
Dissolved Organic Matter (DOM) in a Warm-Temperate Forested Watershed—A Possibility of Ultraviolet Absorbance as an Indicator of DOM


1
Kansai Research Center, Forestry and Forest Products Research Institute (FFPRI), Kyoto 305-8687, Japan
2
Department of Forest Soils, Forestry and Forest Products Research Institute (FFPRI), Tsukuba 305-8687, Japan
3
Graduate School of Environmental Studies, Nagoya University, Nagoya 464-8601, Japan
*
Author to whom correspondence should be addressed.
Forests 2022, 13(4), 510; https://doi.org/10.3390/f13040510
Submission received: 18 February 2022
/
Revised: 16 March 2022
/
Accepted: 21 March 2022
/
Published: 25 March 2022
(This article belongs to the Section Forest Soil)
Abstract
:We investigated changes in the quantity and quality of dissolved organic matter (DOM) from rain to stream water in a forested watershed at Yamashiro Experimental Forest (YMS) in southern Kyoto prefecture. The dissolved organic carbon (DOC) concentration and specific UV absorbance at 254 nm (SUVA254) in rainwater increased in the order of bulk rain, throughfall, stemflow, and O layer leachate because of the DOM supply from tree tissue and O layer. Decreases in DOC concentration and SUVA254 with soil depth were not observed in the soil-percolating water. This finding may have been caused by the low free oxide content of the soil and the collection of soil water with a tension-free lysimeter. The DOC concentration was very low in both seepage and stream waters; seasonal variation with a high concentration in summer was observed in the stream water. An increase in K+ concentration in summer was also observed in the stream water; thus, we presumed that DOC seasonal variation was caused by the DOM supply with the accumulated decomposition of litter in the streambed. The significant correlation between DOC concentration and absorbance at 254 nm (UV254) was observed for all sample types of observation target in the watershed; the ratio of DOC concentration to UV254 was different, while the correlation coefficient between DOC concentration and UV254 value differed among sample types in the watershed. We concluded that UV254 which can be measured by simply and easily is a good indicator for estimating DOC concentration in liquid samples in forested watersheds.
1. Introduction
Dissolved organic matter (DOM), operationally defined as the total mass of organic substances dissolved in soil solution capable of passing through a 0.4–0.6-m filter [1,2], has important roles in organic sequestration, soil acidification, and trace metal dynamics in terrestrial ecosystems [3,4,5]. The related concept of “dissolved organic carbon” (DOC) is the fraction of organic carbon in soil solution that can pass through a 0.22–0.7-m filter; the residue is defined as particulate organic matter. Although the two terms are often used interchangeably, here we use “DOC” for the carbon in DOM and “DOM” for other contexts.
Increases in DOC concentration have recently been observed in the surface waters of glaciated landscapes across eastern North America, as well as northern and central Europe [6,7,8]. DOM in surface water has attracted attention as a precursor for various carcinogenic disinfection byproducts, such as trihalomethane in water chlorination [9].
DOM is a major component of dissolved materials in rain [10], but the DOC concentration in rain is usually low in forest ecosystems (<5 mg C L−1) [11]. DOC concentrations in throughfall and stemflow are higher than the DOC concentration in rain because of the release of organic compounds from leaves, twigs, and tree stems [12]. The quality of DOM differs between stemflow and throughfall [12]; stemflow is often enriched in highly colored DOM [13]. High levels of DOM are supplied from the soil O layer; the highest DOC concentration was observed in the O layer leachate because of DOM dissolution [14]. For mineral soils, DOM is supplied from surface soil to soil solution, but the DOC concentration in soil-percolating water decreases with depth because of the biological decomposition and sorption of DOM to mineral soils [2,15]. Phenolic acids are removed from the soil solution via water percolation in the soil, while carbohydrates and nitrogen-rich compounds remain [16]; thus, the color disappears in the soil solution in deep soil [2,16]. These processes result in low DOC concentrations in the stream and groundwater [17,18,19].
Organic compounds, such as lignin, tannin, humic substances, and aromatic compounds, absorb ultraviolet (UV) radiation [20,21] ; UV absorbance increases with decreasing wavelength [13,22,23]. The correlation between DOC concentration and UV absorbance at a specific wavelength has been recognized in various types of natural water [21,22,24,25,26]. Among substances present in natural water, iron, nitrate, nitrite, and bromide also absorb UV; the concentrations of iron, nitrite, and bromide are usually very low in natural water, and the light absorption by nitrate is very weak at wavelengths above 240 nm [25,27]. Therefore, the UV absorbance (>240 nm) has been used as a surrogate measure of organic constituents in fresh water, salt water, and wastewater [20,26,28]. The UV absorbance at 254 nm (UV254) coincides with one of the strong, sharp peaks of a low-pressure mercury lamp [21]; it has historically been used as a standard wavelength for estimating DOC concentration [20]. Specific UV absorbance (SUVA) is defined as the UV absorbance of water at a particular wavelength, normalized relative to DOC concentration [29]. Chin et al. [30] reported that the SUVA at 280 nm (SUVA280, ‘‘molar absorptivity at 280 nm’’ in the original paper) was strongly correlated with aromatic carbon content. Weishaar et al. [29] also reported that the SUVA at 254 nm (SUVA254) was strongly correlated with the percent aromaticity (as determined by 13C NMR) for water samples obtained from aquatic environments. Therefore, SUVA is regarded as a useful parameter for estimating the dissolved aromatic carbon content in environmental waters [29,31]. SUVA is utilized both for estimating the origin of DOM and for evaluating the changes in DOM properties in forested watersheds [17,32].
In Japan, several studies have examined DOC concentrations in rain, throughfall, stemflow, soil water, and stream water [19,33,34]. Most of these studies were carried out in coniferous forests; few studies of DOM variations have focused on broad-leaved secondary forests, which are widely distributed throughout Japan [35] and constitute 60% of the forest in central Japan [36]. Although the UV absorbance has been used as a surrogate measure of organic constituents in natural water, there have been few reports of the relationship between UV absorbance and DOC concentration in waters in forested watersheds [37,38], except in rivers and lakes in forest catchment areas [39]. The UV absorbance can be easily measured by spectrophotometry, while measurement of the DOC concentration is time-consuming and requires expensive equipment. Therefore, if the DOC concentration can be estimated via UV absorbance, it would contribute to further understanding of the carbon dynamics in forest ecosystems.
This study was performed to examine how the concentration and properties of DOM change from rainwater to stream water in a forested watershed; it also aimed to clarify the relationship between DOC concentration and UV absorbance for each water sample type of observation target (hereinafter referred to as sample type) in the watershed, thus determining whether UV absorbance can be used as an indicator of DOC concentration in a broad-leaved secondary forest.
2. Materials and Methods
2.1. Study Site
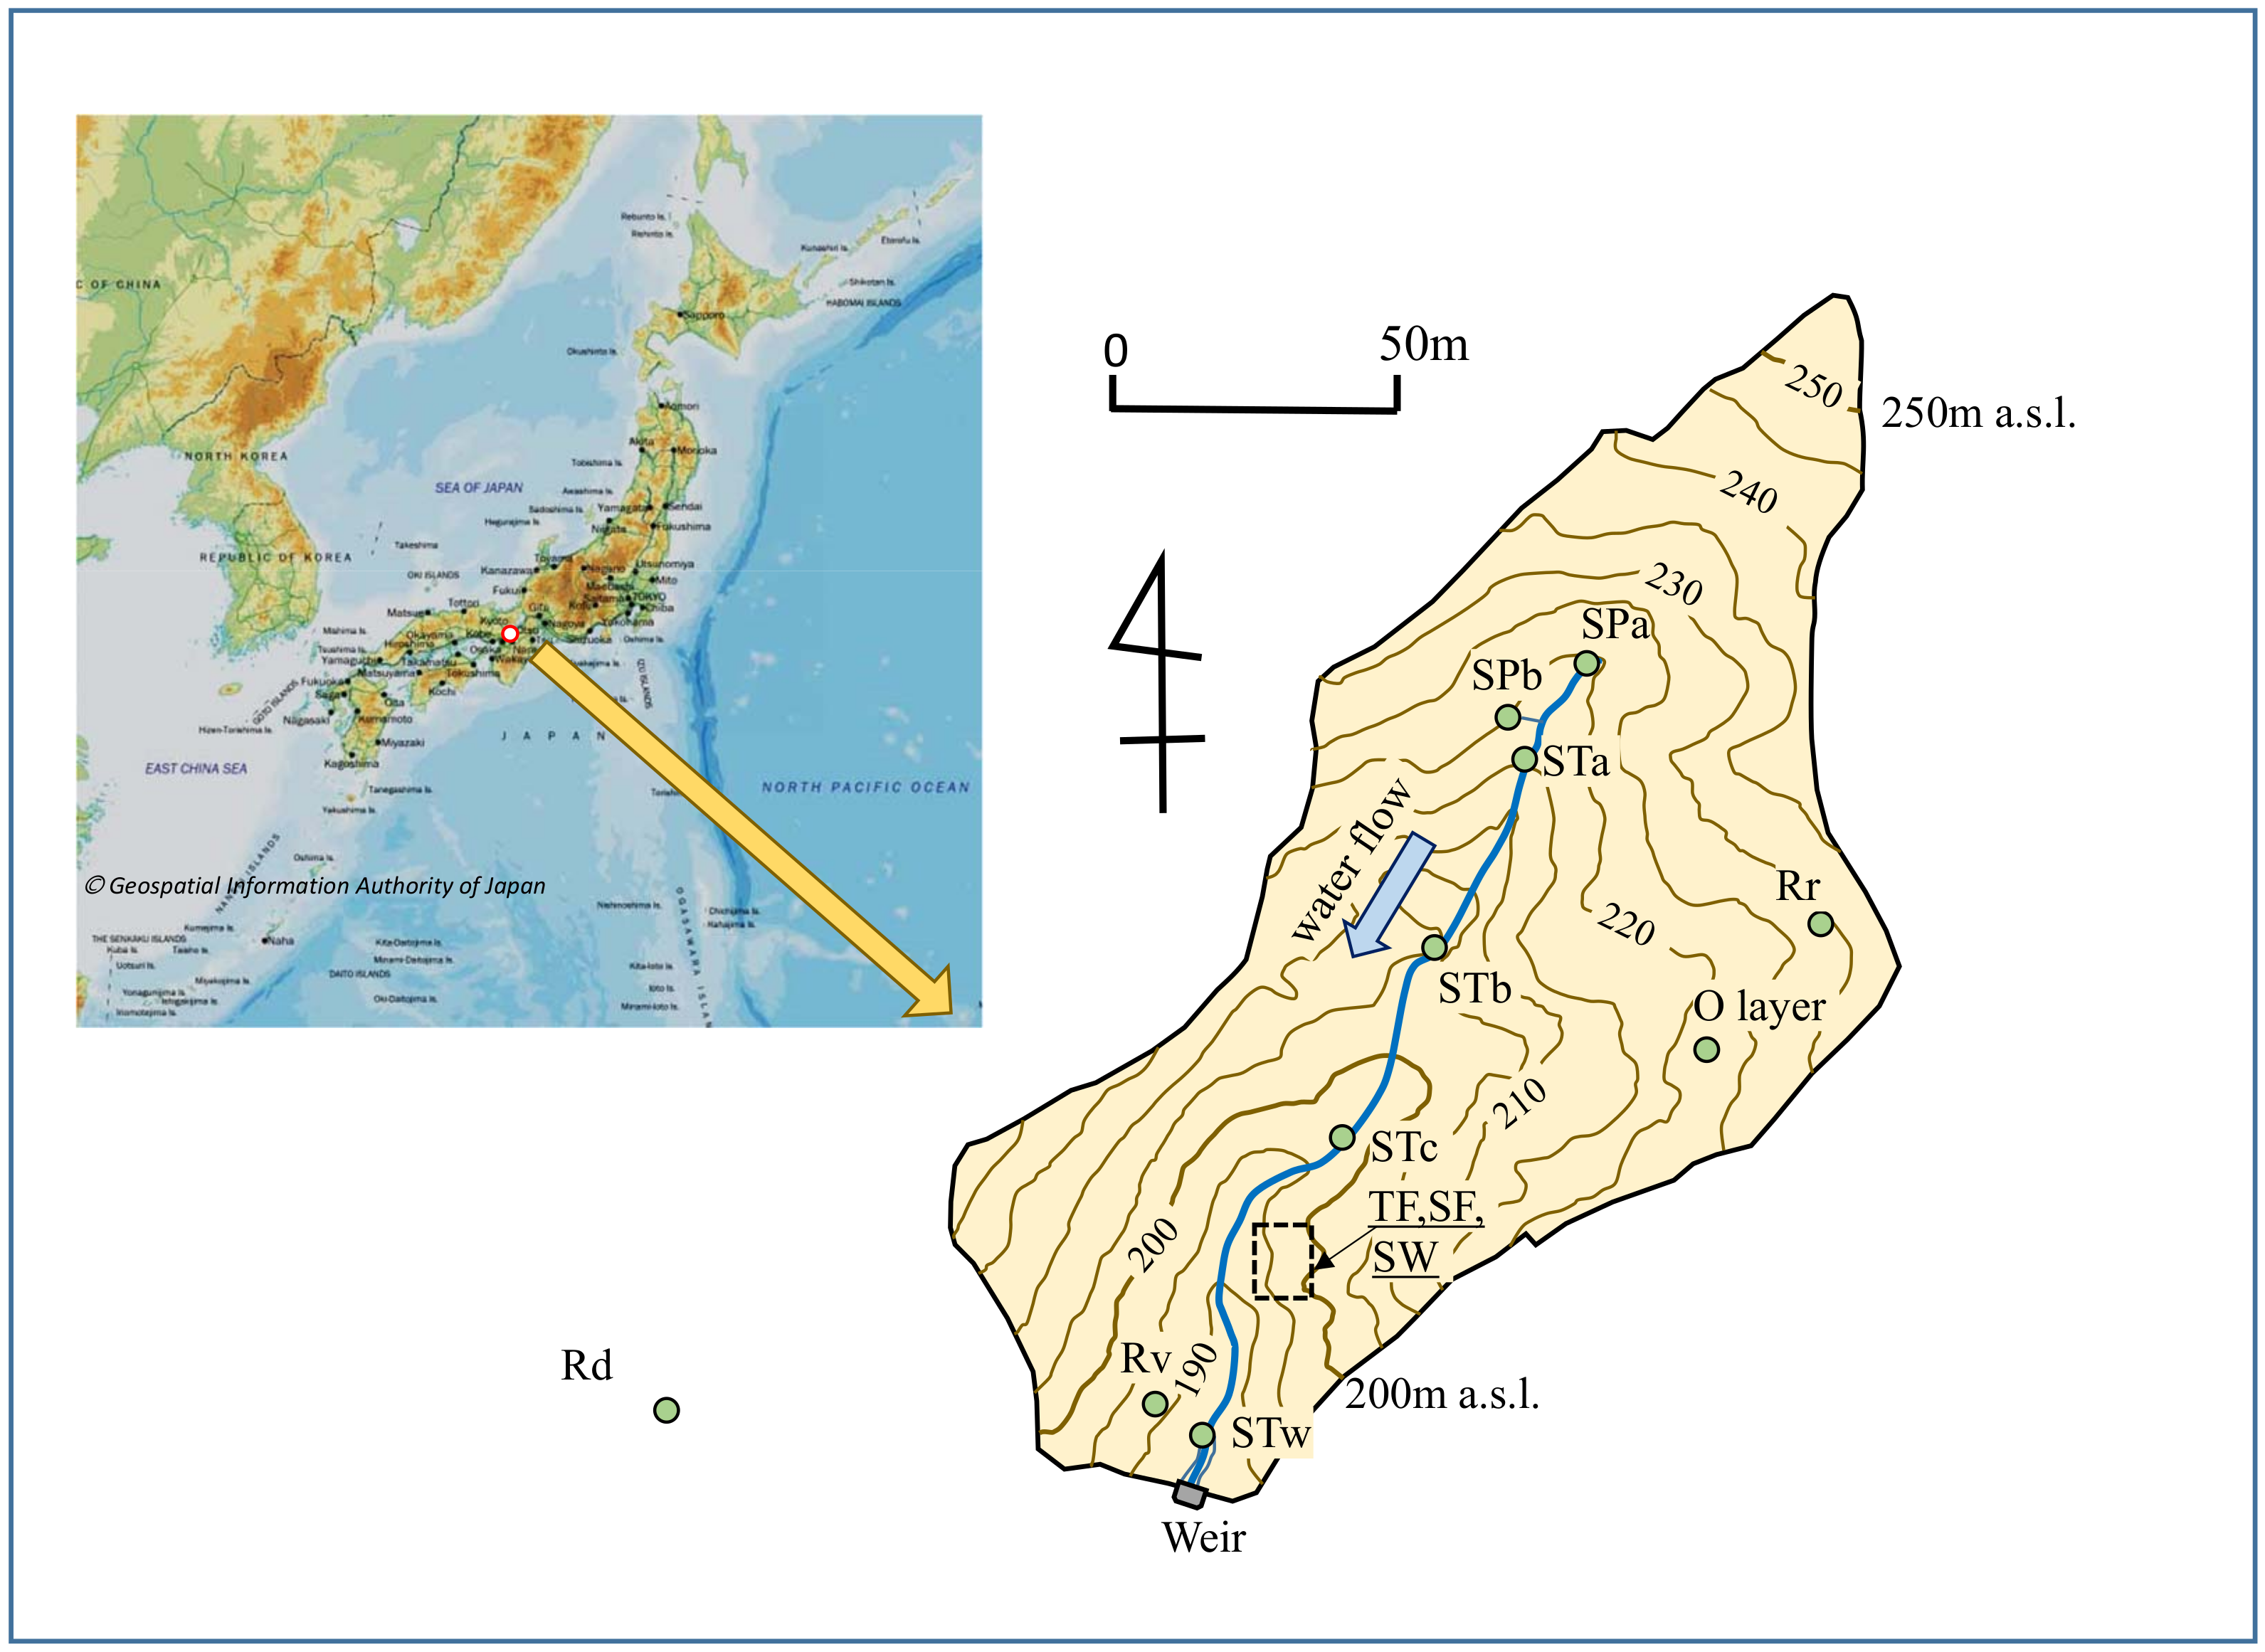
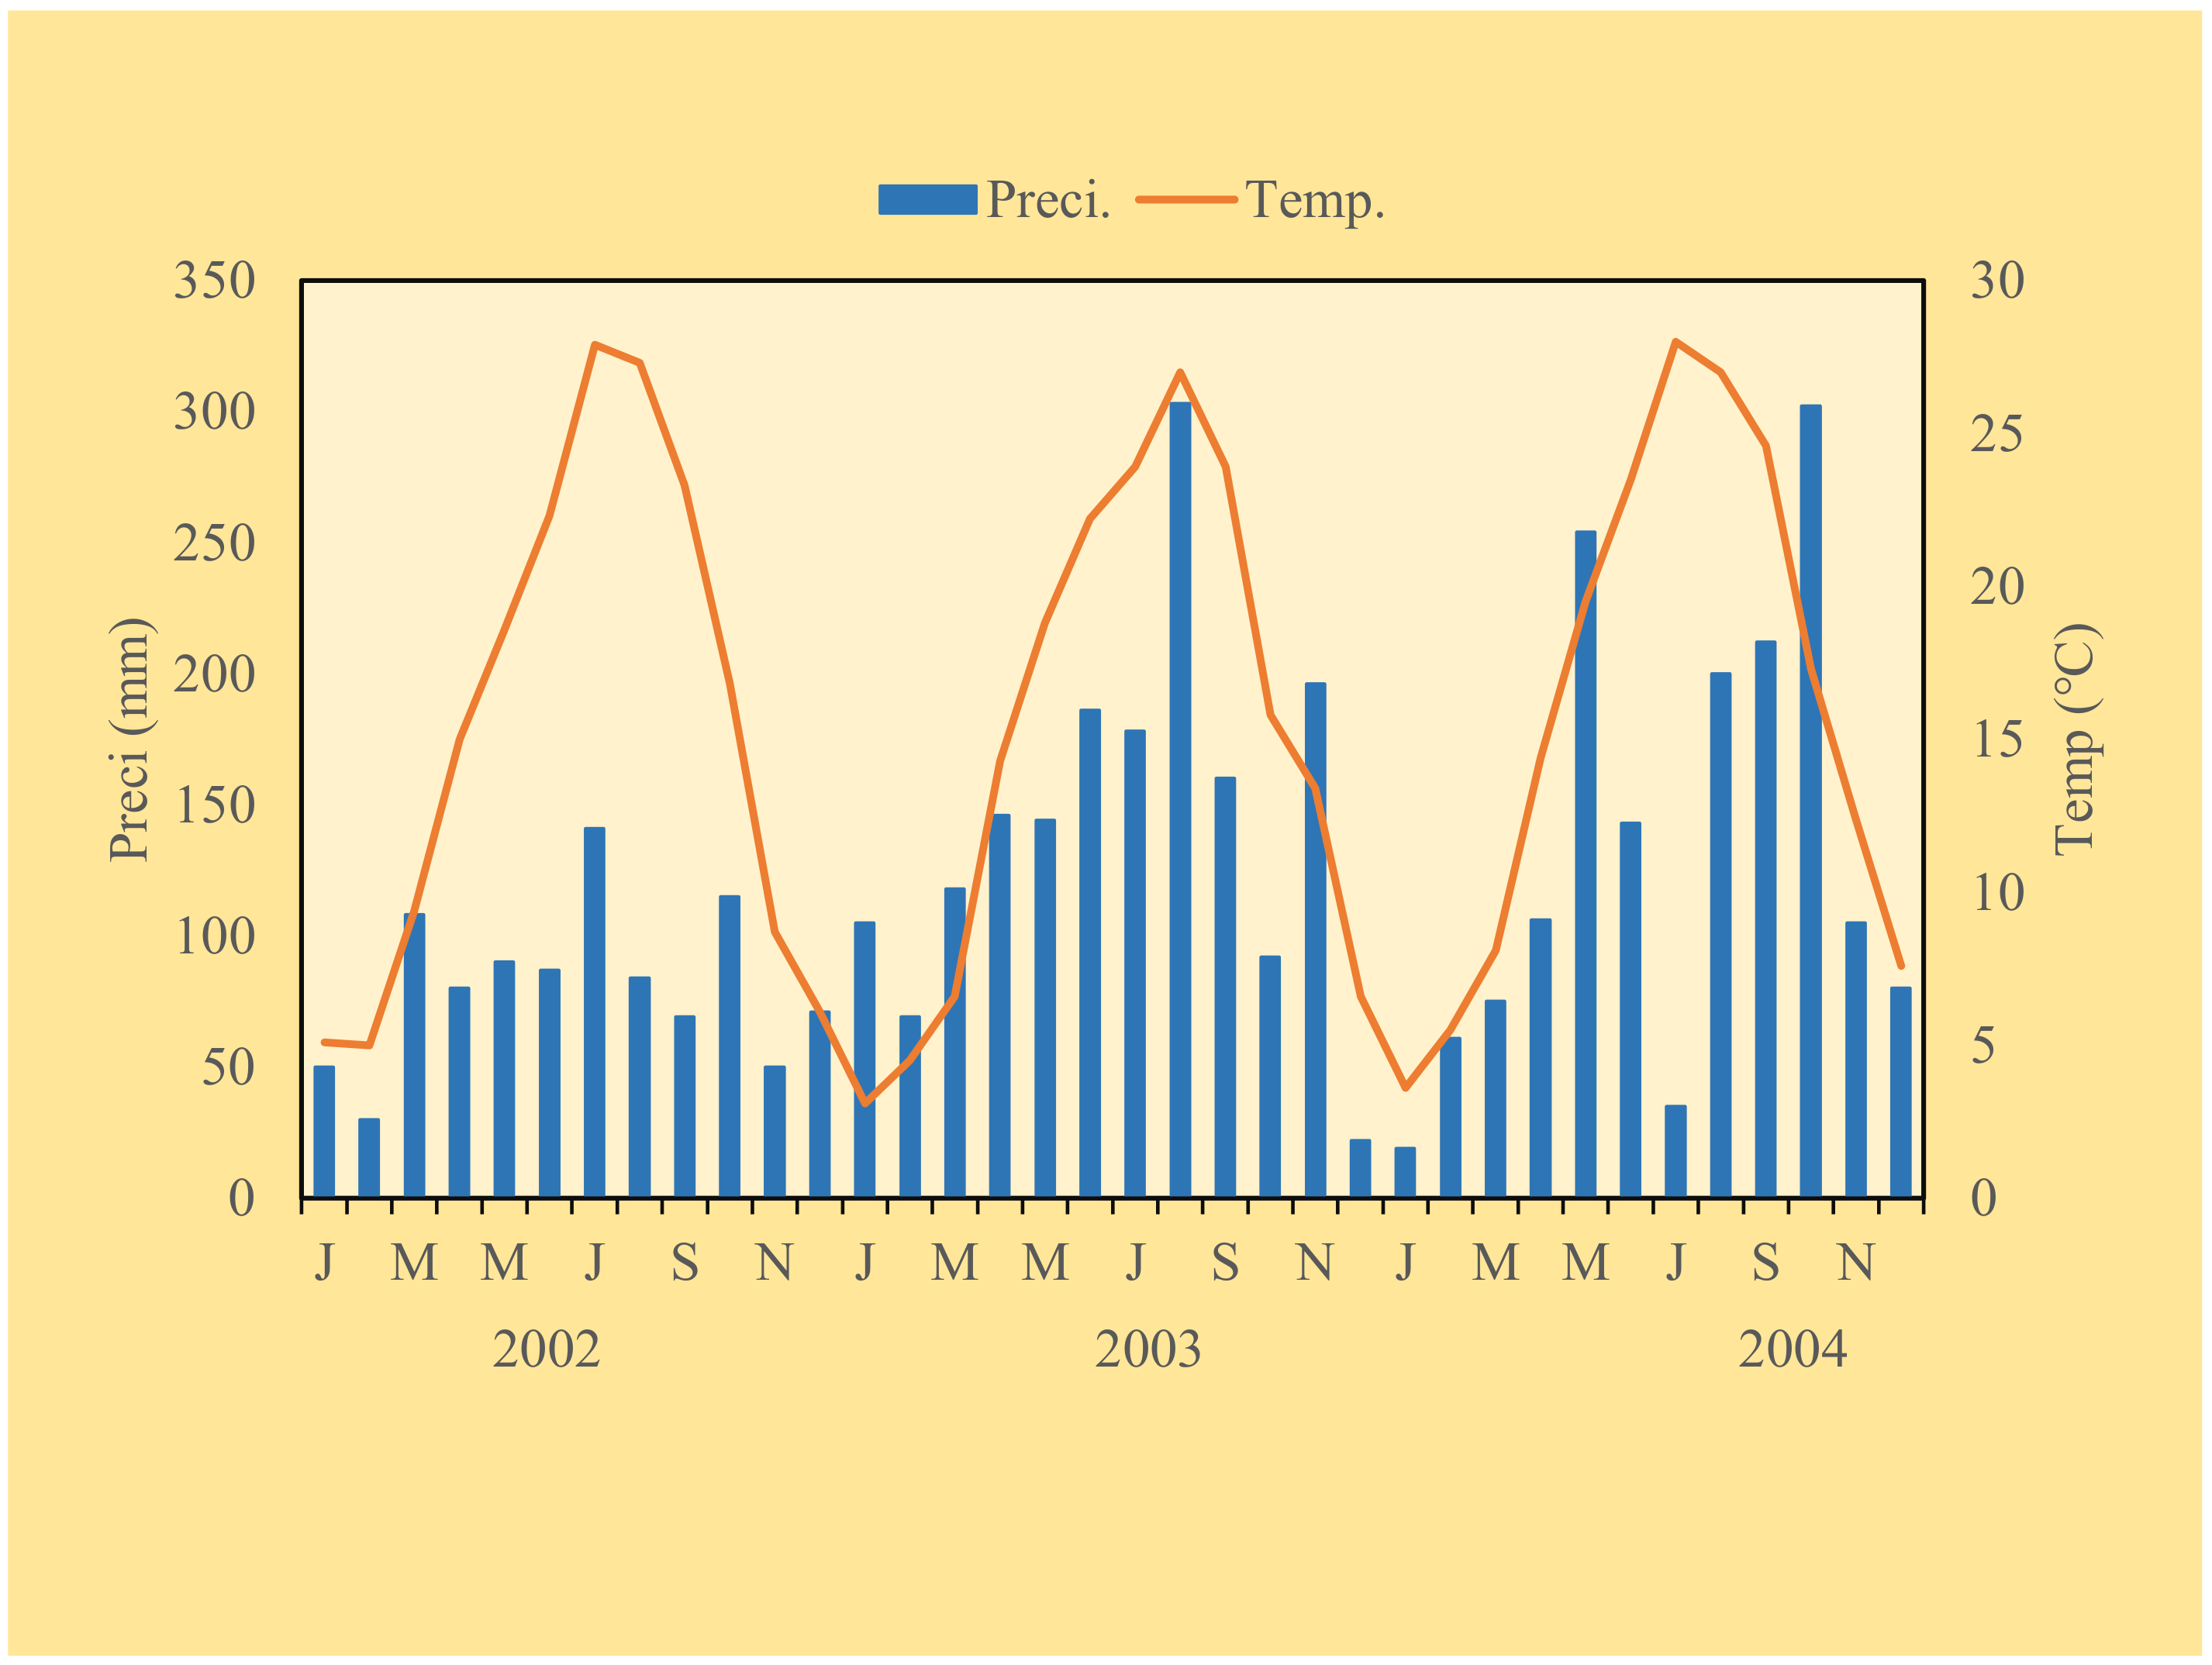
The study was conducted at Yamashiro Experimental Forest (YMS, 3447 N, 13550 E; 180–255 m above sea level, hydrological watershed area 1.6 ha) (Figure 1) in Kyoto, Japan. The site is situated in a hilly area in southern Kyoto Prefecture, in a region managed as a suburban forest. Soil erosion occurred and bare land was formed by heavy logging before the Meiji period (AD 1968-1912) [40]. In the late 19th century, forest rehabilitation was promoted by the Meiji government under the command of Johannis de Rijke, a technician from the Netherlands [41]. Most of the trees planted at that time have since died; the current vegetation is a mixed deciduous forest with evergreen broad-leaved trees [42]. Quercus serrata, Ilex pedunculosa, Lyonia ovalifolia var. elliptica, Alnus sieboldiana, and Clethra barbinervis are the dominant species [43]. The tree species composition is common in broad-leaved secondary forests in this region. The growth of Alnus pendula and Robinia pseudoacacian is also found in the understory as tree species with nitrogen-fixing ability [43]. The geology of the watershed is Late Cretaceous Granitoid [44]. The annual carbon and nitrogen inputs by litterfall were reported as 2674.7 kg C ha−1yr−1 and 55.5 kg N ha−1yr−1, respectively [45]. The soils are acidic and have a sandy texture containing fine granitic gravels (Tables S1 and S2); moreover, they are thin with an average depth of 47 cm [42]. The soil type is classified as Dystric Regosol according to the WRB classification system [46]. The mean annual precipitation is 1449 mm, and the mean annual temperature is 15.5 C [35]. Precipitation is concentrated in the growing season, and minimal snowfall occurs in winter [42]. The annual precipitation levels were 975, 1719, and 1592 mm in 2002, 2003, and 2004, respectively; the mean annual temperatures were 15.5 C, 15.0 C, and 16.0 C in the same years at the weather observation station in Kyotanabe City, which is located 8 km northwest of the YMS watershed [47]. Monthly mean air temperature and monthly total of precipitation from 2003 to 2004 at the station are shown in Figure 2. The YMS was established in 1987 by the Forestry and Forest Products Research Institute to evaluate water resources in the secondary broad-leaved forest [35]. The observation of water chemistry in the watershed began in 2000. Nitrogen budgets in the watershed were reported for 3 years from 2001 to 2003; N deposition from throughfall and stemflow ranged from 7.5 to 8.2 kg N ha−1yr−1 [42].
2.2. Watershed Instrumentation and Sampling
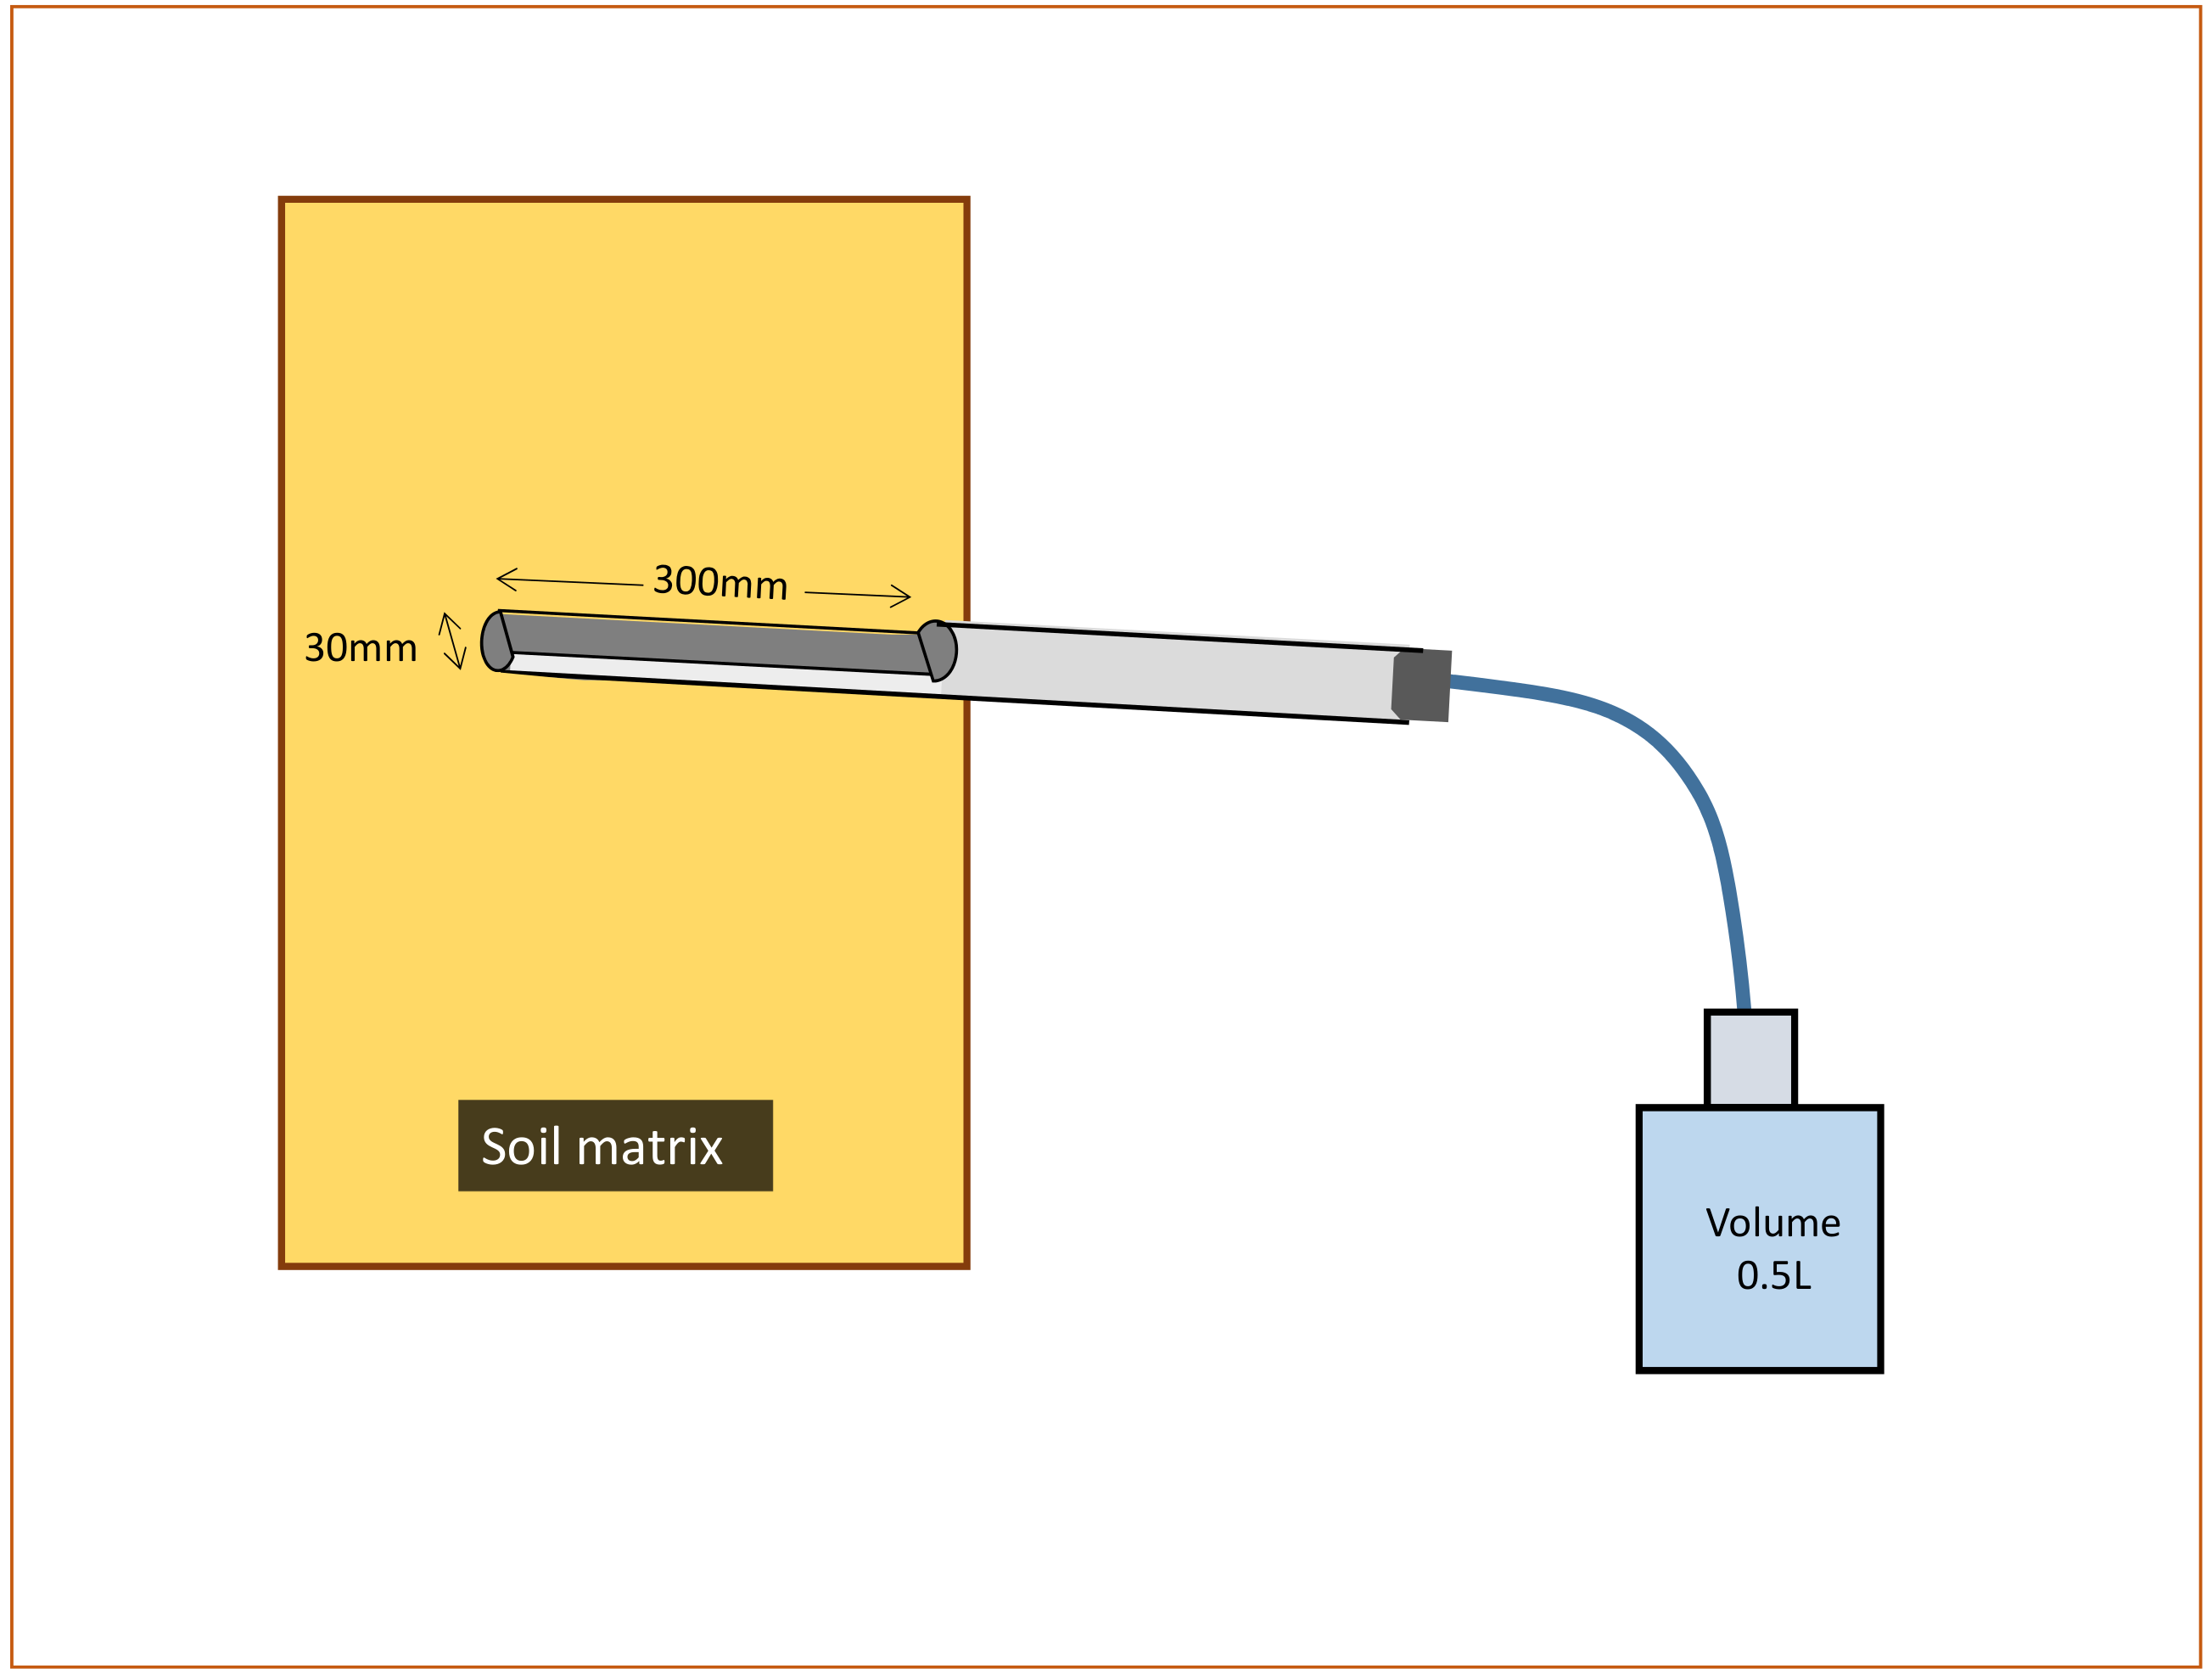
Bulk rain (Rr, Rv, and Rd), throughfall (TF), stemflow (SF), O layer leachate, soil-percolating water (SW), seepage water (SP), and stream water (ST) were collected twice per month inside and outside of the watershed from July 5, 2002, to March 25, 2004 (Figure 1). The sampling method of bulk rain, TF and SF was described in the previous paper of Kaneko et al. [42]. O layer leachate in soils was collected using a tension-free lysimeter (n = 6) set under the O layer (thickness 6 cm) on the ridge. The lysimeter was made of a flat polyethylene plate (200 × 300 mm) connected to polyethylene bottles (5 L) through silicon tubing. Soil-percolating water was collected using a zero-tension lysimeter at depths of 10 cm, 30 cm, and 70 cm (each n = 5) in the TF and SF sampling sites. Hereafter, the O layer leachate is referred to as O leachate; the soil-percolating waters collected at depths of 10, 30, and 70 cm are referred to as So10, So30, and So70, respectively. The tension-free lysimeter was made of polyvinyl chloride pipe (D = 30 mm, L = 600 mm), the top half of which was cut off. The cut end (L = 300 mm) of polyvinyl chloride pipe was inserted into the soil matrix at each depth; the other end of the pipe was connected to polyethylene bottles (0.5 L) with silicon tubing (Figure 3). Stream water was sampled using a polyethylene bottle at six points on the stream in the watershed (Figure 1). The water samples were seepage water in the uppermost area of the stream in SPa and SPb; they were flowing water at the other four points. Water temperature was measured at the sites of stream water sampling using a digital thermometer.
2.2.1. Water Analyses
To minimize changes in the quality and quantity of DOM during transportation to the laboratory, a portion of each stream water sample was filtered into a glass tube (50 mL) in situ using a polyethylene syringe and a disposable disc filter composed of hydrophilic polytetrafluoroethylene membrane (0.5-m pore size; Advantec Toyo Kaisha, Ltd., Tokyo, Japan); the stream water samples in glass tubes were placed in a cooler box and transported to the laboratory. Other water samples were transported to the laboratory and filtered using hydrophilized polytetrafluoroethylene membrane filters (0.5-m pore size; Millipore, Billerica, MA, USA). All samples were refrigerated at 4 C until analysis. The pH, electrical conductivity (EC), inorganic cations, inorganic anions, DOC, and dissolved inorganic carbon (DIC) were measured in the laboratory. The method was described in the previous paper of Kaneko et al. [42]. The DOC concentration was calculated by subtraction of DIC from TOC for samples of rain, TF, SF, O leachate, and soil-percolating water samples. For the seepage and stream water samples, DIC was removed by acidification; the DOC concentration was determined by the high temperature catalytic oxidation method [48]. Total nitrogen concentrations of samples were determined by measuring the absorbance at 220 nm (A220) after autoclave digestion with potassium peroxodisulfate in alkaline medium [49]. Dissolved silica was measured by colorimetric analysis using the molybdenum yellow method [50]. Absorbances at 240 nm and 260 nm (A240 and A260, respectively) were measured using a 1-cm quartz cuvette with a spectrophotometer (UV-160A; Shimadzu). Sample spectra were blank-corrected using spectra collected from ultrapure water (Milli-Q; Millipore).
2.2.2. Data Compilation
Organic nitrogen content was determined from the difference between total nitrogen and inorganic nitrogen (NO3−-N + NO2−-N + NH4+-N). UV254 was estimated as follows [51]:
Specific UV absorbance at 254 nm (SUVA254) was calculated as follows:
For the calculation of ion balance, H+ concentrations were estimated from the pH; we assumed that DIC was present in the stream water as HCO3− because of the neutral pH. The weighted average of each sample type was calculated by weighting the concentration according to the sample volume, except for seepage water and stream water (simple averages were calculated for these samples). For the calculation of average pH, we used H+ concentrations estimated from the pH. For bulk rain, TF, SF, O leachate, and soil-percolating water, the capacity (volume) of the sampling bottle was applied to the sample volume if overflow occurred. The annual flux was obtained by summing the water volumes of all observation periods for bulk rain, TF, and SF. Overflow often occurred during sampling of O leachate and soil-percolating water; thus, we used alternative values for their annual water fluxes. The annual water flux of O leachate was estimated using the following formula:
where O flux is the annual water flux of O leachate; TF, SF, and FE flux are the annual water fluxes of TF, SF, and evaporation from the forest floor, respectively. Daily evaporation from the forest floor was estimated as 0.3 mm in the YMS, based on the report by Tamai and Hattori [52]. For calculation of the annual elemental flux of soil-percolating water, the value of annual discharge at the weir of the watershed (STw) was applied to the annual water flux at the three depths (So10, So30, and So70). The annual discharge at the weir of the watershed (STw) was also applied as the annual discharge for calculation of the annual elemental fluxes of two seepage waters (SPa and SPb) and three stream waters (STa, STb, and STc) in the watershed.
2.2.3. Statistical Analysis
To determine the characteristics of DOC in the watershed, we investigated the relationships between the concentrations or values of DOC and the other constituents in all sample types in the watershed. The correlation coefficients of the relationships between DOC and the other constituents were calculated for each sample type in the watershed using Microsoft Excel 2016 (Microsoft, Redmond, WA, USA). Pearson’s correlation coefficients and p-values were obtained with the Pearson function and TDIST function, respectively.
3. Results
3.1. Variations in Concentrations and Fluxes of DOM and Other Constituents in the Watershed
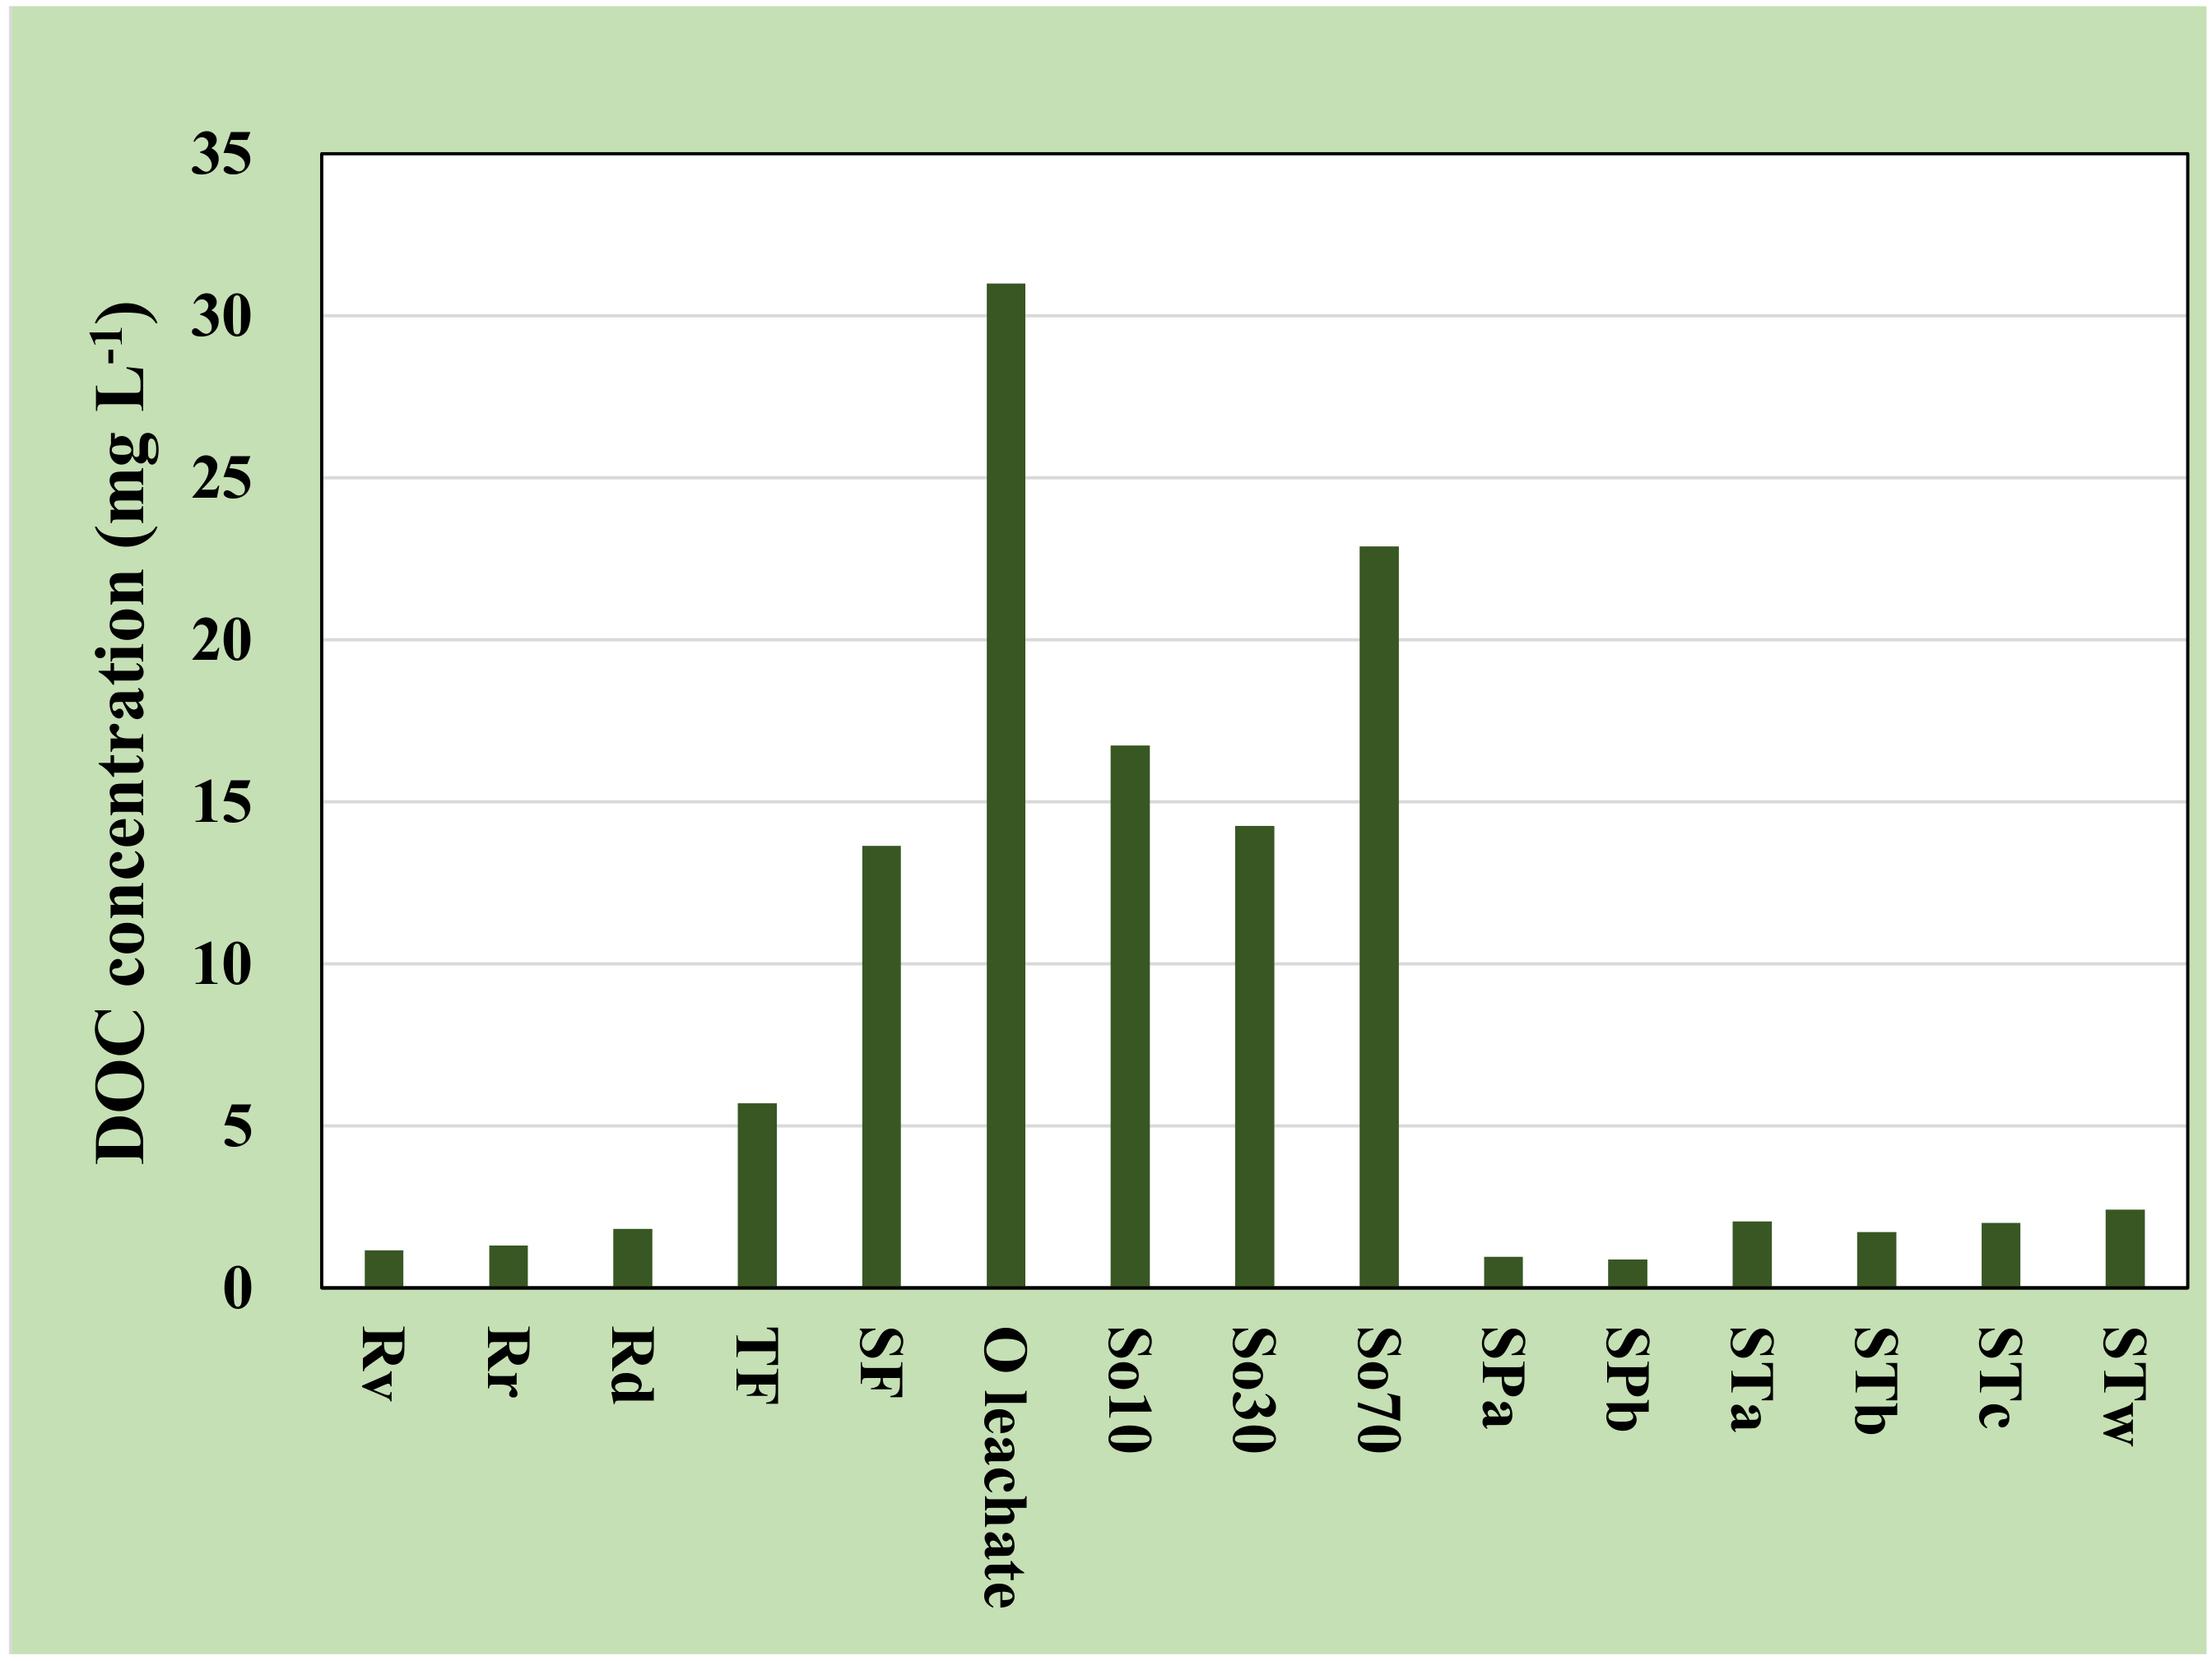
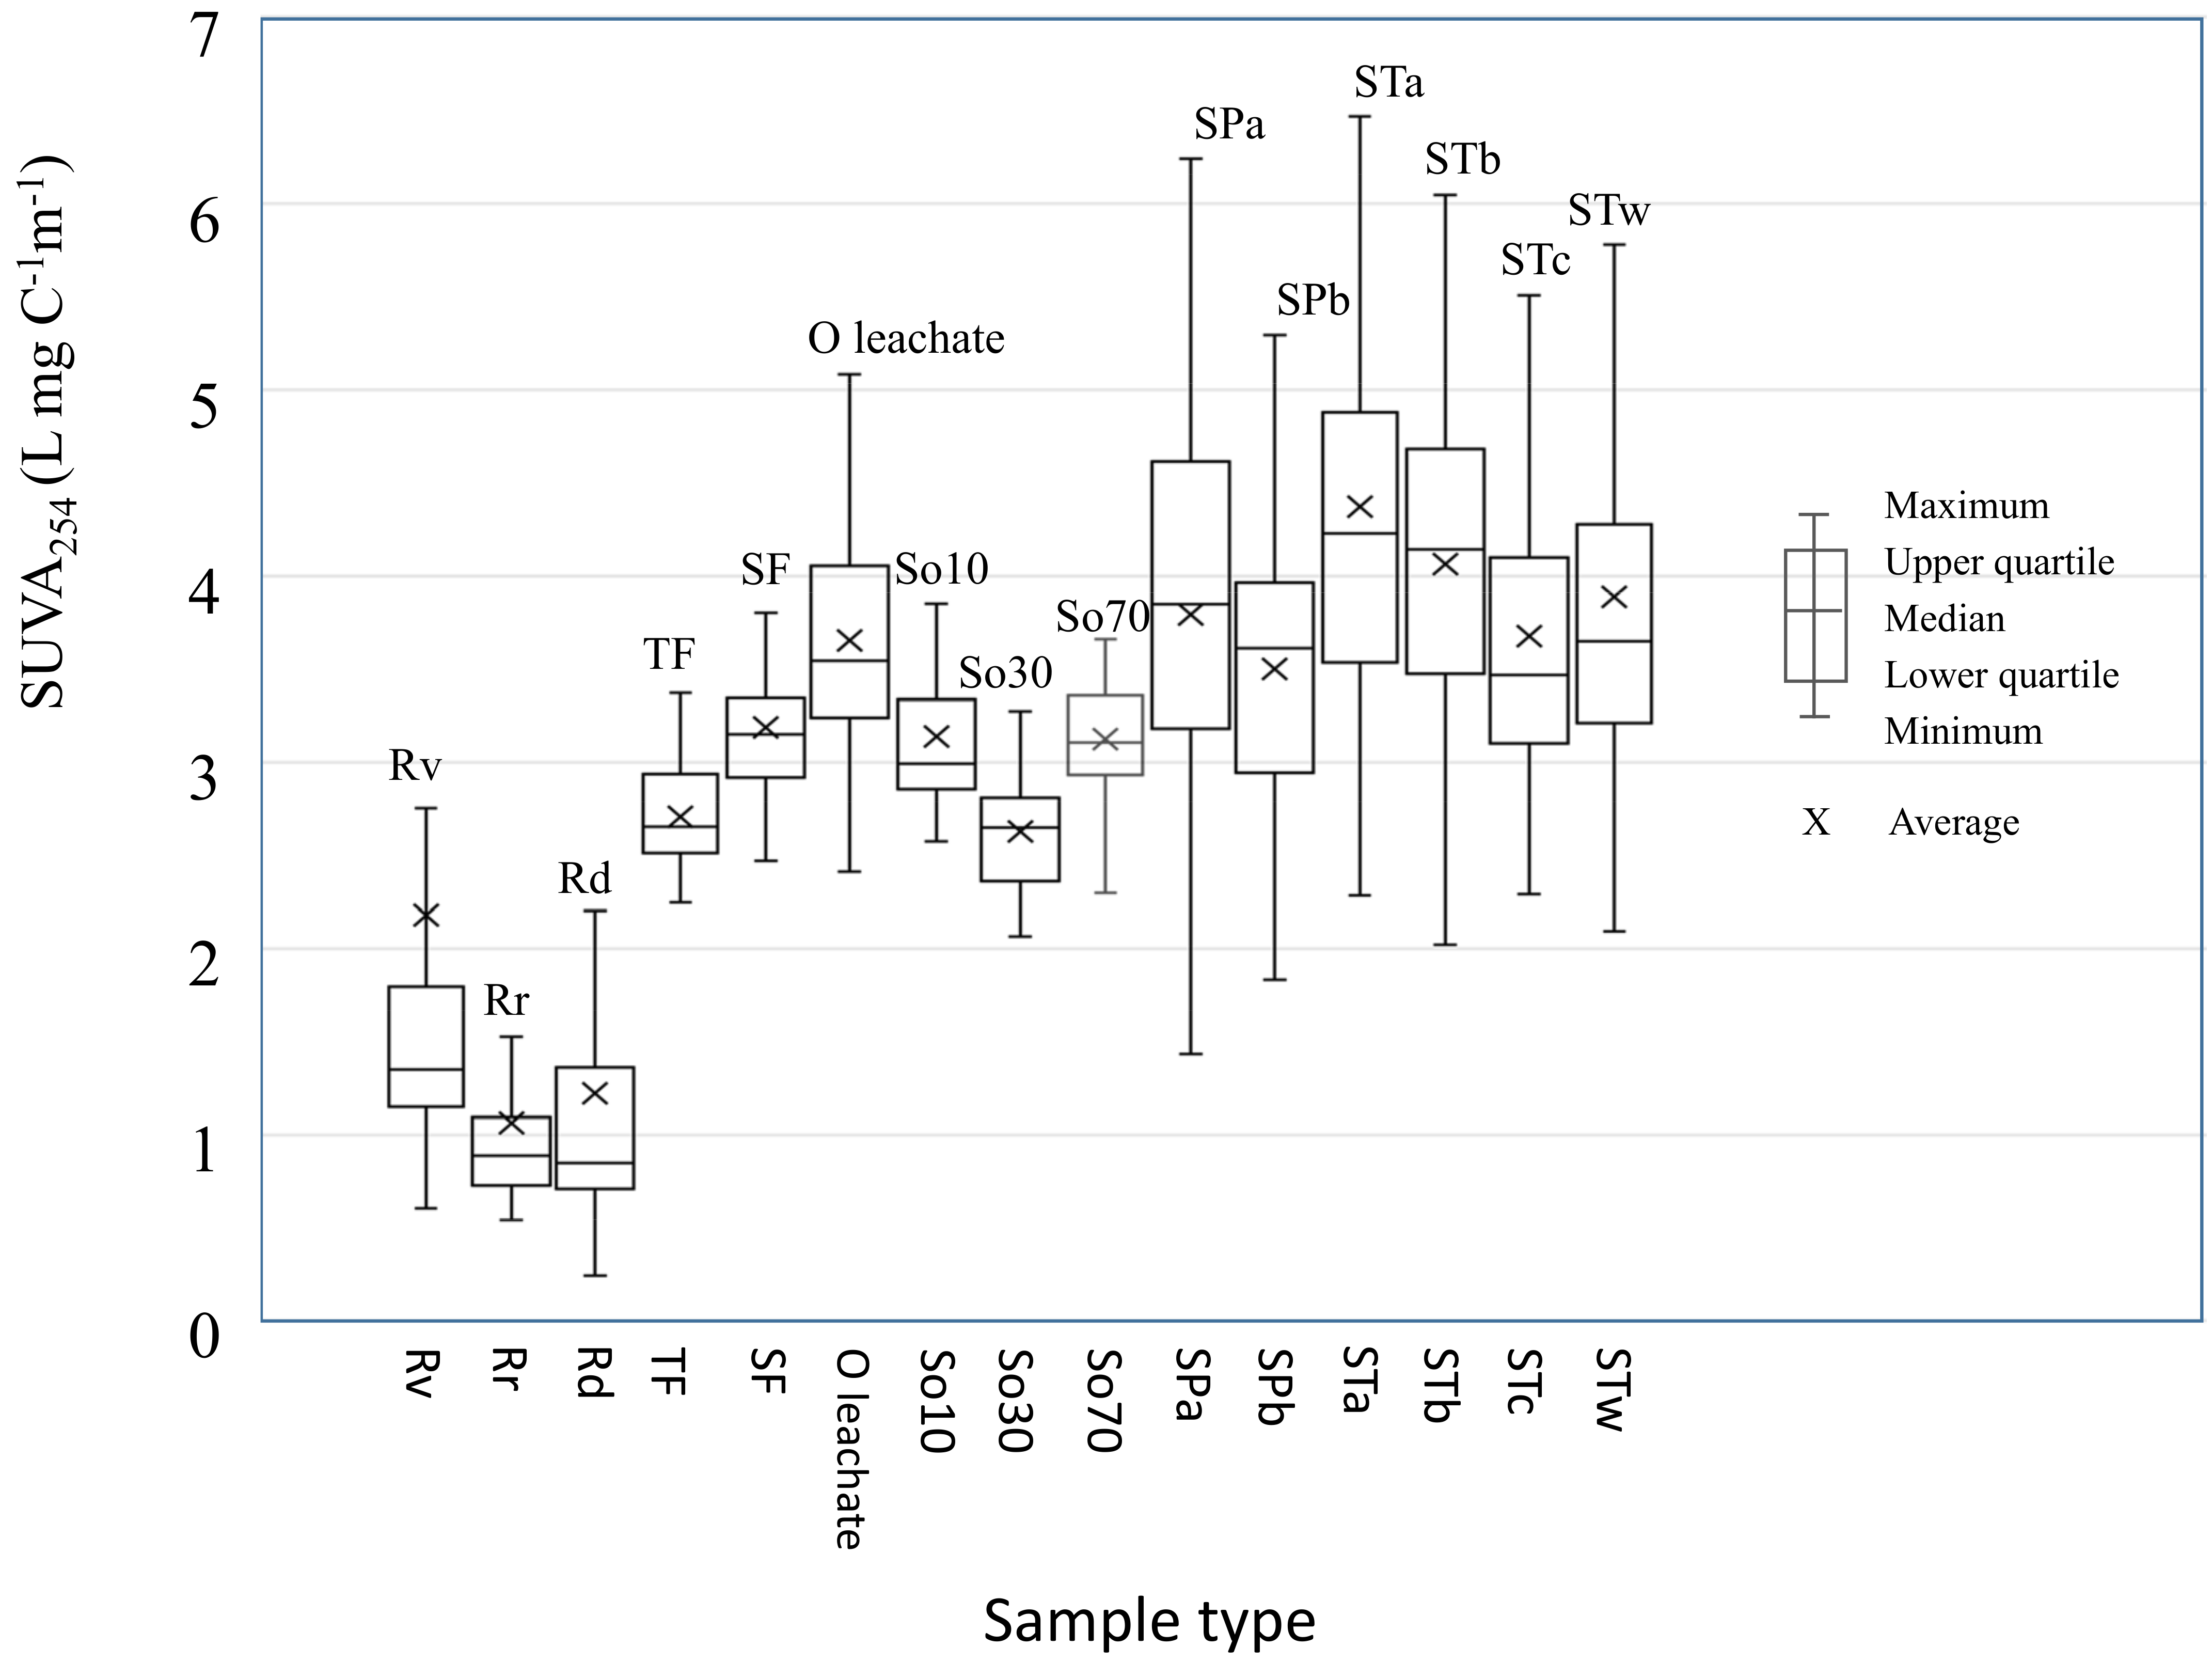
The weight-average DOC concentration (DOCavg) was < 2 mg L−1 in the bulk rain (Rv, Rr, and Rd); it increased in the order of throughfall (TF), stemflow (SF), and O leachate (Figure 4 and Table S3). DOCavg was lower in the soil-percolating waters (So10, So30, and So70) than in the O leachate. DOCavg in the seepage waters (SPa and SPb) was very low (<1 mg L−1); it increased slightly in the stream waters (STa, STb, STc, and STw). The weight-average dissolved organic nitrogen (DON) concentration varied among sample types in the watershed; the variation pattern was similar to the variation of DOCavg. The ratio of weight-average DOC to weight-average DON was approximately 20 in the bulk rain; it ranged from 26.8 to 37.2 in the TF, SF, O leachate, and soil-percolating waters. The ratio of weight-average DOC to weight-average DON was obviously high in both seepage and stream waters. The weight-average UV254 value varied throughout the watershed; the pattern of variation was similar to the variation of DOCavg. The weight-average SUVA254 value was low (1.07–2.53 L mg C−1m−1) in the bulk rain; it increased in the order of TF, SF, and O leachate. It decreased in the soil-percolating water (So10, So30, and So70) but increased in the seepage waters (SPa and SPb) and stream waters (STa, STb, STc, and STw).
The weight-average concentration of each ion was generally low in the bulk rain (Rv, Rr, and Rd), particularly for Mg2+ and K+ in the bulk rain, compared with the other sample types in the watershed (Table S4). The weight-average concentrations of most ions peaked in the O leachate and decreased until the soil-percolating water sampled at a soil depth of 10 cm (So10). The weight-average concentrations of each ion in the seepage waters were similar to the weight-average concentrations in the stream waters. Compared with the soil-percolating waters, Na+, Cl−, and SO42− concentrations were higher, while Ca2+ and NO3− concentrations were lower, in both seepage and stream waters.
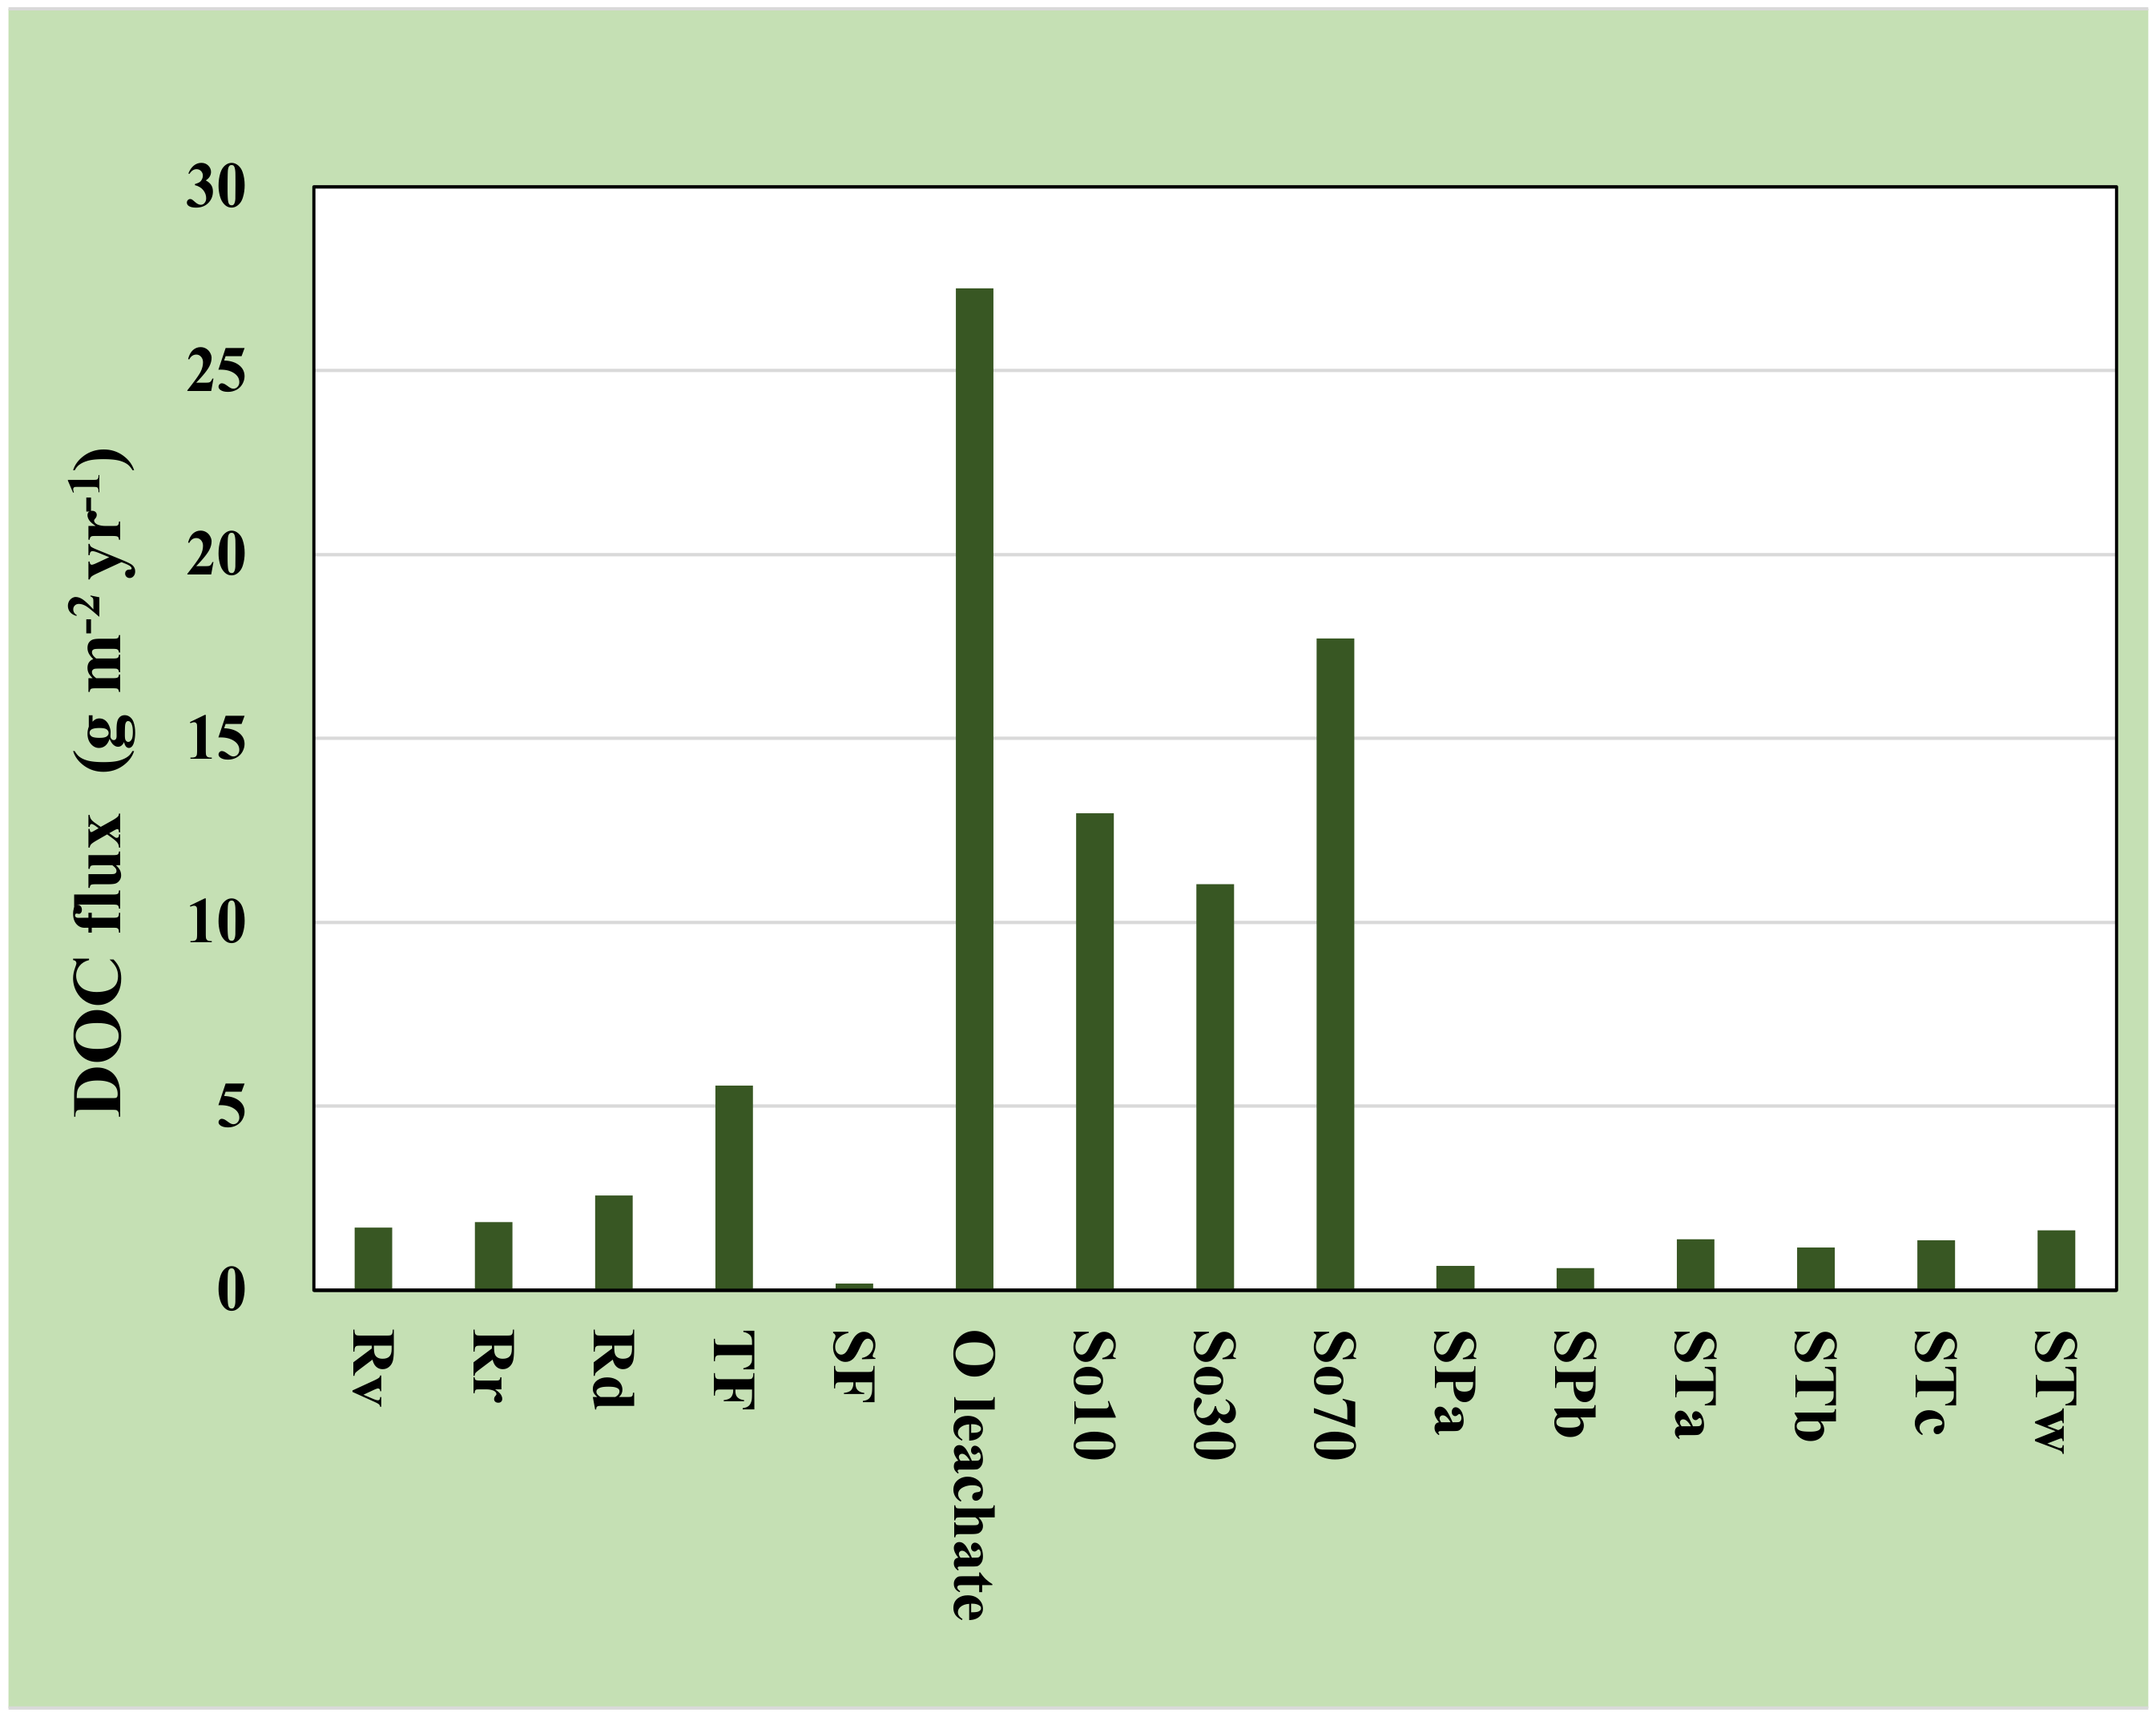
The annual DOC flux of the rain (Rv, Rr, and Rd) ranged from 1.69 to 2.58 g m−2 yr−1; the annual DOC fluxes of TF and SF were 5.56 and 0.17 g m−2 yr−1, respectively (Figure 5 and Table S5). The annual DOC flux peaked in the O leachate (27.24 g m−2 yr−1) and decreased in the soil-percolating waters (So10, So30, and So70). The annual DOC flux ranged from 0.59 to 0.65 g m−2 yr−1 in the seepage waters and from 1.15 to 1.6 g m−2 yr−1 in the stream waters.
The annual ion flux of TF was generally greater than the annual ion flux of the bulk rain for most ion species. In particular, the annual fluxes of Mg2+ and K+ of the TF were extremely high. Annual ion flux peaked in the O leachate, except for Na+, Cl−, and SO42−. The annual flux of Na+ was larger in the soil-percolating waters than in the O leachate; it increased in the seepage and stream waters where Na+ and HCO3− were the dominant cation and anion, respectively. The annual flux of K+ was slightly greater in the stream waters than in the seepage waters, but there were no obvious differences in the concentrations of other ion species between the seepage and stream waters. The annual Si flux ranged from 6.28 to 7.04 g m−2 yr−1 in the seepage and stream waters.
3.2. Relationships between DOC Concentration and the Other Constituents of Water Samples
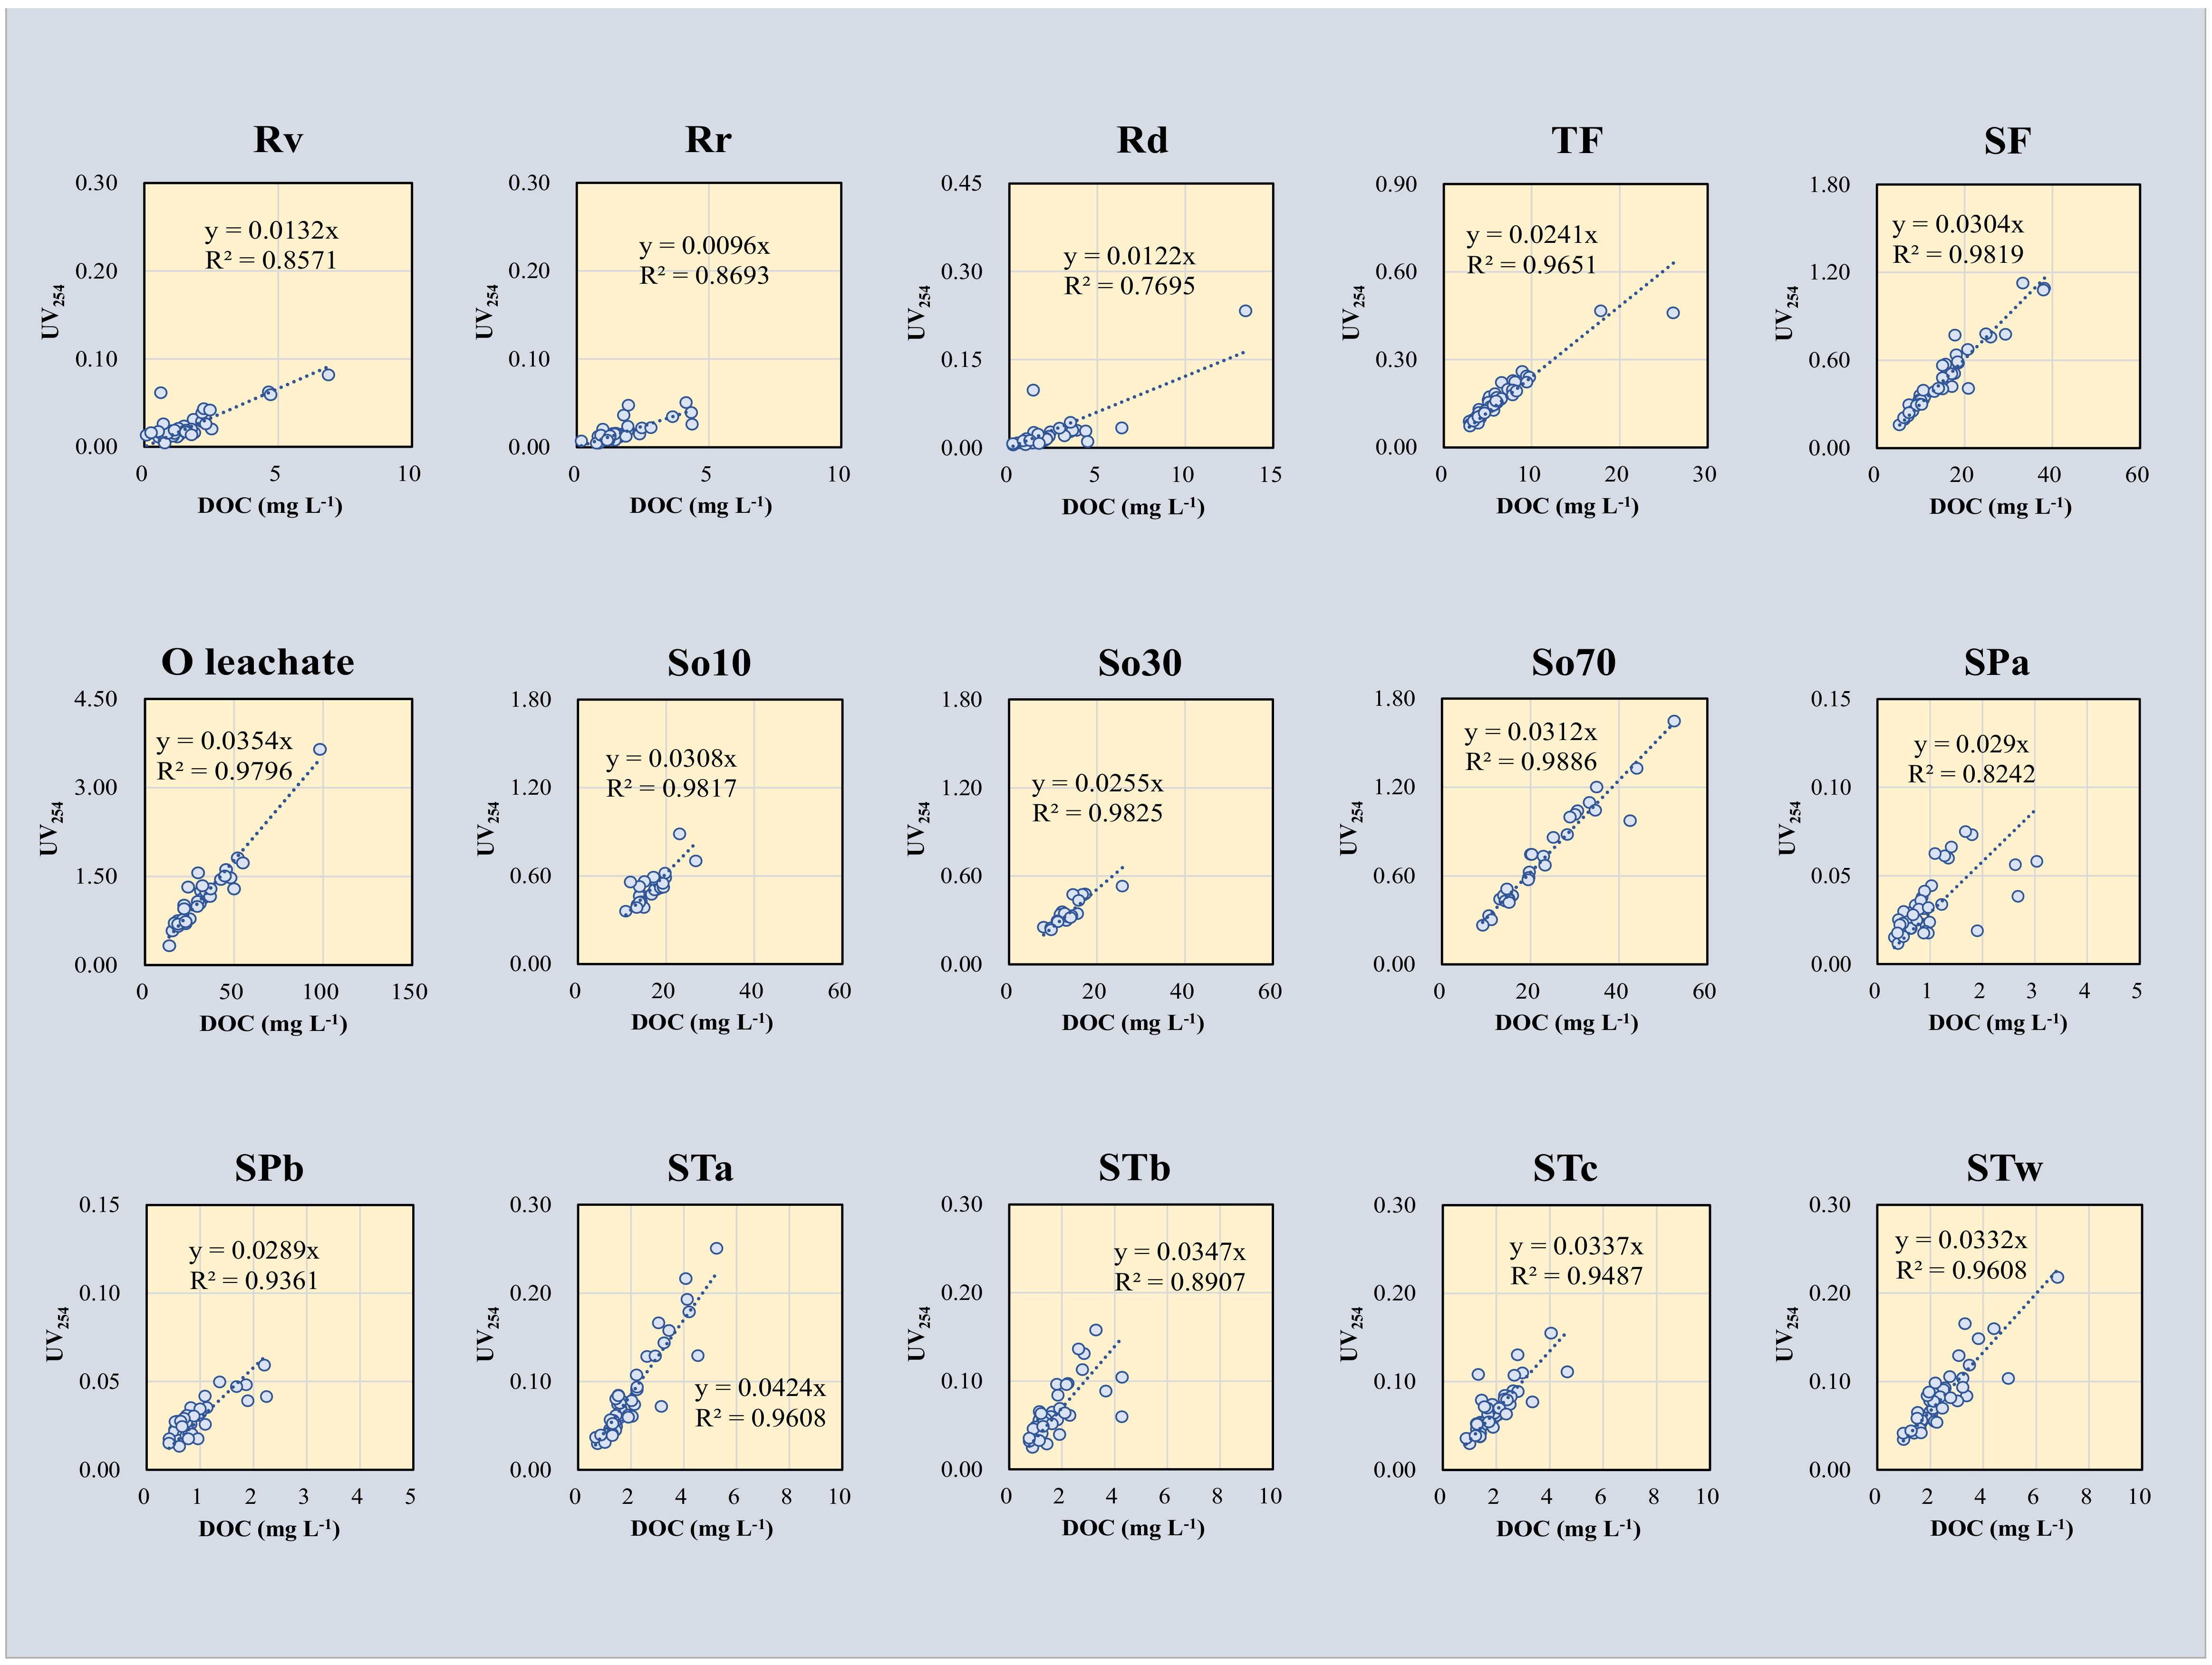
The DOC concentration was strongly correlated with UV254 in all sample types (Table 1 and Figure 6). The correlation coefficient between DOC concentration and UV254 value was >0.9 in the TF, SF, O leachate, soil-percolating water (So70), and stream water (STa) (Table 1). In contrast, the correlation coefficient between DOC concentration and UV254 was <0.85 in the bulk rains (Rv, Rr, and Rd), soil-percolating water (So10), seepage waters (SPa and SPb), and stream waters (STb, STc). The DOC concentration was positively correlated with the DON concentration in the bulk rains (Rr and Rd), TF, SF, O leachate, and soil-percolating water (So10). Throughout the observation period, the DOC was positively correlated with water temperature at all sampling positions in the seepage and stream waters (Table 1). Positive correlations were observed between the DOC concentration and EC in the bulk rains (Rr and Rd), TF, SF, and O leachate; a negative correlation between the DOC concentration and EC was observed in the seepage water (SPb). The DOC concentration was positively correlated with the DON concentration in the bulk rains (Rr and Rd), TF, SF, O leachate, and soil-percolating water (So10). The DOC concentration was positively correlated with most ion species in the rain and with both Mg2+ and K+ in the TF, SF, and O leachate (Table 1). In the stream water, the DOC concentration was positively correlated with both K+ and HCO3−; it was negatively correlated with both H+ and NO3−.
In order to visually understand the relationships with different slopes between DOC concentration and UV254, the relationships between the two were shown in the Figure 6 for all sample types. For bulk rain (Rv, Rr, and Rd), the seepage waters (SPa, SPb) and the stream waters (STa, STb, STc, and STw), there were some data that deviate considerably from the approximate line. In contrast, no such data are found in TF, SF, the O leachate and the soil-percolating waters (So10, So30, and So70). The gradient of approximate line in the figures of the relationship between DOC concentration and UV254 (Figure 6), means the ratio of UV254 to DOC concentration, corresponding SUVA254. It ranged from 0.0096 to 0.0132 in the bulk rains (Rv, Rr, and Rd); increased in the order of TF, SF, and O leachate; decreased in the soil-percolating waters (So10, So30, and So70) and seepage waters (SPa and SPb); and increased again in the stream waters (STa, STb, STc, and STw) (Figure 6). To further clarify the characteristics of SUVA254, SUVA254 for each sample was shown in a box plot (Figure 7). The difference between the average SUVA254 and the median SUVA254 are somewhat large in bulk rains (Rv, Rr, and Rd) due to the large variability of the data. The median SUVA254 of bulk rains (Rv, Rr, and Rd) ranged from 0.85 to 1.35; these values were lower than the SUVA254 values of the other sample types. The median SUVA254 increased in the order of TF, SF, and O leachate; it decreased in the soil-percolating waters (Figure 7). The median SUVA254 was generally higher in the seepage and stream waters than in the soil-percolating waters.
3.3. Seasonal Variation in DOC Concentration and SUVA254 Value
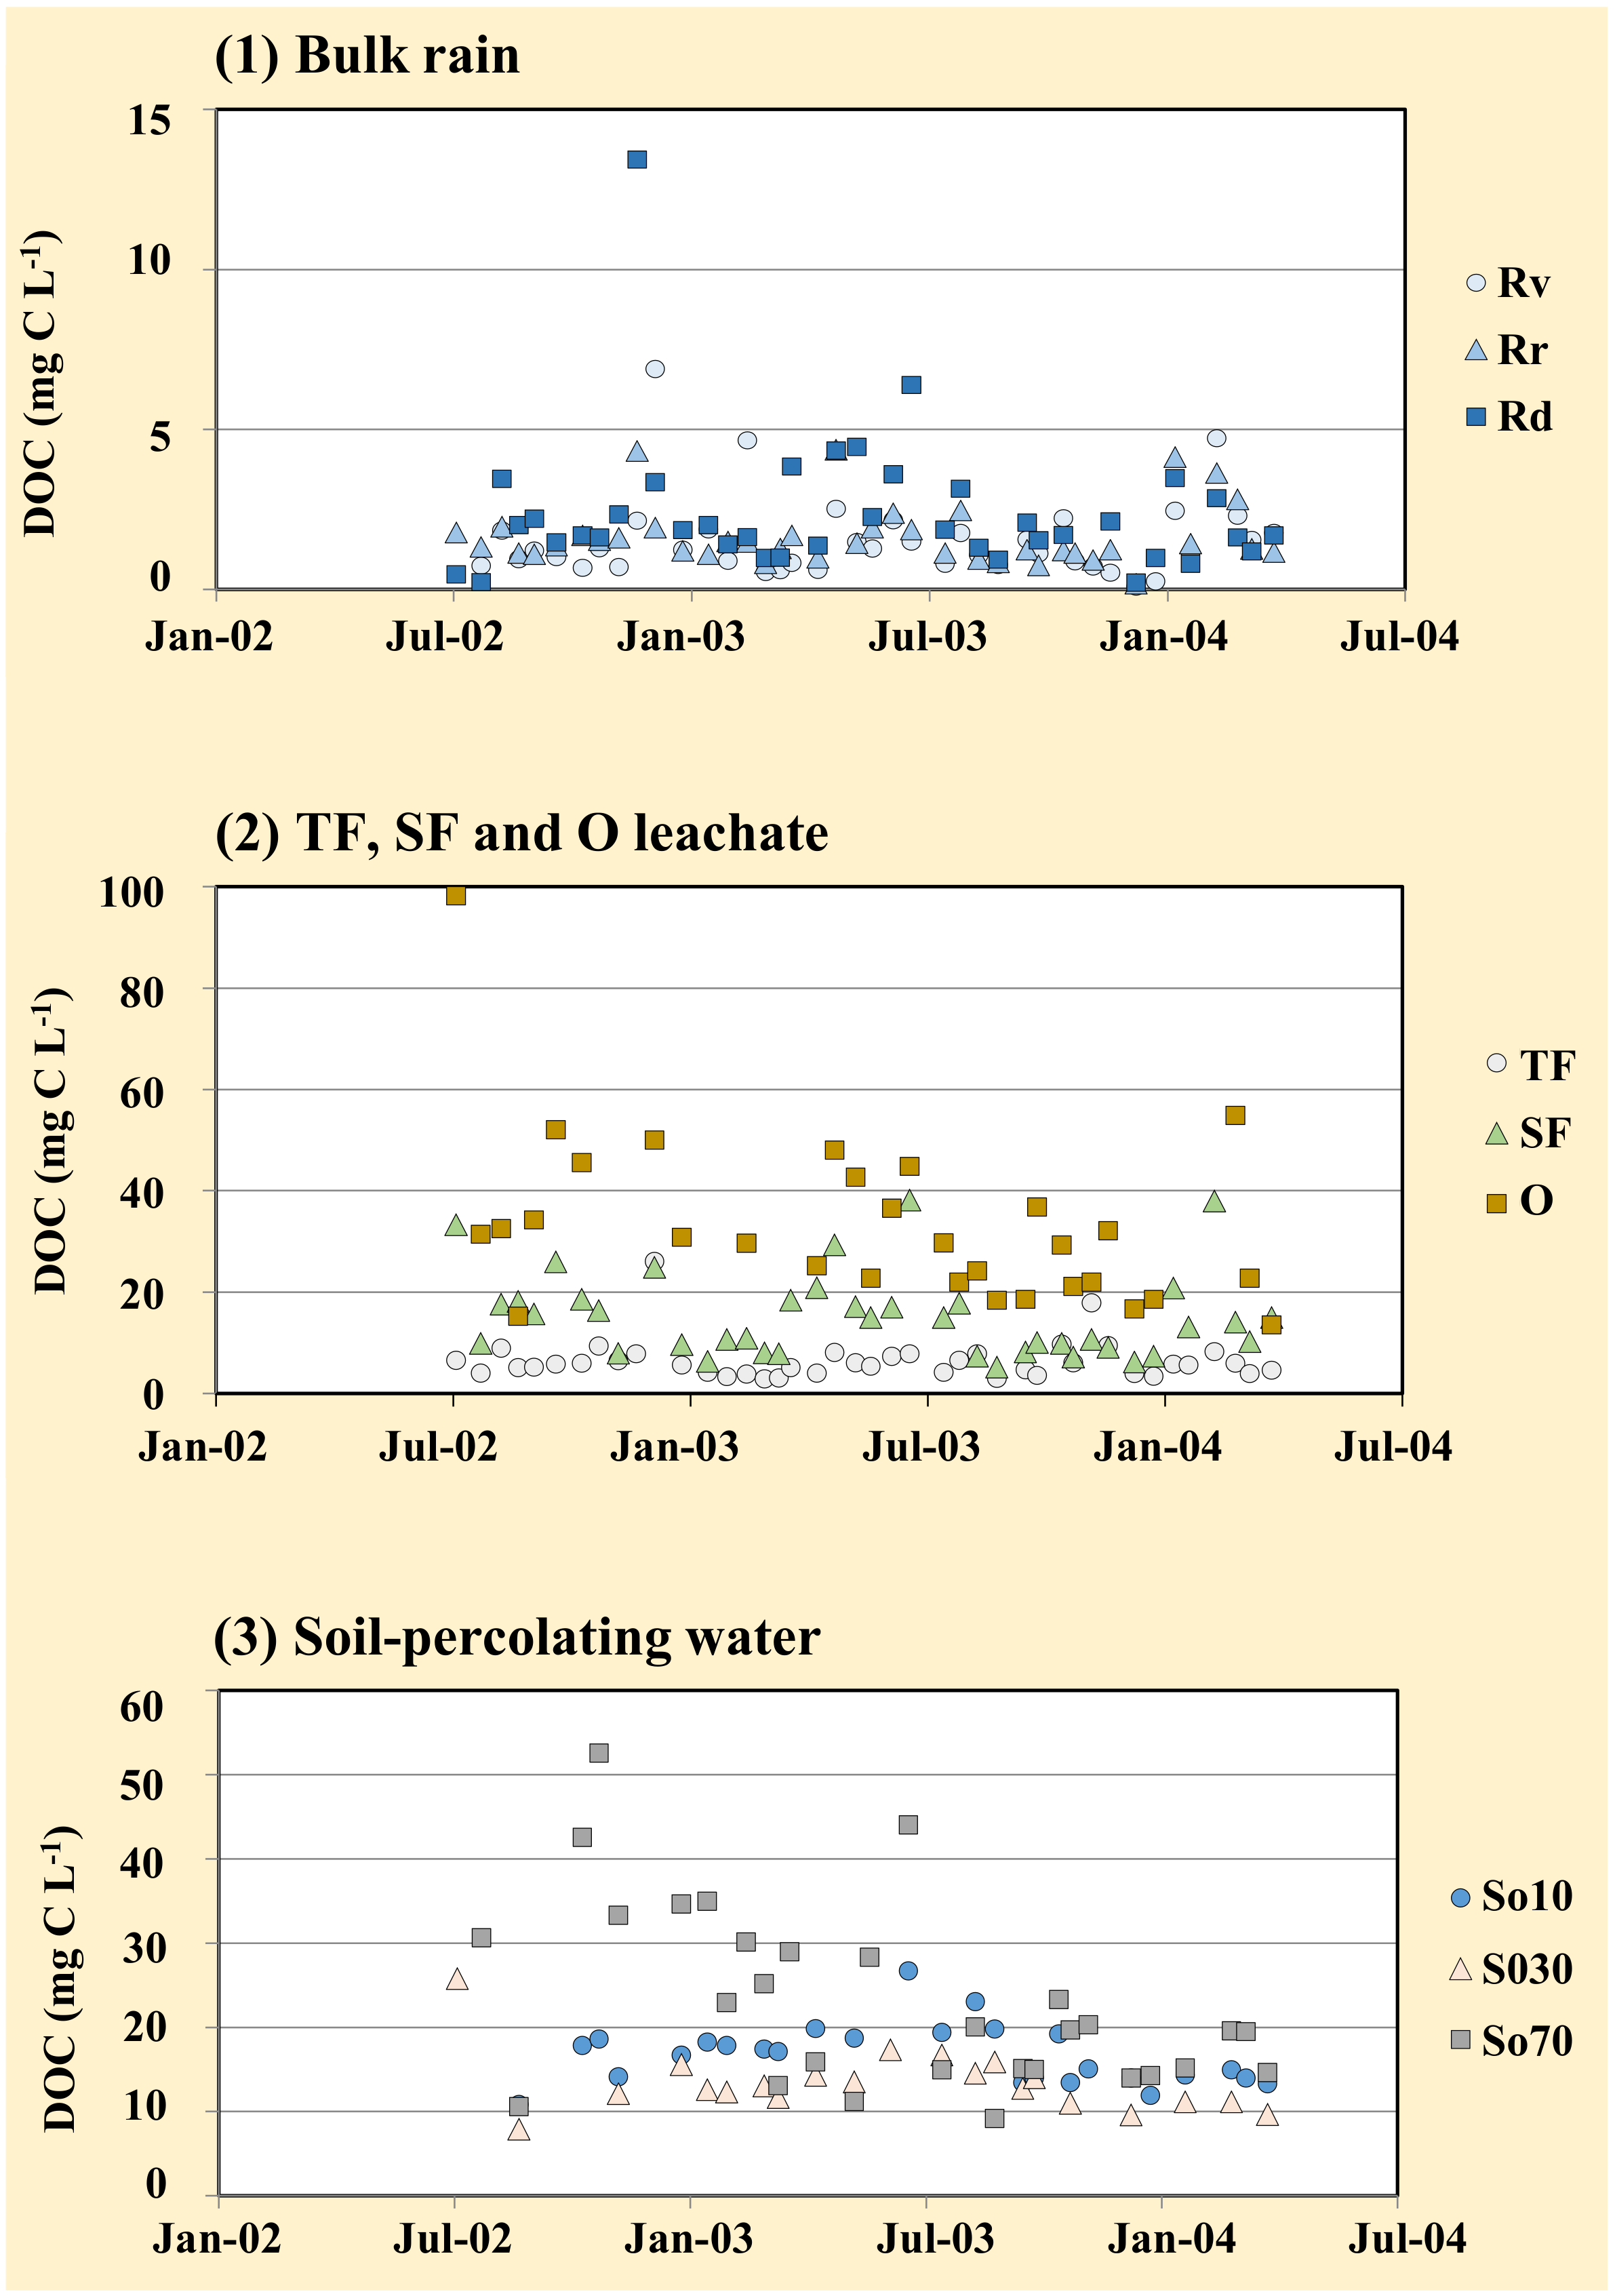
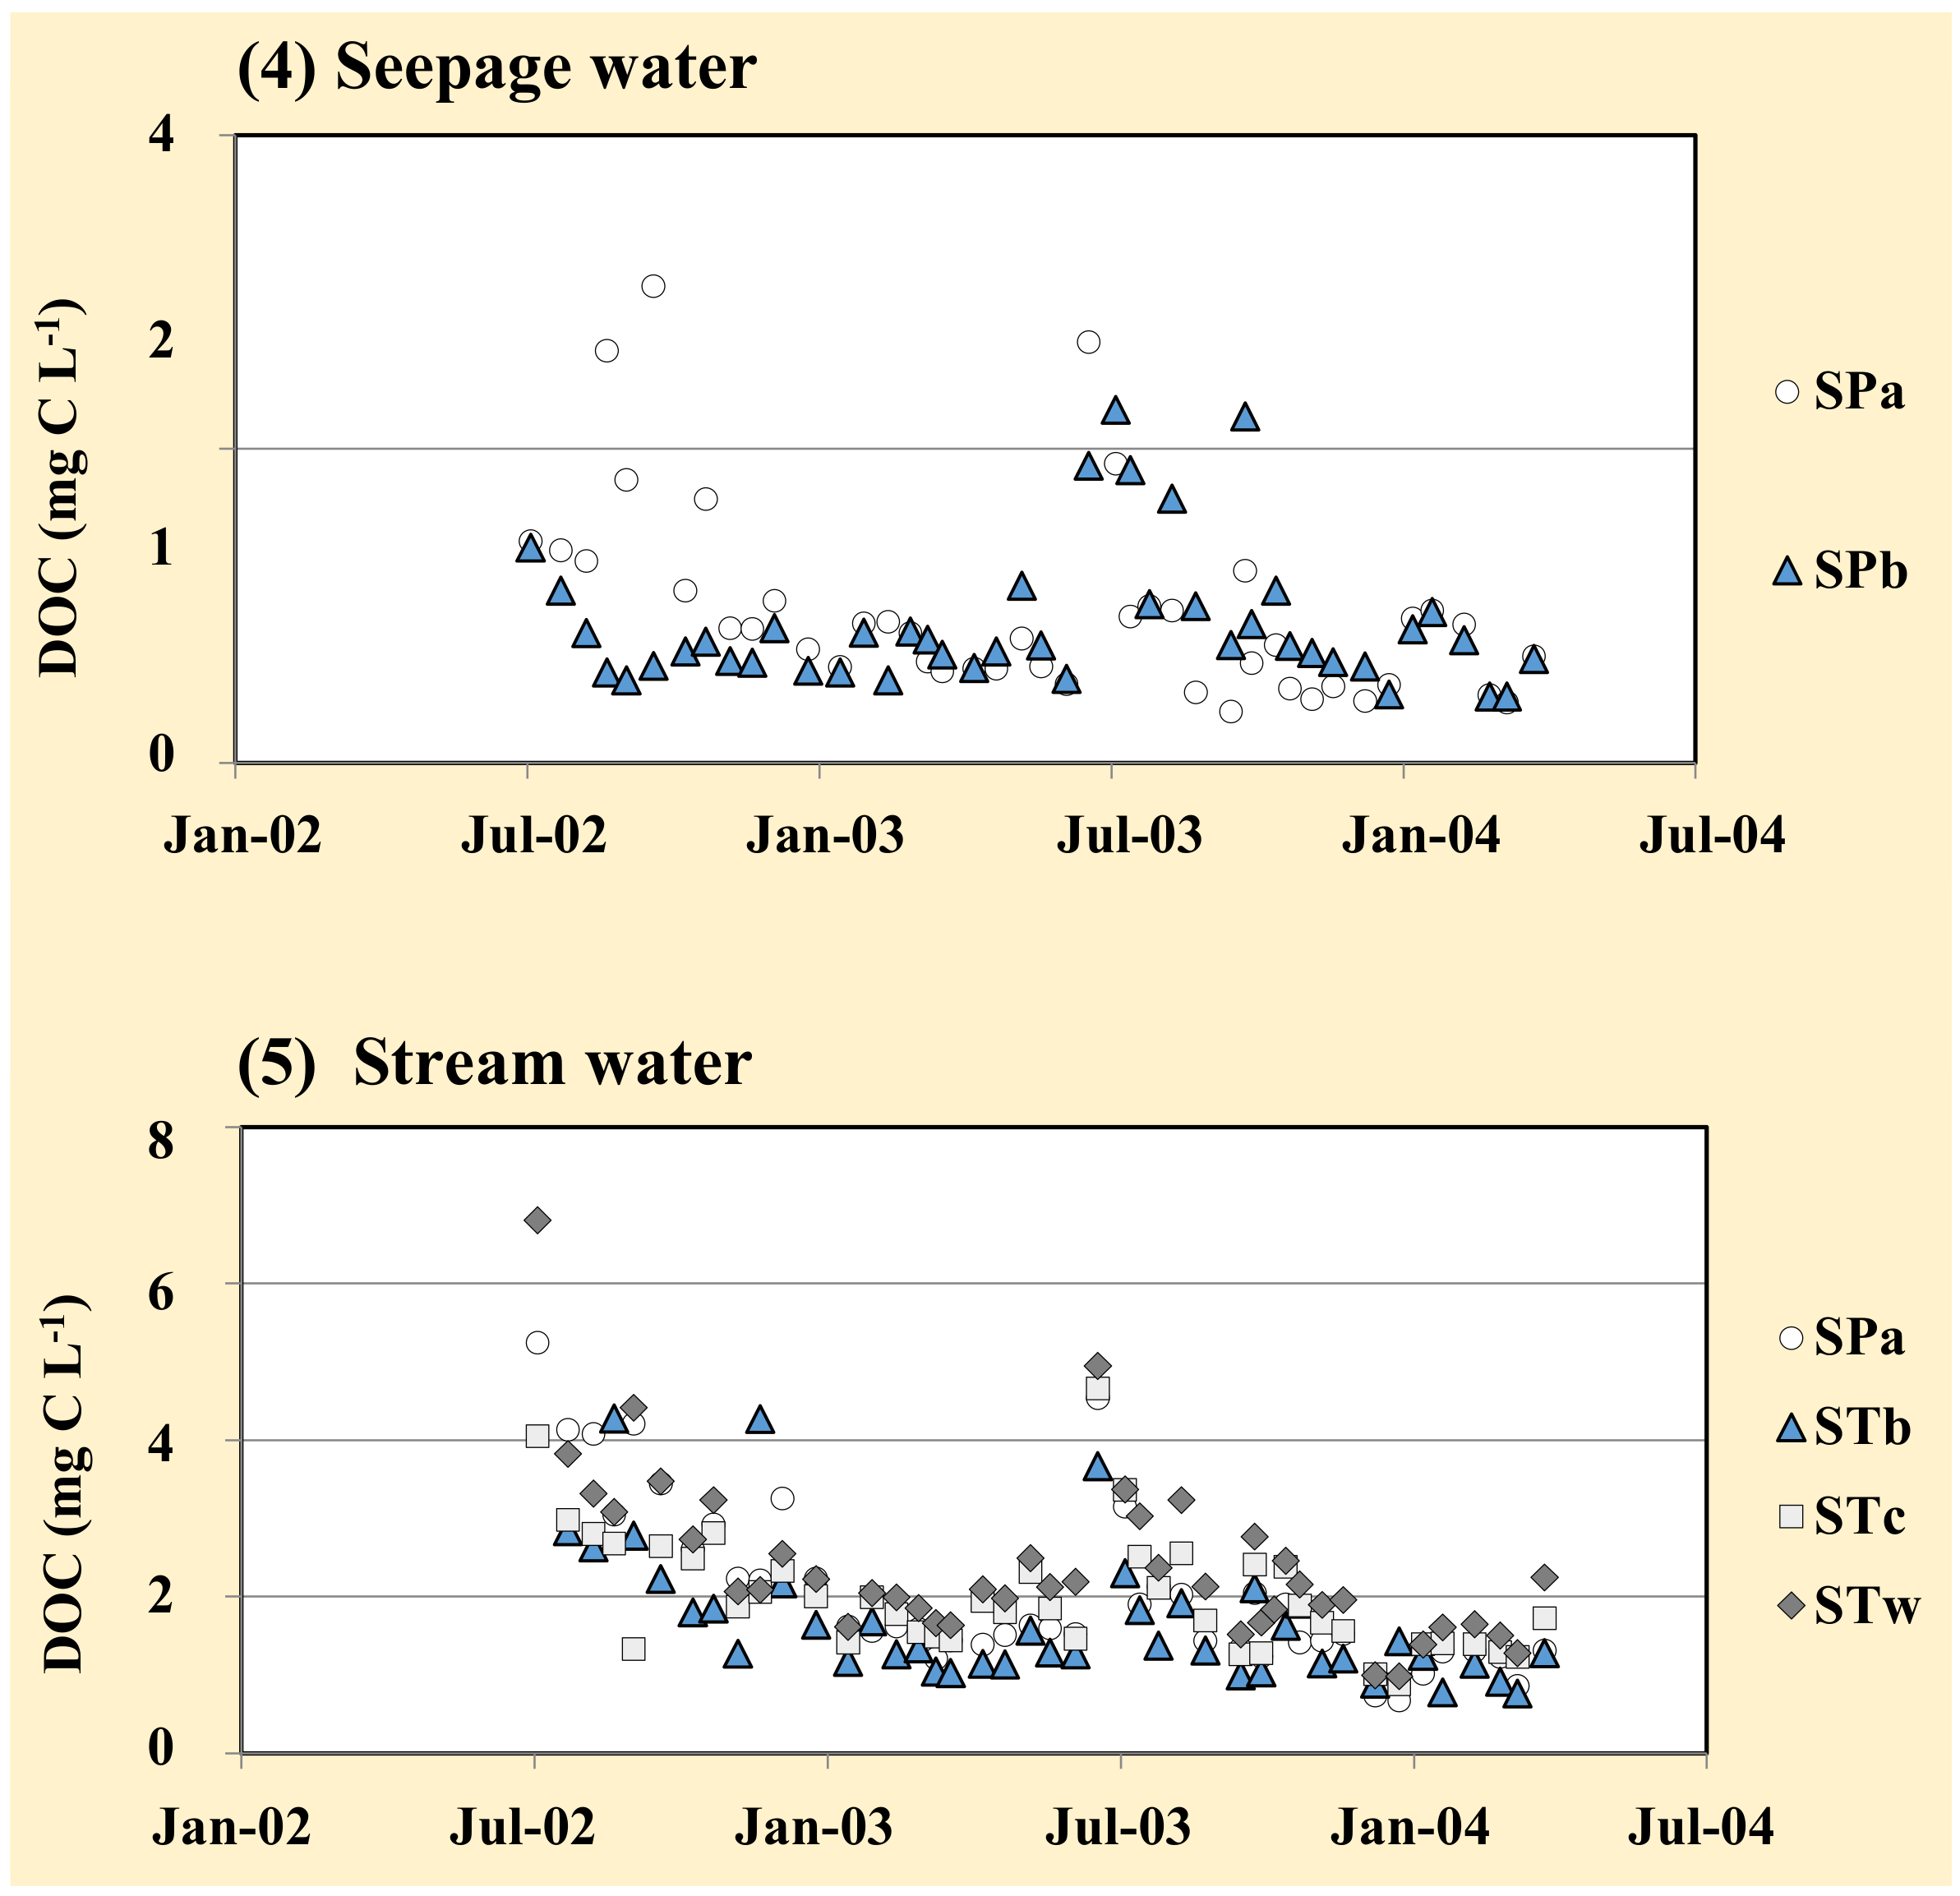
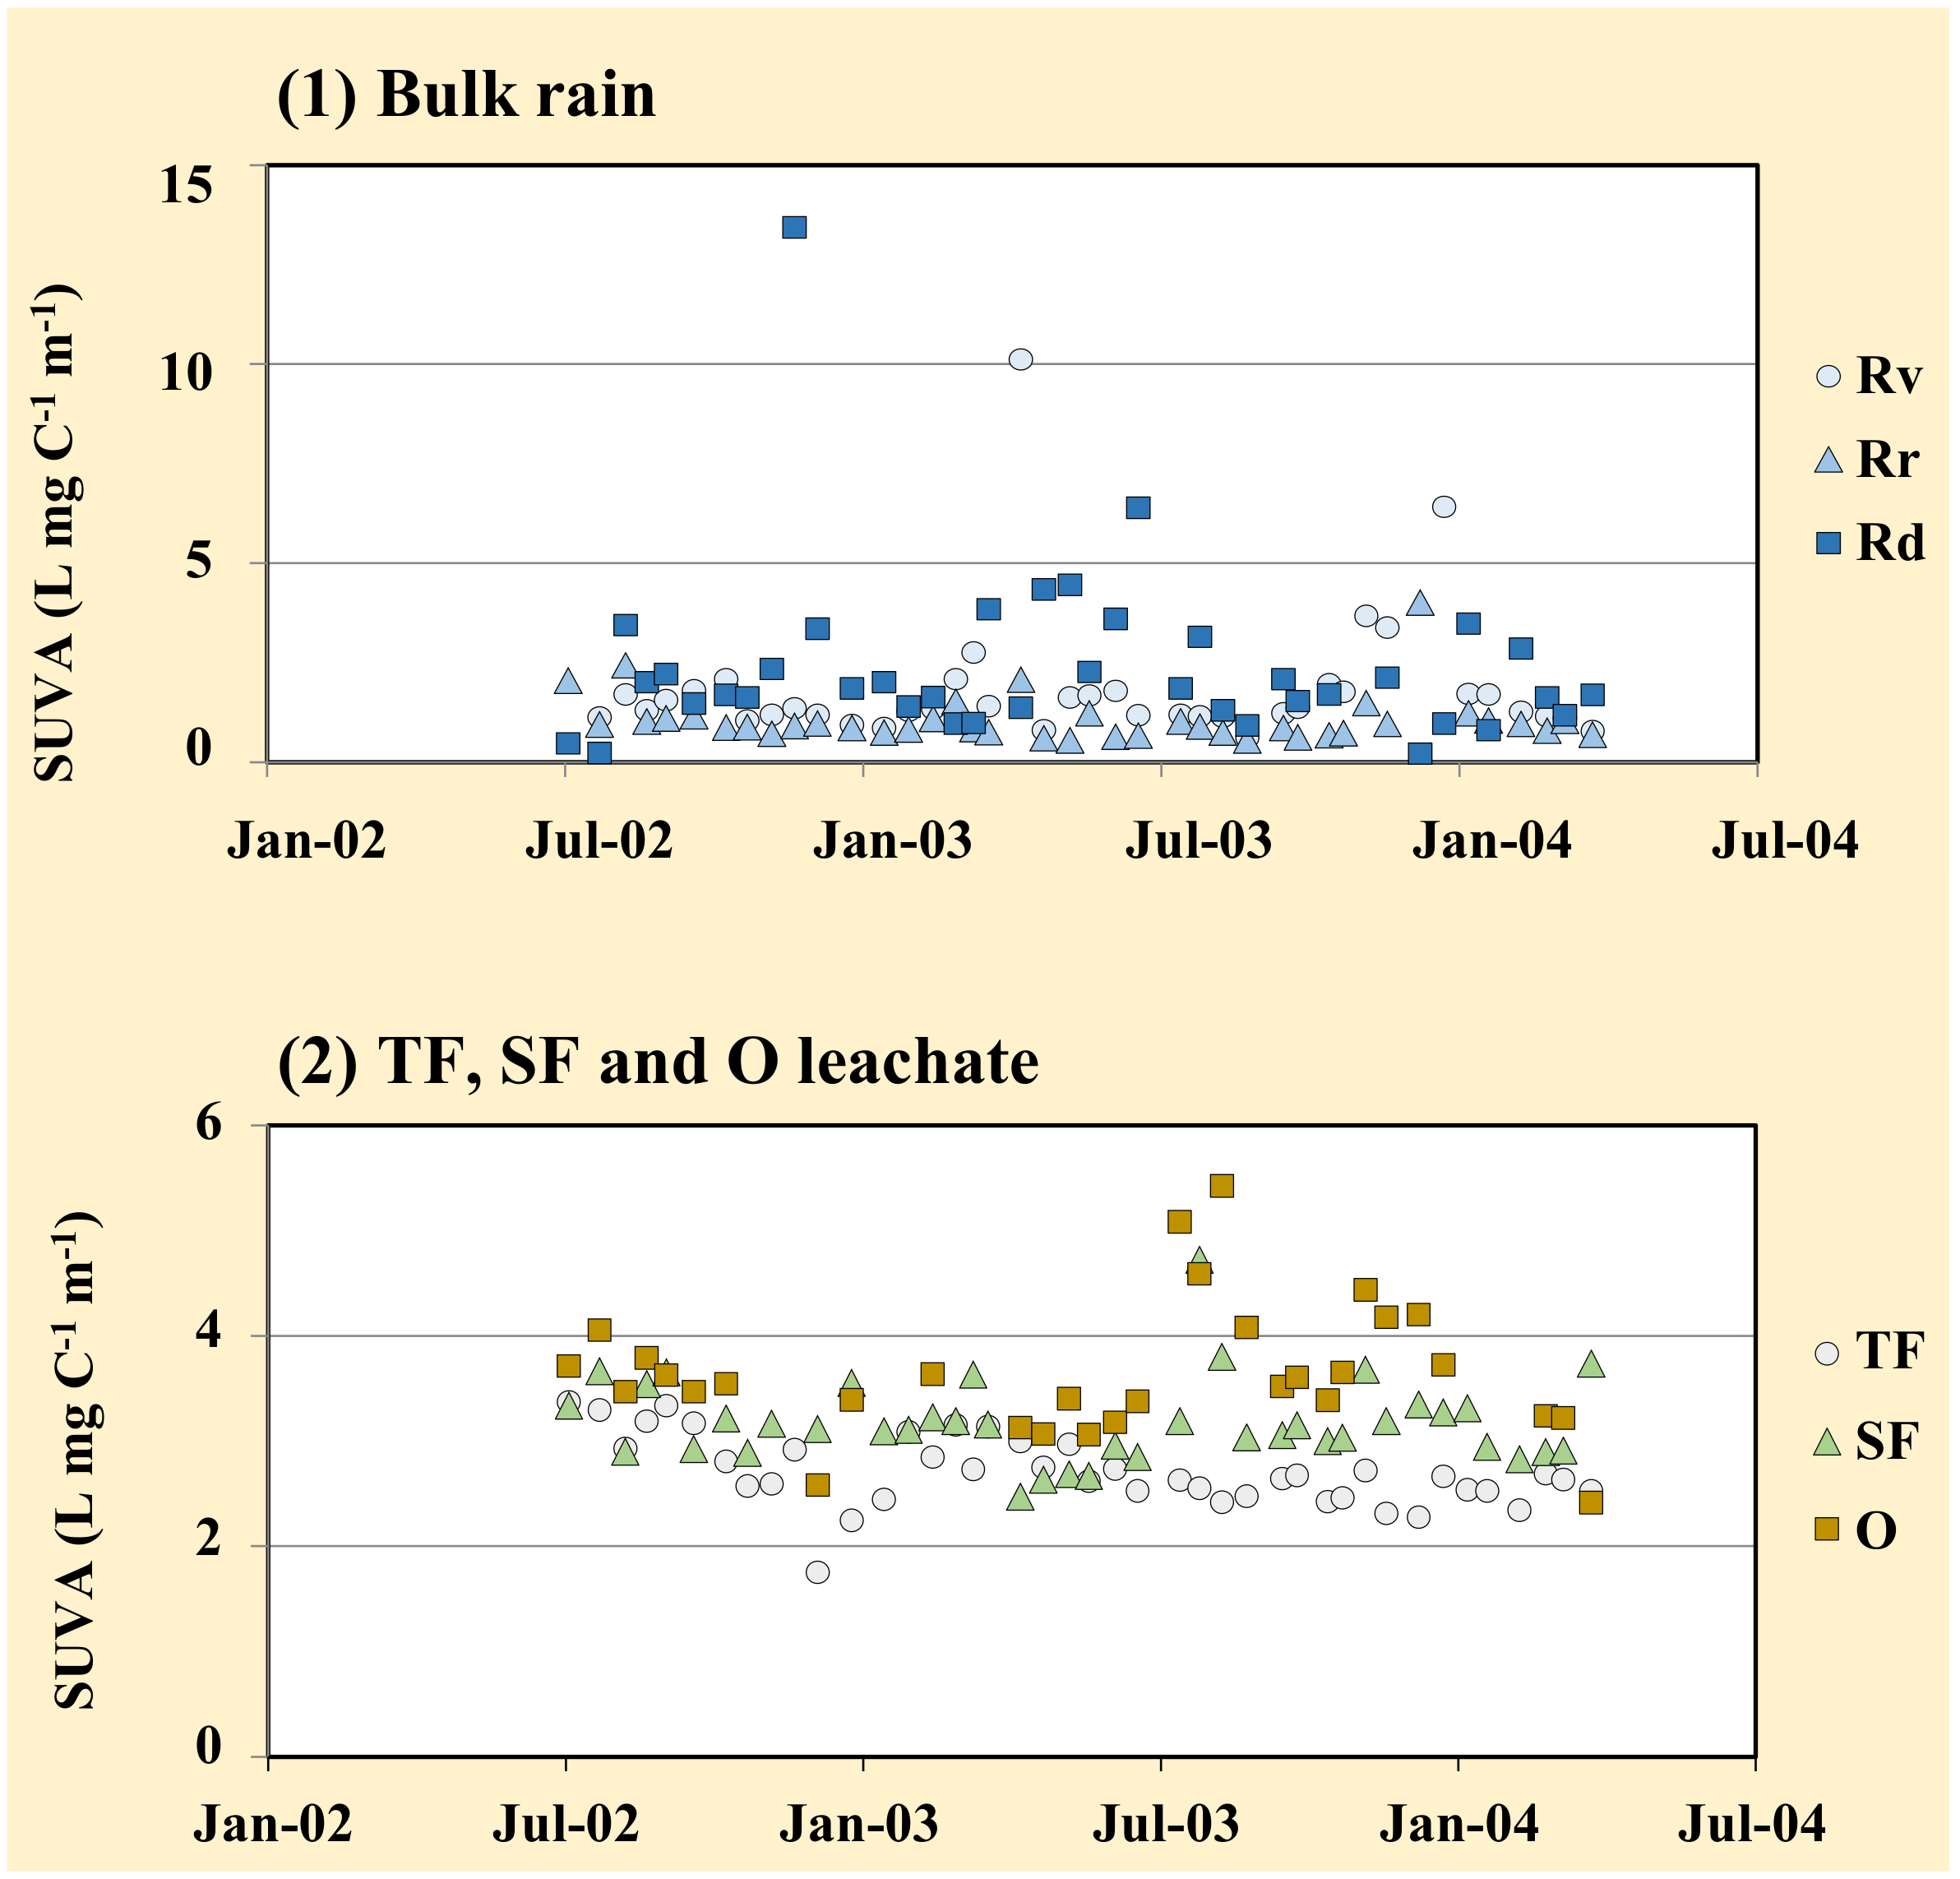
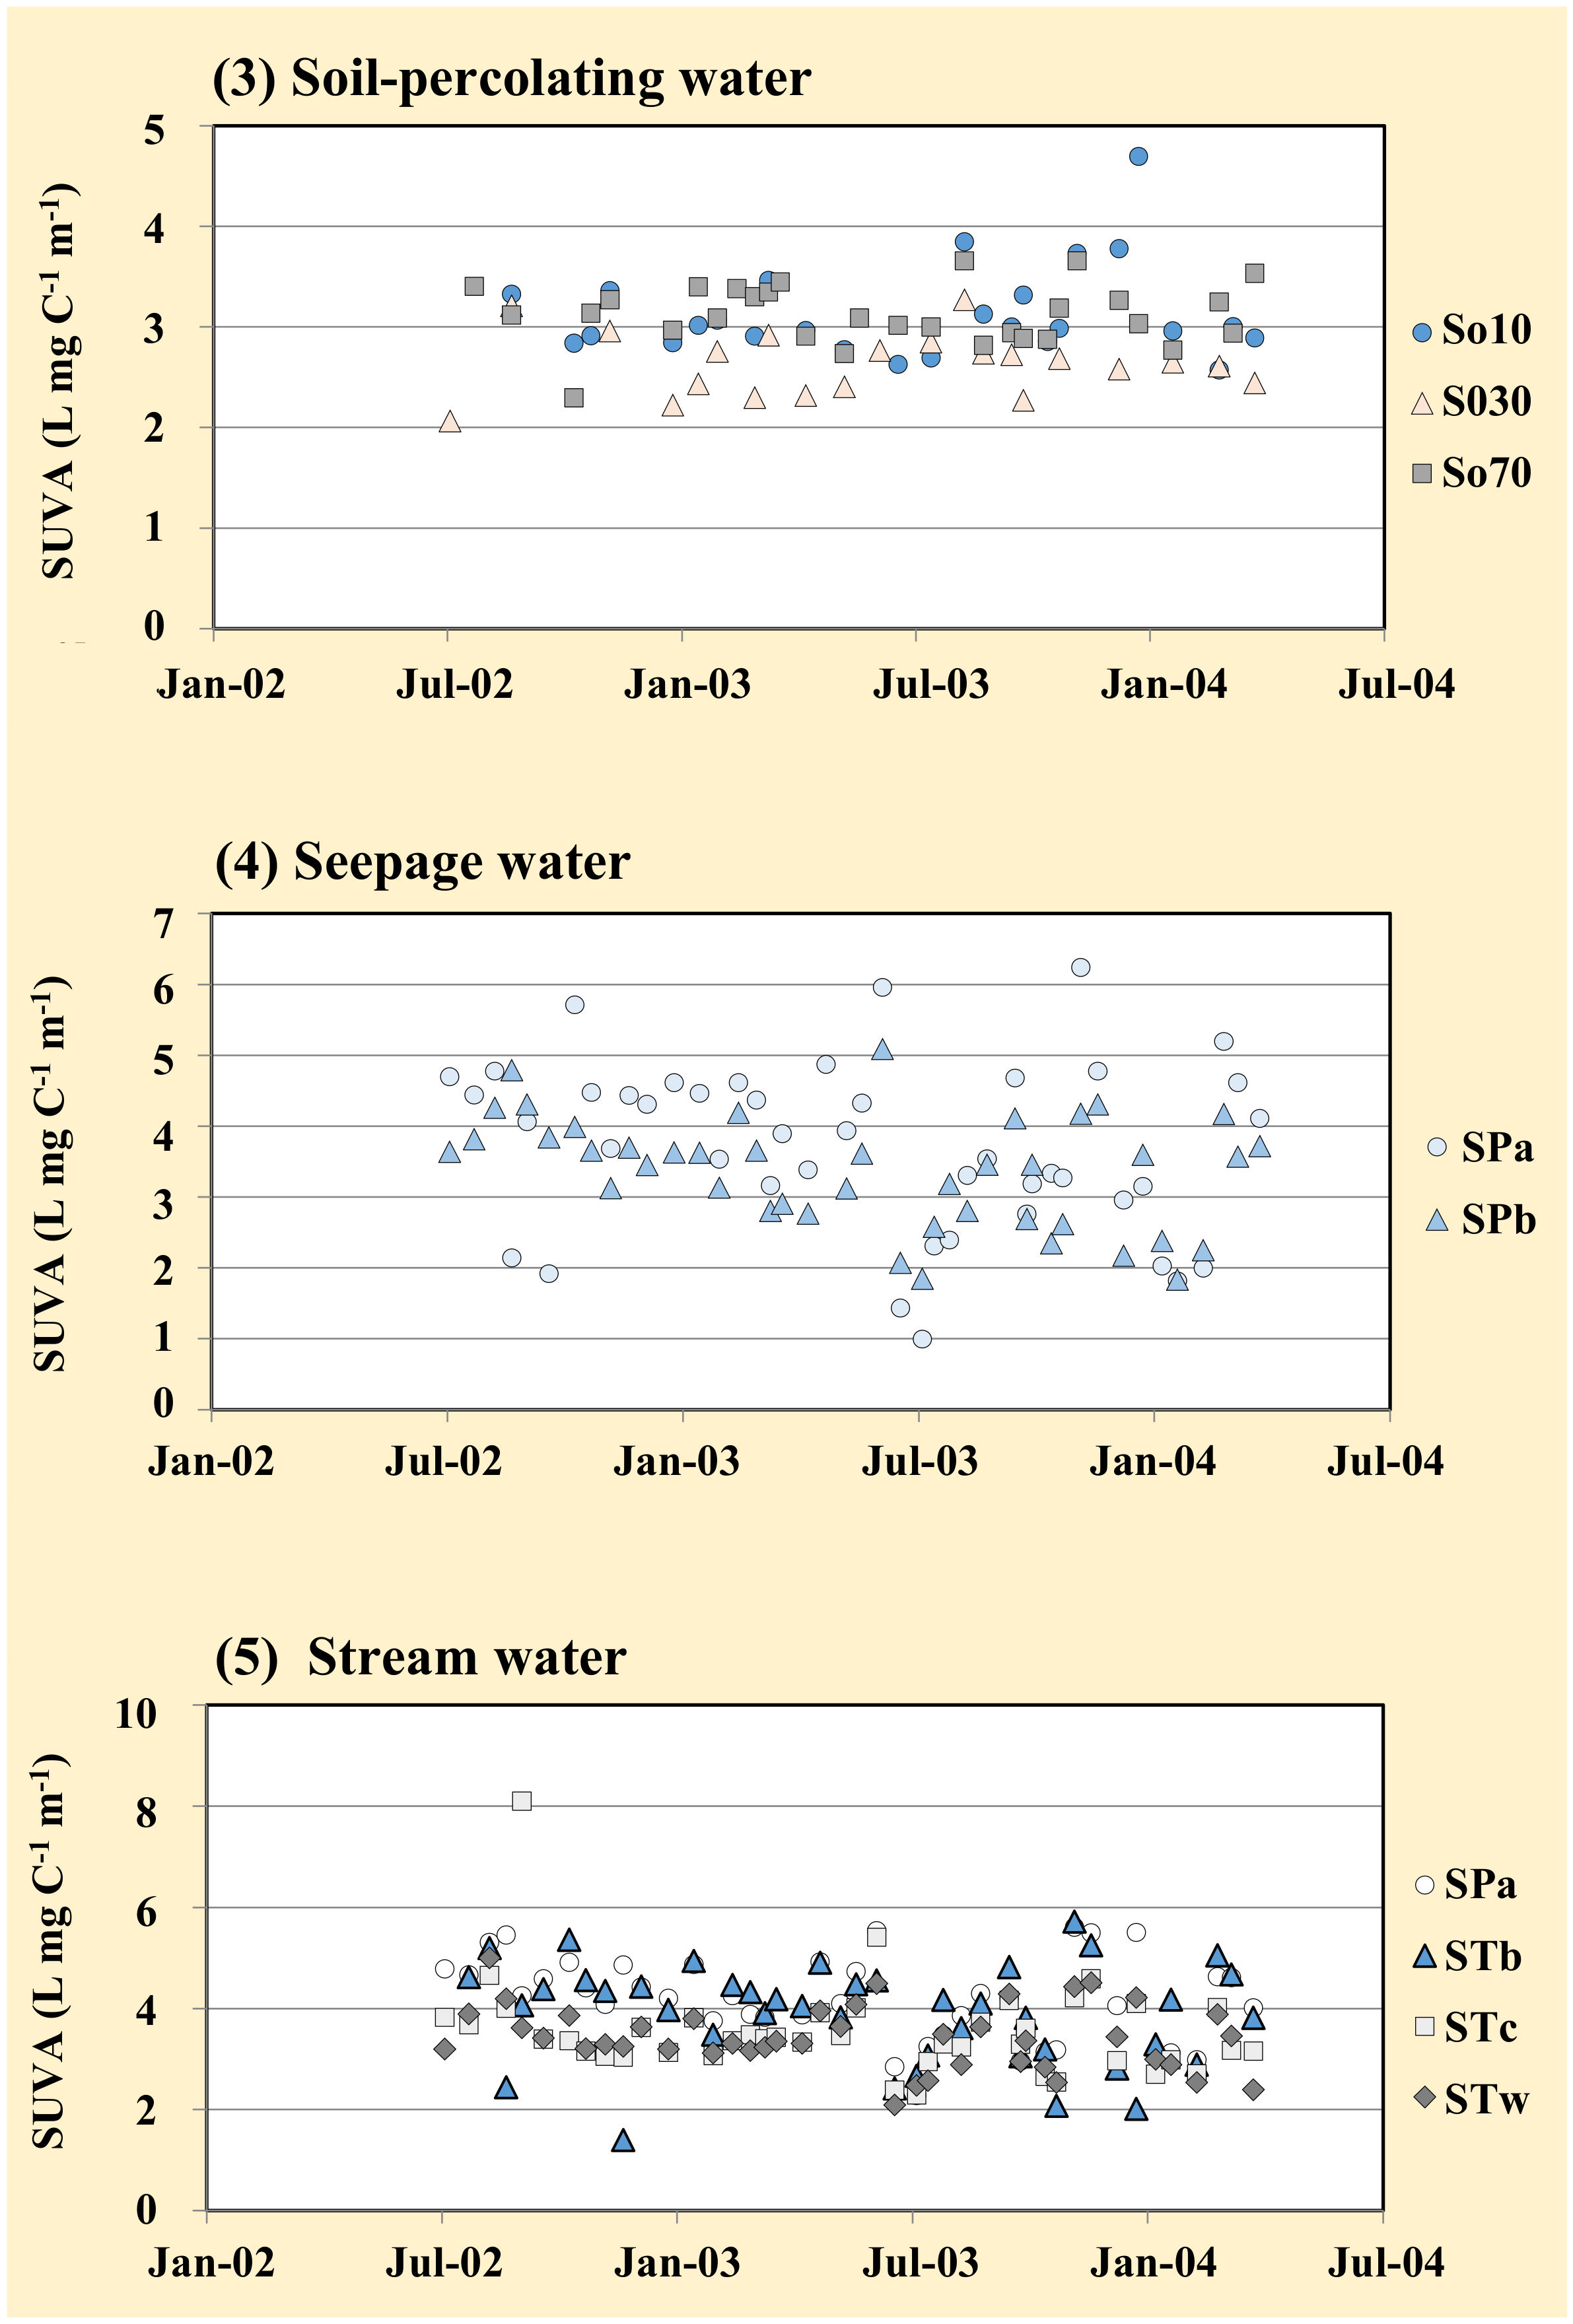
Both the DOC concentration and SUVA254 of the bulk rain (Rv, Rr, and Rd) increased in autumn and from late spring to early summer, but they decreased in winter (Figure 8 and Figure 9). DOC concentrations in TF, SF, and O leachate increased in summer; the DOC concentration was always higher in the order of O leachate, SF, and TF. For the O leachate, high SUVA254 values were observed in summer 2004. For the soil-percolating water, the DOC concentrations at a depth of 10 cm (So10) increased from autumn to early winter in 2002; the DOC concentrations at a depth of 70 cm (So70) increased in winter 2003. The SUVA254 of the soil-percolating water remained almost constant throughout the soil layers; the value at So30 was lower than the values at So10 and So70. For the seepage waters, a high DOC concentration was observed in summer 2002 for SPa and in summer 2003 for both SPa and SPb. The SUVA254 of SPb was generally higher than the SUVA254 of SPa throughout the observation period. The DOC concentration increased in summer and decreased in winter for the stream waters at all sites. The peak height of DOC concentration was generally high in STw and low in STb among the stream water samples. The SUVA254 of STw was generally low, while the SUVA254 of STa was high, among stream water samples throughout the observation period.
4. Discussion
4.1. Doc Concentration and Flux
This study clarified the DOC concentrations and flux in a broad-leaved secondary forest at the level of the watershed of the YMS. We compared the DOC concentrations in the bulk rain, TF, and SF in the YMS with the DOC concentrations in an artificial 35-year-old sugi (Cryptomeria japonica) stand in Anshoji National Forest (ANF), Kyoto City, which is located 24 km north of the YMS [53,54,55]. The DOCavg of bulk rains (1.1–1.7 mg L−1) in the ANF was almost identical to the value in the YMS (1.2–1.6 mg L−1). The DOCavg of TF (4.7–5.9 mg L−1) in the ANF did not differ from the value in the YMS (5.69 mg L−1), while the DOCavg of SF was higher in the ANF than in the YMS (25.7–35.9 mg L−1 vs. 13.6 mg L−1, respectively) (Table 2). Liu and Sheu [11] reported that the DOC concentration of SF was higher in the Chinese fir (Cunninghamia lanceolata) plantation (30.8 ± 17.3 mg L−1) than in the secondary and natural hardwood stands (7.2 ± 4.1–15.5 ± 11.6 mg L−1) in Guandaushi Forest in central Taiwan. Inagaki et al. [33] also demonstrated that the weight-average DOC concentration of SF was higher in stands of two conifer species, sugi and hinoki (Chamaecyparis obtusa), than in a stand of the broad-leaved species, kojii (Castanopsis cuspidata). Higher DOC concentrations in coniferous forests were also observed in Germany [12]. These results clearly indicated that the DOC concentration of SF was higher in coniferous forests than in broad-leaved forests; the difference in DOC concentration of SF among sites presumably reflected differences in tree species.
There are few studies of DOC in tropical forests compared to temperate forests. DOC flux in TF was reported to be 68.4-195 kg ha−1yr−1 in an Amazon tropical forest [18] and that in the O layer is reported to be 4.2–5.4 kg C ha−1yr−1 in a forest of East Kalimantan, Indonesia [56]. These results suggest that the DOC flux in tropical forests is similar to or slightly higher than that in temperate forests.
Michalzik et al. [57] compiled published data concerning the concentrations and fluxes of DOC and DON from 42 case studies in temperate forests in North America and Europe. They found the highest concentrations of DOC and DON in the forest floor leachates and in the A horizon; the annual transport of DOC from the forest floor into the mineral soil averaged 17% (range 6–30%) of the annual litter input, while the annual transport of DON averaged 26% (range 1–53%) of the litter N input [57]. Fujii et al. [4] reported that the DOC fluxes from the O layer corresponded to 16.7% of litterfall C in a deciduous forest in Kyoto City. In the YMS, the annual C flux (272.4 kg C ha−1yr−1) in the O leachate corresponded to 10% of the annual C flux (2674.7 kg C ha−1yr−1) by litterfall, while the annual N flux (12.2 kg N−1yr−1) in the O leachate constituted 21.9% of the annual N flux (55.5 kg N ha−1yr−1) by litterfall [45] (Table S5). These results suggested that the aboveground dynamics of DOC and DON in the YMS are common to temperate forests.
4.2. Variation in DOC Properties among Sample Types
The weight-average SUVA254 value (1.07–2.53 L mg C−1m−1) in the bulk rain in our study (Table S3) was comparable to the range (0.5–1.3 L mg C−1m−1) of rain in Georgia, USA [13]. The low SUVA254 value indicates that the aromatic carbon content is low in rainwater. Both DOC concentration and SUVA254 value of the bulk rain in the YMS were generally high in summer (Figure 8 and Figure 9). Similar seasonal variation, high in summer and low in winter, was also observed for DOC concentrations in rainwater in the eastern USA [10,58]. These observations suggest that the DOC supply from plant tissue to rainwater increases in the growing season. For TF, the weight-average SUVA254 (2.72 L mg C−1m−1) was comparable to the SUVA254 values of oak stands (Quercus virginiana Mill; 1.6–2.8 L mg C−1m−1) and deciduous trees (2.7–3.2 L mg C−1m−1) in the eastern USA [13,17]. For SF (3.16 L mg C−1m−1), it was also comparable to the SUVA254 values of oak stands (Q. virginiana Mill; 1.9–4.2 L mg C−1m−1), American beech (Fagus grandifolia; 2.5–4.9 L mg C−1m−1), and yellow poplar (Liriodendron tulipifera; 3.7–6.2 L mg C−1m−1) in the eastern USA [13,59]. These reports indicated that aromatic carbon content is generally high in both TF and SF; the DOC of SF has a higher aromatic content than does the DOC of TF.
A decrease in the DOC concentration when rainwater passes through the O layer was observed in the YMS, similar to findings in other studies [4,12,17,57]. However, the decrease with depth reported previously [2,14,15,19,57] was not observed for the percolating water in the mineral soil in the YMS (Table S3). The decrease in specific UV absorbance at 250 nm (SUVA250) with soil depth was observed in a forested watershed in Shiga Prefecture in Japan [60], whereas the decrease in SUVA254 value with soil depth was not clear in the YMS (Figure 6 and Table S3). DOC is generally retained in mineral soil, either by sorption to or by co-precipitation with reactive mineral phases, such as aluminum and iron hydrous oxides [15,16]. Asakawa et al. [61] reported that the contents of dithionite citrate bicarbonate-extractable aluminum and iron (Ald and Fed, respectively) were 0.89–1.08 g kg−1 and 8.33–8.56 g kg−1, respectively, while the contents of acid oxalate-soluble aluminum and iron (Alo and Feo, respectively) were 0.65–0.68 g kg−1 and 1.12–2.63 g kg−1, respectively, in granite-derived soil in a forest adjacent to the YMS. These values were lower than the values in mature forest soils derived from granite rock [62], in which the mean Fed and Ald contents had ranges of 8.09 ± 2.66 to 9.66 ± 6.88 g kg−1 and 4.81 ± 1.79 to 4.07 ± 1.20 g kg−1, respectively, whereas the mean Feo and Alo contents were 4.30 ± 1.72–4.12 ± 2.97 g kg−1 and 5.76 ± 2.77–4.81 ± 1.57 g kg−1, respectively. Therefore, we presumed that retention of DOC in the mineral soil was unlikely to occur in the YMS.
The use of a tension-free lysimeter for collecting soil-percolating water may also have contributed to the low adsorption of DOC to mineral soil. Deb and Shukla [1] compared two water sampling devices; they reported that the DOC concentrations in soil solutions were significantly higher with tension–free collectors than with tension devices. The tension-free lysimeter preferentially collects water flowing in large pores. In preferential flow, high water movement velocity leads to low contact times between soil solution and the solid matrix; it creates conditions of chemical and physical nonequilibrium [2]. Hence, the adoption of tension-free lysimeter methods may have contributed to the small decreases in DOC concentration with soil depth recorded at the YMS.
The DOCavg was extremely low in the seepage waters (SPa and SPb) compared to the soil-percolating waters (Table S3), suggesting that sufficient absorption and biodegradation of DOC occurred through water passage in the deeper soil zone in the watershed. However, the higher SUVA254 in the seepage waters (Figure 6) suggested that preferential retention of the hydrophobic DOC fraction [63] did not occur. We cannot explain the reason for this discrepancy; it may be related to the accuracy of the TOC analyzer. The determination of DOC in water samples in which the DOC concentration is very low, such as the seepage and stream waters, is influenced by the system blank because of carbon emitted from the catalyst and components of the Shimadzu TOC analyzer [48]. Because of the system blank, the DOC concentration may have been overestimated, which may have contributed to the lower SUVA254 value.
The DOC concentration of stream waters increased in summer but decreased in winter (Figure 8); the DOC concentrations of stream waters were positively correlated with water temperature (Table 1). The DOC concentration is enhanced by algal growth and litter decomposition in streams [64]. Based on the results of a study performed in a deciduous forest in Kanagawa Prefecture in Japan, Sakamoto and Yoshitake [65] reported that algal photosynthesis decreased in summer because of the increase in canopy leaf area. Deciduous broad-leaved trees are dominant in the YMS; thus, algal photosynthesis production in the stream presumably was not responsible for the high DOC concentration in summer. Dead organic matter, such as leaf litter, is present in the streambed in the YMS; accordingly, the observed increase in DOC concentration in summer may be related to the decomposition of dead organic matter [66]. We concluded that the dissolution of DOC from dead organic matter in the streambed may have contributed to the high DOC concentrations in the stream waters.
The correlations between DOC concentration and UV absorbance at specific wavelengths have been recognized in various types of natural water [21,22,24,25,26]; however, few studies have focused on rain to stream water in forested watersheds. Significant correlations between DOC concentration and UV254 were observed for all sample types in the YMS in this study. These results suggest that UV absorbance is a good indicator for estimation of the DOC concentration for all types of water in the forest watershed because the measurement of DOC using a total carbon analyzer is both time-consuming and expensive. However, the correlation coefficient between DOC concentration and UV254 differed among the sample types (Table 1); the slope of the approximate lines also differed among sample types (Figure 6). The correlation coefficients were generally low for the bulk rains (Rv, Rr, and Rd). Rain contains various organic compounds (e.g., formaldehyde, acetaldehyde, amino acids, and humic-like substances) that are derived from both natural and anthropogenic sources [10]. Changes in DOC sources with rain events may influence the low correlation between DOC concentration and UV254. The levels of aromatic compounds were estimated to be low in rainwater because the gradient of the approximate line of bulk rains was low, as shown in Figure 6.
The gradient of the approximate line increased in the order of TF, SF, and O leachate. It has been suggested that aromatic carbon is supplied from plant tissue and litter layer, as well as the aromaticity of DOC [13]. The addition of aromatic carbon enhanced the correlations between DOC concentration and UV254 in the TF, SF, and O leachate. In the soil-percolating water at So10, the correlation between DOC concentration and UV254 was low (r = 0.757) compared with the TF and O leachate (Table 1). The water collection areas were 9000, 3600, and 450 cm2 for the samplers of the TF, O leachate, and soil-percolating water, respectively. The area of water collection devices may have influenced the heterogeneity of water quality because the quality of TF considerably varied. The correlation between DOC concentration and UV254 increased in the order of So10, So30, and So70. These observations indicated that the heterogeneity of soil-percolating water decreased with depth because of water mixing.
The correlation coefficient between DOC concentration and UV254 was generally low in the seepage waters and stream waters; it was particularly low in SPa and STb (Table 1). There were anomalous data indicating a low ratio of DOC to UV254 in the SPa and STb (Figure 6). Low DOC concentration and UV254 may have been caused by direct rainfall into seepage and stream waters because the gradient of the approximate line was low in the bulk rains (Figure 6). The sites of SPa and STb may be more susceptible to direct rainfall because of their microtopography.
5. Conclusions
We investigated the quantity and quality of DOC from rain to stream water in a forested watershed of a broad-leaved secondary forest. In this study, strong correlations were observed between the DOC concentration and UV254 for all sample types in the watershed. The measurement of UV absorbance using a spectrophotometer is both easier and cheaper than the determination of DOC with a total carbon analyzer. Our results confirmed the usefulness of estimating the DOC concentration via UV254 measurement. However, we found that the ratio of DOC concentration to UV254 varied among sample types in the watershed; the correlation between DOC concentration and UV254 also differed among sample types. For the application of UV absorbance to estimate DOC concentrations in other forested watersheds, it will be necessary to confirm the relationship between DOC concentration and UV absorbance for the target sample type.
Supplementary Materials
The following are available online at https://www.mdpi.com/article/10.3390/f13040510/s1, Table S1: Soil chemical properties of the YMS., Table S2: Soil physical properties of the YMS., Table S3: Total precipitation, average water temperature, and average water chemical constituents for all sample types at the YMS from July 2002 to March 2004., Table S4: Average ion concentration in all sample types at the YMS from July 2002 to March 2004., Table S5: Annual flux of water and elements for all sample types at the YMS.
Author Contributions
Methodology, S.K. and Y.H.; formal analysis, S.K. and Y.H.; investigation, S.K. and Y.H.; resources, S.K., H.F. and Y.H.; data curation, S.K. and Y.H.; writing—original draft preparation, S.K.; writing—review and editing, S.K., Y.H., H.F. and T.O.; supervision, S.K.; project administration, S.K.; funding acquisition, T.O. All authors have read and agreed to the published version of the manuscript.
Funding
This study was funded by the FFPRI project “The Monitoring of the Effect of Acid Rains on Forest Ecosystem and Stream Water Chemistry: FY 2000-2004”.
Institutional Review Board Statement
Not applicable.
Informed Consent Statement
Not applicable.
Data Availability Statement
Data are available on request from the corresponding author.
Acknowledgments
We are grateful to Noriko Akieda and Fumiya Naito of Kinki University for assisting with water sample collection in the field. We are very appreciative of Koji Tamai for providing hydrological data. We would like to express our deep gratitude to Kei Nambu and Toko Tanikawa for their professional support of the research. We also thank Yukari Yamamoto for assisting with laboratory work.
Conflicts of Interest
The authors declare no conflict of interest.
Abbreviations
The following abbreviations are used in this manuscript:
| Ald | the contents of dithionite citrate bicarbonate-extractable aluminum |
| Alo | the contents of acid oxalate-soluble aluminum |
| ANF | Anshoji National Forest |
| DIC | dissolved inorganic carbon |
| DOC | dissolved organic carbon |
| DOCavg | the weight-average DOC concentration |
| DOM | dissolved organic matter |
| EC | electrical conductivity |
| Fed | the contents of dithionite citrate bicarbonate-extractable iron |
| Feo | the contents of acid oxalate-soluble iron |
| O leachate | O layer leachate |
| Rd | bulk rain at a southwest point of the watershed |
| Rr | bulk rain on a ridge |
| Rv | bulk rain in a closed valley |
| SF | stemflow |
| So10 | soil-percolating water at depth of 10 cm |
| So30 | soil-percolating water at depth of 30 cm |
| So70 | soil-percolating water at depth of 70 cm |
| SPa | seepage water at the SPa point |
| SPb | seepage water at the SPb point |
| STa | stream water at the STa point |
| STb | stream water at the STb point |
| STc | stream water at the STc point |
| STw | stream water at a closed point of the weir |
| SUVA | specific UV absorbance |
| SUVA254 | the specific UV absorbance at 254 nm |
| TF | throughfall |
| TOC | total organic carbon |
| UV | ultraviolet |
| UV254 | the UV absorbance at 254 nm |
| YMS | Yamashiro Experimental Forest |
References
- Deb, S.K.; Shukla, M.K. A Review of Dissolved Organic Matter Transport Processes Affecting Soil and Environmental Quality. J. Environ. Anal. Toxicol. 2011, 1, 106. [Google Scholar] [CrossRef]
- Kalbitz, K.; Solinger, S.; Park, J.H.; Michalzik, B.; Matzner, E. Controls on the Dynamics of Dissolved Organic Matter in Soils: A Review. Soil Sci. 2000, 165, 277–304. [Google Scholar] [CrossRef]
- Kalbitz, K.; Kaiser, K. Contribution of Dissolved Organic Matter to Carbon Storage in Forest Mineral Soils. J. Plant Nutr. Soil Sci. 2008, 171, 52–60. [Google Scholar] [CrossRef]
- Fujii, K.; Funakawa, S.; Hayakawa, C.; Kosaki, T. Contribution of Different Proton Sources to Pedogenetic Soil Acidification in Forested Ecosystems in Japan. Geoderma 2008, 144, 478–490. [Google Scholar] [CrossRef]
- Driscoll, C.T.; Fuller, R.D.; Simone, D.M. Longitudinal Variations in Trace Metal Concentrations in a Northern Forested Ecosystem. J. Environ. Qual. 1988, 17, 101–107. [Google Scholar] [CrossRef]
- Garmo, Ø.A.; Skjelkvåle, B.L.; de Wit, H.A.; Colombo, L.; Curtis, C.; Fölster, J.; Hoffmann, A.; Hruška, J.; Høgåsen, T.; Jeffries, D.S.; et al. Trends in Surface Water Chemistry in Acidified Areas in Europe and North America from 1990 to 2008. Water Air Soil Pollut. 2014, 225, 1880. [Google Scholar] [CrossRef] [Green Version]
- Monteith, D.T.; Stoddard, J.L.; Evans, C.D.; de Wit, H.A.; Forsius, M.; Høgåsen, T.; Wilander, A.; Skjelkvåle, B.L.; Jeffries, D.S.; Vuorenmaa, J.; et al. Dissolved Organic Carbon Trends Resulting from Changes in Atmospheric Deposition Chemistry. Nature 2007, 450, 537–540. [Google Scholar] [CrossRef]
- Garmo, Ø.A.; Kaste, Ø.; Arle, J.; Austnes, K.; de Wit, H.; Fölster, J.; Houle, D.; Hruška, J.; Indriksone, I.; Monteith, D.; et al. Trends and Patterns in Surface Water Chemistry in Europe and North America between 1990 and 2016, with Particular Focus on Changes in Land Use as a Confounding Factor for Recovery. Available online: https://hdl.handle.net/11250/2649682 (accessed on 25 January 2022).
- Singer, P.C.; Iii, J.J.B.; Palen, G.M.; Scrivner, A.E. Trihalomethane Formation in North Carolina Drinking Waters. J. AWWA 1981, 73, 392–401. [Google Scholar] [CrossRef]
- Willey, J.D.; Kieber, R.J.; Eyman, M.S.; Avery, G.B. Rainwater Dissolved Organic Carbon: Concentrations and Global Flux. Glob. Biogeochem. Cycles 2000, 14, 139–148. [Google Scholar] [CrossRef]
- Liu, C.P.; Sheu, B.H. Dissolved Organic Carbon in Precipitation, Throughfall, Stemfow, Soil Solution, and Stream Water at the Guandaushi Subtropical Forest in Taiwan. For. Ecol. Manag. 2003, 172, 315–325. [Google Scholar] [CrossRef]
- Thieme, L.; Graeber, D.; Hofmann, D.; Bischoff, S.; Schwarz, M.T.; Steffen, B.; Meyer, U.-N.; Kaupenjohann, M.; Wilcke, W.; Michalzik, B.; et al. Dissolved Organic Matter Characteristics of Deciduous and Coniferous Forests with Variable Management: Different at the Source, Aligned in the Soil. Biogeosciences 2019, 16, 1411–1432. [Google Scholar] [CrossRef] [Green Version]
- Stubbins, A.; Silva, L.M.; Dittmar, T.; Van Stan, J.T. Molecular and Optical Properties of Tree-Derived Dissolved Organic Matter in Throughfall and Stemflow from Live Oaks and Eastern Red Cedar. Front. Earth Sci. 2017, 5, 22. [Google Scholar] [CrossRef] [Green Version]
- Michalzik, B.; Matzner, E. Dynamics of Dissolved Organic Nitrogen and Carbon in a Central European Norway Spruce Ecosystem. Eur. J. Soil Sci. 1999, 50, 579–590. [Google Scholar] [CrossRef]
- McDowell, W.H.; Likens, G.E. Origin, Composition, and Flux of Dissolved Organic Carbon in the Hubbard Brook Valley. Ecol. Monogr. 1988, 58, 177–195. [Google Scholar] [CrossRef]
- Kaiser, K.; Kalbitz, K. Cycling Downwards – Dissolved Organic Matter in Soils. Soil Biol. Biochem. 2012, 52, 29–32. [Google Scholar] [CrossRef]
- Inamdar, S.; Finger, N.; Singh, S.; Mitchell, M.; Levia, D.; Bais, H.; Scott, D.; McHale, P. Dissolved Organic Matter (DOM) Concentration and Quality in a Forested Mid-Atlantic Watershed, USA. Biogeochemistry 2012, 108, 55–76. [Google Scholar] [CrossRef]
- Neu, V.; Ward, N.D.; Krusche, A.V.; Neill, C. Dissolved Organic and Inorganic Carbon Flow Paths in an Amazonian Transitional Forest. Front. Mar. Sci. 2016, 3, 114. [Google Scholar] [CrossRef] [Green Version]
- Kawasaki, M.; Ohte, N.; Nambu, K.; Hobara, S.; Okazaki, R.; Katsuyama, M.; Kim, S. The dynamics of DOC in the hydrological process in a forested watershed. Jpn. J. Limnol. 2002, 63, 31–45, (In Japanese with English Summary). [Google Scholar] [CrossRef]
- American Water Works Association. 5910 UV-absorbing organic constituents. In Standard Methods for the Examination of Water and Wastewater, 23rd ed.; Rice, E.W., Baird, R.B., Eaton, A.D., Eds.; American Public Health Association, American Water Works Association, Water Environment Federation: Washington, DC, USA, 2017; pp. 71–74. [Google Scholar]
- Dobbs, R.A.; Wise, R.H.; Dean, R.B. The Use of Ultra-Violet Absorbance for Monitoring the Total Organic Carbon Content of Water and Wastewater. Water Res. 1972, 6, 1173–1180. [Google Scholar] [CrossRef]
- Jaffrain, J.; Gérard, F.; Meyer, M.; Ranger, J. Assessing the Quality of Dissolved Organic Matter in Forest Soils Using Ultraviolet Absorption Spectrophotometry. Soil Sci. Soc. Am. J. 2007, 71, 1851–1858. [Google Scholar] [CrossRef]
- Maie, N. Monitoring of the Quality of Dissolved Organic Matter in Aquatic Ecosystems by Using the Optical Properties; The Japanese Society of Irrigation, Drainage and Rural Engineering: Tokyo, Japan, 2009; pp. 52–53. (In Japanese) [Google Scholar]
- Edwards, A.C.; Cresser, M.S. Relationships between Ultraviolet Absorbance and Total Organic Carbon in Two Upland Catchments. Water Res. 1987, 21, 49–56. [Google Scholar] [CrossRef]
- Foster, P.; Morris, A.W. The Use of Ultra-Violet Absorption Measurements for the Estimation of Organic Pollution in Inshore Sea Waters. Water Res. 1971, 5, 19–27. [Google Scholar] [CrossRef]
- Ogura, N.; Hanya, T. Ultraviolet Absorbance as an Index of the Pollution of Seawater. Water Pollut. Control Fed. 1968, 40, 464–467. [Google Scholar]
- Kaneko, S.; Inagaki, M.; Morishita, T. The rapid determination of nitrate concentration in potassium chloride extracts. Jpn. J. Soil Sci. Plant Nutr. 2009, 80, 392–395. (In Japanese) [Google Scholar]
- Ogura, N.; Hanya, T. Nature of Ultra-Violet Absorption of Sea Water. Nature 1966, 212, 758. [Google Scholar] [CrossRef]
- Weishaar, J.L.; Aiken, G.R.; Bergamaschi, B.A.; Fram, M.S.; Fujii, R.; Mopper, K. Evaluation of Specific Ultraviolet Absorbance as an Indicator of the Chemical Composition and Reactivity of Dissolved Organic Carbon. Environ. Sci. Technol. 2003, 37, 4702–4708. [Google Scholar] [CrossRef]
- Chin, Y.-P.; Aiken, G.; O’Loughlin, E. Molecular Weight, Polydispersity, and Spectroscopic Properties of Aquatic Humic Substances. Environ. Sci. Technol. 1994, 28, 1853–1858. [Google Scholar] [CrossRef]
- Kalbitz, K.; Schmerwitz, J.; Schwesig, D.; Matzner, E. Biodegradation of Soil-Derived Dissolved Organic Matter as Related to Its Properties. Geoderma 2003, 113, 273–291. [Google Scholar] [CrossRef]
- Leinemann, T.; Mikutta, R.; Kalbitz, K.; Schaarschmidt, F.; Guggenberger, G. Small Scale Variability of Vertical Water and Dissolved Organic Matter Fluxes in Sandy Cambisol Subsoils as Revealed by Segmented Suction Plates. Biogeochemistry 2016, 131, 1–15. [Google Scholar] [CrossRef]
- Inagaki, M.; Sakai, M.; Ohnuki, Y. The Effects of Organic Carbon on Acid Rain in a Temperate Forest in Japan. Water Air Soil Pollut. 1995, 85, 2345–2350. [Google Scholar] [CrossRef]
- Oyanagi, N.; Urakawa, R.; Haibara, K.; Toda, H. The dynamics of dissolved organic nitrogen and dissolved organic carbon in a small watershed of established Japanese cedar (Cryptomeria japonica) and cypress (Chamaecyparis obtusa) plantation. J. For. Environ. 2002, 44, 11–20, (In Japanese with English Summary). [Google Scholar]
- Goto, Y.; Tamai, K.; Miyama, T.; Kominami, Y. Stand structure and dynamics during a 5-year period in a broad-leaved secondary forest in southern Kyoto prefecture, central Japan. Jpn. J. Ecol. 2004, 54, 71–84. (In Japanese) [Google Scholar]
- Yamashita, N. Utilization of hardwood and rehabilitation of hardwood forests in sub-urban and mountainous forest. In How to Use Harwood to Rehailitate Hardwood Forests; Kansai Research Center, Forestry and Forest Products Research Institute: Kyoto, Japan, 2018; pp. 5–8. (In Japanese) [Google Scholar]
- Kaneko, S. A rapid determining the organic carbon concentration in the stem flow of Cryptomeria japonica. J. Jpn. For. Soc. 1995, 77, 179–180. (In Japanese) [Google Scholar]
- Cory, R.M.; Green, S.A.; Pregitzer, K.S. Dissolved Organic Matter concentration and composition in the forests and streams of Olympic National Park, WA. Biogeochemistry 2004, 67, 269–288. [Google Scholar] [CrossRef]
- Vogt, R.D.; Akkanen, J.; Andersen, D.O.; Brüggemann, R.; Chatterjee, B.; Gjessing, E.; Kukkonen, J.V.K.; Larsen, H.E.; Luster, J.; Paul, A.; et al. Key Site Variables Governing the Functional Characteristics of Dissolved Natural Organic Matter (DNOM) in Nordic Forested Catchments. Aquat. Sci. 2004, 66, 195–210. [Google Scholar] [CrossRef]
- Chiba, T. The Study of Bare Lands; Societe Publications: Tokyo, Japan, 1991; 349p. (In Japanese) [Google Scholar]
- Kamibayashi, Y. Johannis de Rijke; Soushisya: Tokyo, Japan, 1999; 350p. (In Japanese) [Google Scholar]
- Kaneko, S.; Akieda, N.; Naito, F.; Tamai, K.; Hirano, Y. Nitrogen Budget of a Rehabilitated Forest on a Degraded Granitic Hill. J. For. Res. 2007, 12, 38–44. [Google Scholar] [CrossRef]
- Goto, Y.; Kominami, Y.; Miyama, T.; Tamai, K.; Kanazawa, Y. Aboveground Biomass and Net Primary Production of a Broad-Leaved Secondary Forest in the Southern Part of Kyoto Prefecture, Central Japan. Bull. FFPRI 2003, 2, 115–147, (In Japanese with English Summary). [Google Scholar]
- Geological Survey of Japan, AIST (Ed.) Seamless digital geological map of Japan 1: 200,000 V2. 6 April 2020 Version. Geological Survey of Japan, National Institute of Advanced Industrial Science and Technology. 2020. Available online: https://gbank.gsj.jp/seamless/ (accessed on 25 January 2022).
- Kaneko, S.; Fujisaki, T.; Kanazawa, Y. Carbon and nitrogen amount of the annual litterfall in a secondary broad-leaved forest in southern part of Kyoto prefecture. Jpn. For. Soc. 2006, 57, 171–174. (In Japanese) [Google Scholar]
- IUSS Working Group WRB. World Reference Base for Soil Resources 2014, Update 2015: International Soil Classification System for Naming Soils and Creating Legends for Soil Maps; World Soil Resources Reports No. 106; FAO: Rome, Italy, 2015; Available online: https://www.fao.org/3/i3794en/I3794en.pdf (accessed on 25 January 2022).
- Japan Meteorological Agency. Past Weather Data/Download. 2021. Available online: https://www.jma.go.jp/jma/indexe.html (accessed on 20 November 2021).
- Spyres, G.; Nimmo, M.; Worsfold, P.J.; Achterberg, E.P.; Miller, A.E.J. Determination of dissolved organic carbon in seawater using high temperature catalytic oxidation techniques. TrAC Trends Anal. Chem. 2000, 19, 498–506. [Google Scholar] [CrossRef]
- Tsuzuki, T.; Uchino, E. Total nitrogen. In Analysis of Water, 4th ed.; Hokkaido Branch of the Japan Society for Analytical Chemistry, Ed.; Kagakudojin: Kyoto, Japan, 1996; pp. 266–269. (In Japanese) [Google Scholar]
- Kawamura, S.; Goto, K. Silicic acid. In Analysis of Water, 4th ed.; Hokkaido Branch of the Japan Society for Analytical Chemistry, Ed.; Kagakudojin: Kyoto, Japan, 1996; pp. 181–184. (In Japanese) [Google Scholar]
- Masago, H. UV/Vis spectroscopy. J. Color Sci. Assoc. Jpn. 2005, 78, 531–538. (In Japanese) [Google Scholar]
- Tamai, K.; Hattori, S. Modelling of Evaporation from a Forest Floor in a Deciduous Broad-Leaved Forest and Its Application to a Basin. J. Jpn. For. Soc. 1994, 76, 233–241, (In Japanese with English Summary). [Google Scholar]
- Kansai Research Center. Monitoring in a sugi forest in Kansai Region. In The Annual Report of Monitoring to Assess the Impact of Acid Deposition on Forest Ecosystems (FY 1995 and FY 1996); Forestry and Forest Products Research Institute: Tsukuba, Japan, 1998; pp. 62–73. (In Japanese) [Google Scholar]
- Kansai Research Center. Monitoring in a sugi forest in Kansai Region. In The Annual Report of Monitoring to Assess the Impact of Acid Deposition on Forest Ecosystems (FY 1997); Forestry and Forest Products Research Institute: Tsukuba, Japan, 1998; pp. 47–53. (In Japanese) [Google Scholar]
- Kansai Research Center. Monitoring in a sugi forest in Kansai Region. In The Annual Report of Monitoring to Assess the Impact of Acid Deposition on Forest Ecosystems (FY 1998); Forestry and Forest Products Research Institute: Tsukuba, Japan, 1998; pp. 41–48. (In Japanese) [Google Scholar]
- Fujii, K.; Uemura, M.; Hayakawa, C.; Funakawa, S.; Sukartiningsih; Kosaki, T.; Ohta, S. Fluxes of Dissolved Organic Carbon in Two Tropical Forest Ecosystems of East Kalimantan, Indonesia. Geoderma 2009, 152, 127–136. [Google Scholar] [CrossRef]
- Michalzik, B.; Kalbitz, K.; Matzner, E. Fluxes and Concentrations of Dissolved Organic Carbon and Nitrogen—A Synthesis for Temperate Forests. 34. Biogeochemistry 2001, 52, 173–205. [Google Scholar] [CrossRef]
- Likens, G.E.; Edgerton, E.S.; Galloway, J.N. The Composition and Deposition of Organic Carbon in Precipitation. Tellus B Chem. Phys. Meteorol. 1983, 35, 16–24. [Google Scholar] [CrossRef]
- Levia, D.F.; Van Stan, J.T., II; Inamdar, S.P.; Jarvis, M.T.; Mitchell, M.J.; Mage, S.M.; Scheick, C.E.; Mchale, P.J. Stemflow and Dissolved Organic Carbon Cycling: Temporal Variability in Concentration, Flux, and UV-Vis Spectral Metrics in a Temperate Broadleaved Deciduous Forest in the Eastern United States. Can. J. For. Res. 2012, 42, 207–216. [Google Scholar] [CrossRef]
- Kawasaki, M.; Ohte, N.; Katsuyama, M. Biogeochemical and Hydrological Controls on Carbon Export from a Forested Catchment in Central Japan. Ecol. Res. 2005, 20, 347–358. [Google Scholar] [CrossRef]
- Asakawa, D.; Mochizuki, H.; Yanagi, Y.; Suzuki, T.; Nagao, S.; Fujitake, N. Changes in Elemental Composition, Molecular Weight and 1H NMR Spectra of the Water-Extractable Hydrophobic Acid Fraction in Cambisol with Season and Soil Depth. Soil Sci. Plant Nutr. 2006, 52, 361–370. [Google Scholar] [CrossRef]
- Imaya, A.; Inagaki, Y.; Tanaka, N.; Ohta, S. Free Oxides and Short-Range Ordered Mineral Properties of Brown Forest Soils Developed from Different Parent Materials in the Submontane Zone of the Kanto and Chubu Districts, Japan. Soil Sci. Plant Nutr. 2007, 53, 621–633. [Google Scholar] [CrossRef]
- Guggenberger, G.; Kaiser, K. Dissolved Organic Matter in Soil: Challenging the Paradigm of Sorptive Preservation. Geoderma 2003, 113, 293–310. [Google Scholar] [CrossRef]
- Mulholland, P.J.; Hill, W.R. Seasonal Patterns in Streamwater Nutrient and Dissolved Organic Carbon Concentrations: Separating Catchment Flow Path and in-Stream Effects. Water Resour. Res. 1997, 33, 1297–1306. [Google Scholar] [CrossRef]
- Sakamoto, T.; Yoshitake, S. Ecological approach to the periphyton communities in small stream of mountainous forest. Kanagawa Prefecture. Bull. Kanagawa Prefect. Nat. Environ. Conserv. Cent. 2013, 10, 145–162. (In Japanese) [Google Scholar]
- Kaneko, S.; Miyama, T. The organic matters export from a forested small catchment in the watershed of Lake Biwa. In Proceedings of the 9th International Conference on the Conservation and Management of Lakes, Sligo, Ireland, 5–7 July 2001; pp. 38–40. [Google Scholar]
Figure 1.
Locations of sampling sites in Yamashiro Experimental Forest (YMS). Rv, Rr, Rd: bulk rain in a closed valley, on a ridge, and at a southwest point of the watershed, respectively; TF, SF: throughfall and stemflow, respectively; O layer: O layer leachate; SW: soil-percolating waters at depth of 10 cm, 30 cm, and 70 cm (So10, So30, and So70); SPa, SPb: seepage water at each point; STa, STb, STc: stream water at each point; STw: stream water at a closed point of the weir. The square area with dotted line indicates sampling points of TF, SF, and SW.

Figure 2.
Monthly mean air temperature and monthly total precipitation from January 2002 to December 2004 at Kyotanabe automated weather station. The data used in this paper were from July 2002 to March 2004.
Figure 2.
Monthly mean air temperature and monthly total precipitation from January 2002 to December 2004 at Kyotanabe automated weather station. The data used in this paper were from July 2002 to March 2004.

Figure 3.
Design of lysimeter for collecting soil-percolating water.

Figure 4.
Average of DOC concentration among all sample types at the YMS from July 2002 to March 2004. The number of measured samples is the same as that shown in Table S3. See Figure 1 for the meaning of the abbreviations.

Figure 5.
Annual DOC flux among all sample types at the YMS. See Figure 1 for the meaning of the abbreviations.
Figure 5.
Annual DOC flux among all sample types at the YMS. See Figure 1 for the meaning of the abbreviations.

Figure 6.
Relationships between DOC concentration and UV.254 for all sample types. See Figure 1 for the meaning of the abbreviations.
Figure 6.
Relationships between DOC concentration and UV.254 for all sample types. See Figure 1 for the meaning of the abbreviations.

Figure 7.
Comparison of SUVA254 among sample types in the watershed. See Figure 1 for the meaning of the abbreviations.
Figure 7.
Comparison of SUVA254 among sample types in the watershed. See Figure 1 for the meaning of the abbreviations.

Figure 8.
Seasonal variation of DOC concentrations for each sample type. See Figure 1 for the meaning of the abbreviations.
Figure 8.
Seasonal variation of DOC concentrations for each sample type. See Figure 1 for the meaning of the abbreviations.


Figure 9.
Seasonal variation of SUVA254 for each sample type. See Figure 1 for the meaning of the abbreviations.
Figure 9.
Seasonal variation of SUVA254 for each sample type. See Figure 1 for the meaning of the abbreviations.


Table 1.
Correlations between DOC concentration and other constituents of water samples in the YMS.
| Sample Type | UV254 | SUVA254 | DON | Temp. | EC | H+ | Ca2+ | Mg2+ | K+ | NO3− | SO42− | HCO3− |
|---|---|---|---|---|---|---|---|---|---|---|---|---|
| Rv | 0.807 a | −0.255 | 0.251 | ND | 0.496 a | −0.052 | 0.650 a | 0.755 a | 0.766 a | 0.385 | 0.524 a | ND |
| Rr | 0.758 a | −0.219 | 0.539 a | ND | 0.784 a | 0.501 a | 0.692 a | 0.729 a | 0.786 a | 0.786 a | 0.746 a | ND |
| Rd | 0.823 a | −0.157 | 0.533 a | ND | 0.372 | −0.041 | 0.359 | 0.478 a | 0.854 a | 0.296 | 0.308 | ND |
| TF | 0.947 a | −0.444 a | 0.750 a | ND | 0.727 a | −0.264 | 0.349 | 0.652 a | 0.899 a | −0.050 | 0.207 | ND |
| SF | 0.960 a | −0.252 | 0.837 a | ND | 0.504 a | 0.429 a | 0.568 a | 0.495 a | 0.663 a | 0.423 a | 0.441 a | ND |
| O leachate | 0.948 a | −0.191 | 0.769 a | ND | 0.746 a | −0.107 | 0.855 a | 0.863 a | 0.610 a | 0.714 a | 0.464 a | ND |
| So10 | 0.757 a | −0.398 | 0.569 a | ND | −0.350 | −0.275 | −0.408 | −0.332 | 0.205 | −0.644 a | 0.144 | ND |
| So30 | 0.859 a | −0.400 | 0.015 | ND | 0.079 | −0.287 | −0.026 | 0.580 | 0.719 a | −0.008 | 0.265 | ND |
| So70 | 0.967 a | −0.007 | 0.417 | ND | 0.232 | 0.673 a | 0.570 a | 0.451 | 0.481 a | 0.075 | −0.239 | ND |
| SPa | 0.641 a | −0.478 a | ND | 0.442 a | 0.115 | −0.099 | −0.223 | −0.109 | 0.350 | −0.085 | 0.359 | 0.448 a |
| SPb | 0.833 a | −0.547 a | ND | 0.409 a | −0.675 a | −0.082 | 0.035 | −0.113 | 0.382 a | −0.696 a | −0.380 | −0.217 |
| STa | 0.923 a | 0.070 | ND | 0.598 a | 0.050 | −0.461 a | 0.454 a | 0.381 a | 0.640 a | −0.789 a | −0.269 | 0.749 a |
| STb | 0.697 a | −0.405 a | ND | 0.465 a | −0.178 | −0.564 a | 0.295 | 0.123 | 0.615 a | −0.558 a | 0.258 | 0.522 a |
| STc | 0.788 a | −0.264 | ND | 0.520 a | −0.298 | −0.348 a | 0.246 | 0.244 | 0.551 a | −0.419 a | −0.561 a | 0.455 a |
| STw | 0.880 a | −0.176 | 0.575 | 0.648 a | −0.097 | −0.403 a | 0.648 a | 0.517 a | 0.459 a | −0.584 a | −0.613 a | 0.671 a |
a p <0.01, ND, not determined. See Figure 1 for the meaning of the abbreviations. The unit of data used for the analysis is the same as that shown in the Table S3 and S4
Table 2.
Annual rainfall amount and weight-average DOC concentration of the rain, throughfall, and stemflow in a 35-year-old sugi forest (35023 N, 1354859 N) in Kyoto Prefecture, Japan.
Table 2.
Annual rainfall amount and weight-average DOC concentration of the rain, throughfall, and stemflow in a 35-year-old sugi forest (35023 N, 1354859 N) in Kyoto Prefecture, Japan.
| Year | 1995 | 1996 | 1997 | 1998 |
|---|---|---|---|---|
| Rainfall (mm) | 1529.7 | 1600.1 | 1582.6 | 1995 |
| DOC in rain (mg L−1) | 1.08 | 0.98 | 1.52 | 1.65 |
| DOC in TF (mg L−1) | 5.85 | 4.66 | 5.87 | 4.7 |
| DOC in SF (mg L−1) | 25.66 | 35.9 | 27.19 | ND |
ND, not determined.
Publisher’s Note: MDPI stays neutral with regard to jurisdictional claims in published maps and institutional affiliations. |
© 2022 by the authors. Licensee MDPI, Basel, Switzerland. This article is an open access article distributed under the terms and conditions of the Creative Commons Attribution (CC BY) license (https://creativecommons.org/licenses/by/4.0/).
Share and Cite
MDPI and ACS Style
Kaneko, S.; Furusawa, H.; Okamoto, T.; Hirano, Y. Dissolved Organic Matter (DOM) in a Warm-Temperate Forested Watershed—A Possibility of Ultraviolet Absorbance as an Indicator of DOM. Forests 2022, 13, 510. https://doi.org/10.3390/f13040510
AMA Style
Kaneko S, Furusawa H, Okamoto T, Hirano Y. Dissolved Organic Matter (DOM) in a Warm-Temperate Forested Watershed—A Possibility of Ultraviolet Absorbance as an Indicator of DOM. Forests. 2022; 13(4):510. https://doi.org/10.3390/f13040510
Chicago/Turabian StyleKaneko, Shinji, Hitomi Furusawa, Toru Okamoto, and Yasuhiro Hirano. 2022. "Dissolved Organic Matter (DOM) in a Warm-Temperate Forested Watershed—A Possibility of Ultraviolet Absorbance as an Indicator of DOM" Forests 13, no. 4: 510. https://doi.org/10.3390/f13040510
Note that from the first issue of 2016, this journal uses article numbers instead of page numbers. See further details here.