Application of the InVEST Model to Quantify the Water Yield of North Korean Forests

1
Department of Environmental Landscape Architecture & Institute of Environmental Science, Wonkwang University, Iksan 54538, Korea
2
Department of Forest & Landscape Architecture, Graduate School, Wonkwang University, Iksan 54538, Korea
*
Author to whom correspondence should be addressed.
Forests 2020, 11(8), 804; https://doi.org/10.3390/f11080804
Submission received: 24 June 2020
/
Revised: 16 July 2020
/
Accepted: 18 July 2020
/
Published: 25 July 2020
(This article belongs to the Special Issue Water Resources Management and Modeling in Forestry)
Abstract
:The calculation and mapping of water yield are of significant importance to the effective planning and management of water resources in North Korea. In this study, we quantified and assessed the water retention capacity of North Korean forests using the Integrated Valuation of Ecosystem Services and Tradeoffs (InVEST) water yield model; six thematic maps were constructed and two coefficients were derived for use in the modeling. Data were obtained from the following sources: average annual precipitation from WorldClim; average monthly evapotranspiration from Global Potential Evapotranspiration (Global-PET); and the soil depth data from the International Soil Reference and Information Centre (ISRIC). The plant available water fraction was calculated using a bulk density formula. Land cover was classified using the Normalized Difference Snow, Water and Vegetation Indices, using Moderate Resolution Imaging Spectroradiometer (MODIS) satellite imagery. Data for the watershed analysis were provided by the World Wildlife Fund. The total water retention in North Korean forests was estimated to be 760,145,120 tons in the 2000s. However, previous studies from 2011 showed a much higher (by 9,409,622,083 tons) water retention capacity in South Korea. In North Korea, the largest monthly water storage volume occurred in July, followed by August, September, and June. This mirrors rainfall patterns, indicating that precipitation has a significant impact on water storage. Analysis of the annual spatial distribution of water storage by administrative district showed that Hamgyongnam-do had the highest, followed by Jagang-do and Gangwon-do Provinces.
1. Introduction
Forests play a globally vital role in controlling floods, drought, and soil erosion; for this reason, forest ecosystems are sometimes termed green dams or reservoirs [1,2]. Their importance in this context was demonstrated by the effects on forest cover of the North Korean famine of 1994 to 1998, known as the Arduous March. This period was characterized by energy shortages, forcing much of the population to utilize wood from forests for fuel, while desperate efforts to ensure food production led to the unsustainable clearance of sloping forested land for cultivation. This was further compounded by forest fires. As a result, North Korea is estimated to have lost 32 percent (284 million ha) of its forest cover between 1990 and 2010. Already highly vulnerable to natural disasters, the depletion of North Korea’s forests has now exacerbated soil erosion and impaired water retention in the country [3]. It is therefore vital to assess the current water retention capacity of North Korean forest ecosystems; our study set out to establish this using the year 2000 as a baseline. In order to do this, we mapped and evaluated ecosystem services and goods using Integrated Valuation of Ecosystem Services and Tradeoffs (InVEST), a suite of free and open source software models made available by the Natural Capital Project. In particular, we used the InVEST Reservoir Hydropower Production (Water Yield) Model, which is also known as the Water Yield model.
No research into the water yield capacity of North Korea has been previously undertaken, but studies do exist for South Korea and its vicinity. Cho et al. [4] and Song et al. [5] used geographical information system (GIS) data to estimate the annual quantity of surface water in South Korean forests and Kim et al. [6] presented the effects of afforestation on water supply with a spatio-temporal simulation of forest water yield from 1971–2010 using the InVEST water yield model. In China, a water yield analysis was performed in the watersheds of the Upper Ganga Basin, Liaohe River Basin, and in the vicinity of the Xitiaoxi River to compare field measurements of natural runoff with InVEST estimates [7,8,9]. With a seasonality factor of 6.5, the estimated and actual runoff values were close, particularly in the Xitiaoxi River Basin. Yang and others [10] estimated water retention associated with land use changes in the data-scarce region of Northwest China. Yin et al. [11] estimated the temporal variations and associated factors in water yield ecosystem services in North China, and the results showed that the InVEST model performed well in water yield estimation (R2 = 0.93). Furthermore, in China InVEST modeling has been used in the design of China’s national ecosystem assessment (CEA) tool to address, at both a national and regional scale, changes in ecosystem services [12]. Scordo et al. grouped 749 watersheds from across North America into five bioclimatic regions using nine environmental variables to compare the predicted flow patterns to actual flow conditions using the InVEST model [13]. In the UK, Redhead et al. [14] validated a hydrological ecosystem service model using widely available global and national-scale datasets; their results suggested that relatively simple models, such as InVEST, can yield accurate ecosystem service measurements.
The calculation and mapping of water yield are of major importance in the planning and management of water resources in North Korea. In our study, we aimed to quantify and assess water retention in North Korean forests using the water yield model from the InVEST suite of models. In order to do this, we used remote sensing and GIS techniques to obtain and construct related global and regional datasets of the inaccessible areas of North Korea.
2. Materials and Methods
2.1. Materials and Tools
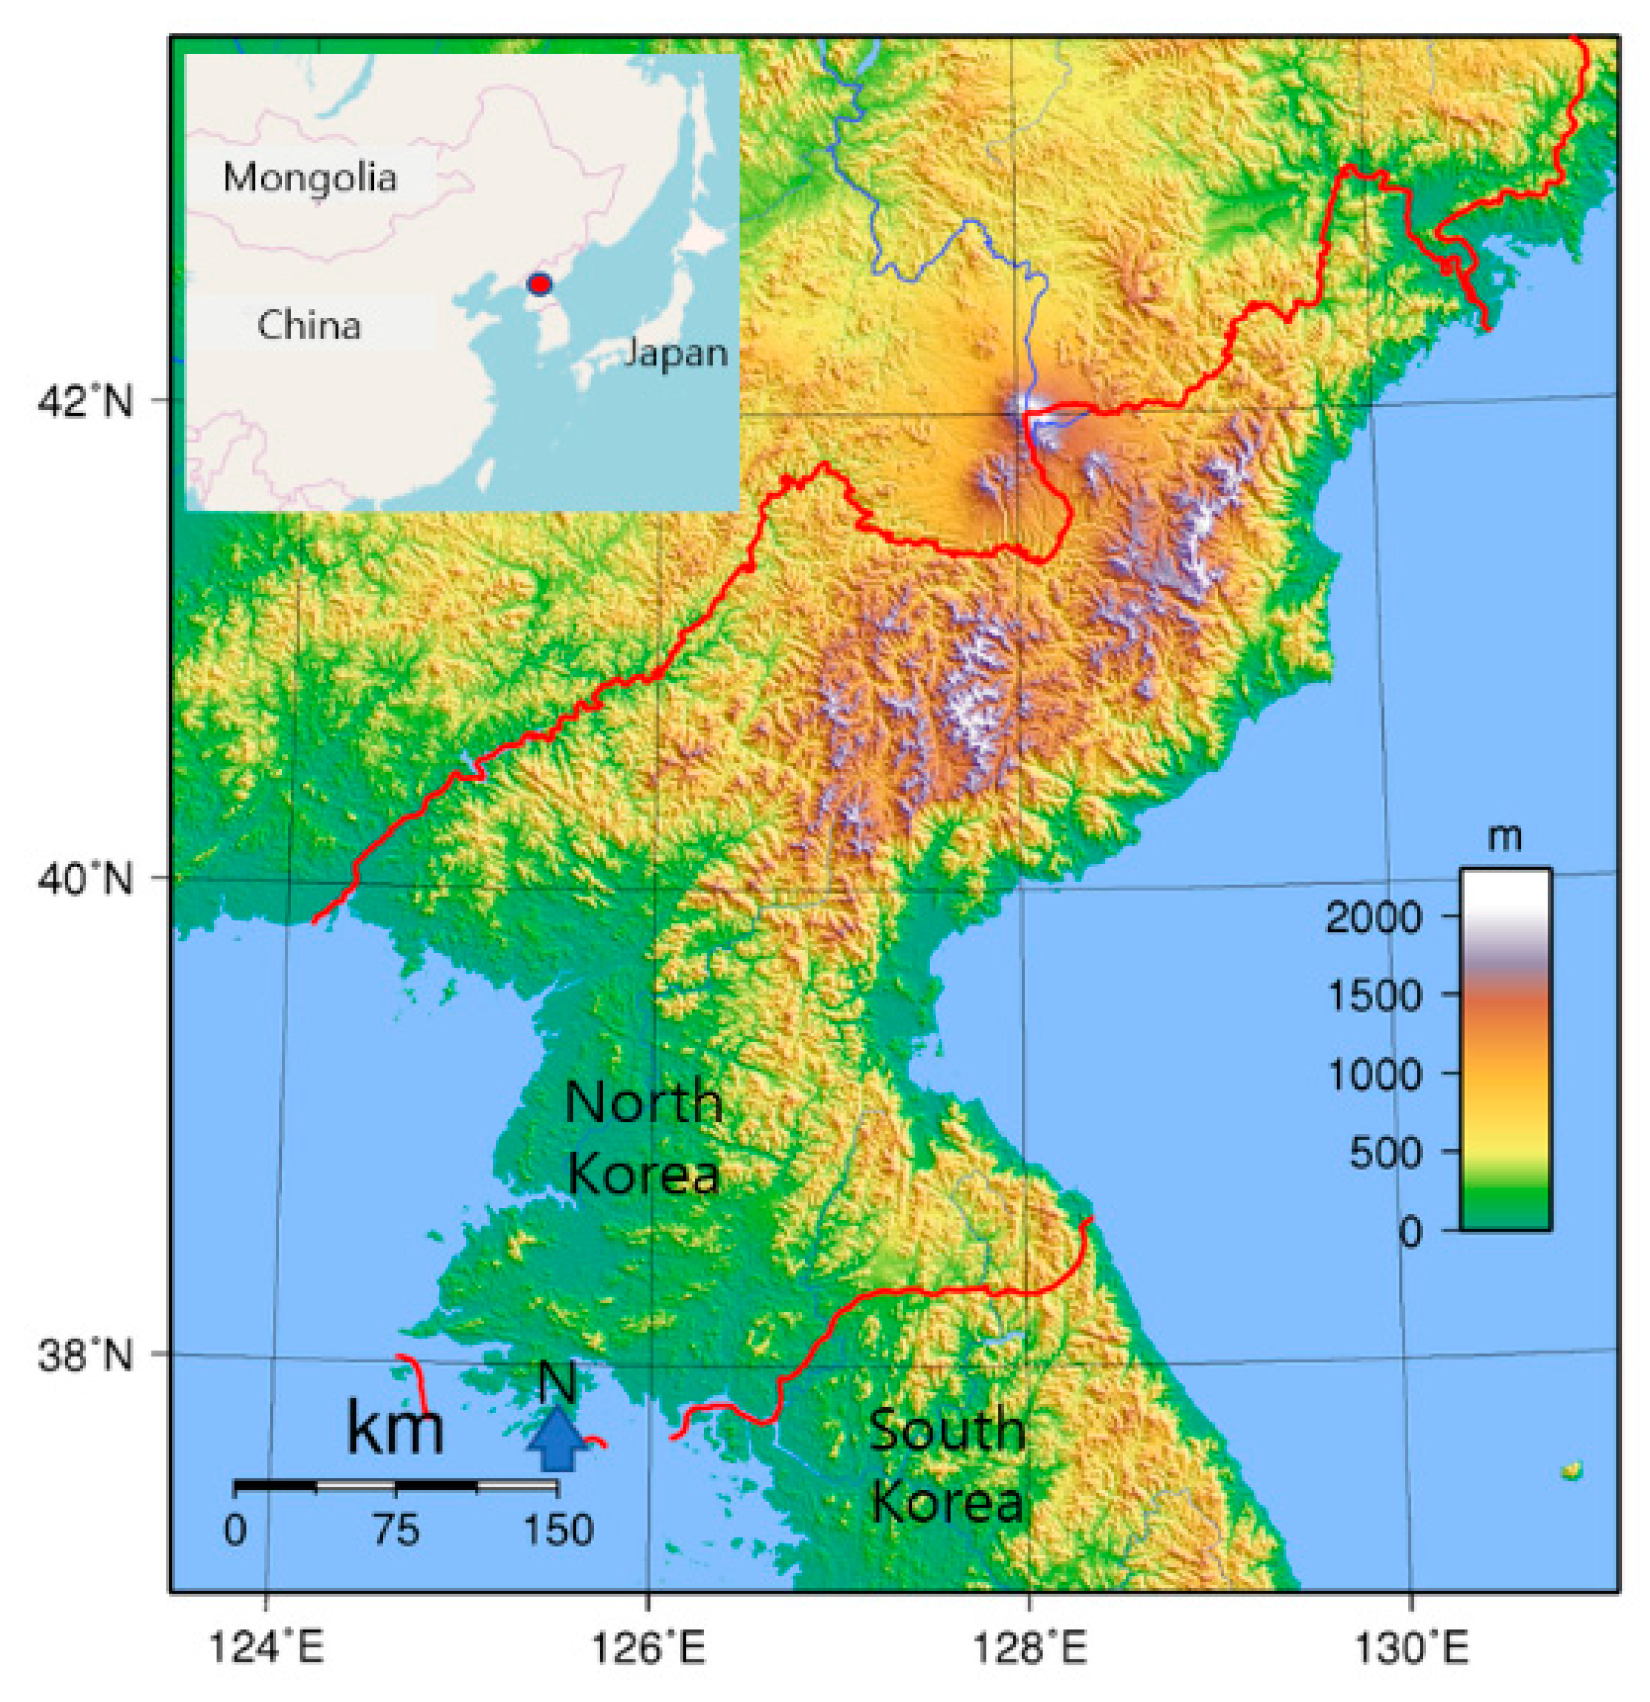
The study was conducted in North Korea, located at latitude 40°20′32.86″ N and longitude 127°25′51.62″ E. The terrain consists mostly of hills and mountains separated by deep, narrow valleys. The coastal plains are wide in the west and discontinuous in the east. Some 80 percent of North Korea’s land area is composed of mountains and uplands, and all of the peninsula’s mountains with elevations of 2000 m (6600 ft) or more are located in North Korea. The great majority of the population lives in the plains and lowlands (Figure 1) [15].
Our study focused on the stocked forest land of North Korea. Moderate Resolution Imaging Spectroradiometer (MODIS) multi-temporal image data were used to classify land cover. InVEST (version 3.8.0) [16] was adopted to quantify water retention. InVEST is a tool designed to map and value ecosystem services and goods and explore how changes in ecosystems may lead to changes in the flow of benefits to people. We used the InVEST water yield model, which estimates annual averages in water quantities within a watershed. ENVI image analysis software (version 5.3) (L3 Harris Geospatial Solutions) was employed for land-cover classification using the MODIS imagery. QGIS (version 3.10.3) was used for spatial analysis of precipitation, watershed analysis, and other data. Limitations in geographical accessibility mean that data from North Korea vary in terms of spatial and temporal resolution. We therefore standardized data by setting spatial information to a MODIS imagery resolution of 250 m, and temporal data were set to the 2000s, although source information ranged from 1990 to 2013.
2.2. Model Input Parameters
2.2.1. Average Annual Precipitation
In order to determine the best source for comparing global precipitation data applicable to North Korea, we considered the following: WorldClim, [17] the Tropical Rainfall Measuring Mission (TRMM; National Aeronautics and Space Administration (NASA) and Japan Aerospace Exploration Agency (JAXA)), the Global Precipitation Climatology Centre (GPCC; National Center for Atmospheric Research (NCAR)), and the Climatic Research Unit (CRU; University of East Anglia). Finally, the WorldClim database, which provides global weather and climate data of a high spatial resolution, was selected; WorldClim version 2 data (1997 to 2000) were processed in order to acquire annual precipitation for North Korea (Figure 2).
2.2.2. Average Annual Reference Evapotranspiration
In order to determine the best source of global evapotranspiration data for North Korea, the Global Potential Evapotranspiration (Global-PET) [18] and MODIS Evapotranspiration databases were compared. Global-PET was finally selected as the source of average monthly evapotranspiration data (1950 to 2000) for processing (Figure 2).
2.2.3. Root Restricting Layer Depth
The depth to root restricting layer (Figure 2) is the depth at which the soils physical or chemical characteristics strongly inhibit root penetration; it can be obtained from some soil maps. Soil depth refers to the depth of the soil above the bedrock; domestic researchers in Korea [4] use the maximum value of root depth data as a substitute for soil depth. Global gridded soil information data provided by the International Soil Reference and Information Centre (ISRIC) were utilized and, of the available variables, data from the depth to bedrock (R Horizon) layer (up to 200 cm) were used for the analysis of North Korean forests.
2.2.4. Plant Available Water Content (PAWC)
The fraction of plant available water content can be obtained from some standard soil maps. The soil map for North Korea is in paper format and was not therefore suitable for the analysis, due to uncertainties over recording timings and definitions in the legend. Instead, an ISRIC dataset ‘Soil grids 250 m: bulk density (fine earth) kg/cubic-meter at 60 cm’ was utilized to evaluate PAWC (Figure 1). Bulk density refers to the ratio of soil solid drying weight to a given soil volume or the drying weight per unit volume of soil. Soil volume refers not only to the solid phase volume but also the volume of the entire sample, including the air gap. Porosity was calculated using the following bulk density formula:
where P is porosity, Db is soil bulk density, and Dp is soil particle density.
P = (1 − Db/Dp) × 100 = [1 − bulk density/particle density (net density)] × 100
2.2.5. Land Use and Land Cover (LULC)
Most existing studies [19,20,21] that have constructed land-cover maps for North Korean forests have used the multi-temporal Normalized Difference Vegetation Index (NDVI) instead of other indices. MODIS satellite images incorporate 36 discrete spectral bands and can be used to analyze vegetation indices other than NDVI. The Normalized Difference Snow and Water Indices (NDSI and NDWI, respectively) were used in our study together with NDVI, collectively termed NDXI [19].
The incorporation of NDSI and NDWI improves sensitivity as both indices use short-wave infrared bands (SWIRs). These provide a finer resolution than the red and near-infrared (NIR) bands used in NDVI to investigate physiological information, such as plant water content and the leaf area index (LAI) [22,23]. In addition, paddy fields have different reflective characteristics depending on the cultivation stage (e.g., seeding, rice planting, weeding, and harvesting), so the greater sensitivity of NDWI and NDSI to physiological information makes them more effective in distinguishing these characteristics [24] (Table 1).
MODIS provides the latest data (2017) among the various databases used; however, the latest precipitation (WorldClim) and evapotranspiration (Global-PET) data available for North Korea are from 2013. Therefore, in order to minimize errors caused by timing incompatibility, MODIS data for 2013 were acquired, processed, and analyzed. Apart from Pyongyang and its vicinity, no large-scale developments have been carried out in North Korea since 2013; nonetheless, the temporal resolution of the data was adjusted as accurately as possible. Most vegetation has a unique phenology, and imaging analysis should take this into careful consideration [22]. Therefore, the MODIS daily satellite images (MOD13Q1) from March 2013 to October 2013 were acquired through the USGS (United States Geological Survey) EarthExplorer website [25] to classify land cover, including North Korean forest areas, reflecting the phenological characteristics [26].
The ISODATA unsupervised classification method was used for land-cover mapping, because it utilizes a more effective algorithm for classifying large areas. It therefore requires less intervention by analysts, making it useful in the context of the inaccessibility of wide areas of North Korea [27]. In particular, the ISODATA classification algorithms have a high classification accuracy when used for NDXI [28]. The iteration was set up to run 30 times; it was firstly separated into 30 classes. Secondly, using high-resolution Google images, C3I digital maps, and ground truth data derived from near the border with China, the final eight classes were established: built-up areas, rice paddies, fields, terraced fields, forest, unstocked forest, plateau vegetation, and water bodies. Terrace fields, unstocked forest, and plateau vegetation are characteristic of land cover in North Korea.
Overall accuracy was calculated using a confusion matrix to evaluate classification accuracy [29], and the Kappa coefficient (Kc) was calculated as 0.808 at 83.87% overall acuity. The forest, rice paddies, and field classes had the highest classification accuracy when compared with the other land cover classes, because their classification utilized various vegetation indices.
2.2.6. Watershed
Uncertainties in basin calculations for the Pyongyang plains and their vicinity, together with variations in the size and number of small watersheds depending on the size of the segmentation, raised potential issues in constructing a watershed map using the North Korean Digital Elevation Model. This was dealt with by constructing a total of 60 watershed polygons for North Korea, utilizing HydroSHEDS data [30,31] provided by the World Wildlife Fund (WWF). In addition, a zonal statistics technique was used to accurately separate the North Korean portions of watersheds that straddle the border between North Korea and China.
2.2.7. Biophysical Parameters
2.2.8. Z Parameter
The seasonal factor (Z parameter) was determined according to a scale of coefficients from 1 to 10, in which 1 represented a seasonal wind monsoon, 4 represented a tropical climate, and 9 represented a temperate climate. In particular, rainfall is more concentrated in summer or winter depending on how close the Z parameter is to 1 or 10, respectively [32]. The Korean Peninsula has a monsoon climate, with rainfall concentrated in summer. Therefore, taking into account the results of a forest yield analysis conducted in the South Korean region [4], a value of 1 was selected for the Z parameter.
3. Results
3.1. Annual Water Yield in the North Korean Forest
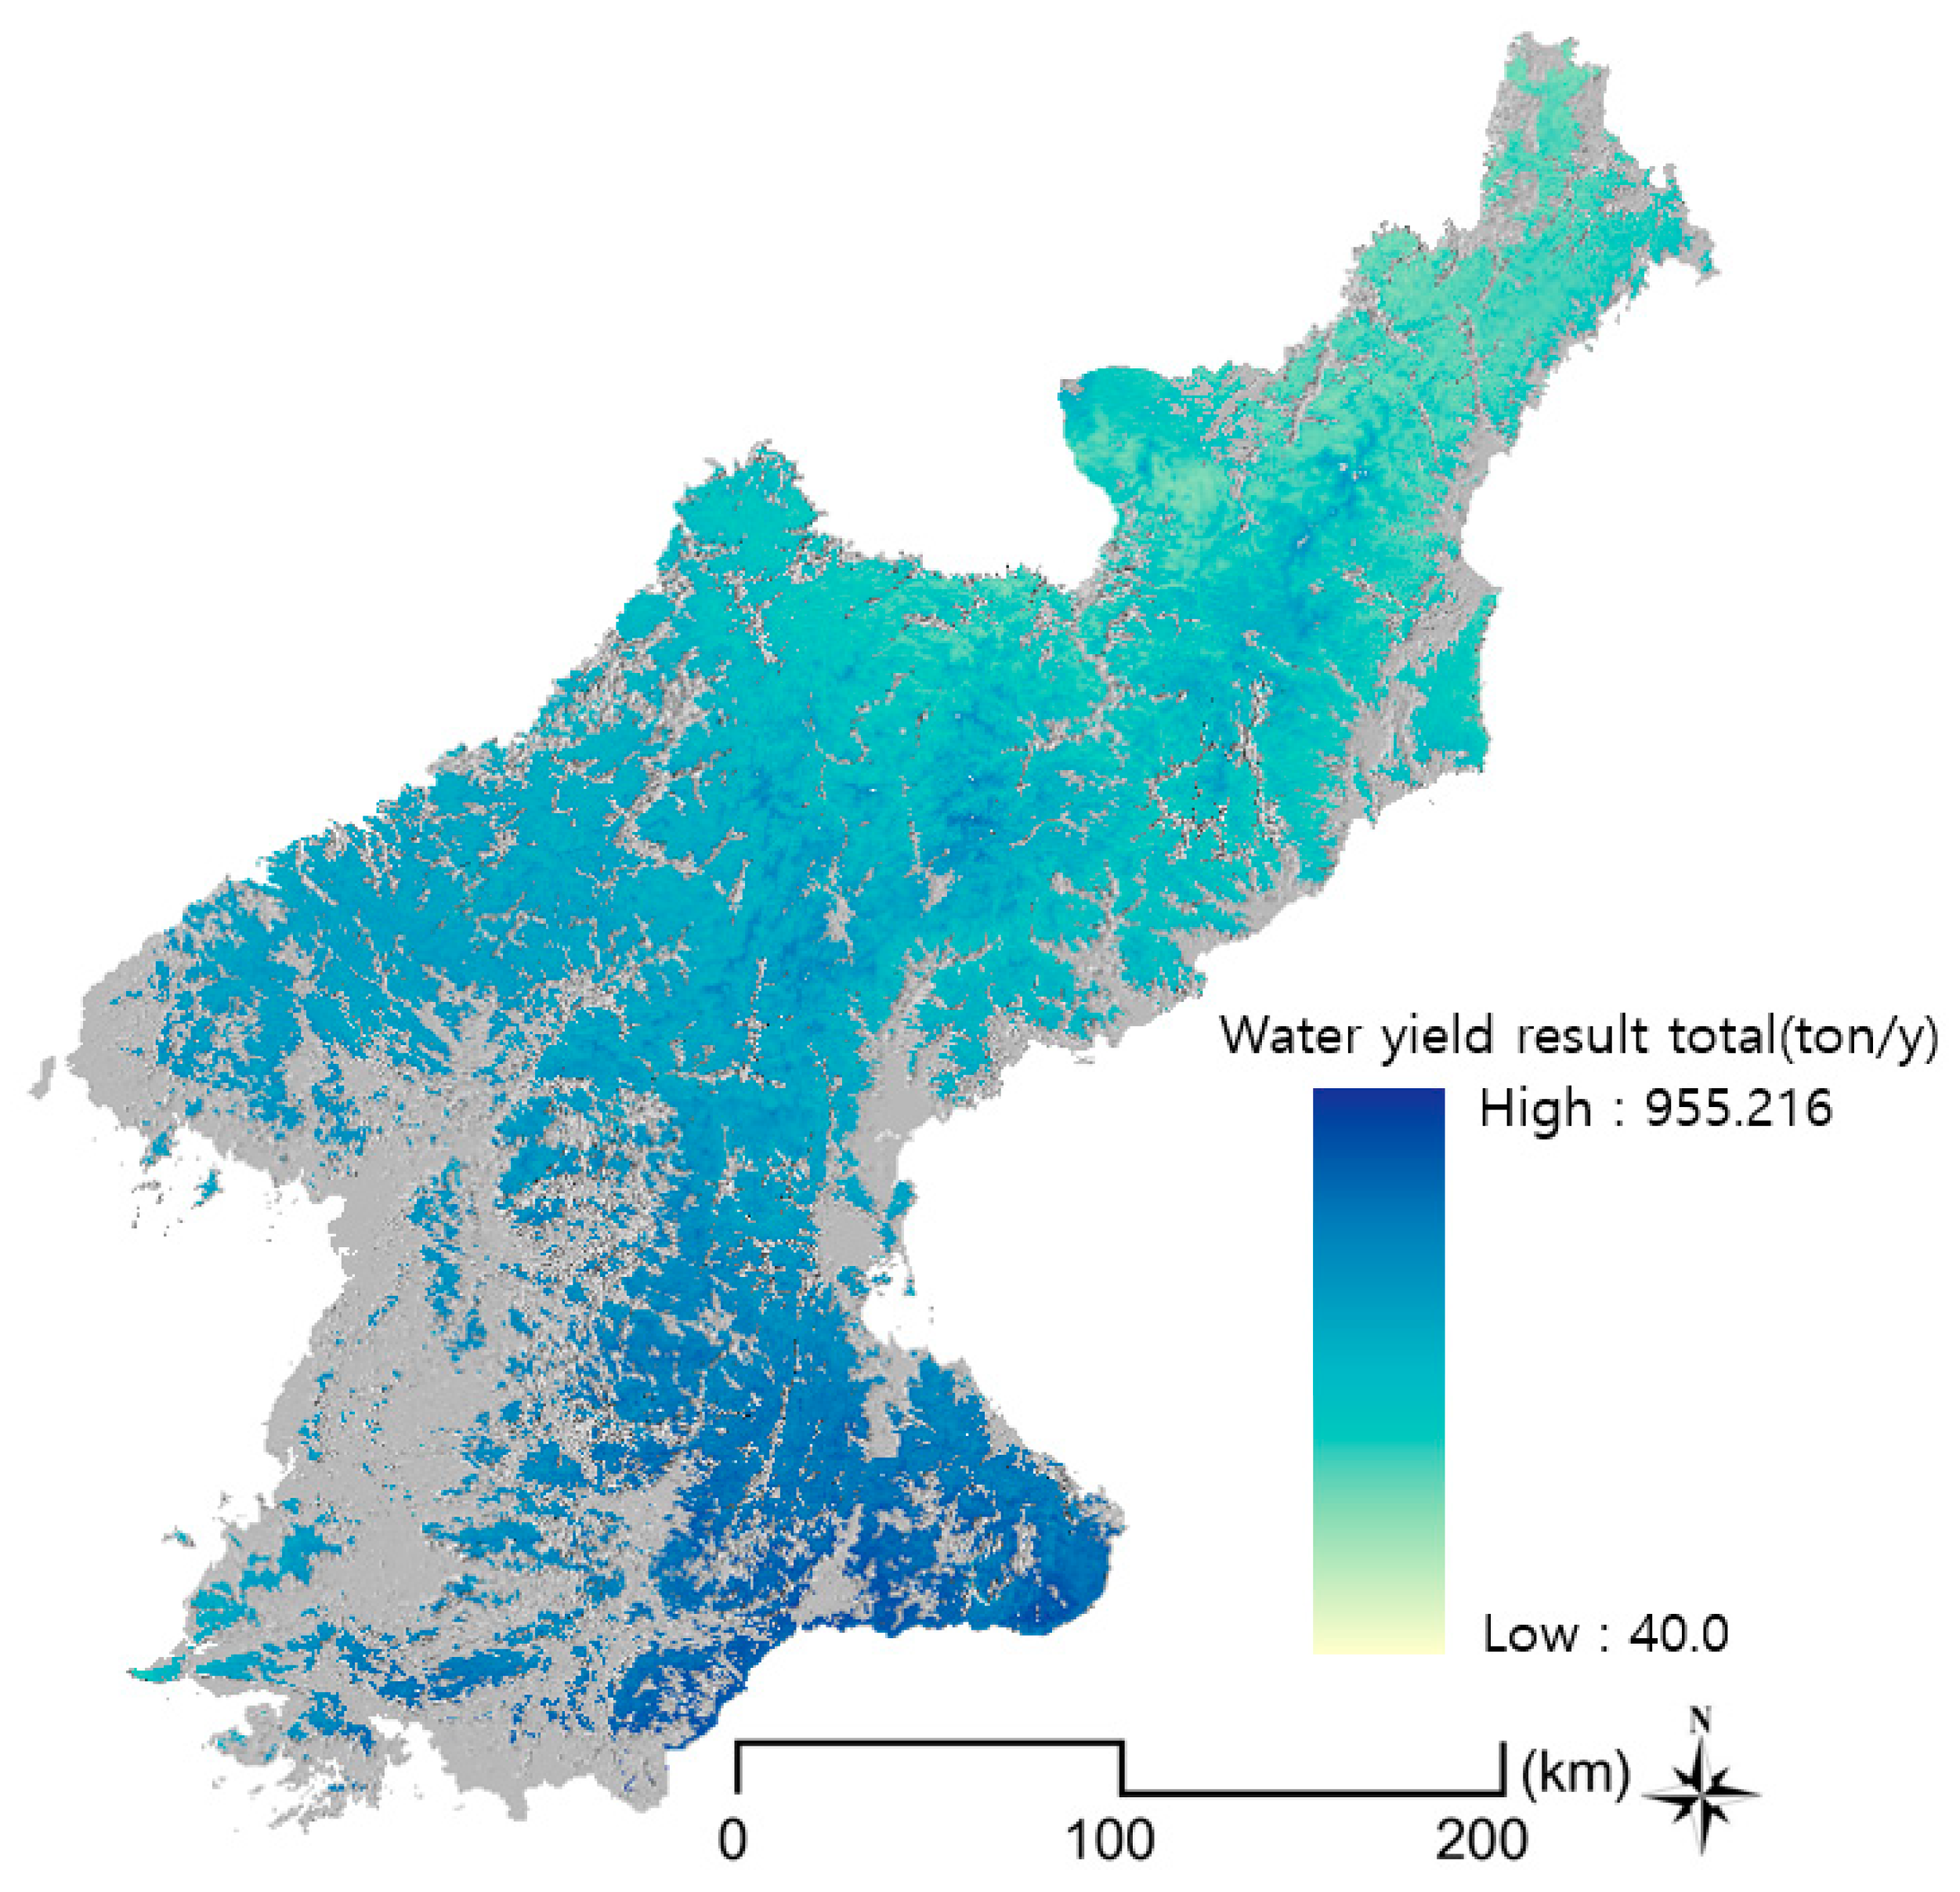
Using the InVEST water yield model, the total water retention in North Korean forests was determined to be 760,145,120 tons during the 2000s. Considering the distribution of water yield across North Korea, the area with the highest water content is Geumgangsan National Park, which is centered around Goseong-gun and Geumgang-gun in Gangwon-do. Water yield is high along the Nanglim Mountains, which include Gangwon-do and Hamgyongnam-do to the north, Nanglimsan Mountain, the Myohyangsan mountain range, and Gaema Plateau.
The Yanggang and Hamgyongbuk-do regions, which are close to Nanglimsan Mountain and located at the center of the Hamgyong Mountain Range, are over 1000 m above sea level, and have high water retention values. The northernmost areas of North Korea (Rajin, Seonbong, and Onseong-gun) have relatively low values. Water yield is high in the western regions of North Korea, mainly in the Jeokyoryong and Gangnam Mountains (Figure 3).
3.2. Monthly and Regional Water Yield
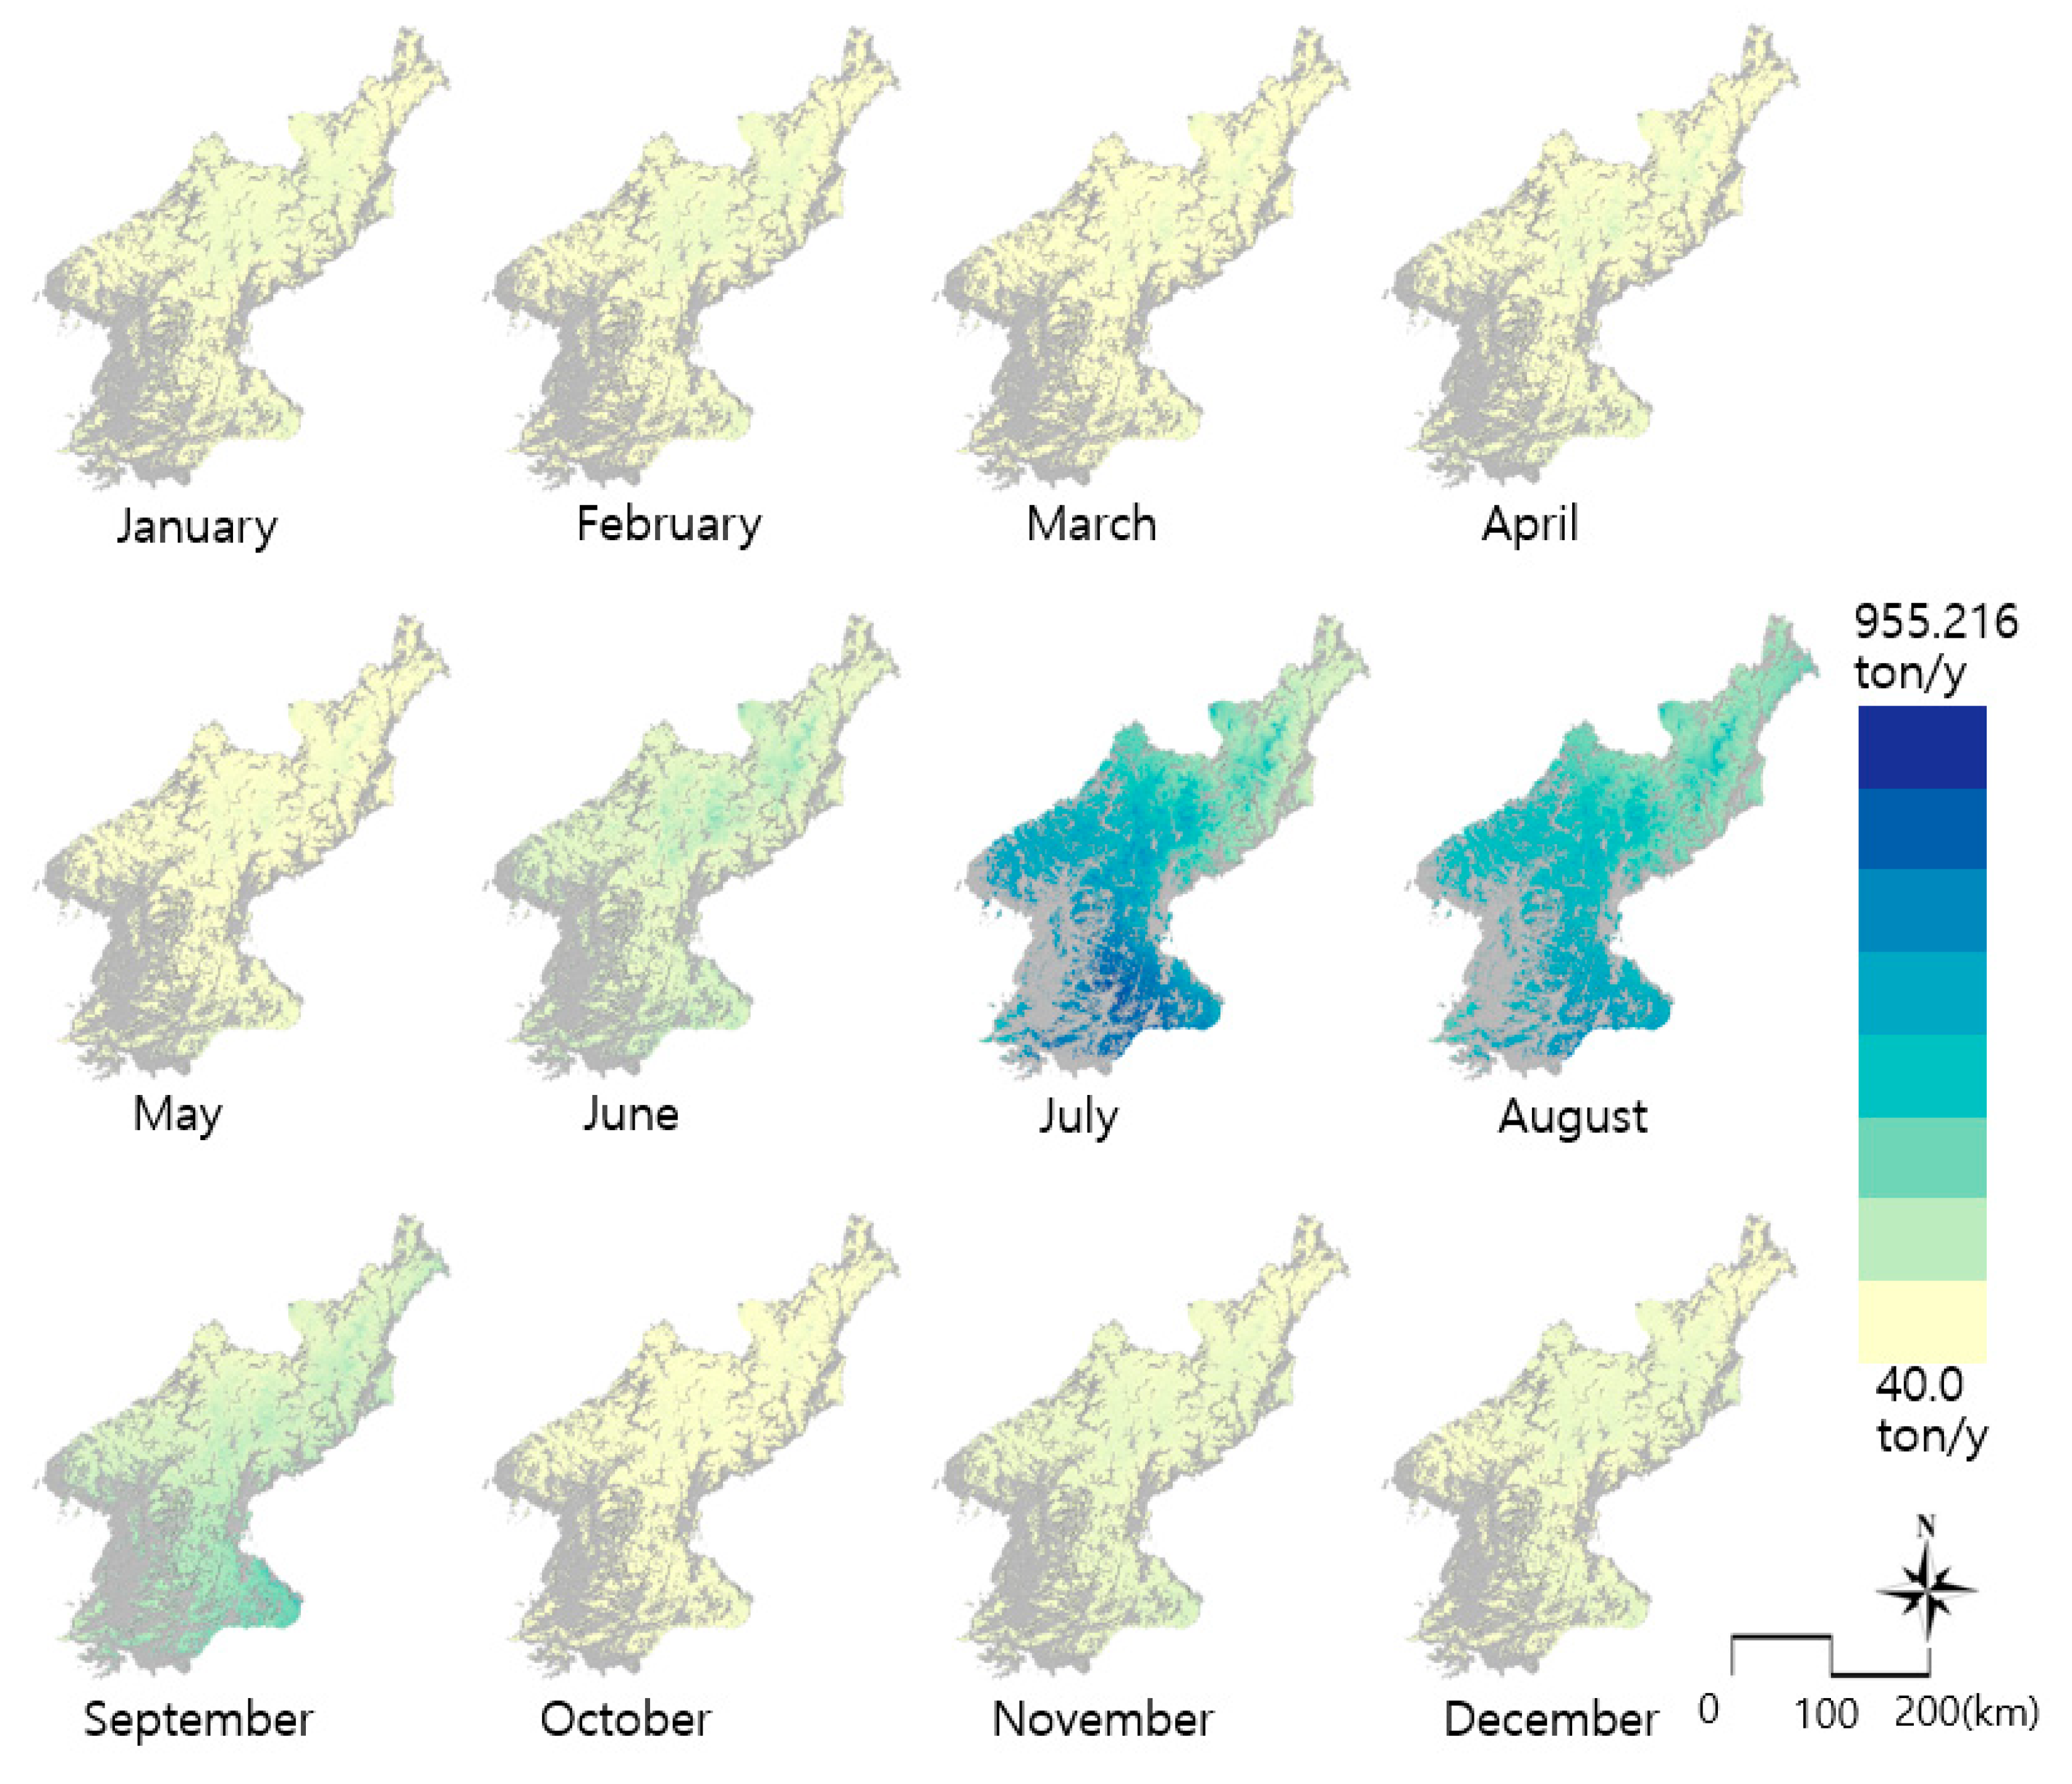
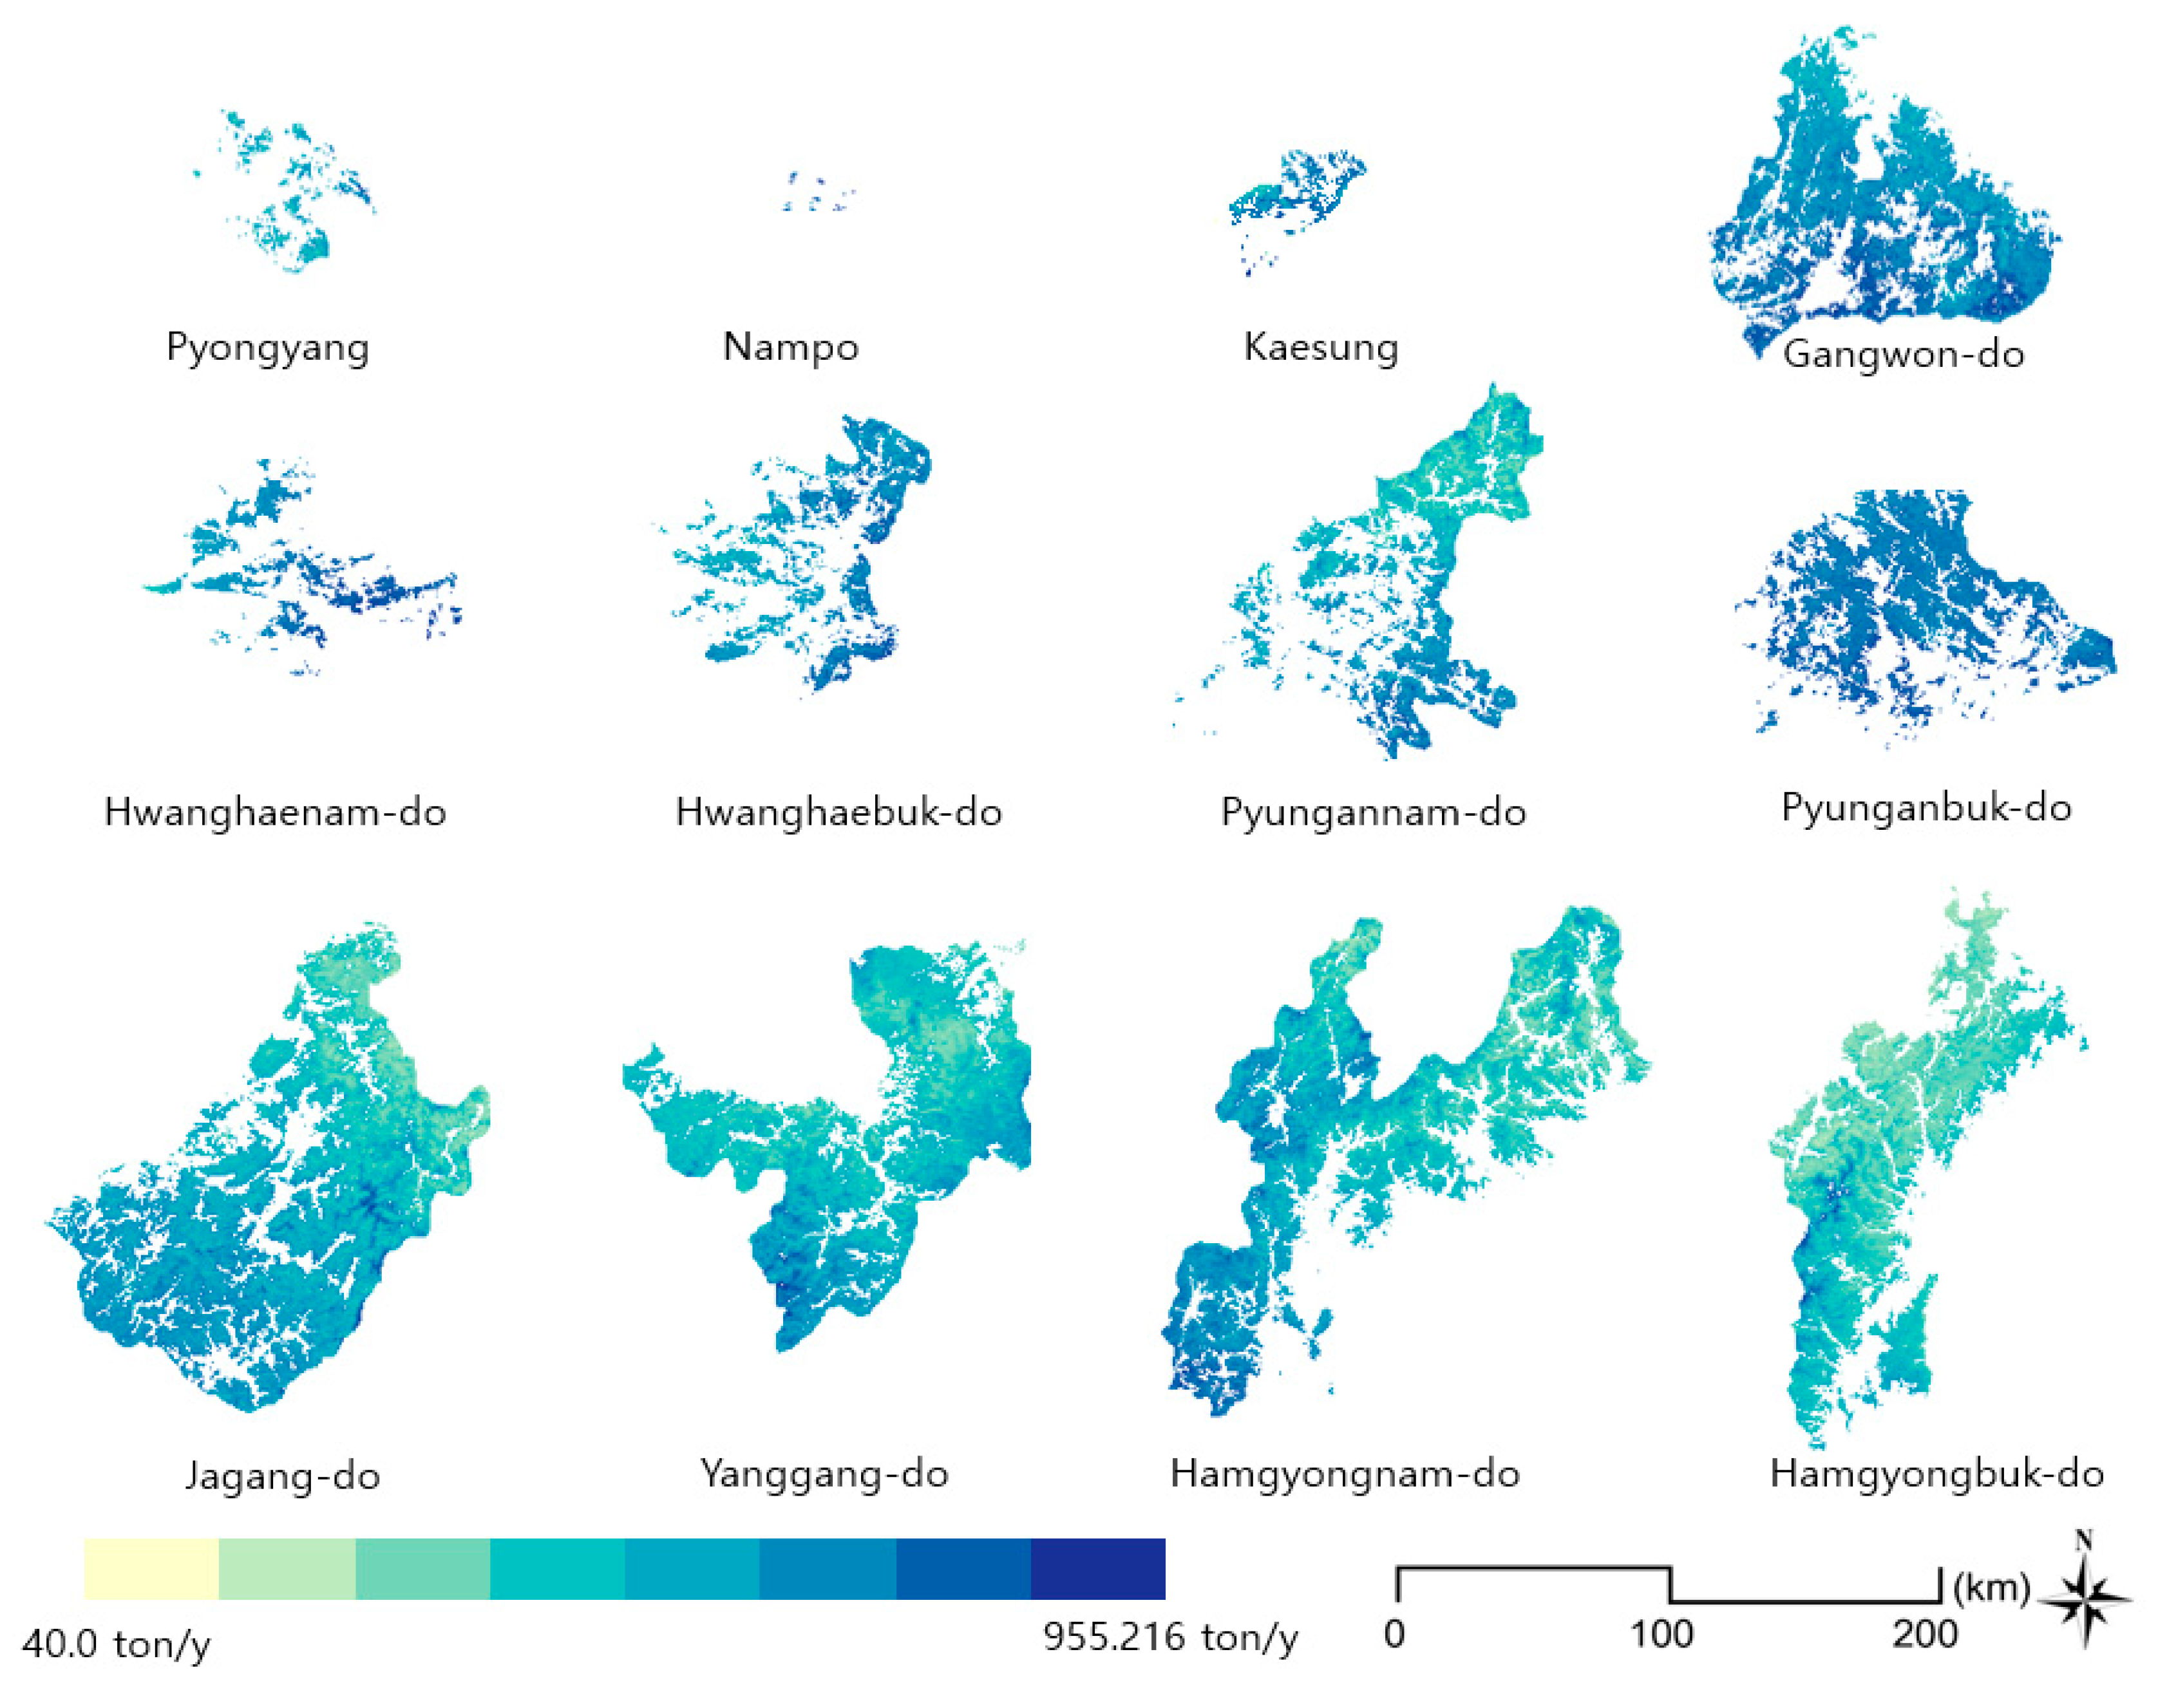
The largest monthly water storage volume in North Korea occurs in July, followed by August, September, and June (Figure 4). This closely follows the rainfall patterns, indicating a significant contribution from precipitation. Table 3 and Figure 5 show the annual water storage quantities and spatial distribution, respectively, by administrative region; Hamgyeongnam-do Province had the highest annual storage volume, followed by Jagang-do and Gangwon-do Provinces. The annual water storage volume and number of pixels falling within mountain ranges were also found to be proportional to each other, indicating that the area covered by forests is proportional to water retention. It can be inferred that Nampo-city has the lowest water content, as most of its land cover comprises paddy fields and urban areas. In contrast, Gangwon Province showed a higher water storage compared with forested areas, a result that was proportional to the precipitation value for each region.
4. Discussion
The water yield of North Korean forests has, to date, not been analyzed using the InVEST model. However, InVEST water yield modeling in South Korea determined a forest ecosystem water yield for South Korea of 9,409,622,083 tons for 2011 [5] and 2,220,950,000 tons for 2000s [6] respectively. This represents a large difference from the result for North Korea (760,145,120 tons), and also the difference between two South Korean results due to the differences in the target year and parameter values for precipitation, evapotranspiration, total forested area, and seasonal factor (Z) which are used as representative indicators of forest water supplies in the InVEST water yield model. The studies across South Korea [6] and North China [11] showed that precipitation, evapotranspiration, and distribution of forest were the key driving factors of the mean water yield, and among them, precipitation was the most sensitive. According to data available from Trading Economics [33], South Korea has an average annual precipitation (1901–2015) of 109.08 mm, compared with 87.13 mm in North Korea for the same period. Precipitation in North Korea is therefore 79.8% of that for South Korea. The area covered by forest in North Korea is also smaller in extent, at 79.4% of the value for South Korea (49,040 km2 compared with 61,764 km2, respectively; data from 2016).
In addition, in a study of farmland across the Korean Peninsula, Lim et al. [34] found that precipitation in the southern region of the Peninsula was far higher than potential evapotranspiration (PET), but the two parameters were evenly balanced in the central areas. In contrast, PET exceeded precipitation in the North Korean region. In other words, it can be assumed that the lower precipitation and higher evapotranspiration of North Korea compared with South Korea, and deforestation in the former, has affected water yield in North Korea and its forests. With the Z parameter, the studies of South Korean forests [5,6] adopted differently, 1 and 16, respectively, and it also caused the difference in the water yield. Zhang et al. [9] simulated various Z parameter values and compared them to the actual measurements for estimating the water yield. In future studies, after conducting analyses of the entire Korean Peninsula with this input data and parameters, we can estimate a more accurate water yield for North Korean forests by comparing it with actual South Korean measurements.
5. Conclusions
The InVEST model is still under development. Not all of its various detailed models have been finalized, but are undergoing a process of gradual improvement. It also has limitations in its application to the inaccessible regions of North Korea. First, applicable thematic maps are hard to acquire, and alternative maps must be used. Second, there are differences between maps in terms of data acquisition timing, so it is impossible to determine isolate outcomes to a specific time. Third, there are variations in the spatial resolution of the acquired data, so all maps have to be reduced to the lowest spatial and spectral resolution level. Fourth, the application of global data to a specific site limits accuracy, therefore making it impossible to verify the analyzed results.
The analysis of North Korea’s water volume therefore has limitations that cannot guarantee its accuracy, especially given the inaccessibility of the region. However, positive outcomes were also achieved. First, it is possible to determine an approximate distribution of water content across North Korea, as well as relative differences in water retention by month and administrative district. Second, the results will be helpful in policy decisions, such as selecting suitable sites for future afforestation projects across both North and South Korea. Third, forest policy for North Korea, including afforestation, can be informed by quantitative data derived from analysis of time-series changes in the amount of water supplied to North Korean forests. Fourth, the results of spatial and temporal dimensions of water supply can be the basis to understand the water yield response to ongoing climate change in North Korea. Fifth, using NDXI is useful to enhance land-cover classification accuracy, and if ground truth data are available from the border area between China and North Korea it can be helpful to accurately classify North Korea’s land cover, particularly terraced fields and unstocked forest.
Author Contributions
S.-w.K. conceived the idea of the study, analyzed the data and wrote the manuscript; Y.-y.J. carried out data collection and software manipulation. All authors have read and agreed to the published version of the manuscript.
Funding
This study was supported by the 2020 research fund from Wonkwang University.
Conflicts of Interest
The authors declare no conflicts of interest.
References
- Chang, C.S.; Shin, Y.K. Payment for Environmental Services on Watershed Conservation Forest; KREI: Singapore, 2007. [Google Scholar]
- Lee, M.K. Opportunity Cost for Increasing Watershed Conservation Function of Forest—A Case Study of Sueo Dam Catchment Area in Mt. Baekun Jeollanamdo. Master’s Thesis, Seoul National University, Seoul, Korea, 2007. [Google Scholar]
- Rehabilitation North Korea’s Forests. 2019. Available online: https://www.newsecuritybeat.org/2019/10/rehabilitating-north-koreas-forests-struggle-balance-conservation-livelihoods/ (accessed on 28 November 2019).
- Cho, H.W.; Song, C.H.; Jeon, S.W.; Kim, J.S.; Lee, W.K. Evaluation of the spatial distribution of water yield service based on precipitation and population. J. Korean Assoc. Geogr. Inf. 2016, 19, 1–15. [Google Scholar] [CrossRef]
- Song, C.H.; Lee, W.K.; Choi, H.A.; Jeon, S.W.; Kim, J.U.; Kim, J.S.; Kim, J.T. Application of InVEST water yield model for assessing forest water provisioning ecosystem service. J. Korean Assoc. Geogr. Inf. Stud. 2015, 18, 120–134. [Google Scholar] [CrossRef]
- Kim, G.S.; Lim, C.H.; Kim, S.J.; Lee, J.Y.; Son, Y.W.; Lee, W.K. Effect of national-scale afforestation on forest water supply and soil loss in South Korea, 1971–2010. Sustainability 2017, 9, 1017. [Google Scholar] [CrossRef] [Green Version]
- Shukla, A.K.; Ojha, C.S.P.; Mijic, A.; Buytaert, W.; Pathak, S.; Garg, R.D.; Shukla, S. Population growth, land use and land cover transformations, and water quality nexus in the Upper Ganga River basin. Hydrol. Earth Syst. Sci. 2018, 22, 4745–4770. [Google Scholar] [CrossRef] [Green Version]
- Wu, K.; Gu, J.; Zhang, N. Evaluation on water source conservation capacity of West Liaohe River Basin based on InVEST model. In Proceedings of the 2019 International Conference on Smart Grid and Electrical Automation (ICSGEA), Xiangtan, China, 10–11 August 2019; pp. 443–447. [Google Scholar]
- Zhang, C.; Li, W.; Zhang, B.; Liu, M. Water yield of Xitiaoxi river basin based on InVEST modeling. J. Resour. Ecol. 2012, 3, 50–54. [Google Scholar]
- Yang, X.; Chen, R.; Meadows, M.; Ji, G.; Xu, J. Modelling water yield with the InVEST model in a data scarce region of northwest China. Water Supply 2020, in press. [Google Scholar] [CrossRef]
- Yin, G.; Wang, X.; Zhnag, X.; Fu, Y.; Hao, F.; Hu, Q. InVEST model-based estimation of water yield in North China and its sensitivities to climate variables. Water 2020, 12, 1692. [Google Scholar] [CrossRef]
- Ouyang, Z.; Zheng, H.; Xiao, Y.; Polasky, S.; Liu, J.; Xu, W.; Wang, Q.; Zhang, L.; Xiao, Y.; Rao, E.; et al. Improvements in ecosystem services from investments in natural capital. Science 2016, 352, 1455–1459. [Google Scholar] [CrossRef]
- Scordo, F.; Lavender, T.M.; Seitz, C.; Perillo, V.L.; Rusak, J.A.; Piccolo, M.C.; Perillo, G.M.E. Modeling water yield: Assessing the role of site and region-specific attributes in determining model performance of the InVEST seasonal water yield model. Water 2018, 10, 1496. [Google Scholar] [CrossRef] [Green Version]
- Redhead, J.W.; Stratford, C.; Sharps, K.; Jones, L.; Ziv, G.; Clarke, D.; Oliver, T.H.; Bullock, J.M. Empirical validation of the InVEST water yield ecosystem service model at a national scale. Sci. Total Environ. 2016, 569–570, 1418–1426. [Google Scholar] [CrossRef] [Green Version]
- Geography of North Korea. Available online: https://en.wikipedia.org/wiki/Geography_of_North_Korea (accessed on 12 July 2020).
- Natural Capital Project Website. Available online: https://naturalcapitalproject.stanford.edu/ (accessed on 5 May 2018).
- Worldclim Website. Available online: https://www.worldclim.org (accessed on 12 June 2018).
- Global Aridity and PET Database. Available online: https://cgiarcsi.community/data/global-aridity-and-pet-database/ (accessed on 3 August 2018).
- Kim, R.H.; Kim, H.W.; Lee, J.H.; Lee, S.H. Estimation of Land Cover and Vegetation Change in North Korea Using Satellite Data; KRIHS: Yeongi-gun, Korea, 2017; Volume 90, pp. 117–128. [Google Scholar]
- Cha, S.Y.; Seo, D.J.; Park, C.H. Monitoring vegetation phenology using MODIS in northern plateau region. Korean J. Remote Sens. 2009, 5, 399–409. [Google Scholar]
- Yeom, J.M.; Han, K.S.; Lee, C.S.; Park, Y.Y.; Kim, Y.S. A detection of vegetation variation over North Korea using SPOT/VEGETATION NDVI. J. Korean Assoc. Geogr. Inf. Stud. 2008, 11, 28–37. [Google Scholar]
- Ceccato, P.; Flasse, S.; Tarantola, S.; Jacquemoud, S.; Gregoire, J. Detecting vegetation leaf water content using reflectance in the optical domain. RSE 2001, 77, 22–33. [Google Scholar] [CrossRef]
- Tucker, C.J. Remote sensing of leaf water content in the near infrared. RSE 1980, 10, 23–32. [Google Scholar] [CrossRef]
- Jeong, S.G.; Park, J.H.; Park, C.H.; Lee, D.K. Terrace fields classification in North Korea using MODIS multi-temporal image data. J. Korean Environ. Res. Technol. 2016, 19, 73–83. [Google Scholar]
- USGS Earthexplorer Home. Available online: https://earthexplorer.usgs.gov (accessed on 25 June 2018).
- Jeong, S.G.; Park, C.H.; Kim, S.W. Land cover classification of the Korean Peninsula using linear spectral mixture analysis of MODIS multi-temporal data. Korean J. Remote Sens. 2006, 22, 553–563. [Google Scholar]
- Jensen, J.R. Introductory Digital Image Processing: A Remote Sensing Perspective; Pearson Prentice Hall: Upper Saddle River, NJ, USA, 2005. [Google Scholar]
- Pan, X.Z.; Uchida, S.; Liang, Y.; Hirano, A.; Sun, B. Discriminating different landuse types by using multitemporal NDXI in a rice planting area. Int. J. Remote Sens. 2010, 31, 585–596. [Google Scholar] [CrossRef]
- Congalton, R.G. A review of assessing the accuracy of classifications of remotely sensed data. RSE 1991, 37, 35–46. [Google Scholar] [CrossRef]
- Lehner, B.; Grill, G. Global river hydrography and network routing: Baseline data and new approaches to study the world’s large river systems. Hydrol. Process. 2013, 27, 2171–2186. [Google Scholar] [CrossRef]
- Lehner, B.; Verdin, K.; Jarvis, A. New global hydrography derived from spaceborne elevation data. Eos 2008, 89, 93–94. [Google Scholar] [CrossRef]
- Sharp, R.; Tallis, H.T.; Ricketts, T.; Guerry, A.D.; Wood, S.A.; Chaplin-Kramer, R.; Nelson, E.; Ennaanay, D.; Wolny, S.; Olwero, N.; et al. InVEST 3.6.0 User’s Guide. Available online: http://data.naturalcapitalproject.org/nightly-build/invest-users-guide/InVEST_3.6.0_Documentation.pdf (accessed on 24 June 2020).
- Trading Economics. Available online: https://tradingeconomics.com (accessed on 3 December 2019).
- Lim, C.H.; Kim, D.M.; Shin, Y.S.; Lee, W.K. Assessment of drought severity on cropland in Korea Peninsula using normalized precipitation evapotranspiration index (NPEI). JCCR 2015, 6, 223–231. [Google Scholar] [CrossRef]
Figure 1.
The study area.

Figure 2.
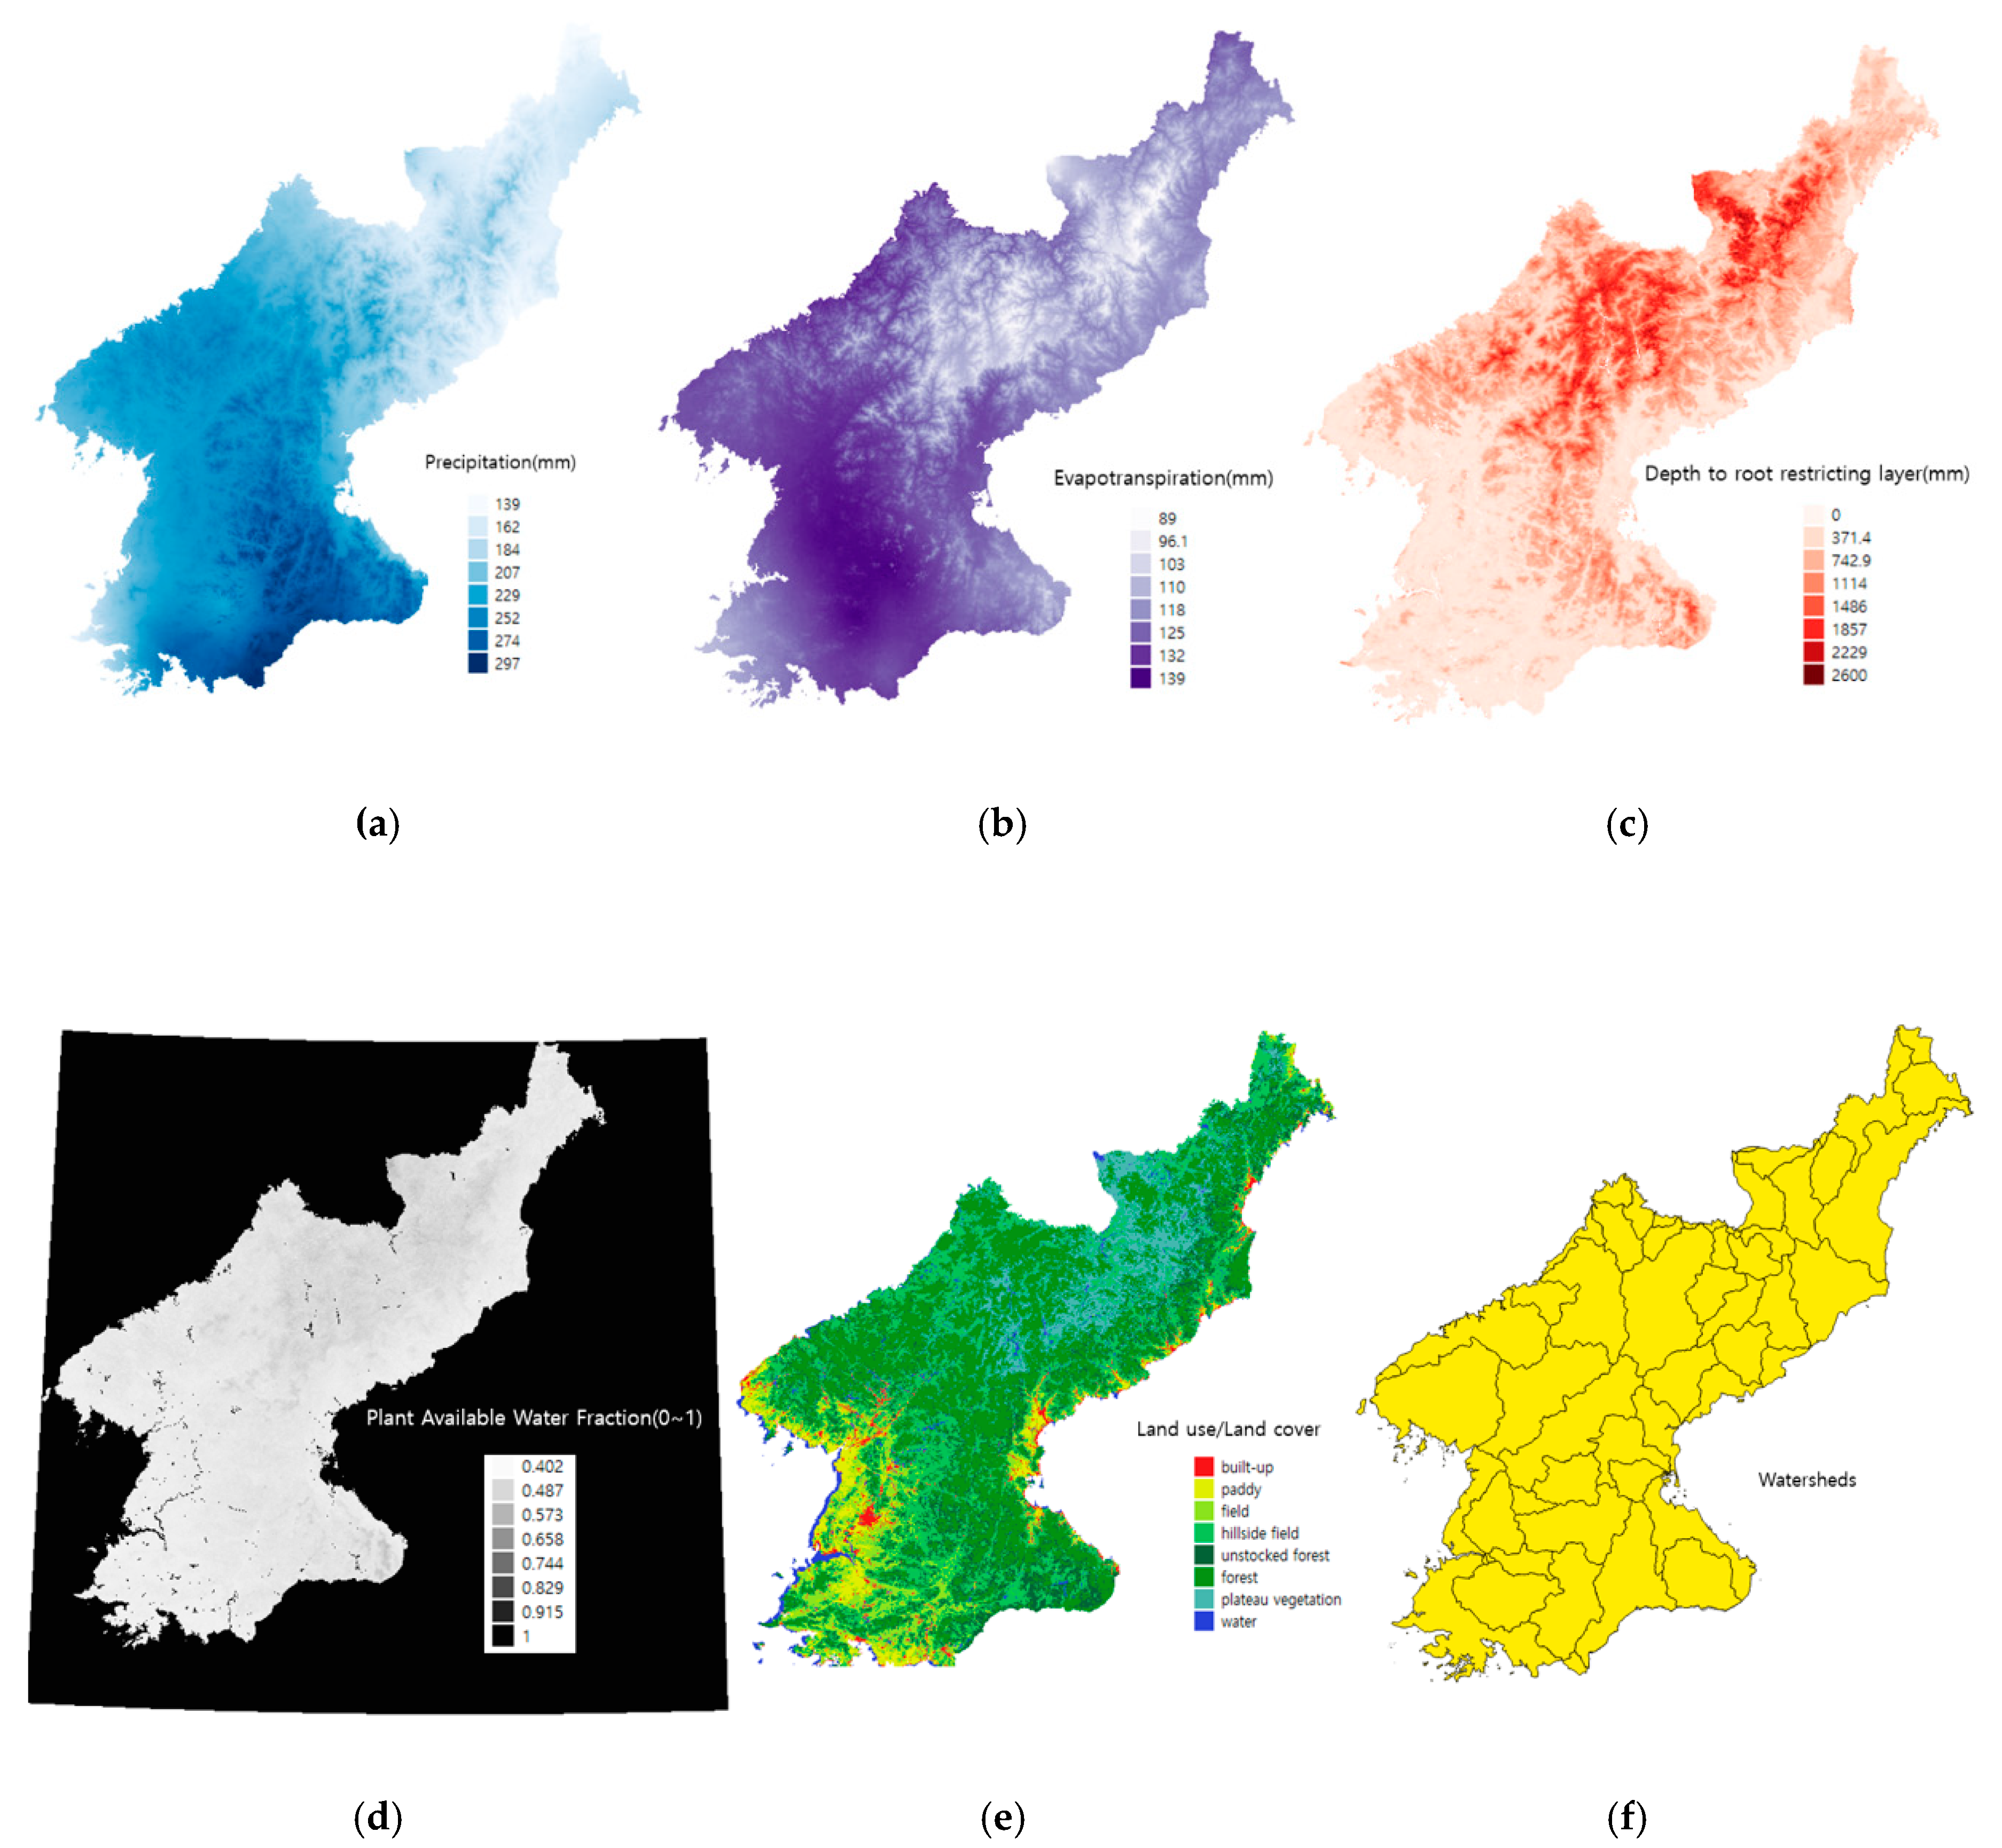
Input datasets constructed for Integrated Valuation of Ecosystem Services and Tradeoffs (InVEST) water yield modeling, (a) precipitation (mm), (b) evapotranspiration, (c) depth to root restricting layer, (d) plant available water fraction, (e) land use and land cover (LULC) and (f) 60 watersheds.
Figure 2.
Input datasets constructed for Integrated Valuation of Ecosystem Services and Tradeoffs (InVEST) water yield modeling, (a) precipitation (mm), (b) evapotranspiration, (c) depth to root restricting layer, (d) plant available water fraction, (e) land use and land cover (LULC) and (f) 60 watersheds.

Figure 3.
Results of water yield analysis for North Korean forests.

Figure 4.
Monthly water yield of North Korean forests.

Figure 5.
Spatial distribution of the water yield of North Korean forests by administrative district.
Figure 5.
Spatial distribution of the water yield of North Korean forests by administrative district.


Table 1.
Vegetation indices and their respective equations.
| Spectral Indices | Equation |
|---|---|
| NDVI (Normalized Difference Vegetation Index) | NDVI = (NIR − Red)/(NIR + Red) |
| NDSI (Normalized Difference Snow Index) | NDSI = (SWIR − NIR)/(SWIR + NIR) |
| NDWI (Normalized Difference Water Index) | NDWI = (RED − SWIR)/(RED + SWIR) |
NIR, near-infrared band; Red, red-band; SWIR, short-wave infrared band.
Table 2.
Biophysical parameters linked to land-cover characteristics in North Korea.
| Lucode | Description | Kc | LULC | Root_Depth | LULC_Veg |
|---|---|---|---|---|---|
| 1 | Built-up | 0.5 | 1 | 700 | 0 |
| 2 | Rice paddies | 0.7 | 71 | 2000 | 1 |
| 3 | Fields | 0.6 | 82 | 700 | 1 |
| 4 | Terraced fields | 0.5 | 39 | 500 | 0 |
| 5 | Unstocked forest | 0.85 | 42 | 1500 | 1 |
| 6 | Forest | 1 | 54 | 7000 | 1 |
| 7 | Plateau vegetation | 0.85 | 51 | 1700 | 1 |
| 8 | Water bodies | 1 | 89 | 1000 | 0 |
Lucode, land use class code; Kc, Kappa coefficient; LULC, land use and land cover.
Table 3.
Water yield of North Korean forests by administrative district.
| Administration | Pixels | Water Yield (t) |
|---|---|---|
| Pyongyang | 8915 | 6804,561 |
| Nampo | 1074 | 758,972 |
| Kaesung | 6167 | 5,657,589 |
| Hwanghaebuk-do | 57,245 | 46,239,243 |
| Hwanghaenam-do | 30,238 | 22,081,433 |
| Pyunganbuk-do | 97,677 | 64,532,206 |
| Pyungannam-do | 98,703 | 69,192,194 |
| Kangwon-do | 129,361 | 108,519,183 |
| Jagang-do | 229,949 | 129,904,600 |
| Yanggang-do | 212,206 | 95,361,861 |
| Hamgyongbuk-do | 203,288 | 78,494,901 |
| Hamgyongnam-do | 237,802 | 132,598,377 |
| TOTAL | 760,145,120 |
© 2020 by the authors. Licensee MDPI, Basel, Switzerland. This article is an open access article distributed under the terms and conditions of the Creative Commons Attribution (CC BY) license (http://creativecommons.org/licenses/by/4.0/).
Share and Cite
MDPI and ACS Style
Kim, S.-w.; Jung, Y.-y. Application of the InVEST Model to Quantify the Water Yield of North Korean Forests. Forests 2020, 11, 804. https://doi.org/10.3390/f11080804
AMA Style
Kim S-w, Jung Y-y. Application of the InVEST Model to Quantify the Water Yield of North Korean Forests. Forests. 2020; 11(8):804. https://doi.org/10.3390/f11080804
Chicago/Turabian StyleKim, Sang-wook, and Yoon-young Jung. 2020. "Application of the InVEST Model to Quantify the Water Yield of North Korean Forests" Forests 11, no. 8: 804. https://doi.org/10.3390/f11080804
Note that from the first issue of 2016, this journal uses article numbers instead of page numbers. See further details here.