Forest Disturbances in Polish Tatra Mountains for 1985–2016 in Relation to Topography, Stand Features, and Protection Zone


Department of Geoinformatics, Cartography and Remote Sensing, Chair of Geomatics and Information Systems, Faculty of Geography and Regional Studies, University of Warsaw, 00-927 Warsaw, Poland
Forests 2020, 11(5), 579; https://doi.org/10.3390/f11050579
Submission received: 31 March 2020
/
Revised: 11 May 2020
/
Accepted: 19 May 2020
/
Published: 21 May 2020
(This article belongs to the Special Issue Effects of Disturbance on Forest Dynamics under Climate Changes)
Abstract
:For more than four centuries, the Tatra Mountains were affected by many factors, such as forest and pastoral management, mining and metallurgy, windthrows, snow avalanches, and bark beetle outbreaks. Due to the availability of the long-running Landsat program enabling acquisition of spatially and spectrally consistent information, it is possible to the use these data for forest disturbance analysis. The main aim of this study was to analyze the relationships between the frequency of disturbances detected over the period of 1985–2016 and selected topographic features, such as elevation, exposure, and slope, derived from a digital elevation model (DEM); stand features, such as vegetation community type, age, structure, and degree of naturalness of the stand; and the management protection zone, which was extracted from thematic layers of the Tatra National Park (TNP). Using the normalized difference moisture index (NDMI), we detected forest disturbances in each year and analyzed them in the context of these topographic features, forest stand characteristics, and the management protection zone. We observed that forest stands in the lower montane zone, slopes between 10°–30°, and eastern exposures were primarily affected by disturbances. These consisted of artificially planted spruce stands aged between 51 and 100 years old.
1. Introduction
Forest disturbances and subsequent recovery from these disturbances are integral parts of an ecosystem’s dynamics, leading to increased landscape diversity [1]. The definition of disturbance depends on the spatial scale and the level of organization (i.e., from individuals to entire ecosystems) and the temporal scale (i.e., abrupt or gradual changes) [2]. Disturbances can be caused by abiotic factors, such as fires, windthrows, floods, or landslides, or biotic factors, such as pests or pathogens [2,3]. Depending on the geographical location and other local factors, the disturbances can be related to topography, stand features, or management protection activities [4,5,6].
In mountain areas, the differences in forest change types are primarily caused by topography and land-use history [7]. These features are interrelated, due to the fact that some areas will have been more preferable for agriculture or timber collection in previous centuries. Additionally, topographic variations may also affect the windstorm direction [8]. This may lead to more frequent disturbances for certain elevations, exposures, or slopes. The effects of topographic features on stand sensitivity to disturbance have been demonstrated consistently [4,5,7,9]. Several studies have shown that the important factors affecting the occurrence of forest disturbances were also related to selected stand features, including species composition [10],,canopy size and shape [9], wood density [11], forest structure [7], and stand age [12]. Moreover, differences between forms of forest area protection reflecting management activities were also indicated in the literature as important factors when analyzing disturbances [6,11]. Management influence in some regions can be so strong as to obscure the existence of natural disturbances [7].
Remote sensing data have an advantage over field-collected data in that they are more objective, due to the same collection and processing procedures being used for the whole analyzed area [13], which is especially important to consider in less accessible areas, such as mountains [14]. Due to the repeatability of data acquisition, satellite data in particular provide great potential for forest change analysis [15,16,17]. For such applications, disturbances are defined as all processes leading to the significant removal of vegetation canopies and biomass [2]. According to this definition, for global- and regional-scale monitoring using remote sensing data, individual tree mortality is not considered, rather only the dieback of the canopy; hence, very high spatial resolution is not required. More importantly, the spectral resolution of optical data should be considered, where spectral shifts caused by changes in pigments, structure, defoliation, or mortality can be detected. Based on these conditions, Landsat data, which has been collected from 1970s onwards, includes a revisit time for all sensors of 8–16 days, registered bands encompassing visible, near-, and short-wave infrared spectra, and a spatial resolution of 30 m [18]. Together, these factors seem to be a good compromise between the availability and repeatability of high-quality data and the information required for forest change monitoring.
Topographic features can be derived from various sensors that acquire information regarding terrain height. More detailed analysis requires the use of topographic maps, digital aerial photographs, or aerial laser scanning (ALS) point clouds for high-resolution 3D model generation [19,20,21,22]. For analysis conducted on regional or global scales, the resolution of Shuttle Radar Topography Mission (SRTM)-derived data, which encompass the majority of Earth’s land, is sufficient [23,24]. Remote sensing products are flexible regarding their combination with geographic information system (GIS) thematic layers. Many thematic maps are produced for management of protected areas [25,26], providing valuable information for both application and research.
The forests of Tatra National Park (TNP) were affected for more than four centuries by many stress factors, and their condition has been studied for many years via remote sensing and geographic information systems (GIS) methods using field, aerial, and satellite sensors [27,28,29,30]. As stands cover the majority of the Tatra Mountains, they were the main object of interest during monitoring.
The first change analyses in the subalpine belt of TNP in 1934–1977 were carried out by photointerpretation of the photogrammetric map of the Tatra Mountains and panchromatic aerial photographs [30]. In later years, forest changes were analyzed using panchromatic aerial photos, multispectral Satellite Pour l’Observation de la Terre (SPOT) data, thematic maps presenting forest changes, topographic maps, and a digital elevation model (DEM) created by digitizing contour lines from 1:50,000 topographic maps (1934–1992) [31]. Detected forest changes were analyzed by considering elevation, slope, and slope exposure. Subsequently, changes in TNP forests were analyzed using images from the Landsat and Advanced Spaceborne Thermal Emission and Reflection Radiometer (ASTER) satellites (1992–2002) [32]; SPOT 5 and SPOT 6 images; and DEM obtained from a 1:50,000 topographic map (2002–2012) [33]. High-resolution orthophotomaps from 1999, 2002, 2009, and 2012, satellite images from 2004, 2008, and 2013, and a DEM from 2009 were developed based on digital and analog data (scales were 1:14,000 and 1:26,000) and used to study spruce damage caused by bark beetle gradations over three periods ranging from 1999 to 2012 in TNP [19]. Changes in tree mortality in active and passive protection zones relating to height, slope, exposure, and amount of solar radiation were analyzed using analysis of variance (ANOVA) and regression trees to assess the effectiveness of predicting relationships with stand mortality. The whole TNP area was analyzed for forest conditions based on Landsat data from 1987, 2005, and 2011 [34]. Based on two vegetation indices and the decision tree classification method, it was possible to indicate the best and the worst overall conditions of the TNP forests.
Bark beetle gradations in a part of the Tatra Mountains within the Slovak national park border (TANAP) were analyzed using Landsat data from 1991, 1993, 1995, 1997, and 1999; a DEM; and differences in calculated vegetation indices [35]. Continuation of these studies via the Landsat dense time series was carried out using six indices sensitive to the condition of coniferous trees to map bark beetle gradations on the southern slopes of the Slovak Tatras from 2005 to 2011 [36]. The stands of both the Polish and Slovak parts of Tatras subjected to wind and bark beetle activity in the years 2003–2014 were examined in active and passive protection zones after supervised classification of eleven Landsat scenes [6]. All of the Tatra Mountains forest stands were part of the analysis of protected forest areas in Central Europe, which were affected by destructive wind activity and bark beetle gradation between 1985 and 2016 [37]. Using the breakpoint detection algorithm and Landsat data, forest disturbances were detected and four disturbance classes (windthrow, cleared windthrow, bark beetles, and other harvests) were mapped using spectral, temporal, and topography-related metrics (slopes, exposures, elevation, and roughness of the terrain derived from SRTM data).
While in the aforementioned publications some smaller parts of the Tatra Mountains were analyzed by taking into account forest disturbances in relation to topographic features or management activities, to the best of our knowledge, no works had focused on the entire TNP area or on particular stand features for this area over such a long duration. Long-term monitoring of Tatra Mountain forests was the subject of works that considered classification of disturbance agents; however, the detection of disturbance areas and their relationships to topographic and stand features, as well as management protection zones, was not performed.
The aim of this study was to analyze forest disturbances in the Polish Tatra Mountains from 1985 to 2016 in relation to the following:
- Topographic features, such as elevation, exposure, and slope.
- Stand features, such as vegetation community type, age, structure, and degree of naturalness.
- The management protection zone.
Landsat data from 1985 to 2016 were utilized for forest disturbance detection and digital elevation model derivatives, and thematic layers were applied to analyze the relationships.
We hypothesized that the frequency of disturbances would depend on the abovementioned features. More specifically, we expected that the disturbances would occur more frequently at lower elevations and not on steep slopes, which were more accessible for humans in previous centuries during timber collection (H1). Additionally, we expected the most frequent would be forest disturbances in the most common northern exposures in TNP. Furthermore, we hypothesized that spruce stands incompatible with the type of forest, mainly consisting of relatively young trees (up to 100 years), would be most frequently affected by disturbances (H2). Finally, based on other studies concerning the relationships between disturbances and management activities, we expected that disturbances would be less frequent in strict protection zones (H3).
2. Materials and Methods
2.1. Study Area
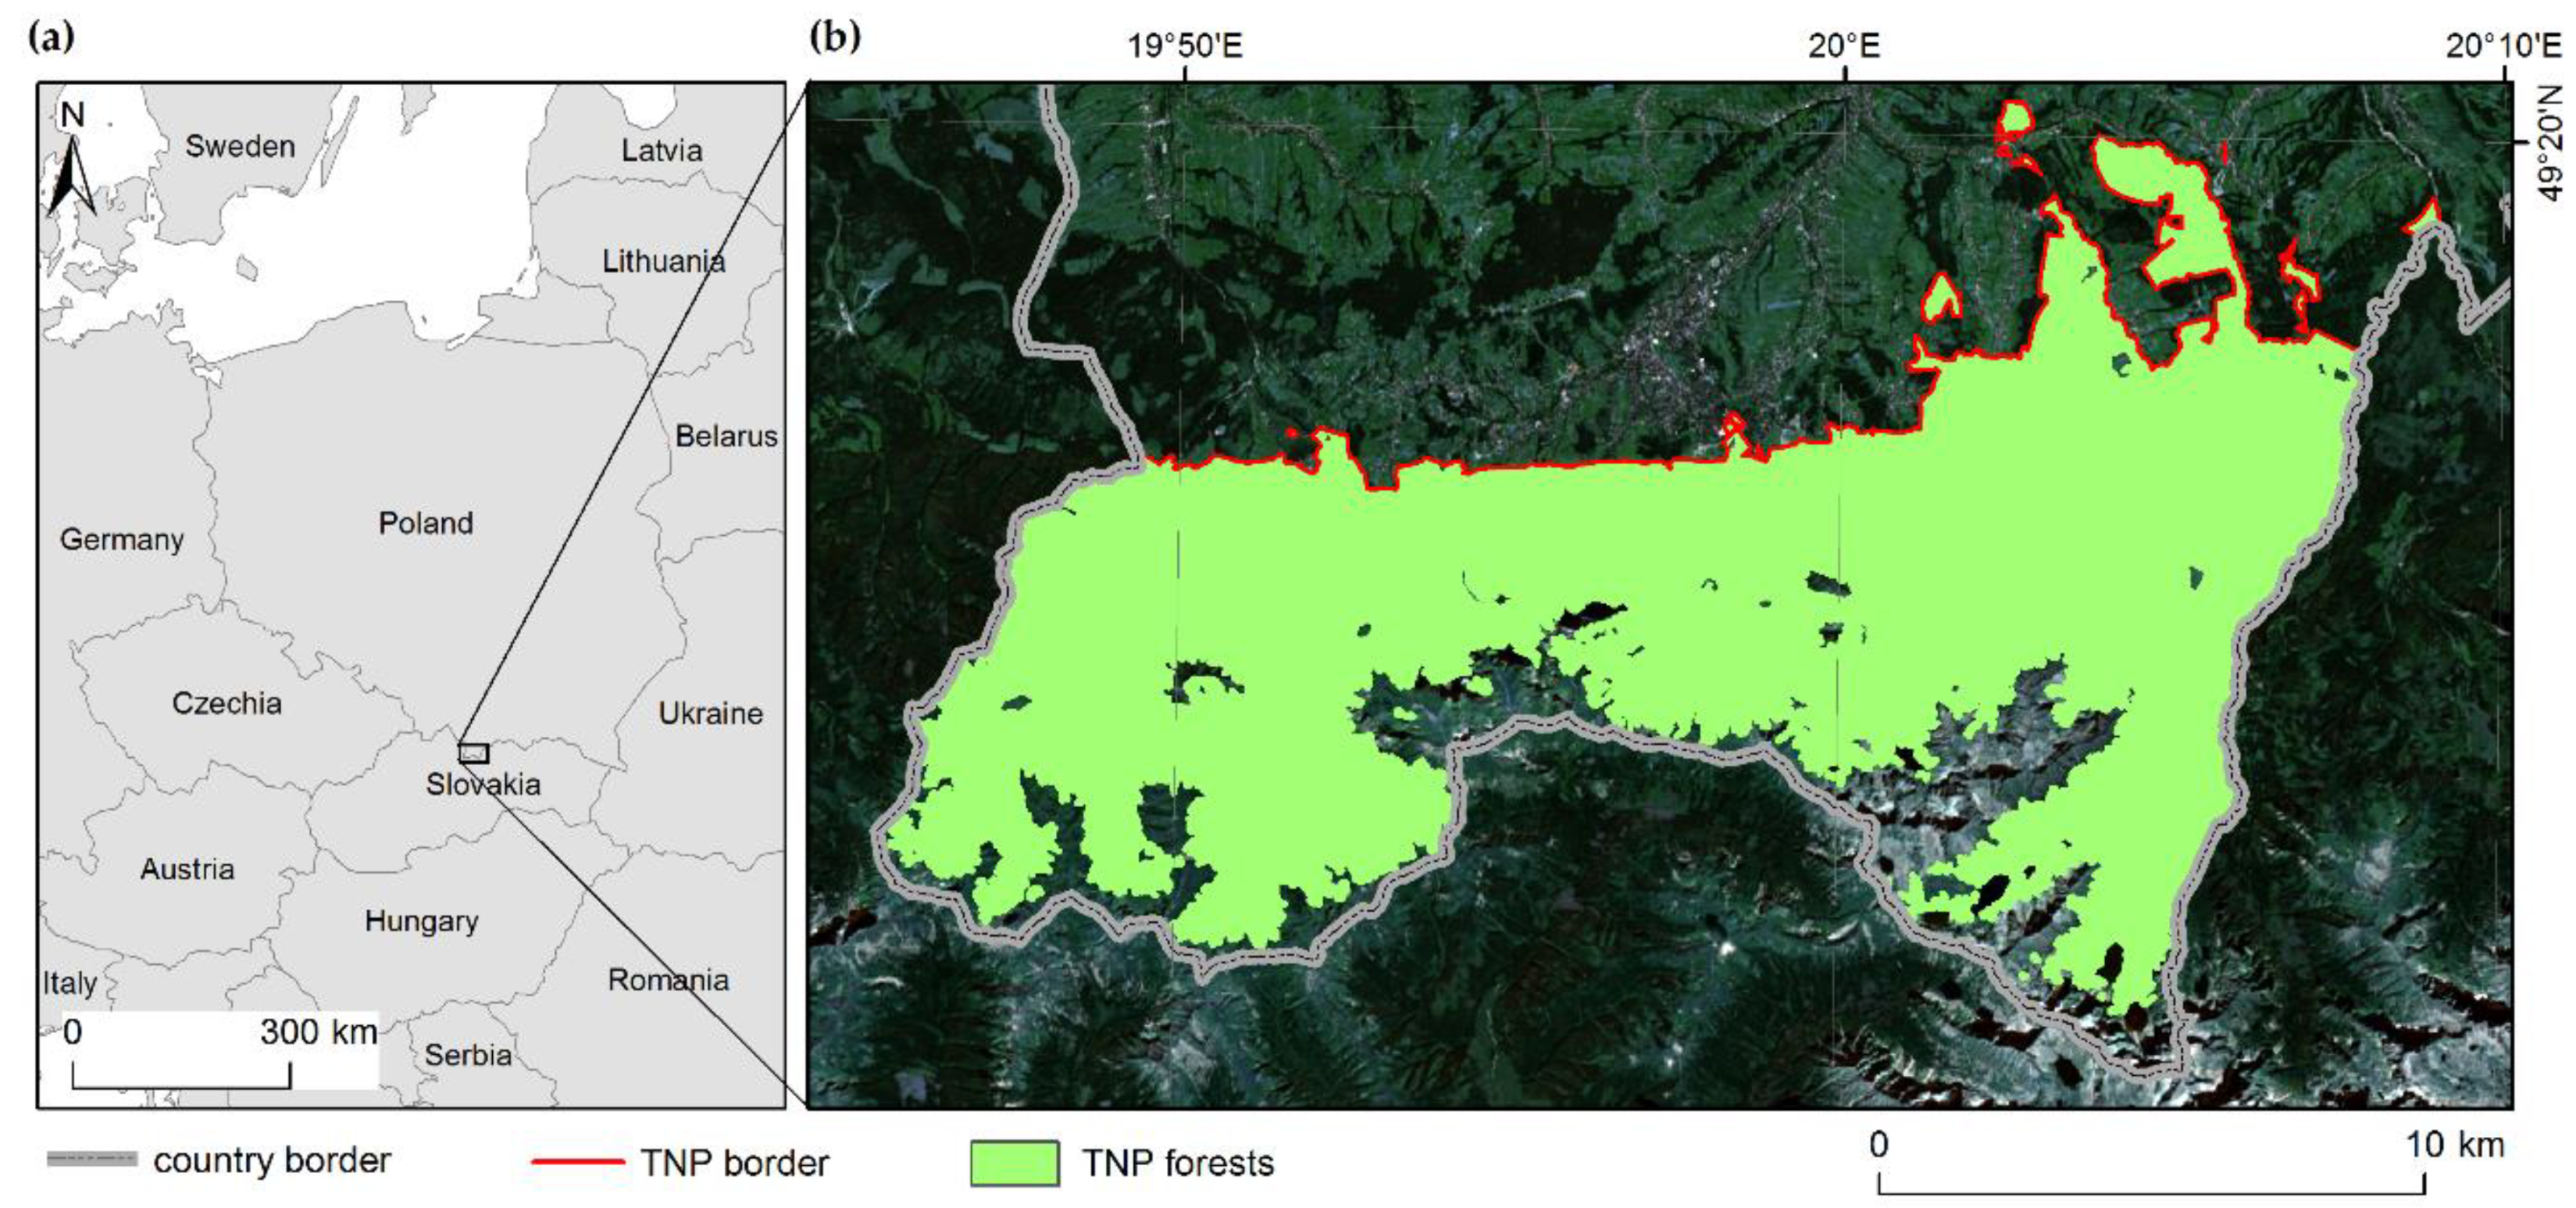
The Tatra Mountains are located in Poland and Slovakia, encompassing the area of 19°45′36″ E and 20°09′00″ E, as well as 49°10′42″ N and 49°20′05″ N. The elevation range is approximately 900–2650 m. In comparison with other Alpides, they are much smaller both in area and height. On the other hand, the largest number of high-mountain fauna and flora species in the region are found here, and the mountains are the northernmost center of endemism. The mountains are, therefore, an important area in the context of biodiversity protection, which is ensured thanks to two national parks, namely the Tatrzański Park Narodowy (TPN) in Poland and Tatranský Národný Park (TANAP) in Slovakia. Because of the thematic layers available, this study focused only on the Polish side of the area, which encompasses 21,165 ha (Figure 1).
In total, 75% of TNP is covered by forests (15,877 ha). The largest areas of the forest zone are covered with spruce, being the only tree species in the upper montane zone. In the lower montane zone, spruce forms stands alongside fir, which is the second most frequently occurring species throughout the TNP forests. Other tree species, representing a negligible share of the overall forest area, include beech, larch, rowan, sycamore, Swiss pine, black alder, grey alder, willow, pine, birch, ash, elm, and aspen. The subalpine zone is dominated by the main species of the area, i.e., dwarf pine, which forms dense shrubs.
The vegetation in the TNP was affected by humans for more than four centuries. The most significant transformations were caused by mining and metallurgy, as well as forestry, pastoral management, and tourism, to a lesser extent [28]. Uneven-aged beech and fir stands were transformed into even-aged spruce monocultures, covering over 80% of the area of the lower montane zone. Changes in the forests of TNP were also caused by strong winds, snow avalanches, and bark beetle outbreaks. More recently, one of the most influential moments was powerful mountain wind in December 2013, with speeds reaching 180 km/h and fallen trees covering an area of about 400 ha. Forest management, as well as the destructive activities of the wind, caused the appearance of the European spruce bark beetle, Ips typographus L., in the most damaged tree stands, where conditions were favorable for its development [38]. The vegetation of the Tatra Mountains has also been significantly affected by air pollution from local contamination.
2.2. Data and Processing
2.2.1. Landsat Data
Satellite Landsat time series data were obtained from the United States Geological Survey (USGS; https://earthexplorer.usgs.gov/) and the European Space Agency (ESA; https://earth.esa.int) archives. The data were acquired using the Landsat 5 Thematic Mapper (TM), the Landsat 7 Enhanced Thematic Mapper Plus (ETM+), and the Landsat 8 Operational Land Imager (OLI) sensors from 1984 to 2016 (30 one-year composites, except 1990, 1998, and 2004, due to the lack of good quality data). To avoid the effects of phenological changes, selected data were derived from the middle of June to the middle of September. All Landsat scenes were atmospherically and topographically corrected using ATCOR (Atmospheric and Topographic Correction) 2/3 (ReSe Applications GmbH, Wil, Switzerland, [39]).
Additionally, due to the differences between spectral signals registered by different Landsat sensors, harmonization was performed using linear regression models based on pairs of TM-ETM+ and ETM+-OLI scenes, with 1000 observations per scene. Then, the data were masked for clouds, shadows, and snow elimination using the Fmask algorithm implemented in the ENVI 5.3 software [40]. Such composites were subjected to disturbance detection throughout the entire analyzed period.
2.2.2. Digital Elevation Model
Four tiles of DEM were derived from SRTM and obtained from the USGS archive. The Arc-Second Global product was used with 30-m spatial resolution, with exposure and slopes calculated using ArcGIS 10.3 software. For the analysis of the relationship between disturbance frequency and exposure, this derivative was divided into nine categories: north, northeast, east, southeast, south, southwest, west, northwest, and flat areas. For the same purpose, the slope derivative was divided into seven categories from 0° to 60°, with 10° steps and one broader class above 60°. Based on the DEM, the relationship between elevation and disturbance was assessed and divided into two categories: <1250 m above sea level (a.s.l.), and 1250–1550 m a.s.l., corresponding to lower and upper montane zones, respectively.
2.2.3. Data from Conservation Plan of the Tatra National Park
To analyze the relationship between the forest stand features and the management protection zone, the following thematic layers were acquired from the TNP authorities:
- Forest vegetation communities (1:25,000 scale);
- Age structure of stands (1:75,000 scale);
- Age of stands (1:75,000 scale);
- Degree of naturalness (1:75,000 scale);
- Management protection zone (1:25,000 scale).
With the DEM derivatives, these layers were collected using ArcGIS 10.3 in order to prepare the database for further analysis.
2.3. Disturbance Detection and Database Preparation
Disturbance detection was performed for whole Tatra Mountains using a thresholding approach based on the normalized difference moisture index [41] series calculated for each year. This index was selected by detailed analysis of ten different vegetation indices, with the threshold value tested empirically [42]. This choice was supported by other authors conducting research into forest disturbance detection, noting that indices regarding water content were more sensitive to changes in the upper plant canopy and less sensitive to the impact of lower vegetation in the stands [43]. This was because renewing stands creates an increasingly dense, multi-layered, wet plant cover, resulting in increased index values [44]. To avoid false-positive detection caused by shadows and unmasked parts of clouds, logical rules using information from four subsequent images were incorporated into the thresholding. The best results indicating disturbance detection were obtained, showing a 0.085 decrease in NDMI value. Detailed procedures of disturbance detection were described in [42]. These results showed 29 images of forest disturbance in each year. The total disturbed forest area was 3095 ha, which was 14.5% of the study area.
An accuracy assessment was performed using 200 randomly sampled pixels extracted from each Landsat image in the time series. Based on visual interpretation, information was assigned for disturbance and no-disturbance occurrences for each pixel on a given date (5800 observations, with 114 representing disturbances). Orthophotomaps and high-resolution satellite images from Google Earth were used as ancillary data to support this interpretation. The overall accuracy of obtained results was 98%, while the producer accuracy calculated for disturbance was 79% and the user accuracy was 57%. For non-disturbed areas these values were 99% and 100%, respectively.
In order to check the relationship between the topographic features, stand characteristics, and the management protection zone, as well as the frequency of forest disturbance, a set of pixels representing the stands detected in the TNP area was prepared. Then, information from the above thematic layers was assigned to pixels in areas covered with forest stands in 1984 within TNP. In order to avoid bias in the results, detected pixels for mowed meadows were manually removed.
3. Results
Based on 34,385 pixels, the information from the thematic layers was assigned and charts presenting each individual factor and feature were created (the “other” category refers to patches of non-forest vegetation, where during the inventory for the TNP Conservation Plan development the stand no longer existed, but was within the borders of the stands during 1984). The map presenting detected disturbances in the TNP area between 1984 and 2016 is included as Supplementary Materials (Figure S1), as well as the charts presenting the areas of forest disturbances in relation to the area of each category (Figures S2–S9).
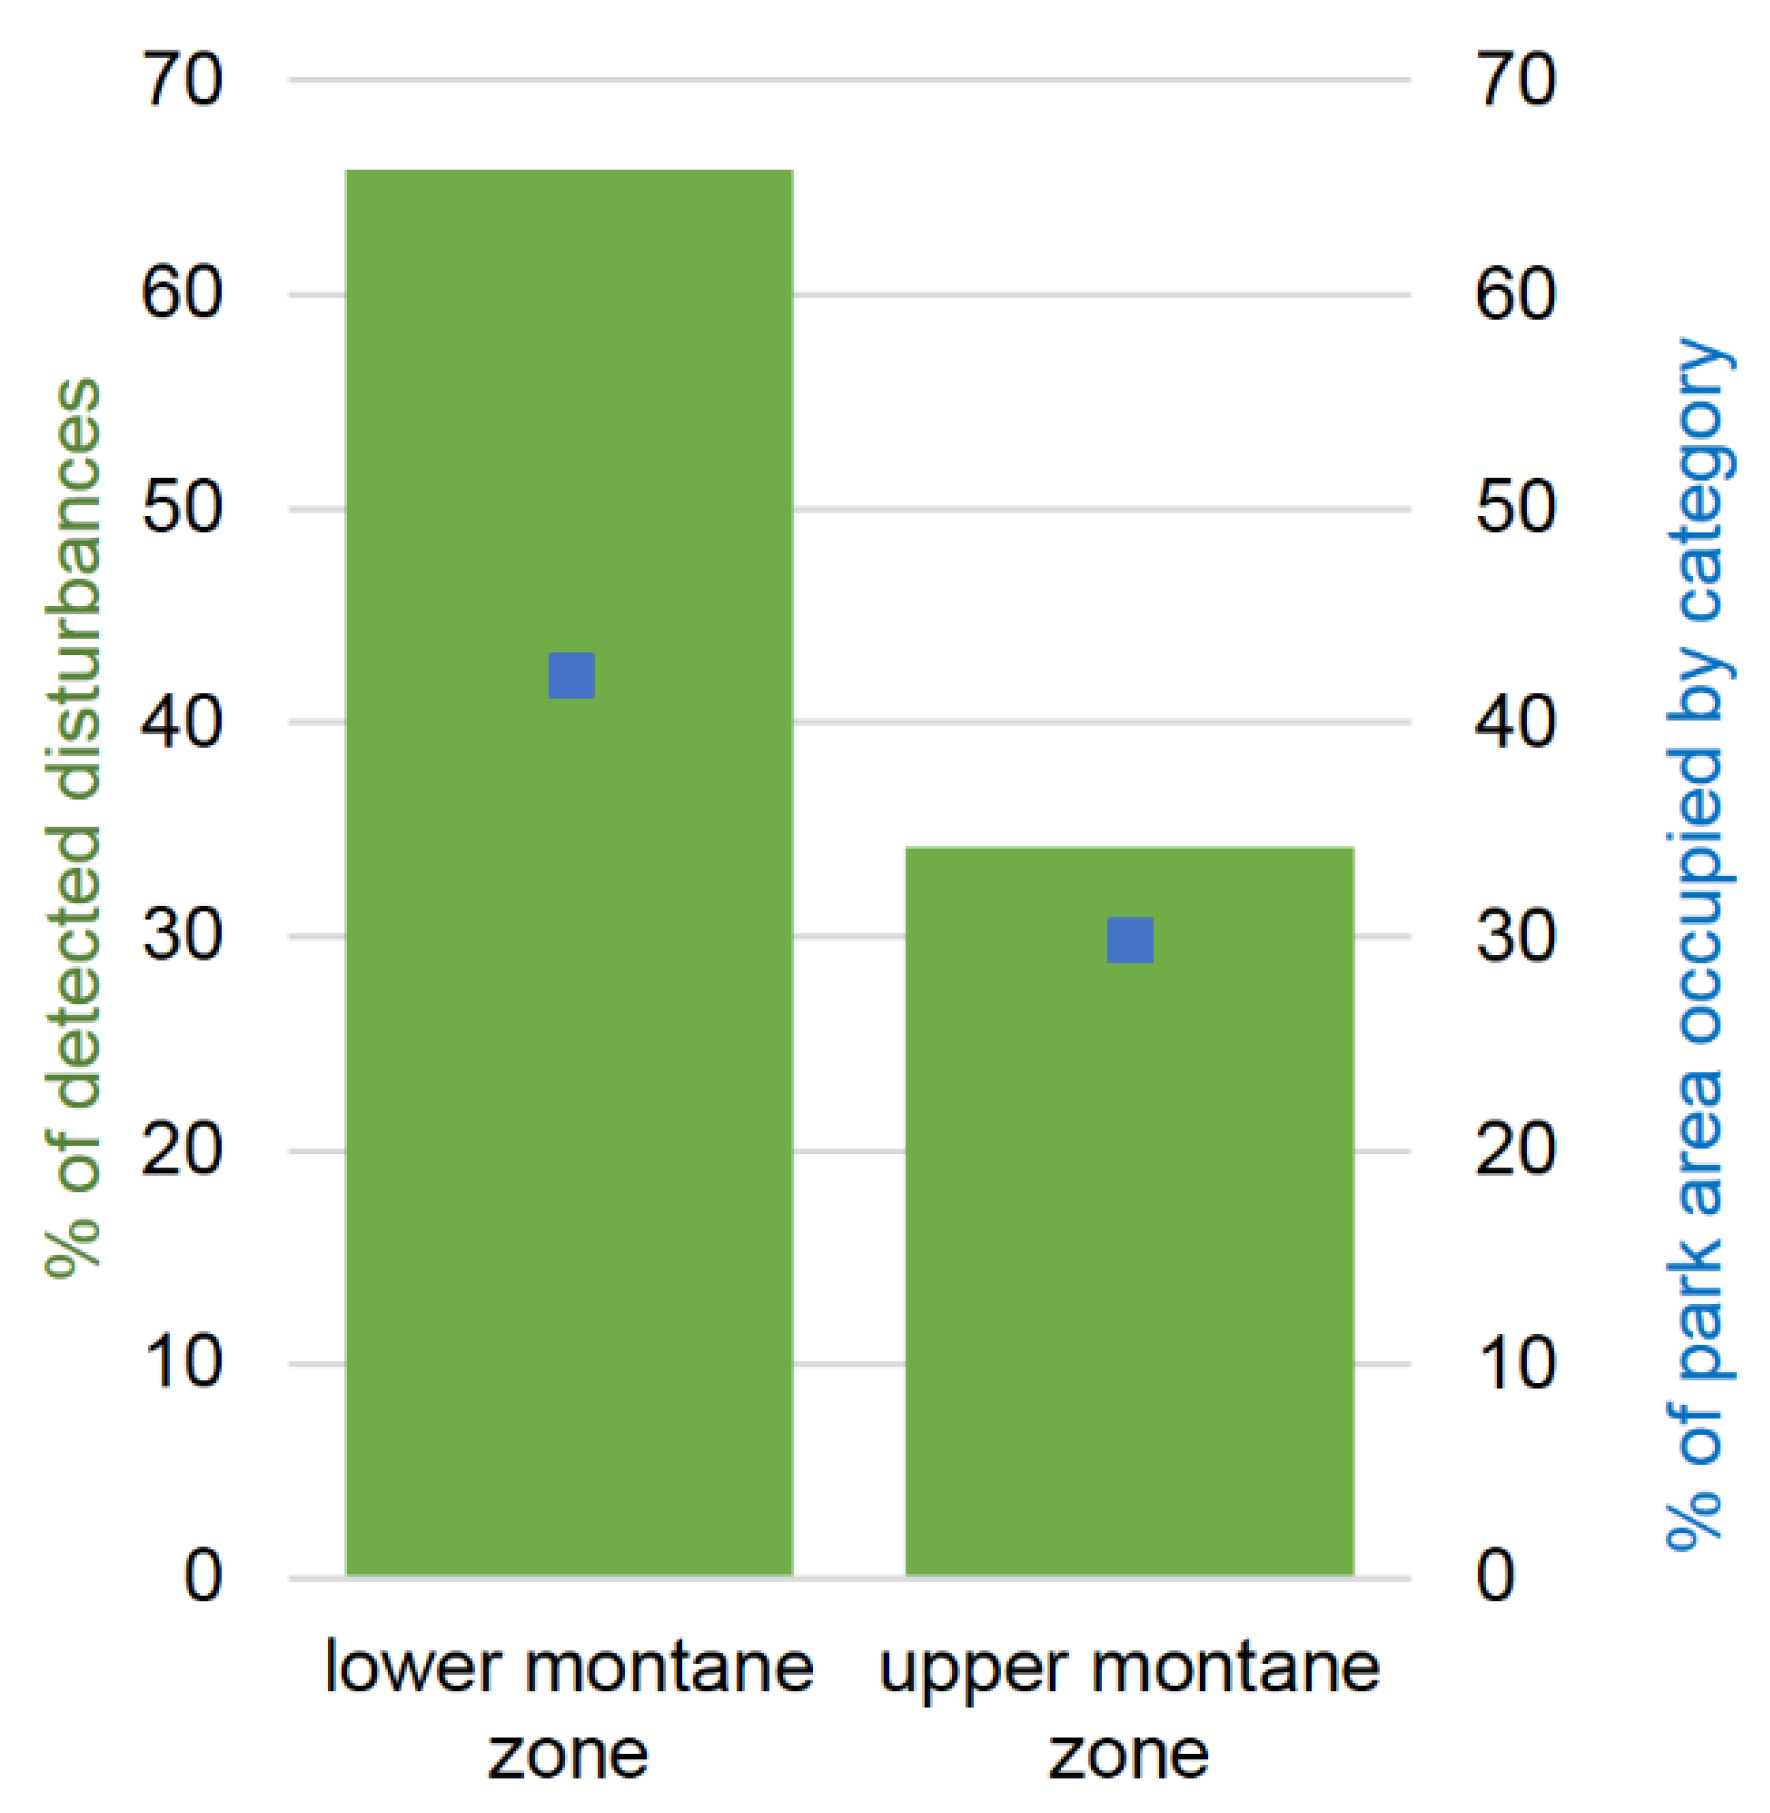
Forest disturbances were almost twice as frequent in the lower montane zone as in the upper zone (Figure 2), although the differences between the areas occupied by these zones were much smaller.
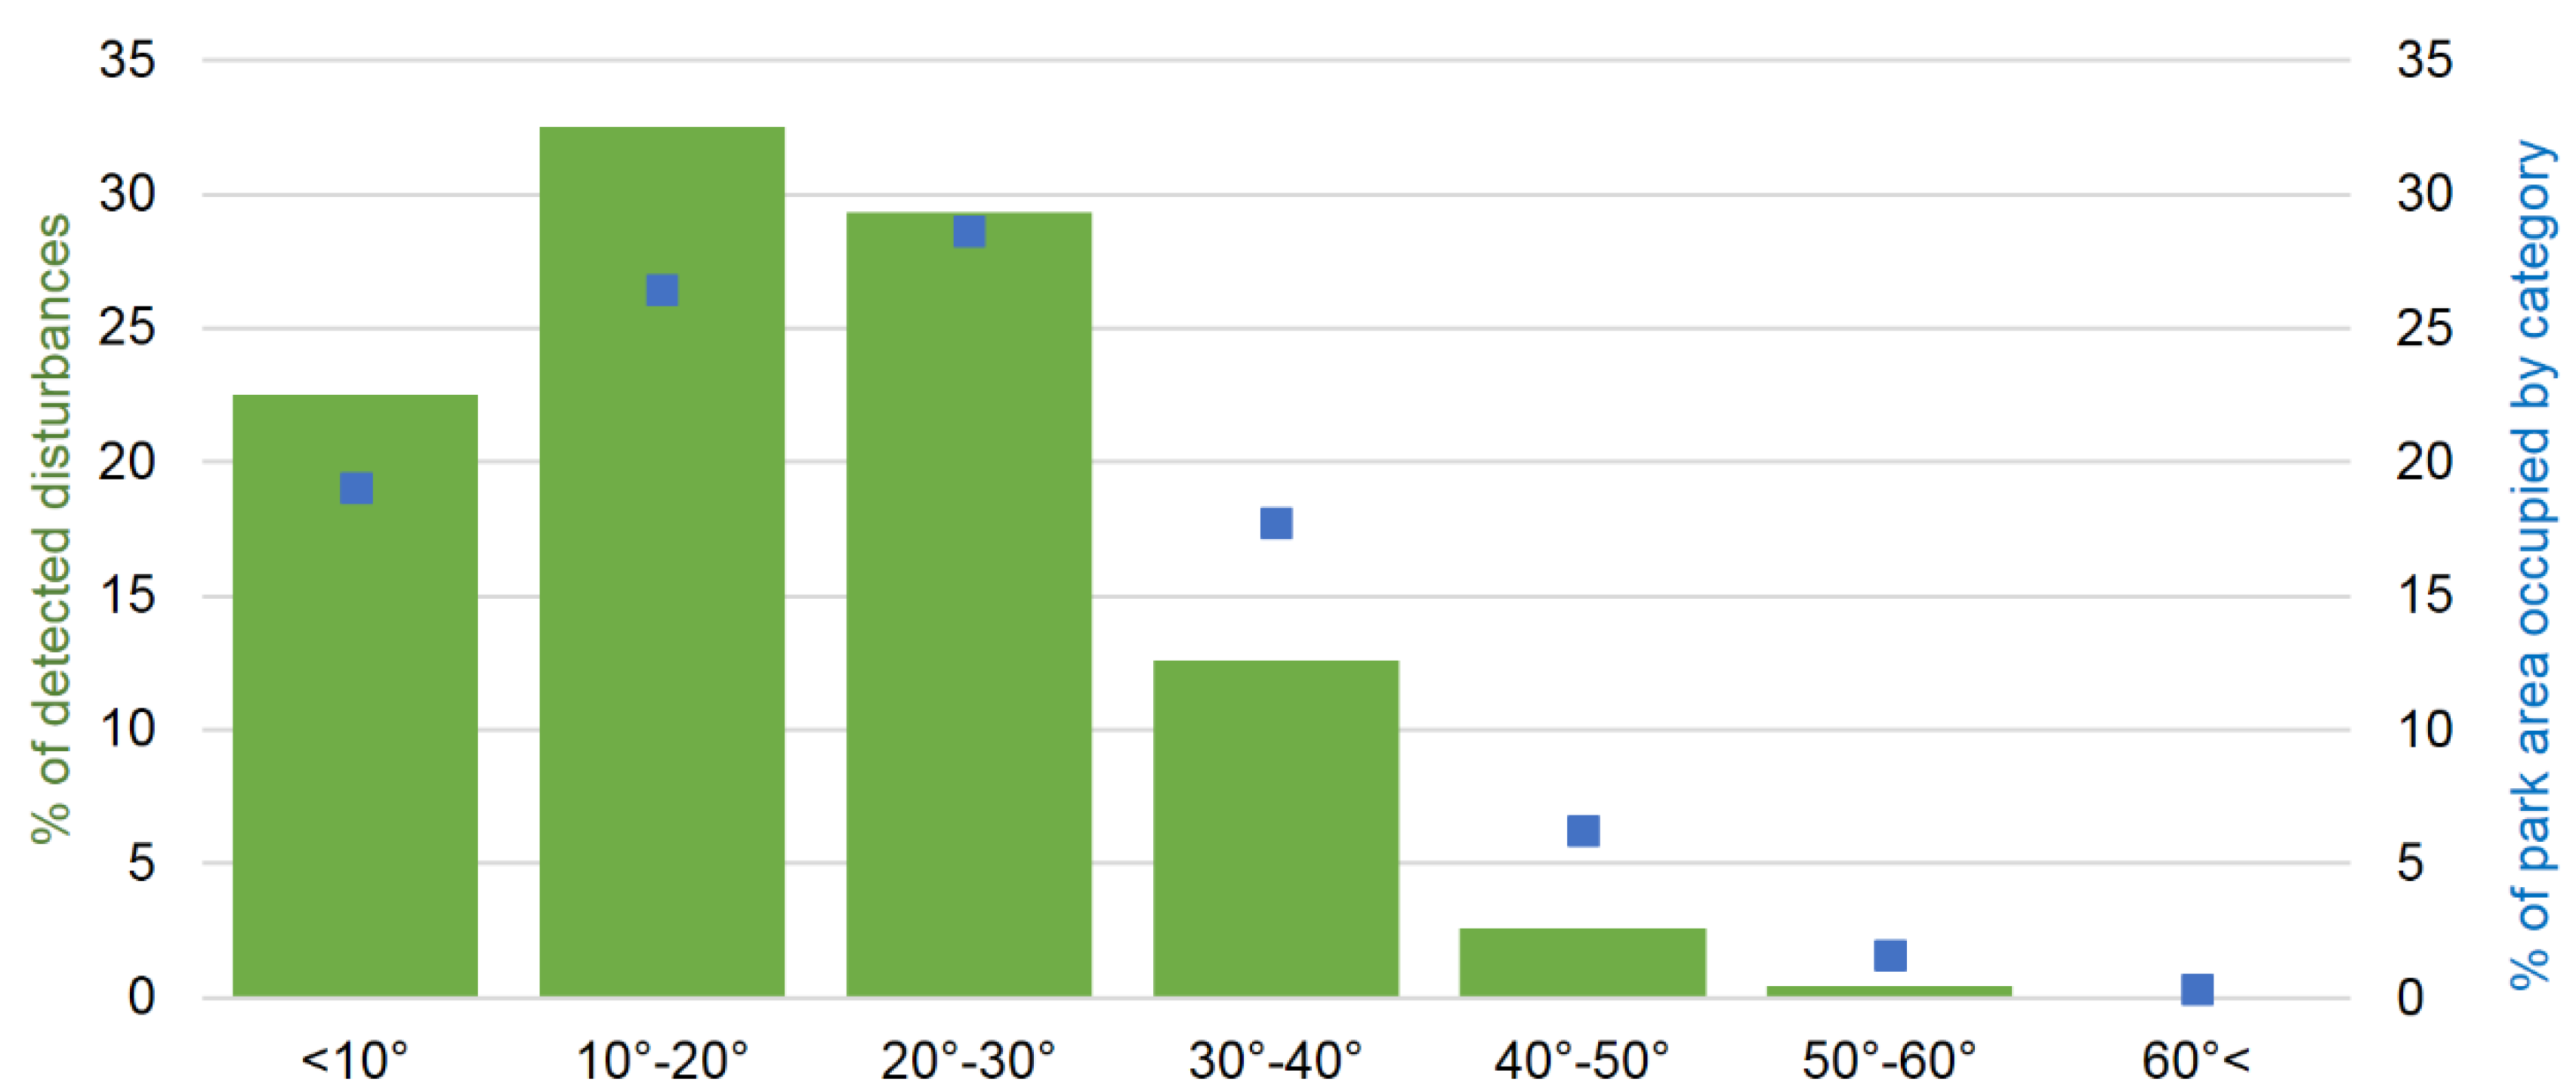
The most numerous disturbances were found on weak slopes (10°–30°; Figure 3), which were the most common type of slope in the TNP. Less disturbances were detected on nearly flat surfaces. Even less disturbances were registered on slopes above 30°; the larger the slope, the less stand disturbance observed due to the rare occurrence of stands on such slopes.
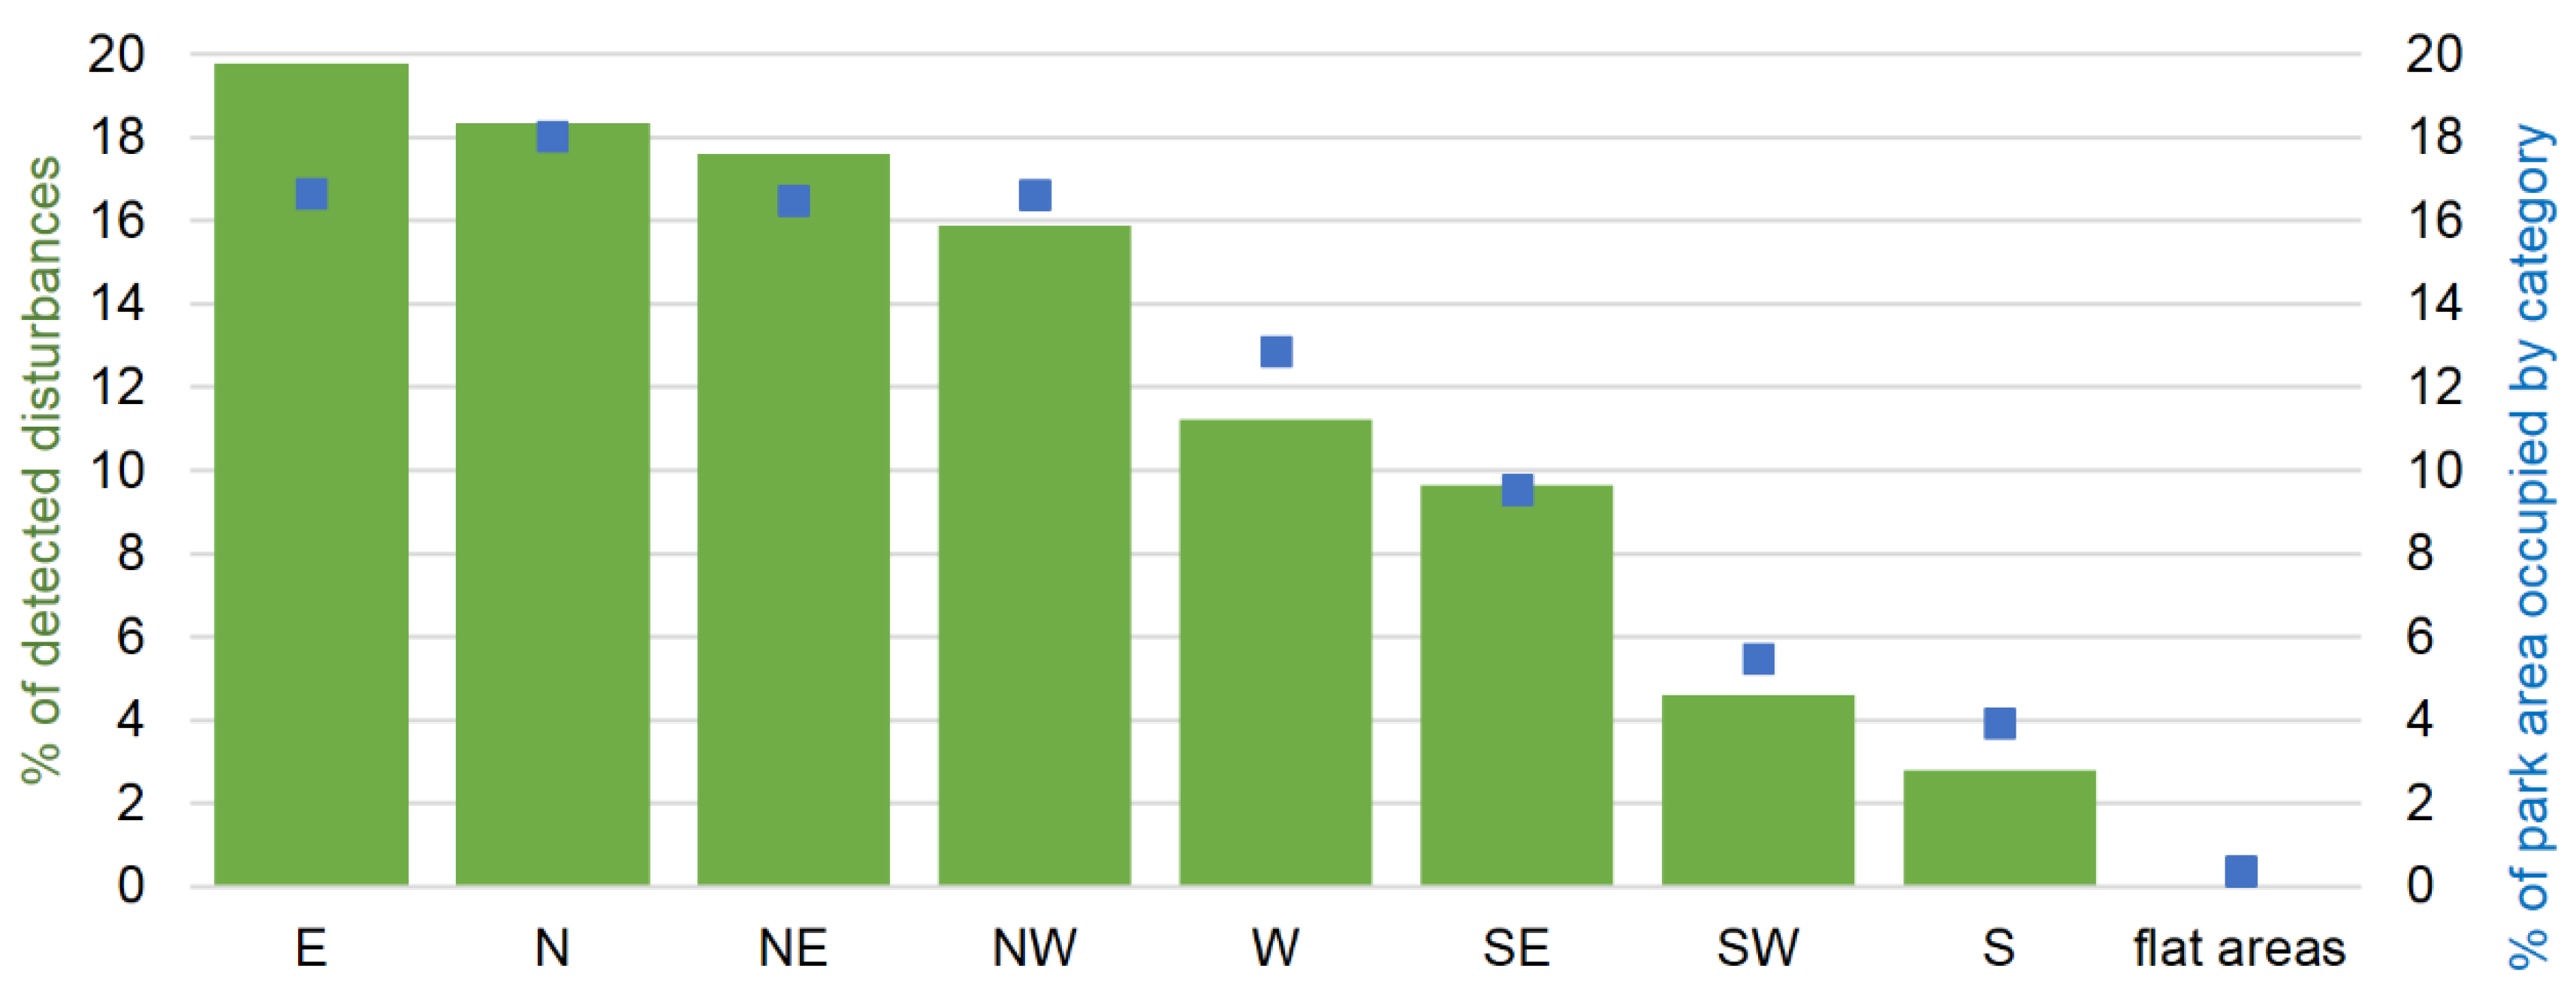
Forest disturbances were most common on slopes with eastern exposure (19.8%), covering 16.7% of the park’s area (Figure 4). In other cases, the percentage of detected disturbances was similar to the percentage of the area occupied by a given category.
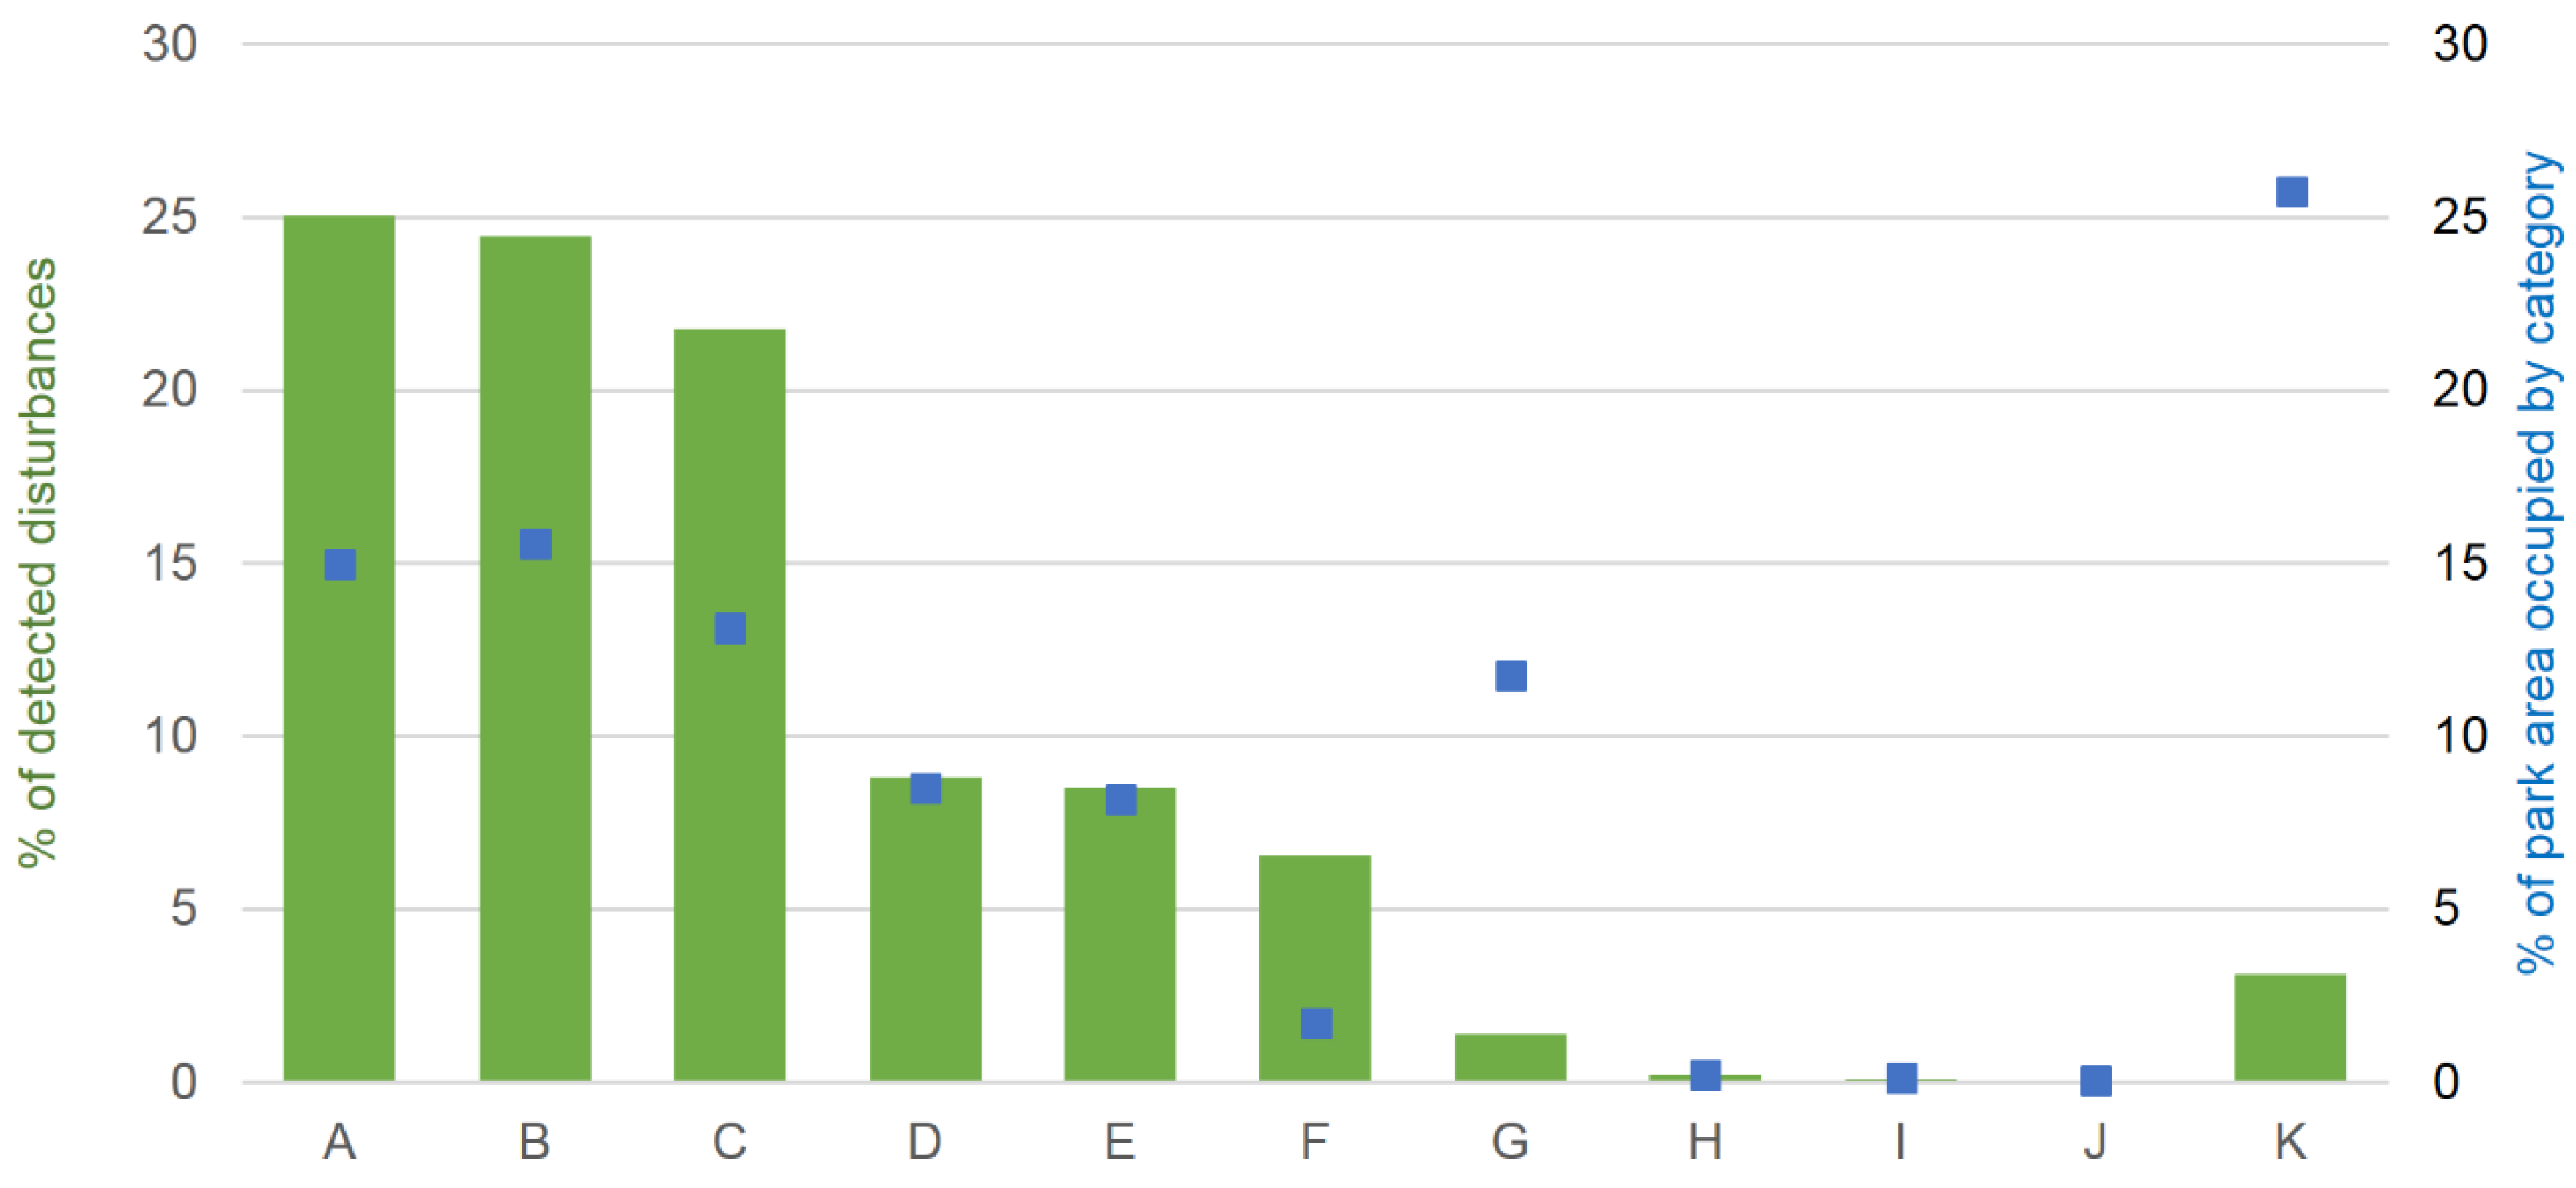
The highest percentage of disturbances (above 20%) was observed in areas of artificial spruce stands, as well as natural or close to natural spruce and fir forests (Figure 5). Less than 10% of the detected disturbances were found in fertile beech and fir forests and fertile spruce forests in the upper zone. Strongly thinned artificial spruce stands, which constituted a negligible percentage of the area considered, were characterized by a relatively high percentage of detected disturbances. In the remaining categories, including the “other” category, there was a negligible percentage of disturbances.
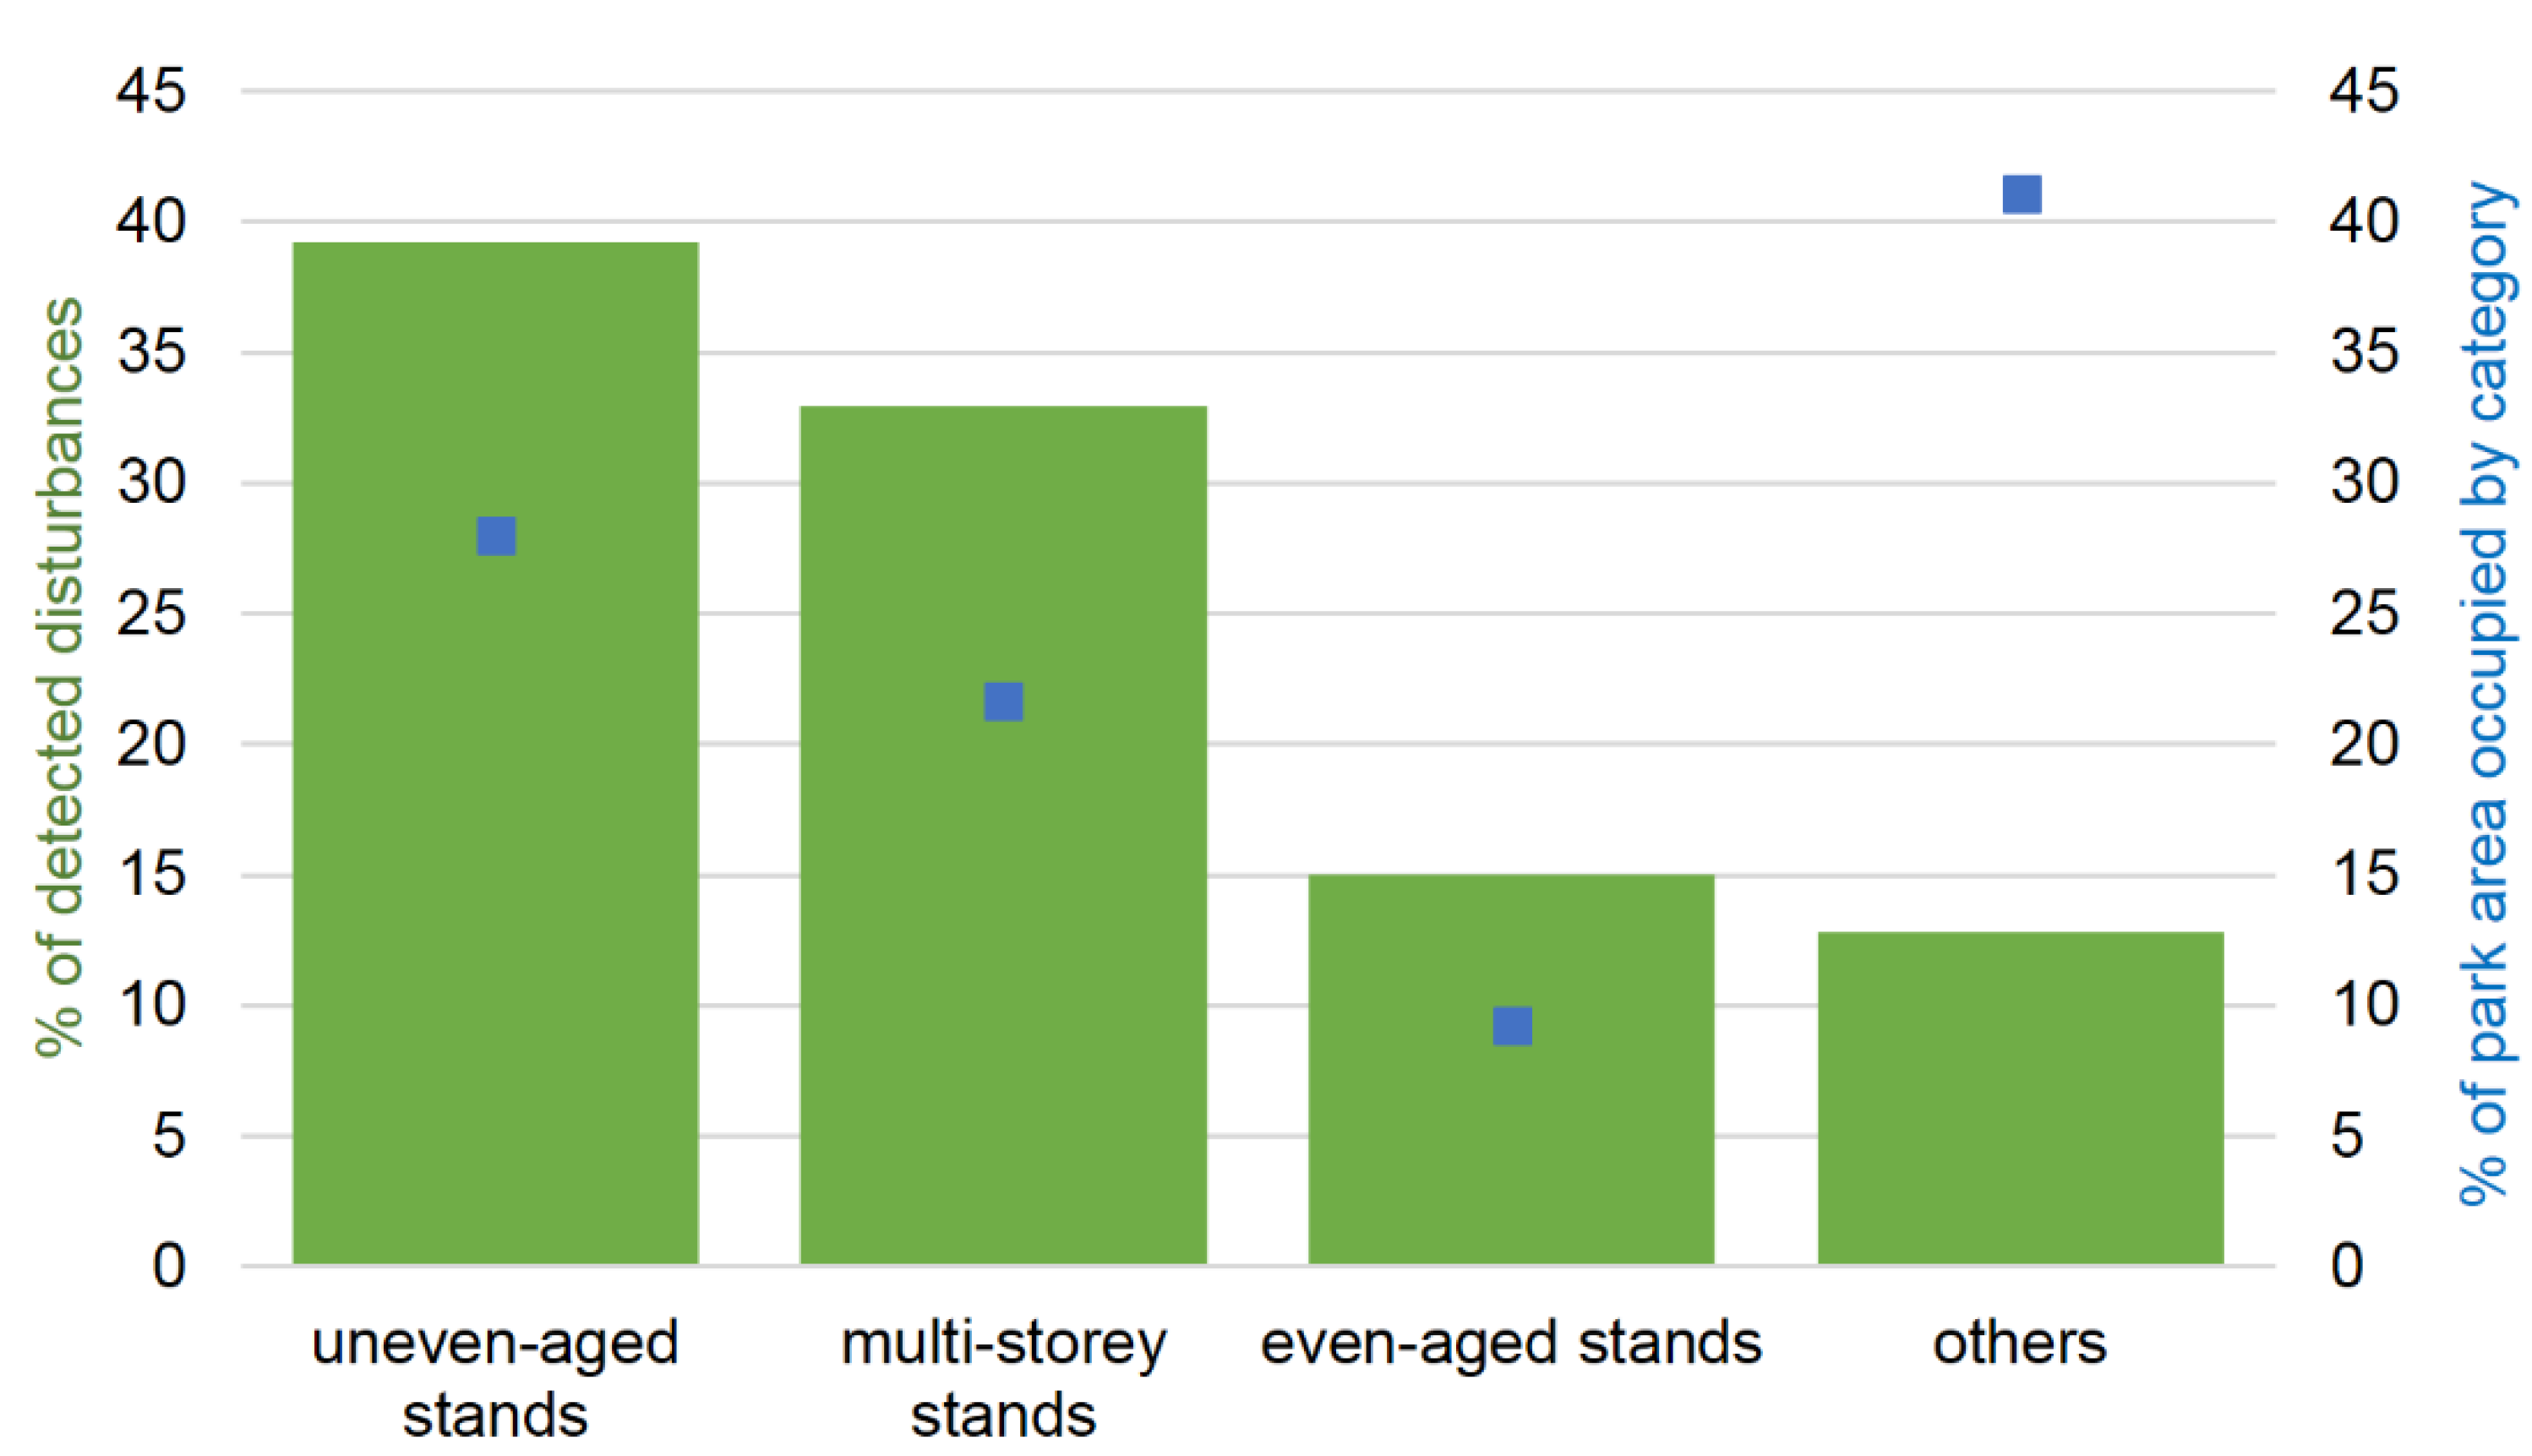
The relationship between the age structure of stands and the frequency of disturbances showed that uneven-aged stands and multistory stands (i.e., built from many layers; Figure 6) were affected. In even-aged stands, surprisingly few disturbances (15%) were noted, indicating that relatively young stands were involved in this relationship.
Considering the age of the stand, the most frequent disturbances were observed in stands in the 51–100 age class (36.3%), which were the most widespread in the TNP (Figure 7). Slightly older stands (101–150 years) were also characterized by frequent disturbance compared to the occupied area. These proportions were more equal for the youngest stands (up to 50 years old). In the oldest classes, i.e., 151–200 years and over 200 years, the percentage of detected disturbances was similar to the percentage of the area they occupied. As with the age structure, the “other” category also included detected disturbances in areas with completely damaged stands.
The most frequent disturbances occurred in stands of the lower zone, which were incompatible (30%) or only partly consistent (24.3%) with the type of forest (Figure 8). At the same time, the percentage of detected disturbances was relatively high in relation to the area occupied by a given type. Fewer disturbances were found in the upper zone natural stands (17.6%), with less disturbances found in the primary upper zone stands (8.6%), and even less again found in the lower zone stands that were close to natural (6.7%). Only a negligible percentage of disturbances was found for natural dwarf mountain pine (1.5%).
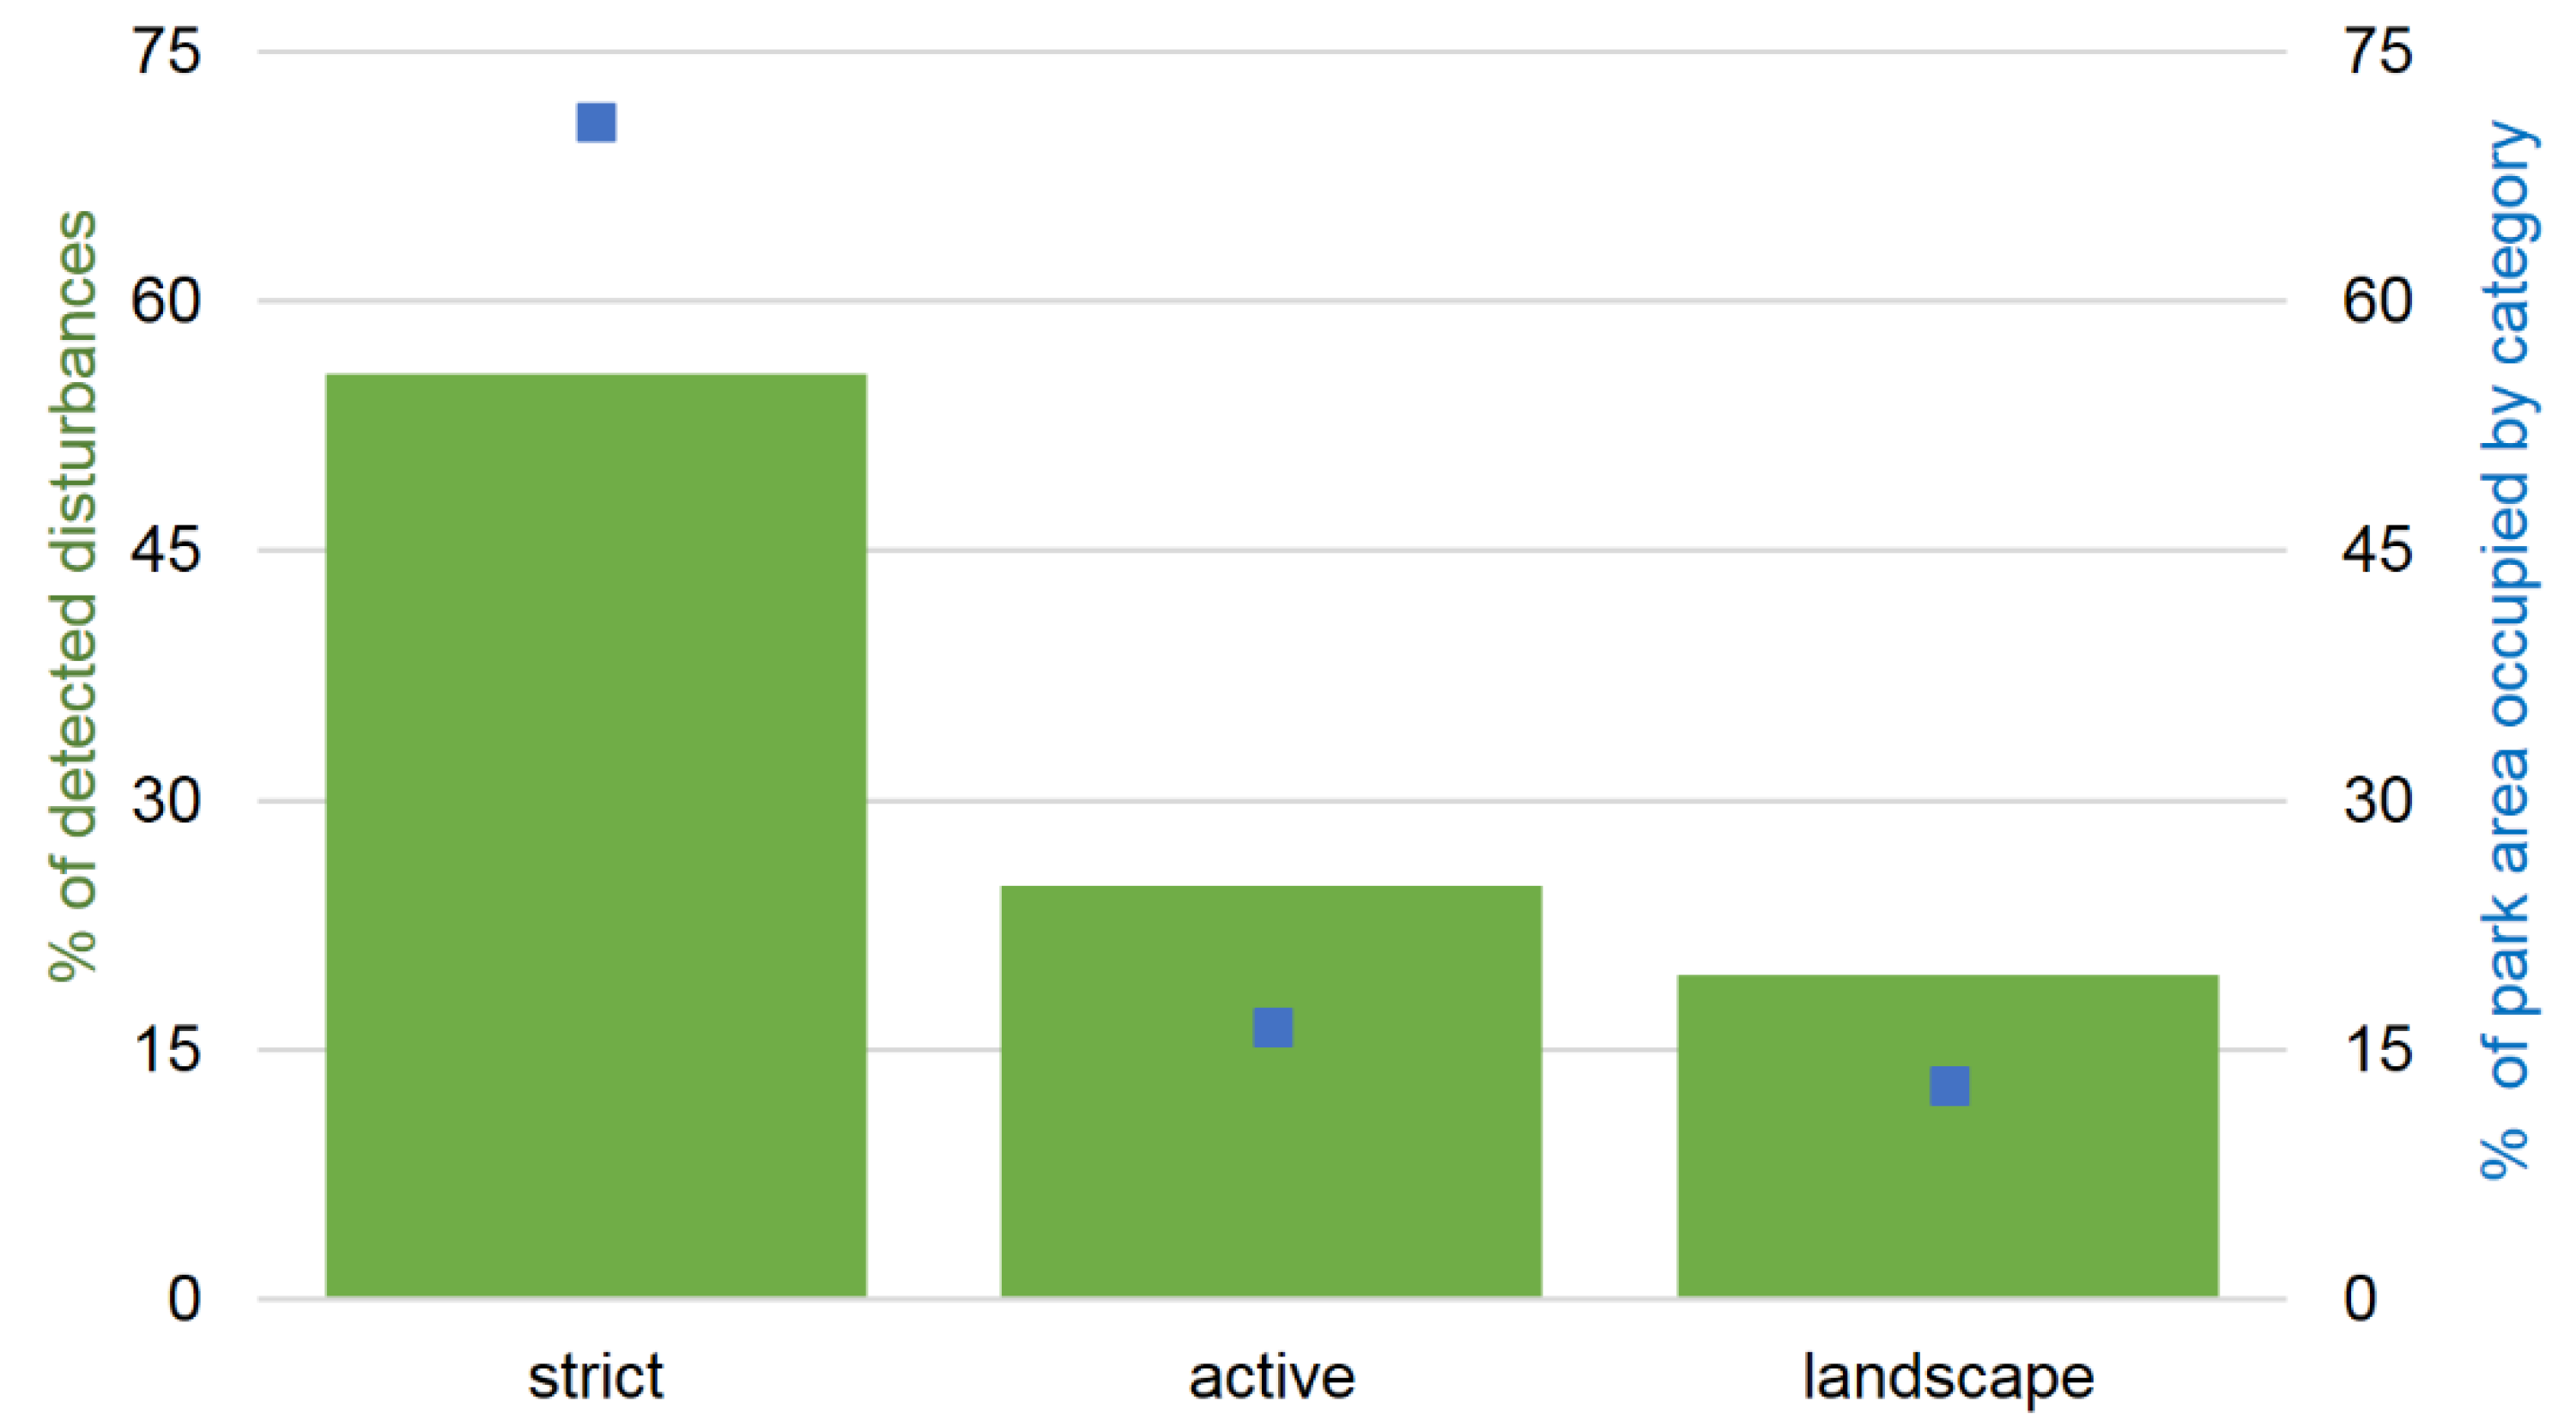
Although the largest percentage of disturbances was observed in the strict protection zone, the percentage was still proportionately lower than it appeared from the area occupied by this form of protection (Figure 9). More disturbances were detected in active and landscape protection zones than the indicated area, i.e., disturbances were relatively more frequent in these zones than in the strict protection zone.
4. Discussion
4.1. Frequency of Disturbances in Relation to Topography
The majority of forest disturbances observed in this study were in the lower montane zone (66.0% of detected disturbances), which supported our expectations (H1). The disturbances most frequently occurred on slopes of 20° to 50° (44.5%). This was similar to the relationship observed by Bielecka et al. [31] and Weintrit and Pluto-Kossakowska [33], indicating that most disturbances occurred on slopes with gradients of 19°–45°, covering 47% and 45% of disturbances, respectively. We observed 32.5% of disturbances in the 10°–20° slope range, where Bielecka et al. [31] observed 21% of disturbances and Weintrit and Pluto-Kossakowska [33] observed 30% of disturbances (in the range of 9°–19°). There was a noticeable increase in the area of forests disturbed on smaller slopes relative to the results of Bielecka et al. [31], possibly due to large-scale windthrow from 2013 in the TNP valleys.
The percentage of detected disturbances was similar to the percentage of the park area occupied by slopes with a given exposure, with deviations in the case of eastern exposure (19.8% of disturbances, 16.7% of the park’s area). Although this outcome is not in line with our hypothesis (H1), similar observations resulted from studies conducted in TNP by Weintrit and Pluto-Kossakowska [33], where 29% of forest disturbances in the period of 2002–2012 took place on slopes with eastern exposure. Both studies showed changes in this trend relative to the results of Bielecka et al. [31], indicating that the stands located on the slopes with northern exposure were the most frequently affected (32%) in the period of 1934–1992. However, it should be taken into account that the aforementioned research studies differed in terms of the analyzed period and used data. The advantage of our study is the utilization of dense time series encompassing 30 years, which allows for detailed detection of areas that undergo forest disturbances. Grodzki et al. [45] showed the largest development of bark beetle gradation on southern and southeastern (TPN) and western (TANAP) slopes in their analysis of the areas of both parks (1991–1999). However, in the presented study, the areas of detected disturbances included the sum of areas of stands disturbed by any agent. The analysis carried out in this work ended in 2016; similarly, Grodzki and Gąsienica-Fronek [46] studied the intensity of bark beetle gradation in the Kościeliska Valley during growing seasons in the years 2014–2016, showing that the increase in the number of trees populated by the bark beetle indicated a high probability of its further development.
4.2. Frequency of Disturbances in Relation to Stand Features
The analysis of disturbance frequency in relation to selected stand features showed that the most frequent disturbances were to stands incompatible or partly consistent with the type of forest (54% disturbances), which was in accordance with our hypothesis (H2). The largest disturbed areas were observed in artificial spruce stands and low-fir spruce forests, characterized by partial consistence or lack thereof with the type of forest habitat. In the lower zone, a small percentage of forest (less than 10% of the area) retained its natural character, including fertile beech and fir forests characterized by a small proportion of stand damage. On the other hand, some spruce and fir forests underwent regeneration, with their undergrowth transformed toward mixed mountainous and forest terrain [47]; however, the stands remained unchanged and were, therefore, at risk of damage. In the lower zone, the main factor causing stand area reduction was strong winds, to which artificially introduced spruces with shallow root systems were not very resistant. In the case of the upper zone, no incompatibility of the stand with the habitat was observed since spruce was the only forest-forming species present, and yet 21.8% of forest disturbances were detected. For over 70 years, no changes other than natural fluctuations were observed in these forests [47].
4.3. Frequency of Disturbances in Relation to the Management Protection Zone
Disturbances were more frequent in the active and landscape protection zones than in the strict protection zone, which confirmed our expectations (H3). The disturbances were more frequent than the area they occupied would indicate. Other authors also analyzed this relationship focusing on particular disturbance agents, such as bark beetle outbreaks within active and passive protection zones. Sproull et al. [19] proved that management activities in the TNP did not effectively reduce spruce mortality severity caused by bark beetle outbreaks. Havašová et al. [6] pointed out that in protected areas with neighboring active and passive management zones, forest managers should acknowledge the limited influence of logging activities on bark beetle control, while further considering negative impacts on the environment. However, Oeser et al. [37] observed that active management of natural disturbances through salvage and sanitation logging led to decreased frequency of bark beetle disturbances. The differences in conclusions drawn regarding this relationship may result from differences in management methods in the analyzed areas.
4.4. Future Works
This study demonstrated the relationships between selected factors and forest disturbances in general, without differentiation into particular biotic and abiotic agents, as stated in the Introduction. Because different agents affect forest stands in various ways, deeper research should focus on separate analyses of windthrows, bark beetle outbreaks, and other factors using an image classification approach, following Havašová et al. [6] and Oeser et al. [37]. This could allow for the assessment of the relative impact of management activities, such as logging for bark beetle control, and the geographical distances between forest stands under different management plans.
Another way to expand the knowledge about the disturbances occurrence in the TNP is to combine the results obtained by considering topographic and stand features, as well as management activity. For instance, investigation of forest stands in different topographic positions with respect to management activity could show the differences and provide complementary information about the occurrence of disturbances, leading to specific recommendations being made for forest management in the TNP.
5. Conclusions
The analysis of the relationships between the occurrence of detected disturbances in the TNP and the exposure and slopes showed that disturbances occurred more often at eastern exposures (19.8%), and most commonly affected the lower montane zone (64.9%) and slopes between 10° and 30° (61.8%). The study showed differences in the frequency of forest disturbances depending on the elevation zone, slope, exposure, vegetation community type, age, structure, degree of naturalness, and the performance of protective management activities. Spruce and spruce–fir stand disturbances were associated with strong winds and bark beetle outbreaks. Artificial spruce stands were most often damaged (25% of cases) due to inadequate habitats that were susceptible to breaking and overturning by strong winds. The stands most frequently damaged were between 51 and 100 years old (36.2%), which also occupied the largest percentage of the TNP area and were often artificially planted spruce stands. Even though disturbances were more frequently detected for the strict protection area, the analysis of areas occupied by all forms of protection presented relatively more frequent disturbances in landscape and active management zones.
Future analysis could be developed by classifying disturbance agents and examining the dependence of the occurrence of particular factors causing forest disturbances on topographic and stand features, as well as management activities.
Supplementary Materials
The following are available online at https://www.mdpi.com/1999-4907/11/5/579/s1, Figure S1: Detected forest disturbances in the Tatrzański Park Narodowy (TNP) between 1984–2016, basemap: Landsat Operational Land Imager (OLI) image in 432 red, green, blue (RGB) composition, acquired in 31 August 2016. Figure S2: Area of forest disturbance in relation to the area of montane zones category (adapted from [42]). Figure S3: Area of forest disturbance in relation to the area of slopes category (adapted from [42]). Figure S4: Area of forest disturbance in relation to the area of exposure category (adapted from [42]). Figure S5: Area of forest disturbance in relation to the area of community category (A—artificial spruce stands, B—lower zone fir and spruce forests, C—upper zone Carpathian spruce, D—fertile beech and fir forests, E—upper zone limestone spruce, F—heavily thinned artificial spruce stands, G—mountain pine scrub, H—mountain alders, I—alpine sycamore and rowan thickets, J—lower zone fir spruce forest on peat, K—others; adapted from [42]). Figure S6: Area of forest disturbance in relation to the area of age structure category (adapted from [42]). Figure S7: Area of forest disturbance in relation to the area of age class category (adapted from [42]).Figure S8: Area of forest disturbance in relation to the area of degree of naturalness category (A—lower zone stands incompatible with the type of forest, B—lower zone stands partly consistent with the type of forest, C—natural stands of the upper zone, D—primary stands of the upper zone, E—lower zone stands close to natural, F—natural scrubs, G—others; adapted from [42]). Figure S9: Area of forest disturbance in relation to the area of management protection zones category (adapted from [42]).
Funding
This research received no external funding. The APC was funded by the Faculty of Geography and Regional Studies, University of Warsaw.
Acknowledgments
Author would like to thank Tatra National Park authorities, especially Marcin Bukowski for sharing vector layers for analyses and for his support, and Anna Kozłowska and Bogdan Zagajewski for their supervision of this work. Special thanks to my wife Adriana Marcinkowska-Ochtyra for her support. Author is also grateful to the editor and anonymous reviewers for their constructive comments and suggestions that helped to improve this manuscript.
Conflicts of Interest
The author declares no conflict of interest.
References
- Seidl, R.; Thom, D.; Kautz, M.; Martin-Benito, D.; Peltoniemi, M.; Vacchiano, G.; Wild, J.; Ascoli, D.; Petr, M.; Honkaniemi, J.; et al. Forest disturbances under climate change. Nat. Clim. Chang. 2017, 7, 395–402. [Google Scholar] [CrossRef] [Green Version]
- McDowell, N.G.; Coops, N.C.; Beck, P.S.A.; Chambers, J.Q.; Gangodagamage, C.; Hicke, J.A.; Huang, C.; Kennedy, R.; Krofcheck, D.J.; Litvak, M.; et al. Global satellite monitoring of climate-induced vegetation disturbances. Trends Plant Sci. 2015, 20, 114–123. [Google Scholar] [CrossRef] [Green Version]
- Kautz, M.; Meddens, A.J.H.; Hall, R.J.; Arneth, A. Biotic disturbances in Northern Hemisphere forests—A synthesis of recent data, uncertainties and implications for forest monitoring and modelling. Glob. Ecol. Biogeogr. 2017, 26, 533–552. [Google Scholar] [CrossRef]
- Bałazy, R.; Ciesielski, M.; Waraksa, P.; Zasada, M.; Zawiła-Niedźwiecki, T. Deforestation processes in the polish mountains in the context of terrain topography. Forests 2019, 10, 1027. [Google Scholar] [CrossRef] [Green Version]
- Kenderes, K.; Aszalós, R.; Ruff, J.; Barton, Z.; Standovár, T. Effects of topography and tree stand characteristics on susceptibility of forests to natural disturbances (ice and wind) in the Börzsöny Mountains (Hungary). Commun. Ecol. 2007, 8, 209–220. [Google Scholar] [CrossRef]
- Havašová, M.; Ferenčík, J.; Jakuš, R. Interactions between windthrow, bark beetles and forest management in the Tatra national parks. For. Ecol. Manag. 2017, 391, 349–361. [Google Scholar] [CrossRef]
- Bebi, P.; Seidl, R.; Motta, R.; Fuhr, M.; Firm, D.; Krumm, F.; Conedera, M.; Ginzler, C.; Wohlgemuth, T.; Kulakowski, D. Changes of forest cover and disturbance regimes in the mountain forests of the Alps. For. Ecol. Manag. 2017, 388, 43–56. [Google Scholar] [CrossRef] [Green Version]
- Kulakowski, D.; Veblen, T.T. Influences of fire history and topography on the pattern of a severe wind blowdown in a Colorado subalpine forest. J. Ecol. 2002, 90, 806–819. [Google Scholar] [CrossRef]
- Bragg, D.C.; Shelton, M.G.; Zeide, B. Impacts and management implications of ice storms on forests in the southern United States. For. Ecol. Manag. 2003, 186, 99–123. [Google Scholar] [CrossRef]
- Canham, C.D.; Papaik, M.J.; Latty, E.F. Interspecific variation in susceptibility to windthrow as a function of tree size and storm severity for northern temperate tree species. Can. J. For. Res. 2001, 31, 1–10. [Google Scholar] [CrossRef]
- Sommerfeld, A.; Senf, C.; Buma, B.; D’Amato, A.W.; Després, T.; Díaz-Hormazábal, I.; Fraver, S.; Frelich, L.E.; Gutiérrez, Á.G.; Hart, S.J.; et al. Patterns and drivers of recent disturbances across the temperate forest biome. Nat. Commun. 2018, 9, 1–9. [Google Scholar] [CrossRef] [PubMed]
- Rhoads, A.G.; Hamburg, S.P.; Fahey, T.J.; Siccama, T.G.; Hane, E.N.; Battles, J.; Cogbill, C.; Randall, J.; Wilson, G. Effects of an intense ice storm on the structure of a northern hardwood forest. Can. J. For. Res. 2002, 32, 1763–1775. [Google Scholar] [CrossRef] [Green Version]
- Marcinkowska-Ochtyra, A.; Jarocińska, A.; Bzdȩga, K.; Tokarska-Guzik, B. Classification of expansive grassland species in different growth stages based on hyperspectral and LiDAR data. Remote Sens. 2018, 10, 2019. [Google Scholar] [CrossRef] [Green Version]
- Marcinkowska-Ochtyra, A.; Zagajewski, B.; Ochtyra, A.; Jarocińska, A.; Wojtuń, B.; Rogass, C.; Mielke, C.; Lavender, S. Subalpine and alpine vegetation classification based on hyperspectral APEX and simulated EnMAP images. Int. J. Remote Sens. 2017, 38, 1839–1864. [Google Scholar] [CrossRef] [Green Version]
- Meigs, G.W.; Kennedy, R.E.; Cohen, W.B. A Landsat time series approach to characterize bark beetle and defoliator impacts on tree mortality and surface fuels in conifer forests. Remote Sens. Environ. 2011, 115, 3707–3718. [Google Scholar] [CrossRef]
- Kennedy, R.E.; Yang, Z.; Cohen, W.B. Detecting trends in forest disturbance and recovery using yearly Landsat time series: 1. LandTrendr—Temporal segmentation algorithms. Remote Sens. Environ. 2010, 114, 2897–2910. [Google Scholar] [CrossRef]
- Cohen, W.B.; Healey, S.P.; Yang, Z.; Stehman, S.V.; Brewer, C.K.; Brooks, E.B.; Gorelick, N.; Huang, C.; Hughes, M.J.; Kennedy, R.E.; et al. How Similar Are Forest Disturbance Maps Derived from Different Landsat Time Series Algorithms? Forests 2017, 8, 98. [Google Scholar] [CrossRef]
- Wulder, M.A.; Loveland, T.R.; Roy, D.P.; Crawford, C.J.; Masek, J.G.; Woodcock, C.E.; Allen, R.G.; Anderson, M.C.; Belward, A.S.; Cohen, W.B.; et al. Current status of Landsat program, science, and applications. Remote Sens. Environ. 2019, 225, 127–147. [Google Scholar] [CrossRef]
- Sproull, G.J.; Bukowski, M.; Mcnutt, N.; Zwijacz-Kozica, T.; Szwagrzyk, J. Landscape-Level Spruce Mortality Patterns and Topographic Forecasters of Bark Beetle Outbreaks in Managed and Unmanaged Forests of the Tatra Mountains. Polish J. Ecol. 2017, 65, 24–37. [Google Scholar] [CrossRef]
- Osińska-Skotak, K.; Bakuła, K.; Jełowicki, Ł.; Podkowa, A. Using canopy height model obtained with dense image matching of archival photogrammetric datasets in area analysis of secondary Su. Remote Sens. 2019, 11, 2182. [Google Scholar] [CrossRef] [Green Version]
- Osińska-Skotak, K.; Radecka, A.; Piórkowski, H.; Michalska-Hejduk, D.; Kopeć, D.; Tokarska-Guzik, B.; Ostrowski, W.; Kania, A.; Niedzielko, J. Mapping Succession in Non-Forest Habitats by Means of Remote Sensing: Is the Data Acquisition Time Critical for Species Discrimination? Remote Sens. 2019, 11, 2629. [Google Scholar] [CrossRef] [Green Version]
- Marcinkowska-Ochtyra, A.; Gryguc, K.; Ochtyra, A.; Kopeć, D.; Jarocińska, A.; Sławik, Ł. Multitemporal hyperspectral data fusion with topographic indices’improving classification of natura 2000 grassland habitats. Remote Sens. 2019, 11, 2264. [Google Scholar] [CrossRef] [Green Version]
- Rennó, C.D.; Nobre, A.D.; Cuartas, L.A.; Soares, J.V.; Hodnett, M.G.; Tomasella, J.; Waterloo, M.J. HAND, a new terrain descriptor using SRTM-DEM: Mapping terra-firme rainforest environments in Amazonia. Remote Sens. Environ. 2008, 112, 3469–3481. [Google Scholar] [CrossRef]
- Simard, M.; Zhang, K.; Rivera-Monroy, V.H.; Ross, M.S.; Ruiz, P.L.; Castañeda-Moya, E.; Twilley, R.R.; Rodriguez, E. Mapping height and biomass of mangrove forests in Everglades National Park with SRTM elevation data. Photogramm. Eng. Remote Sens. 2006, 72, 299–311. [Google Scholar] [CrossRef]
- Marcinkowska-Ochtyra, A.; Zagajewski, B.; Raczko, E.; Ochtyra, A.; Jarocińska, A. Classification of high-mountain vegetation communities within a diverse Giant Mountains ecosystem using airborne APEX hyperspectral imagery. Remote Sens. 2018, 10, 570. [Google Scholar] [CrossRef] [Green Version]
- Kupková, L.; Červená, L.; Suchá, R.; Jakešová, L.; Zagajewski, B.; Březina, S.; Albrechtová, J. Classification of tundra vegetation in the Krkonoše Mts. National park using APEX, AISA dual and sentinel-2A data. Eur. J. Remote Sens. 2017, 50, 29–46. [Google Scholar] [CrossRef]
- Kycko, M.; Zagajewski, B.; Lavender, S.; Dabija, A. In situ hyperspectral remote sensing for monitoring of alpine trampled and recultivated species. Remote Sens. 2019, 11, 1296. [Google Scholar] [CrossRef] [Green Version]
- Kycko, M.; Zagajewski, B.; Lavender, S.; Romanowska, E.; Zwijacz-Kozica, M. The impact of tourist traffic on the condition and cell structures of alpine swards. Remote Sens. 2018, 10, 220. [Google Scholar] [CrossRef] [Green Version]
- Zagajewski, B. Classification of High-Mountain Plant Communities Using Artificial Neural Nets and Hyperspectral Data. In 2nd Workshop on Hyperspectral Image and Signal Processing: Evolution in Remote Sensing, WHISPERS 2010—Workshop Program; IEEE: Reykjavik, Iceland, 2010. [Google Scholar]
- Bielecka, E. Photointerpretation survey of changes in the range of the Tatra subalpine forests. Misc. Geogr. 1986, 2, 125–132. [Google Scholar] [CrossRef] [Green Version]
- Bielecka, E.; Fedorowicz-Jackowski, W.; Witkowska, E. Sequential monitoring of Tatra subalpine forests on the basis of cartographic and remotely-sensed data. Conf. Pap. Polish Acad. Sci. Inst. Geogr. Spat. Organ. 1995. [Google Scholar]
- Fedorowicz-Jackowski, W. Ten Years After—1992–2002. Change Detection of Tatra Subalpine Forests. Presented at the Environmount Conference on GIS and RS in Mountain Environmment Research Papers, Zakopane, Poland, 19–23 September 2002. [Google Scholar]
- Weintrit, B.; Pluto-Kossakowska, J. Multi-Temporal Analysis of Forestation Changes in Tatra National Park Using SPOT Images. In Proceedings of the EARSeL 34th Symposium Proceedings, Warsaw, Poland, 16–20 June 2014. [Google Scholar]
- Ochtyra, A.; Zagajewski, B.; Kozłowska, A.; Jarocińska, A. Assessment of the condition of forests in the Tatra National Park using decision tree mothod and multispectral Landsat TM satellite images. Sylwan 2016, 160, 256–264. [Google Scholar]
- Jakuš, R.; Grodzki, W.; Jezik, M.; Jachym, M. Definition of spatial patterns of bark beetle Ips typographus (L.) Outbreak spreading in tatra mountains (Central Europe), Using GIS. Ecol. Surv. Manag. For. Insects 2003, 1–5, 25–32. [Google Scholar]
- Havašová, M.; Bucha, T.; Ferenčík, J.; Jakuš, R. Applicability of a vegetation indices-based method to map bark beetle outbreaks in the High Tatra Mountains. Ann. For. Res. 2015, 58, 295–310. [Google Scholar] [CrossRef]
- Oeser, J.; Pflugmacher, D.; Senf, C.; Heurich, M.; Hostert, P. Using intra-annual Landsat time series for attributing forest disturbance agents in Central Europe. Forests 2017, 8, 251. [Google Scholar] [CrossRef]
- Grodzki, W.; Guzik, M. Wiatro-i Śniegołomy Oraz Gradacje Kornika Drukarza w Tatrzańskim Parku Narodowym na Przestrzeni Ostatnich 100 lat. Próba Charakterystyki Przestrzennej. In Długookresowe Zmiany w Przyrodzie i Użytkowaniu TPN; Wydawnictwa Tatrzańskiego Parku Narodowego: Zakopane, Poland, 2009; pp. 33–46. [Google Scholar]
- Richter, R.; Schläpfer, D. Atmospheric/Topographic Correction for Satellite Imagery. Aerospace 2011, 2011, 565. [Google Scholar]
- ENVI User’s Guide. 2002.
- Hardisky, M.A.; Klemas, V.; Smart, R.M. The influence of soil salinity, growth form, and leaf moisture on the spectral radiance of Spartina alterniflora canopies. Photogramm. Eng. Remote Sens. 1983, 49, 77–83. [Google Scholar]
- Ochtyra, A. Assessment of Remote Sensing Usefulness for Vegetation Disturbance Monitoring of Tatra Mountains. Ph.D. Thesis, University of Warsaw, Warsaw, Poland, 9 September 2019. [Google Scholar]
- Hais, M.; Jonášová, M.; Langhammer, J.; Kučera, T. Comparison of two types of forest disturbance using multitemporal Landsat TM/ETM+ imagery and field vegetation data. Remote Sens. Environ. 2009, 113, 835–845. [Google Scholar] [CrossRef]
- Frazier, R.J.; Coops, N.C.; Wulder, M.A. Boreal Shield forest disturbance and recovery trends using Landsat time series. Remote Sens. Environ. 2015, 70, 317–327. [Google Scholar] [CrossRef]
- Kozłowska, A. Analiza Trwałości Charakterystyki Fitosocjologicznej Borów Świerkowych Tatr w Ciągu 80 lat. In Geobotaniczne Rozpoznanie Tendencji Rozwojowych Zbiorowisk Leśnych w Wybranych Regionach Polski, Monografie, 8th ed.; Matuszkiewicz, J.M., Ed.; PAN IgiPZ: Warsaw, Poland; pp. 410–433.
- Grodzki, W.; Turcáni, M.; Jakuš, R.; Hlásny, T.; Rasi, R.; McManus, M.L. Bark beetles in the Tatra Mountains. International research 1998–2005—An overview. Folia For. Pol. Ser. A For. 2010, 52, 114–130. [Google Scholar]
- Grodzki, W.; Gąsienica-Fronek, W. Występowanie kornika drukarza Ips typographus (L.) (Coleoptera, Curculionidae, Scolytinae) po wiatrołomie z 2013 roku w Dolinie Kościeliskiej w Tatrzańskim Parku Narodowym. Leśn. Pr. Badaw. 2017, 78, 113–119. [Google Scholar]
Figure 1.
Study area location in Central Europe: (a) base map showing the administrative boundaries; (b) Tatra Mountains and forests within the Tatrzański Park Narodowy (TNP) border, showing a Landsat Operational Land Imager (OLI) image in 432 red, green, blue (RGB) composition, acquired on 31 August 2016. (© EuroGeographics for the administrative boundaries.)

Figure 2.
Frequency of forest disturbance in relation to the montane zone (adapted from [42]).
Figure 2.
Frequency of forest disturbance in relation to the montane zone (adapted from [42]).

Figure 3.
Frequency of forest disturbance in relation to slope (adapted from [42]).
Figure 3.
Frequency of forest disturbance in relation to slope (adapted from [42]).

Figure 4.
Frequency of forest disturbance in relation to exposure (adapted from [42]).
Figure 4.
Frequency of forest disturbance in relation to exposure (adapted from [42]).

Figure 5.
Frequency of forest disturbance in relation to the community. Note: A—artificial spruce stands; B—lower zone fir and spruce forests; C—upper zone Carpathian spruce; D—fertile beech and fir forests; E—upper zone limestone spruce; F—heavily thinned artificial spruce stands; G—mountain pine scrub; H—mountain alders; I—alpine sycamore and rowan thickets; J—lower zone fir spruce forest on peat; K—others; adapted from [42].

Figure 6.
Frequency of forest disturbance in relation to age structure (adapted from [42]).
Figure 6.
Frequency of forest disturbance in relation to age structure (adapted from [42]).

Figure 7.
Frequency of forest disturbance in relation to age class (adapted from [42]).
Figure 7.
Frequency of forest disturbance in relation to age class (adapted from [42]).

Figure 8.
Frequency of forest disturbance in relation to the degree of naturalness. Note: A—lower zone stands incompatible with the type of forest; B—lower zone stands partly consistent with the type of forest; C—natural stands of the upper zone; D—primary stands of the upper zone; E—lower zone stands close to natural; F—natural scrubs; G—others; adapted from [42].

Figure 9.
Frequency of forest disturbance in relation to management protection zone (adapted from [42]).
Figure 9.
Frequency of forest disturbance in relation to management protection zone (adapted from [42]).

© 2020 by the author. Licensee MDPI, Basel, Switzerland. This article is an open access article distributed under the terms and conditions of the Creative Commons Attribution (CC BY) license (http://creativecommons.org/licenses/by/4.0/).
Share and Cite
MDPI and ACS Style
Ochtyra, A. Forest Disturbances in Polish Tatra Mountains for 1985–2016 in Relation to Topography, Stand Features, and Protection Zone. Forests 2020, 11, 579. https://doi.org/10.3390/f11050579
AMA Style
Ochtyra A. Forest Disturbances in Polish Tatra Mountains for 1985–2016 in Relation to Topography, Stand Features, and Protection Zone. Forests. 2020; 11(5):579. https://doi.org/10.3390/f11050579
Chicago/Turabian StyleOchtyra, Adrian. 2020. "Forest Disturbances in Polish Tatra Mountains for 1985–2016 in Relation to Topography, Stand Features, and Protection Zone" Forests 11, no. 5: 579. https://doi.org/10.3390/f11050579
Note that from the first issue of 2016, this journal uses article numbers instead of page numbers. See further details here.