High Precision Altimeter Demonstrates Simplification and Depression of Microtopography on Seismic Lines in Treed Peatlands


Applied Conservation Ecology (ACE) Lab, Department of Renewable Resources, Faculty of Agriculture, Life, and Environmental Sciences, University of Alberta, Edmonton, AB T6G 2H1, Canada
*
Author to whom correspondence should be addressed.
Forests 2019, 10(4), 295; https://doi.org/10.3390/f10040295
Submission received: 27 February 2019
/
Revised: 21 March 2019
/
Accepted: 26 March 2019
/
Published: 28 March 2019
(This article belongs to the Special Issue Forest Biodiversity Conservation with Remote Sensing Techniques)
Abstract
:Seismic lines are linear forest clearings used for oil and gas exploration. The mechanical opening of forests for these narrow (3–10 meter) lines is believed to simplify microtopographic complexity and depress local topographic elevation. In treed peatlands, simplified microtopography limits tree regeneration by removing favourable microsites (hummocks) for tree recruitment and increasing the occurrence of flooding that reduces survival of tree seedlings. Little, however, has been done to quantify the microtopography of seismic lines and specifically the degree of alteration. Here, we measured microtopography at 102 treed peatland sites in northeast Alberta, Canada using a high precision hydrostatic altimeter (ZIPLEVEL PRO-2000) that measured variation in local topography of seismic lines and adjacent paired undisturbed forests. Sites were separated into four peatland ecosite types and the presence or absence of recent (<22 years) wildfires. Paired t-tests were used to compare microtopographic complexity and depression depth of seismic lines compared with adjacent forests. Microtopographic complexity on seismic lines was simplified by 20% compared to adjacent stands with no significant change between recently burned and unburned sites, nor between ecosites. Not only were seismic lines simplified, but they were also depressed in elevation by an average of 8 cm compared to adjacent forests with some minor variation between ecosites observed, but again not with recent wildfires. Thus, simplification of microtopographic complexity and the creation of depressions can persist decades after initial disturbance with some differences between peatland ecosites, implying the need for ecosite-specific restoration of topographic complexity. The importance of microtopography for tree regeneration on seismic lines remains an important question for reforestation of these disturbances and thus long-term recovery of habitat for species dependent on undisturbed peatlands, including woodland caribou.
Keywords:
microtopography; seismic line; boreal forest; restoration; fire; disturbance; peatland; hummock; hollow; woodland caribou1. Introduction
With major increases in the global population over the last two centuries [1] there is an increasing demand for natural resources. However, exploration and extraction of these resources alters the environment and thus affects ecological processes, function, and biodiversity. In Canada’s boreal forest, one major source of disturbance is from energy exploration and extraction, particularly in the oil sands region of northeast Alberta. Boreal forests become fragmented during exploration and extraction due to roads, pipelines, transmission lines, well pads, seismic lines, and other associated infrastructure [2]. However, the most common disturbance are seismic lines [2,3]. These relatively narrow (3–10 m) linear disturbances are created by machinery to remove trees via mulching and/or bulldozing, thus allowing access to remote areas for mapping bitumen depth and volume. Not only do seismic lines persist, they are also quite abundant with densities as high as 40 km/km² (i.e., 50 m spacing in a grid of lines), with conservative estimates over larger areas of the region averaging 1.5 km/km² [2]. Although these disturbances are not permanent features, representing instead narrow forest clearings where aboveground woody vegetation is removed, they still alter the physical characteristics of the landscape, as well as ecosystem processes, including fire [4,5,6].
When seismic lines were created, the assumption was that due to their relatively narrow nature, they would recover naturally and quickly, but this has not been the case [3,7]. Forest regeneration and recovery rates in these disturbed areas are often poor, with only 8.2% of seismic lines recovering to woody vegetation after 35 years, and greater than 60% persisting in a cleared state [3]. Lee and Boutin [3] suggest recovery time for seismic lines would be ~112 years based on current median recovery rates. As this number is based on seismic lines that have not been transitioned to transportation corridors (roads, pipelines, power lines, etc.), the harsh reality is that many will persist, in one form or another, much longer. The “pulse of growth” in industrial development that accompanied the initial establishment of seismic lines is further exacerbated by the increasing use of seismic lines as transportation corridors, promoting seismic line persistence and leaving little chance for recovery [2]. Northeast Alberta is located in the physiographic region of the northern Alberta lowlands [8] that are dominated by peatlands composed of poor fens, rich fens, and bogs [8], which overlap with prime locations for oil and gas exploration.
Inadequate forest regeneration of seismic lines has implications for abiotic and biotic components of boreal ecosystems. In addition to altering forest structure by creating edge effects [9,10], vegetative loss on lines alters successional processes that have been shown to promote more seral shrub species [11]. Vegetation removal also alters forest hydrology by reducing water uptake and modifying soil structure and development [12,13]. Although peatlands are slow growing, they are carbon dense and thus important for carbon sequestration and understanding the effects of disturbance on greenhouse gas emissions [14]. Seismic lines also influence the abundance and behaviour of wildlife species, including, among others, black bears (Ursus americanus) [15], grizzly bears (Ursus arctos) [16], pine marten (Martes americana) [17], ovenbirds (Seiurus aurocapilla) [18], and butterflies [19]. The most contentious wildlife issue is that of woodland caribou (Rangifer tarandus caribou), a species at risk [20]. Studies of woodland caribou movement show that caribou avoid seismic lines during certain parts of the year [21], potentially resulting in smaller range sizes or limited resources. Seismic lines also act as corridors for wolves, which lead to increases in encounters with woodland caribou, ultimately resulting in lower survival of woodland caribou [22,23]. Changes in habitat and warmer winters have also increased white-tailed deer populations, further supporting wolf populations, and thus predation on woodland caribou [24]. Forest fragmentation associated with seismic lines has been listed as a threat to endangered woodland caribou [25], and thus rapid recovery of forest structure on these disturbances is a conservation priority. There are currently no regulatory requirements for restoration, but public pressure is mounting with guidelines now being developed to create standards for restoration and monitoring of recovery.
The areas commonly associated with persistent seismic lines in Alberta are the peatland forests. The wetter, slower growing ecosites (fens and bogs) are organic wetlands whose slower rate of succession is affected by high water tables [26]. Bogs are acidic, mostly rainwater fed, with little to no groundwater flow and at least 40 cm of peat as organic soil [8]. These sites are associated with acidic-tolerating vegetation (i.e. Ericaceae) and black spruce trees (Picea mariana (Mill.) B.S.P.) [8]. Fens are also defined as having organic soils with at least a 40 cm layer of peat, but with more water-adapted vegetation due to greater water flow, generally from sub-surface water [8]. Both bogs and fens are high in carbon and therefore important in terms of carbon sequestration.
One aspect that is thought to affect tree recovery on seismic lines is changes in microtopography, yet microtopography is seldom measured, leaving restoration efforts of these sites based largely on anecdotal assessments. Microtopography can be represented by the elevational hummock–hollow patterns typical in peatlands. A reduction of microtopographic complexity on seismic lines reduces tree regeneration by eliminating microsites for seedling establishment [3,11,27,28]. Patterns of tree recovery on seismic lines are related to the overall moisture regime, with mainly xeric or hydric locations having reduced or even arrested succession [7]. Microtopographic complexity is positively related to forest regeneration in fens in northern Alberta for both untreated disturbances [2], as well as sites with artificial mounding [2,11]. Microtopographic complexity reduces the severity of flooding, which negatively affects tree seedling establishment and survival, thus increasing recovery time post-disturbance [27].
Wildfires are thought to affect microtopography in treed peatlands, but most studies have focused on bogs [29], with limited information on fens. Post-fire microtopography in bogs can increase over longer periods due to greater depth of burns in hollows and faster rates of growth on hummocks [29], although more severe wildfires can reduce hummock structure [30]. Wildfires may also reduce available moisture in seismic lines in wetter ecosites such as fens where already stagnant water is likely exacerbated by the compaction or removal of soils (depression) during seismic line construction. A reduction in moisture post-fire might return seismic lines to a drier state, allowing for less water-adapted tree seedlings to re-vegetate. Quantifying the effects of fire and type of treed peatland (ecosite) on microtopographic complexity and depression levels may help us better understand the factors associated with seismic line re-forestation (restoration) thereby guiding predictions of recovery rates and informing restoration treatments, including use of artificial mounding in sites where it would be most beneficial [11].
Quantifying microtopography poses many challenges. Some studies focus on comparing the height differences between a few hollows to their neighboring hummocks, while others extract large monoliths of peat [31] or use depth to water table as a reference. However, this can be complicated, costly, and temporally variable since water table fluctuates seasonally and yearly [29,32]. Newer studies have relied on laser leveling [28,29], but this can be impractical in a larger forested setting. Here, we tested a relatively new technology that measures minute (sub-centimeter) elevational changes from a reference starting point. Hydrostatic altimeters measure the displacement of liquid within a tube that is connected to two devices designed to quantify changes in elevation when one part of the device is raised or lowered. Hydrostatic altimeters thus use gravity to measure fine scale changes in elevation, and are now sometimes used in construction as a replacement for levelers. This technique previously has had limited application elsewhere, but the newest technology offers highly accurate measures. Here, we used a high-precision hydrostatic altimeter (accuracy of 0.127 cm), the ZIPLEVEL PRO-2000, as a near-remote sensing technique to evaluate the usefulness of this type of technology in quantifying fine-scale changes in microtopography.
The objective of this study is to quantify microtopography on seismic lines and adjacent control forest settings in treed peatlands of northeast Alberta, where these linear disturbances are common and considered a conservation concern. Specifically, we hypothesized that, (1) seismic lines will be depressed in elevation compared to adjacent forest edges due to initial and residual compaction/removal of peat, soils, and hummocks by equipment; (2) seismic lines will have a simplified microtopography compared to adjacent natural stands due to mechanical disturbance and reduction of hummocks during clearing; (3) microtopography of seismic lines will differ by ecosite (rich fens, poor fens, bogs, and poor mesic) considering diverse moisture and nutrient regimes; and (4) recent fires will increase microtopography as it has been previously shown for bogs.
2. Materials and Methods
2.1. Study Area
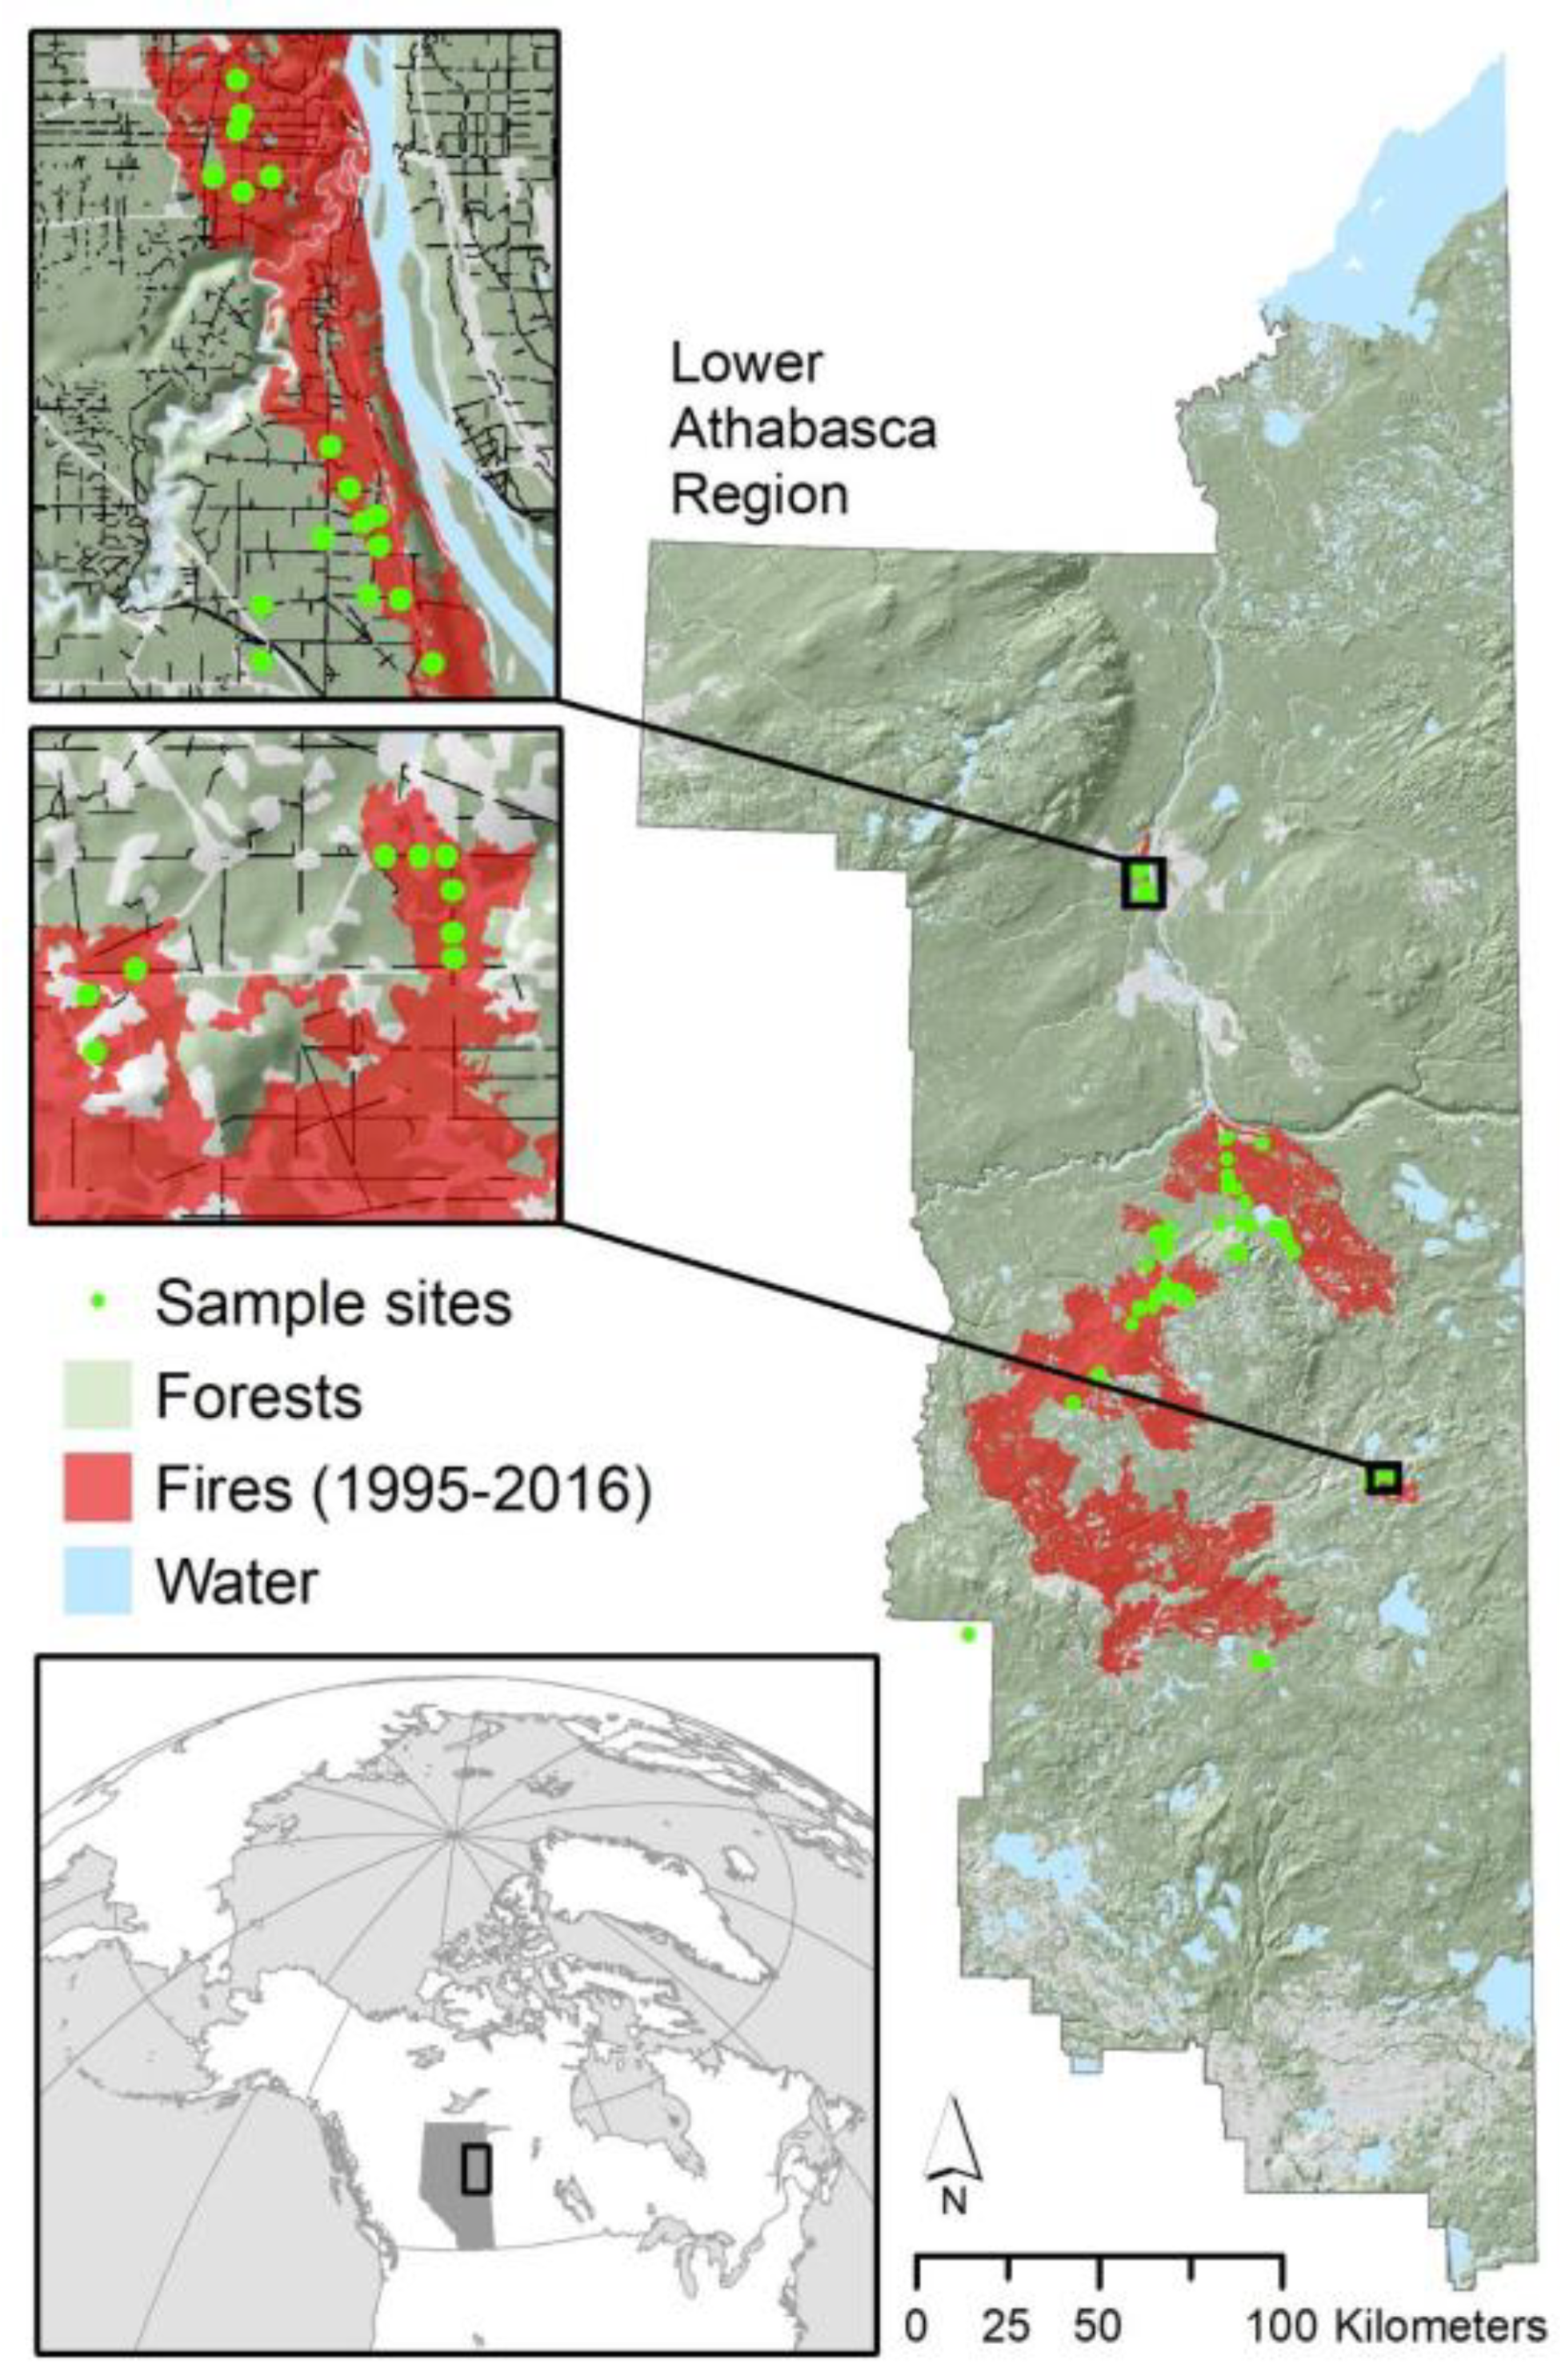
The study area is located in northeastern Alberta, Canada centered around the municipality of Fort McMurray (Figure 1) where treed peatlands are common. Elevation ranges from 279 to 741 m. Sites consisted of treed peatlands across four ecosite types (poor mesic, poor fens, rich fens, and bogs; Figure 2) with ecosite classification defined by the Alberta Biodiversity Monitoring Institute Terrestrial Field Data Collection Protocols using dominant vegetative community (or that of pre-disturbance), soil characteristics, soil nutrients, and moisture [33]. Dominant tree species depended on ecosite type and conditions, but typically black spruce was the dominant species in poor mesic, bog, poor fens, and occasionally in rich fens; while tamarack (Larix laricina (Du Roi) K. Koch) was usually the dominant species in rich fens and co-dominant in poor fens. In some circumstances, aspen (Populus tremuloides Michx.) and/or jack pine (Pinus banksiana Lamb.) were present in poor mesic sites, but normally were not dominant. Sample sites included mature peatland forests, as well as areas of five separate recent wildfires occurring within the region including the Mariana Lake Fire (1995), a fire in 1999 and in 2009, the Richardson Fire of 2011, and the Horse River (Fort McMurray) Fire of 2016 (Figure 1).
2.2. Site Selection
Field data were collected between May 18 and July 25, 2017. Sample sites (102 sites; 204 paired plots) were selected (stratified) across a range of five fire burn years (1995, 1999, 2009, 2011, and 2016) (Figure 1) and from low to high fire severity. Of the 102 sites and 204 plots sampled, 42 sites (84 plots) were unburned sites, 12 sites were sampled from the 1995 fire, 10 from the 1999 fire, 14 from the 2009 fire, 12 from the 2011 fire, and 12 from the 2016 fire (Table 1). Fire severity was defined using percent overstory tree mortality with sites used only when fire severity was similar for the seismic line and adjacent forest. We also examined ecosite characteristics as they may create differences in microtopography. Ecosite types included: 15 bogs (6 unburned and 9 burned), 46 poor fens (19 unburned and 27 burned), 18 rich fens (8 unburned and 10 burned), and 23 poor mesic sites (9 unburned and 14 burned) (Table 1). This composition of ecosites reflects the distribution found in northeastern Alberta with, for instance, bogs being less common. All plots were at least 60 meters from other forest types, forest edges, or other seismic lines. Sites were at least 400 m apart, to avoid pseudo-replication, with a preference to have sites on separate seismic lines and only on the same line if in a different ecosite. Transects were 20 m in length down the center of the seismic line with an adjacent stand transect running parallel, 25 meters into the forest (randomized for the left or right side of the seismic line).
2.3. Field Measures of Microtopography
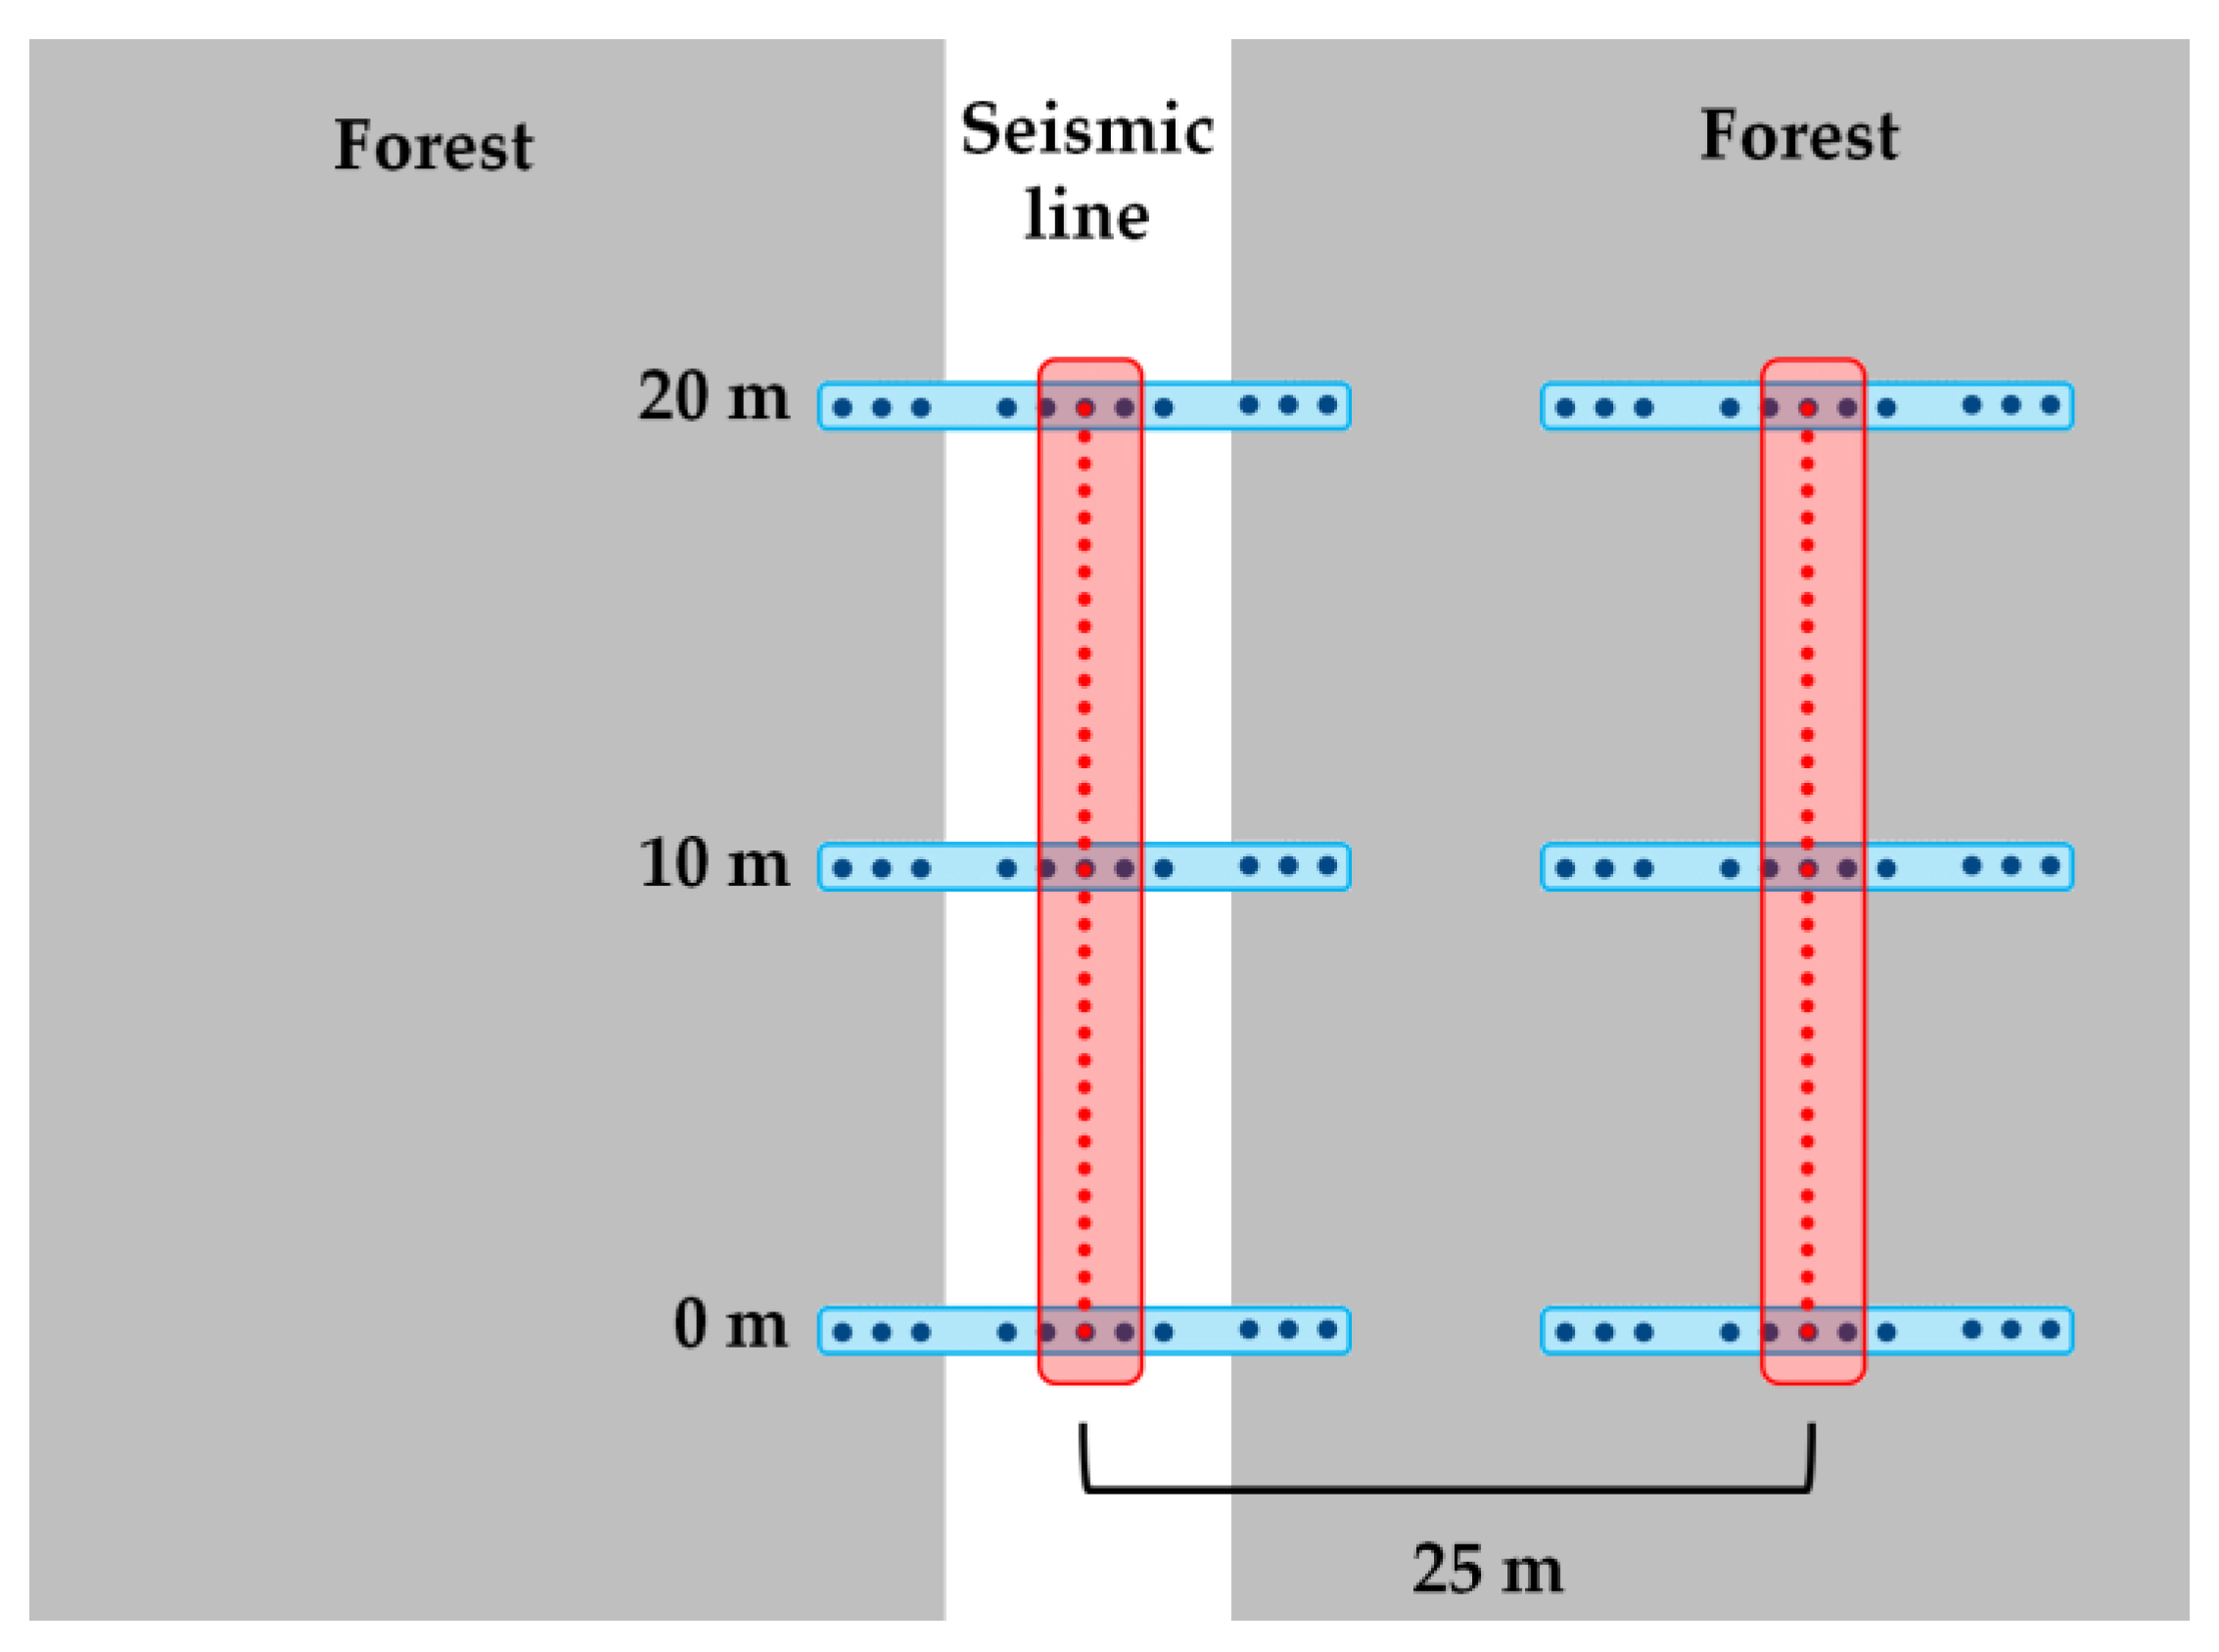
Microtopographic complexity and depression depth were measured using a ZIPLEVEL PRO-2000 (Technidea® Corporation, Escondido, CA, USA) High Precision Hydrostatic Altimeter (0.127 cm accuracy). Seismic line depression was assessed via perpendicular measures across the seismic line obtained at 0, 10, and 20 m points of the transect (Figure 3). Eleven points were taken at each distance with the adjacent measurements being 0.25, 0.5, and 0.75 m from the outer edge of the seismic line into both left and right sides of the adjacent forests (edges), with five points measured in the middle of the seismic line (seismic line width varied from 3 to 14 m) at increments of 0.25 m (Figure 3). Depression depth was calculated as the average difference between the central points to the forest edges. Microtopographic complexity was measured along the center 20 m of each seismic line and its paired adjacent forest control (25 m from seismic line) at intervals of 0.25 m (n = 81 observations per transect). Points were measured as elevations or depressions relative to an initially tared zero value. These data were later converted to mean absolute residual deviation of microtopography as a measure of variation (higher values meaning more complexity and vice versa). This method accounts for natural slopes in terrain along the seismic line that would not be accounted for with mean absolute deviation measures.
2.4. Data Analysis
Depression depth of seismic lines were assessed as the average difference between points on the seismic line and those at forest edges. Differences in microtopographic complexity were calculated using the mean absolute residual deviation of microtopography. Differences in microtopography were graphed by ecosite and presence of fire with paired t-tests used to assess significance in differences between the depth of seismic line depression and microtopographic complexity from that of seismic lines and adjacent forest stands. All analyses were performed in STATA/SE version 15.1 (StataCorp, 2017, College Station, TX, USA) [34].
3. Results
3.1. Seismic Line Depression
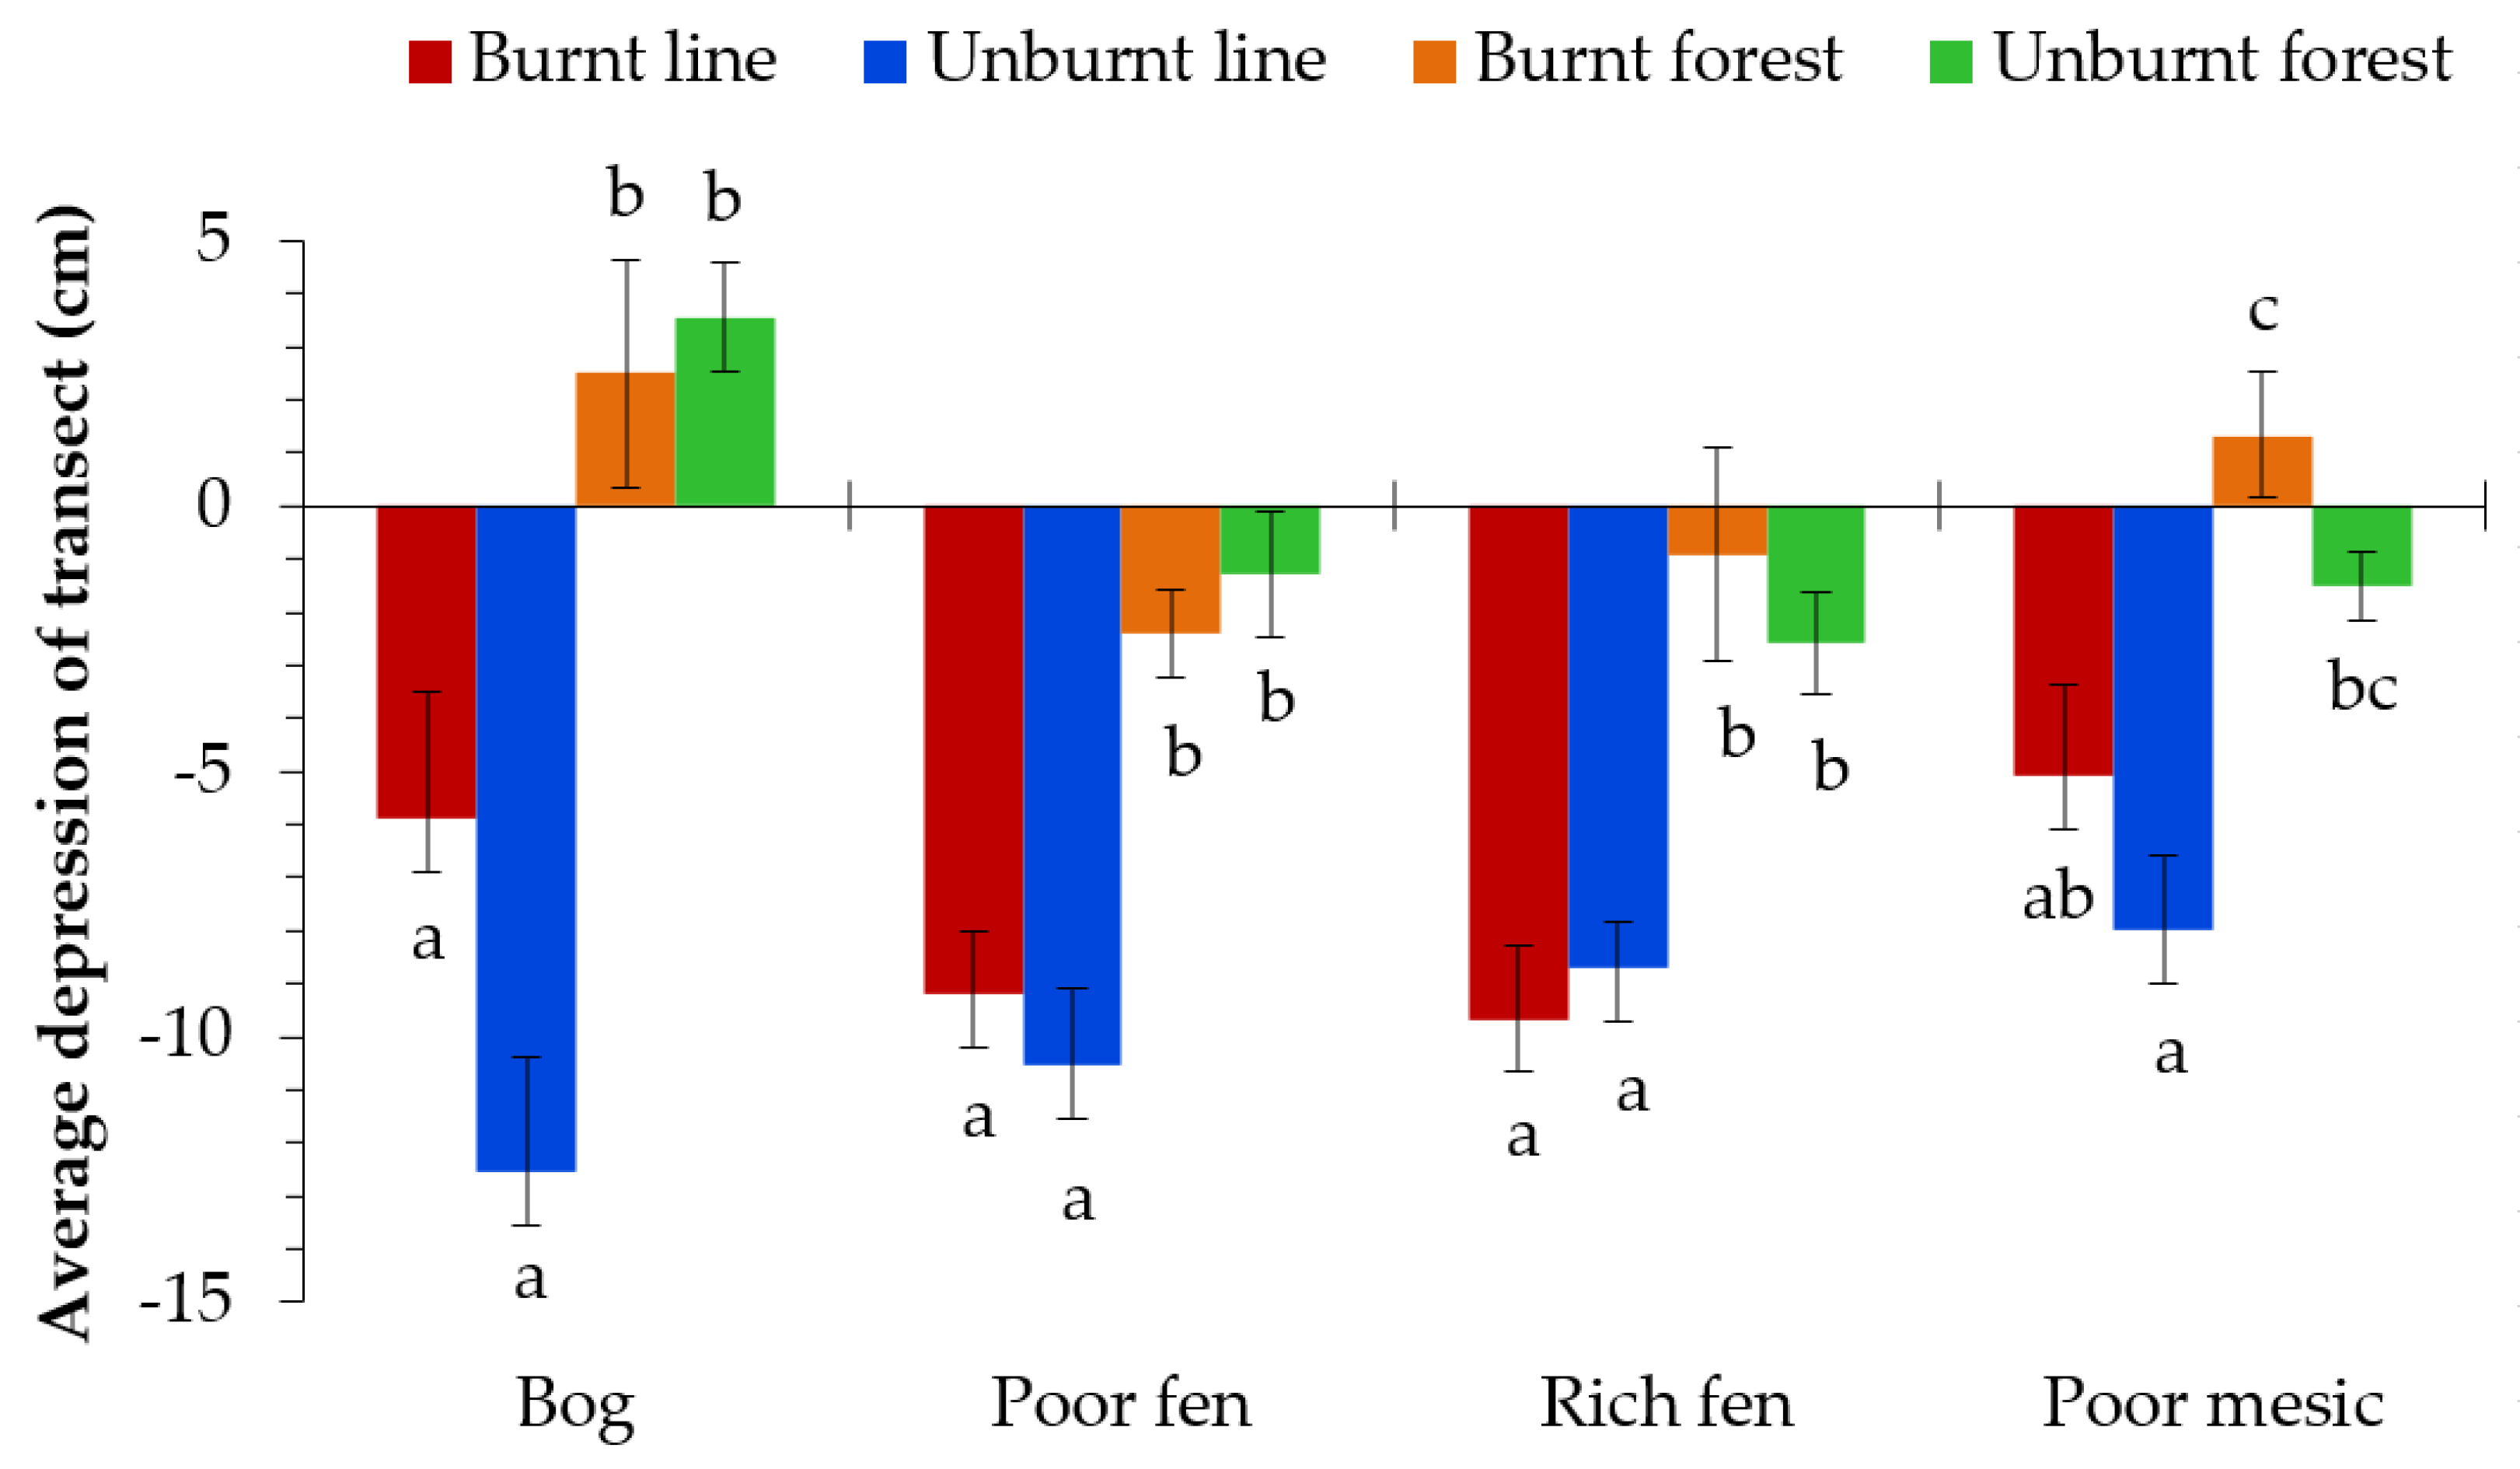
Seismic lines were depressed in elevation by 8.42 cm when compared to adjacent forests when all ecosite types were assessed together (t = 9.093, df (degrees of freedom) = 202, p < 0.001, Table 2). When assessed by ecosite type, seismic lines of all bogs (t = 3.838, df = 28, p < 0.001,), poor fens (t = 5.730, df = 90, p < 0.001), rich fens (t = 7.050, df = 34, p < 0.001), and poor mesic (t = 3.174, df = 44, p = 0.001) ecosite types were significantly depressed compared to forest edges (Figure 4). By further separating data by the presence of fire, it was apparent that the presence of fire alone had no effect on changes in microtopography (Figure 4). Measures of microtopography demonstrated significant differences in seismic line depression depths between poor fens and those of bogs and poor mesic forests.
3.2. Seismic Line Simplification
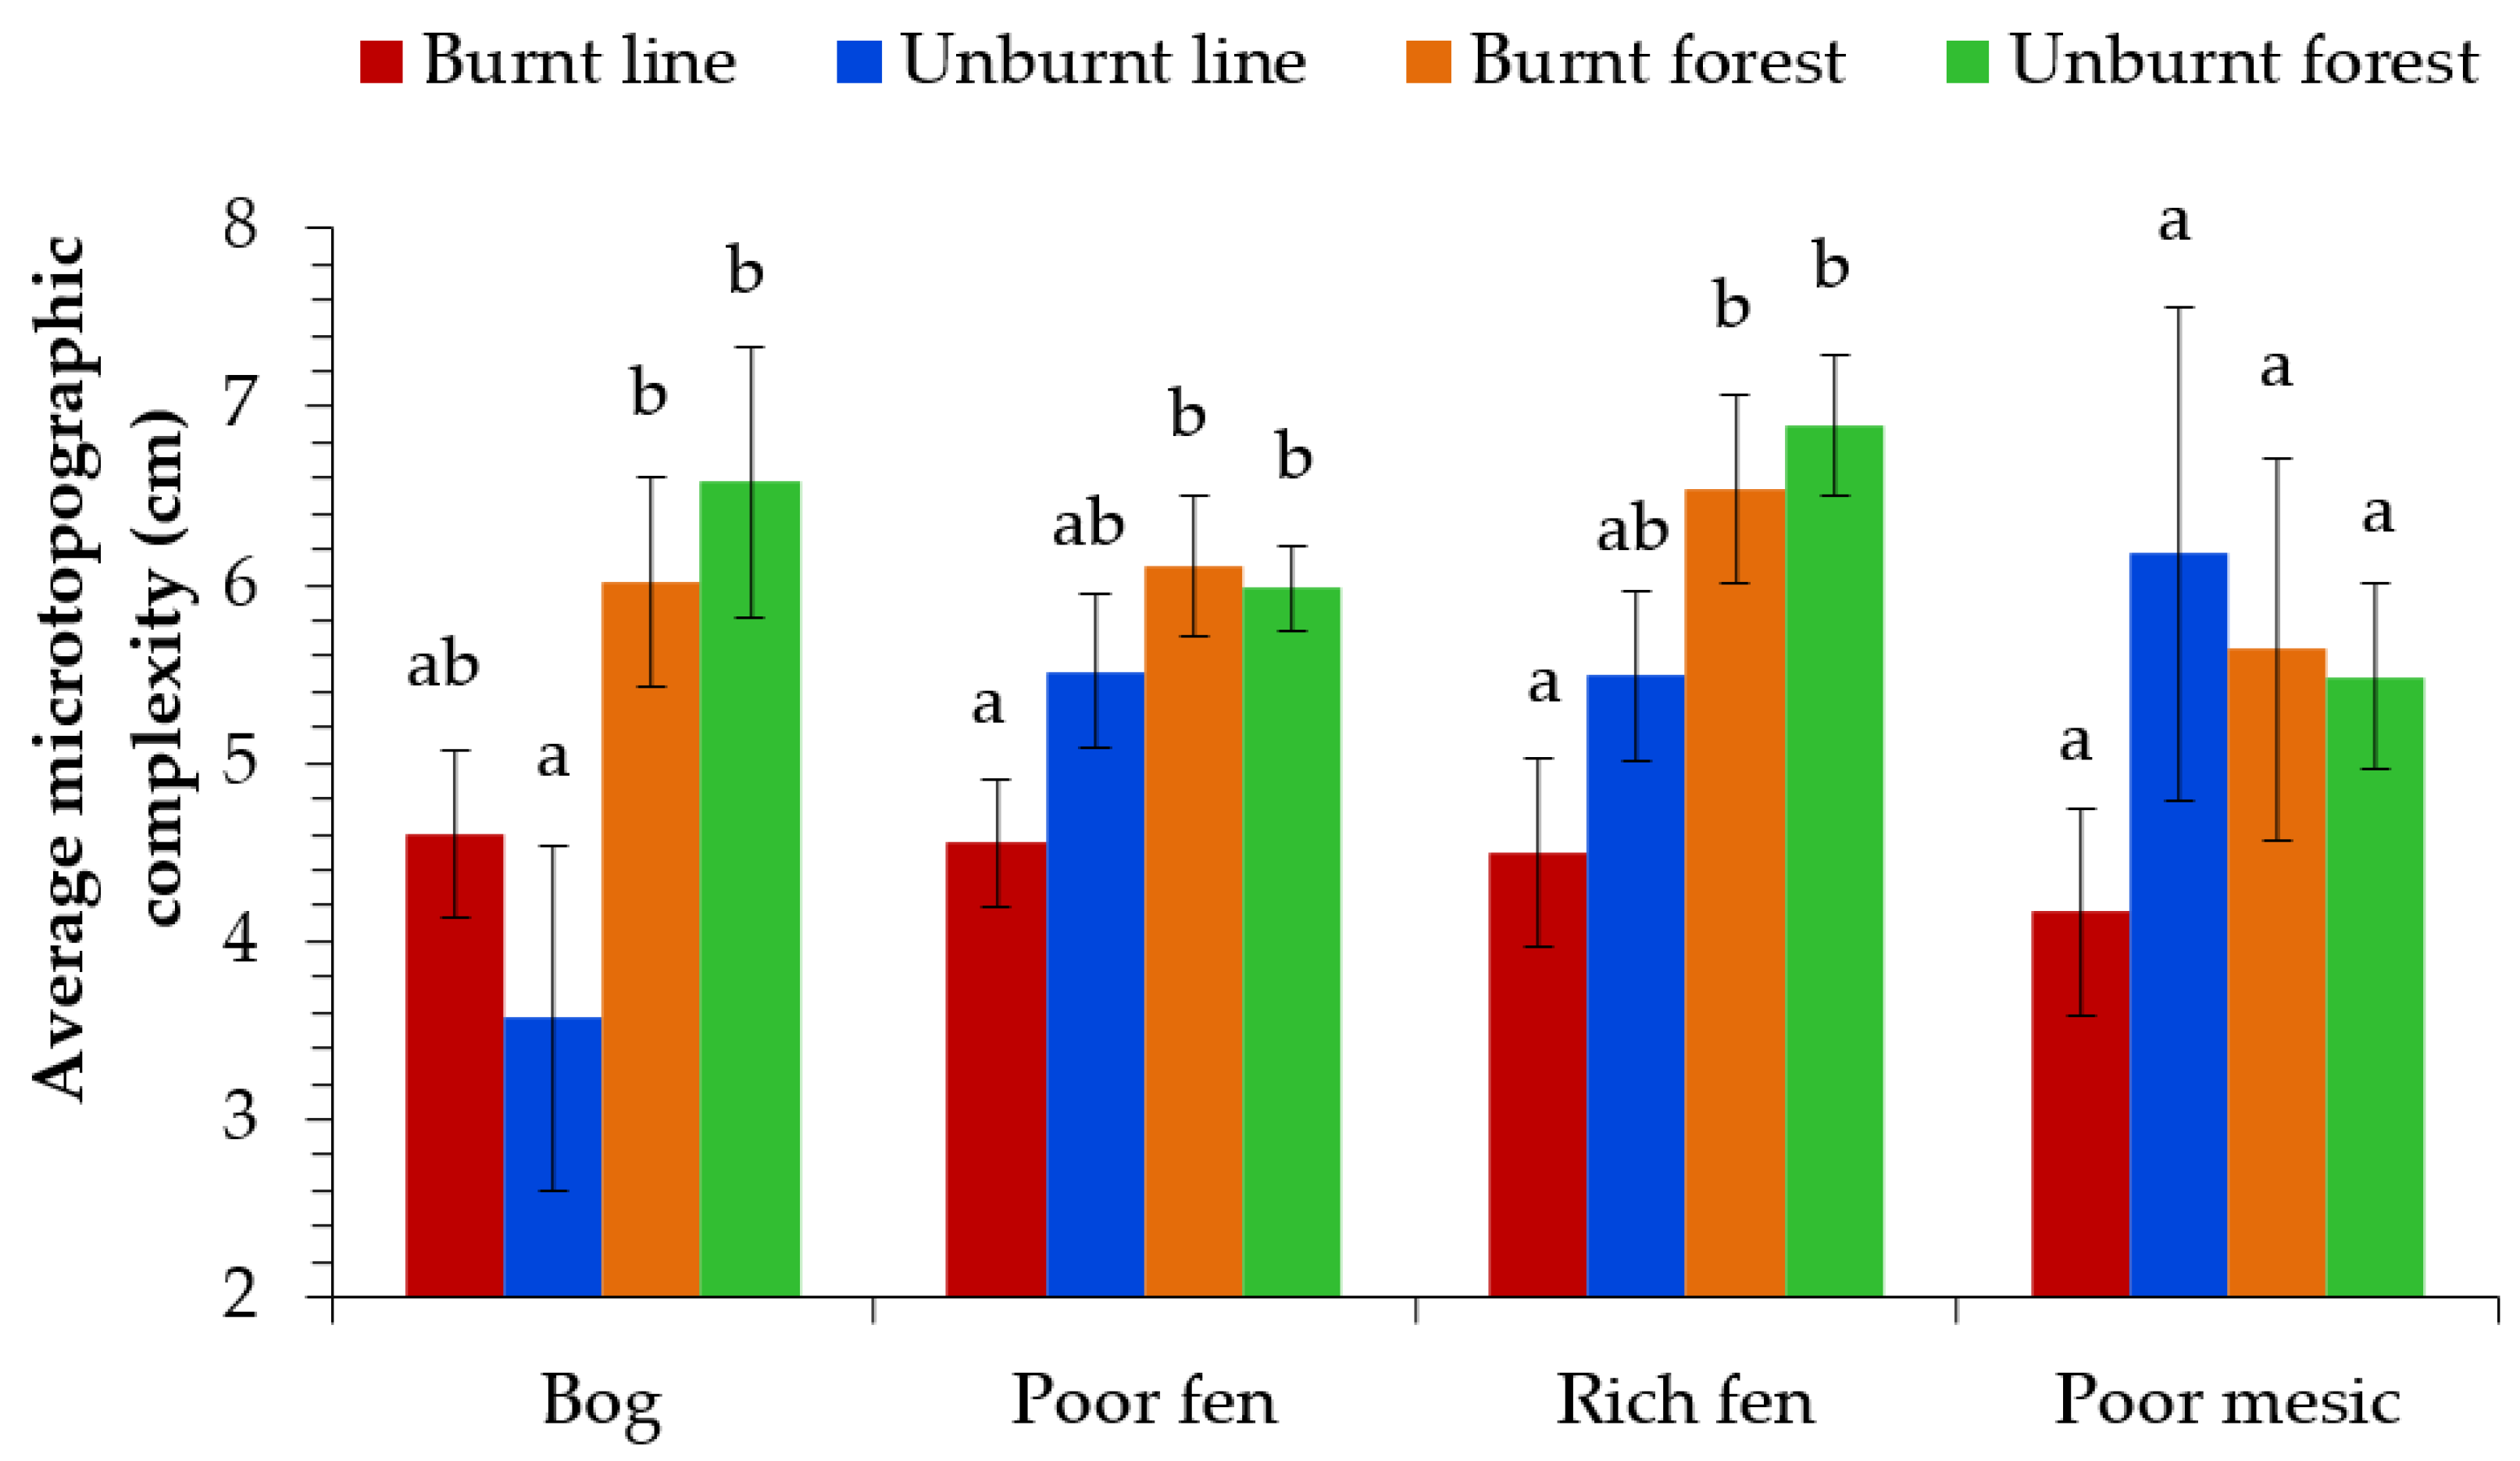
Seismic lines were significantly simplified (4.85 cm average mean absolute residual deviation), with a 20% reduction in microtopographic complexity compared to natural adjacent stands (6.08 cm average mean absolute residual deviation) for all 102 paired sites (all unburned and burned sites together; t = 4.824, df = 202, p < 0.001, see Table 2). When assessing ecosite types separately, seismic line microtopographic complexity was reduced in bogs (t = 2.859, df = 28, p = 0.004), poor fens (t = 3.258, df = 90, p = 0.001), and rich fens (t = 3.418, df = 34, p = 0.001) compared to that of adjacent forest stands. Seismic lines on poor mesic sites showed no significant difference in microtopographic complexity. The presence of fire did not affect microtopographic complexity for any ecosite (Figure 5), nor did the other fire-related variables of severity and time since fire (not shown).
4. Discussion
Seismic lines were depressed in elevation by ~8 cm and their microtopographic complexity simplified by 20% compared to adjacent forest stands. These patterns occurred across all ecosites. In contrast to ecosite differences, wildfires did not reverse or exacerbate this trend, with only minor differences between ecosites. Anecdotal evidence and applications of restoration techniques [11] indicate that microtopography plays an important role in providing the variety of microsite conditions that aid in re-establishment of seedlings in peatlands. The consistent observation of a depression on lines helps explain the difficulty that treed peatlands have in regenerating trees. This is then exacerbated by the simplification of topography that occurs on these lines.
Results here suggest that seismic lines remain simplified and depressed decades after seismic line construction and that this arrests regeneration of trees [3,7]. Persistence of seismic line depressions may in part be due to the lack of vegetation regrowth and exacerbated by heightened levels of flooding due to their lower elevation (depression). This suggests a positive feedback that further delays microtopographic recovery of seismic lines. Loss of vegetation due to clearing is known to substantially change hydrological components of forests through both the reduction of water uptake by lost vegetation and alteration of soil structure [13]. Anecdotal observations during data collection at our sites suggested vegetation on seismic lines was often strikingly different than vegetation on adjacent stands, in part due to water level and differences in microtopography. Vegetation characteristic of bogs is usually predominantly black spruce, with various sphagnum species, reindeer lichen (Cladonia rangiferina), bog cranberry (Vaccinium oxycoccus), and other ericaceous species [8], but we noticed many of the seismic lines on bogs contained species that are usually more prominent in wetter areas, such as willow (Salix spp.), dwarf birch (Betula nana), or leatherleaf (Chamaedaphne calyculata). Seismic lines in poor fens, which are usually associated with black spruce, larch, willow, dwarf birch, leather leaf [8], seemed to support species more associated with rich fens, such as water sedges (Carex aquatilis), buckbean (Menyanthes trifoliata), or march cinquefoil (Comarum palustre). Large amounts of nutrients can be lost (changing peak nutrient loss) post-disturbance due to reductions in nutrient acquisition by plants with remnant nutrients transported out of the system prior to uptake by other vegetation [35]. This supports previous evidence that delays in recovery are a result, at least in part, of the adverse effects caused by flooding on reductions in the establishment of mosses, such as Sphagnum [27], and subsequent reductions in autogenic creation of heightened variation of microtopography [29].
Most of the literature to date focuses on microtopographic changes due to wildfires in bogs, yet other peatland forest types have been less commonly sampled. Previous studies have suggested that fire increases microtopography of bogs [29], while favoring the creation of hollows over hummocks [30], and that fires are typically more severe in hollows [29]. However, we saw no effect of fire on seismic line microtopographic complexity or depression depth. Conditions in bogs are not only acidic, but bogs are rainwater fed, resulting in slow vegetation growth and therefore slow nutrient accumulation. It is possible that measured sites have not reached the stage of later succession, where fire was seen to increase microtopographic complexity, because the time since fire of the samples in this study were all within the last 30 years. Previous studies have shown that post-fire microtopography should recover within decades [29,30,36], mostly due to bryophytes that gradually spread laterally into surrounding hollows [30], but we suggest here that this may take much longer in the case of seismic lines given the initial depression and simplification is more severe than the effects of fire alone. Poor mesic sites show less depression than poor fens (burned and unburned), which characteristically seems consistent with distinct differences in nutrient and moisture regimes in relation to water presence and depression persistence. Poor mesic sites are located higher in elevation than the other ecosites and thus further above the water table. As a result, poor mesic sites may not be as affected by persistence of flooding or the reliance on greater microtopographic complexity for tree regeneration. Similar studies suggest that these depressions can be severe enough to shift local ecosite type due to higher water tables [32]. This leads to different vegetation in depressions that can persist for many decades [32,36] in an early succession state with slower growth rates of vegetation than on hummocks [30].
Although the apparent lack of influence of fire and the limited influence of ecosite type were inconsistent with expectations and previous literature, this may be due to sample sites being in a variety of treed peatlands, whereas other studies assessing microtopography have focused on open bogs [26,29,30]. Larger sample sizes and/or higher resolution measurements (<0.25 m increments) may uncover situations where fire affects microtopography or with more pronounced effects between ecosite types. Overall, however, results in this study point to the persistence of lost microtopographic complexity and perpetual depression of seismic lines, which can affect seedling regeneration on seismic lines. It has recently been found that restoration treatments that increase microtopographic variation through artificial mounding, increase woody tree species recruitment in peatland forests [11]. Considering the implications of seismic line persistence on both abiotic and biotic components, these findings advocate for the further understanding of factors affecting microtopography, and how changes in microtopography affect vegetative composition and growth and habitat for biotic species, including long-term recovery of habitat for endangered woodland caribou. Results also suggest that the use of newer technologies, such as the high precision hydrostatic altimeter, can adequately characterize microtopography in the field. With tools such as this, it becomes possible to characterize hummock–hollow composition across a treed landscape and thus assess the possible effects to vegetation establishment, growth, and distribution.
The ZIPLEVEL PRO-2000 high-precision hydrostatic altimeter not only is accurate for construction, but its lightweight design also allows for ease of transport to remote field locations. Other studies measuring microtopography have used levels [27] or other time-consuming or expensive methods including light detection and ranging (LiDAR) [37], unmanned aerial vehicles (UAVs) [14,38,39], or real-time kinematic (RTK) global positioning system (GPS) [40]. The ZIPLEVEL PRO-2000 allowed for a quick setup and provided fast and accurate measurements of micro-elevational changes (~40 minutes per site). The use of hydrostatic altimeters in measuring microtopography is potentially a much simpler and more accurate solution. This novel tool may be useful for other fields of research that require measures of micro-elevational change, with ease of transport, ease of use, and high accuracy. However, comparisons with other methods are still needed to assess cost-benefits of these different technologies.
5. Conclusions
Seismic lines are depressed compared to the adjacent forest stands across all ecosite types. Surprisingly, we found no effect of fire on microtopographic complexity or depression depth, while microtopography complexity was simplified across all ecosites except poor mesic stands. The lack of effects of fire on microtopography complexity and depression was surprising, considering prior literature. Differences in microtopography may not be as associated with fire as previously thought or may recover quickly following fire. Deciphering effects of microtopography remains important with seismic lines being a persistent disturbance in boreal landscapes that alter vegetation regrowth. Persistence of microtopographic depression and simplification on seismic lines has implications for reduced tree regeneration [11]. High precision hydrostatic altimeters show promise in quantifying microtopography and should be applied elsewhere to investigate the role of microtopography on ecological and biological responses.
Author Contributions
C.J.S., A.T.F., and S.E.N. conceived and designed the experiments; C.J.S. and A.T.F. collected the data; C.J.S., A.T.F., and S.E.N. analyzed the data; C.J.S., A.T.F., and S.E.N. wrote the paper.
Funding
This research is part of the Boreal Ecosystem Recovery and Assessment (BERA) project (www.bera-project.org), and was supported by a Natural Sciences and Engineering Research Council of Canada Collaborative Research and Development Grant (CRDPJ 469943-14) in conjunction with Alberta-Pacific Forest Industries, Cenovus Energy, ConocoPhillips Canada, and Devon Canada Corporation. Additional funding provided by Northern Scientific Training Program (NSTP), the Alberta Conservation Association through the ACA Grants in Biodiversity Program, and Natural Sciences and Engineering Research Council of Canada (NSERC) Undergraduate Student Research Award.
Acknowledgments
Federico Riva for discussions on seismic line microtopography and site selection.
Conflicts of Interest
The authors declare no conflict of interest. The funding sponsors had no role in the design of the study; in the collection, analyses, or interpretation of data; in the writing of the manuscript, and in the decision to publish the results.
References
- Alexandratos, N. Counties with Rapid Population Growth and Resource Constraints: Issues of Food, Agriculture and Development. Popul. Dev. Rev. 2005, 31, 237–258. [Google Scholar] [CrossRef]
- Schneider, R.R. Alternative futures: Alberta’s boreal forest at the crossroads; Federation of Alberta Naturalists: Edmonton, AB, Canada, 2002. [Google Scholar]
- Lee, P.; Boutin, S. Persistence and developmental transitions of wide seismic lines in the western Boreal Plains of Canada. J. Environ. Manag. 2006, 78, 240–250. [Google Scholar] [CrossRef] [PubMed]
- Veblen, T.T.; Kitzberger, T.; Donnegan, J. Climatic and human influences on fire regimes in ponderosa pine forests in the Colorado. Ecol. Appl. 2001, 10, 1178–1195. [Google Scholar] [CrossRef]
- Lefort, P.; Gauthier, S.; Bergeron, Y. The influence of fire weather and land use on fire activity of the Lake Abitibi area, Eastern Canada. Forest Sci. 2003, 49, 509–521. [Google Scholar]
- Arienti, M.C.; Cumming, S.G.; Krawchuk, M.A.; Boutin, S. Road network density correlated with increased lightning fire incidence in the Canadian western boreal forest. Int. J. Wildland Fire 2009, 19, 970–982. [Google Scholar] [CrossRef]
- van Rensen, C.K.; Nielsen, S.E.; White, B.; Vinge, R.; Lieffers, V.J. Natural regeneration of forest vegetation on legacy seismic lines in boreal habitats in Alberta’s oil sands region. Biol. Conserv. 2015, 184, 127–135. [Google Scholar] [CrossRef] [Green Version]
- Government of Alberta: Natural Regions Committee. Natural Regions and Subregions of Alberta; Government of Alberta: Edmonton, AB, Canada, 2006. Available online: https://www.albertaparks.ca/media/2942026/nrsrcomplete_may_06.pdf (accessed on 16 March 2019).
- Braithwaite, N.T.; Mallik, A.U. Edge effects of wildfire and riparian buffers along boreal forest streams. J. Appl. Ecol. 2012, 49, 192–201. [Google Scholar] [CrossRef]
- Laurance, W.F.; Nascimento, H.E.M.; Laurance, S.G.; Andrade, A.; Ewers, R.M.; Harms, K.E.; Luizao, R.C.C.; Ribeiro, J.E. Habitat Fragmentation, Variable Edge Effects, and the Landscape-Divergence Hypothesis. PLoS ONE 2007, 2, 2–8. [Google Scholar] [CrossRef]
- Filicetti, A.T.; Cody, M.; Nielsen, S.E. Caribou Conservation: Restoring Trees on Seismic Lines in Alberta, Canada. Forests 2019, 10, 185. [Google Scholar] [CrossRef]
- Vitt, D.H. An overview of factors that influence the development of Canadian peatlands. The Memoirs of the Entomological Society of Canada 1994, 126, 7–20. [Google Scholar] [CrossRef]
- Chen, J.; Budisulistiorini, S.H.; Itoh, M.; Lee, W.; Mijakawa, T.; Komasaki, Y.; Yang, L.D.Q.; Kuwata, M. Water uptake by fresh Indonesian peat burning particles is limited by water-soluble organic matter. Atmos. Chem. Phys. 2017, 17, 11591–11604. [Google Scholar] [CrossRef] [Green Version]
- Lovitt, J.; Rahman, M.M.; Saraswati, S.; McDermid, G.J.; Strack, M.; Xu, B. UAV Remote Sensing Can Reveal the Effects of Low-Impact Seismic Lines on Surface Morphology, Hydrology, and Methane (CH4) Release in a Boreal Treed Bog. JGR Biogeosci. 2018, 123, 741–1142. [Google Scholar] [CrossRef]
- Tigner, J.; Bayne, E.M.; Boutin, S. Black bear use of seismic lines in Northern Canada. J. Wildl. Manag. 2014, 78, 282–292. [Google Scholar] [CrossRef]
- Linke, J.; Franklin, S.E.; Huettman, F.; Stenhouse, G.B. Seismic Cutlines, Changing Landscape Metrics and Grizzly Bear Landscape use in Alberta. Landsc. Ecol. 2005, 20, 811–826. [Google Scholar] [CrossRef]
- Tigner, J.; Bayne, E.M.; Boutin, S. American Marten Respond to Seismic Lines in Northern Canada at Two Spatial Scales. PLoS ONE 2015, 10, e0118720. [Google Scholar] [CrossRef] [PubMed]
- Bayne, E.M.; Boutin, S.; Tracz, B.; Charest, K. Functional and numerical responses of ovenbirds (Seiurus aurocapilla) to changing seismic exploration practices in Alberta’s boreal forest. Ecoscience 2005, 12, 216–222. [Google Scholar] [CrossRef]
- Riva, F.; Acorn, J.H.; Nielsen, S.E. Localized disturbances from oil sands developments increase butterfly diversity and abundance in Alberta’s boreal forests. Biol. Conserv. 2018, 217, 173–180. [Google Scholar] [CrossRef]
- Environment Canada. Species at Risk Act Recovery Strategy Series; Environment Canada: Ottawa, ON, Canada, 2012.
- Dyer, S.J.; O’Neill, J.P.; Wasel, S.M.; Boutin, S. Avoidance of Industrial Development by Woodland Caribou. J. Wildl. Manag. 2001, 65, 531–542. [Google Scholar] [CrossRef]
- James, A.R.C.; Stuart-Smith, A.K. Distribution of caribou and wolves in relation to linear corridors. J. Wildl. Manag. 2000, 64, 154–159. [Google Scholar] [CrossRef]
- Latham, A.D.M.; Latham, M.C.; Boyce, M.S.; Boutin, S. Movement responses by wolves to industrial linear features and their effect on woodland caribou in northeastern Alberta. Ecol. Appl. 2011, 21, 2854–2865. [Google Scholar] [CrossRef]
- Latham, A.D.M.; Latham, M.C.; McCutchen, N.A.; Boutin, S. Invading White-Tailed Deer Change Wolf–Caribou Dynamics in Northeastern Alberta. J. Wildl. Manag. 2011, 75, 204–212. [Google Scholar] [CrossRef]
- Government of Canada. Woodland Caribou (Rangifer Tarandus Caribou), Boreal Population: Recovery Strategy 2012; Government of Canada: Ottawa, ON, Canada, 2012. Available online: https://www.canada.ca/en/environment-climate-change/services/species-risk-public-registry/recovery-strategies/woodland-caribou-boreal-population–2012.html (accessed on 16 March 2019).
- Kuhry, P. The Role of Fire in the Development of Sphagnum-Dominated Peatlands in Western Boreal Canada. J. Ecol. 1994, 82, 899–910. [Google Scholar] [CrossRef]
- Caners, T.; Lieffers, V.J. Divergent Pathways of Successional Recovery for In Situ Oil Sands Exploration Drilling Pads on Wooded Moderate-Rich Fens in Alberta, Canada. J. Res. Ecol. 2014, 22, 657–667. [Google Scholar] [CrossRef]
- Lieffers, V.J.; Caners, R.T.; Hangfei, G. Re-establishment of hummock topography promotes tree regeneration on highly disturbed moderate-rich fens. J. Environ. Manag. 2017, 197, 258–264. [Google Scholar] [CrossRef] [PubMed]
- Benscoter, B.W.; Greencare, D.; Turetsky, M.R. Wildfire as a key determinant of peatland microtopography. Can. J. For. Res. 2015, 45, 1132–1136. [Google Scholar] [CrossRef]
- Benscoter, B.W.; Wieder, R.K.; Vitt, D.H. Linking microtopography with post-fire succession in bogs. J. Veg. Sci. 2005, 16, 453–460. [Google Scholar] [CrossRef]
- Weltzin, J.F.; Harth, C.; Bridgham, S.D.; Pastor, J.; Vonderharr, M. Production and microtopography of bog bryophytes; response to warming and water-table manipulations. Oecol 2001, 128, 557–564. [Google Scholar] [CrossRef] [PubMed]
- Triisberg, T.; Karofeld, E.; Liira, J.; Orru, M.; Ramst, R.; Paal, J. Microtopography and the Properties of Residual Peat Are Convenient Indicators for Restoration Planning of Abandoned Extracted Peatlands. Restor. Ecol. 2014, 2, 31–39. [Google Scholar] [CrossRef]
- Alberta Biological Monitoring Institute (ABMI). Terrestrial Field Data Collection Protocol (Abridged Version). Available online: http://www.abmi.ca/home/publications/1-50/46.html (accessed on 15 May 2017).
- StataCorp. Stata Statistical Software: Release 15; StataCorp LLC: College Station, TX, USA, 2017. [Google Scholar]
- Uldis, S.; Bladon, K.D.; Kelly, E.N.; Esch, E.; Spence, K.R.; Stone, M.; Emelko, M.B.; Boon, S.; Wagner, M.J.; Williams, C.H.S.; Tichkowsky, I. Fire-year legacy of wildfire and salvage logging impacts on nutrient runoff and aquatic plant, invertebrate, and fish productivity. Ecohydrology 2014, 7, 1508–1523. [Google Scholar]
- Pouliot, R.; Rochefort, L.R.; Karofeld, E. Initiation of microtopography in re-vegetated cutover peatlands: evolution of plant species composition. Appl. Veg. Sci. 2019, 15, 369–382. [Google Scholar] [CrossRef]
- Brubaker, K.M.; Myers, W.L.; Drohan, P.L.; Miller, D.A. The Use of LiDAR Terrain Data in Characterizing Surface Roughness and Microtopography. Appl. Environ. Soil Sci. 2013, 4, 1–13. [Google Scholar] [CrossRef]
- Franklin, S.E. Pixel-and object-based multispectral classification of forest tree species from small unmanned aerial vehicles. J. Unmanned Veh. Sys. 2018, 6, 195–211. [Google Scholar] [CrossRef]
- Feduck, C.; McDermid, G.J.; Castilla, G. Detection of Coniferous Seedlings in UAV Imagery. Forests 2018, 9, 432. [Google Scholar] [CrossRef]
- McDonald, T.P.; Fulton, J.P.; Darr, M.J.; Gallagher, T.V. Evaluation of a system to spatially monitor hand planting of pine seedlings. Comput. Electron. Agr. 2008, 64, 173–182. [Google Scholar] [CrossRef]
Figure 1.
Location of 102 study sites in northeast Alberta, Canada (inset map). Green shaded areas in the main map represent forested areas of the Lower Athabasca region, while the light gray color represents open disturbed habitats. Each sample site represents a paired plot with one plot on the seismic line and the other plot 25 m into the adjacent forest in either unburned or burned sites from five different burn years (1995–2016). Sites were restricted to areas not influenced by recent all-terrain vehicle use or recent re-clearing.

Figure 2.
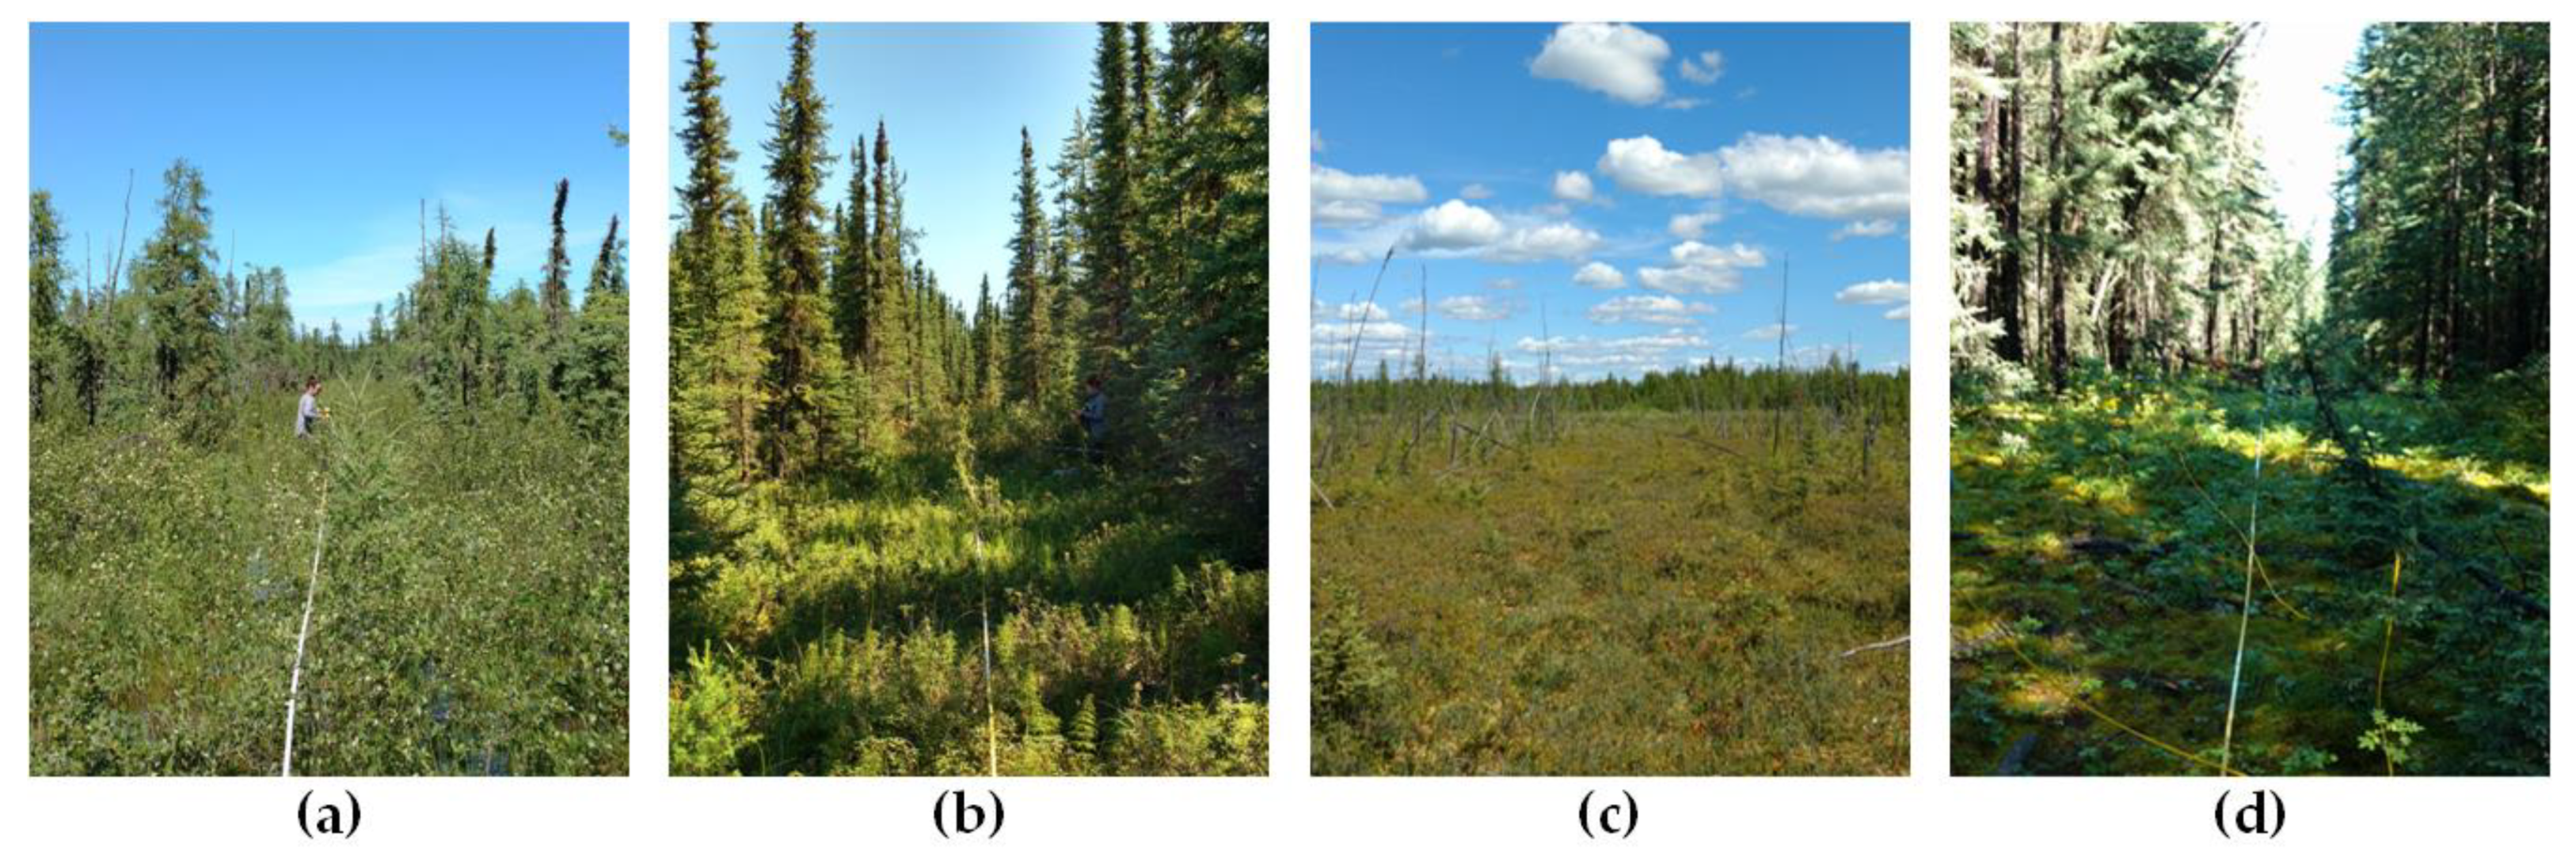
Examples of seismic line disturbances for four different peatland forest ecosites in northeastern Alberta, Canada: (a) rich fen; (b) poor fen; (c) bog; and (d) poor mesic. All photographs by Angelo T. Filicetti.
Figure 2.
Examples of seismic line disturbances for four different peatland forest ecosites in northeastern Alberta, Canada: (a) rich fen; (b) poor fen; (c) bog; and (d) poor mesic. All photographs by Angelo T. Filicetti.

Figure 3.
Schematic of plot design used for measuring microtopography on seismic lines (white) and in adjacent forests (gray). A 20 m transect, in red, was used to measure complexity with 0.25 m spacing. Perpendicular transects, in blue, measured depression depth with three transects spaced at 0, 10, and 20 m along the main transect at, again, 0.25 m increments.

Figure 4.
Mean and standard error (error bars) of average depression (cm) across four ecosites (bog, poor fen, rich fen, and poor mesic) and four treatments (burnt line, unburnt line, burnt forest, and unburnt forest). Significance of treatments tested with a pairwise comparison (Bonferroni adjustment). Different letters indicate significant (p < 0.0125) differences within an ecosite.

Figure 5.
Mean and standard error (error bars) of microtopographic complexity across four ecosites (bog, poor fen, rich fen, and poor mesic) and four treatments (burnt line, unburnt line, burnt forest, and unburnt forest). Significance of treatments was tested with a pairwise comparison (Bonferroni adjustment). Different letters indicate significant (p < 0.0125) differences within an ecosite.


Table 1.
Ecological site type and presence or absence of fire for 102 paired sampling sites in northeast Alberta, Canada across five burn years (1995, 1999, 2009, 2011, and 2016). Sites were sampled between 18 May 2017 and 25 July 2017.
Table 1.
Ecological site type and presence or absence of fire for 102 paired sampling sites in northeast Alberta, Canada across five burn years (1995, 1999, 2009, 2011, and 2016). Sites were sampled between 18 May 2017 and 25 July 2017.
| Total | Bog | Poor Fen | Rich Fen | Poor Mesic | Total |
|---|---|---|---|---|---|
| 15 | 46 | 18 | 23 | 102 | |
| Unburnt | 6 | 19 | 8 | 9 | 42 |
| Burnt | 9 | 27 | 10 | 14 | 60 |
| Fire Year | |||||
| 1995 | 3 | 7 | 2 | 0 | 12 |
| 1999 | 3 | 1 | 1 | 5 | 10 |
| 2009 | 3 | 5 | 0 | 6 | 14 |
| 2011 | 0 | 8 | 2 | 2 | 12 |
| 2016 | 0 | 6 | 5 | 1 | 12 |
Table 2.
The t-test results for microtopographic depression and complexity between seismic lines and adjacent forests using all sites (n = 102) regardless of ecosite and fire presence.
Table 2.
The t-test results for microtopographic depression and complexity between seismic lines and adjacent forests using all sites (n = 102) regardless of ecosite and fire presence.
| Statistic | Depression Depth (cm) | Microtopographic Complexity (cm) | ||
|---|---|---|---|---|
| Seismic Line | Adjacent Forest | Seismic Line | Adjacent Forest | |
| Mean | −8.42 | −0.54 | 4.85 | 6.08 |
| Standard error | 0.66 | 0.57 | 0.22 | 0.21 |
| t | 9.093 | 4.824 | ||
| df | 202 | 202 | ||
| p-value | <0.001 | <0.001 | ||
© 2019 by the authors. Licensee MDPI, Basel, Switzerland. This article is an open access article distributed under the terms and conditions of the Creative Commons Attribution (CC BY) license (http://creativecommons.org/licenses/by/4.0/).
Share and Cite
MDPI and ACS Style
Stevenson, C.J.; Filicetti, A.T.; Nielsen, S.E. High Precision Altimeter Demonstrates Simplification and Depression of Microtopography on Seismic Lines in Treed Peatlands. Forests 2019, 10, 295. https://doi.org/10.3390/f10040295
AMA Style
Stevenson CJ, Filicetti AT, Nielsen SE. High Precision Altimeter Demonstrates Simplification and Depression of Microtopography on Seismic Lines in Treed Peatlands. Forests. 2019; 10(4):295. https://doi.org/10.3390/f10040295
Chicago/Turabian StyleStevenson, Cassondra J., Angelo T. Filicetti, and Scott E. Nielsen. 2019. "High Precision Altimeter Demonstrates Simplification and Depression of Microtopography on Seismic Lines in Treed Peatlands" Forests 10, no. 4: 295. https://doi.org/10.3390/f10040295
Note that from the first issue of 2016, this journal uses article numbers instead of page numbers. See further details here.