Proportional Relationship between Leaf Area and the Product of Leaf Length and Width of Four Types of Special Leaf Shapes


1
Co-Innovation Centre for Sustainable Forestry in Southern China, College of Biology and the Environment, Bamboo Research Institute, Nanjing Forestry University, Nanjing 210037, China
2
Department of Biosciences Engineering, University of Antwerp, B-2020 Antwerp, Belgium
3
Tasmanian Institute of Agriculture, University of Tasmania, Private Bag 98, Hobart, Tasmania 7001, Australia
*
Author to whom correspondence should be addressed.
Forests 2019, 10(2), 178; https://doi.org/10.3390/f10020178
Submission received: 22 December 2018
/
Revised: 12 February 2019
/
Accepted: 18 February 2019
/
Published: 19 February 2019
(This article belongs to the Section Forest Ecophysiology and Biology)
Abstract
:The leaf area, as an important leaf functional trait, is thought to be related to leaf length and width. Our recent study showed that the Montgomery equation, which assumes that leaf area is proportional to the product of leaf length and width, applied to different leaf shapes, and the coefficient of proportionality (namely the Montgomery parameter) range from 1/2 to π/4. However, no relevant geometrical evidence has previously been provided to support the above findings. Here, four types of representative leaf shapes (the elliptical, sectorial, linear, and triangular shapes) were studied. We derived the range of the estimate of the Montgomery parameter for every type. For the elliptical and triangular leaf shapes, the estimates are π/4 and 1/2, respectively; for the linear leaf shape, especially for the plants of Poaceae that can be described by the simplified Gielis equation, the estimate ranges from 0.6795 to π/4; for the sectorial leaf shape, the estimate ranges from 1/2 to π/4. The estimates based on the observations of actual leaves support the above theoretical results. The results obtained here show that the coefficient of proportionality of leaf area versus the product of leaf length and width only varies in a small range, maintaining the allometric relationship for leaf area and thereby suggesting that the proportional relationship between leaf area and the product of leaf length and width broadly remains stable during leaf evolution.
1. Introduction
The leaf is the most important photosynthetic organ of plants. Leaves participate in many physiological processes that sometimes result in trade-offs among carbon fixation, water loss, and defense from herbivore attack. There are clearly multiple solutions or ways to optimize leaf form, as evidenced by the wide variety of leaves that can be found in almost any environment [1]. During long-term evolution, plants evolved different leaf shapes to enable them to survive and win the fierce interspecific competition in plant communities [2]. The leaves of plants exhibit a large variation in shape, ranging from an elliptic leaf to a palmate leaf. To calculate the leaf area of corn, Montgomery [3] proposed a formula that assumes that leaf area is proportional to the product of leaf length and width. We call this formula the Montgomery equation in the present study and we refer to the coefficient of proportionality in the equation as the Montgomery parameter. This equation was confirmed to hold for crops with different leaf shapes, including the castor bean (Ricinus communis L.) [4,5]. However, the Montgomery equation had been largely neglected in the investigation of the leaves of woody plants. Our recent study showed that the Montgomery equation was also able to describe the proportional relationship between leaf area and the product of leaf length and width of six classes of plants: 10 geographical populations of Parrotia subaequalis (H. T. Chang) R. M. Hao & H. T. Wei, two species of tulip trees with their hybrid, 12 species of Bambusoideae, five species of Lauraceae, five species of Oleaceae, and 12 species of Rosaceae, where 150−500 leaves were used for each population or each species. The estimates of the Montgomery parameter all fell into the range (1/2, π/4) [6]. If the Montgomery equation did apply to all broad-leaved plants and the estimates of the Montgomery parameter for different plants fell into a narrow range, it would imply that the allometric relationship between leaf area and the product of leaf length and width maintains a certain stability during leaf evolution. However, the relevant geometric derivation associated with leaf shape has not been studied.
In this study, we investigated four leaf shapes whose areas can be described by mathematical equations to derive theoretical or limiting values of the Montgomery parameter. In addition, to further test the validity of the theoretical derivation, the leaves of four species of plants with similar leaf shapes to the above mathematical equations were used.
2. Materials and Methods
2.1. Leaf Area Models Associated with the Montgomery Parameter
Let A, L, and W represent leaf area, leaf length, and leaf width, respectively. The Montgomery equation is A = kLW, where k is a parameter to be fitted, referred to here as the Montgomery parameter, and which can be rewritten as:
(1) For an elliptical leaf, its semi-major axis is half its leaf length, and its semi-minor axis is half its leaf width. Thus, the area of an ellipse can be expressed as:
In this case, the Montgomery parameter equals π/4.
(2) For a sectorial leaf, we use the radius from leaf base to the farthest edge to represent its length, the straight-line distance of two apexes of the arc to represent its width, and θ to represent the arc angle in radians. Then, leaf width W = 2 L sin(θ/2). Because A = L2 θ/2 (i.e., the formula for the area of a sector of a circle), we have, according to Equation (1):
For a sectorial leaf, θ lies in the range (0, π). Note that in the case of θ > π (e.g., Nymphaea tetragona Georgi), it is unsuitable to define leaf length as the radius of a sector, and leaf length should be defined as twice the radius. When θ = π, k = π/4. It is easy to prove because . Thus, for a sectorial leaf (on the condition that the arc angle does not exceed π), the Montgomery parameter ranges from 1/2 to π/4.
(3) For a bamboo leaf, it can be described by the simplified Gielis equation (SGE) [7,8,9,10]:
where r and φ represent the polar radius and polar angle, respectively; l and n are the parameters to be fitted. For a leaf, φ ranges from 0 to 2π. Assume that the polar radius and polar angle associated with leaf width in the first quadrant are rw and α. Leaf length and width have been demonstrated by Shi et al. [8] to be:
and
From the above, we derive and . In other words, for leaves with the SGE leaf shape, the Montgomery parameter ranges from 0.6795 to π/4.
(4) For a triangular leaf, let its height represent its length and its base represent its width. According to the triangular area formula, its area is equal to
In this case, the Montgomery parameter equals 1/2.
2.2. Materials
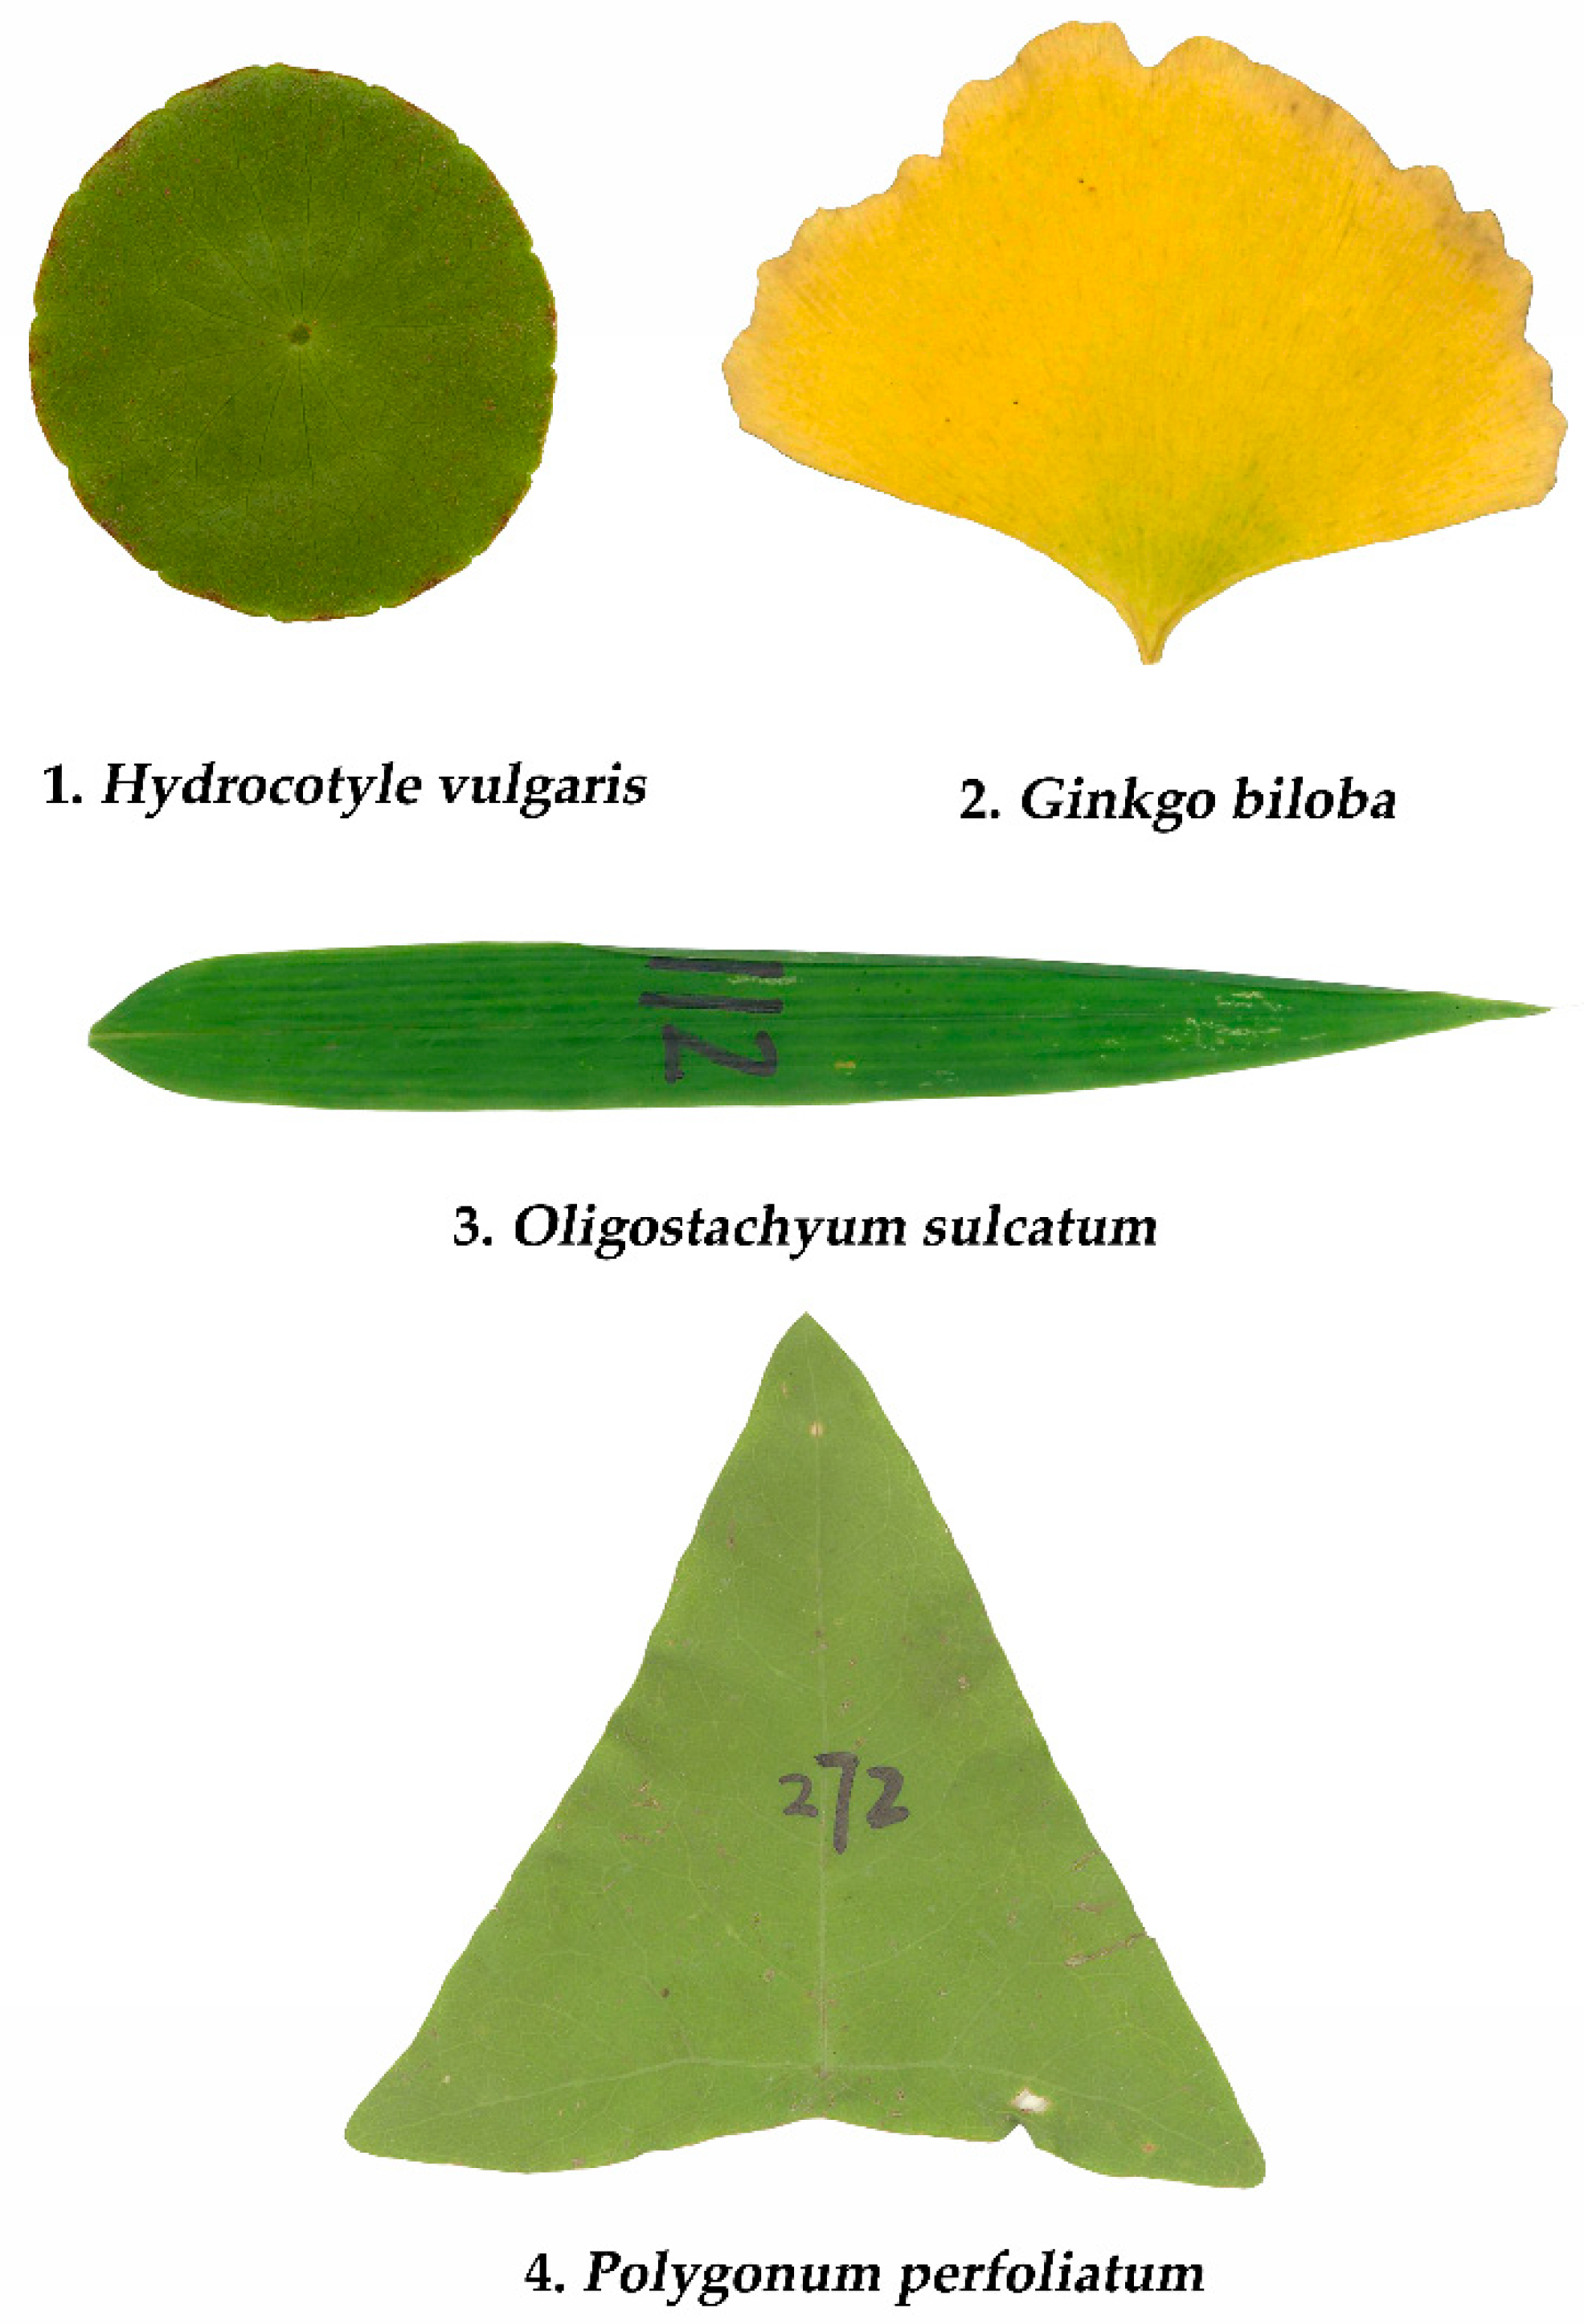
More than 390 leaves of Hydrocotyle vulgaris L. were collected at the Xuanwu Lakeside Park, Nanjing, China, as the representative of an elliptical shape; more than 380 leaves of Ginkgo biloba L. were collected in the Nanjing Forestry University campus, Nanjing, China, as representative of a sector shape; 250−500 leaves of each of 20 bamboo species were collected in the Nanjing Forestry University campus (see Table S1 in the online Supplementary Materials for details), and among these bamboo species more than 300 leaves of Oligostachyum sulcatum Z.P. Wang et G.H. Ye were used as an example representative of a linear shape; more than 340 leaves of Polygonum perfoliatum L. were collected in the White Horse experimental station of Nanjing Forestry University as the representation of the triangular shape. The detailed collection information of the four representative species is listed in Table 1. Figure 1 shows the intuitive examples for the four types of leaf shapes.
2.3. Leaf Image Processing and Data Acquisition
Each leaf was scanned to a bitmap image in a resolution of 400−600 dpi, and the magic wand in Photoshop (version ≥CS3) was used to extract the leaf edge. The edge was saved in a new layer. We filled the outer part of the leaf edge with black and filled the inner part of the leaf edge with white, which is beneficial for the extraction of the planar coordinates of the leaf edge [11]. This new layer was referred to as the black-white image. Then we used an M file in Matlab (version ≥2009a) developed by Shi et al. [8] to extract the planar coordinates of the leaf edge and the number of data points relied on the resolution of the black-white image. Finally, we used the R (version ≥3.2.2) [12] script developed by Shi et al. [8] to obtain the measures of leaf morphologic parameters, such as leaf area, length, width, and perimeter. If the leaf surface is sufficiently flat, measured leaf parameters will be very accurate. However, this method does not apply to plants like Ilex cornuta Lindl. et Paxt. that do not have flat leaves. Leaf length was defined as the distance from leaf apex to the junction of the lamina and petiole of a leaf. We defined the straight line through these two points as the x-axis. Then we set up 1000 strips of equal width perpendicular to the x-axis starting with the leaf apex and ending at the junction of the lamina and petiole. The leaf width was defined to be the widest part of the leaf perpendicular to the x-axis.
2.4. Statistical Analysis
For each species, assume that A represents leaf area, L represents leaf length, and W represents leaf width. To stabilize the variance, we used the log-transformation of leaf area and that of the product between leaf length and width. Then we carried out the following linear regression:
where a is a parameter to be fitted. In this case, the Montgomery parameter is equal to exp(a). Then the linear regression with slope equal to one was carried out to estimate the intercept and its 95% confidence interval (CI). We also fitted the pooled data of 20 bamboo species to check whether the pooled data still could satisfy the Montgomery equation. Considering that the leaf shapes of these plants exhibited a large difference, we also used Tukey’s HSD (Honestly Significant Difference) test to carry out the multiple comparisons in the ratios of leaf width to length and the ratios of leaf perimeter to area among four species of plants [13].
3. Results
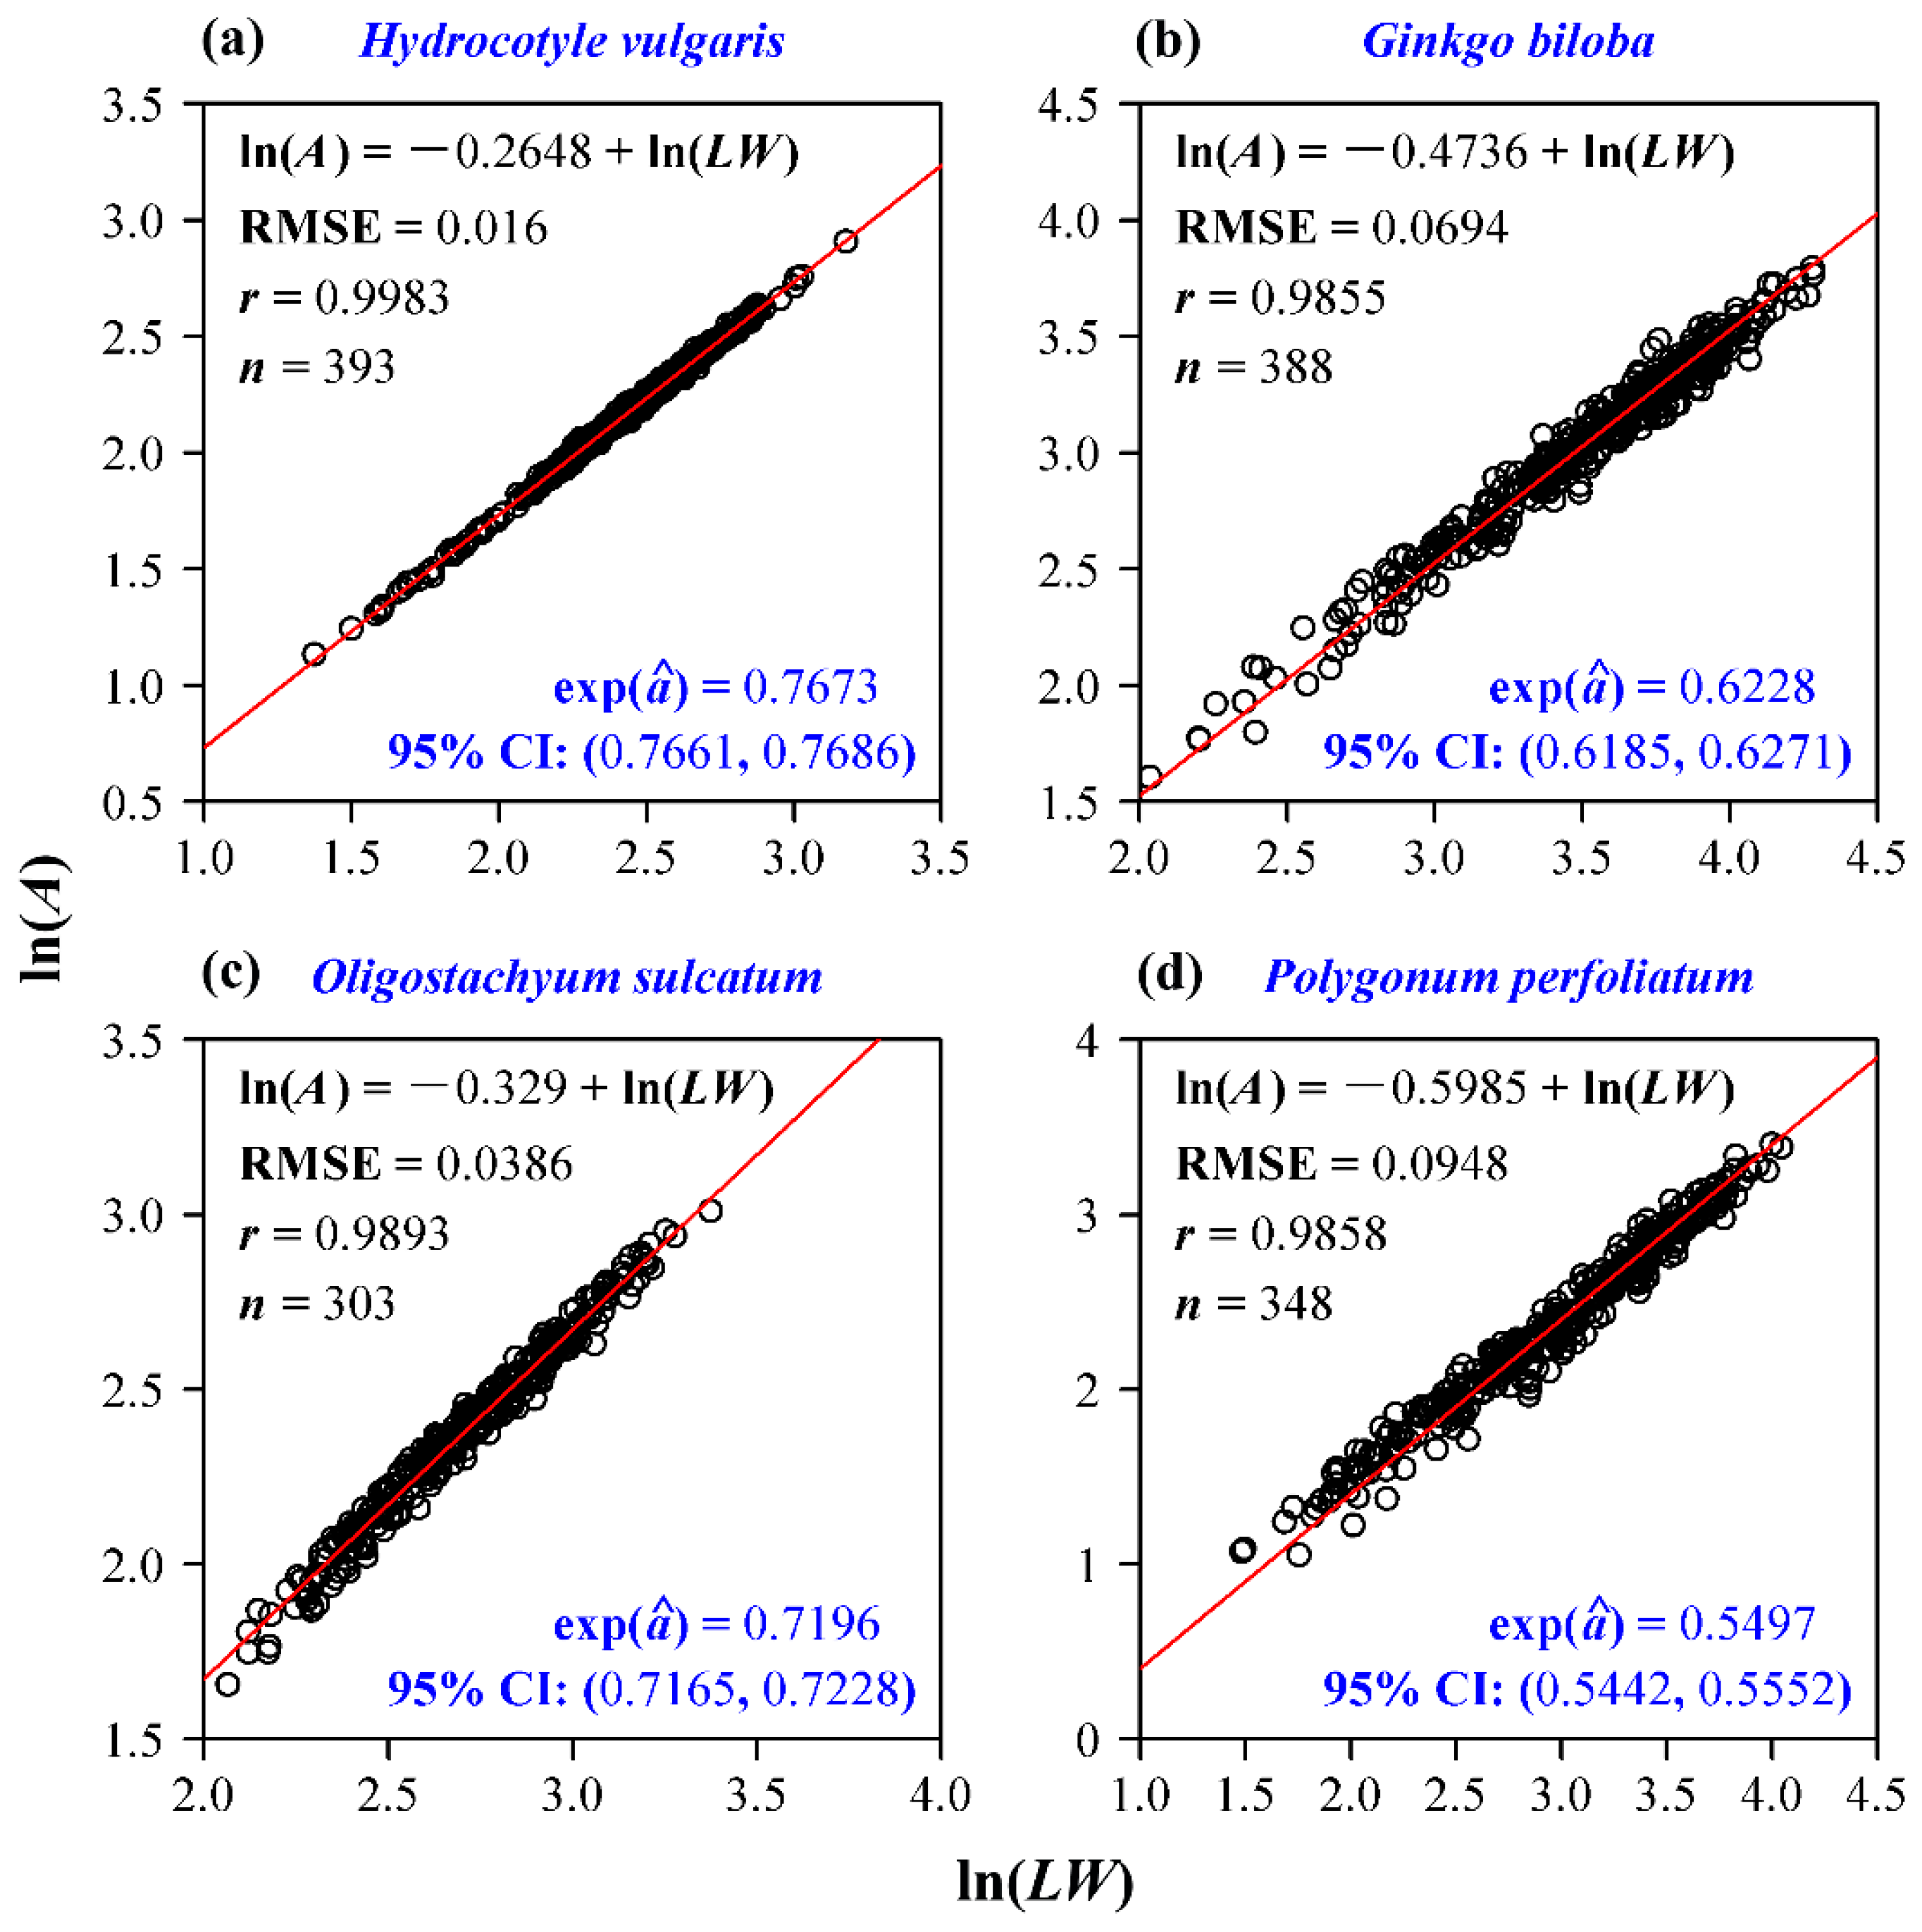
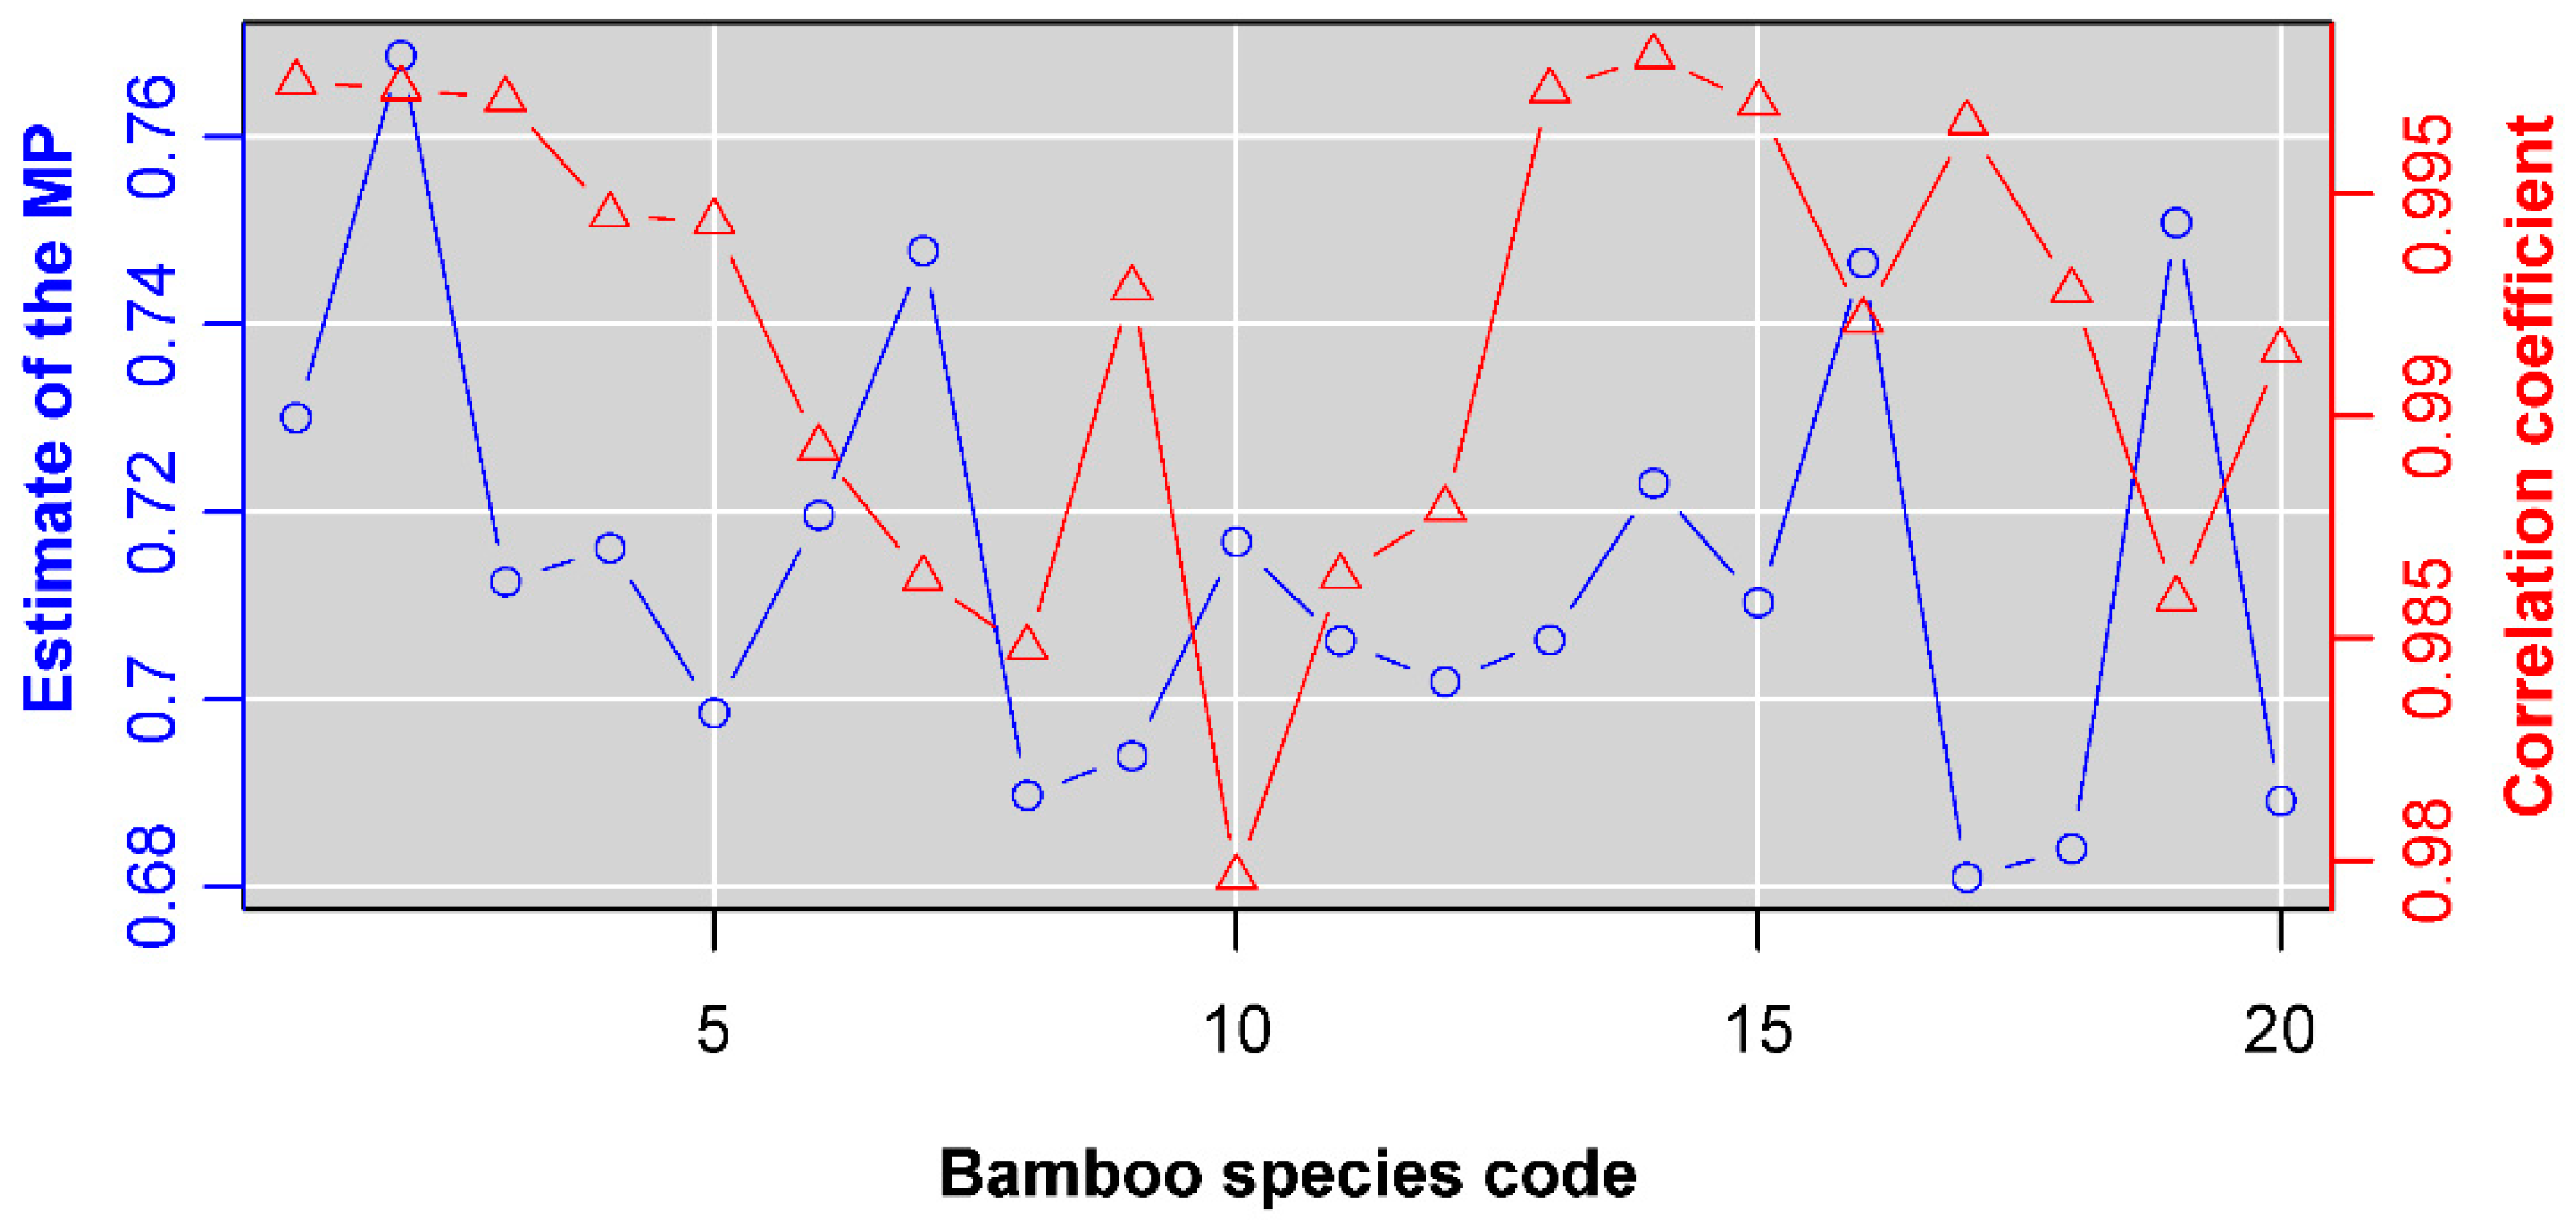
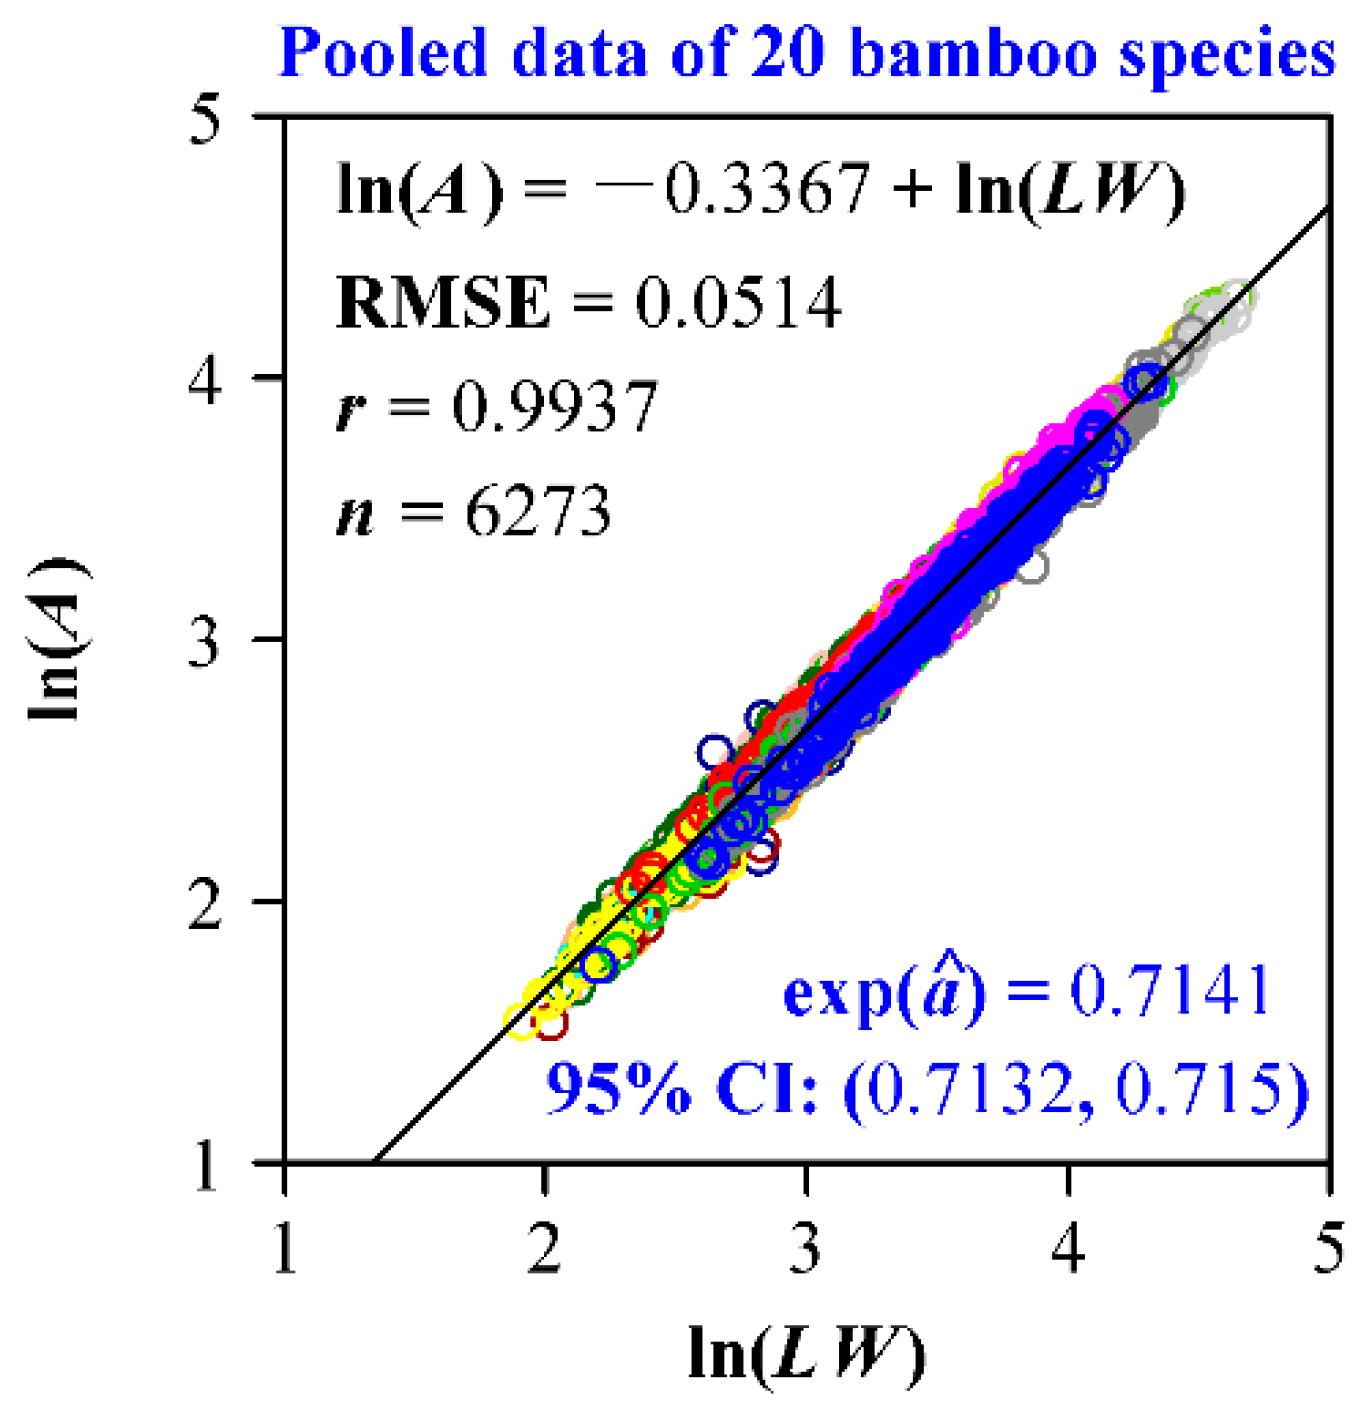
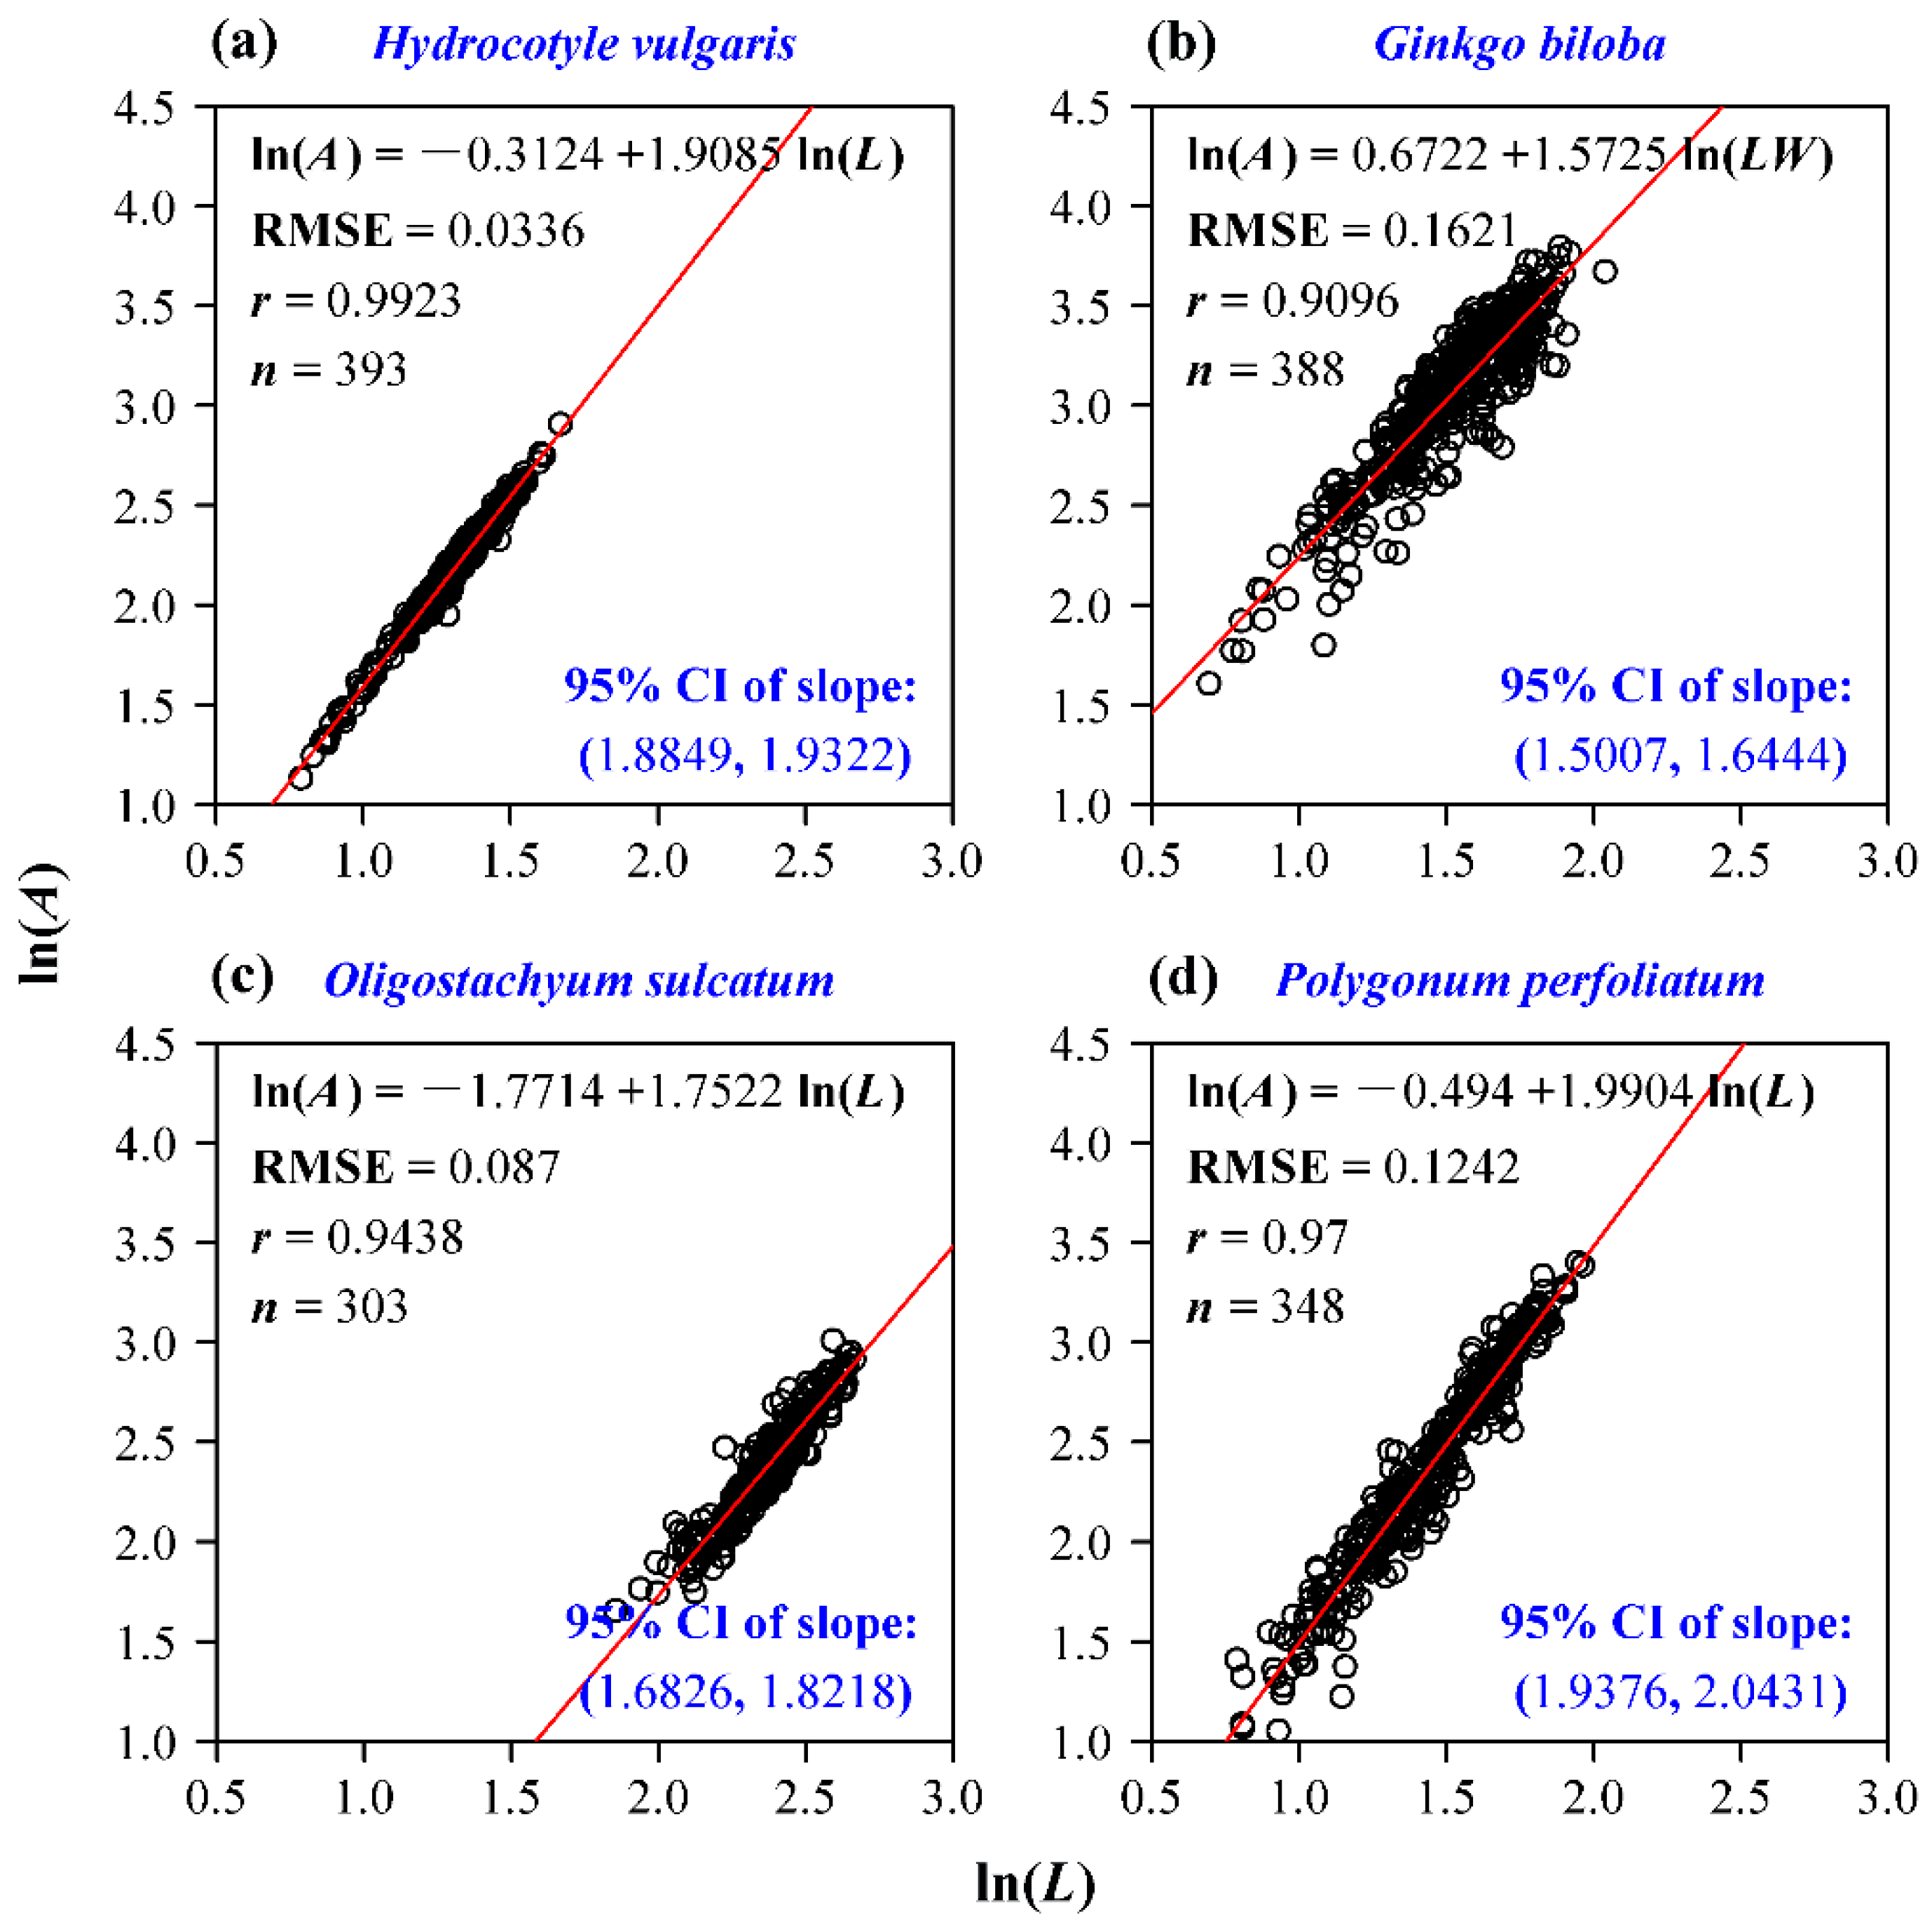
Four groups of data all confirm the validity of the Montgomery equation. Leaf area is demonstrated to be proportional to the product of leaf length and width; the goodness of fit for each data set is high (r > 0.985; Figure 2). The estimate of the Montgomery parameter for H. vulgaris is 0.7673, which is slightly lower than π/4 (Figure 2a). This means that the leaf shape of H. vulgaris slightly deviates from a standard ellipse. The estimate of the Montgomery parameter of G. biloba is equal to 0.6228, which lies in the range (1/2, π/4) derived from a standard sector (Figure 2b). The estimate of the Montgomery parameter of O. sulcatum is equal to 0.7196, which also falls into the range (0.6795, π/4) derived from a standard SGE shape (Figure 2c). Actually, the estimates of the Montgomery parameter for the 20 bamboo species all fall into that range (Figure 3). Even for the pooled data of 20 bamboo species, the Montgomery equation still validly describes the proportionality of the product of leaf length and width to leaf area, and the estimate of the Montgomery parameter equals 0.7141 (Figure 4). The estimate of the Montgomery parameter of P. perfoliatum equals 0.5497, which is slightly higher than 0.5 derived from a standard triangle (Figure 2d). The 95% confidence intervals corresponding to the aforementioned estimates of the Montgomery parameter are also all between 1/2 and π/4. Overall, all of the estimates lie within the range (1/2, π/4).
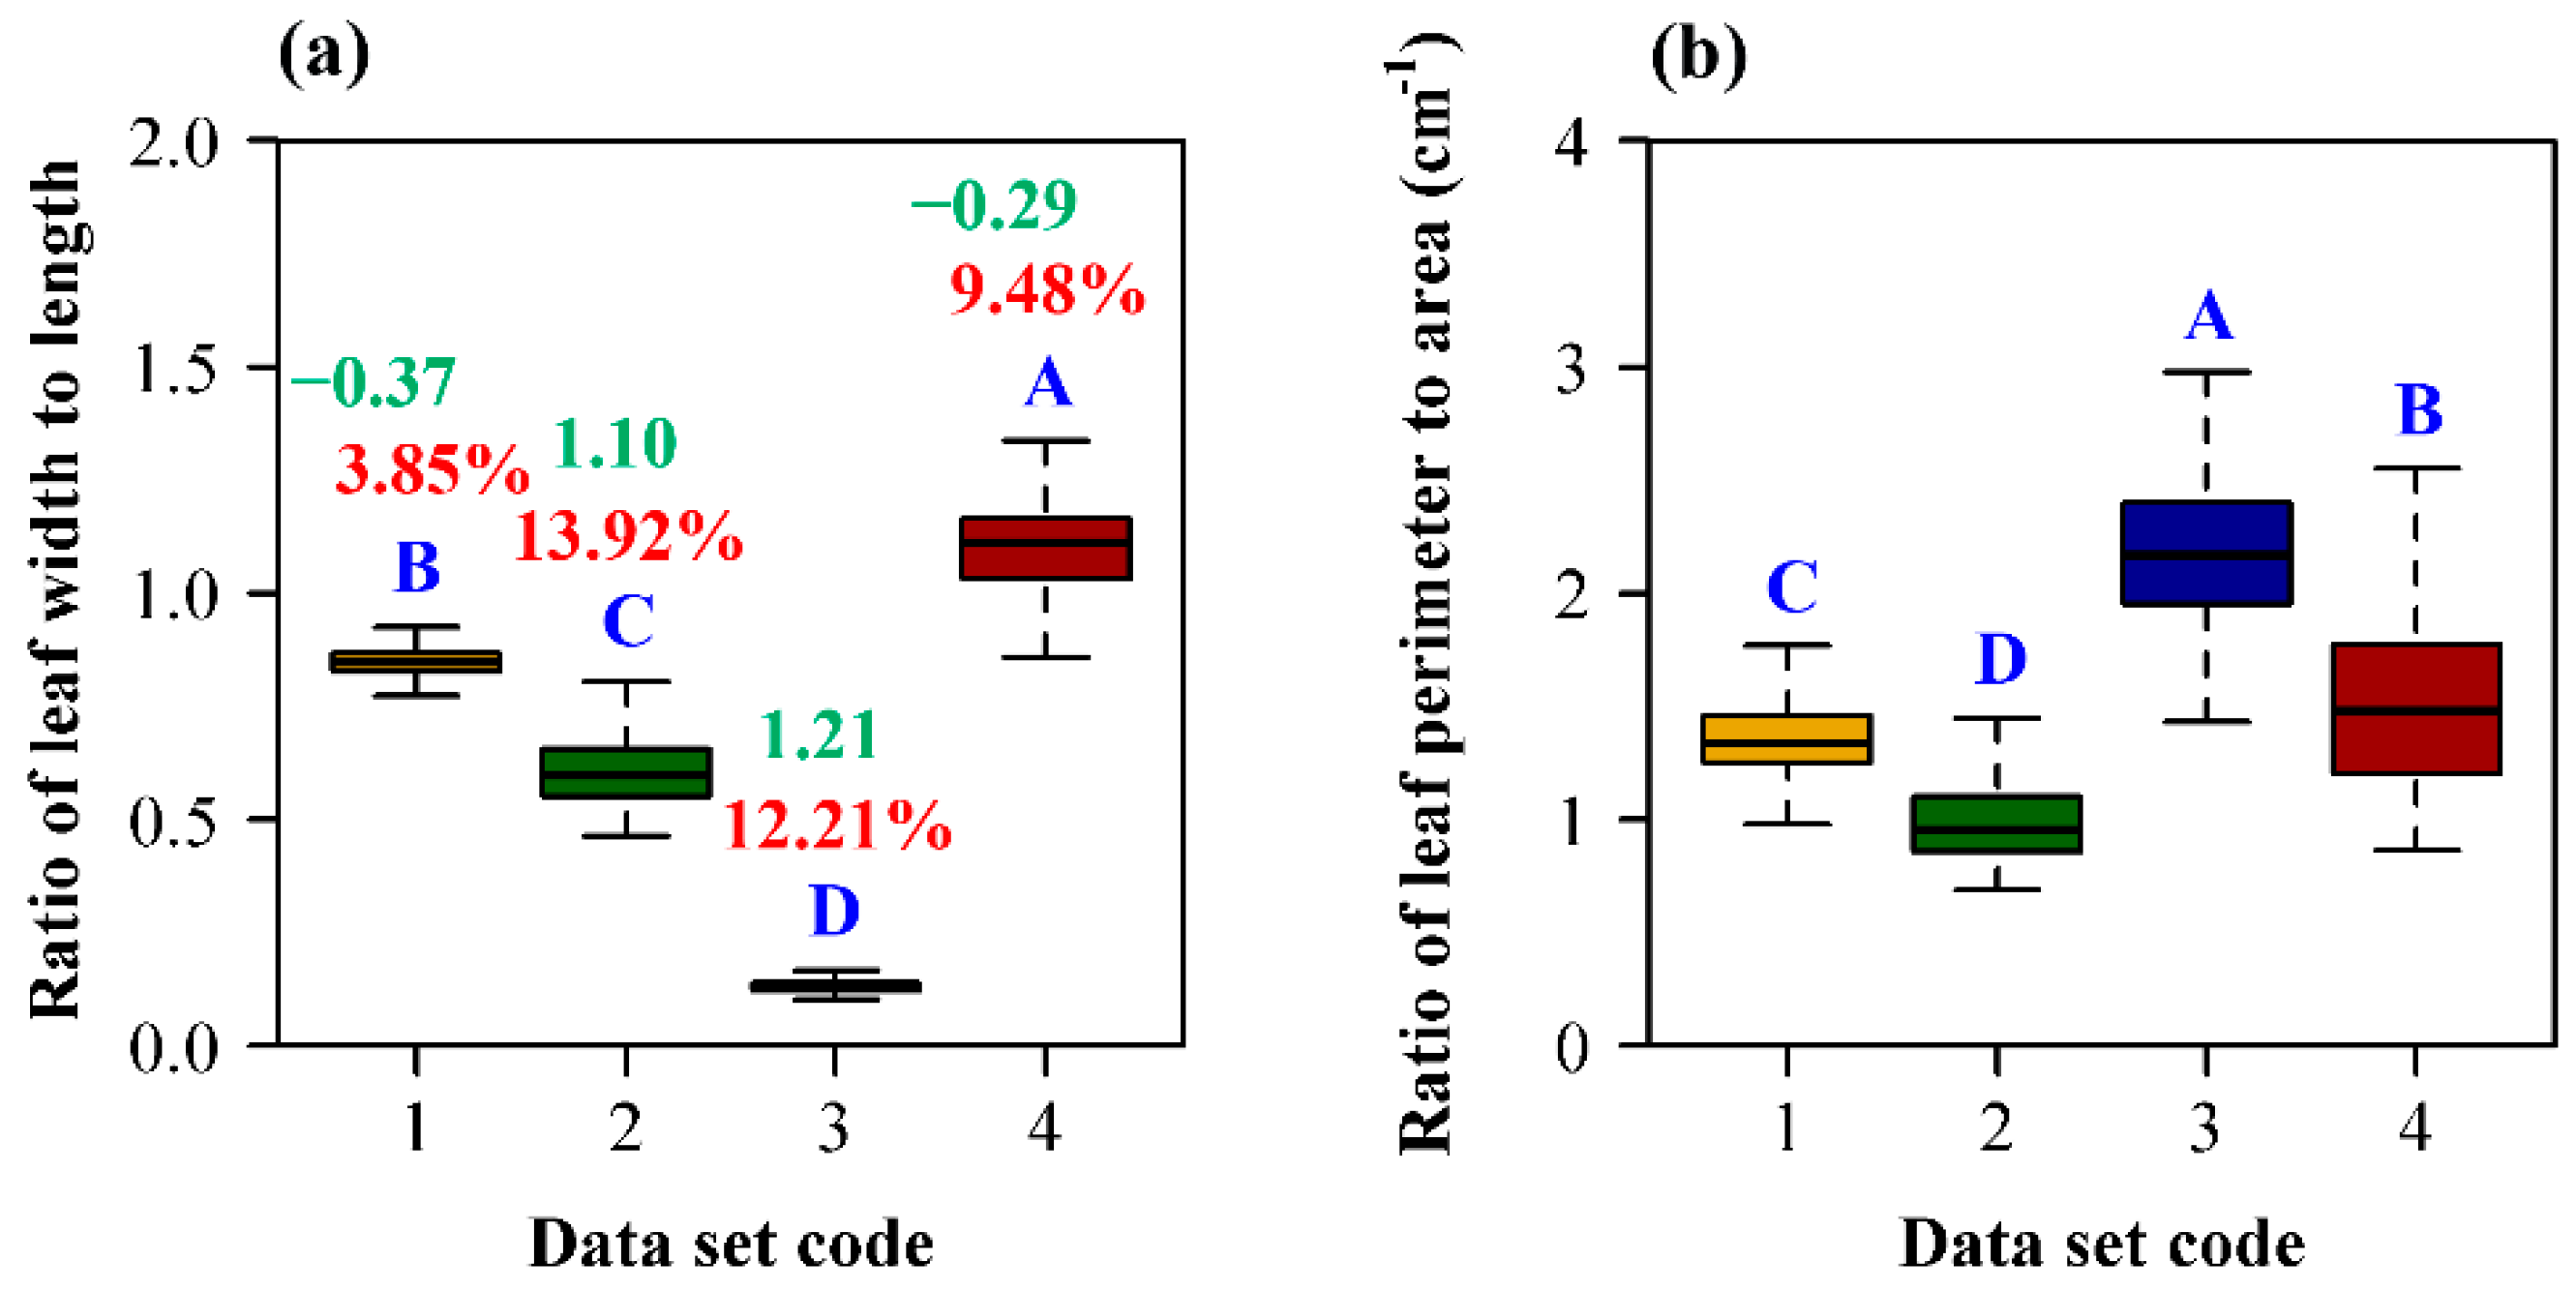
There is a significant difference in the ratio of leaf width to length among the four types of plants. The ratio of leaf width to length of P. perfoliatum is significantly higher than the others, and that of the bamboo is the smallest (Figure 5a). There is also a significant difference in the ratio of leaf perimeter to area among the four types of plants. The ratio of leaf perimeter to area of O. sulcatum is significantly higher than the others, and that of the ginkgo is the smallest (Figure 5b).
4. Discussion
4.1. The Allometric Relationship between Leaf Area and Length
Thompson stated that the area of an object is proportional to its length squared [14]. However, for plant leaves, this principle does not always hold [6]. Figure 6 shows the fitted results using the log-transformed data of leaf area and length. We found that the estimates of the slopes for H. vulgaris and P. perfoliatum are approximately equal to 2, whereas the estimates of another two species especially G. biloba largely deviate from 2. According to our recent studies [6,8], we found that whether leaf area is proportional to leaf length squared mainly depends on the extent of variation of the ratio of leaf width to length and the skewness of the ratio distribution curve. The coefficients of variation of the ratio of leaf width to length of H. vulgaris and P. perfoliatum are lower than those of the other two plant species (Figure 5a). Although the extent of the variation of the W/L ratio of H. vulgaris is smaller than that of P. perfoliatum, the estimate of the latter is closer to 2 than that of the former. We believe that a larger absolute value of the skewness of the W/L ratio of H. vulgaris compared to that of P. perfoliatum should lead to a larger deviation of the estimate of the slope from 2. The current findings are in accord with the report of our previous study [8]. This means that a small variation and a small absolute value of the skewness of the W/L ratio will result in a 2-power law for the leaf area–length allometry. Lin et al. [10] showed that several bamboo leaves followed the 2-power law between leaf area and length. However, for more bamboo species, the leaf area–length allometry appeared to deviate from the 2-power law to some degree [6]. For H. vulgaris and P. perfoliatum, their leaf shapes appear to be more bilaterally symmetrical, so the extents of variation are both low. However, for the leaves of G. biloba, the angles formed by two sides have a large variation because of the phenomenon of heterophylly [15], which consequently leads to a large variation in the W/L ratio.
4.2. The Original Gielis Equation and Its Validity in Describing Leaf Shape
Gielis proposed a polar coordinate equation to describe the shapes of many objects [16]. Tian et al. [17] reparameterized this equation to improve the model’s close-to-linear performance during the non-linear regression [18,19,20]:
Here, r is the polar radius at the polar angle φ; m is a positive integer that is used to control the number of the angles of the shape; λ, γ, n1, n2, and n3 are the constants to be fitted. Figure 7 exhibits the fitted results using the Gielis equation for the leaf edges of three species. The predicted edges are basically the same as the actual leaf edges, and the predicted areas are very approximate to the scanned leaf areas (see Table S2 in the online Supplementary Materials for details). We did not fit the leaf edge of G. biloba. It is actually easy to describe the arc of a sector. We only need to designate φ to range from 0 to a certain angle (not up to 2π) according to the circular (or elliptical) equation, which also could be simulated by the Gielis equation. However, it is difficult for us to find a suitable parameter combination to make the Gielis equation generate a sector. There is also the possibility that the Gielis equation cannot generate a standard sector or approximate it. Shi et al. [8] stated that the simplified Gielis equation was able to calculate the leaf shapes of many broad-leaved plants by introducing a floating ratio in leaf length. From the current study, since leaf area is proportional to the product of leaf length and width, keeping leaf width constant but increasing or decreasing leaf length will make the predicted leaf area more closely approach its actual value.
4.3. The Angle of G. biloba
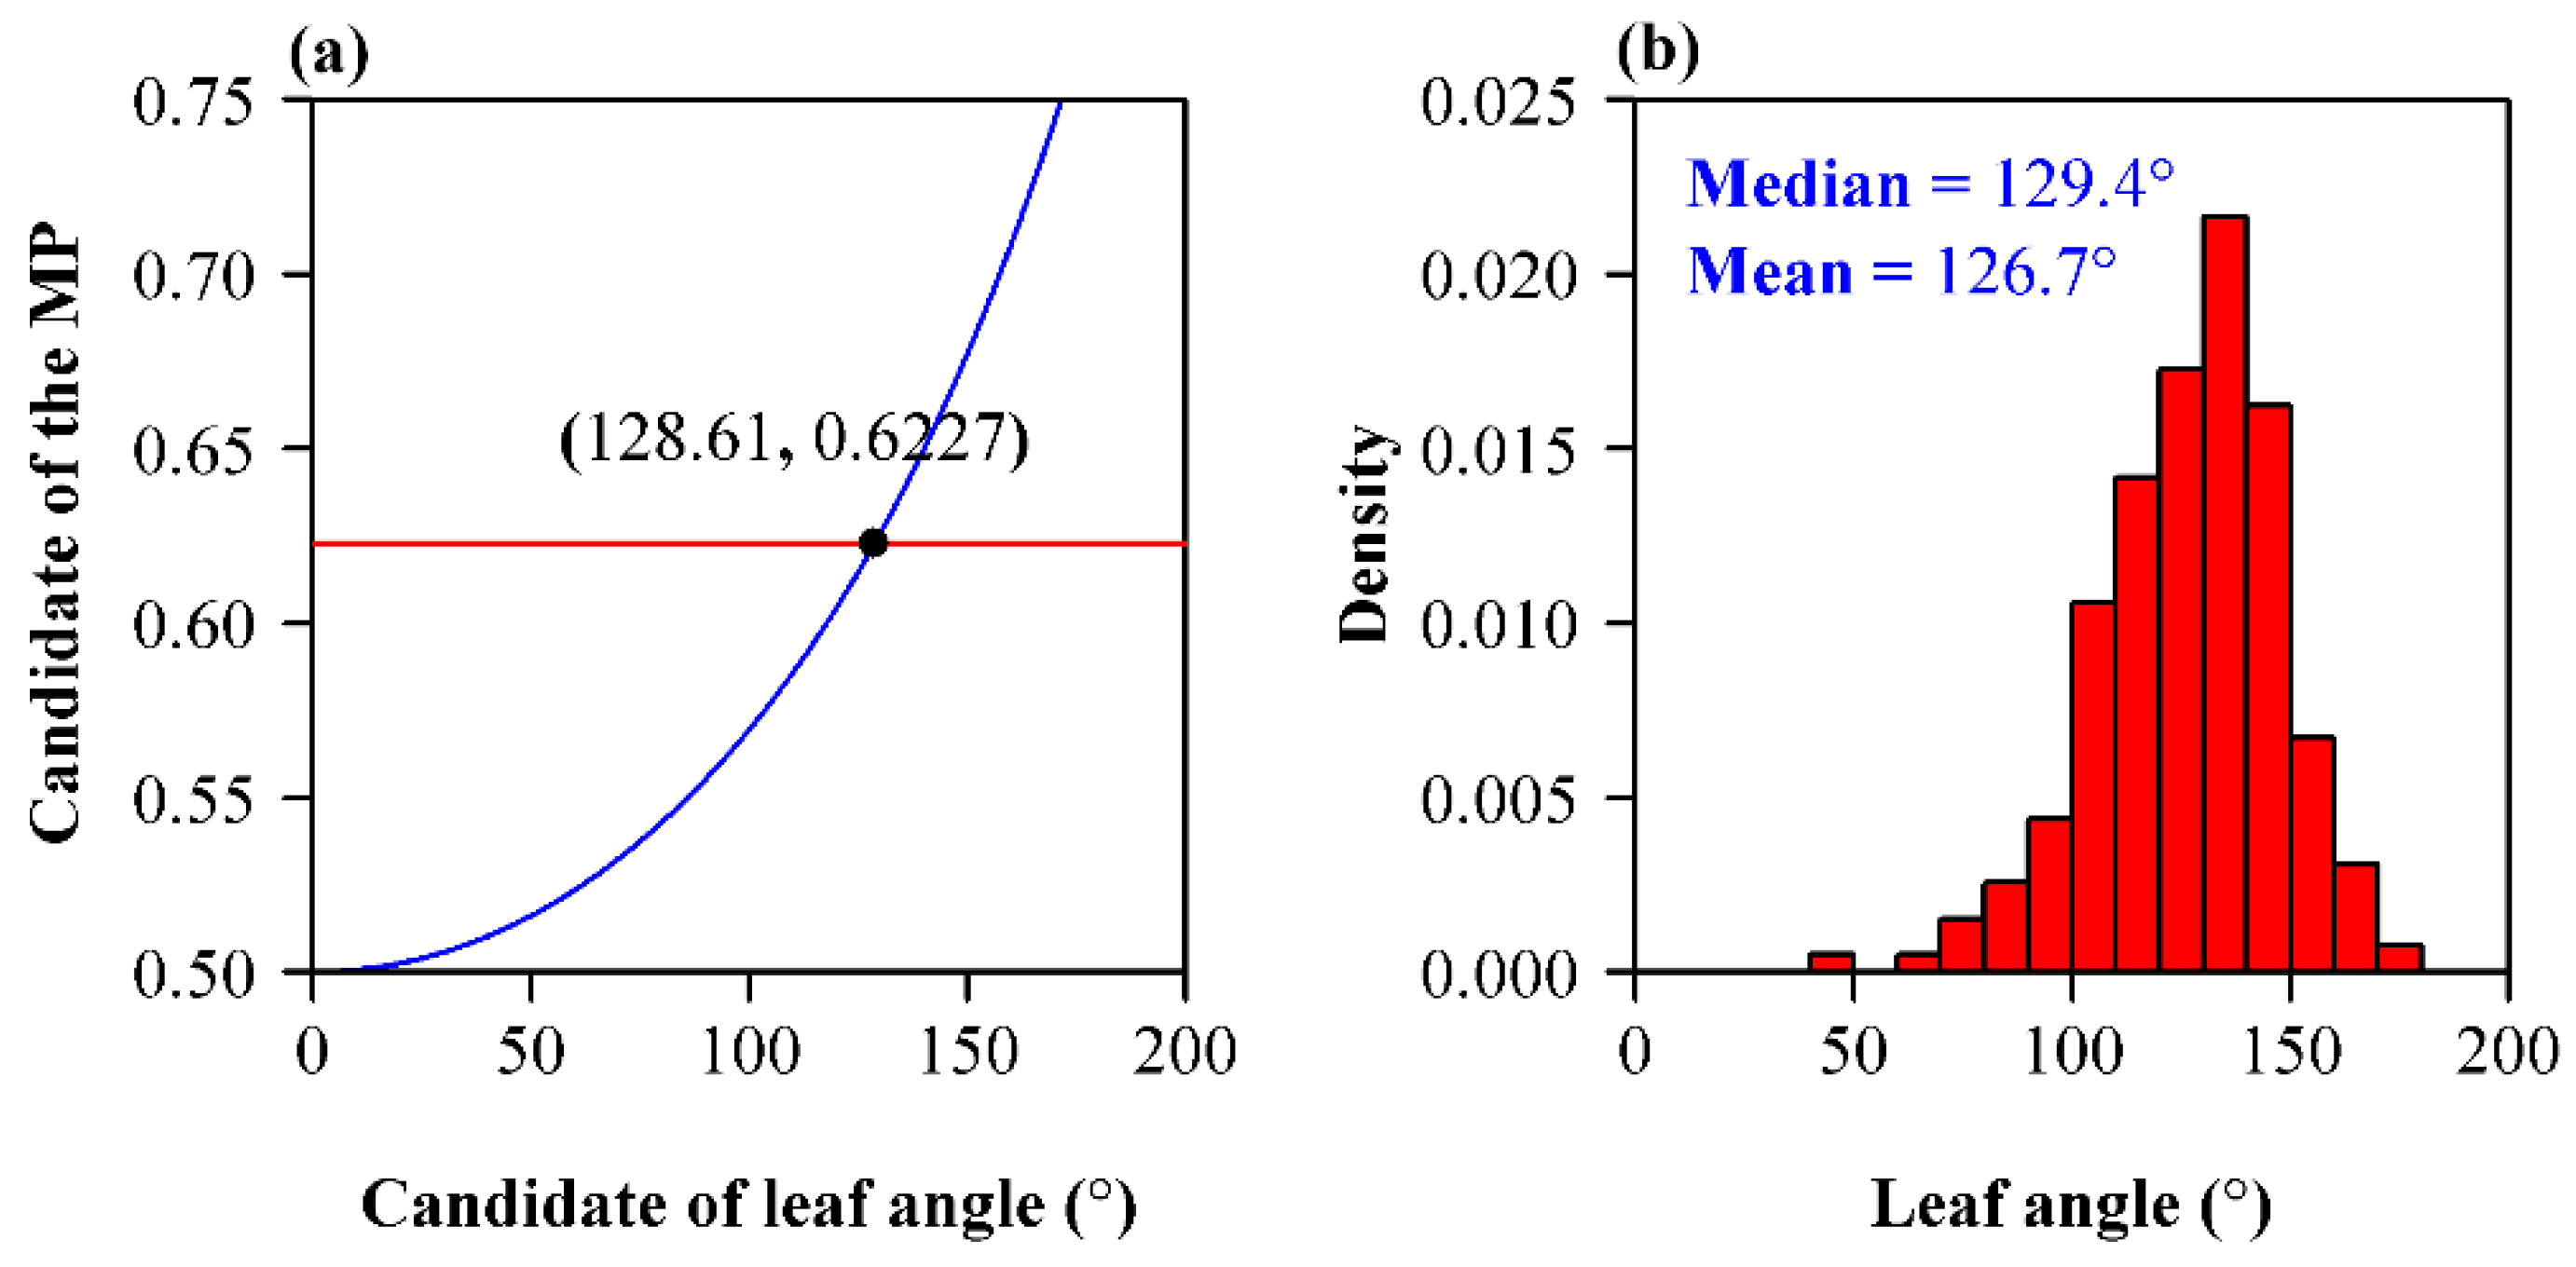
G. biloba is a precious relic tree species that has significant economic value. It has five cultivars according to seed morphology [17,21]. Its leaf shape and leaf vein pattern have received considerable attention [22,23]. Although the leaves of G. biloba do exhibit a deviation from perfect bilateral symmetry, the areal ratios of the left side to the right side tend to be 1, which indicates that the left deviation and the right deviation from bilateral symmetry are basically the same [23]. Leigh et al. [15] compared two types of different leaves of G. biloba, short- and long-shoot leaves, and found that both the structure and physiology of these two types of leaves were significantly different. Niklas and Christianson [24] studied the leaf weight–area allometries of 13 biologically distinct categories of leaves of G. biloba, and they obtained seven statistically significantly different models describing the scaling of leaf weight and area. The current study demonstrates that the Montgomery equation can hold regardless of the difference in leaf shape of G. biloba. However, whether the Montgomery parameters from different cultivars or geographical populations of G. biloba have significant differences deserves further investigation. In addition, the Montgomery equation is helpful to quantify the angles of the leaves of G. biloba. Because the leaf of G. biloba is not a standard sector, it creates difficulties for investigators who attempt to measure and compare the angles of different cultivars or geographical populations. The angles of leaves might also reflect the hydraulic limitation of heterophylly in this tree species. We cannot obtain the analytical solution of the angle θ in Equation (3), but its numerical solution can be easily obtained. Figure 8a shows the numerical solution of the leaf angle of the population of G. biloba based on the Montgomery parameter; Figure 8b shows the histograms of the numerical solutions of the angles of all leaves sampled based on A/(LW). We found that the solution (= 128.6°) based on the estimate of the Montgomery parameter is approximately equal to the median of the estimates of the angles (= 129.4°) based on all individual leaves.
4.4. Why Do We Choose to Use the Montgomery Equation?
The Montgomery equation shows a simple proportional relationship between leaf area and the product of leaf length and width. The main value of this parametric equation is that it opens a door to predict the leaf area based on leaf length and width among different species within the same taxon. In another relevant study [6], we demonstrated that the relationship of leaf area vs. the product of leaf length and width for closely related species followed the Montgomery equation. This means that the data of leaf area vs. the product of leaf length and width for those species within the taxonomic unit such as a genus, a subfamily, and even a family exhibit a linear relationship on a planar surface. However, the leaf shapes of closely related species might have a certain degree of variation, which renders it unsuitable to use elliptical Fourier analysis or other more complex/descriptive metrics of leaf shape. Although the above advanced technology could measure the extent of similarity for the leaf shapes, the same leaf shapes might come from species that are unrelated in their genetic relationships. However, the proportional relationship reflected by the Montgomery equation appears to be superior to the aforementioned complex/descriptive metrics of leaf shape. At least, according to our recent study for six classes of plants, the proportional relationship for the pooled data of leaf area vs. the product of leaf length holds [6]. In this case, we advocate using a parametric model like the Montgomery equation to reveal the relationship among leaf basic morphological indices. We admit that multiple leaf shapes could generate the same or similar estimates of the Montgomery parameter; however, this result (namely the same or similar estimates of the Montgomery parameter for different leaf shapes) might imply that leaves may come from the same ancestor regardless of the difference of leaf shape. For closely related species, the difference in leaf shape does not cause the data of leaf area vs. the product of leaf length and width to largely deviate from a proportional relationship (e.g., the 12 species of Rosaceae reported in ref. [6]). After all, the shoots and leaves of vascular plants experienced an explosive radiation around 430 million years ago [25]. The morphological difference of leaves might result from the distinct gene expression pattern in a particular location like the leaf base [26]. In this case, it is meaningless to use a complex/descriptive metric for measuring the extent of leaf similarity. When we obtain the Montgomery parameter based on a limited sample size (that is surely destructive for sampled leaves), the remaining prediction work is then non-destructive. In the field, it is obviously easier to measure leaf length and width than to measure leaf area. Although there are some non-destructive methods (e.g., Leaf-IT [27]) that could directly measure leaf area in the field, the requirements of the work environment are usually rigorous (e.g., the requirement for a strong color contrast between a leaf and its background). In addition, the Montgomery equation can be simplified to A = cL2 if the coefficient of variation of the ratio of leaf width to length is small [6,8]. As a result, it will further reduce the workload in the field because we only need to measure leaf length for calculating its area. In the present study, we do not state that different leaf shapes must have different Montgomery parameters. In fact, in another study, we also did not say that [6]. We actually intend to show that the estimates of the Montgomery parameters from different species are confined to a small range from 1/2 to π/4. In the present study, we chose four types of leaf shapes that could be described by four explicit mathematical models so that we could accurately derive the theoretical range of the Montgomery parameter corresponding to each leaf shape.
5. Conclusions
In the current study, we studied the proportional relationship between leaf area and the product of leaf length and leaf width for four types of leaf shapes (namely elliptical, sectorial, linear, and triangular leaf shapes). We found that the Montgomery equation (A = kLW, where k is the Montgomery parameter) holds for the four types of leaf shapes. By using the elliptical, sectorial, and triangular area formulae, we derived theoretically that the Montgomery parameter should range from 1/2 to π/4; by using the area formula based on the simplified Gielis equation, we found that the Montgomery parameter for the linear leaf shape ranges from 0.6795 to π/4. We also used the actual leaves of four types of plants to test the above derivations, and we found that the conclusions drawn from the mathematical derivation were supported by the actual data sets. Considering that the estimates of the Montgomery parameter of the six classes of plants we recently reported also fell into the range of (1/2, π/4), we believe that the Montgomery model appears to apply to broad-leaved plants with different leaf shapes. It reflects the stability of the proportional relationship between leaf area and the product of leaf length and width during leaf evolution. The Montgomery parameters for different species and taxa were found to be different, which are beneficial for the interpretation of the difference in photosynthetic potentials, because the complexity of leaf shape can have a significant influence on the photosynthetic potentials of plants.
Supplementary Materials
The following are available online at https://www.mdpi.com/1999-4907/10/2/178/s1, Table S1. Collection information of 20 bamboo species; Table S2. The Gielis fit to the leaf edge data of three species of plants.
Author Contributions
P.S. and D.A.R. designed the experiment and contributed equally to this work; M.L. and X.Y. carried out the field experiment; P.S., J.G., and D.A.R. analyzed the data and wrote the manuscript. All authors read and commented on this manuscript.
Funding
This research was funded by the Priority Academic Program Development of Jiangsu Higher Education Institutions (grant number: no number).
Acknowledgments
We are thankful to Ping Wang, Xiao Zheng, and Jialu Su for their useful help during the preparation of this manuscript.
Conflicts of Interest
The authors declare no conflict of interest.
References
- Smith, W.K.; Vogelmann, T.C.; DeLucia, E.H.; Bell, D.T.; Shepherd, K.A. Leaf form and photosynthesis: Do leaf structure and orientation interact to regulate internal light and carbon dioxide? BioScience 1997, 47, 785–793. [Google Scholar] [CrossRef]
- Nicotra, A.B.; Leigh, A.; Boyce, C.K.; Jones, C.S.; Niklas, K.J.; Royer, D.L.; Tsukaya, H. The evolution and functional significance of leaf shape in the angiosperms. Funct. Plant Biol. 2011, 38, 535–552. [Google Scholar] [CrossRef]
- Montgomery, E.G. Correlation Studies in Corn, Annual Report No. 24; Nebraska Agricultural Experimental Station: Lincoln, NB, USA, 1911; pp. 108–159. [Google Scholar]
- Jani, T.C.; Misra, D.K. Leaf area estimation by linear measurements in Ricinus communis. Nature 1966, 212, 741–742. [Google Scholar] [CrossRef]
- Palaniswamy, K.M.; Gomez, K.A. Length-width method for estimating leaf area of rice. Agron. J. 1974, 66, 430–433. [Google Scholar] [CrossRef]
- Shi, P.; Liu, M.; Ratkowsky, D.A.; Gielis, A.; Su, J.; Yu, X.; Wang, P.; Zhang, L.; Lin, Z.; Schrader, J. Leaf area-length allometry and its implications in leaf-shape evolution. Trees Struct. Funct. 2019. in review. [Google Scholar]
- Shi, P.; Xu, Q.; Sandhu, H.S.; Gielis, J.; Ding, Y.; Li, H.; Dong, X. Comparison of dwarf bamboos (Indocalamus sp.) leaf parameters to determine relationship between spatial density of plants and total leaf area per plant. Ecol. Evol. 2015, 5, 4578–4589. [Google Scholar] [CrossRef] [PubMed]
- Shi, P.; Ratkowsky, D.A.; Li, Y.; Zhang, L.; Lin, S.; Gielis, J. General leaf-area geometric formula exists for plants—Evidence from the simplified Gielis equation. Forests 2018, 9, 714. [Google Scholar] [CrossRef]
- Lin, S.; Zhang, L.; Reddy, G.V.P.; Hui, C.; Gielis, J.; Ding, Y.; Shi, P. A geometrical model for testing bilateral symmetry of bamboo leaf with a simplified Gielis equation. Ecol. Evol. 2016, 6, 6798–6806. [Google Scholar] [CrossRef] [PubMed] [Green Version]
- Lin, S.; Shao, L.; Hui, C.; Song, Y.; Reddy, G.V.P.; Gielis, J.; Li, F.; Ding, Y.; Wei, Q.; Shi, P. Why does not the leaf weight-area allometry of bamboos follow the 3/2-power law? Front. Plant Sci. 2018, 9, 583. [Google Scholar] [CrossRef] [PubMed]
- Shi, P.; Huang, J.; Hui, C.; Grissino-Mayer, H.D.; Tardif, J.; Zhai, L.; Wang, F.; Li, B. Capturing spiral radial growth of conifers using the superellipse to model tree-ring geometric shape. Front. Plant Sci. 2015, 6, 856. [Google Scholar] [CrossRef] [PubMed]
- R Core Team. R: A Language and Environment for Statistical Computing. R Foundation for Statistical Computing: Vienna, Austria, 2015. Available online: https://www.R.-project.org/ (accessed on 17 April 2018).
- Hsu, J.C. Multiple Comparisons: Theory and Methods; Chapman and Hall/CRC: New York, NY, USA, 1996. [Google Scholar]
- Thompson, D.W. On Growth and Form; Cambridge University Press: London, UK, 1917. [Google Scholar]
- Leigh, A.; Zwieniecki, M.A.; Rockwell, F.E.; Boyce, C.K.; Nicotra, A.B.; Holbrook, N.M. Structural and hydraulic correlates of heterophylly in Ginkgo biloba. New Phytol. 2011, 189, 459–470. [Google Scholar] [CrossRef] [PubMed]
- Gielis, J. A generic geometric transformation that unifies a wide range of natural and abstract shapes. Am. J. Bot. 2003, 90, 333–338. [Google Scholar] [CrossRef] [PubMed] [Green Version]
- Tian, F.; Wang, Y.; Sandhu, H.S.; Gielis, J.; Shi, P. Comparison of seed morphology of two ginkgo cultivars. J. For. Res. 2018, in press. [Google Scholar] [CrossRef]
- Bates, D.M.; Watts, D.G. Nonlinear Regression Analysis and its Applications; Wiley: New York, NY, USA, 1988. [Google Scholar]
- Ratkowsky, D.A. Nonlinear Regression Modeling: A Unified Practical Approach; Marcel Dekker: New York, NY, USA, 1983. [Google Scholar]
- Ratkowsky, D.A.; Reddy, G.V.P. Empirical model with excellent statistical properties for describing temperature-dependent developmental rates of insects and mites. Ann. Entomol. Soc. Am. 2017, 110, 302–309. [Google Scholar] [CrossRef]
- He, F.R. Cultivation of Ginkgo biloba L. Trees; Phoenix Science Press: Nanjing, China, 1989. (In Chinese) [Google Scholar]
- Runions, A.; Fuhrer, M.; Lane, B.; Federl, P.; Rolland-Lagan, A.-G.; Prusinkiewicz, P. Modeling and visualization of leaf venation patterns. ACM Trans. Gr. 2005, 24, 702–711. [Google Scholar] [CrossRef]
- Shi, P.; Zheng, X.; Ratkowsky, D.A.; Li, Y.; Wang, P.; Cheng, L. A simple method for measuring the bilateral symmetry of leaves. Symmetry 2018, 10, 118. [Google Scholar] [CrossRef]
- Niklas, K.J.; Christianson, M.L. Differences in the scaling of area and mass of Ginkgo biloba (Ginkgoaceae) leave and their relevance to the study of specific leaf area. Am. J. Bot. 2011, 98, 1381–1386. [Google Scholar] [CrossRef] [PubMed]
- Harrison, C.J.; Morris, J.L. The origin and early evolution of vascular plant shoots and leaves. Philos. Trans. R. Soc. Lond. B. Biol. Sci. 2017, 373, 2016496. [Google Scholar] [CrossRef] [PubMed]
- Vlad, D.; Kierzkowski, D.; Rast, M.I.; Vuolo, F.; Dello Ioio, R.; Galinha, C.; Gan, X.; Hajheidari, M.; Hay, A.; Smith, R.S.; et al. Leaf shape evolution through duplication, regulatory diversification, and loss of a homeobox gene. Science 2014, 343, 780–783. [Google Scholar] [CrossRef] [PubMed]
- Schrader, J.; Pillar, G. Leaf-IT: An Android application form measuring leaf area. Ecol. Evol. 2017, 7, 9731–9738. [Google Scholar] [CrossRef] [PubMed]
Figure 1.
Examples of the four types of leaf shapes.

Figure 2.
Linear regression of the Montgomery equation for four species of plants. (a) H. vulgaris; (b) G. biloba; (c) O. sulcatum; (d) P. perfoliatum. In each panel, A denotes leaf area; L represents leaf length; W represents leaf width; RMSE represents the root-mean-square error; r represents the correlation coefficient; n represents the number of leaves sampled; exp() represents the estimate of the Montgomery parameter; 95% CI denotes the 95% confidence interval of the estimate of the Montgomery parameter. Open circles represent the observations, and the red straight line represents the fitted regression line.

Figure 3.
The estimates of the Montgomery parameters (MP) and the correlation coefficients for 20 bamboo species. Blue open circles represent the estimates of the MP; and red open triangles represent the correlation coefficients. The number on the x-axis represents the bamboo species code (see Table S1 in the online Supplementary Materials for details).

Figure 4.
Linear regression of the Montgomery equation for the pooled data of 20 bamboo species. A denotes leaf area; L represents leaf length; W represents leaf width; RMSE represents the root-mean-square error; r represents the correlation coefficient; n represents the number of leaves sampled; exp() represents the estimate of the Montgomery parameter; 95% CI denotes the 95% confidence interval of the estimate of the Montgomery parameter. Open circles (among which different colors represent different bamboo species) represent the observations, and the solid straight line represents the fitted regression line.

Figure 5.
Comparison of the ratios of leaf width to length (and the ratios of leaf perimeter to area) among the four species of plants. (a) The ratio of leaf width to length; (b) the ratio of leaf perimeter to area. In panel (a), the red percentage number above the box is the coefficient of variation of the ratios of leaf width to length; the green number above the box is the skewness of the ratios of leaf width to length. The letters A, B, C, and D in each panel were used to indicate a significant difference of species means using Tukey’s HSD (α = 0.05). Data set 1 represents H. vulgaris; data set 2 represents G. biloba; data set 3 represents O. sulcatum; data set 4 represents P. perfoliatum.

Figure 6.
Linear regression of the leaf area–length allometry for the four species of plants. (a) H. vulgaris; (b) G. biloba; (c) O. sulcatum; (d) P. perfoliatum. In each panel, A denotes leaf area; L represents leaf length; RMSE represents the root-mean-square error; r represents the correlation coefficient; n represents the number of leaves sampled; 95% CI denotes the 95% confidence interval of the estimate of the slope.

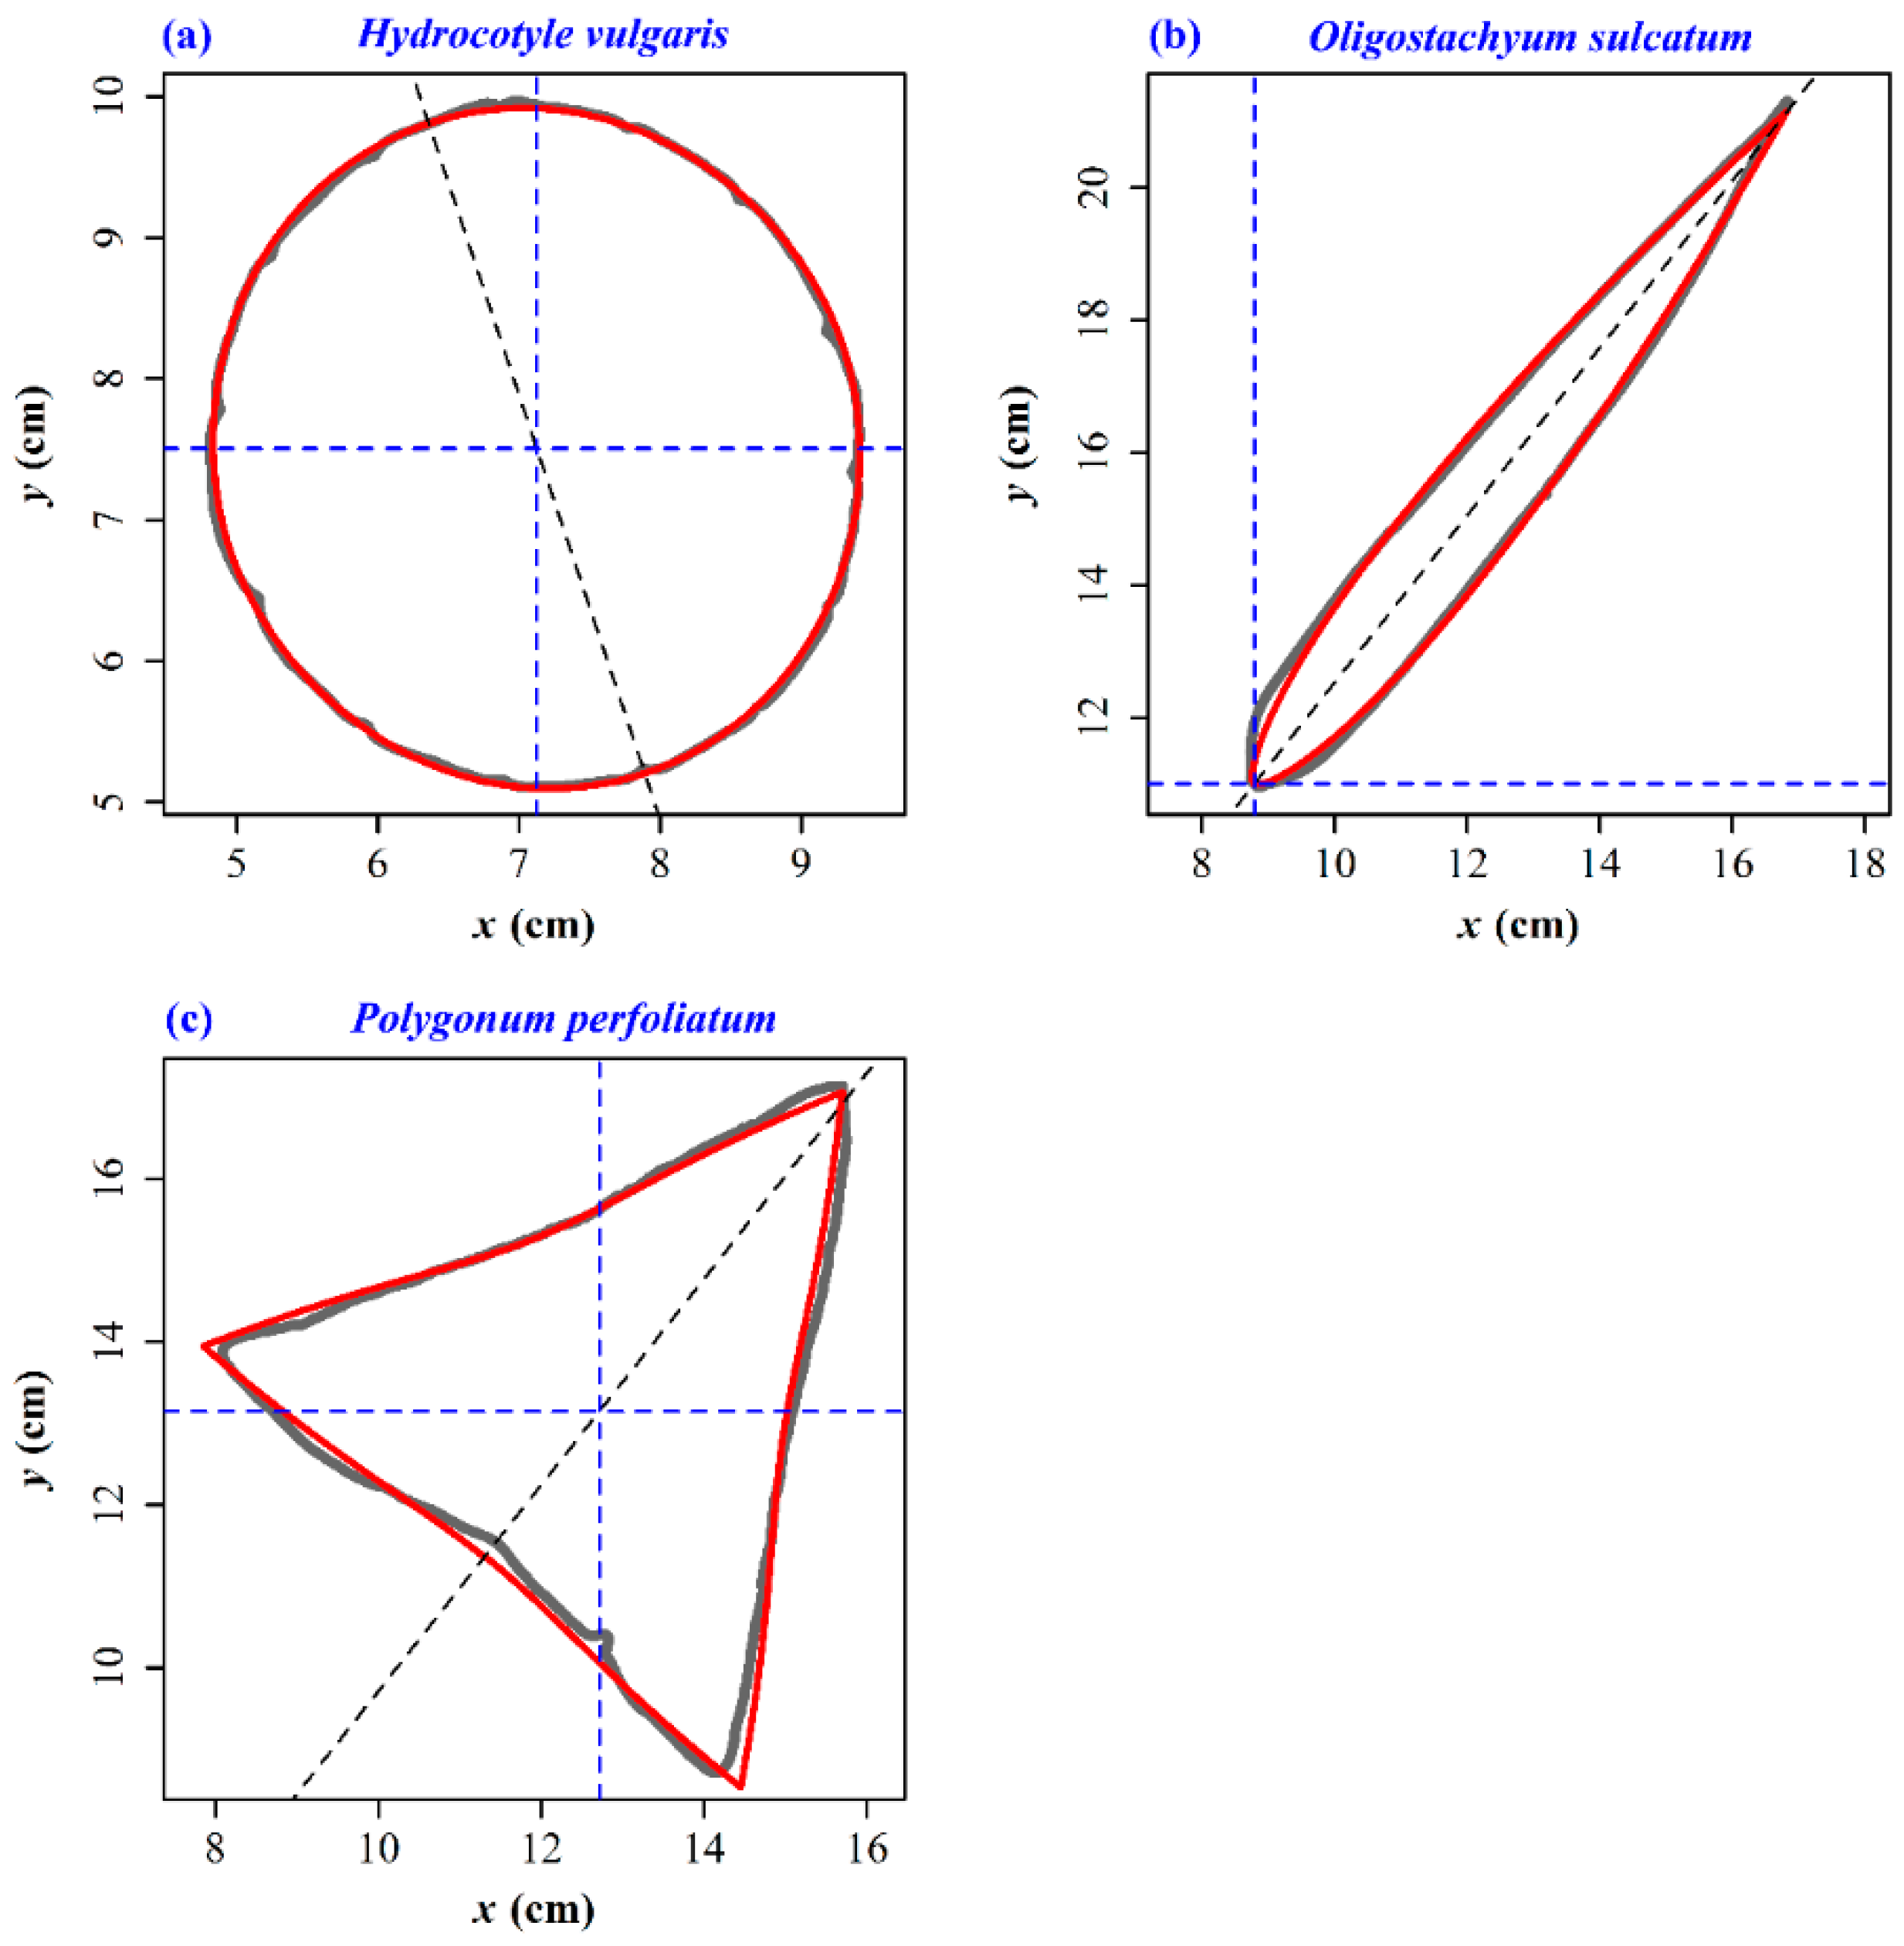
Figure 7.
Gielis fit to the leaf edge data of three species of plants. (a) H. vulgaris; (b) O. sulcatum; (c) P. perfoliatum. The gray curve represents the scanned (observed) leaf edge; the red curve represents the predicted leaf edge by the Gielis equation; the intersection of two blue dashed lines represents the polar point of the Gielis equation; the gray dashed line represents the rotated straight line that was the previous x-axis for a standard Gielis shape.

Figure 8.
Estimation of the leaf angle of G. biloba. (a) Numerical solution of the leaf angle of the population of G. biloba; (b) histogram of the numerical solutions for different individual leaves sampled. In panel (a), the red horizontal straight line represents the estimate of the Montgomery parameter; the blue curve represents (see Equation (3)), where δ represents the candidate of leaf angle that was initially set from π/4000 to π by an increment of π/4000; the point at which the red straight line and the blue curve intersect is used to quantify the leaf angle of the population (namely all the leaves sampled). In panel (b), red bars represent the densities of different groups of leaf angles.


Table 1.
Collection information of four representative leaf shapes. All leaves were collected in Nanjing city, Jiangsu Province, China, in 2018.
Table 1.
Collection information of four representative leaf shapes. All leaves were collected in Nanjing city, Jiangsu Province, China, in 2018.
| Family | Latin Name | Collection Location | Sampling Time | Sample Size |
|---|---|---|---|---|
| Araliaceae | Hydrocotyle vulgaris L. | 32°4′9″ N, 118°48′23″ E | 1 December 2018 | 393 |
| Ginkgoaceae | Ginkgo biloba L. | 32°4′57″ N, 118°48′34″ E | 28 November 2018 | 388 |
| Poaceae | Oligostachyum sulcatum Z.P. Wang et G.H. Ye | 32°4′47″ N, 118°49′2″ E | 21 June 2018 | 303 |
| Polygonaceae | Polygonum perfoliatum L. | 31°36′19″ N, 119°10′35″ E | 30 September 2018 | 348 |
© 2019 by the authors. Licensee MDPI, Basel, Switzerland. This article is an open access article distributed under the terms and conditions of the Creative Commons Attribution (CC BY) license (http://creativecommons.org/licenses/by/4.0/).
Share and Cite
MDPI and ACS Style
Shi, P.; Liu, M.; Yu, X.; Gielis, J.; Ratkowsky, D.A. Proportional Relationship between Leaf Area and the Product of Leaf Length and Width of Four Types of Special Leaf Shapes. Forests 2019, 10, 178. https://doi.org/10.3390/f10020178
AMA Style
Shi P, Liu M, Yu X, Gielis J, Ratkowsky DA. Proportional Relationship between Leaf Area and the Product of Leaf Length and Width of Four Types of Special Leaf Shapes. Forests. 2019; 10(2):178. https://doi.org/10.3390/f10020178
Chicago/Turabian StyleShi, Peijian, Mengdi Liu, Xiaojing Yu, Johan Gielis, and David A. Ratkowsky. 2019. "Proportional Relationship between Leaf Area and the Product of Leaf Length and Width of Four Types of Special Leaf Shapes" Forests 10, no. 2: 178. https://doi.org/10.3390/f10020178
Note that from the first issue of 2016, this journal uses article numbers instead of page numbers. See further details here.