Proceeding Paper

Environmental Management of Dredging Activities: Monitoring System and an Empirical Approach to Estimating Values of Background and Limit Turbidity †

1
Department of Civil, Environmental, Land, Building Engineering and Chemistry (DICATECh), Polytechnic University of Bari, 70125 Bari, Italy
2
Bari Port Authority, 70125 Bari, Italy
3
Regional Agency for Environmental Protection, ARPA Puglia, 70126 Bari, Italy
*
Author to whom correspondence should be addressed.
Presented at the International Conference EWaS5, Naples, Italy, 12–15 July 2022.
Environ. Sci. Proc. 2022, 21(1), 12; https://doi.org/10.3390/environsciproc2022021012
Published: 19 October 2022

Abstract

:
The land use, climate change, hydrology, geology and topography determine sediment supply and transport in water resources. However, due to human-made activities, the presence of contaminants, such as heavy metals, nutrients, pesticides and other organic micro-pollutants, threatens the good ecological status of marine systems. In areas with a long record of sedimentation, sediment cores reflect the history of the pollution in each basin. Dredging activities ensure the navigability of harbors and the removal of contaminated sediments. However, an environmental strategy is necessary to achieve the best environmental management practice during a dredging activity. In particular, monitoring the turbidity data produced from the excavation, transport, and placement of dredged sediment is one of the most important management practices to avoid unacceptable ecological impacts. This study presents the environmental management of the dredging activities in the harbor of Bari (Southern Italy, Adriatic Sea), showing the monitoring system and an empirical approach to estimating the values of background and limit turbidity.

1. Introduction

Port areas are characterized by the continuing release and diffusion of contaminants with strong chemical–ecological risks towards the marine ecosystem and human health [1,2,3,4,5,6,7,8,9,10,11,12,13,14,15]. Sediment accumulates in ports for various reasons, both anthropogenically and naturally induced. Often turning basins and berthing areas are reduced to the extent that safe vessel movement is no longer possible, and therefore, dredging activities are necessary. Therefore, when a port expansion project is carried out, it is very important to define an environmental monitoring strategy to assess the state of the marine ecosystem in order to avoid any adverse effects on the environment and also to prepare for the eventually adoption of mitigation measures. The main objective of the monitoring strategy on aquatic components is aimed at controlling the impact of dredging on water-column turbidity. The imposition of a limit on the concentration of total suspended solids in the water column that dredging contractors must comply with during dredging is common for port expansion projects in most parts of the world.
Turbidity is an optical property of water and refers to the amount of the scattering of light by particulate and dissolved matter in water [16,17,18]. In general, the higher the concentration of this matter, such as silt and clay and organic solids, such as (micro)algae and detritus, and dissolved salts, the more turbid the water. Natural turbidity in coastal ecosystems is caused by the re-suspension of debris in the water column by strong wind and wave action. However, turbidity can increase due to stormwater runoff, sewage discharge, industrial wastes, and dredging activities threatening the good ecological status of marine systems [19,20,21,22,23,24,25]. Turbidity is measured in nephelometric turbidity units (NTU), and the most frequently used and accurate device is the nephelometer (turbidimeter).
The objective of this study was to propose an empirical method for turbidity (NTU) threshold determination during dredging conditions for the port of Bari in southern Italy.

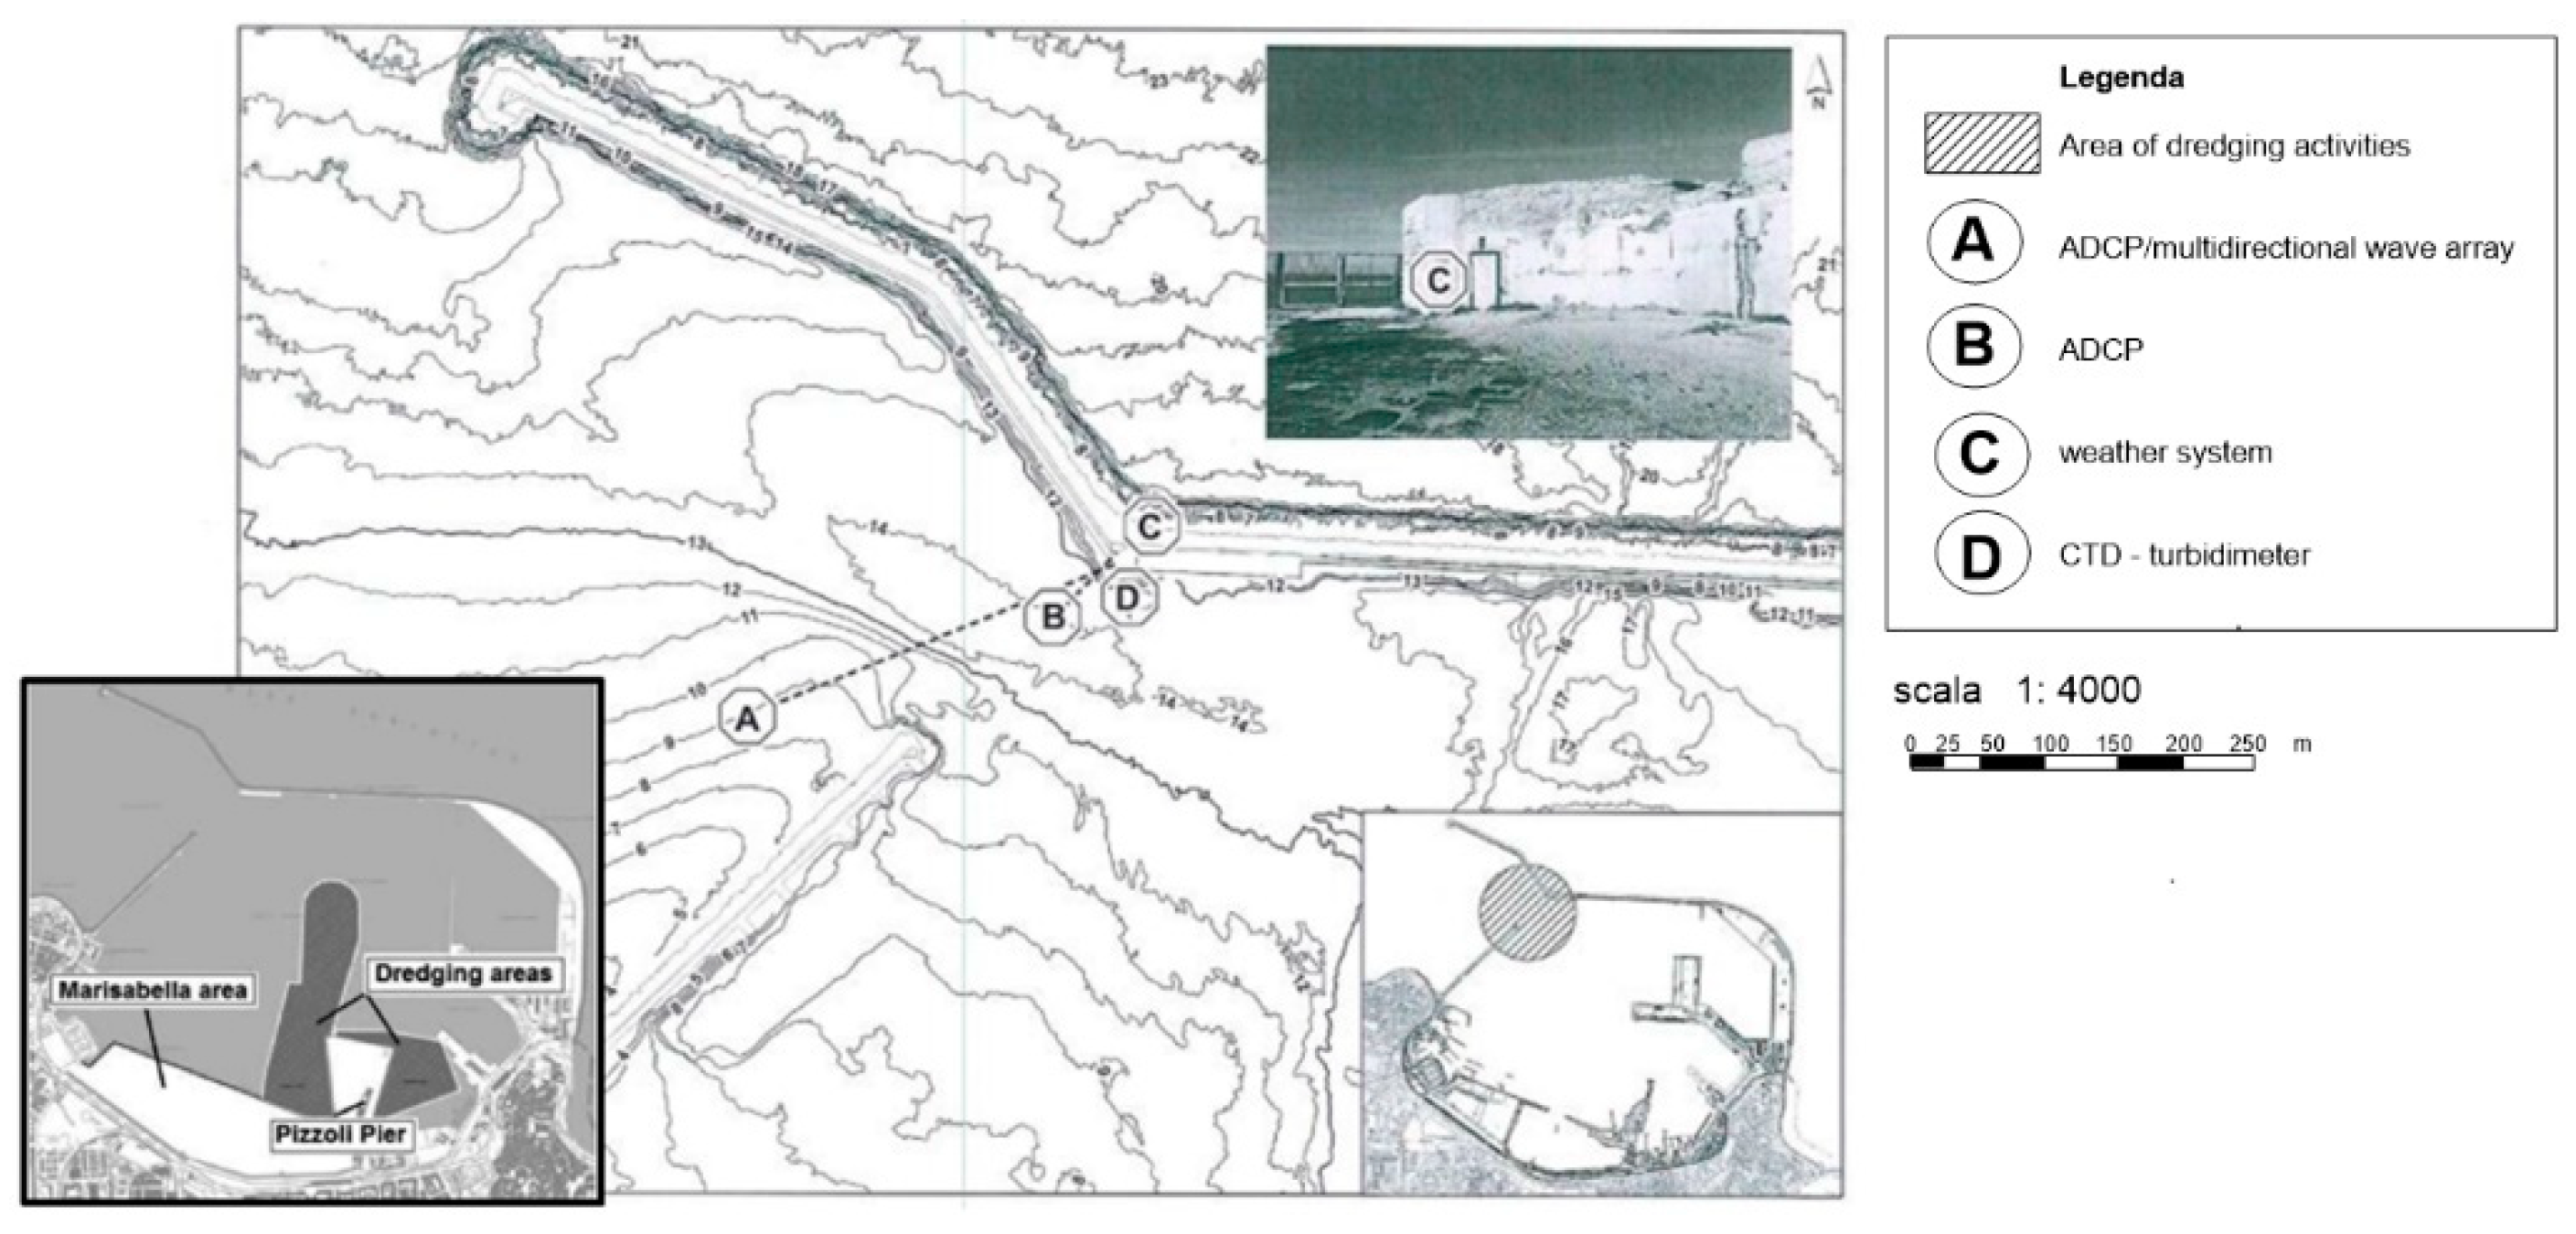
2. Study Site and Description of the Monitoring Meteo-Oceanographic Station

The port of Bari is one of the most important ports in the Mediterranean area. It is traditionally considered the entrance of Europe to the Balkans and Middle-Eastern countries. It has direct sea links with several of these countries, such as Montenegro, Albania, Greece, and Turkey. The port consists of two large eastern and western breakwaters and is divided into five principal basins. The maximum port water depth is equal to about 13 m. Inside the port of Bari, there are some technical-assistance services and fuel supply stations for boats that can be considered the main sources of pollution.
The project for the works to complete the harbor facilities in the area “Pizzoli-Marisabella” has been drawn up with reference to the works of dredging, of filling, and of wharf construction (Figure 1). The dredging activities and the filling of the area of Marisabella would ensure the sustainable efficiency of the basin that, today, is in a negative condition [26,27,28,29].
Four different monitoring phases have been identified to control the state of the environments: ante-operam, work in progress, post-operam, and operational.
During the ante-operam phase, a monitoring activity has been carried out in order to acquire information on the natural variability of the area’s characteristics and to properly calibrate the monitoring activities provided for in the later stages. In particular, in this phase, an empirical method for turbidity (NTU) threshold determination has been carried out.
In February 2019, to start collecting some information about the hydrodynamic state of the basin, a monitoring meteo-oceanographic station was installed in the port of Bari (Figure 1). The station is provided with many instruments, including a weather system (Station C), a CTD (Station D), a bottom-mounted Acoustic Doppler Current Profile (ADCP)/a multidirectional wave array (Station A), and a bottom-mounted Acoustic Doppler Current Profile (ADCP) (Station B). In detail, the weather system combines an ultrasonic wind speed and direction sensor providing averaged values every 15 min. The bottom-mounted Acoustic Doppler Current Profile (ADCP) with a multidirectional wave array (Station A), located at the geographical coordinates 41°08′32.8304″ N and 016°51′02.53512″ E, provides hourly averaged values of the velocity and direction of sea currents along the water column with a 0.50 m vertical bin resolution. The bottom-mounted Acoustic Doppler Current Profile (ADCP), located at the geographical coordinates 41°08′35.47932″ N and 016°51′15.42708″ E (Station B), provides hourly averaged values of the velocity and direction of sea currents along the water column with a 0.50 m vertical bin resolution.
The CTD (Station D), located at the geographical coordinates 41°08’36.93″ N and 016°51’18.56″ E, provides hourly averaged values of water conductivity, water temperature, water pressure, dissolved oxygen, chlorophyll, and turbidity.
The dataset has been processed with quality-control procedures, and data has been flagged following SeaDataNet protocols. In particular, dataset quality control has been carried out with the following steps:
-
maintenance and calibration of instruments twice a year in specialized laboratories;
-
visual inspection of the time series (e.g., time-series plot, current vector scatter plot, progressive vector diagram);
-
combined screening of related parameters such as current speed and current direction or salinity and temperature to identify spurious values;
-
flagging of spikes in the data;
-
flagging of suspicious data or correcting data after consultation with the data supplier;
-
checking against other data collected on nearby moorings or measured during monitoring survey using two vessel-mounted acoustic Doppler current profilers (VM-ADCPs).
In Table 1, the main meteo-oceanographic variables have been marked up with the SeaDataNet common vocabularies from Library P01, P02, and P03 (https://vocab.seadatanet.org/search vocabularies P01, P02, P03, accessed on 19 February 2019) and divided as follows:

3. Analysis of Monitored Data

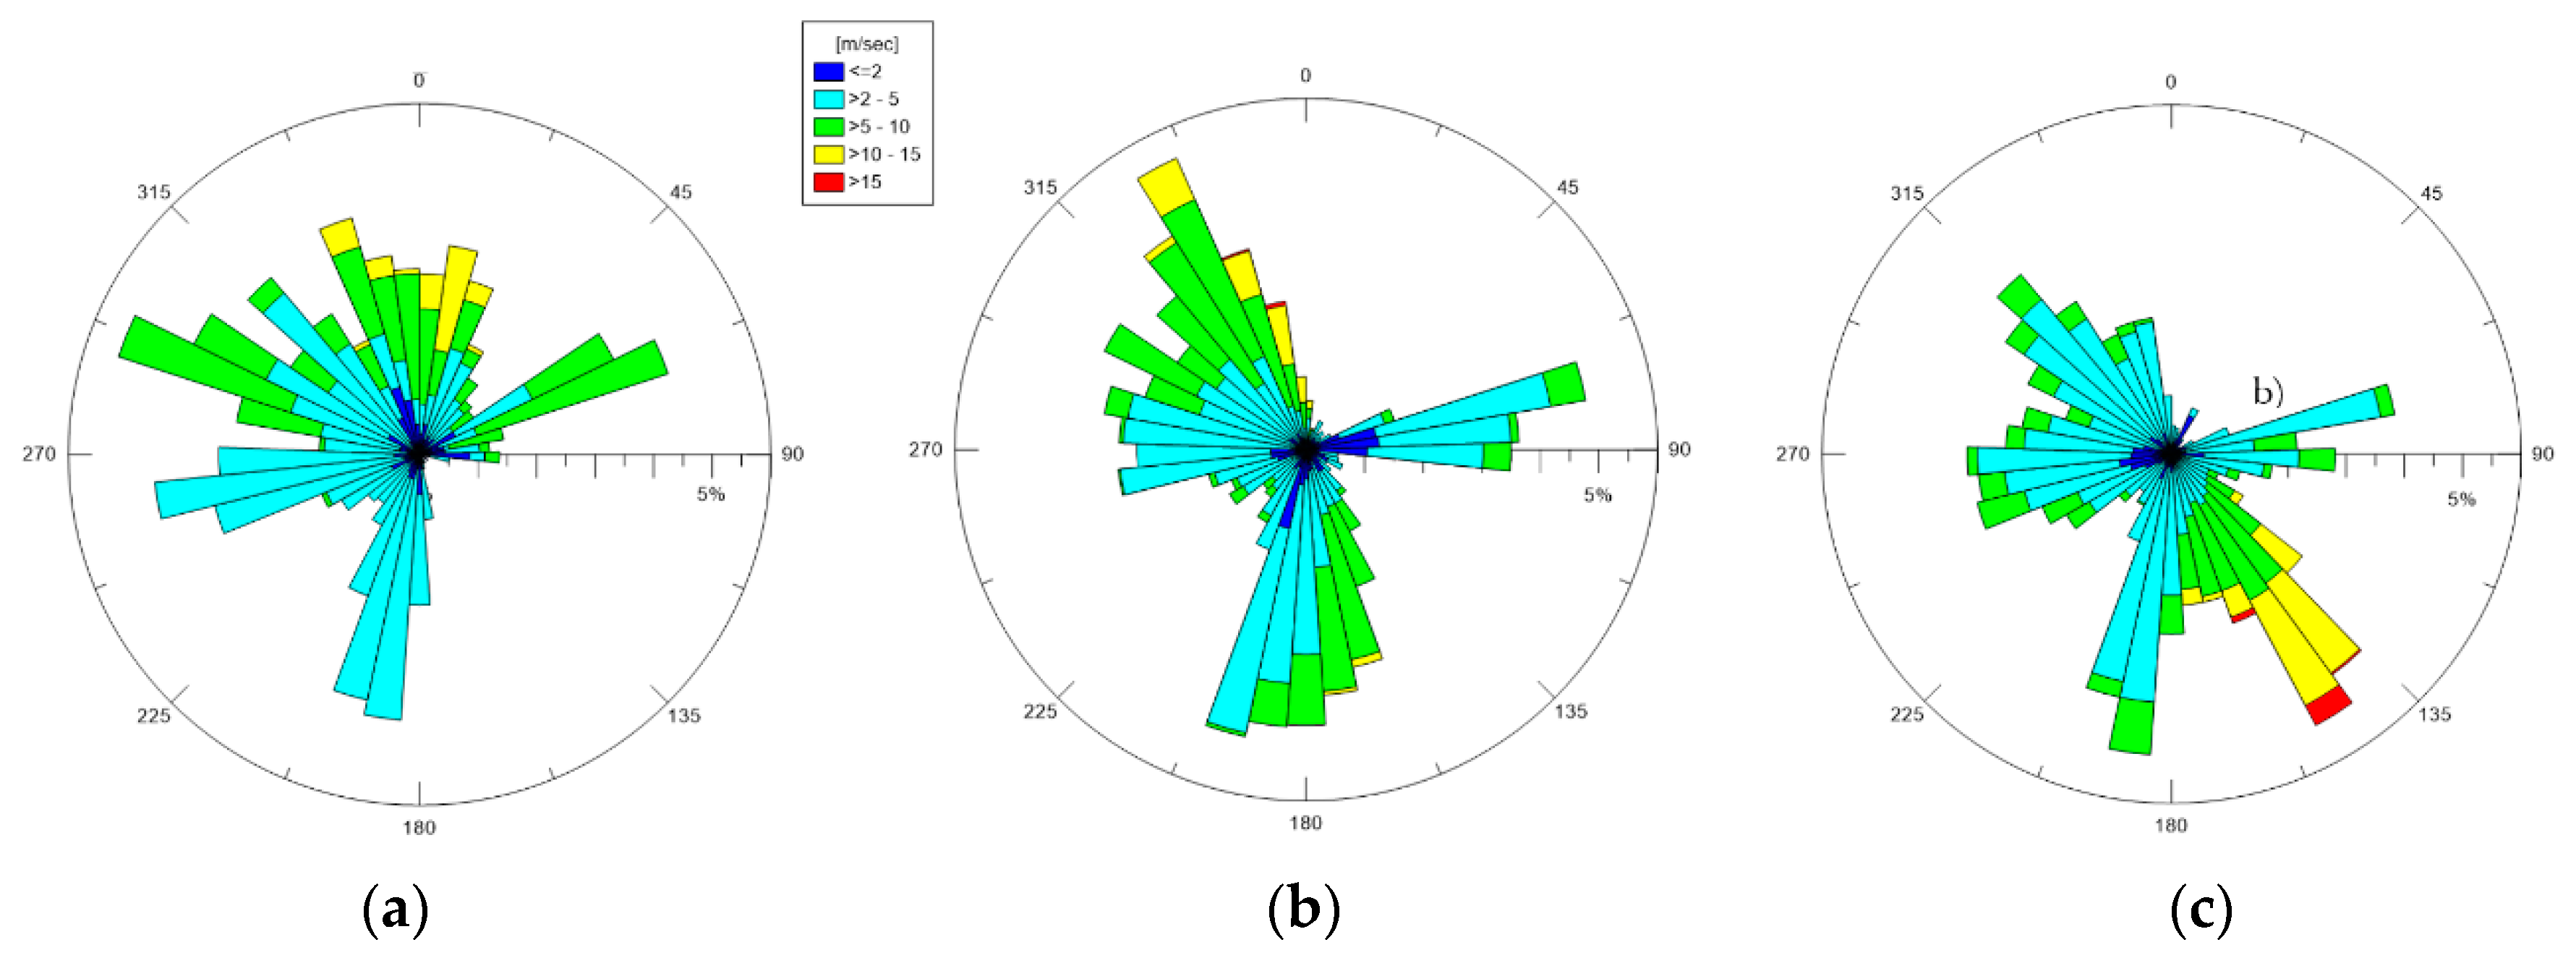
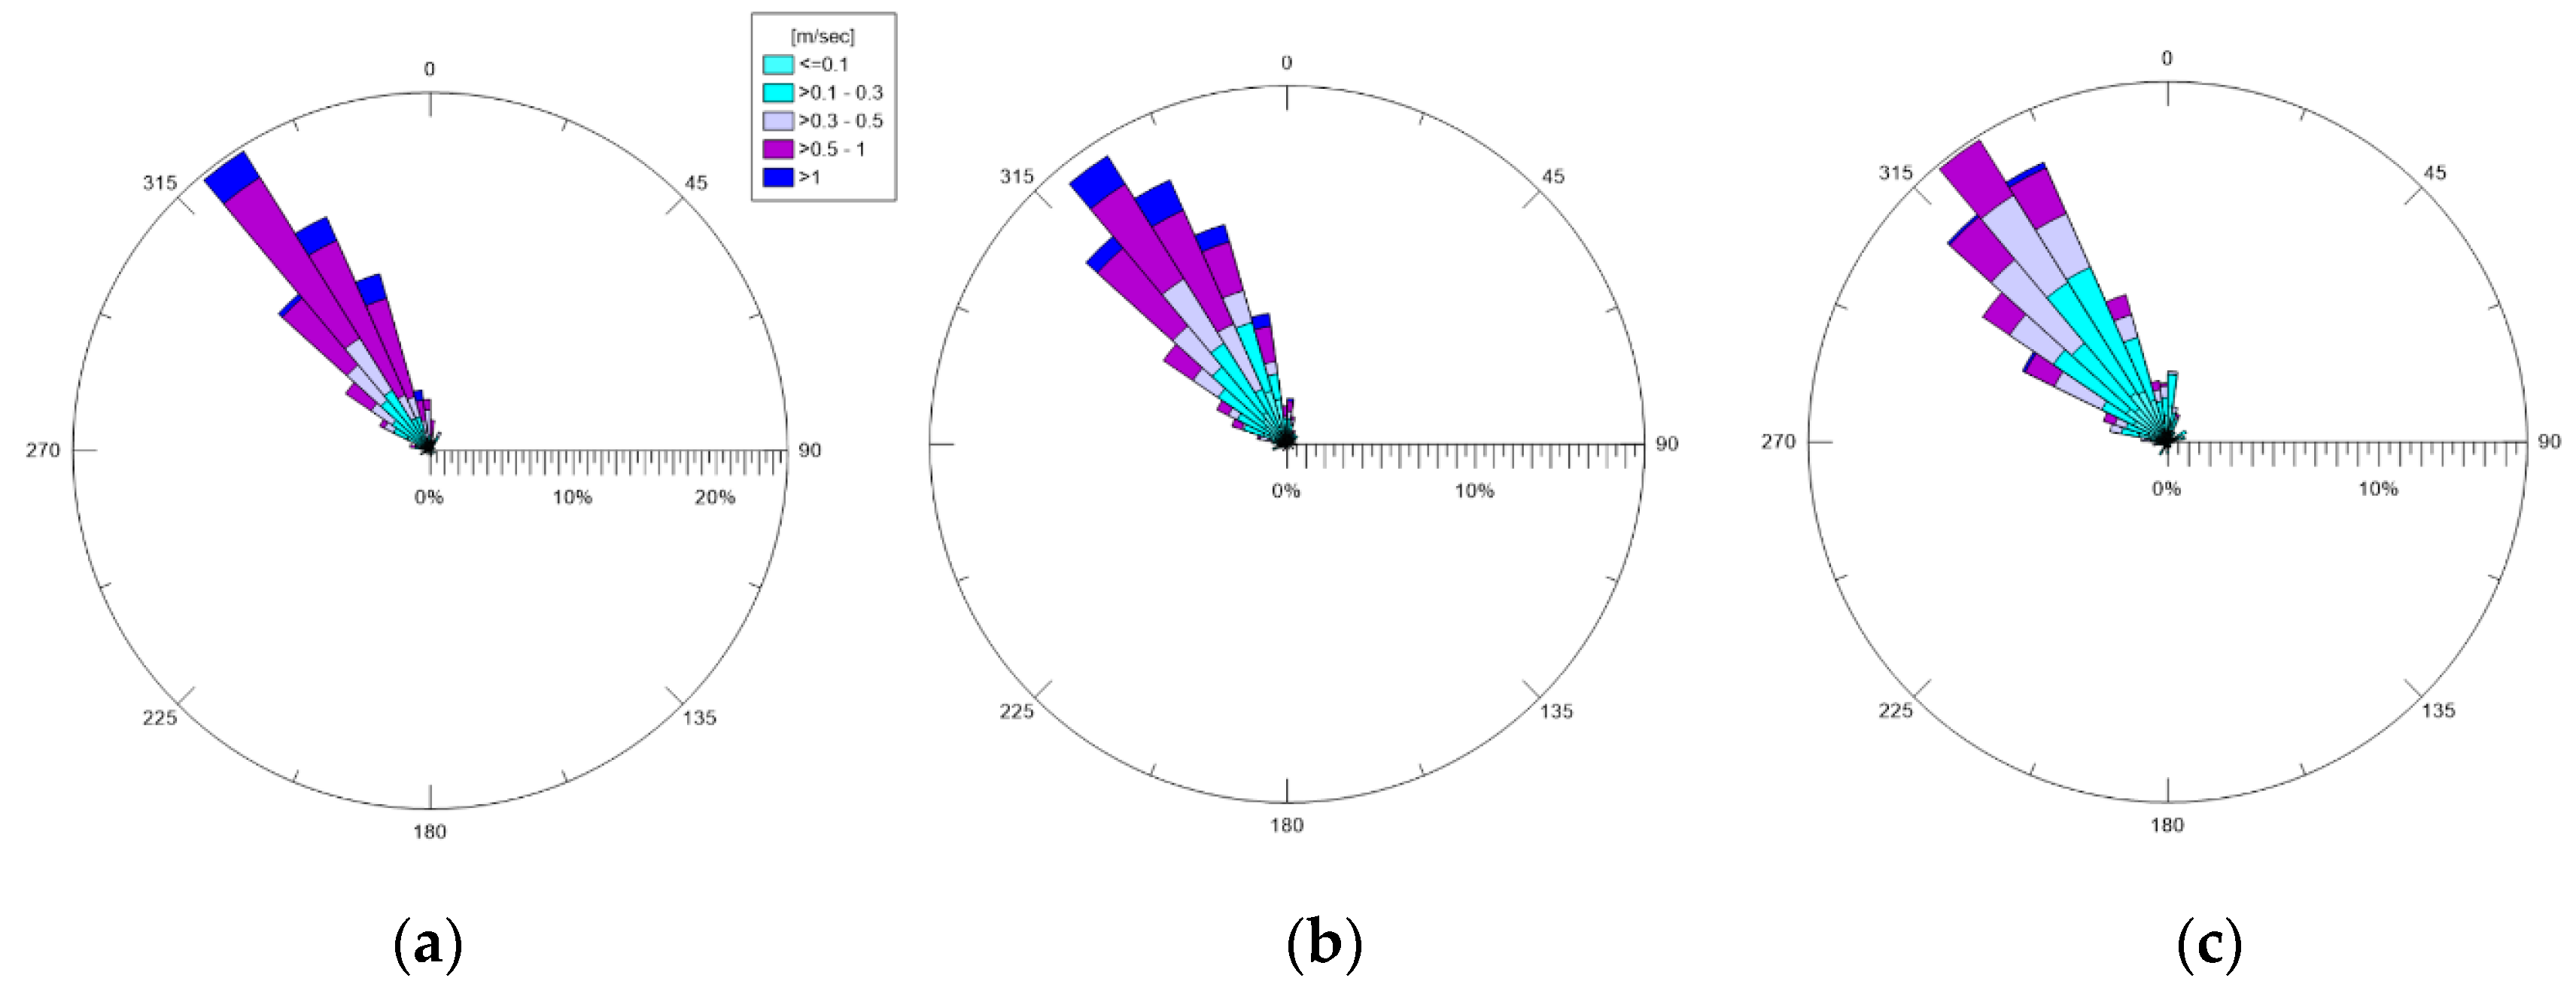
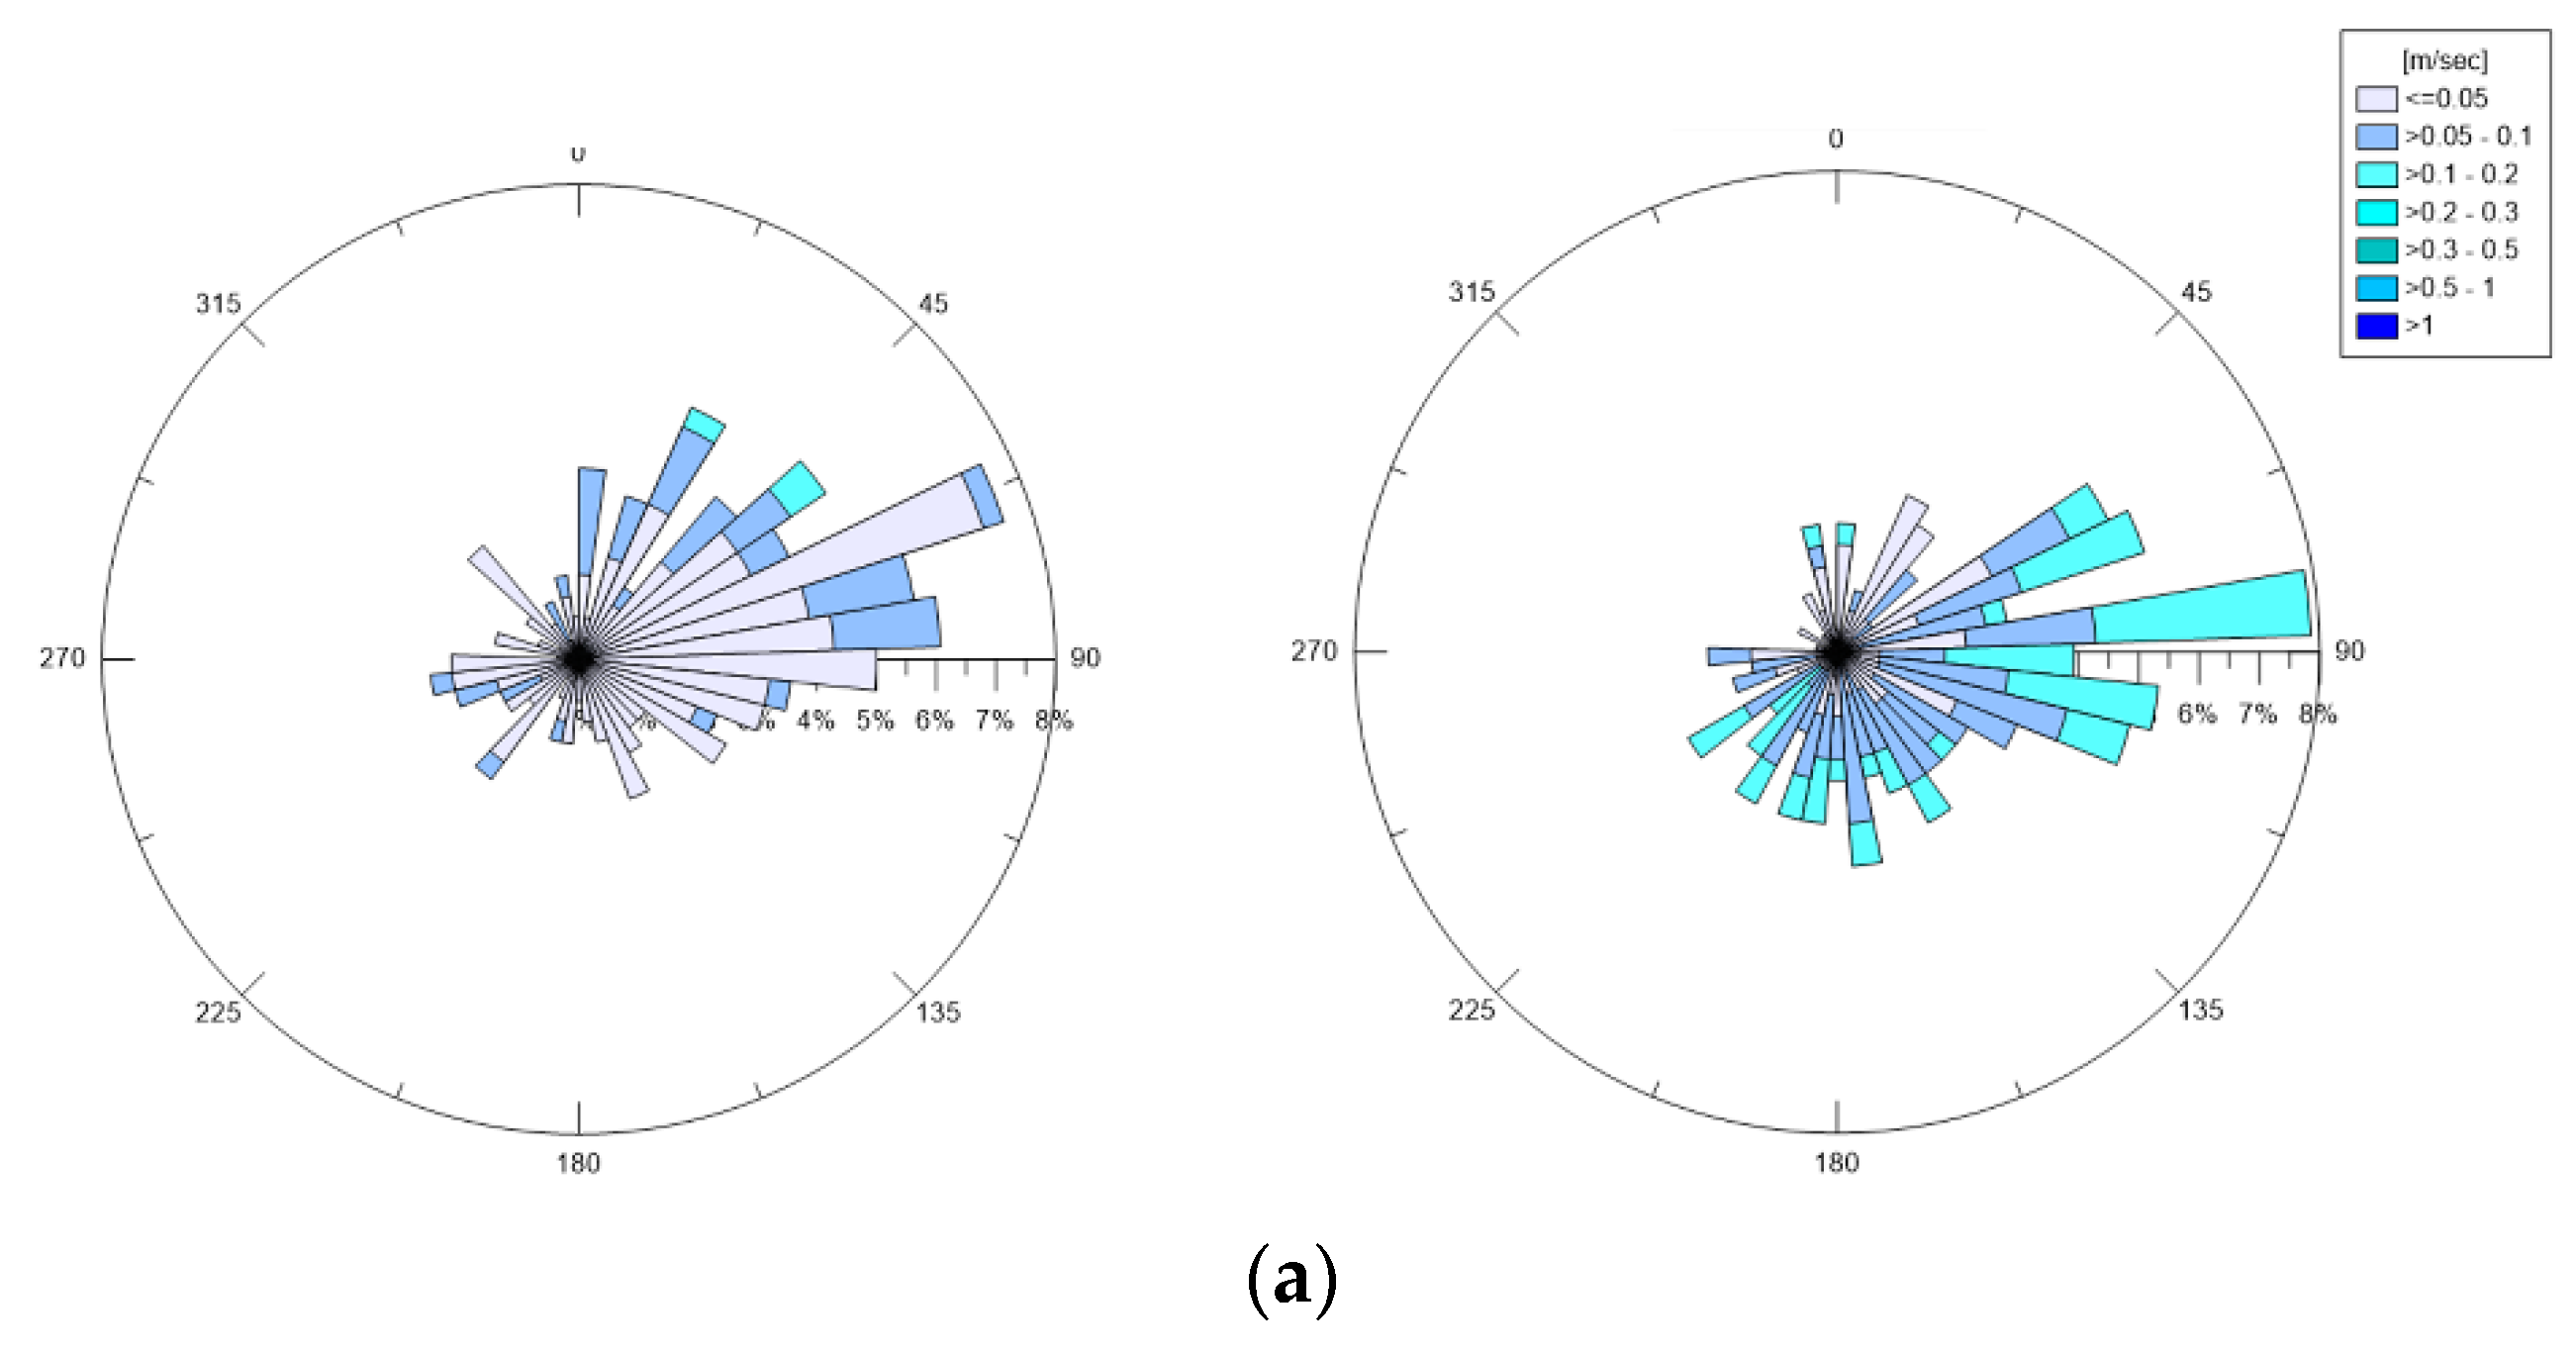
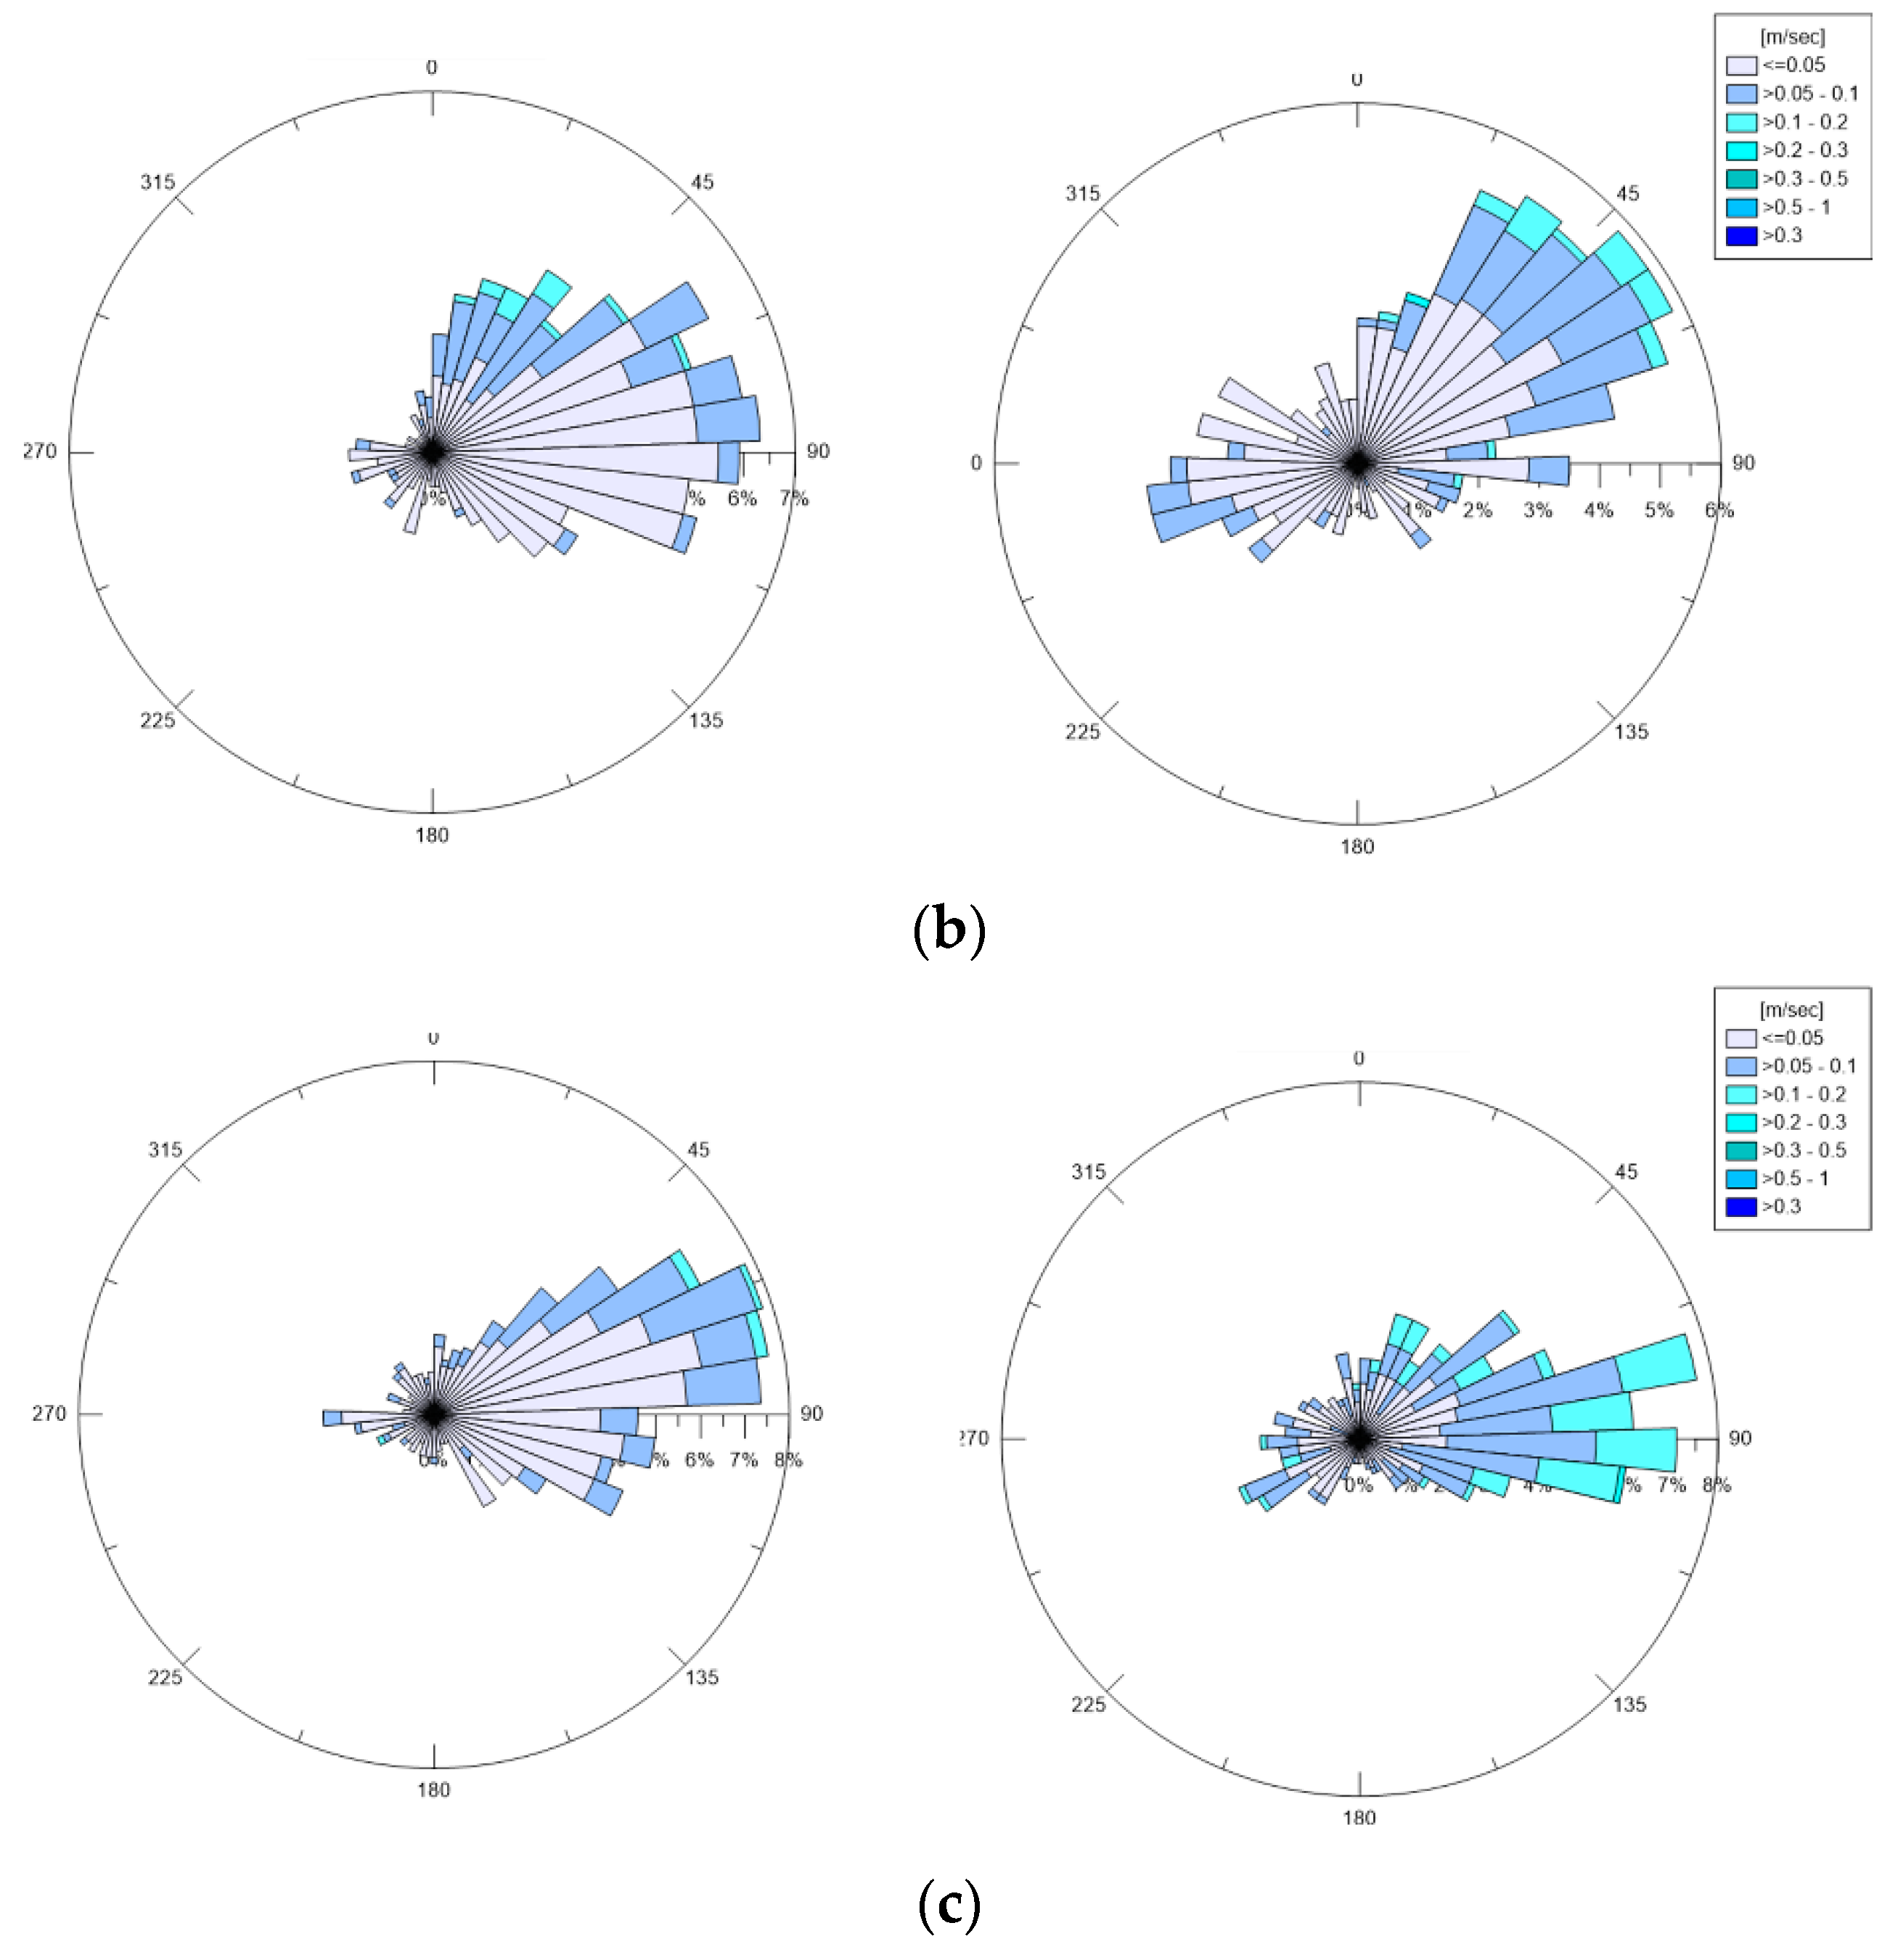
3.1. Winds, Waves, and Currents
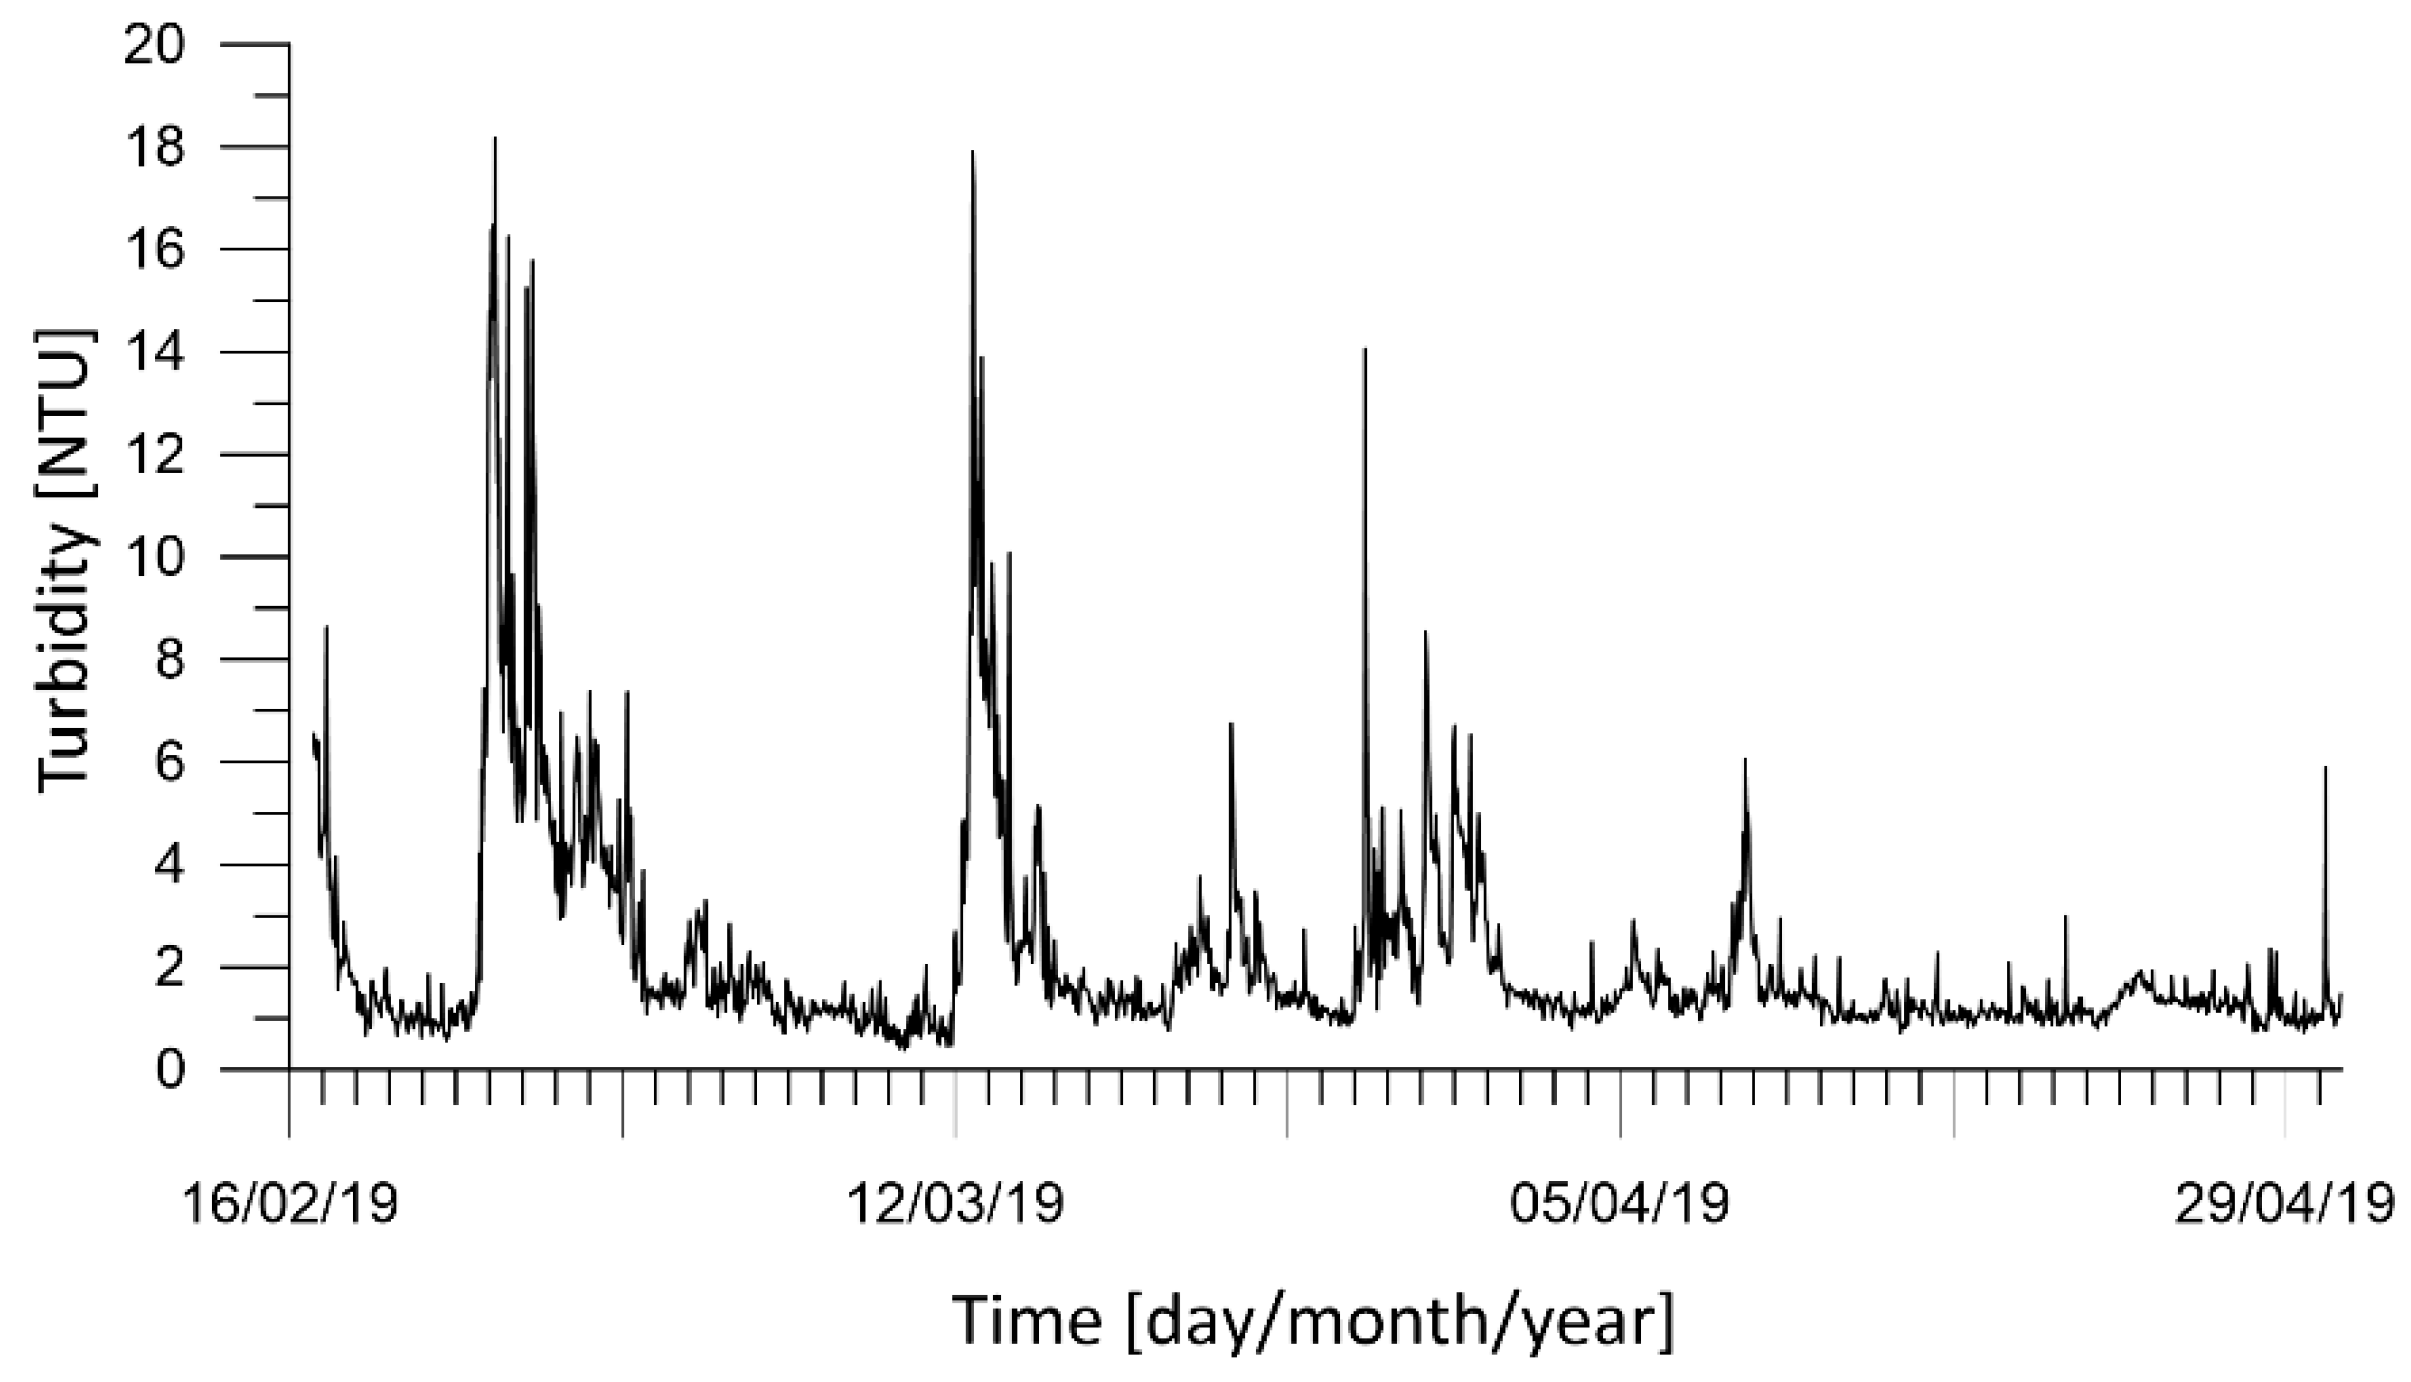
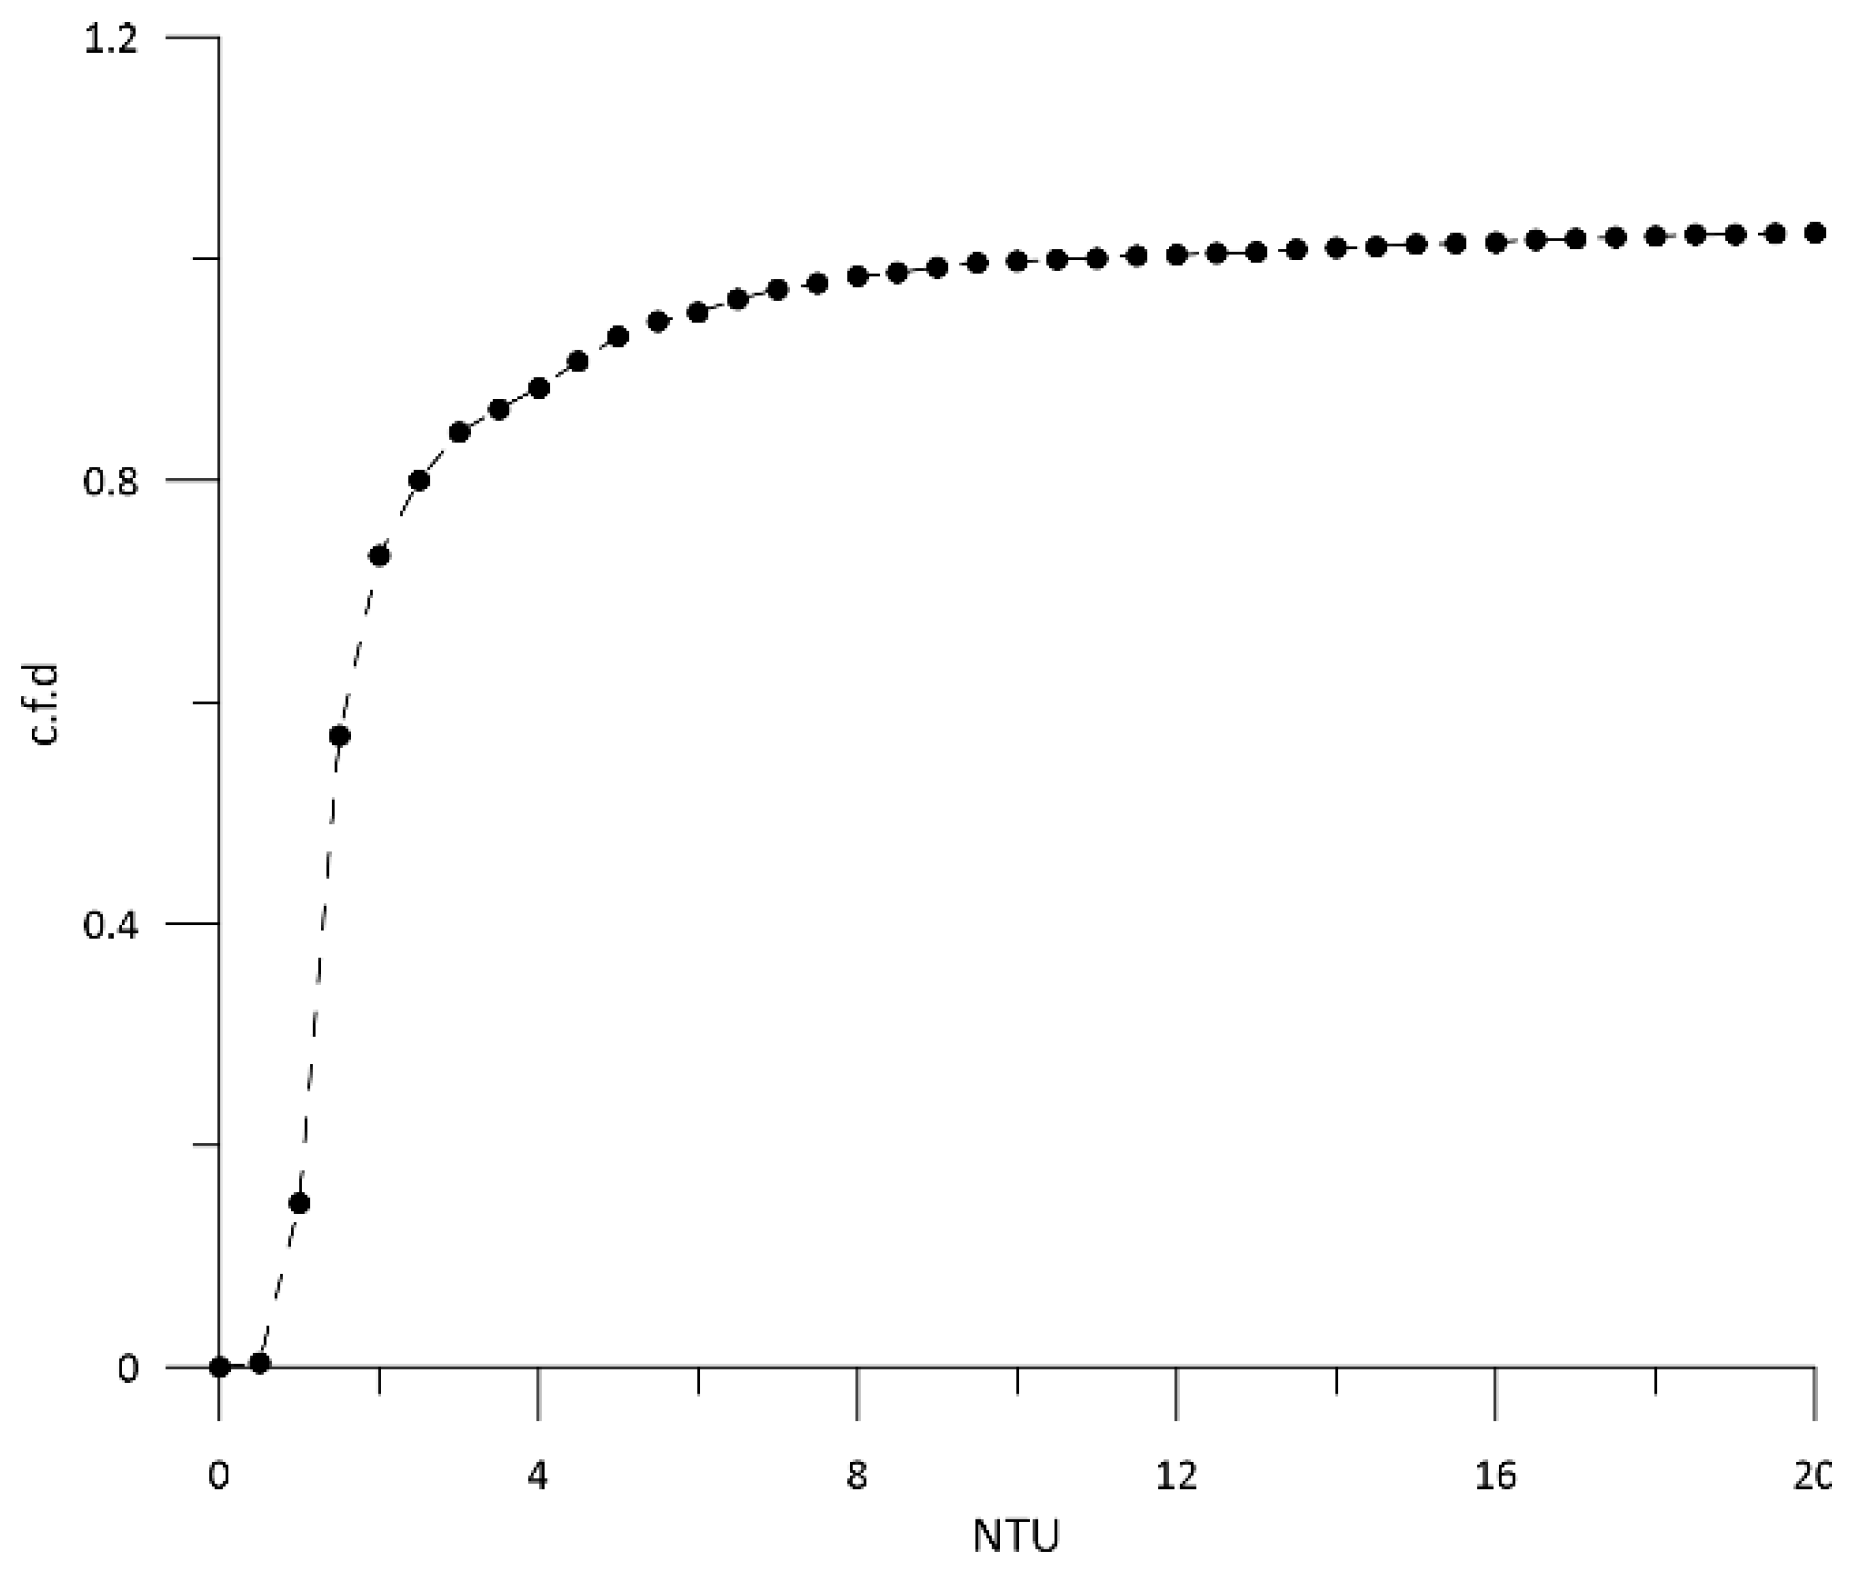
The wind data for the whole ante-operam period have been processed. The rose plots referring to the February, March, and April months are shown in Figure 2, based on their incoming directions. In February 2019, the most frequent winds came mainly from ONO, with peak velocities in a high range of 5–10 m/s. Considering the location of the station, NNO–NNE winds, which are also the most intense (intensities >10 m/s), were significant, because they came from the open sea where they originated wind waves on longer fetches. Moderate (2–5 m/s) wind intensities were observed along the other directions. In March 2019, the most frequent winds came mainly from NO e N, with peak intensities >15 m/s. Moreover, SSO–SSE winds were frequent, but their intensities were in a high range of 5–10 m/s. In April 2019, the most frequent winds came mainly from SSE–ESE, with peak intensities >15 m/s. Compared to these, all of the winds coming from different directions were more occasional and almost weak.
Figure 3 displays polar plots of the significant wave heights (Hs) monitored during the ante-operam period, and the directions of incoming waves are shown. In all three months, a well-defined and evident path was recognized for high waves, which came from NO–NNO (incoming in from the port of Bari). The lowest waves were observed in April 2019, as expected.
Figure 4 shows polar plots of the measured bottom and surface currents in February, March, and April 2019. In all three months, the currents appeared to have a preferred direction and tended to converge towards the opening of the basin. By comparing the surface currents with the bottom ones, the highest values (>0.2 m/s) were always noted near the surface, rather than near the bed, where values were in the range 0.05 to 0.1 m/s.

3.2. Turbidity

The turbidity data for the whole ante-operam period have been processed. In Figure 5, the time series of turbidity are plotted with peaks due to the extreme marine weather of the period. Starting with the collected turbidity data, the mean, maximum, median, and standard deviation values have been calculated (Table 2).
In Figure 6, the cumulative frequency distribution (c.f.d) of the turbidity is shown. The background turbidity value has been evaluated as the sum of the 90th percentile value of turbidity and the median value. Finally, the turbidity threshold value has been defined as the sum of the background turbidity value and twice the maximum value. By processing the collected data, the background turbidity value and the turbidity threshold value were equal to 5.85 NTU and 36.13 NTU, respectively.

4. Conclusions

Dredging activities ensure the navigability of harbors and the removal of contaminated sediments. However, all types of dredging operations create turbidity in the water column, depending on the type of dredges (hydraulic or mechanical), of the sediment bed, and hydrodynamic conditions. The most important environmental problems on marine organisms are reductions in dissolved oxygen and the decrease of sunlight in surface water due to turbidity. Therefore, an environmental strategy is necessary to achieve the best environmental management practice during a dredging activity. In particular, monitoring the turbidity data produced from the excavation, transport, and placement of dredged sediment is one of the most important management practices to avoid unacceptable ecological impacts.
This study presents the environmental management of the dredging activities in the harbor of Bari (Southern Italy, Adriatic Sea), showing the monitoring system and an empirical approach to estimating the values of background and limit turbidity. In particular, the data recorded during the monitoring survey were used to propose an empirical method for turbidity threshold determination. In this way, turbidity threshold determination can be used to mitigate the severity of the effects during the dredging operation. In particular, when the background turbidity value is exceeded for more than 12 h, the volume to be dredged will be reduced; instead, when the turbidity threshold value is exceeded, the dredging operation will be immediately stopped.

Author Contributions

M.M., A.A., and N.U. managed the monitoring meteo-oceanographic station; D.D.P. analyzed the data; D.D.P. wrote the manuscript. All authors revised the manuscript. All authors have read and agreed to the published version of the manuscript.

Funding

This research received no external funding.

Institutional Review Board Statement

Not applicable.

Informed Consent Statement

Not applicable.

Data Availability Statement

The data presented in this study are available on request.

Conflicts of Interest

The authors declare no conflict of interest.

References

  1. De Serio, F.; Ben Meftah, M.; Mossa, M. Monitoring and modelling of coastal currents and wastewater discharge: A case study. Geo-Eco-Mar. 2014, 20, 1–15. [Google Scholar]
  2. De Serio, F.; Armenio, E.; Ben Meftah, M.; Capasso, G.; Corbelli, V.; De Padova, D.; De Pascalis, F.; Di Bernardino, A.; Leuzzi, G.; Monti, P.; et al. Detecting sensitive areas in confined shallow basins. Environ. Model. Softw. 2020, 126, 104659. [Google Scholar] [CrossRef]
  3. De Serio, F.; Mossa, M. Environmental monitoring in the Mar Grande basin (Ionian Sea, Southern Italy). J. Environ. Sci. Poll. Res. 2016, 23, 12662–12674. [Google Scholar] [CrossRef] [PubMed]
  4. De Serio, F.; Mossa, M. Assessment of hydrodynamics, biochemical parameters and eddy diffusivity in a semi-enclosed Ionian basin. Deep. -Sea Research. Part 2. Top. Stud. Oceanogr. 2016, 133, 176–185. [Google Scholar] [CrossRef]
  5. De Serio, F.; Mossa, M. Meteo and Hydrodynamic Measurements to Detect Physical Processes in Confined Shallow Seas. Sensors 2018, 18, 280. [Google Scholar] [CrossRef] [PubMed] [Green Version]
  6. Armenio, E.; Ben Meftah, M.; Bruno, M.F.; De Padova, D.; De Pascalis, F.; De Serio, F.; Di Bernardino, A.; Mossa, M.; Leuzzi, G.; Monti, P. Semi enclosed basin monitoring and analysis of meteo, wave, tide and current data. In Proceedings of the IEEE Conference on Environmental. Energy and Structural Monitoring Systems, Bari, Italy, 13–14 June 2016. [Google Scholar]
  7. Armenio, E.; De Serio, F.; Mossa, M. Analysis of data characterizing tide and current fluxes in coastal basins. Hydrol. Earth Syst. Sci. 2017, 21, 3441–3454. [Google Scholar] [CrossRef] [Green Version]
  8. Armenio, E.; De Serio, F.; Mossa, M.; De Padova, D. Monitoring system for the sea: Analysis of meteo, wave and current data. In Proceedings of the IMEKO TC19 Workshop on Metrology for the Sea, MetroSea: Learning to Measure Sea Health Parameters, Naples, Italy, 11–13 October 2017; pp. 143–148. [Google Scholar]
  9. Armenio, E.; Ben Meftah, M.; De Padova, D.; De Serio, F.; Mossa, M. Onitoring System in Mar Grande Basin (Ionian Sea). In Proceedings of the IEEE International Workshop on Metrology for the Sea; Learning to Measure Sea Health Parameters (Metrosea), Bari, Italy, 8–10 October 2018; pp. 104–109. [Google Scholar] [CrossRef]
  10. Armenio, E.; Ben Meftah, M.; De Padova, D.; De Serio, F.; Mossa, M. Monitoring Systems and Numerical Models to Study Coastal Sites. Sensors 2019, 19, 1552. [Google Scholar] [CrossRef] [Green Version]
  11. De Padova, D.; Mossa, M.; Adamo, M.; De Carolis, G.; Pasquariello, G. Synergistic use of an oil drift model and remote sensing observations for oil spill monitoring. Environ. Sci. Pollut. Res. 2017, 24, 5530–5543. [Google Scholar] [CrossRef]
  12. De Padova, D.; De Serio, F.; Mossa, M.; Armenio, E. Investigation of the current circulation offshore Taranto by using field measurements and numerical model. In Proceedings of the 2017 IEEE International Instrumentation and Measurement Technology Conference, Turin, Italy, 22–25 May 2017. [Google Scholar] [CrossRef]
  13. De Carolis, G.; Adamo, M.; Pasquariello, G.; De Padova, D.; Mossa, M. Quantitative characterization of marine oil slick by satellite near-infrared imagery and oil drift modelling: The Fun Shai Hai case study. Int. J. Remote Sens. 2013, 34, 1838–1854. [Google Scholar] [CrossRef]
  14. Chimienti, G.; De Padova, D.; Mossa, M.; Mastrototaro, F. A mesophotic black coral forest in the Adriatic Sea. Sci. Rep. 2020, 10, 8504. [Google Scholar] [CrossRef]
  15. Chimienti, G.; De Padova, D.; Adamo, M.; Mossa, M.; Bottalico, A.; Lisco, A.; Ungaro, N.; Mastrototaro, F. Effects of global warming on Mediterranean coral forests. Sci. Rep. 2021, 11, 20703. [Google Scholar] [CrossRef] [PubMed]
  16. Wetzel, R.G. Limnology; CBS College Publishing: Philadelphia, PA, USA, 1983. [Google Scholar]
  17. Wilber, C.G. Turbidity in the Aquatic Environment: An Environmental Factor in Fresh and Oceanic Waters; Charles Thomas Publications: Springfield, IL, USA, 1983. [Google Scholar]
  18. Newman, B.; Jones, C.; Omarjee, A.; Ngcingwana, N.; Parsons, G. Laboratory-Produced Turbidity-Total Suspended Solids Concentration Relationship for Dredging Compliance Monitoring in the Ngqura Area of Algoa Bay; CSIR Report CSIR/NRE/ECOS/ER/2013/0059/B; Council for Scientific and Industrial Research, Coastal Systems Res. Group: Pretoria, South Africa, 2013. [Google Scholar]
  19. Mossa, M. Experimental study on the interaction of non-buoyant jets and waves. J. Hydraul. Res. 2004, 42, 13–28. [Google Scholar] [CrossRef]
  20. Mossa, M. Behavior of non-buoyant jets in a wave environment. J. Hydraul. Eng. 2004, 130, 704–717. [Google Scholar] [CrossRef]
  21. Mossa, M. Field measurements and monitoring of wastewater discharge in sea water. Estuar. Coast. Shelf Sci. 2006, 68, 509–514. [Google Scholar] [CrossRef]
  22. Mossa, M.; Davies, P.A. Some aspects of turbulent mixing of jets in the marine environment. Water 2018, 10, 522. [Google Scholar] [CrossRef] [Green Version]
  23. De Padova, D.; Mossa, M.; Sibilla, S. Numerical investigation of the behaviour of jets in a wave environment. J. Hydraul. Res. 2019, 58, 618–627. [Google Scholar] [CrossRef]
  24. De Padova, D.; Mossa, M.; Sibilla, S. Characteristics of nonbuoyant jets in a wave environment investigated numerically. Environ. Fluid Mech. 2020, 20, 189–202. [Google Scholar] [CrossRef]
  25. Barile, S.; De Padova, D.; Mossa, M.; Sibilla, S. Theoretical analysis and numerical simulations of turbulent jets in a wave environment. Phys. Fluids 2020, 32, 035105. [Google Scholar] [CrossRef]
  26. Mega, M.; Attolico, A.; Armenio, E. Application of an Environmental Monitoring Strategy in the Port of Bari. In Sustainable Development of Sea-Corridors and Coastal Waters; Stylios, C., Floqi, T., Marinski, J., Damiani, L., Eds.; Springer: Cham, Switzerland, 2015. [Google Scholar]
  27. Wooldridge, C.F.; McMullen, C.; Howe, V. Environmental management of ports and harbors implementation of policy through scientific monitoring. Mar. Policy J. 1999, 23, 413–425. [Google Scholar] [CrossRef]
  28. Darbra, R.M.; Ronza, A.; Casal, J.; Stojanovic, T.; Wooldridge, C. A new methodology to assess environmental management in sea ports. Mar. Pollut. Bull. 2004, 48, 420–428. [Google Scholar] [CrossRef]
  29. Corsini, S.; Onorati, F.; Pellegrini, F.; De Angelis, P.; Avancini, M. Manuale per la Movimen-Tazione di Sedimenti Marini. 2007. Available online: http://www.minambiente.it (accessed on 20 June 2006).
Figure 1. Port of Bari: map of port expansion work and the location of the monitoring station.
Environsciproc 21 00012 g001
Figure 2. Wind polar diagrams for 2019: (a) February; (b) March; (c) April. Incoming wind directions are shown.
Environsciproc 21 00012 g002
Figure 3. Wave polar diagrams for 2019: (a) February; (b) March; (c) April. Incoming wind directions are shown.
Environsciproc 21 00012 g003
Figure 4. Station A: Polar plot of measured bottom and surface currents in (a) February; (b) March; (c) April 2019 (direction of propagation shown).
Environsciproc 21 00012 g004aEnvironsciproc 21 00012 g004b
Figure 5. Station D: Time series of measured turbidity [NTU] during February to April 2019. Time is local time.
Environsciproc 21 00012 g005
Figure 6. Cumulative frequency distribution (c.f.d) of the turbidity [NTU].
Environsciproc 21 00012 g006
Table 1. Main characteristics of the monitoring meteo-oceanographic station.
Station AStation B
X
WaveProgressive data number
Date (year/month/day/hour/minute)
Position (Lat, lon)
-
SDN: P01: Conceptid:: GTHDAP01: Significant wave height Hs (m)
-
SDN: P01: Conceptid:: GTZHAW01: Significant wave period Ts (s)
-
SDN: P01: Conceptid:: GWMDAD01: Mean wave direction (in degree, referenced to North)
-
SDN: P01: Conceptid:: MBANZZZZ:Local depth (mm);
-
SDN: P01: Conceptid:: GTDHAP01: H1/10–Average of the 1/10 highest waves
-
SDN: P01: Conceptid:: GTAMZD01: Average wave period Tmean (s)
Station AStation B
XX
CurrentProgressive data number
Date (year/month/day/hour/minute)
Position (Lat, lon)
-
SDN: P01: Conceptid:: MBANZZZZ: Cell of a measurement with an indication of its depth from the surface (z = 0)
-
SDN: P01: Conceptid:: LCSAAP01: Cell current intensity (m/s)
-
SDN: P01: Conceptid:: LCDAAP01: Cell current direction (in degrees, referenced to north)
Station AStation B
XX
TemperatureProgressive data number
Date (year/month/day/hour/minute)
Position (Lat, lon)
-
SDN: P01: Conceptid:: MBANZZZZ: Sensor depth (m)
-
SDN: P01: Conceptid:: TEMPS901: Water potential Temperature measured in ITS-90 degrees Celsius (°C)
Station C
X
MeteoData number
Date (year/month/day/hour/minute)
Position (Lat, lon)
-
SDN: P01: Conceptid:: EGTSSS01: Average wind velocity–SDN: P01: Conceptid:: EGTSSS01: Average wind velocity (m/s)
-
SDN: P01: Conceptid:: ESSAMX01: Max wind velocity (m/s)
-
SDN: P01: Conceptid:: EGTDSS01: Wind incoming direction N (deg)
-
SDN: P01: Conceptid:: CDTAZZ01: Air temperature (°C)
-
SDN: P01: Conceptid:: CDEWZZ01: Dew point (°C)
-
SDN: P01: Conceptid:: CAPHZZ01: Atmospheric pressure (mbar)
-
SDN: P01: Conceptid:: CHUMZZ01: Relative humidity (%) (m/s)
Station D
Water qualityProgressive data number
Date (year/month/day/hour/minute)
Position (Lat, lon)
X
-
SDN: P01: Conceptid:: TEMPS901: Water potential Temperature measured in ITS-90 degrees Celsius (°C)
-
SDN: P01:Conceptid:: CNDCST01: Conductivity (S/m)
-
SDN: P01: Conceptid:: PRESPR01: Absolute pressure (dbar)
-
SDN: P01: Conceptid:: DOXYOP01:Dissolved oxygen (mL/L)
-
SDN: P01: Conceptid:: CLSDPM01: Chlorophyll (µg/L)
-
SDN: P01: Conceptid:: CLSDPM01: Turbidity (NTU)
Table 2. Main parameters of the measured turbidity data.
February–April 2019
Max [NTU]Mean [NTU]Median [NTU]Stand.dev [NTU]
18.172.131.42.08
Publisher’s Note: MDPI stays neutral with regard to jurisdictional claims in published maps and institutional affiliations.

