Article

Working Fluid Stability in Large-Scale Organic Rankine Cycle-Units Using Siloxanes—Long-Term Experiences and Fluid Recycling †

by
Tobias G. Erhart
1,*,
Jürgen Gölz
2,‡,
Ursula Eicker
1,‡ and
Martijn Van den Broek
3,‡
1
Centre for Sustainable Energy Technology Research (zafh.net), University of Applied Sciences Stuttgart, Schellingstrasse 24, Stuttgart 70174, Germany
2
BIOP Biomasseoptimierungen GmbH, Parkstrasse 37, Remshalden 73630, Germany
3
Department of Industrial System and Product Design (TEI), Ghent University, Graaf Karel de Goedelaan 5, Kortrijk 8500, Belgium
*
Author to whom correspondence should be addressed.
This paper is an extended version of our paper published in Erhart, T.; Gölz, J.; Eicker, U.; van den Broek, M. Fluid stability in large scale ORCs using Siloxanes—Long-term experiences and fluid recycling. In Proceedings of the 3rd International Seminar on ORC Power Systems, Brussels, Belgium, 12–14 October 2015; pp. 1313–1322.
These authors contributed equally to this work.
Energies 2016, 9(6), 422; https://doi.org/10.3390/en9060422
Submission received: 28 January 2016 / Revised: 28 April 2016 / Accepted: 9 May 2016 / Published: 31 May 2016

Abstract

:
The results in this work show the influence of long-term operation on the decomposition of working fluids in eight different organic rankine cycle (ORC) power plants (both heat-led and electricity-led) in a range of 900 kW el to 2 MW el . All case study plants are using octamethyltrisiloxane (MDM) as a working fluid; the facilities are between six to 12 years old. Detailed analyses, including the fluid distribution throughout the cycle, are conducted on one system. All presented fluid samples are analyzed via head space gas chromatography mass spectrometry (HS-GC-MS). Besides the siloxane composition, the influence of contaminants, such as mineral oil-based lubricants (and their components), is examined. In most cases, the original working fluid degrades to fractions of siloxanes with a lower boiling point (low boilers) and fractions with a higher boiling point (high boilers). As a consequence of the analyses, a new fluid recycling and management system was designed and tested in one case study plant (Case Study #8). Pre-post comparisons of fluid samples prove the effectiveness of the applied methods. The results show that the recovery of used working fluid offers an alternative to the purchase of fresh fluid, since operating costs can be significantly reduced. For large facilities, the prices for new fluid range from € 15 per liter (in 2006) to € 22 per liter (in 2013), which is a large reinvestment, especially in light of filling volumes of 4000 liters to 7000 liters per unit. Using the aforementioned method, a price of € 8 per liter of recovered MDM can be achieved.

Graphical Abstract

1. Introduction

Over recent years, a large number (over 200) of organic rankine cycles (ORCs) based on siloxanes as the working fluids has begun operating all across Europe [1]. Siloxanes are advertised as uncomplicated and long-lasting working fluids. Many siloxanes are classified as inflammable, and they are more stable than their carbo-organic equivalents. The bond energy of a siloxy group is significantly higher than the bond energy of a carbon chain [2]. There are only a few sources in the literature describing the decomposition of siloxanes in high-temperature applications (250–350 °C) in detail, such as [3]. Most studies are related to the use of poly-siloxanes as solids under oxygen and nitrogen atmospheres [2]. The siloxy-bonds in siloxanes are very strong (809 kJ / mol ), but compared to the methyl-silane group, they are the weaker link. The methyl-silane decomposition takes place above 400 °C. In general, siloxanes have a tendency to polymerize or oligomerize above 300 °C. The equilibrium of the polymerization and the product configuration depend on pressure and educt configuration. Formic acid may be produced during thermal decomposition. In thermal conversion, siloxanes react to SiO2, CO2 and hydrocarbon residues [4]. Some authors claim that siloxane working fluids last throughout the lifespan of the ORC unit, approximately 20–25 years [5], without an aging process.
However, over longer periods of operation, cycle fluids degrade through decomposition or contamination. Strong oxidants, catalytic alloys or sulfur can trigger or accelerate the decomposition processes. Contaminants and decomposition products of cycle fluids can lead to severe disturbances of the process. High boilers, which are still liquid while the main working fluid is fully evaporated, can damage the turbine or heat exchangers by droplet impingement. Furthermore, the liquid is transported across the turbine section without contributing to expansion and, consequently, to power generation. Vaporous low boilers can lead to cavitation in the feed-pump, galloping in the pre-heater, excessive super-heating in the evaporator and low heat transfer coefficients. The pressure level in the condenser and recuperator rises with a larger fraction of low boilers in the working fluid. The pressure differences across the turbine decrease accordingly. The volume distribution across the cycle can significantly differ from the original design. As a consequence, lower electric efficiencies and higher maintenance costs have to be expected.
Over the last few years, the authors have monitored an ORC power plant in detail (see Case Study Power Plant #8 in Section 2.2) [6,7]. The efficiency, as a well as the cycle characteristics of the unit have changed during this period: the annual thermal efficiency of the system decreased significantly from 11.5% (in 2008) to 7.6% (in 2013) and 5.04% (in 2014). A first working fluid test in 2013 showed degradation. The purchase of a new filling of working fluid would have been a reinvestment of € 140,000. In addition, between 2006 and 2012, the prices of wood chips doubled [8]. The confluence of the aforementioned points seriously threatened the economical feasibility of this biomass-fueled ORC power plant. Consequently, the authors decided to develop a method to recycle old working fluid and to test it on an existing power plant. The following Section 2 describes the method of working fluid analyses. In Section 3, working fluid analyses of several power plants are presented in order to prove that the observed effects are not an isolated incident, but rather a common problem. The procedures of recycling in the laboratory and in situ are shown in Section 4. A working fluid recycling system prototype that is integrated into the existing power cycle is presented in Section 5. It can be easily applied to similar power plants of this type.

2. Methodology and Materials

2.1. Fluid Analysis

Fluid samples were taken and analyzed for eight case studies using the head space gas chromatography mass spectrometry (HS-GC-MS) method. In order to test the separation of contaminated working fluid mixtures, distilling experiments were conducted on various samples of Case Study #8. For each distilling experiment, the original working fluid sample (base fluid) and all products of the process were analyzed.

2.2. Case Study Power Plant #8

The removal of contaminations and the recycling of the working fluid in situ was tested on Case Study Power Plant #8, after analyzing the fluid decomposition and the contaminations (Case Studies #1 to #7). Furthermore, the sequestration of fluid fractions across the ORC-unit has been observed in Case Study #8.
Power Plant #8 is located in the city quarter of Scharnhauser Park near Stuttgart. Since 2004, the power plant has covered the heat demand of an area with a population of about 7000. The combined heat and power unit (CHP) is biomass driven and heat-led. A 7 MW th furnace converts landscaping residues and wood chips into heat. The ORC module is connected via a thermal oil cycle to the furnace. The system is controlled according to ambient temperature. The sink temperature levels are 60 °C/80 °C. The source temperature (thermal oil) of this ORC-unit is limited to 290 °C.

2.3. Distilling

The distilling of fluid samples was conducted under laboratory conditions. As depicted in the sketch in Figure 1, the method uses a von Liebig-type apparatus (5) cooled with water flowing on the outside of the tube from (6) to (7). The educt in a flask (15) is heated by a heater (1), evaporated and condensed into a reservoir (8), which is cooled by cold water (16).

3. Experimental Results

3.1. Analysis of Working Fluids from Various Power Plants

In order to give an overview of fluid aging and decomposition, in total, samples of eight power plants were tapped and analyzed. The authors have analyzed the data of seven foreign power plants located all across Europe, detailed results can be found in Table A1. In addition, one research power plant near Stuttgart was analyzed (further information in Section 2.2). The focus was set on the following points:
  • Operational mode: heat-led or electricity-led;
  • Total hours of operation and up-time per year;
  • Fluid quality: contaminations, degree of degradation, low boilers, high boilers;
  • Source temperature and degree of super-heating.
The following Table 1 shows an overview of the conditions under which the case study plants are working. Case Study #8 was chosen for detailed analyses. The relevant characteristics in terms of fluid aging are listed: system age, operating hours and heat source temperature. Furthermore, the operation mode (heat-led, electricity-led) is listed. A lower number of full load hours and, consequently, more stop-start procedures might influence the aging process, as well. According to Arrhenius [10], one can expect an increasing decomposition with higher temperatures and time.
From all of above listed case study plants, samples were tapped from the recuperator section (Tap 3, Figure 9) and analyzed via HS-GC-MS. In Figure 2a,b, the composition of the fluid samples from seven different power plants (Case Studies #1–#7) is depicted. In Figure 2a, the lubricant fraction is included, and in Figure 2b, only the siloxane fractions are depicted. The degree of degradation of the working fluid samples varies across a wide range (in Figure 2a 5%–55%, respectively and in Figure 2b 5%–34%, respectively).
The following Figure 3a depicts the total degradation of the original working fluid MDM for the Case Studies #1 to #7 versus the operating time. As time is one of the main factors in chemical reactions, a rough trend can be seen. However, the dispersion is very large.
In Figure 3b, the development of the two categories of reaction products (low boilers, high boilers) versus the operating time of the system is shown. The amount of high boilers is significantly higher compared to the share of low boilers. Besides the siloxane compounds in the working fluid, the samples were contaminated with varying fractions of petroleum derivates. These contaminations usually descend from leakages located at the turbine shaft sealing. A certain minimum leakage rate cannot be avoided, but some of the samples show massive contaminations (Case Studies #2, #5 and #6 in Figure 2).
The data in Figure 4 depict the degradation ratio of the original cycle fluid versus the measured fraction of lubricant residues on a logarithmic scale. The trend depicted in the diagram shows a positive correlation between the amount of hydrocarbon contaminants and the degradation of the original working fluid.

3.2. Fluid Distribution within the ORC-Module (Case Study #8)

In case of fluid degradation, the fluid composition throughout a cycle is not equal. Depending on the local thermodynamic state, the equilibrium of compounds shifts. This distribution of compounds across the cycle was tested on the Power Plant Case Study #8. The following HS-GC-MS analyses in Table 2, Table 3, Table 4 and Table 5 show the results of various fluid samples taken from different points of the cycle. The first fluid sample (Table 2) has been tapped from the pre-heater (Tap 1 in Figure 9) after a full stop of the cycle.
The second used fluid sample (Table 3) was taken from the reservoir of the vacuum pump (Tap 4 in Figure 9). The large fraction of hexamethyldisiloxane (MM) is very obvious. As the condensables in the condenser are fed back into the cycle and take part in the overall process, the low boiling MM collects as vapor in the condenser shell. Consequently, the vacuum pump takes the MM from this point.
After a full stop of the system, the sample presented in Table 4 has been taken from the bottom of the recuperator (under the liquid line, Tap 3 in Figure 9). The analysis shows a large amount of high boilers (MD2M and MD3M). After the turbine, the expanded vapor is transported through the recuperator. Meanwhile, the saturation pressure of the high boilers is reached. Furthermore, the flow of the vapor decelerates. Therefore, the high boilers precipitate inside the recuperator shell and no longer take part in the cycle’s generation process. The high boilers that are not evaporated before the turbine can damage the turbine blades.
The last sample (Table 5) has been taken from the feed pump (Tap 3 in Figure 9). It is the most representative of the fluid mixture involved in the overall thermodynamic process of this ORC unit. Less than 80% of the original working fluid MDM is left.

4. Fluid Treatment Results

4.1. Distilling under Laboratory Conditions

In order to prove the feasibility of a working fluid separation, a laboratory test was conducted. The liquid educt Sample 1 was taken from the recuperator reservoir of Case Study #8 (liquid line, Tap 3 in Figure 9). The second sample was collected from the exhaust of the vacuum pump (Tap 4 in Figure 9).
Under a pressure of 40 mbar , two fluid samples (educts) are evaporated and condensed; the results of the two experiments, A and B, are shown in Figure 5a,b. In the diagrams, the saturation temperatures of MDM and MM are given according to the measured pressure in the flask. The temperature ϑ v a p represents the temperature of an MM-dominated mixture, including all other low boilers that evaporate below MDM. Furthermore, the temperatures of the boiling fluid mixture and the vapor are shown. The condensation rate is categorized (0, none; 1, low; 2, medium; 3, high) by visual observation. In Experiment A, the base fluid reservoir was heated to a set-point of 85 °C. In Experiment B, the temperature set-point was set to 90 °C. If the liquid temperature exceeds the saturation temperatures, evaporation occurs. If the measured vapor temperature is above or near the saturation temperature, condensation occurs. During Time Steps 2, 3 and 4, the condensation rate rises in both experiments; in that period, the first distillates are taken (Product #1). The first distillate usually contains the largest share of low boilers. The second distillate (Product #2), containing mainly MDM, is extracted during Time Steps 8 and 9. In the end of every experiment, liquid remains in the heated flask (residue). In Table 6, the composition of the first product of Experiment A is shown. Especially, the low boiler MM has been enriched. The analysis results of the original working fluid samples can be found in Table A2 and Table A3 in the Appendix.
The composition of Product #2 in Table 7 shows that mainly the MDM could be extracted from the original sample. With a purity of 95.2%, after one treatment, the distilling result is very good. With a fraction of 3.4%, the greater share of the rest consists mainly of high boilers (D4/L4).
The analysis results of the distilling residues (Table 8) show large fractions of high boilers and still 25.5% of MDM.
Taking a look at the analysis of Product #1 in Experiment B (Table 9), one can again see a large fraction of MDM and low boilers being separated. Compared to Experiment A, the mass fractions of MDM and MM are higher (71% and 21.1%).
Product #2 of Experiment B shows an almost perfect extraction of MDM from the educt fluid (Table 10). The only other relevant component in this case is the high boiler D4.
The results in Table 11 show a similar compound distribution as in Experiment A. Mainly high boilers and MDM are left as residue in the original sample after distilling.
In Experiment #1, 80.4% of MDM could be recovered (Figure 5a) from the base fluid. In Experiment #2, 63.8% of the MDM could be recovered from the base fluid. In terms of total working fluid, this means a recovery rate of 64.24% for Experiment #1, respectively 53.8% for Experiment #2. The lubricant contamination was removed successfully from the original sample, and no traceable amount of lubricant remained in the product sample. A visualization of the mass flows during the distilling process is depicted for both experiments in Figure 6 and Figure 7.
The two Sankey diagrams in Figure 6 and Figure 7 illustrate that low boiler and lubricant contaminations are collected in Product #1. High boilers are not evaporated and remain in the first flask as residue.

4.2. Distilling and Fluid Treatment under Field Conditions

Based on the experiences from the laboratory tests, the condensation was tested at a real scale in Power Plant Case Study #8. Unlike the laboratory setup, under real conditions, the base samples for fluid treatment are either tapped from the recuperator (Tap 3 in Figure 9) or the vacuum system (Tap 4 in Figure 9). In this case study, the main fluid source is the reservoir of the recuperator. As the distillation experiments in the previous section show, this source contains a large fraction of high boilers and lubricant. For the recovery of MDM and the elimination of lubricant fractions from the working fluid, it is the perfect source. The distilling apparatus (1) built for the condensation of MDM from fluid mixtures with a large fraction of high boilers is depicted in Figure 8a. It is mounted on top of the multi-cyclone (2) and heated by the hot exhaust gases of the biomass furnace. A water-cooled coil (3) is used for condensation. Usually, power plants of that type have a vacuum system removing inert gases and low boilers. In the original layout of this power plant, the vacuum pump (claw type) extracts working fluid vapor, containing a large fraction of low boilers and inert gas from the condenser. The extracted fluid is usually released to the ambient environment. By doing so, the MDM in the extracted fluid is lost, and the working fluid exhaust pollutes the environment. In order to avoid this, a reservoir has been added to the system. The extracted mixture is collected in a vessel outside the turbine house ((1) in Figure 8b). In order to separate the low boilers and inert gases from the mixture in the vessel, a second vacuum pump (membrane type) has been added. It can provide a lower pressure than the original pump ((2) in Figure 8b).

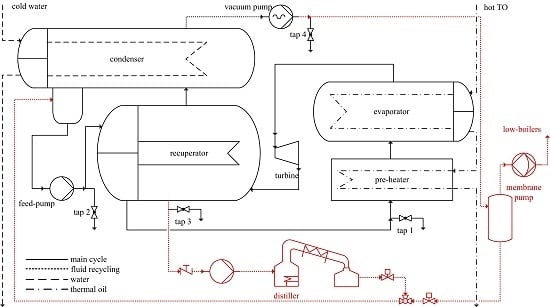
5. Cycle Modifications

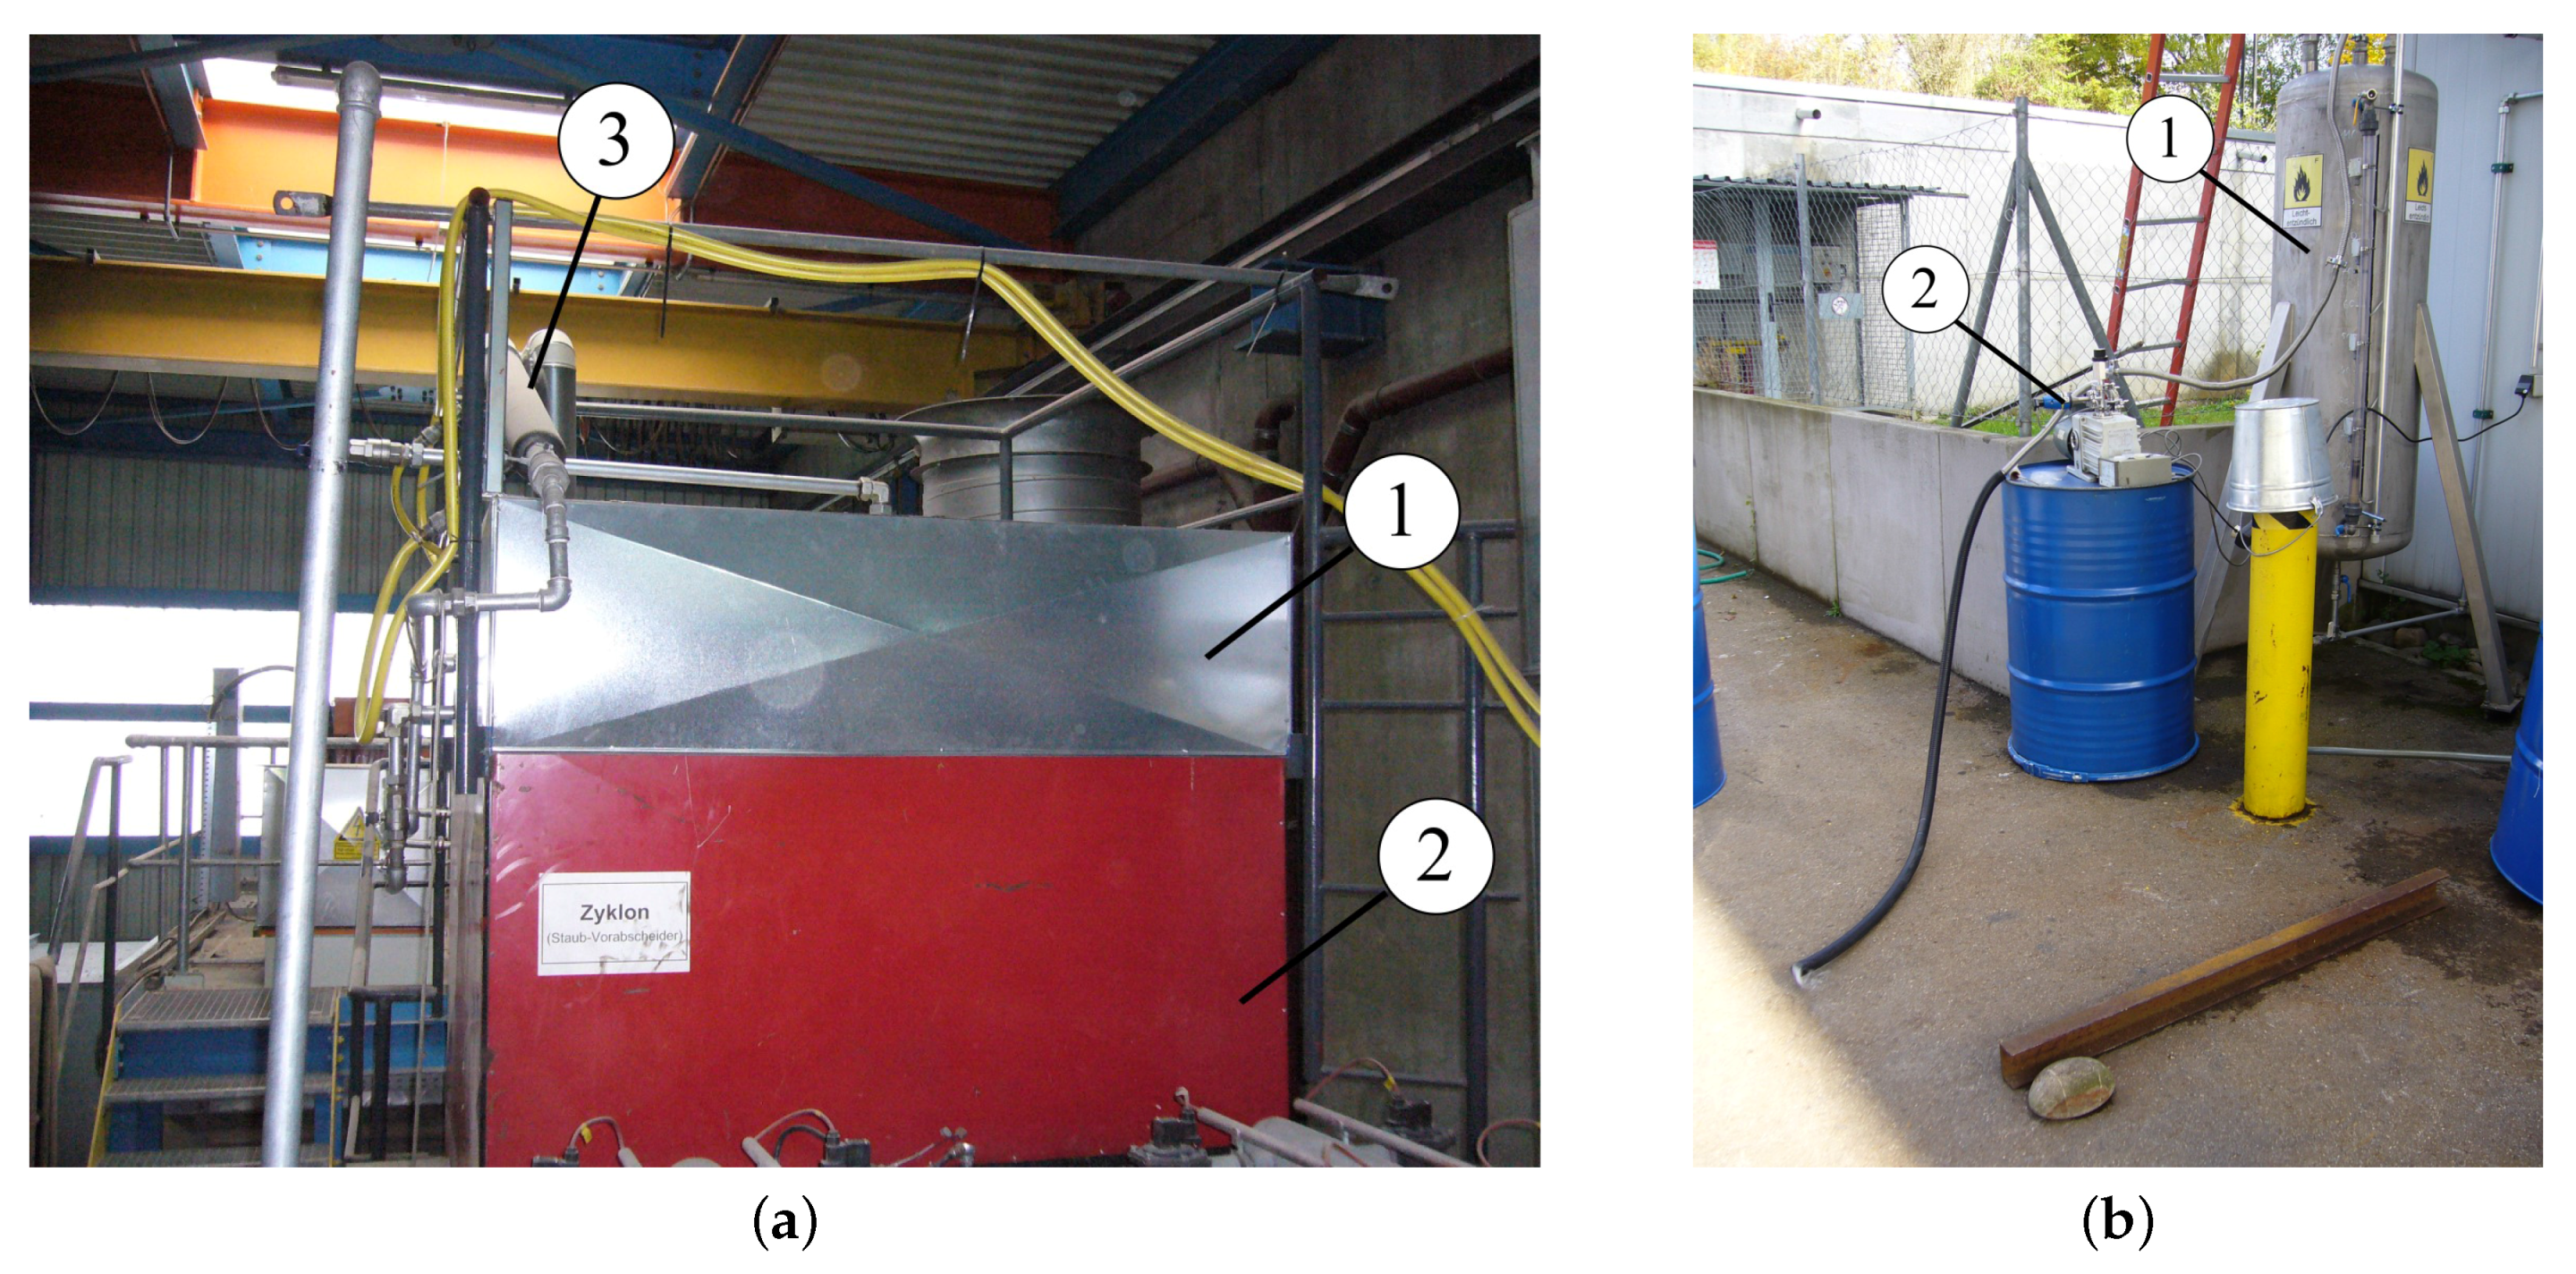
The modifications that were made in order to conduct the recycling procedures are depicted in 
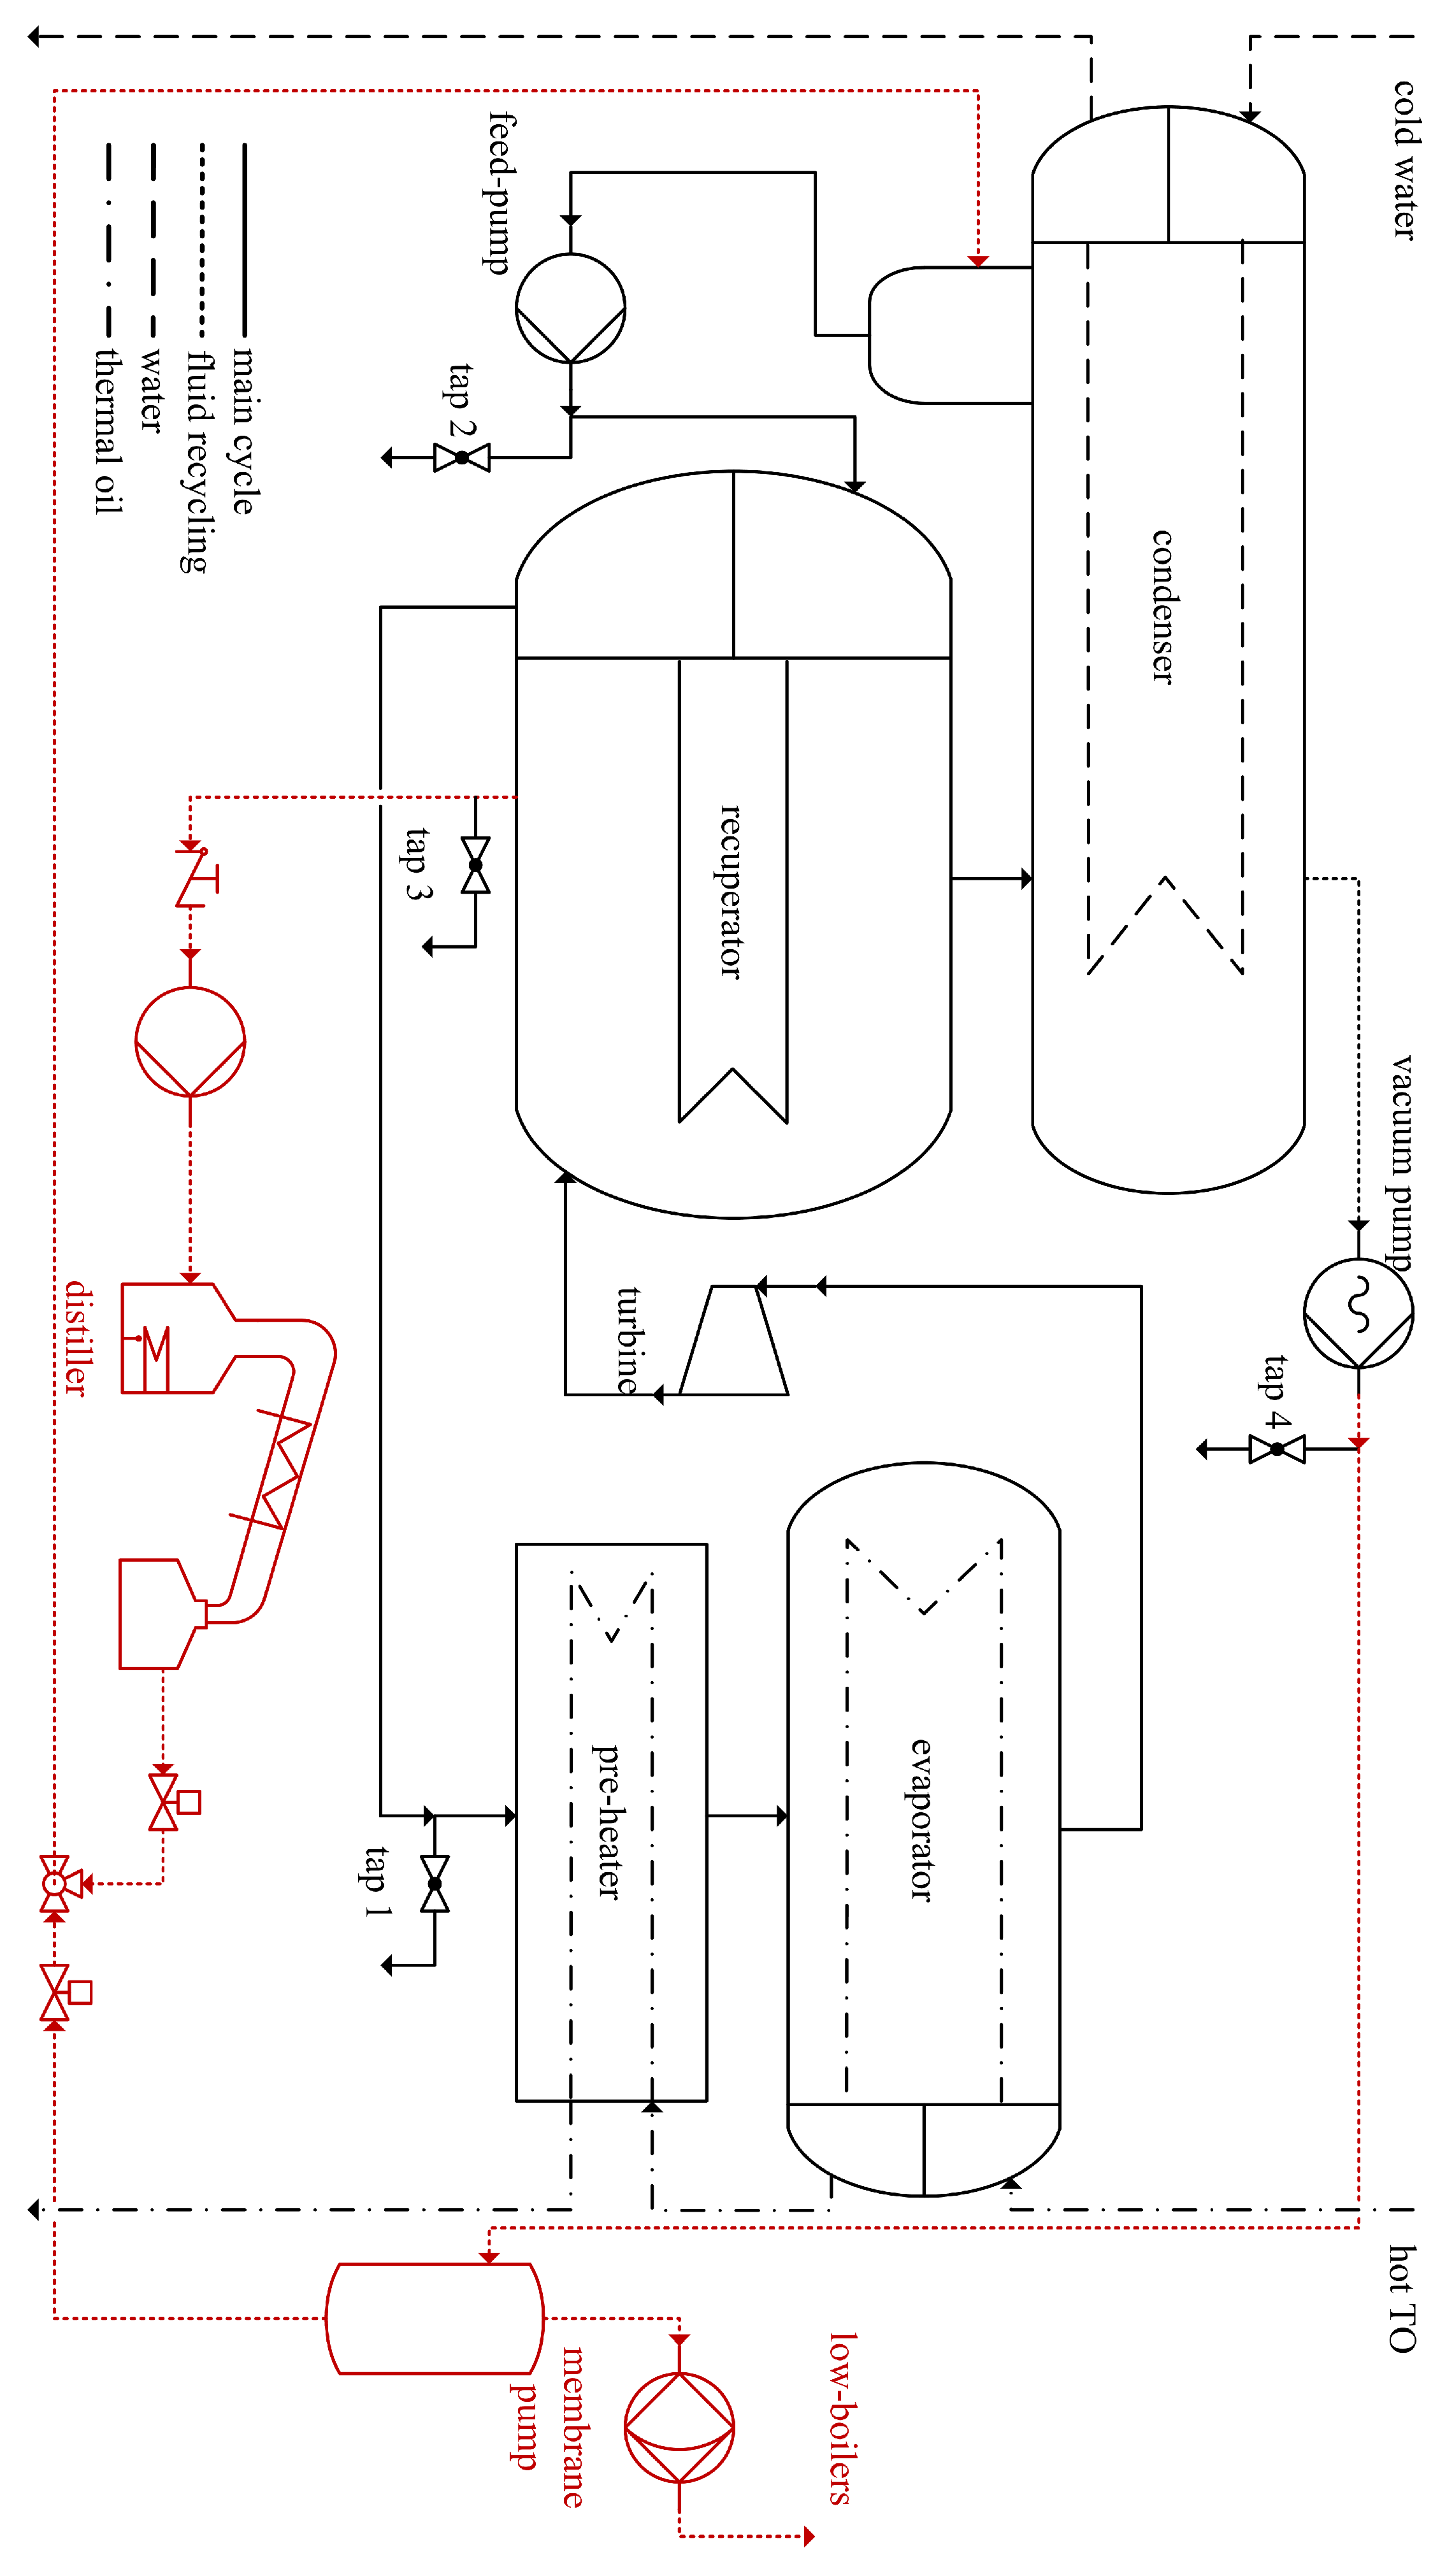
Figure 9a,b and the scheme in Figure 8. Besides the original vacuum pump, a membrane pump was installed (Figure 9, highlighted in red). Vapor from the condenser vessel is collected in a reservoir outside the turbine house where it partially condenses (Figure 8b). As the tests show (Table 3), the fluid mixture from the vacuum pump contains a great share of MM. In order to remove the MM from the mixture, a pressure between 10 mbar and 43 mbar is necessary (ambient temperature in a range of 0–20 °C). This system is operated batch-wise; as soon as the capacity of the vessel is reached (200 liters ), the membrane pump is started. After the end of the procedure, the remaining MDM is returned to the cycle. The removal of working fluid with a high fraction of high boilers is done via a drain (Tap 3, 
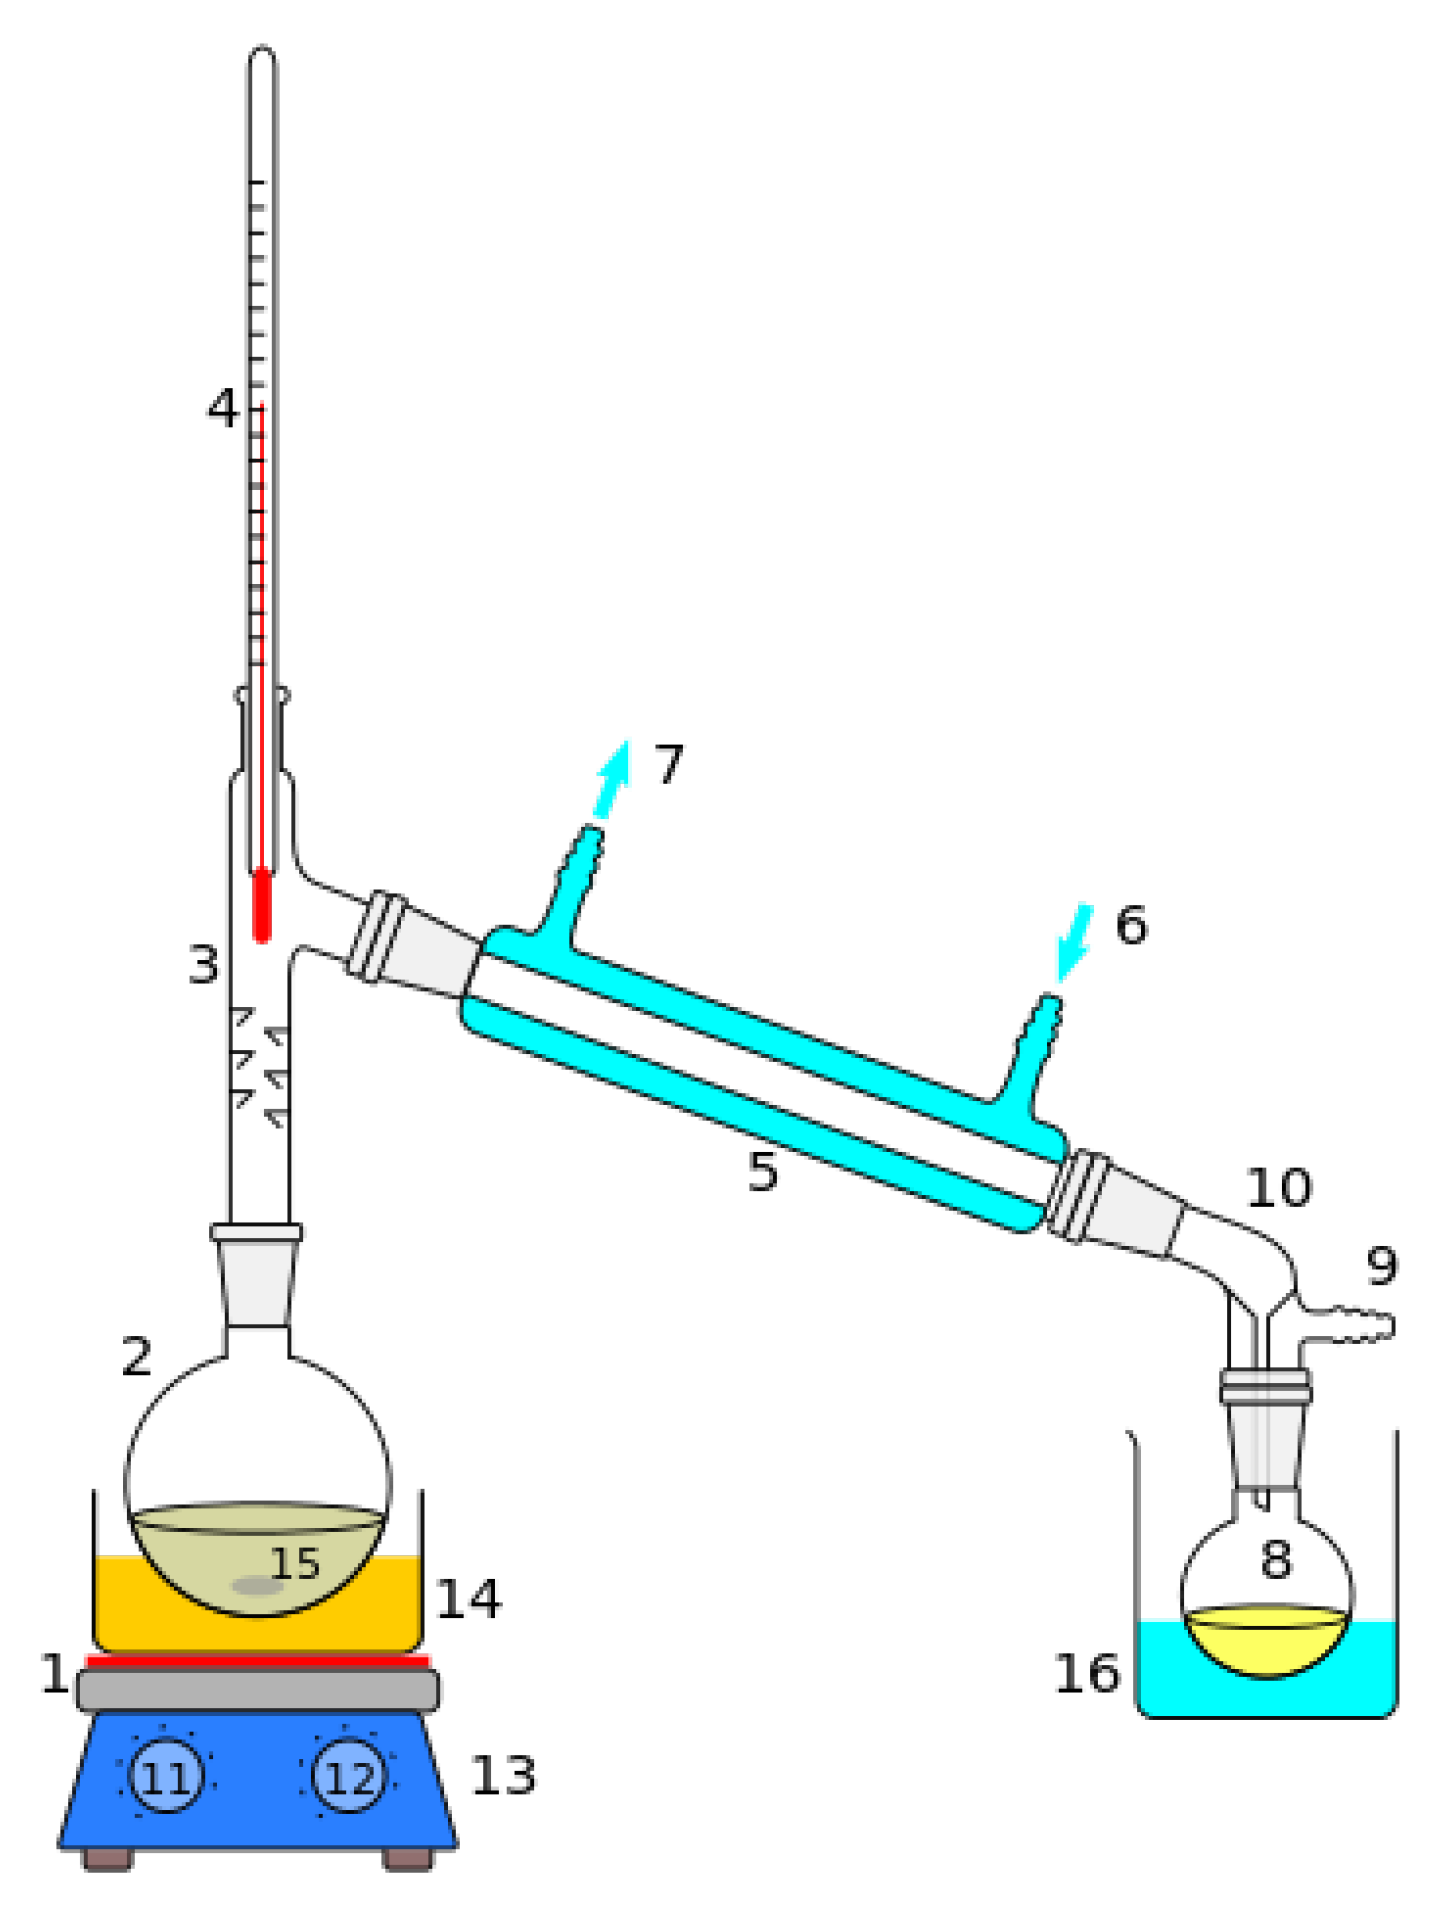
Figure 9) in the recuperator vessel. With the original design of the cycle, this was not possible. The liquid from this tap is evaporated in the distilling apparatus depicted in Figure 8. With the modifications of the cycle, the costs for the recovery of one liter of MDM, with a purity of more than 95%, are roughly € 8. After more than one year of operational experience with regular working fluid checks and replacement, the following observations were made.
  • The condenser pressure has been held stable at a low level. As a consequence, the electric output and efficiency increased significantly.
  • The availability of enough fluid and an appropriate filling level of the evaporator leads to less super-heating, due to that fact hot spots in the evaporation section are avoided. The thermal efficiency of the system rises.
  • The turbine and the recuperator are suffering less from droplet impingement. A qualitative estimation is not possible in this case. However, the noise emissions and vibrations were reduced significantly.

6. Discussion

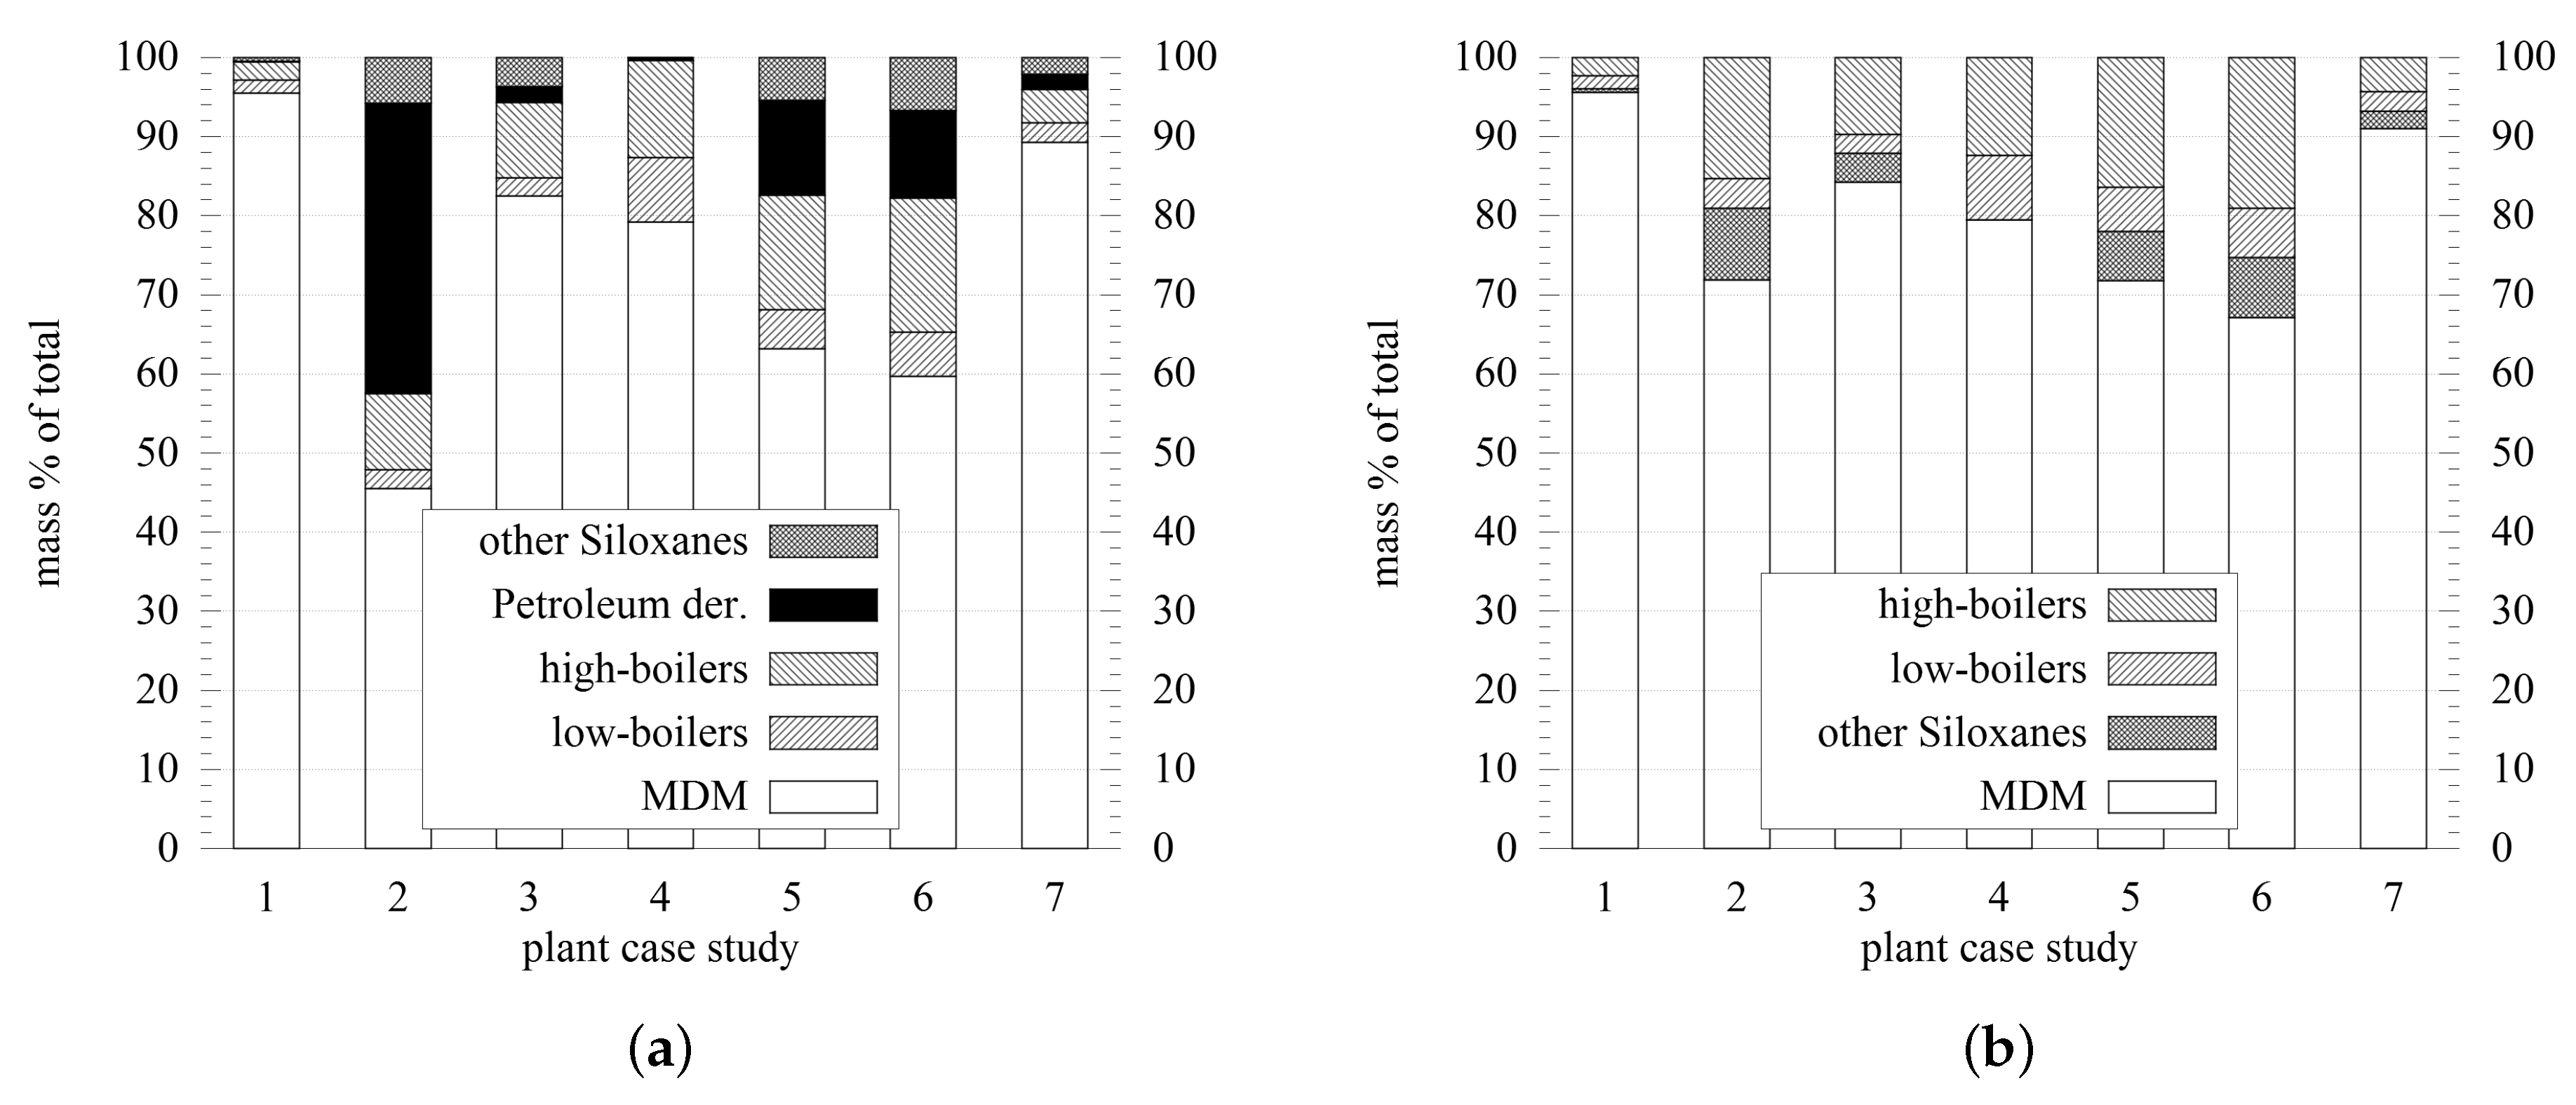
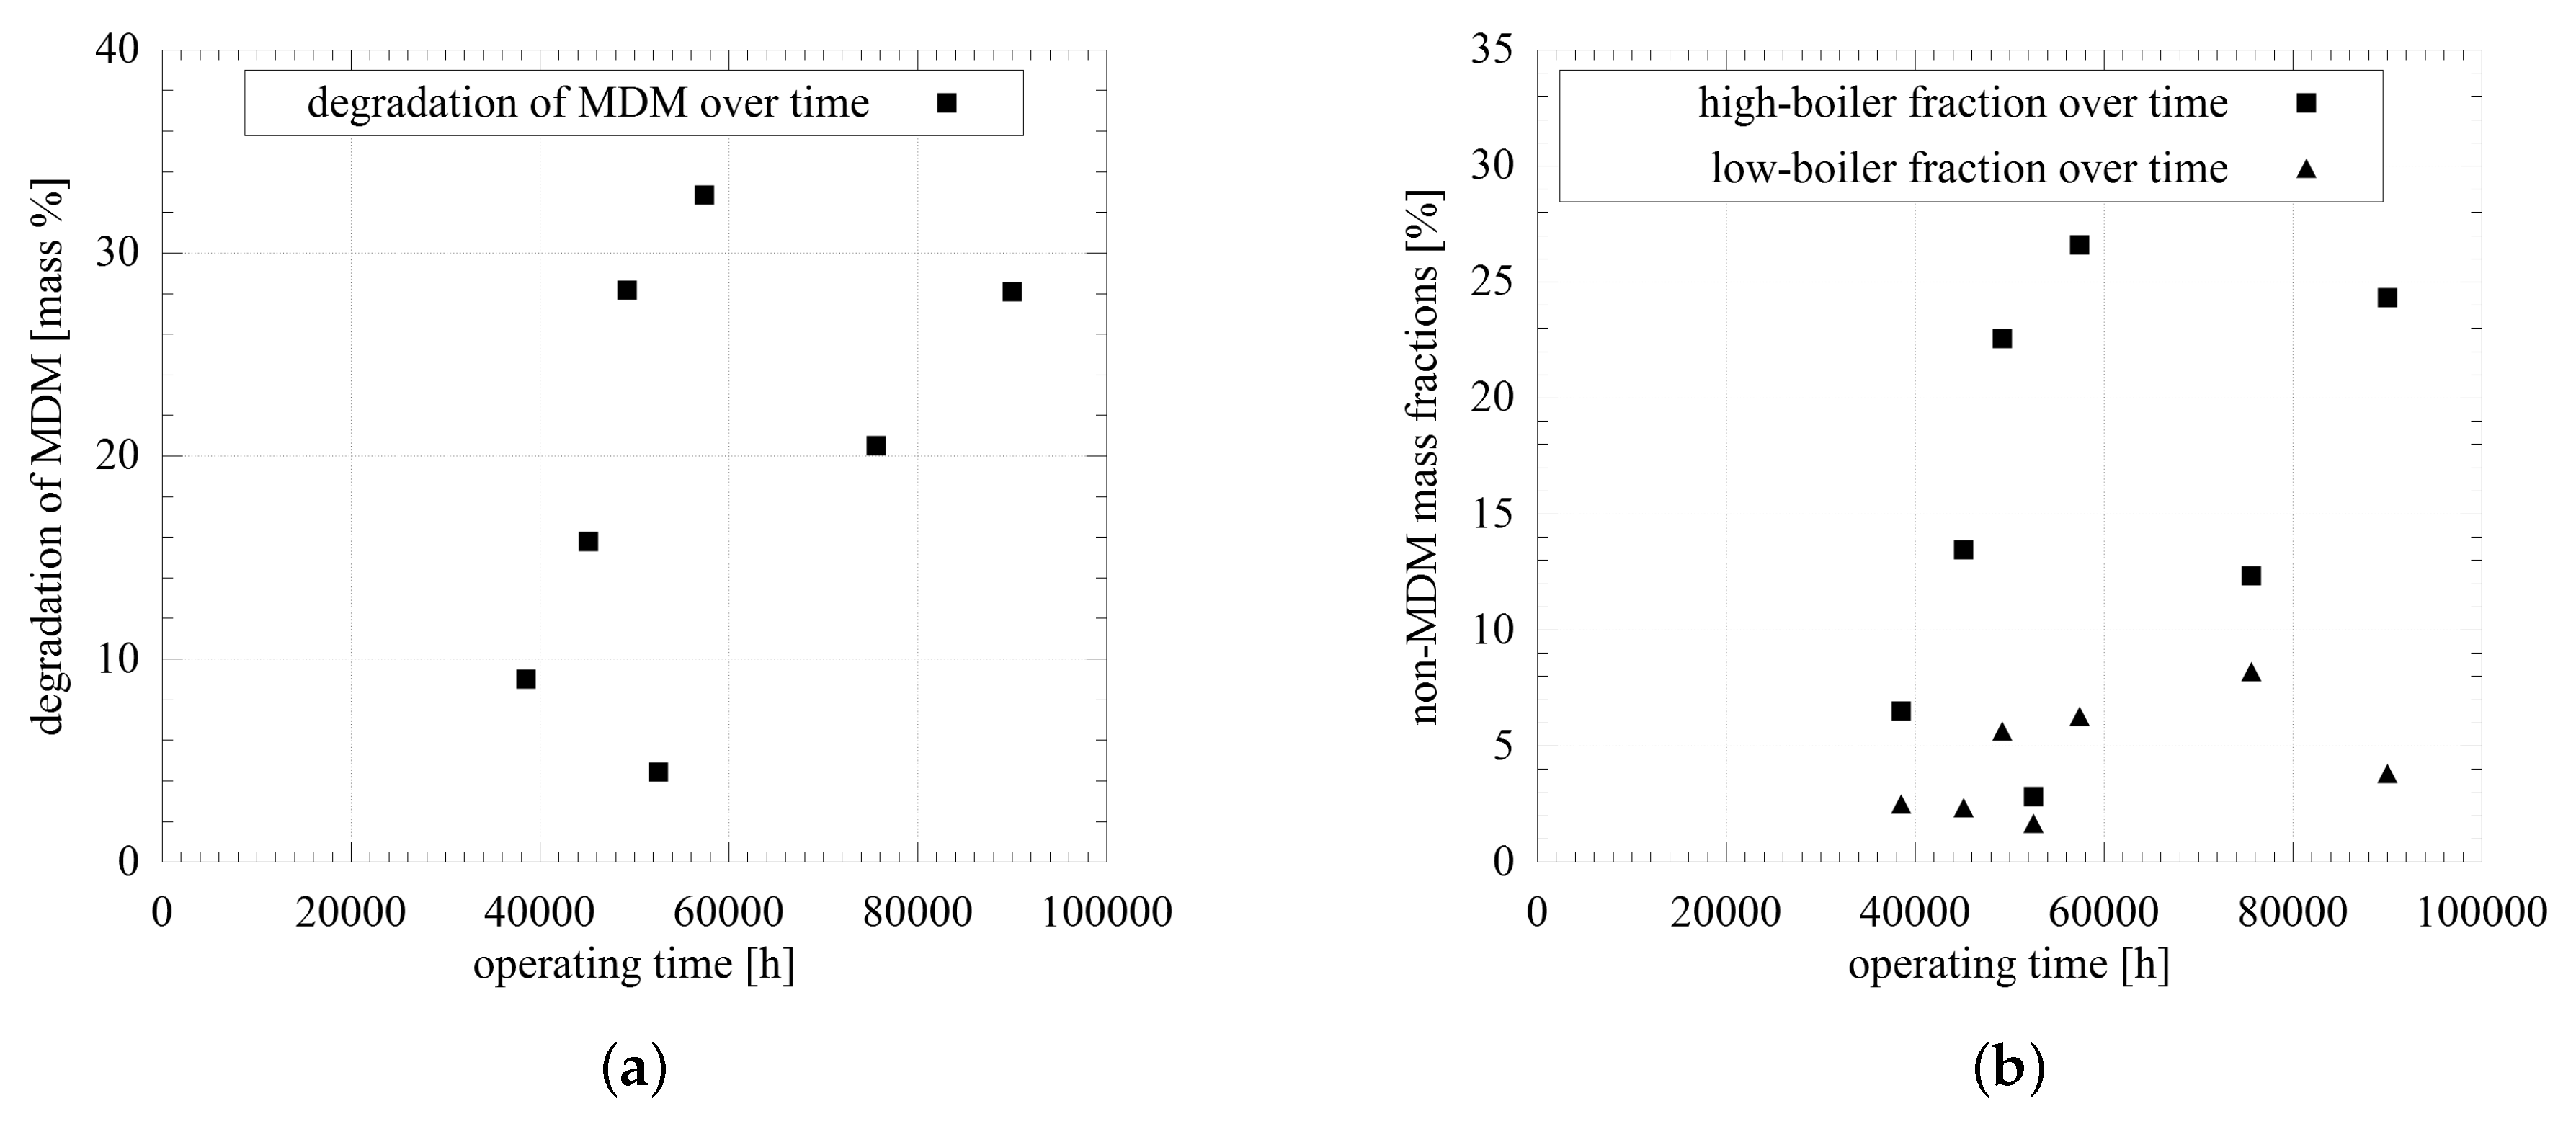
The presented research with a field analysis of eight power plants shows that the degradation and aging of working fluids is a problem. In order to turn an ORC power plant into a good investment for a long period, the working fluid properties have to be observed. ORC power plants are often said to have low personnel and maintenance costs. As the results here show, this is not entirely true. Quality checks and the distilling process demand manpower on site. In most cases, where ORC power plants are biomass fueled, the personnel already exist. The recycling procedure can be integrated in the weekly and monthly routines of the operation of such a power plant. Due to design and concept reasons, the usage of a separated lubricating system is state-of-the art in many large-scale ORC modules. If designed properly, the contamination of working fluid by turbine oil can be mostly avoided. However, gaskets do fail, and oil pumps do fail. Taking a look at the analyses of the different case studies, this happens regularly. The data in 
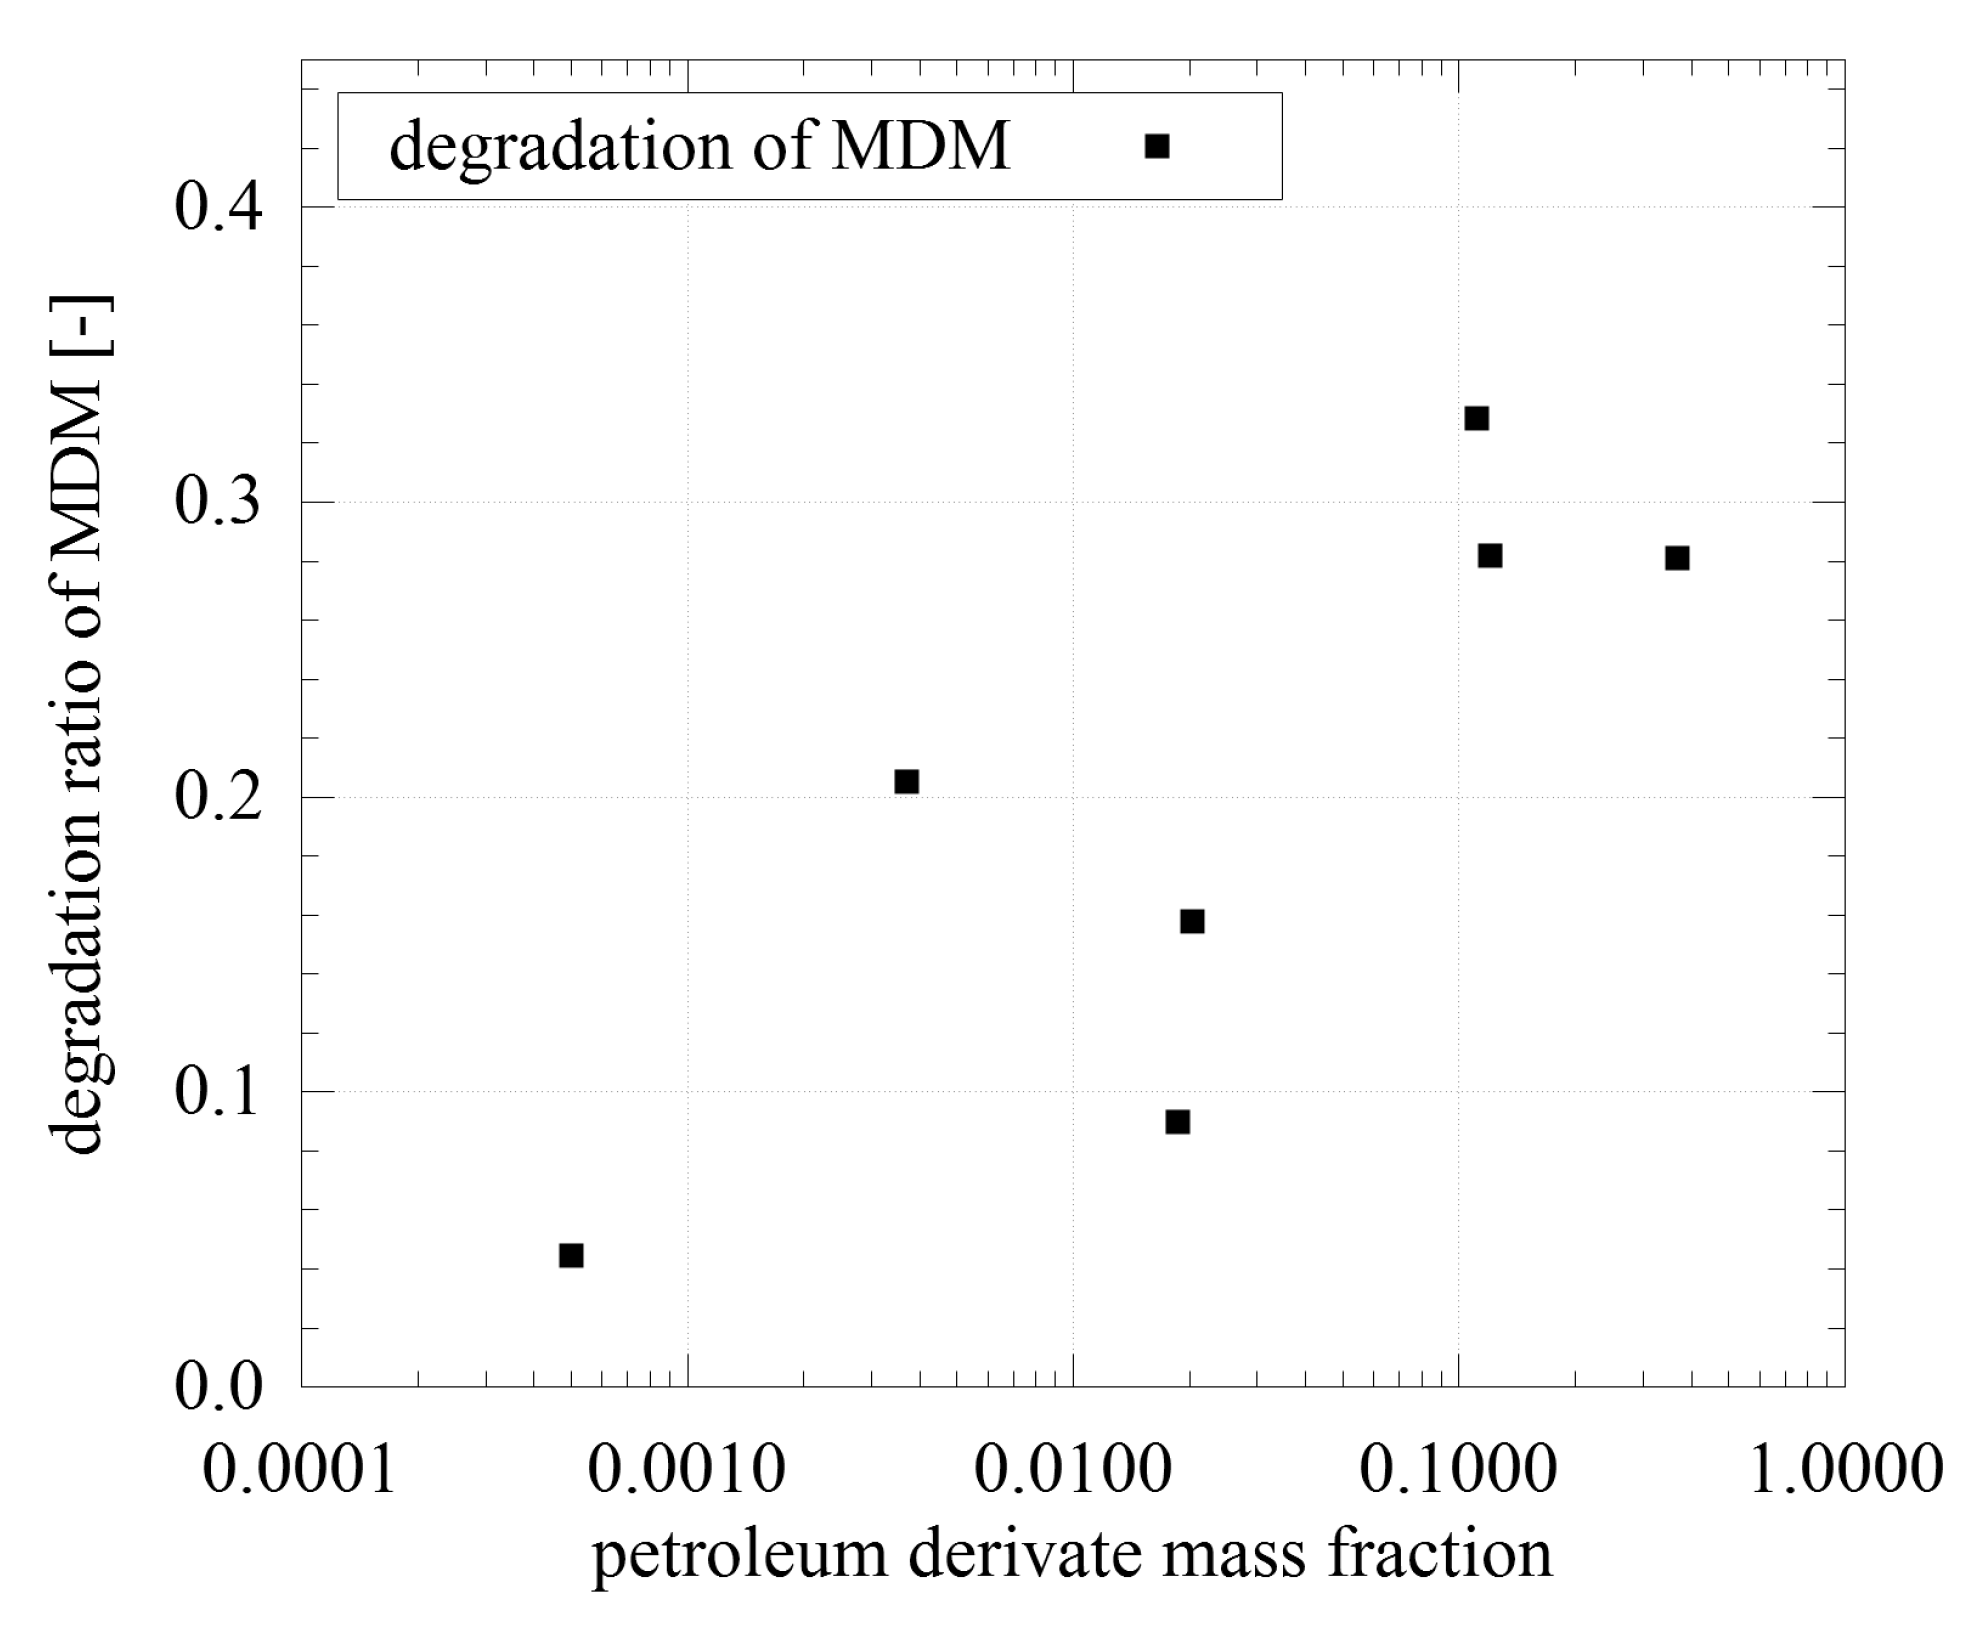
Figure 4 indicate a correlation between the contamination and the degradation of MDM. The reaction kinetics are not clear to the authors, as the interplay of the different factors, such as contamination, composition, time and temperature, are too complex. As the fluid aging process seems to be unavoidable, countermeasures are necessary. Both, the laboratory experiments, as well as the in situ experiments have shown that the distilling of old working fluid is a technical and economical alternative to the refilling of the cycle with fresh fluid. By doing so, lubricants can be completely removed, and the MDM fraction can be significantly increased. While the replacement of the working fluid takes time to shut down the facility and clean the cycle, recycling can be done while the engine is running. Furthermore, the old working fluid does not have to be disposed. The modifications shown in Figure 8a,b and Figure 9 are relatively straight forward. The actual process is not affected nor disturbed by this method. The results of operation of the power plant in Case Study #8 for more than one year with this strategy prove the effectiveness of the proposed methods. The annual electric efficiency increased to a value of 13.22% (7.6% in 2013 and 5.04% in 2014).

7. Conclusions

The following conclusions can be drawn from the observations in this paper:
  • The data indicate that the degradation of MDM in ORCs is related to the amount of petroleum-based lubricants. If this is related to the main component of the lubricant, to its additives or to the decomposition products of the lubricant is not entirely clear.
  • The decomposition process under the observed conditions leads to a large amount of high boilers in the working fluid.
  • The fluid composition throughout the cycle differs significantly. A large fraction of high boilers precipitate after the turbine in the recuperator. This offers the opportunity to remove these high boilers from the system if the recuperator has a closed reservoir.
  • Low boilers can be removed from the cycle with the vacuum system by adding an additional membrane pump.
  • The distilling of highly contaminated working fluid can deliver 95% of pure MDM after the first treatment. Lubricants can be removed from the fluid reliably under laboratory conditions.
  • The laboratory distilling tests have shown that 64–80% of MDM in the working fluid can be recovered. This means that 54–64% of the aged working fluid can be reused. The rest has to be replaced by working fluid from another source.
  • The economical effort of distilling contaminated fluid is far below the effort of a reinvestment in new working fluid. The costs (investment and running costs) for the distillation for one liter of pure working fluid are around € 8. Over the last few years, the price for new working fluid ranged between € 15 and € 22 per liter. The personnel expenses for the working fluid recycling are negligible, as the power plant at hand requires attendance of at least one mechanic. The necessary work steps can be included in the day-to-day work flow.
  • The reduction of low boilers led to lower condensing pressures and higher electric outputs. The removal of high boilers reduced droplet impingement and resulted in smoother operation of the engine. With higher working fluid purity and appropriate filling level, the super-heating could be reduced.
  • After cleaning the working fluid and regular working fluid checks and replacements, in 2015, the annual electric efficiency of Case Study #8 increased significantly to 13.22% (7.6% in 2013 and 5.04% in 2014).
Even though the number of analyzed power plants is rather low, the data show the relevance of this topic and the necessity for further investigation. The detailed chemical processes, especially the interaction of hydrocarbons from the lubricant oil with MDM, could not be analyzed in detail. Further chemical analyses, under laboratory conditions, are necessary to determine the reaction kinetics of this complex process. However, the implementation of the recycling procedure in an existing power plant proves the potential of the applied methods. The replication of this method could improve the economical situation of many power plants of this type.

Acknowledgments

Thanks to the local energy supplier Stadtwerke Esslingen for giving the opportunity to conduct this study on their premises. Many thanks to Lisa Botero.

Author Contributions

Jürgen Gölz and Tobias G. Erhart performed the experiments; Jürgen Gölz and Tobias G. Erhart analyzed the data;Tobias G. Erhart wrote the paper; Martijn van den Broek developed the paper structure; Ursula Eicker was in charge of the project and the entire methodology

Conflicts of Interest

The authors declare no conflict of interest. The funding sponsors had no role in the design of the study; in the collection, analyses or interpretation of data; in the writing of the manuscript; nor in the decision to publish the results.

Abbreviations

The following abbreviations are used in this manuscript:
L2/MM:Hexamethyldisiloxane
L3/MDM:Octamethyltrisiloxane
D3:Hexamethylcyclotrisiloxane
D4:Octamethylcyclotetrasiloxane
L4/MD2M:Decamethyltetrasiloxane
D5:Decamethylcyclopentasiloxane
L5/MD3M:Dodecamethylpentasiloxane
MOH:Trimethylsilanol
CHP:Combined Heat and Power
CAS:Chemical Abstract Service registry number
HS-GC-MS:Head Space Gas Chromatography Mass Spectrometry
TO:Thermal oil; here, Therminol®66
ORC:Organic Rankine Cycle
ϑ:Temperature in °C
Educt:Original sample before distilling
Product:Extracted material
Residue:Remaining material after distilling

Subscript

cond:condensing, condensate, condensed
el:electric
max:maximum
th:thermal
vap:vapor

Appendix A

Table A1. Detailed working fluid compositions of case Studies #1–#7.
Compound Case Study
1234567
Octamethyltrisiloxane (L3/OMTS)0.95500.45500.82500.79200.63200.59700.8930
Hexamethyldisiloxane (L2)0.01370.02080.02130.07550.04720.05000.0214
Hexamethylcyclotrisiloxane (D3)0.00260.00310.00140.00590.00210.00560.0030
Octamethylcyclotetrasiloxane (D4)0.00470.01060.00710.04930.00430.01130.0039
Decamethyltetrasiloxane (L4)0.01150.05040.05220.05120.08310.08860.0206
Decamethylcyclopentasiloxane (D5)0.00020.00140.00050.00540.00030.00140.0000
Dodecamethylpentasiloxane (L5)0.00700.03420.03570.01700.05670.06800.0180
Trimethylsilanol (MOH)-0.0000-----
Other poly-siloxanes0.00500.05740.0365-0.05440.06710.0213
Petroleum0.00050.36710.02030.00370.12000.11100.0187
Low boilers0.01630.02390.02270.08140.04930.05560.0244
High boilers0.02330.09660.09560.12290.14440.16930.0426
Sum1.00001.00001.00001.00001.00001.00000.9999
Table A2. HS-GC-MS analysis results of Experiment A, educt.
CompoundAbbreviationCASMass Fraction (%)
OctamethyltrisiloxaneL3/MDM107-51-775.991
HexamethyldisiloxaneL2/MM107-46-03.041
HexamethylcyclotrisiloxaneD3107-52-80.516
OctamethylcyclotetrasiloxaneD4556-67-23.354
DecamethyltetrasiloxaneL4/MD2M141-62-87.696
DecamethylcyclopentasiloxaneD5541-02-60.704
DodecamethylpentasiloxaneL5/MD3M141-63-93.734
TrimethylsilanolMOH1066-40-6-
Other poly-siloxanes--1.873
Petroleum--3.094
Table A3. HS-GC-MS analysis results of Experiment A, educt.
CompoundAbbreviationCASMass Fraction (%)
OctamethyltrisiloxaneL3/MDM107-51-781.571
HexamethyldisiloxaneL2/MM107-46-010.968
HexamethylcyclotrisiloxaneD3107-52-80.676
OctamethylcyclotetrasiloxaneD4556-67-21.986
DecamethyltetrasiloxaneL4/MD2M141-62-82.857
DecamethylcyclopentasiloxaneD5541-02-60.208
DodecamethylpentasiloxaneL5/MD3M141-63-91.055
TrimethylsilanolMOH1066-40-60.010
Other poly-siloxanes--0.658
Petroleum---

References

  1. Turboden. Technical Report 07A03061e–List of Recent Projects; Technical Report; Turboden Srl: Brescia, Italy, 2008. [Google Scholar]
  2. Zhou, W.; Yang, H.; Guo, X.; Lu, J. Thermal degradation behaviors of some branched and linear Polysiloxanes. Polym. Degrad. Stab. 2006, 91, 1471–1475. [Google Scholar] [CrossRef]
  3. Grassie, N.; Macfarlane, I. The thermal degradation of Polysiloxanes, I. Poly(dimethylsiloxane). Eur. Polym. J. 1978, 14, 875–884. [Google Scholar] [CrossRef]
  4. Dow Corning. Safety Datasheet-Dow Corning®OS-20; Technical Report; Dow Corning S.A.: Seneffe, Belgium, 2013; Volume 3.1. [Google Scholar]
  5. Obernberger, I.; Biedermann, F. Combustion and Gasification of Solid Biomass for Heat and Power Production in Europe—State-of-the-Art and Relevant Future Developments; Technical Report; Austrian Bioenergy Centre GmbH, Graz, Austria and Eindhoven University of Technology: Einhoven, The Netherlands, 2005. [Google Scholar]
  6. Strzalka, R.; Erhart, T.; Eicker, U. Analysis and optimization of a cogeneration system based on biomass combustion. Appl. Therm. Eng. 2013, 50, 1418–1426. [Google Scholar] [CrossRef]
  7. Eicker, U. (Ed.) POLYCITY—Energy Networks in Sustainable Cities; Karl Krämer Verlag: Stuttgart, Germany, 2012.
  8. Preisentwicklung bei Waldhachschnitzeln. Available online: http://www.carmen-ev.de/infothek/preisindizes/hackschnitzel/jahresmittelwerte (accessed on 1 October 2013).
  9. Wikipedia. Condenser (laboratory). Available online: https://en.wikipedia.org/wiki/Condenser_(laboratory) (accessed on 28 Janury 2016).
  10. Arrhenius, S. On the reaction velocity of the inversion of cane sugar by acids. Z. Phys. Chem. 1889, 4, 226. [Google Scholar]
  11. Erhart, T.G. Improvement of Heat-led CHPs Based upon ORC Technology. Ph.D. Thesis, Strathclyde University of Glasgow, Glasgow, UK, 2016. [Google Scholar]
Figure 1. Scheme of the used laboratory distilling setup [9].
Energies 09 00422 g001
Figure 2. (a) Composition of case study fluids including contamination; (b) Composition of case study fluids, siloxane fractions only.
Energies 09 00422 g002
Figure 3. (a) High and low boiler fraction in fluid samples versus operating time; (b) Degradation of working fluid versus operating time.
Energies 09 00422 g003
Figure 4. Degradation rate of MDM versus petrol derivate fraction in cycle fluid.
Energies 09 00422 g004
Figure 5. (a) Distilling process of Experiment A; (b) Distilling process of Experiment B.
Energies 09 00422 g005
Figure 6. Sankey diagram of mass flows for distilling Experiment A.
Energies 09 00422 g006
Figure 7. Sankey diagram of mass flows for distilling Experiment B.
Energies 09 00422 g007
Figure 8. (a) Distilling apparatus on top of multi-cyclone/exhaust gas duct; (b) new fluid reservoir for low boiler extraction and membrane pump.
Energies 09 00422 g008
Figure 9. Cycle scheme including sample taps and all design modifications (red).
Energies 09 00422 g009
Table 1. Boundary and operating conditions for seven case study ORC power plants (1–7) and one test power plant (8).
Case ϑ source , max (°C)Age (Year)Operating Time (h) P m a x ( kVA )Operation Mode, Description
130010.552,5001200heat-led, district heating
23001290,0001280electricity-led
33135.545,1002000heat-led, district heating
430010.575,6001000both, district heating
5315649,2001000heat-led, district heating
6310757,4001000both, district heating
7308738,5001000heat-led, district heating
82901055,000950heat-led, district heating
Table 2. HS-GC-MS analysis results of cycle fluid (source: pre-heater after full-stop) [11].
CompoundAbbreviationCASMass Fraction (%)
OctamethyltrisiloxaneL3/MDM107-51-779.2
HexamethyldisiloxaneL2/MM107-46-07.55
HexamethylcyclotrisiloxaneD3107-52-80.592
OctamethylcyclotetrasiloxaneD4556-67-24.93
DecamethyltetrasiloxaneL4/MD2M141-62-85.12
DecamethylcyclopentasiloxaneD5541-02-60.535
DodecamethylpentasiloxaneL5/MD3M141-63-91.7
TrimethylsilanolMOH1066-40-6-
Table 3. HS-GC-MS analysis results of cycle fluid (source: vacuum pump) [11].
CompoundAbbreviationCASMass Fraction (%)
OctamethyltrisiloxaneL3/MDM107-51-750.9
HexamethyldisiloxaneL2/MM107-46-045.5
HexamethylcyclotrisiloxaneD3107-52-80.898
OctamethylcyclotetrasiloxaneD4556-67-21.4
DecamethyltetrasiloxaneL4/MD2M141-62-80.816
DecamethylcyclopentasiloxaneD5541-02-60.099
DodecamethylpentasiloxaneL5/MD3M141-63-90.238
TrimethylsilanolMOH1066-40-6-
Other poly-siloxanes--0.116
Table 4. HS-GC-MS analysis results of cycle fluid (source: recuperator reservoir) [11].
CompoundAbbreviationCASMass Fraction (%)
OctamethyltrisiloxaneL3/MDM107-51-765.50
HexamethyldisiloxaneL2/MM107-46-05.09
HexamethylcyclotrisiloxaneD3107-52-80.50
OctamethylcyclotetrasiloxaneD4556-67-24.97
DecamethyltetrasiloxaneL4/MD2M141-62-811.00
DecamethylcyclopentasiloxaneD5541-02-61.30
DodecamethylpentasiloxaneL5/MD3M141-63-97.05
TrimethylsilanolMOH1066-40-6-
Other poly-siloxanes--4.56
Table 5. HS-GC-MS analysis results of cycle fluid (source: feed pump) [11].
CompoundAbbreviationCASMass Fraction (%)
OctamethyltrisiloxaneL3/MDM107-51-778.3
HexamethyldisiloxaneL2/MM107-46-03.6
HexamethylcyclotrisiloxaneD3107-52-80.543
OctamethylcyclotetrasiloxaneD4556-67-24.04
DecamethyltetrasiloxaneL4/MD2M141-62-86.55
DecamethylcyclopentasiloxaneD5541-02-60.92
DodecamethylpentasiloxaneL5/MD3M141-63-93.96
TrimethylsilanolMOH1066-40-60.001
Other poly-siloxanes--1.852
Table 6. HS-GC-MS analysis results of Experiment A, Product #1.
CompoundAbbreviationCASMass Fraction (%)
OctamethyltrisiloxaneL3/MDM107-51-762.3
HexamethyldisiloxaneL2/MM107-46-015.8
HexamethylcyclotrisiloxaneD3107-52-81.05
OctamethylcyclotetrasiloxaneD4556-67-20.638
DecamethyltetrasiloxaneL4/MD2M141-62-80.275
DecamethylcyclopentasiloxaneD5541-02-60.004
DodecamethylpentasiloxaneL5/MD3M141-63-9≤0.001
TrimethylsilanolMOH1066-40-6-
Other poly-siloxanes---
Petroleum--19.920
Table 7. HS-GC-MS analysis results of Experiment A, Product #2.
CompoundAbbreviationCASMass Fraction (%)
OctamethyltrisiloxaneL3/MDM107-51-795.2
HexamethyldisiloxaneL2/MM107-46-00.883
HexamethylcyclotrisiloxaneD3107-52-80.546
OctamethylcyclotetrasiloxaneD4556-67-22.4
DecamethyltetrasiloxaneL4/MD2M141-62-80.995
DecamethylcyclopentasiloxaneD5541-02-60.006
DodecamethylpentasiloxaneL5/MD3M141-63-90.018
TrimethylsilanolMOH1066-40-6-
Other siloxanes---
Petroleum---
Table 8. HS-GC-MS analysis results of Experiment A, residue.
CompoundAbbreviationCASMass Fraction (%)
OctamethyltrisiloxaneL3/MDM107-51-725.5
HexamethyldisiloxaneL2/MM107-46-00.098
HexamethylcyclotrisiloxaneD3107-52-80.011
OctamethylcyclotetrasiloxaneD4556-67-28.47
DecamethyltetrasiloxaneL4/MD2M141-62-834.8
DecamethylcyclopentasiloxaneD5541-02-618.4
DodecamethylpentasiloxaneL5/MD3M141-63-9-
TrimethylsilanolMOH1066-40-69.257
Other siloxanes---
Table 9. HS-GC-MS analysis results of Experiment B, Product #1.
CompoundAbbreviationCASMass Fraction (%)
OctamethyltrisiloxaneL3/MDM107-51-771.0
HexamethyldisiloxaneL2/MM107-46-027.1
HexamethylcyclotrisiloxaneD3107-52-81.15
OctamethylcyclotetrasiloxaneD4556-67-20.517
DecamethyltetrasiloxaneL4/MD2M141-62-80.235
DecamethylcyclopentasiloxaneD5541-02-60.005
DodecamethylpentasiloxaneL5/MD3M141-63-90.006
TrimethylsilanolMOH1066-40-60.024
Other siloxanes---
Table 10. HS-GC-MS analysis results of Experiment B, Product #2.
CompoundAbbreviationCASMass Fraction (%)
OctamethyltrisiloxaneL3/MDM107-51-796.7
HexamethyldisiloxaneL2/MM107-46-00.156
HexamethylcyclotrisiloxaneD3107-52-80.397
OctamethylcyclotetrasiloxaneD4556-67-22.14
DecamethyltetrasiloxaneL4/MD2M141-62-80.553
DecamethylcyclopentasiloxaneD5541-02-60.019
DodecamethylpentasiloxaneL5/MD3M141-63-90.009
TrimethylsilanolMOH1066-40-6-
Other siloxanes---
Table 11. HS-GC-MS analysis results of Experiment B, residue.
CompoundAbbreviationCASMass Fraction (%)
OctamethyltrisiloxaneL3/MDM107-51-716.9
HexamethyldisiloxaneL2/MM107-46-00.004
HexamethylcyclotrisiloxaneD3107-52-80.004
OctamethylcyclotetrasiloxaneD4556-67-210.4
DecamethyltetrasiloxaneL4/MD2M141-62-841.1
DecamethylcyclopentasiloxaneD5541-02-63.25
DodecamethylpentasiloxaneL5/MD3M141-63-917.4
TrimethylsilanolMOH1066-40-6-
Other siloxanes--10.915

