
Influence of Hydrogen-Based Storage Systems on Self-Consumption and Self-Sufficiency of Residential Photovoltaic Systems


Abstract
:
1. Introduction
2. Modelling

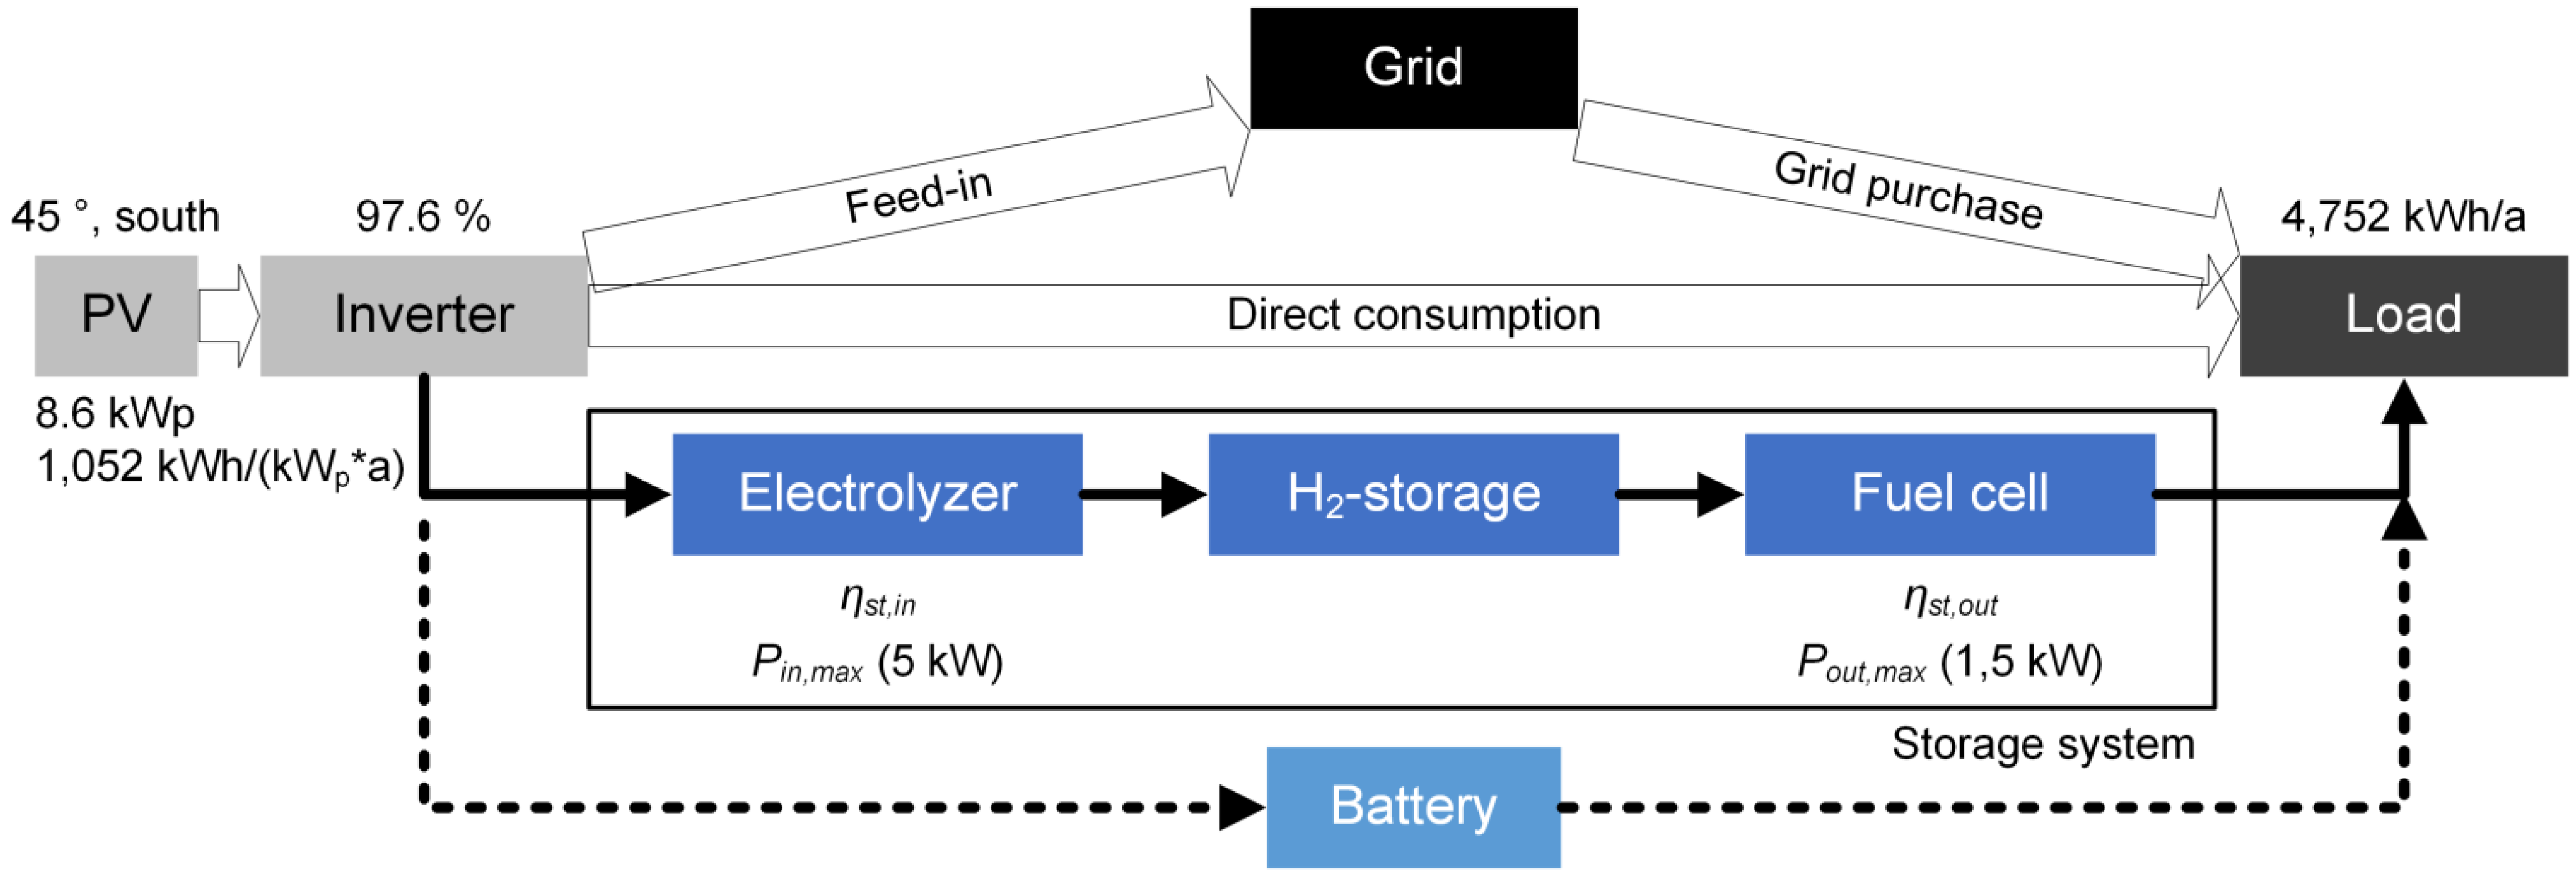
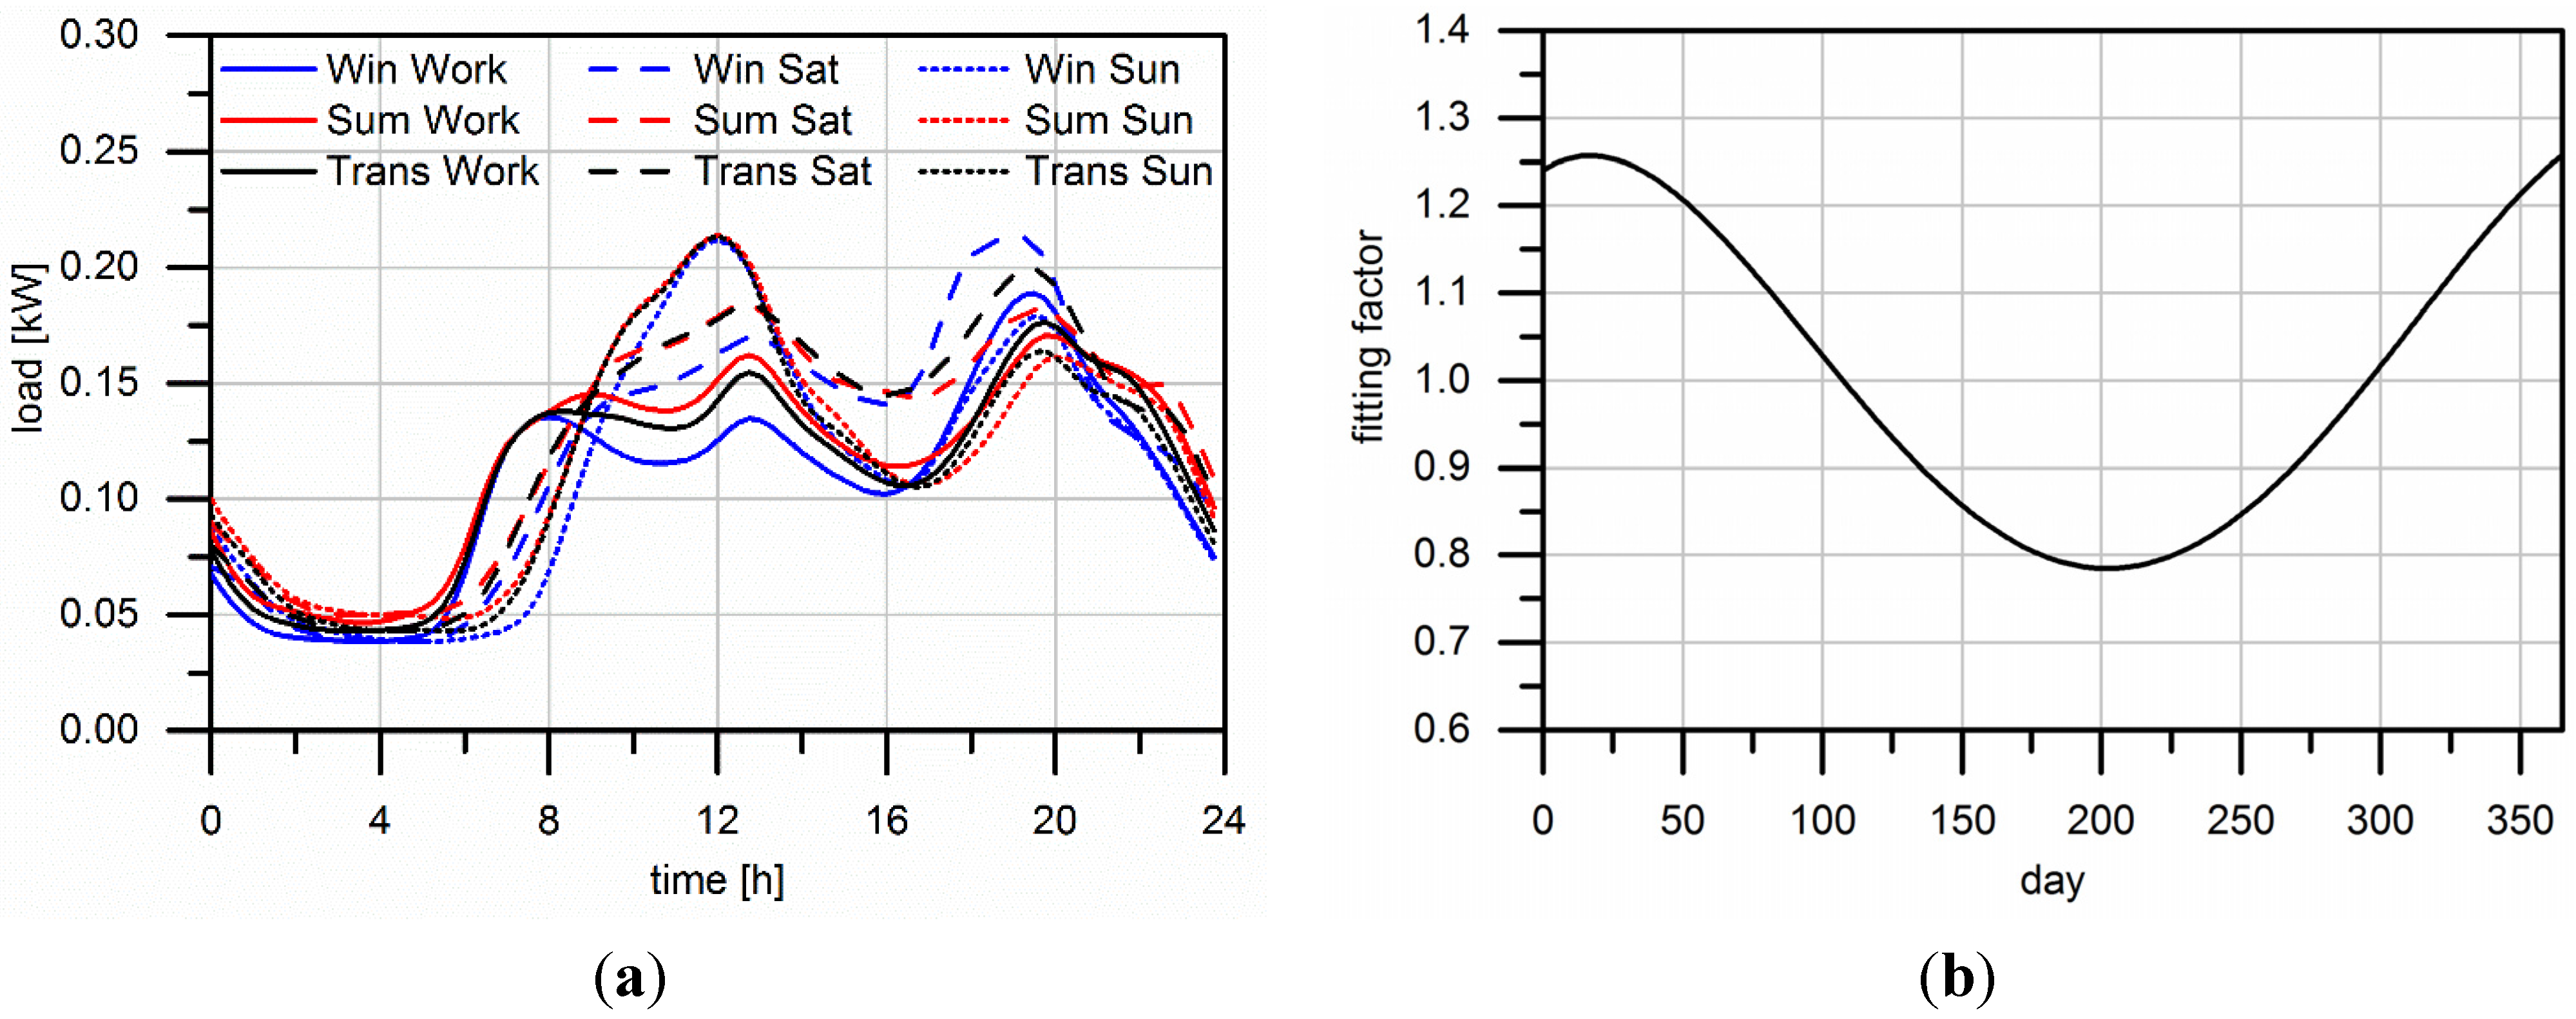
2.1. Input Data

| Solar potential | Unit | Value |
|---|---|---|
| Average sum of global radiation on horizontal surface | kWh/(m2·a) | 1160 |
| Average sum of global radiation on inclined surface (45°, south) | kWh/(m2·a) | 1382 |
| PV production | ||
| Installed PV power | kWp | 8.64 |
| Average annual PV yield | kWh/(kWp·a) | 1052 |
| Consumption | ||
| Annual electricity demand | kWh/a | 4752 |

2.2. Direct Consumption


2.3. PV Storage System

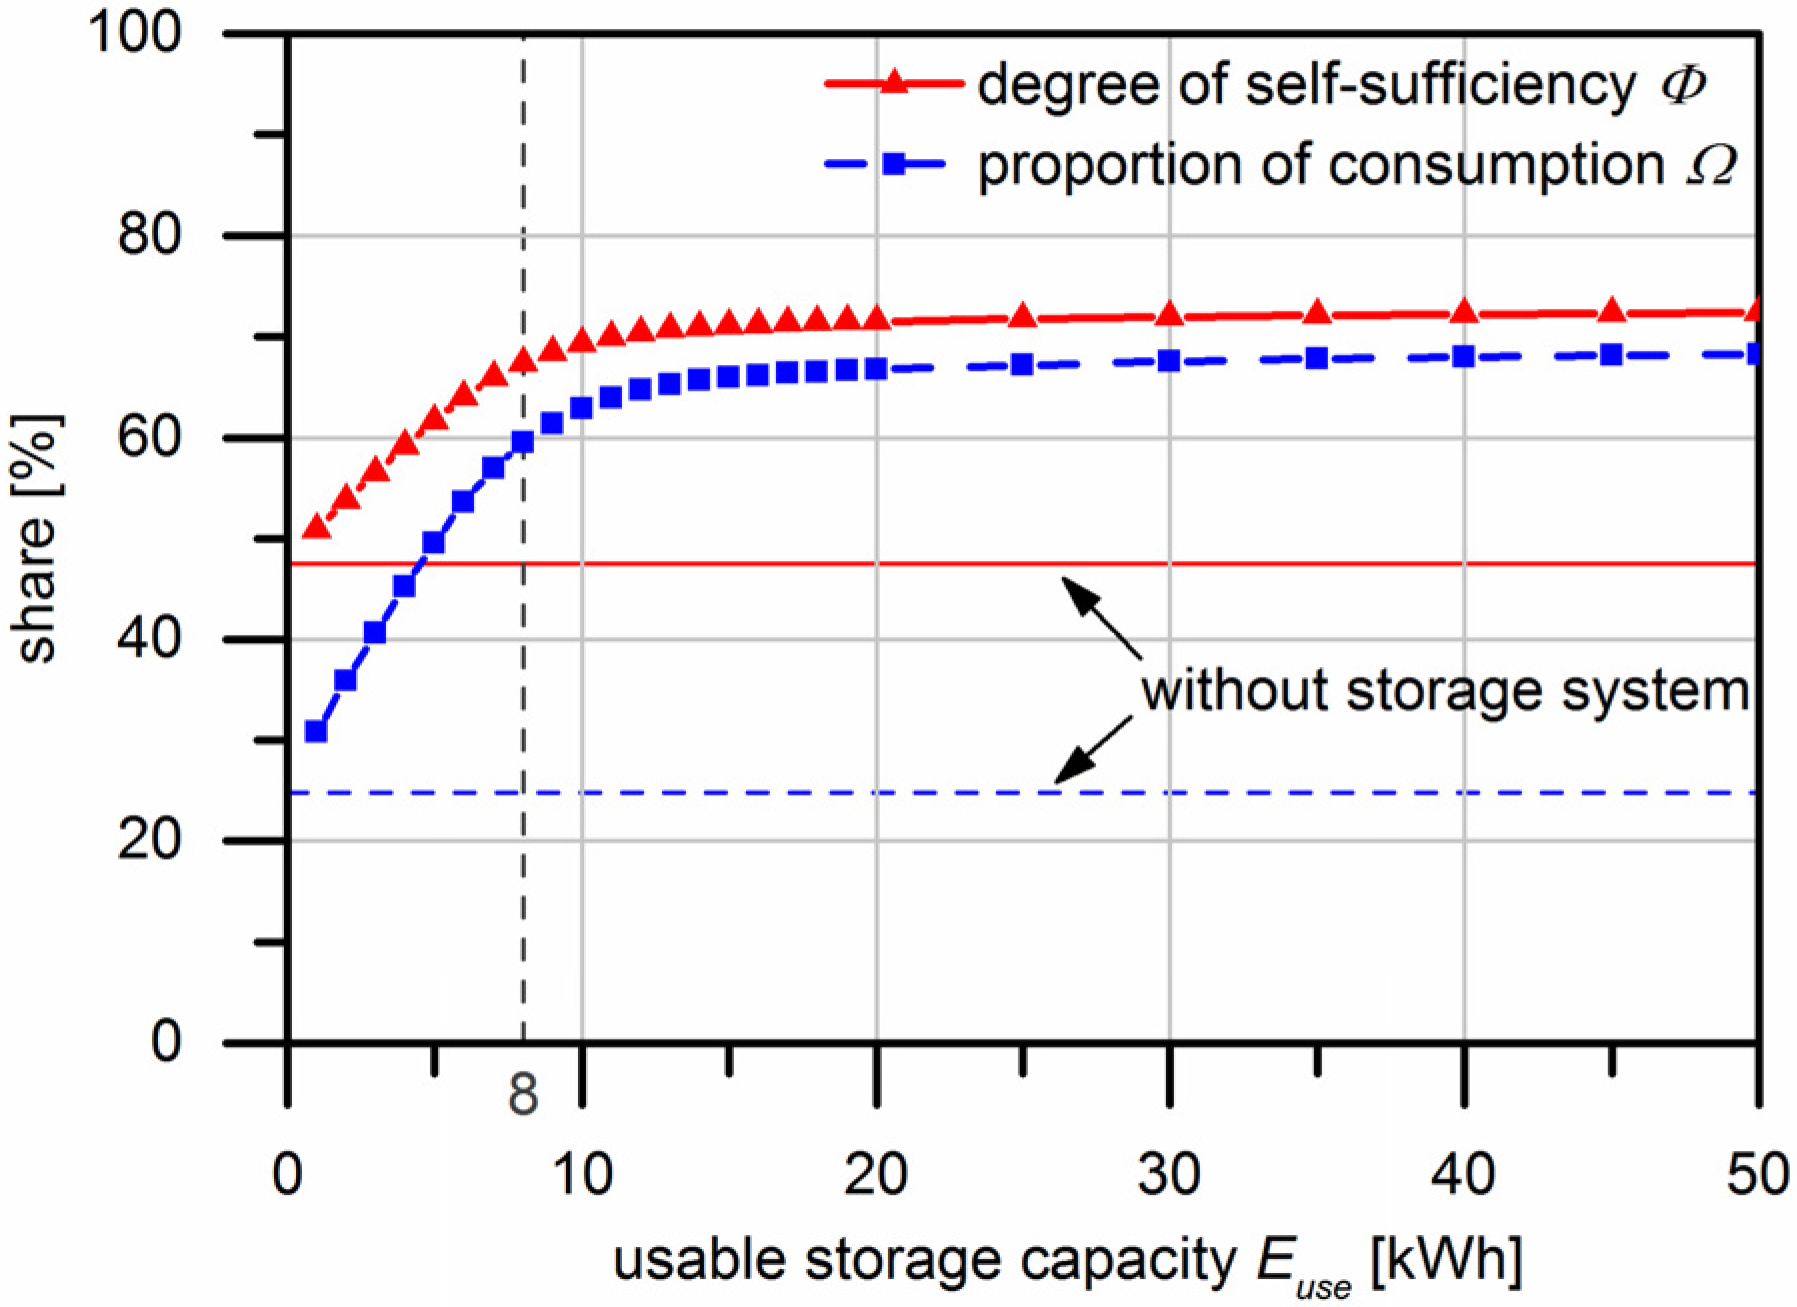
2.4. Assessment Criteria
3. Results and Discussion
3.1. Direct Consumption System

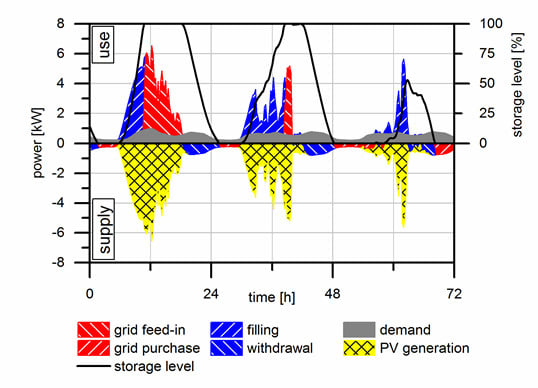
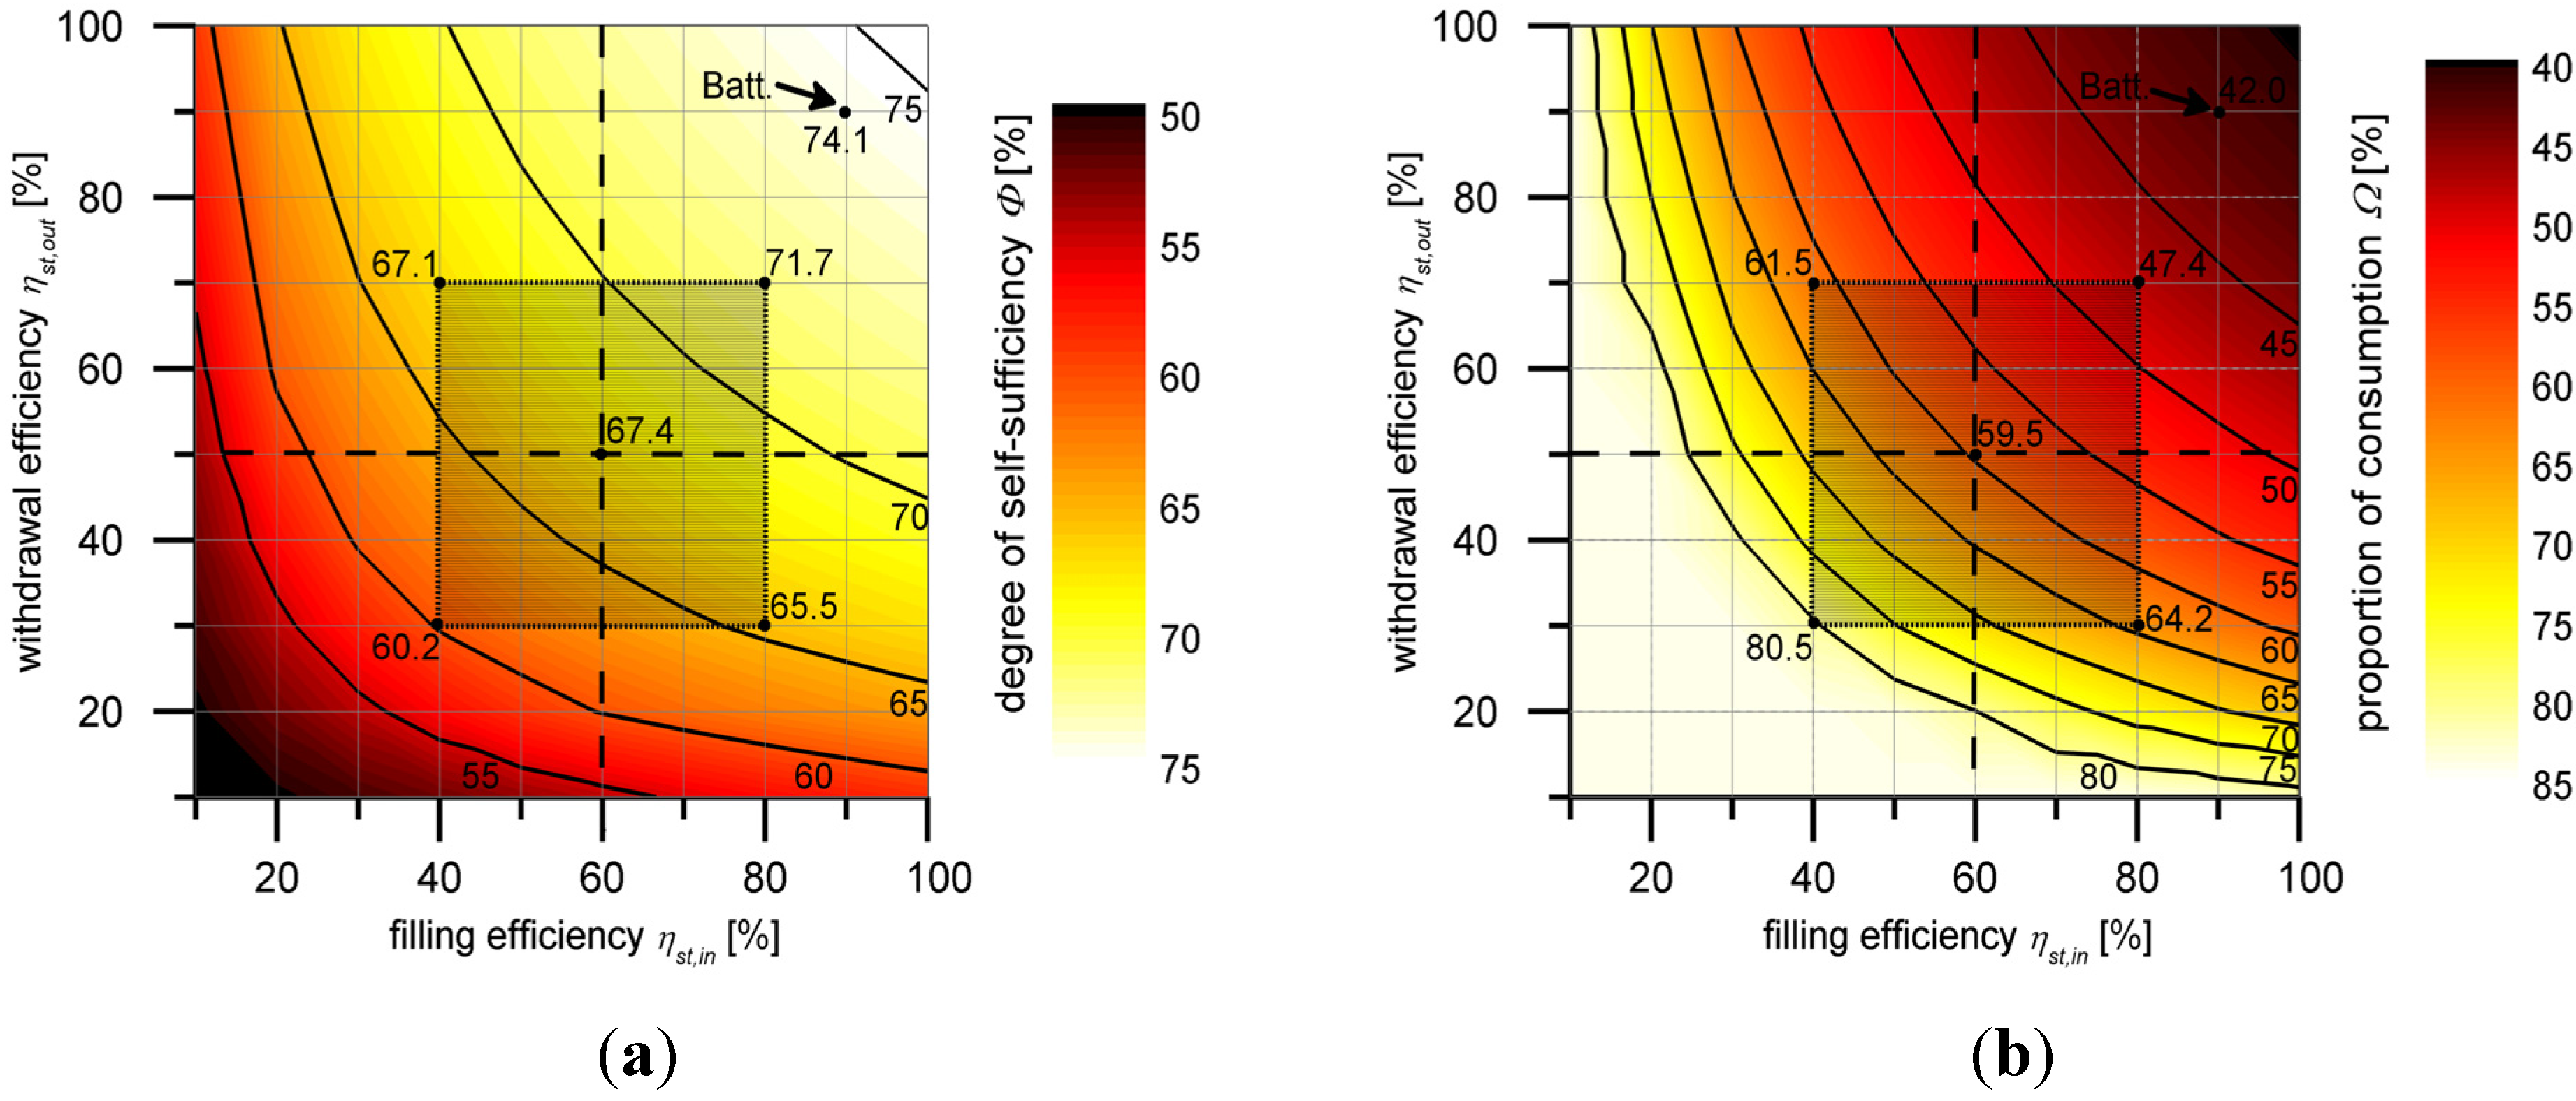
3.2. Short-Time Storage


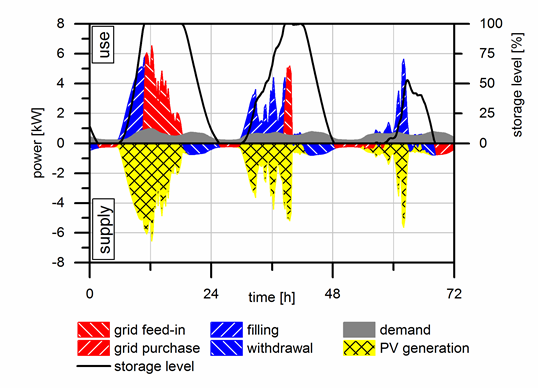
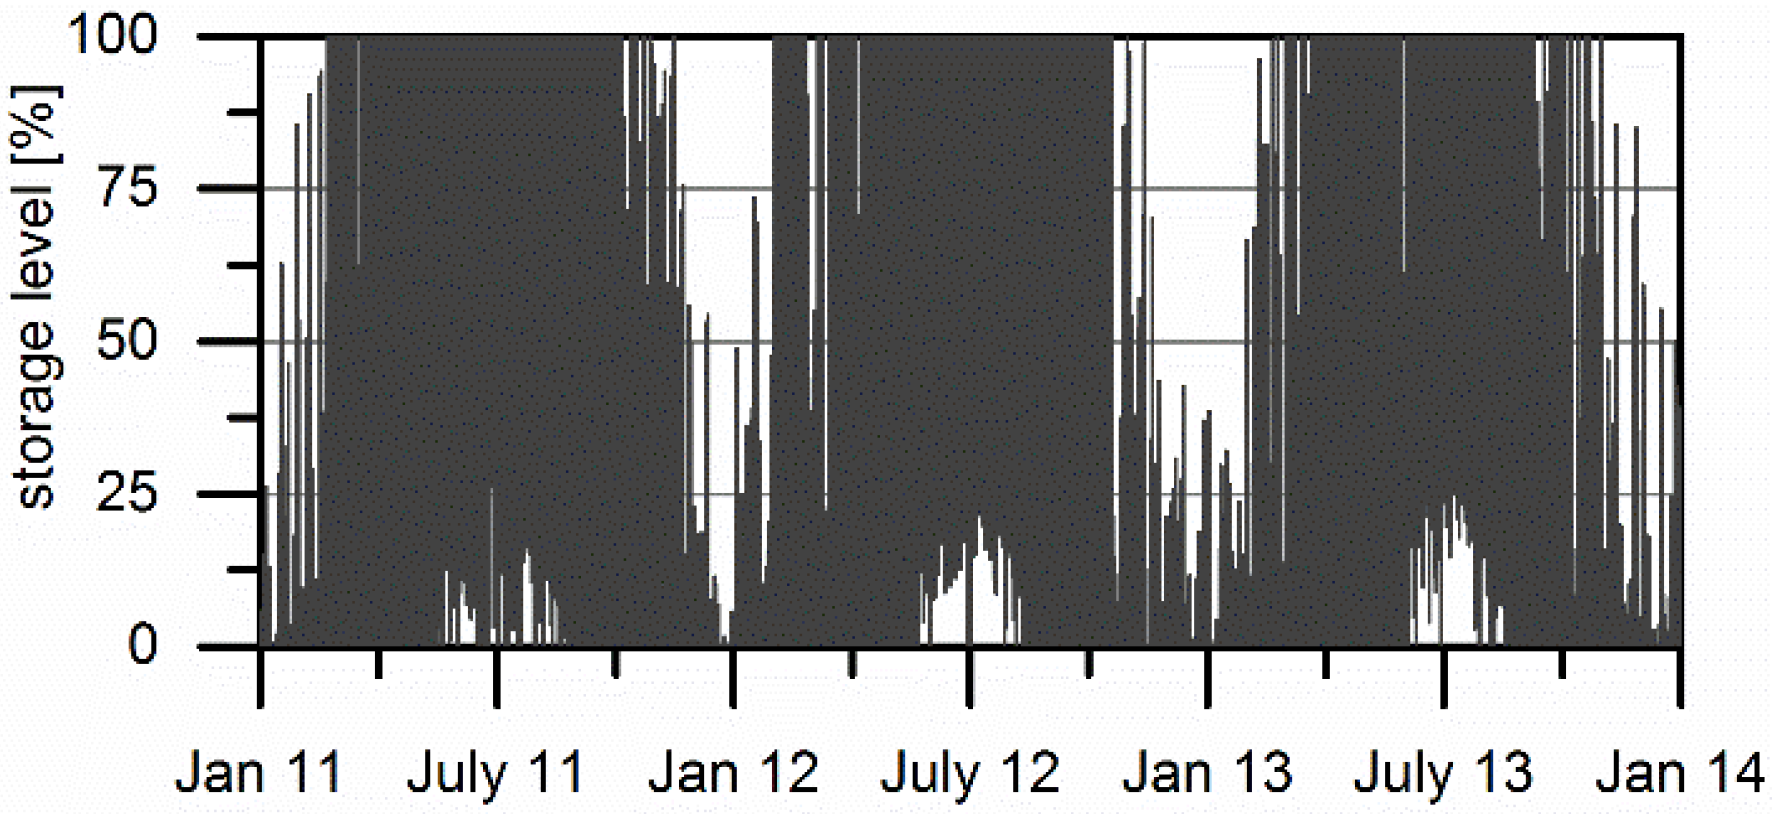
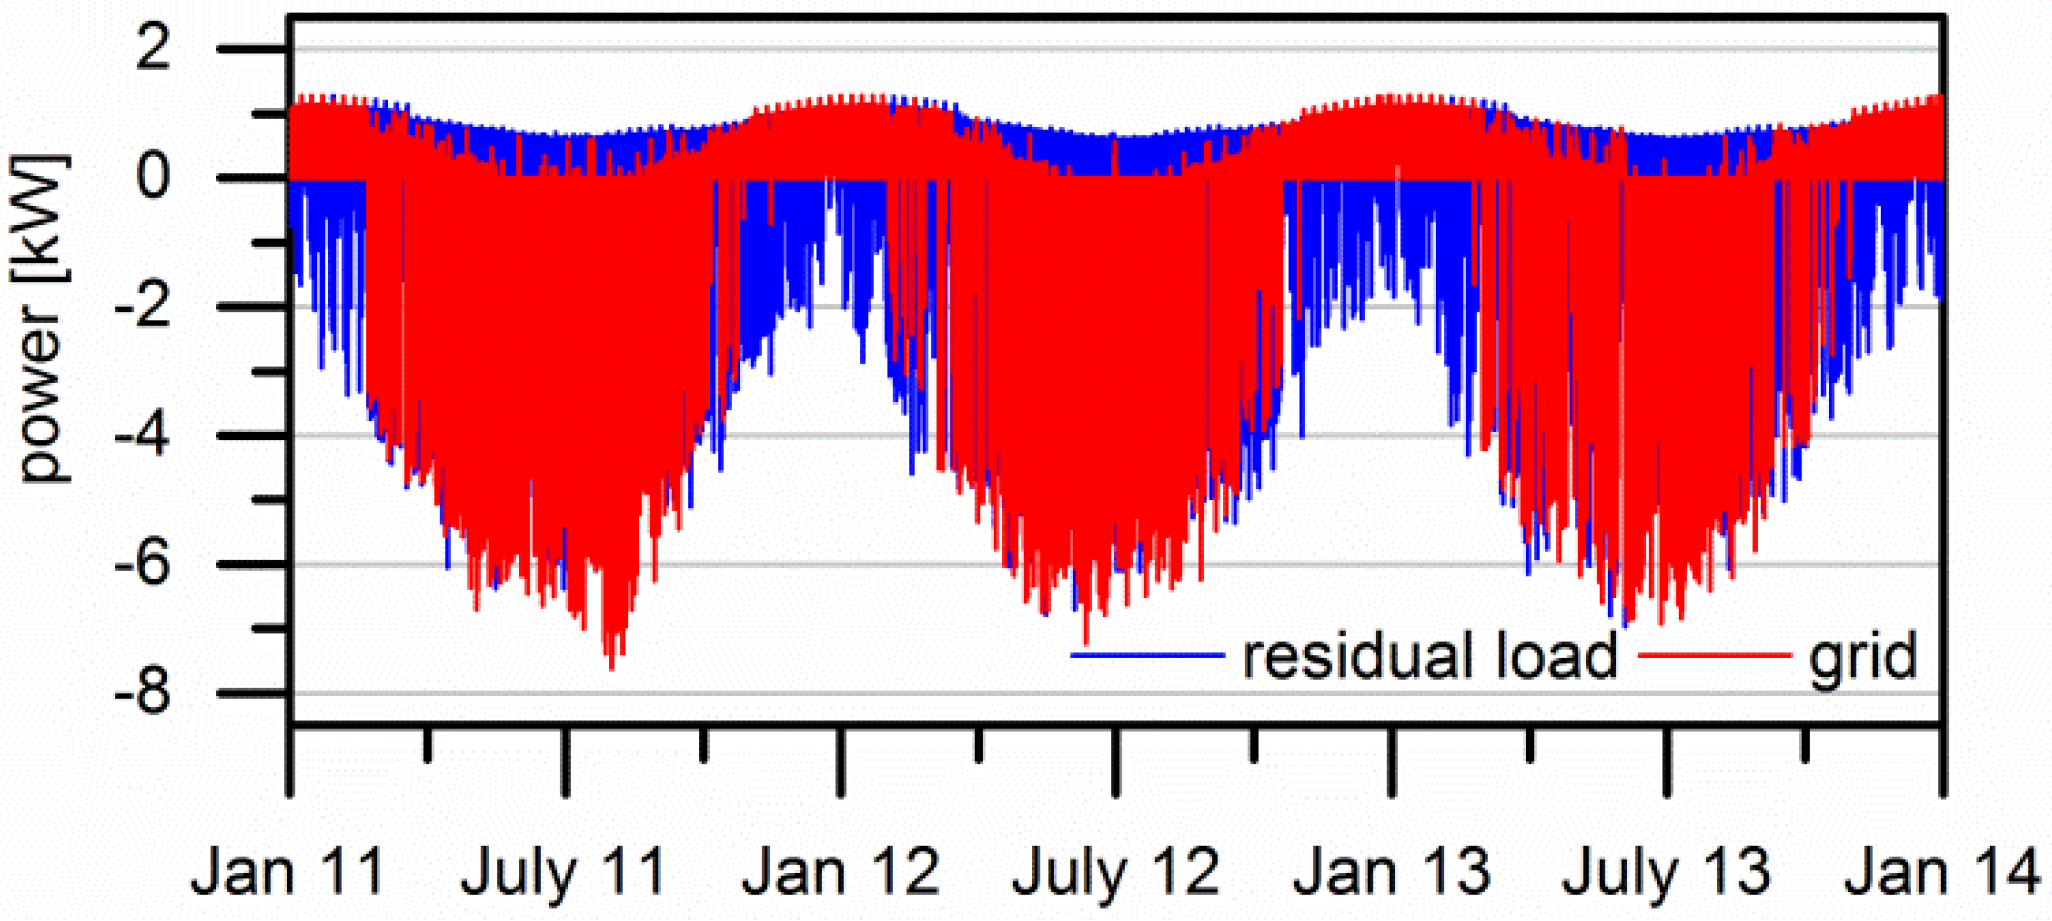
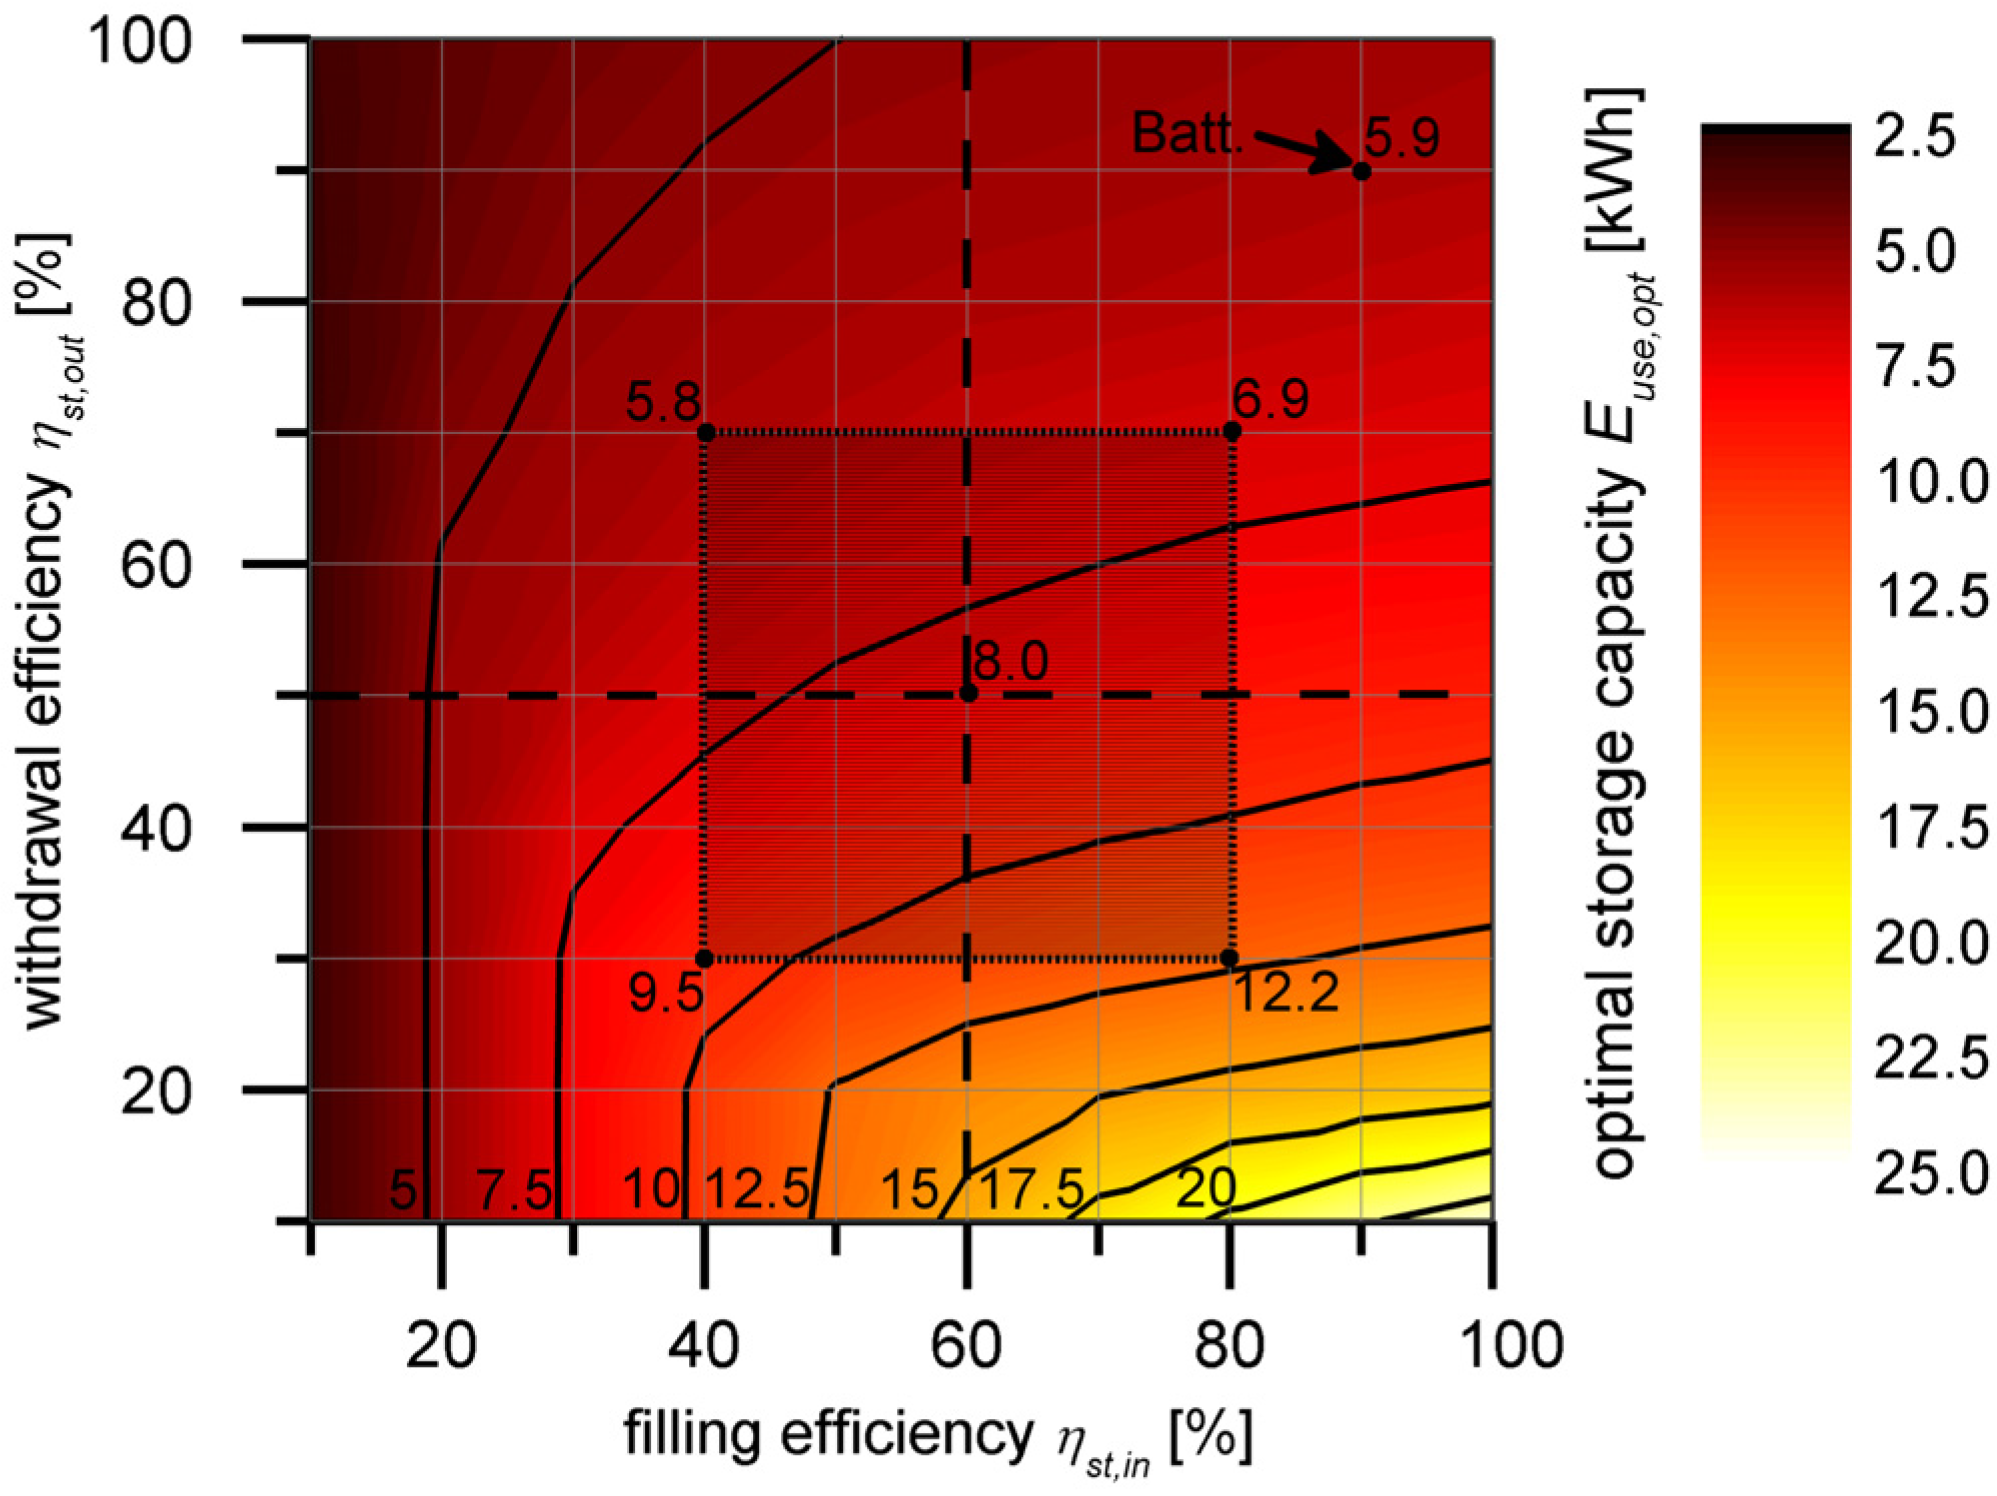
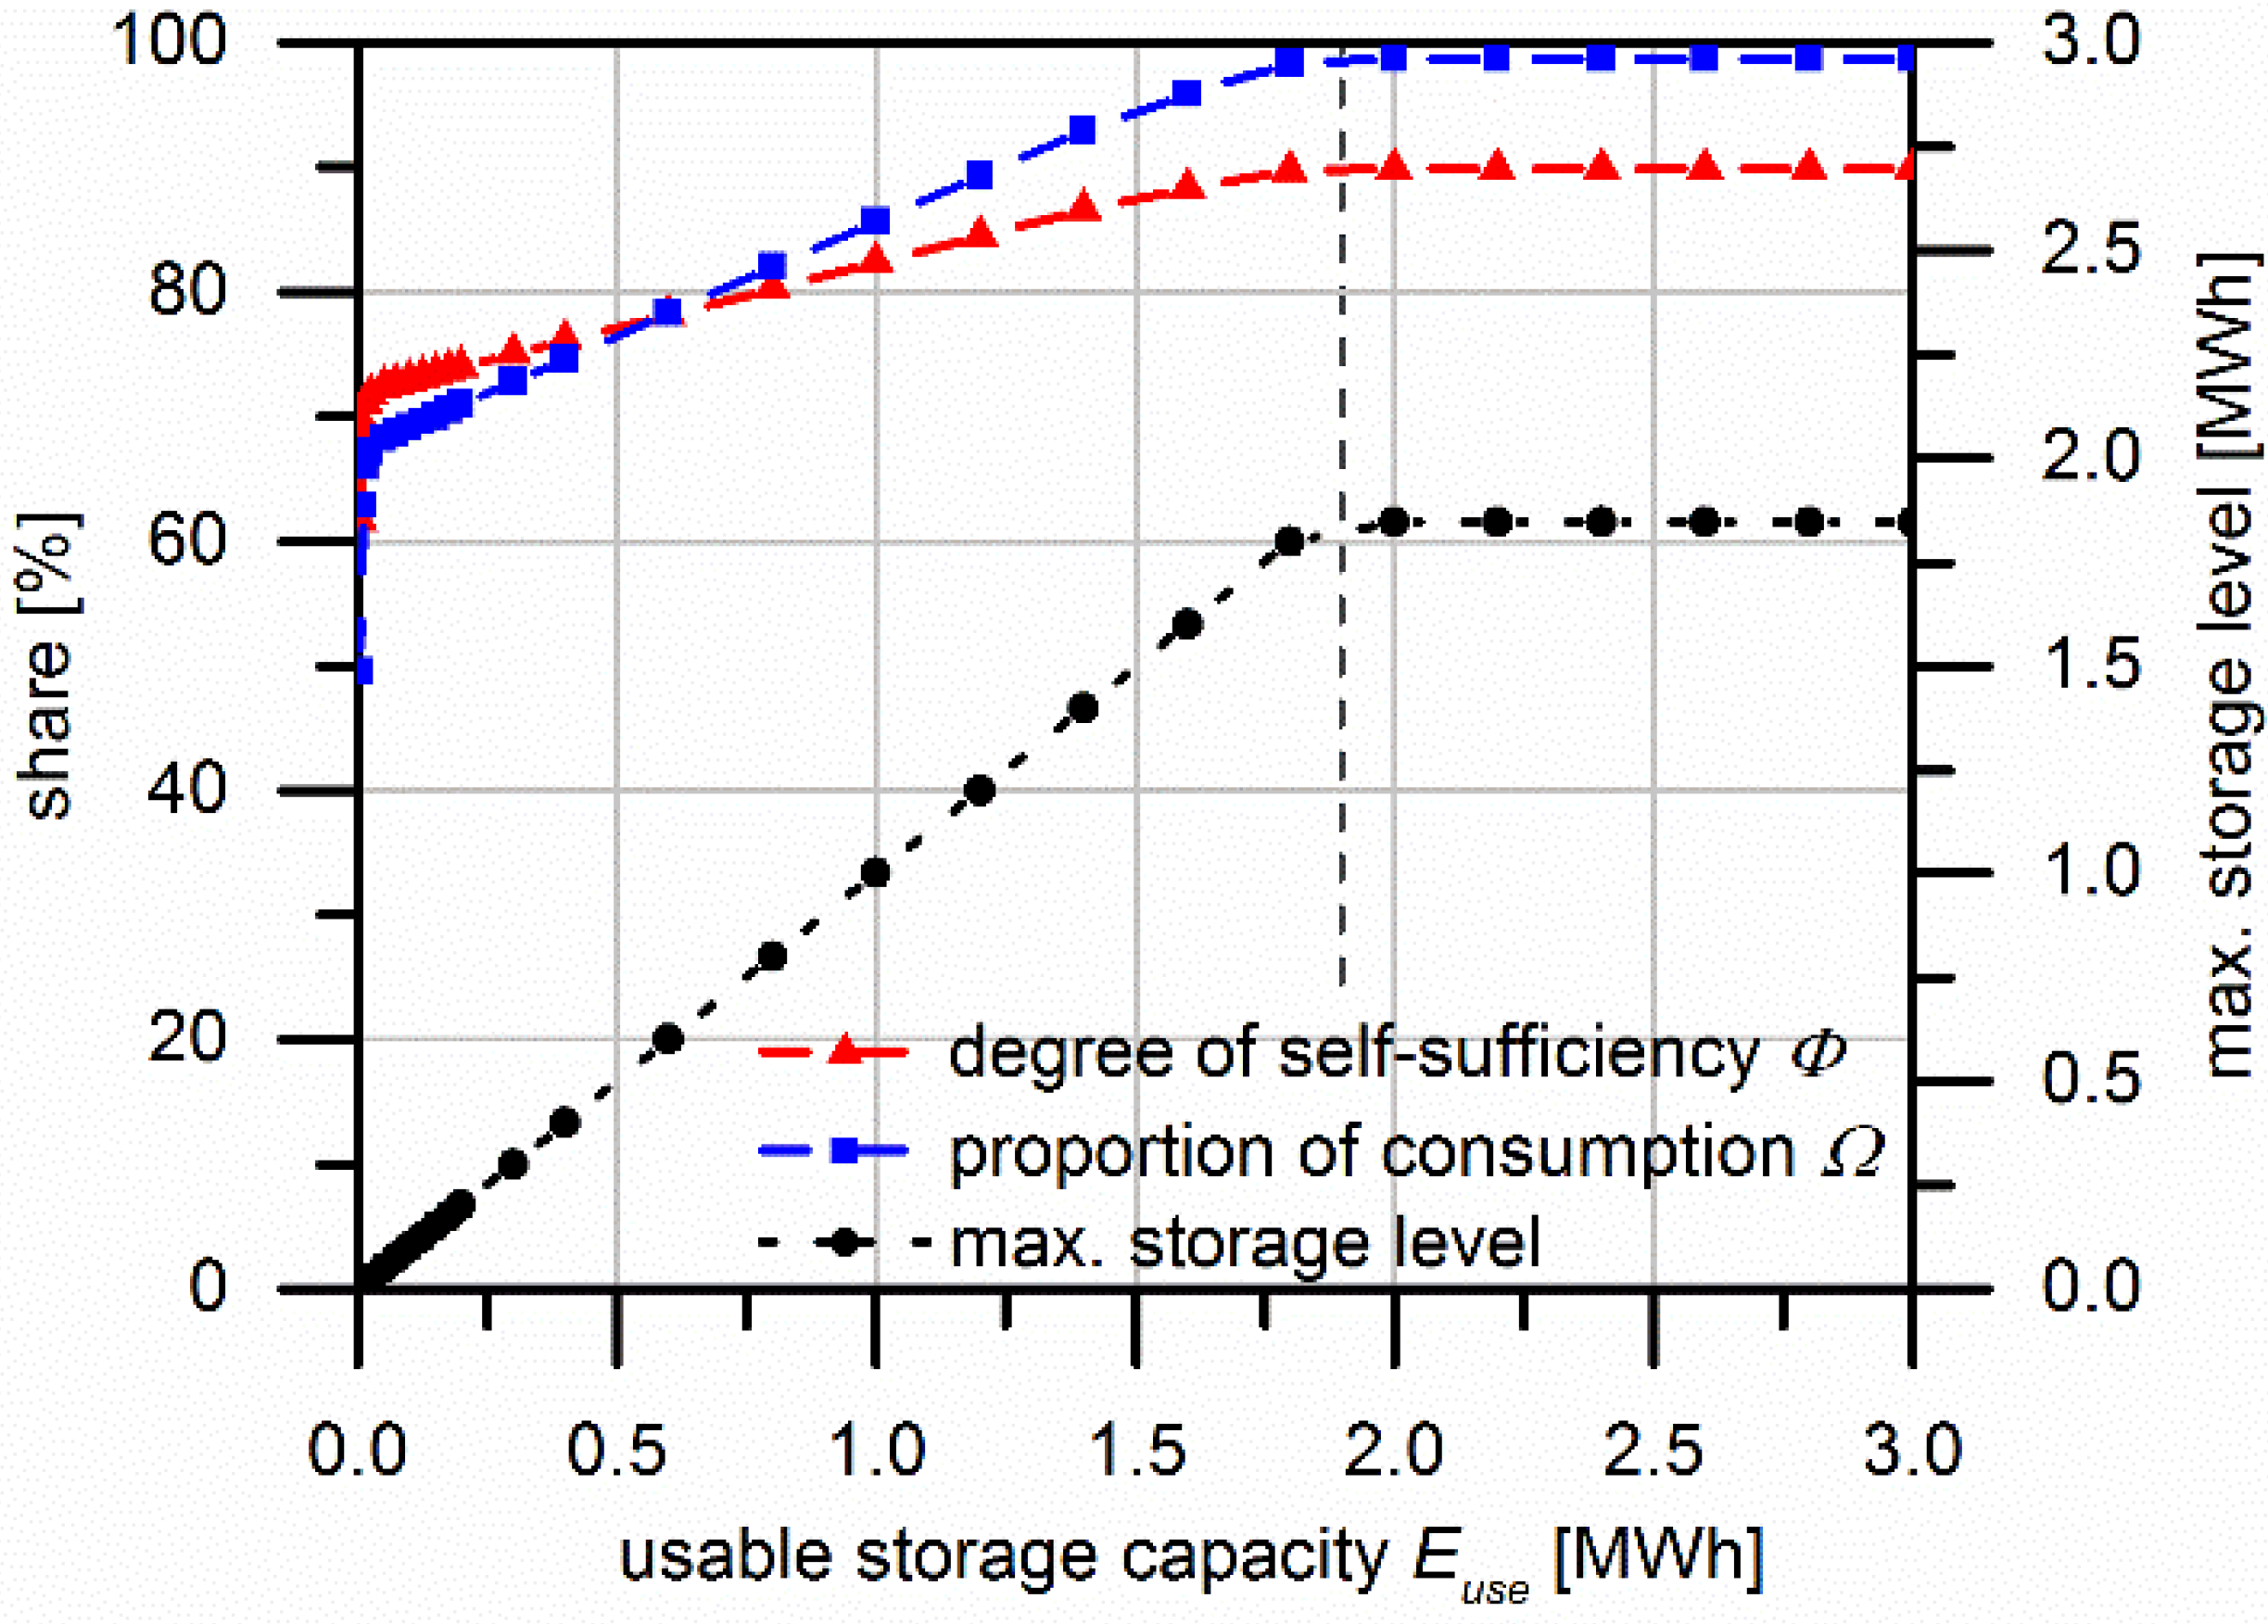
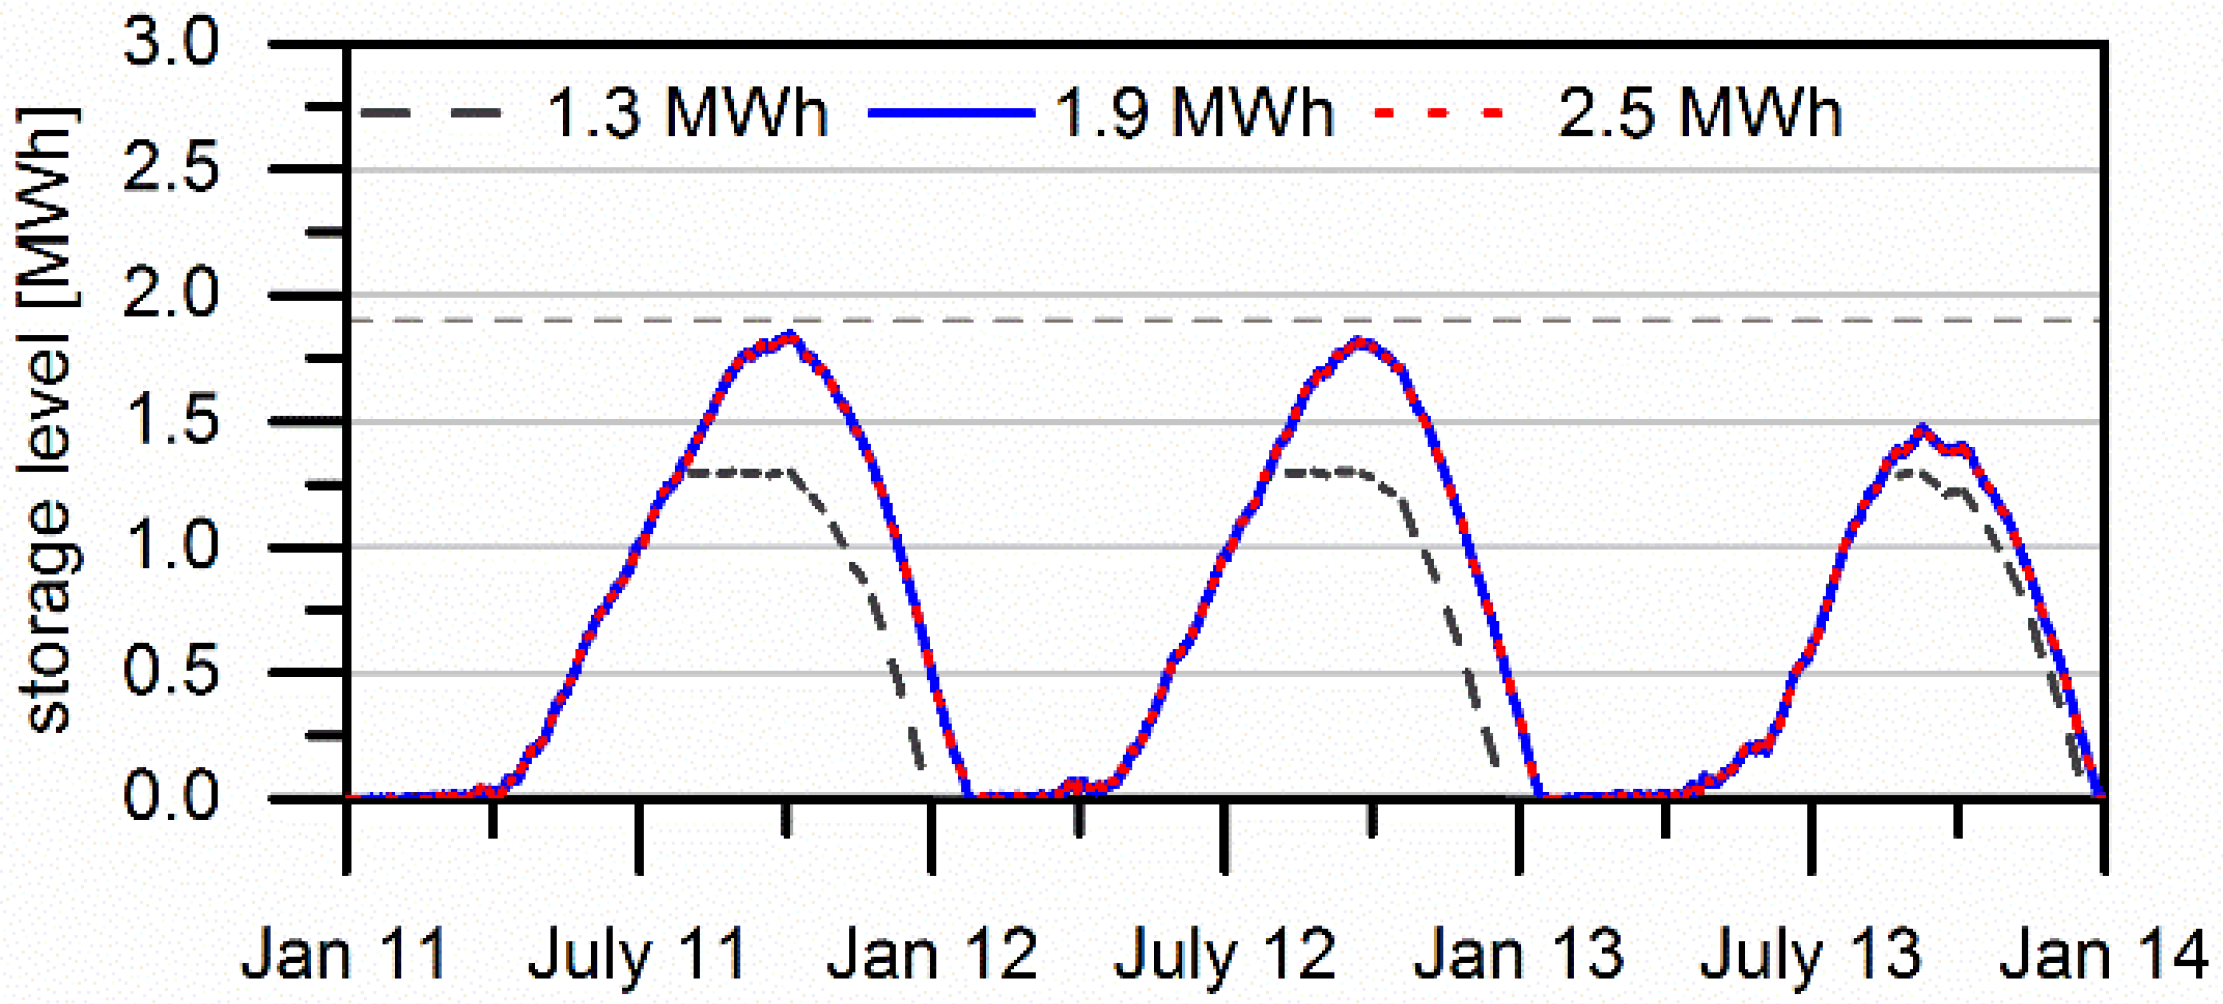
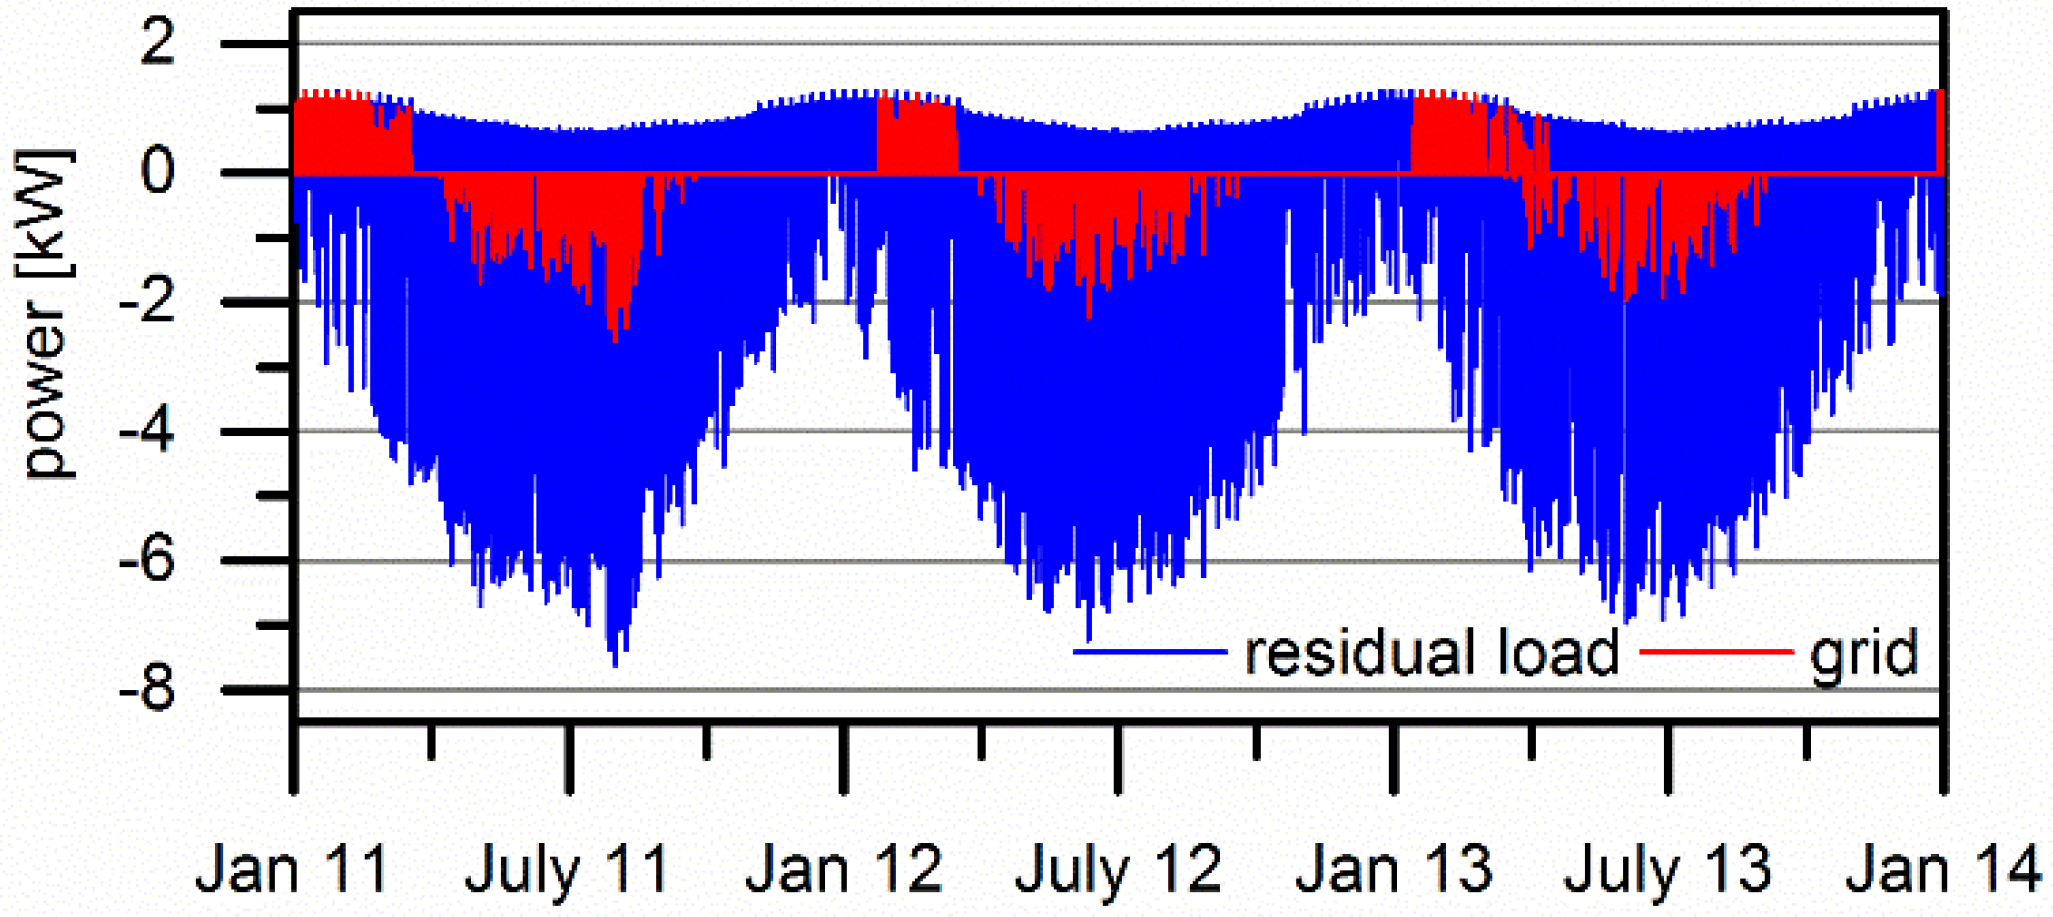
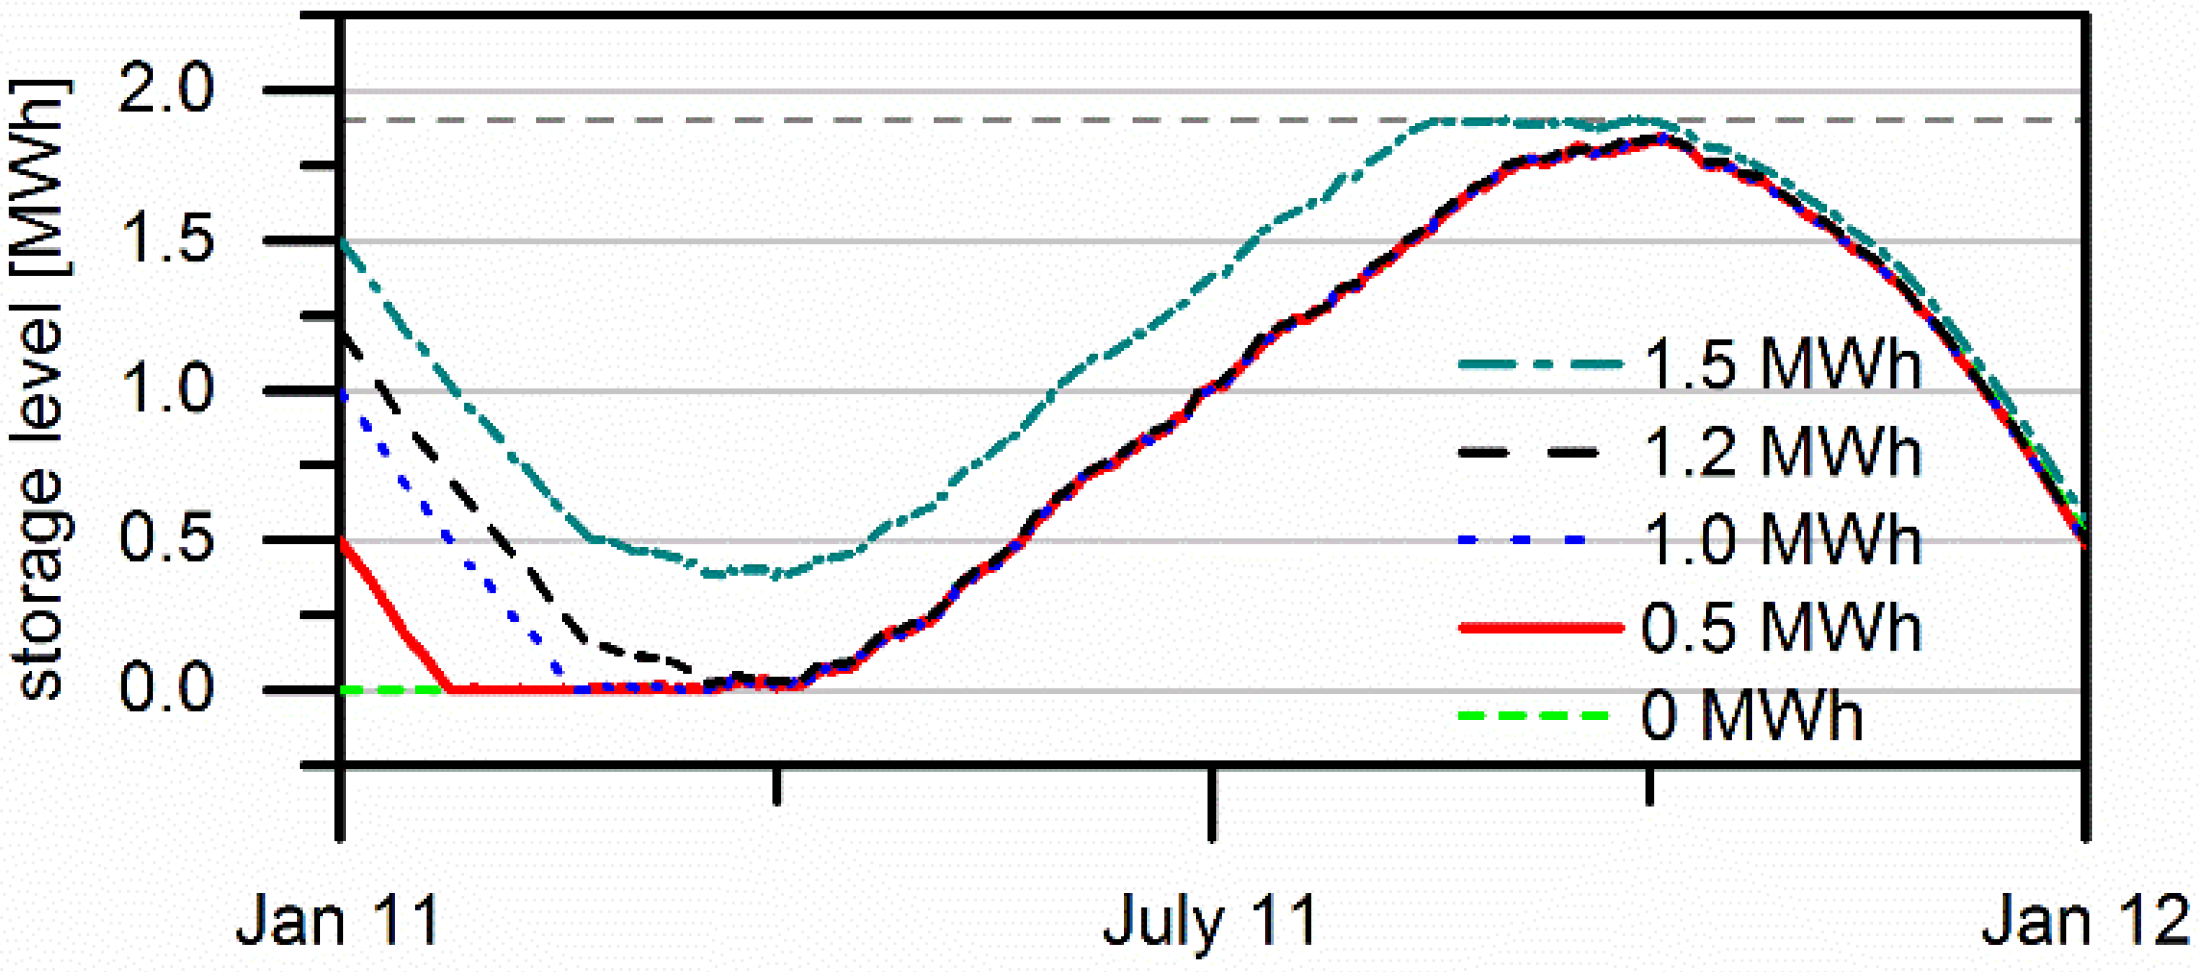
3.3. Seasonal Storage


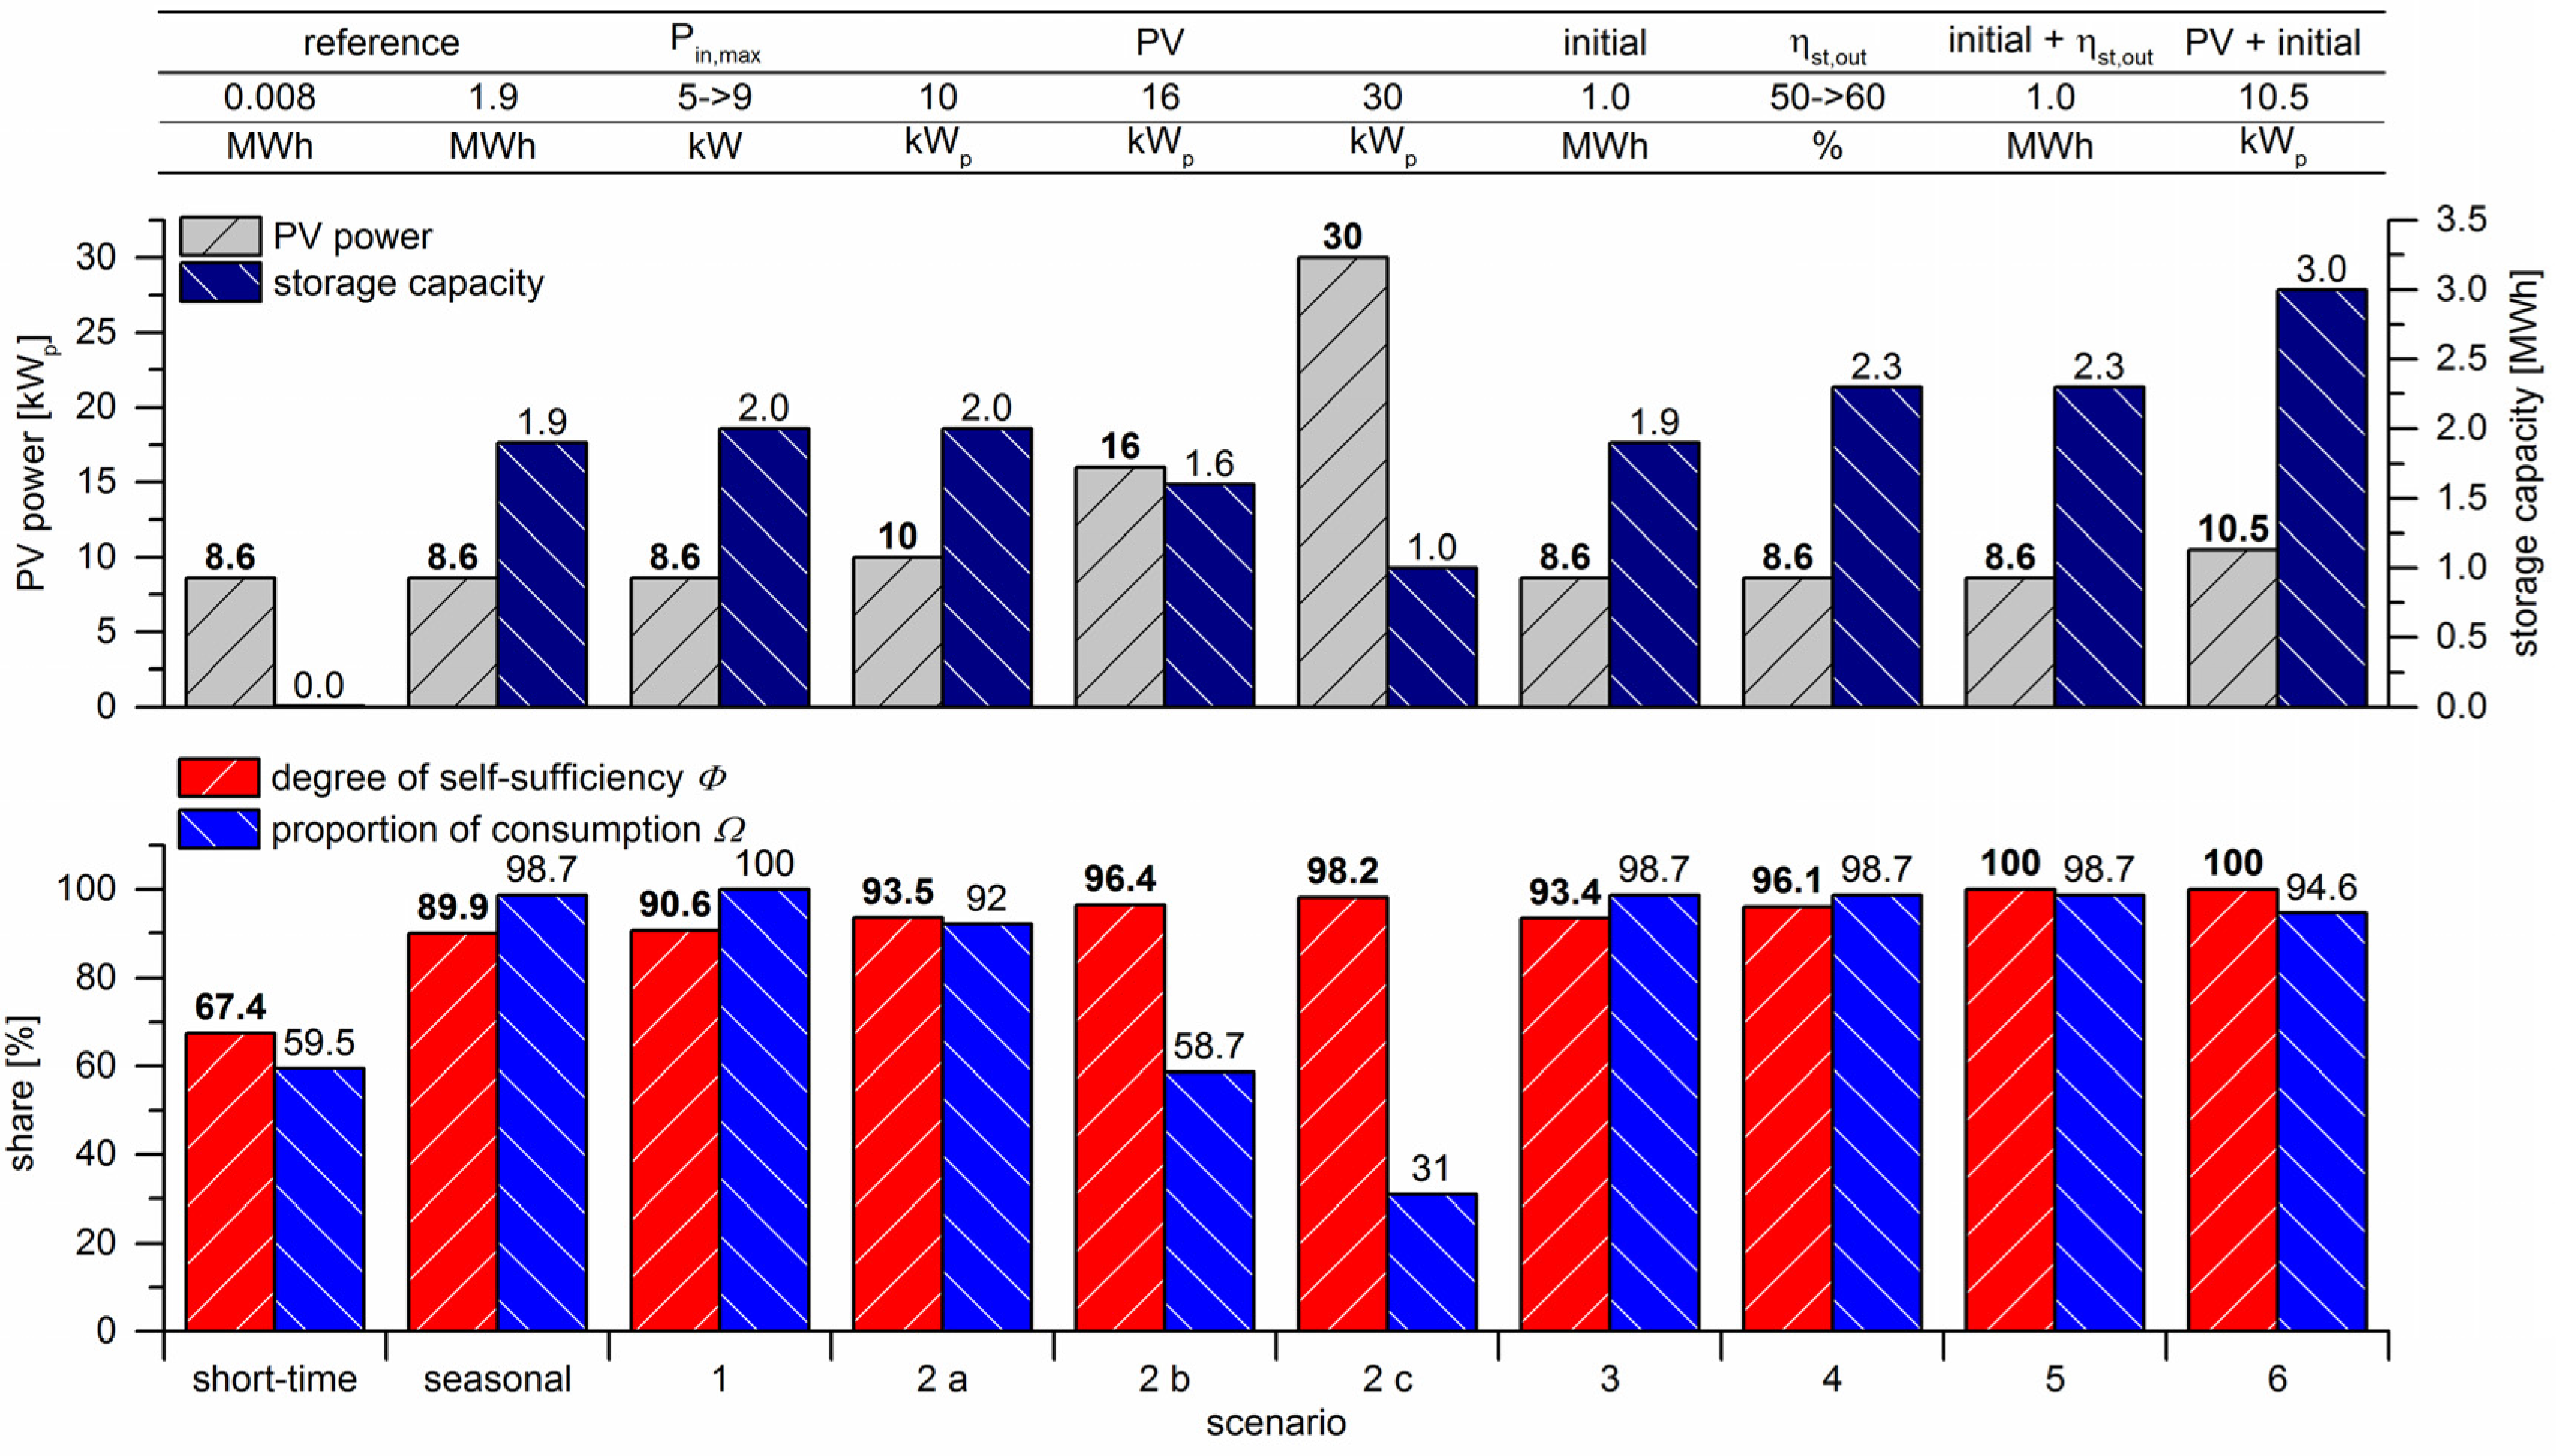
3.4. Scenarios to Achieve Self-Sufficiency


4. Conclusions and Outlook
Acknowledgments
Author Contributions
Conflicts of Interest
References
- The Integrated Energy and Climate Programme of the German Government. Available online: http://www.bmub.bund.de/fileadmin/bmu-import/files/english/pdf/application/pdf/hintergrund_meseberg_en.pdf (accessed on 13 July 2015).
- Gesetz für den Ausbau erneuerbarer Energien (Erneuerbare-Energien-Gesetz—EEG 2014). Available online: http://www.bmwi.de/BMWi/Redaktion/PDF/G/gesetz-fuer-den-ausbau-erneuerbarer-energien,property=pdf,bereich=bmwi2012,sprache=de,rwb=true.pdf (accessed on 13 July 2015).
- Bundesministerium für Wirtschaft und Energie. BMWi—Energiedaten Gesamtausgabe, Stand April 2015. Available online: http://www.bmwi.de/BMWi/Redaktion/PDF/E/energiestatistiken-grafiken,property=pdf,bereich=bmwi2012,sprache=de,rwb=true.pdf (accessed on 13 July 2015).
- Intergovernmental Panel on Climate Change (IPCC). Summary for Policymakers. In Climate Change 2013: The Physical Science Basis; IPCC: Geneva, Switzerland, 2013; Available online: http://www.climatechange2013.org/images/report/WG1AR5_SPM_FINAL.pdf (accessed on 13 July 2015).
- Photovoltaic Power Systems Programme (IEA-PVPS), International Energy Agency (IEA). National Survey Report of PV Power Applications in Germany 2013; IEA: St. Ursen, Switzerland, 2013. [Google Scholar]
- Quaschning, V. Photovoltaik-Eigenverbrauchssysteme im Wohngebäudesektor—Der unterschätzte Markt. Available online: http://pvspeicher.htw-berlin.de/wp-content/uploads/2014/04/BWK-2012-Der-untersch%C3%A4tzte-Markt.pdf (accessed on 13 July 2015).
- Luthander, R.; Widén, J.; Nilsson, D.; Palm, J. Photovoltaic self-consumption in buildings: A review. Appl. Energy 2015, 142, 80–94. [Google Scholar] [CrossRef]
- Widén, J. Improved photovoltaic self-consumption with appliance scheduling in 200 single-family buildings. Appl. Energy 2014, 126, 199–212. [Google Scholar] [CrossRef]
- Castillo-Cagigal, M.; Caamaño-Martín, E.; Matallanas, E.; Masa-Bote, D.; Gutiérrez, A.; Monasterio-Huelin, F.; Jiménez-Leube, J. PV self-consumption optimization with storage and active DSM for the residential sector. Sol. Energy 2011, 85, 2338–2348. [Google Scholar] [CrossRef] [Green Version]
- Barbato, A.; Capone, A. Optimization models and methods for demand-side management of residential users: A survey. Energies 2014, 7, 5787–5824. [Google Scholar] [CrossRef]
- Mokhtari, G.; Nourbakhsh, G.; Gosh, A. Optimal sizing of combined PV-energy storage for a grid-connected residential building. Adv. Energy Eng. 2013, 1, 53–65. [Google Scholar]
- Velik, R. East-south-west orientation of PV systems and neighbourhood energy exchange to maximize local photovoltaics energy consumption. Int. J. Renew. Energy Res. 2013, 4, 566–570. [Google Scholar]
- Zeh, A.; Witzmann, R. Operational strategies for battery storage systems in low-voltage distribution grids to limit the feed-in power of roof-mounted solar power systems. Energy Procedia 2014, 46, 114–123. [Google Scholar] [CrossRef]
- Johann, A.; Madlener, R. Profitability of energy storage for raising self-consumption of solar power: Analysis of different household types in Germany. Energy Procedia 2014, 61, 2206–2210. [Google Scholar] [CrossRef]
- Bianchi, M.; Branchini, L.; Ferrari, C.; Melino, F. Optimal sizing of grid-independent hybrid photovoltaic-battery power systems for household sector. Appl. Energy 2014, 136, 805–816. [Google Scholar] [CrossRef]
- Santos, J.M.; Moura, P.S.; de Almeida, A.T. Technical and economic impact of residential electricity storage at local and grid level for Portugal. Appl. Energy 2014, 128, 254–264. [Google Scholar] [CrossRef]
- Moshövel, J.; Kairies, K.-P.; Magnor, D.; Leuthold, M.; Bost, M.; Gährs, S.; Szczechowicz, E.; Cramer, M.; Sauer, D.U. Analysis of the maximal possible grid relief from PV-peak-power impacts by using storage systems for increased self-consumption. Appl. Energy 2015, 137, 567–575. [Google Scholar] [CrossRef]
- Bayod-Rújula, Á.A.; Haro-Larrodé, M.E.; Martínez-Gracia, A. Sizing criteria of hybrid photovoltaic-wind systems with battery storage and self-consumption considering interaction with the grid. Solar Energy 2013, 98, 582–591. [Google Scholar] [CrossRef]
- Bhandari, B.; Poudel, S.R.; Lee, K.-T.; Ahn, S.-H. Mathematical modeling of hybrid renewable energy system: A review on small hydro-solar-wind power generation. Int. J. Precis. Eng. Manuf. Green Technol. 2014, 1, 157–173. [Google Scholar] [CrossRef]
- Wang, X.; Palazoglu, A.; El-Farra, N.H. Operational optimization and demand response of hybrid renewable energy systems. Appl. Energy 2015, 143, 324–335. [Google Scholar] [CrossRef]
- Dufo-López, R.; Bernal-Agustín, J.L.; Yusta-Loyo, J.M.; Domínguez-Navarro, J.A.; Ramírez-Rosado, I.J.; Lujano, J.; Aso, I. Multi-objective optimization minimizing cost and life cycle emissions of stand-alone PV-wind-diesel systems with batteries storage. Appl. Energy 2011, 88, 4033–4041. [Google Scholar] [CrossRef]
- Schmiegel, A.U.; Kleine, A. Optimized operation strategies for PV storages systems yield limitations, optimized battery configuration and the benefit of a perfect forecast. Energy Procedia 2014, 46, 104–113. [Google Scholar] [CrossRef]
- Schneider, M.; Boras, P.; Schaede, H.; Quurck, L.; Rinderknecht, S. Effects of operational strategies on performance and costs of electric energy storage systems. Energy Procedia 2014, 46, 271–280. [Google Scholar] [CrossRef]
- Daud, M.Z.; Mohamed, A.; Hannan, M.A. An optimal state of charge feedback control strategy for battery energy storage in hourly dispatch of PV sources. Procedia Technol. 2013, 11, 24–31. [Google Scholar] [CrossRef]
- Masa-Bote, D.; Castillo-Cagigal, M.; Matallanas, E.; Caamaño-Martín, E.; Gutiérrez, A.; Monasterio-Huelín, F.; Jiménez-Leube, J. Improving photovoltaics grid integration through short time forecasting and self-consumption. Appl. Energy 2014, 125, 103–113. [Google Scholar] [CrossRef]
- Castañeda, M.; Cano, A.; Jurado, F.; Sánchez, H.; Fernández, L.M. Sizing optimization, dynamic modeling and energy management strategies of a stand-alone PV/hydrogen/battery-based hybrid system. Int. J. Hydrog. Energy 2013, 38, 3830–3845. [Google Scholar] [CrossRef]
- Cau, G.; Cocco, D.; Petrollese, M. Modeling and simulation of an isolated hybrid micro-grid with hydrogen production and storage. Energy Procedia 2014, 45, 12–21. [Google Scholar] [CrossRef]
- Dufo-López, R.; Bernal-Agustín, J.L.; Contreras, J. Optimization of control strategies for stand-alone renewable energy systems with hydrogen storage. Renew. Energy 2007, 32, 1102–1126. [Google Scholar] [CrossRef]
- Gencoglu, M.T.; Ural, Z. Design of a PEM fuel cell system for residential application. Int. J. Hydrog. Energy 2009, 34, 5242–5248. [Google Scholar] [CrossRef]
- Onar, O.; Uzunoglu, M.; Alam, M. Modeling, control and simulation of an autonomous wind turbine/photovoltaic/fuel cell/ultra-capacitor hybrid power system. J. Power Sources 2008, 185, 1273–1283. [Google Scholar] [CrossRef]
- Maclay, J.D.; Brouwer, J.; Samuelsen, G.S. Dynamic modeling of hybrid energy storage systems coupled to photovoltaic generation in residential applications. J. Power Sources 2007, 163, 916–925. [Google Scholar] [CrossRef]
- Lacko, R.; Drobnič, B.; Sekavčnik, M.; Mori, M. Hydrogen energy system with renewables for isolated households: The optimal system design, numerical analysis and experimental evaluation. Energy Build. 2014, 80, 106–113. [Google Scholar] [CrossRef]
- Boscaino, V.; Miceli, R.; Capponi, G.; Ricco Galluzzo, G. A review of fuel cell based hybrid power supply architectures and algorithms for household appliances. Int. J. Hydrog. Energy 2014, 39, 1195–1209. [Google Scholar] [CrossRef]
- Santarelli, M.; Macagno, S. A thermoeconomic analysis of a PV-hydrogen system feeding the energy requests of a residential building in an isolated valley of the Alps. Energy Convers. Manag. 2004, 45, 427–451. [Google Scholar] [CrossRef]
- Hwang, J.J.; Lai, L.K.; Wu, W.; Chang, W.R. Dynamic modeling of a photovoltaic hydrogen fuel cell hybrid system. Int. J. Hydrog. Energy 2009, 34, 9531–9542. [Google Scholar] [CrossRef]
- Bocci, E.; Zuccari, F.; Dell’Era, A. Renewable and hydrogen energy integrated house. Int. J. Hydrog. Energy 2011, 36, 7963–7968. [Google Scholar] [CrossRef]
- Karellas, S.; Tzouganatos, N. Comparison of the performance of compressed-air and hydrogen energy storage systems: Karpathos island case study. Renew. Sustain. Energy Rev. 2014, 29, 865–882. [Google Scholar] [CrossRef]
- Richards, B.S.; Conibeer, G.J. A comparison of hydrogen storage technologies for solar-powered stand-alone power supplies: A photovoltaic system sizing approach. Int. J. Hydrog. Energy 2007, 32, 2712–2718. [Google Scholar] [CrossRef]
- Gray, E.; Webb, C.J.; Andrews, J.; Shabani, B.; Tsai, P.J.; Chan, S. Hydrogen storage for off-grid power supply. Int. J. Hydrog. Energy 2011, 36, 654–663. [Google Scholar] [CrossRef]
- Cao, S.; Sirén, K. Impact of simulation time-resolution on the matching of PV production and household electric demand. Appl. Energy 2014, 128, 192–208. [Google Scholar] [CrossRef]
- MathWorks Inc. MATLAB R2013b; MathWorks Inc.: Natick, MA, USA, 2013. [Google Scholar]
- Bundesinstitut für Bau-, Stadt- und Raumforschung im Bundesamt für Bauwesen und Raumordnung. In Planung neuer Wohngebäude nach Energieeinsparverordnung 2009 und Erneuerbare-Energien-Wärmegesetz; Federal Ministry of Transport and Digital Infrastructure, Federal Ministry for the Environment, Nature Conservation, Building and Nuclear Safety: Berlin, Germany, 2010.
- Bavarian Hydrological Service (GkD). Available online: http://www.gkd.bayern.de/?sp=en (accessed on 13 July 2015).
- Loedl, M.; Witzmann, R.; Metzger, M. Operation strategies of energy storages with forecast methods in low-voltage grids with a high degree of decentralized generation. In Proceedings of the IEEE Electrical Power and Energy Conference, Winnipeg, MB, Canada, 3–5 October 2011; pp. 52–56.
- Valentin Software GmbH. PV*SOL Expert 6.0; Valentin Software GmbH: Berlin, Germany, 2014. [Google Scholar]
- Caputo, P.; Gaia, C.; Zanotto, V. A methodology for defining electricity demand in energy simulations referred to the Italian context. Energies 2013, 6, 6274–6292. [Google Scholar] [CrossRef]
- Verein Deutscher Ingenieure (VDI)/Association of German Engineers. VDI 4655—Referenzlastprofile von Ein- und Mehrfamilienhäusern für den Einsatz von KWK-Anlagen (Reference Load Profiles of Single-Family and Multi-Family Houses for the Use of CHP Systems); VDI: Berlin, Germany, 2008. [Google Scholar]
- Bundesverband der Energie und Wasserwirtschaft (BDEW). Standardlastprofile Strom. Available online: https://www.bdew.de/internet.nsf/id/DE_Standartlastprofile (accessed on 13 July 2015).
- Meier, H.; Fünfgeld, C. Repräsentative Lastprofile der VDEW; VDEW Materialien M-32/99; Brandenburgische Technische Universität Cottbus, Lehrstuhl Energiewirtschaft: Frankfurt am Main, Germany, 1999. [Google Scholar]
- WEMAG Netz GmbH. Available online: http://www.wemag-netz.de/export/sites/wemagnetz/zugang/lastprofilkunden/SLP-Beschreibung_140401.pdf (accessed on 13 July 2015).
- Tjaden, T.; Weniger, J.; Bergner, J.; Schnorr, F.; Quaschning, V. Einfluss des Standorts und Nutzerverhaltens auf die energetische Bewertung von PV-Speichersystemen. In Proceeding of the Symposium Photovoltaische Solarenergie, Bad Staffelstein, Germany, 12–14 March 2014.
- Bundesverband der Energie- und Wasserwirtschaft e.V. BDEW—Energie-Info—Stromverbrauch im Haushalt; BDEW: Berlin, Germany, 2014. [Google Scholar]
- Töpler, J.; Lehmann, J. Wasserstoff und Brennstoffzelle: Technologien und Marktperspektiven; Springer Vieweg: Berlin, Germany, 2014. [Google Scholar]
- Yilanci, A.; Dincer, I.; Ozturk, H. Performance analysis of a PEM fuel cell unit in a solar-hydrogen system. Int. J. Hydrog. Energy 2008, 33, 7538–7552. [Google Scholar] [CrossRef]
- Weniger, J.; Tjaden, T.; Quaschning, V. Sizing of residential PV battery systems. Energy Procedia 2014, 46, 78–87. [Google Scholar] [CrossRef]
- Linares, J.I.; Herranz, L.E.; Moratilla, B.Y. Maximum efficiency of direct energy conversion systems. Application to fuel cells. Int. J. Hydrog. Energy 2011, 36, 10027–10032. [Google Scholar] [CrossRef]
- Martel, F.; Kelouwani, S.; Dubé, Y.; Agbossou, K. Optimal economy-based battery degradation management dynamics for fuel-cell plug-in hybrid electric vehicles. J. Power Sources 2015, 274, 367–381. [Google Scholar] [CrossRef]
- Tjaden, T.; Krien, U.; Breyer, C. Simulation und techno-ökonomischer Vergleich von solarthermischen Heizungskonzepten und Photovoltaik-Wärmepumpen-Kombinationen im Wohnungssektor. In Proceeding of the Symposium Thermische Solarenergie, Bad Staffelstein, Germany; 2013. [Google Scholar]
- Teichmann, D.; Arlt, W.; Wasserscheid, P. Liquid organic hydrogen carriers as an efficient vector for the transport and storage of renewable energy. Int. J. Hydrog. Energy 2012, 37, 18118–18132. [Google Scholar] [CrossRef]
- Bavarian Hydrogen Center. Available online: http://www.bh2c.de/imprint/?lang=en (accessed on 15 July 2015).
© 2015 by the authors; licensee MDPI, Basel, Switzerland. This article is an open access article distributed under the terms and conditions of the Creative Commons Attribution license (http://creativecommons.org/licenses/by/4.0/).
Share and Cite
Pötzinger, C.; Preißinger, M.; Brüggemann, D. Influence of Hydrogen-Based Storage Systems on Self-Consumption and Self-Sufficiency of Residential Photovoltaic Systems. Energies 2015, 8, 8887-8907. https://doi.org/10.3390/en8088887
Pötzinger C, Preißinger M, Brüggemann D. Influence of Hydrogen-Based Storage Systems on Self-Consumption and Self-Sufficiency of Residential Photovoltaic Systems. Energies. 2015; 8(8):8887-8907. https://doi.org/10.3390/en8088887
Chicago/Turabian StylePötzinger, Christian, Markus Preißinger, and Dieter Brüggemann. 2015. "Influence of Hydrogen-Based Storage Systems on Self-Consumption and Self-Sufficiency of Residential Photovoltaic Systems" Energies 8, no. 8: 8887-8907. https://doi.org/10.3390/en8088887