Article

Communication Network Architectures for Smart-House with Renewable Energy Resources

1
Wind Energy Grid-Adaptive Technology Research Center, Chonbuk National University, Jeonju 561-756, Korea
2
Department of Electrical Engineering, Wind Energy Grid-Adaptive Technology Research Center, and Smart Grid Research Center, Chonbuk National University, Jeonju 561-756, Korea
3
Department of Computer Engineering, Wind Energy Grid-Adaptive Technology Research Center, and Smart Grid Research Center, Chonbuk National University, Jeonju 561-756, Korea
*
Authors to whom correspondence should be addressed.
Energies 2015, 8(8), 8716-8735; https://doi.org/10.3390/en8088716
Submission received: 16 June 2015 / Revised: 20 July 2015 / Accepted: 10 August 2015 / Published: 17 August 2015

Abstract

:
With the microgrid revolution, each house will have the ability to meet its own energy needs locally from renewable energy sources such as solar or wind. However, real-time data gathering, energy management and control of renewable energy systems will depend mainly on the performance of the communications infrastructure. This paper describes the design of a communication network architecture using both wired and wireless technologies for monitoring and controlling distributed energy systems involving small-scale wind turbines and photovoltaic systems. The proposed communication architecture consists of three layers: device layer, network layer, and application layer. Two scenarios are considered: a smart-house and a smart-building. Various types of sensor nodes and measurement devices are defined to monitor the condition of the renewable energy systems based on the international electrotechnical commission standard. The OPNET Modeler is used for performance evaluation in terms of end-to-end (ETE) delay. The network performance is compared in view of ETE delay, reliability and implementation cost for three different technologies: Ethernet-based, WiFi-based, and ZigBee-based.

1. Introduction

Recently, the integration of renewable energy systems into the electric power grid has received great attention in both academia and industry. It is expected that the eventual integration level of renewable energy systems will be vast, and their control will become more challenging [1]. As wind and solar power are the best-known and famous examples, the focus will be on these renewable energy systems. There are two types of renewable energy system: large-scale wind and solar farms located in remote areas, and small-scale wind turbines (WTs) and photovoltaic (PV) panels connected to the electric distribution system. The focus of this study will be small-scale renewable energy systems.
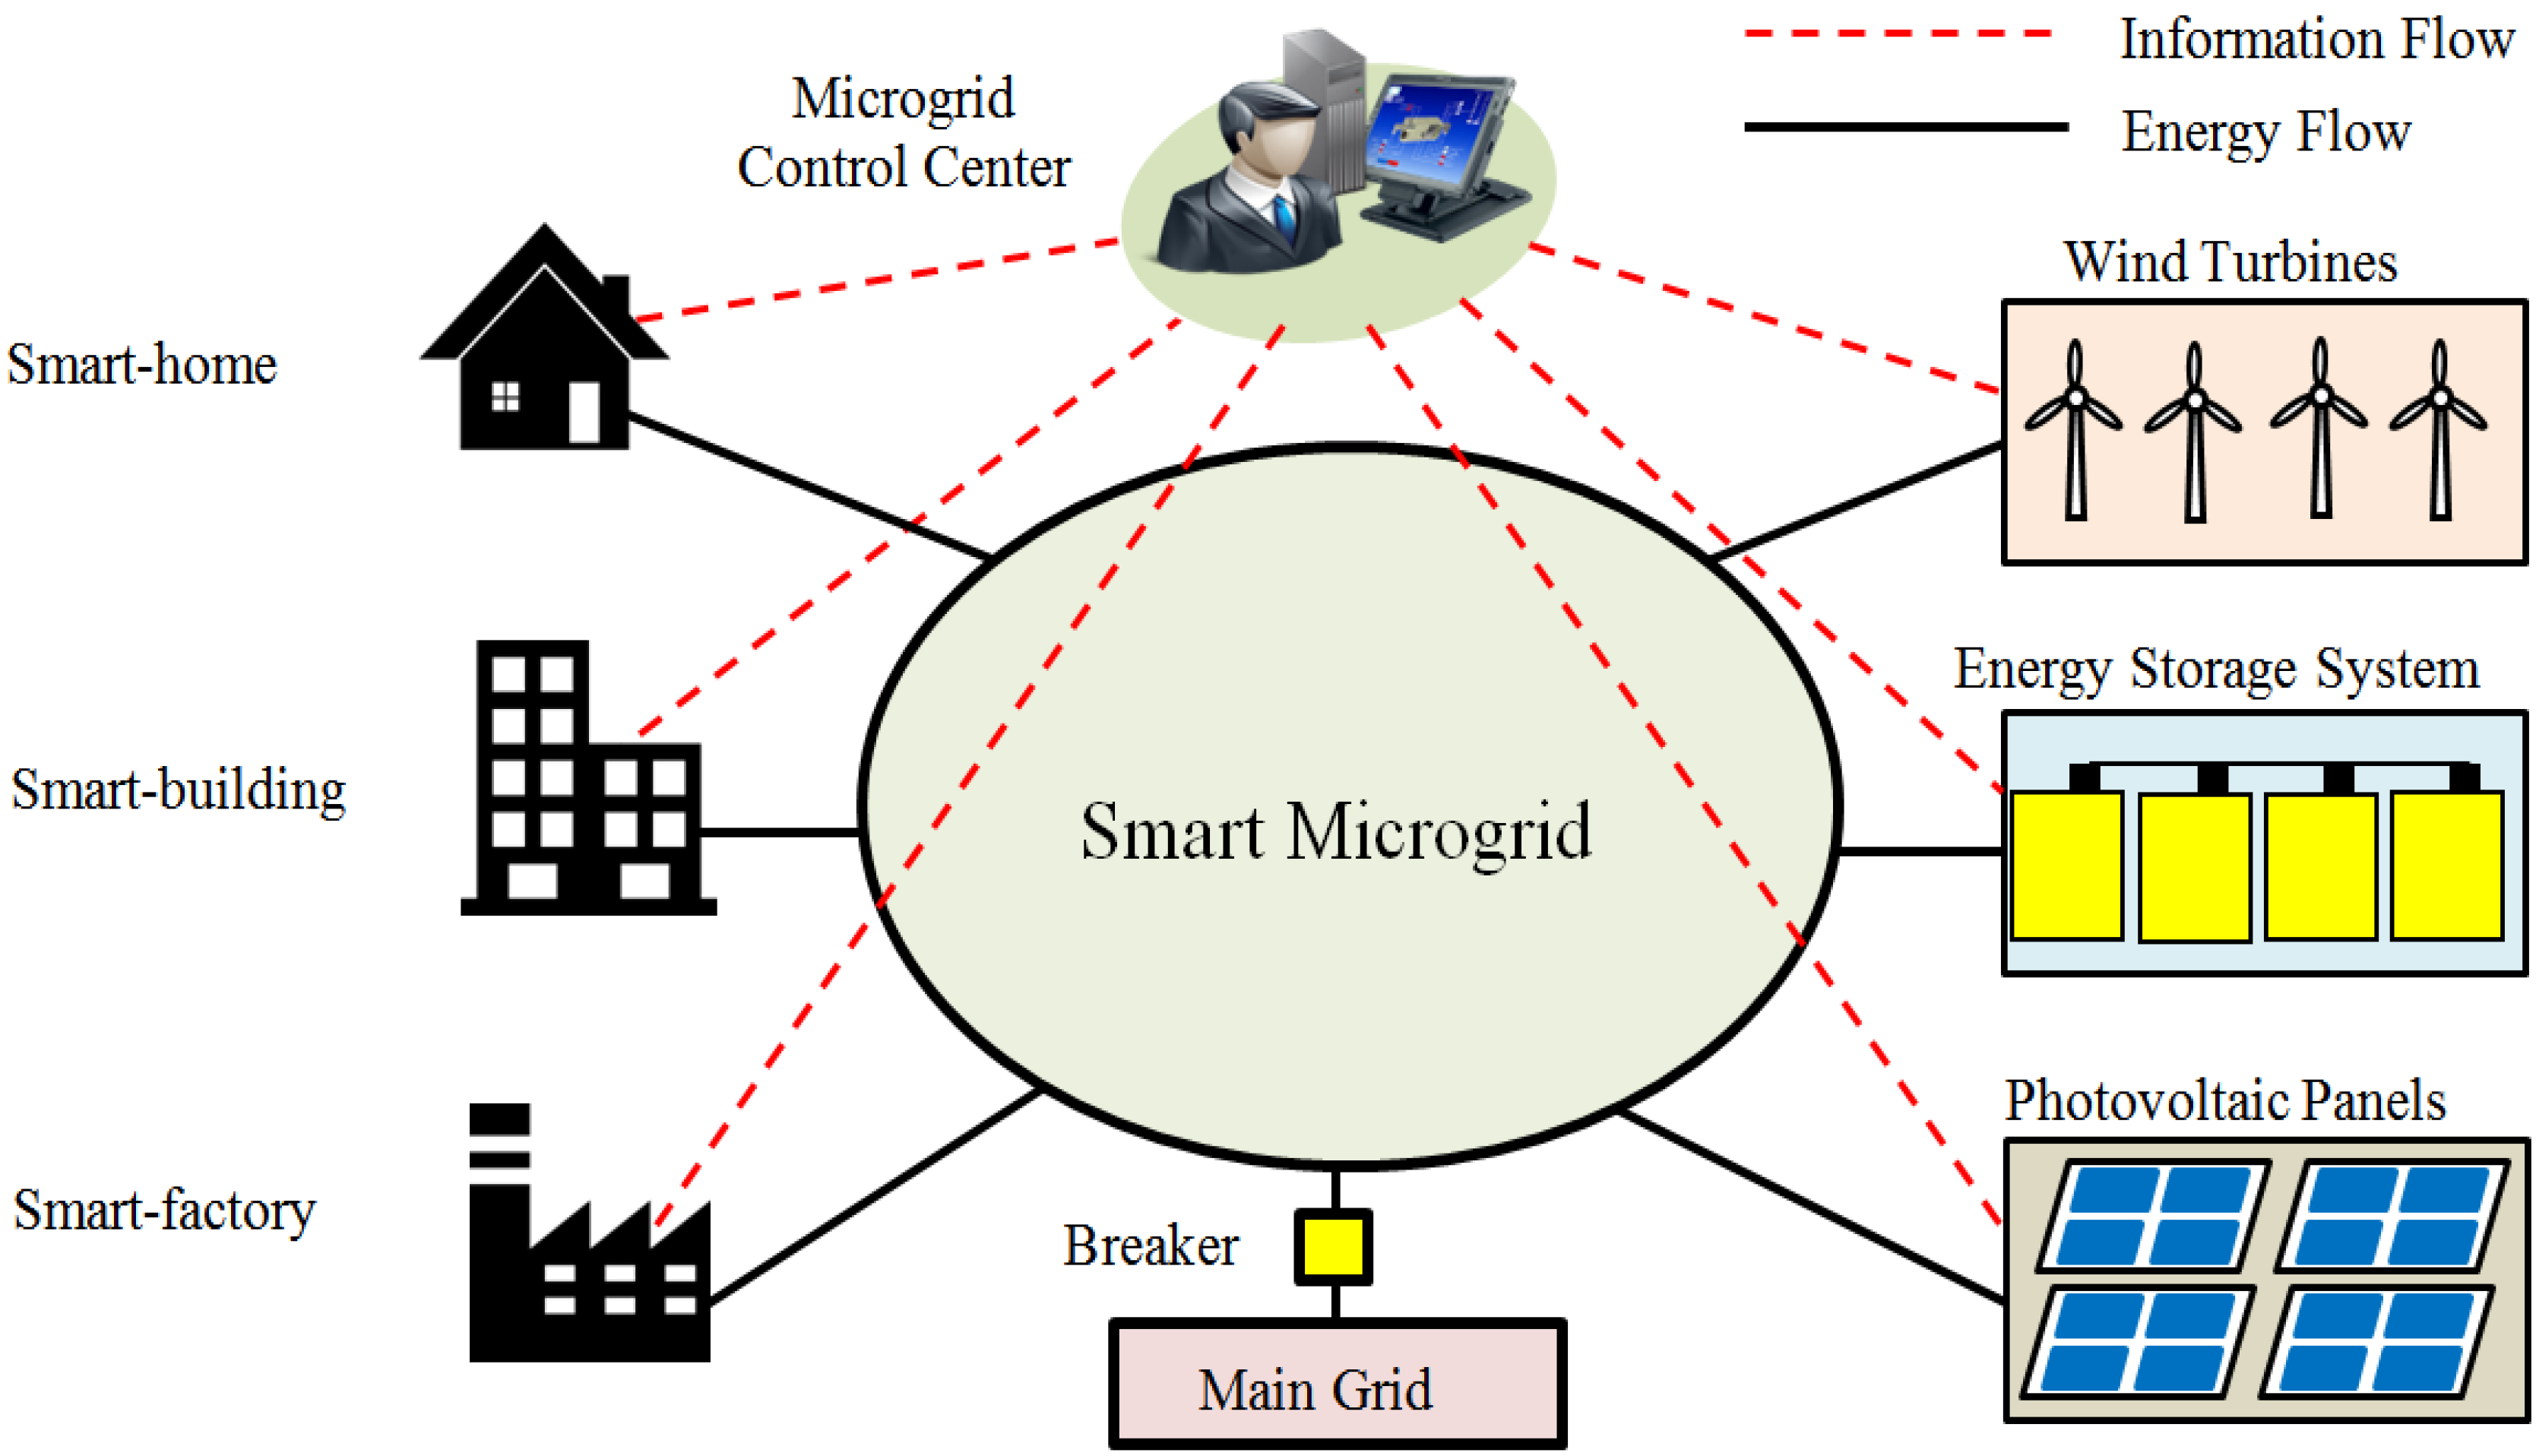
Nowadays, many customers and households have begun to install small-scale WTs and PV panels as standalone systems to meet some of their energy needs locally. The microgrid system can be defined as a low/medium voltage electric power system that contains renewable energy systems, an energy storage system, controllable loads, and an energy management system [2]. The size of a microgrid system can range from a single household to a large geographic area such as a campus. Energy consumers/producers such as a home, building, factory, or campus can use small-scale renewable energy systems to manage themselves either in island mode or connected to the main grid [3,4]. The customer may feed the excess power into the grid or store it using energy storage systems to be used when needed. The communication infrastructure is considered the fundamental element that allows monitoring and control of the operation of the renewable energy systems. In addition, it enables the transfer of both measured information and control signals between the renewable energy systems and the control center [5].
The deployment of renewable energy systems is considered key for enabling technology toward the future smart grid implementation that will change the way we produce and consume electricity. Under certain conditions, these systems will be able to supply the needed electricity to isolated/remote locations. However, managing and controlling the operation of renewable energy systems on a large scale will present many challenges [6]. In order to achieve reliable, secure, and cost-efficient operation of renewable energy systems, as well as the microgrid systems, information and communication technologies are considered an essential element. In this regard, many aspects of the communications technology need to be studied, and their performance should be investigated in order to make the smart-microgrid a reality.
Few papers in the literature have studied the communications infrastructure of small-scale renewable energy systems. In one study [7], a hybrid solar-wind energy system was designed for domestic applications such as rural and remote areas. This system consisted of solar panels, wind generators, load controller, batteries, and inverter. The system could be operated in grid-connected mode as well as off-grid mode. In another study [8], the authors designed and implemented a domestic solar-wind energy system that was monitored and controlled in real time. Measurement of current and voltage from the WT and the solar panels in the implemented system was carried out using three current sensors and three voltage sensors. Sharafat et al. [9] described a distributed Ethernet-based communication network for monitoring a hybrid system consisting of solar PV and a diesel power generator in a local electricity grid. Direct communications links were established between the hybrid system and the control center. Furthermore, the communication links were configured in a star topology. Rashidi et al. [10] proposed a cost-effective PV monitoring system using wireless technology (ZigBee). In order to monitor real-time measurements such as voltage, current, and power of each module, a graphical user interface was developed using LabView. A real microgrid project in Girona, Spain was presented by Salas et al. in [11]. The project was configured as a standalone system consisting of PV panels, a small WT, energy storage system (batteries), and micro combined heat and power. A cost-effective monitoring system was carried out using ZigBee technology. In [12], Kang et al. implemented a condition monitoring and control system for a small-scale WT. It consists of data collection unit, control unit and a coordinator. The data collection units were used to collect data from various sensors such as temperature, pressure, humidity, wind speed and wind direction. ZigBee was used to communicate between the data collection units and the coordinator. Another study [13] applied the small wind generation system to a super high-rise building. Vibration and noise measurements were performed for both horizontal and vertical WT installations.
Few papers have studied the communications infrastructure and networking of small-scale renewable energy systems. Most research work has focused on the electric engineering and electric control aspects [14]. In order to monitor the behavior of small-scale renewable energy systems, different types of sensors should be considered. Furthermore, considering only one wired/wireless technology for the communication infrastructure is not the best solution because of the restrictions or obstacles that may exist in system deployment. The main objective of the current paper is to design communication network architecture for monitoring the behavior of renewable energy generation involving small-scale WTs and PV systems based on international electrotechnical commission standards. A simulation model using three different technologies: Ethernet-based, Wi-Fi-based and ZigBee-based, was designed using the OPNET Modeler. The performance of the proposed network models was evaluated with respect to end-to-end (ETE) delay for different architectures, including a smart-house and a smart-building. The major contributions of this work are as follows:
  • Design of communication network architecture for monitoring and controlling small-scale distributed energy systems using both wired and wireless technologies.
  • Define the traffic profile and data packet size of renewable energy systems including small-scale WTs and PV systems.
  • Evaluate the performance using three different technologies: Ethernet-based, WiFi-based, and ZigBee-based architectures.
  • Compare the performance of communication networks with respect to the ETE delay, reliability and network cost for different architectures including a smart-house and a smart-building.

2. Microgrid System

2.1. Microgrid Components

Figure 1 shows a microgrid system including PV panels, small-scale WTs, and energy storage units. The microgrid system has two operation modes: a standalone mode and a grid-connected mode [15]. In the standalone mode, the microgrid could be isolated from the main power grid as a result of geographical isolation or failure of the main grid. According to the microgrid power balance, it may be operated in equilibrium mode, surplus mode, or shortage mode. In the grid-connected mode, the microgrid is viewed as an integral part of the electric power system. The microgrid operation is managed through a microgrid control center, which is responsible for real-time monitoring and also enables stable operation and control of all equipment in the system.
Figure 1. Overview of a microgrid system with renewable energy resources (e.g., small-scale WTs and PV panels).
Energies 08 08716 g001

2.2. Microgrid Electric Topology

The microgrid configuration can be classified into three types: alternating current (AC) microgrid, direct current (DC) microgrid, and hybrid AC/DC microgrid [16,17]. For the AC microgrid configuration, all the generating units with AC power output such as WTs are directly connected to the AC bus line. The units with DC power output such as the PV panels are connected to the AC bus using a DC/AC converter. The AC loads are directly connected to the AC bus whereas the DC loads need AC/DC power converters. The technology for the AC microgrid is now matured, and several AC microgrids have been constructed in several countries. The DC microgrid is a new concept for future power systems because most of the customer equipment needs DC power for its operation. In the near future, the DC microgrid will become an alternative for the AC microgrids. In this case, the energy storage units and PV systems would be easily connected to the DC bus line. However, for WTs AC/DC inverters will be need to be connected to the DC bus line. The hybrid AC/DC microgrid consists of both AC microgrids and DC microgrids, which are connected through an AC/DC converter. Each part has its own energy sources, energy storage, and loads. Figure 2 shows the configuration of AC microgrid and DC microgrid systems.
Figure 2. (a) AC microgrid; (b) DC microgrid.
Energies 08 08716 g002

2.3. Microgrid Communication Network Technologies

The communication media in the power system can be classified into two main groups: dependent communication media and independent ones. The dependent communication media is part of the power network elements, for example, power line communication (PLC) and optical power ground wire. The independent communication media does not depend on the power system, for example wireless communication and networks owned by companies providing data service [18]. In the case of a small microgrid system, the network traffic is light and does not require a high-speed communication network or high bandwidth capacity. Therefore, low-speed communication networks such as WiFi and ZigBee are considered suitable solutions for residential microgrid applications as shown in Table 1. From the practical point of view, wireless communication networks offer the best choice for ease of deployment, cost, and maintainability. A dedicated wired medium such as Ethernet could be considered the best choice in the case of restrictions or limited space [19]. Also, wireless communication technology can offer more flexibility, reliability, and lower cost of installation compared with wired-based technologies. Wi-Fi and ZigBee are considered the most cost-effective solutions to relay the collected data via one hop or multi-hop to the control unit. Table 2 compares the three different communication standards used for the microgrid communication network in this study.
Table 1. Network requirements for customer premises applications [19].
ApplicationLatencyReliabilityCommunication technologies
WiredWireless
EthernetPLCWiFiZigBee
Home automationSeconds>98%
Building automationSeconds>98%
Table 2. Comparison between different communication technologies applicable for microgrid.
TechnologyStandard/ProtocolData RateCoverage Range
EthernetIEEE 802.3100 MbpsUp to 100 m
ZigBeeIEEE 802.15.4250 kbps100 m–1600 m
WLANIEEE 802.11g54 MbpsUp to 100 m

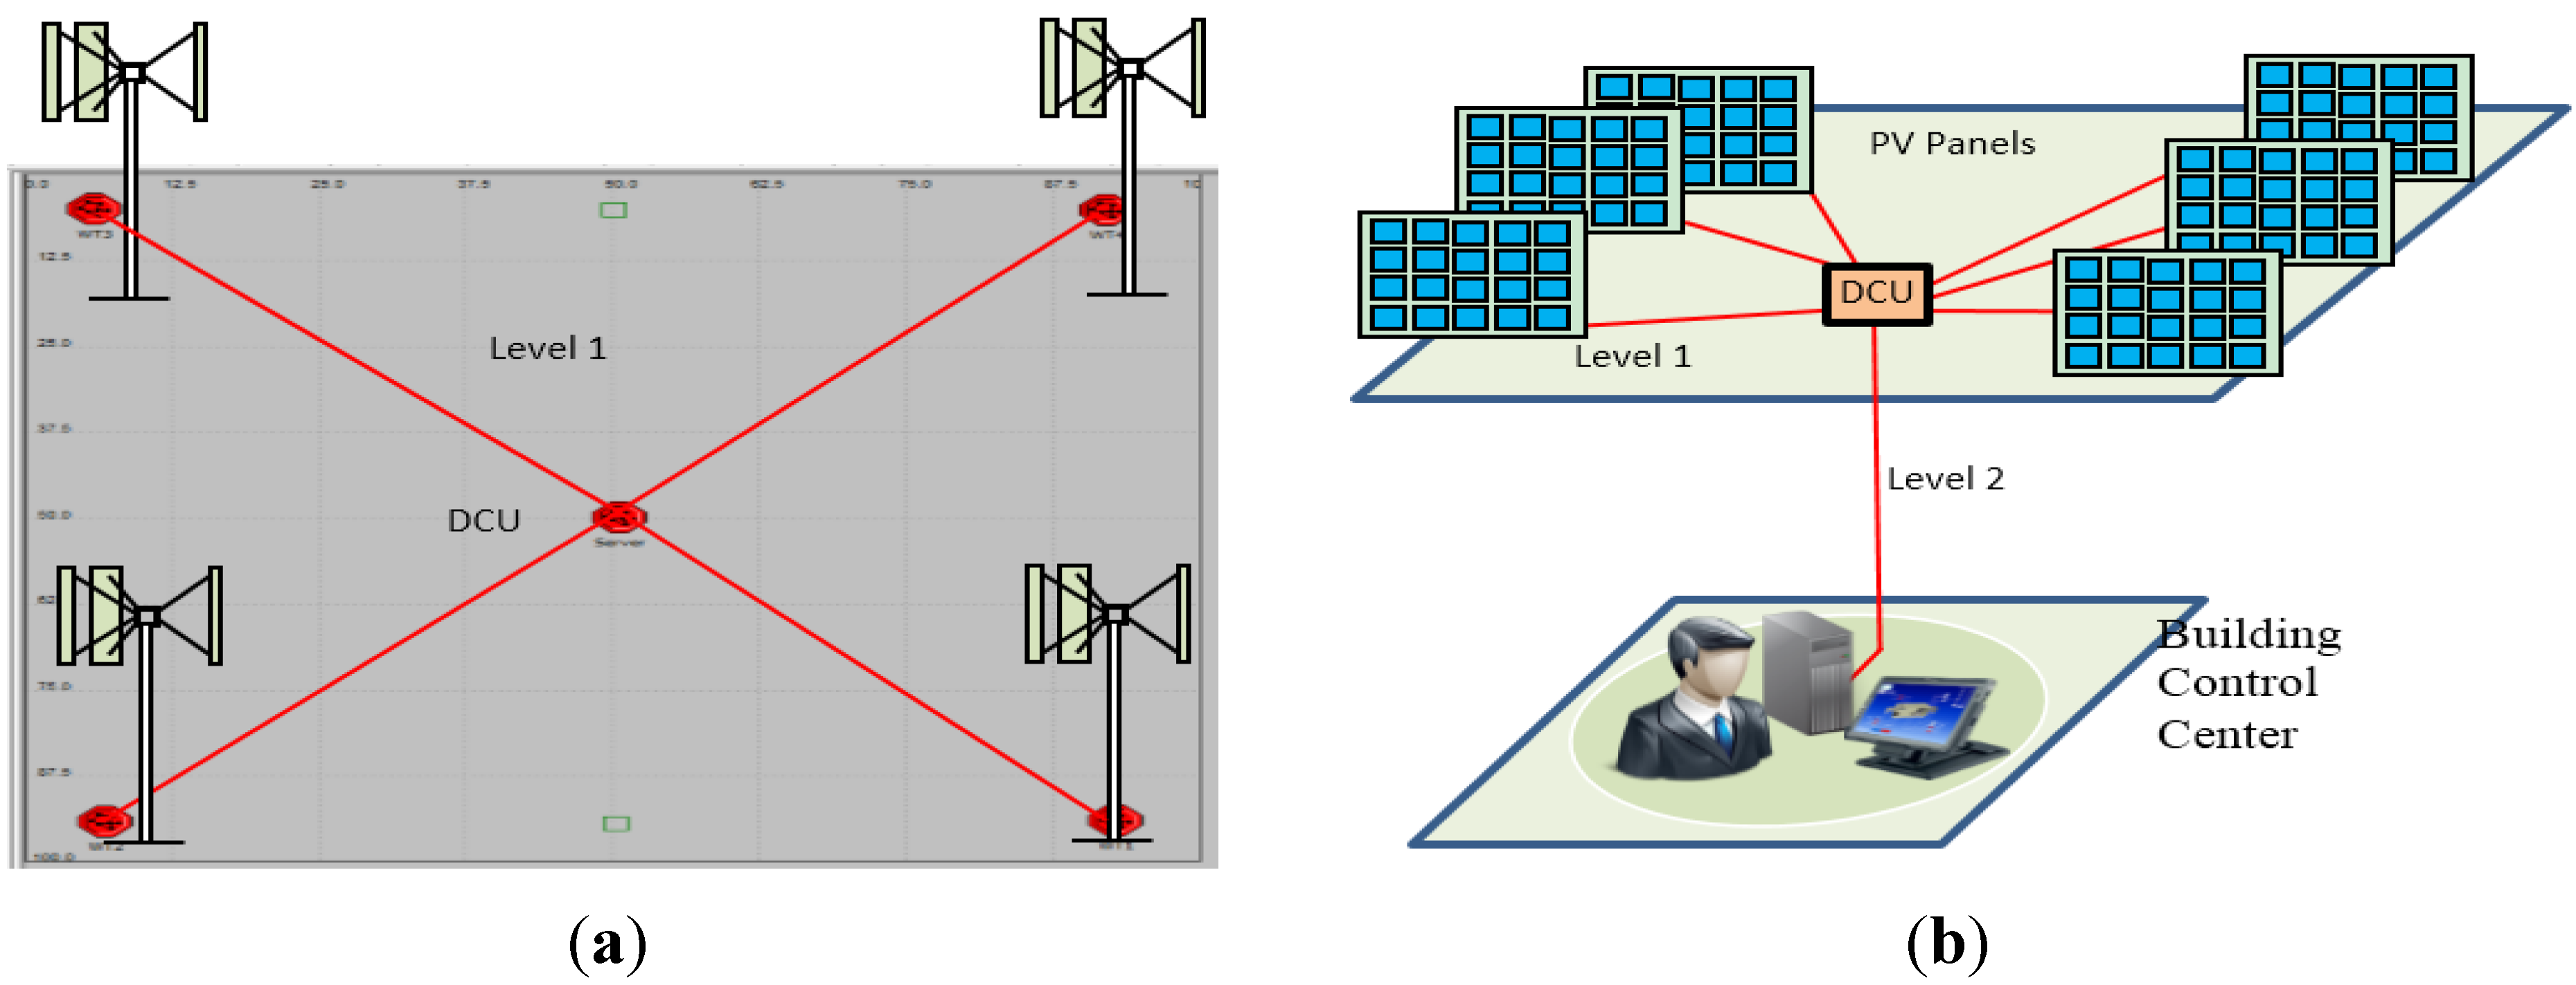
3. Network Architecture for Small-Scale Renewable Energy Systems

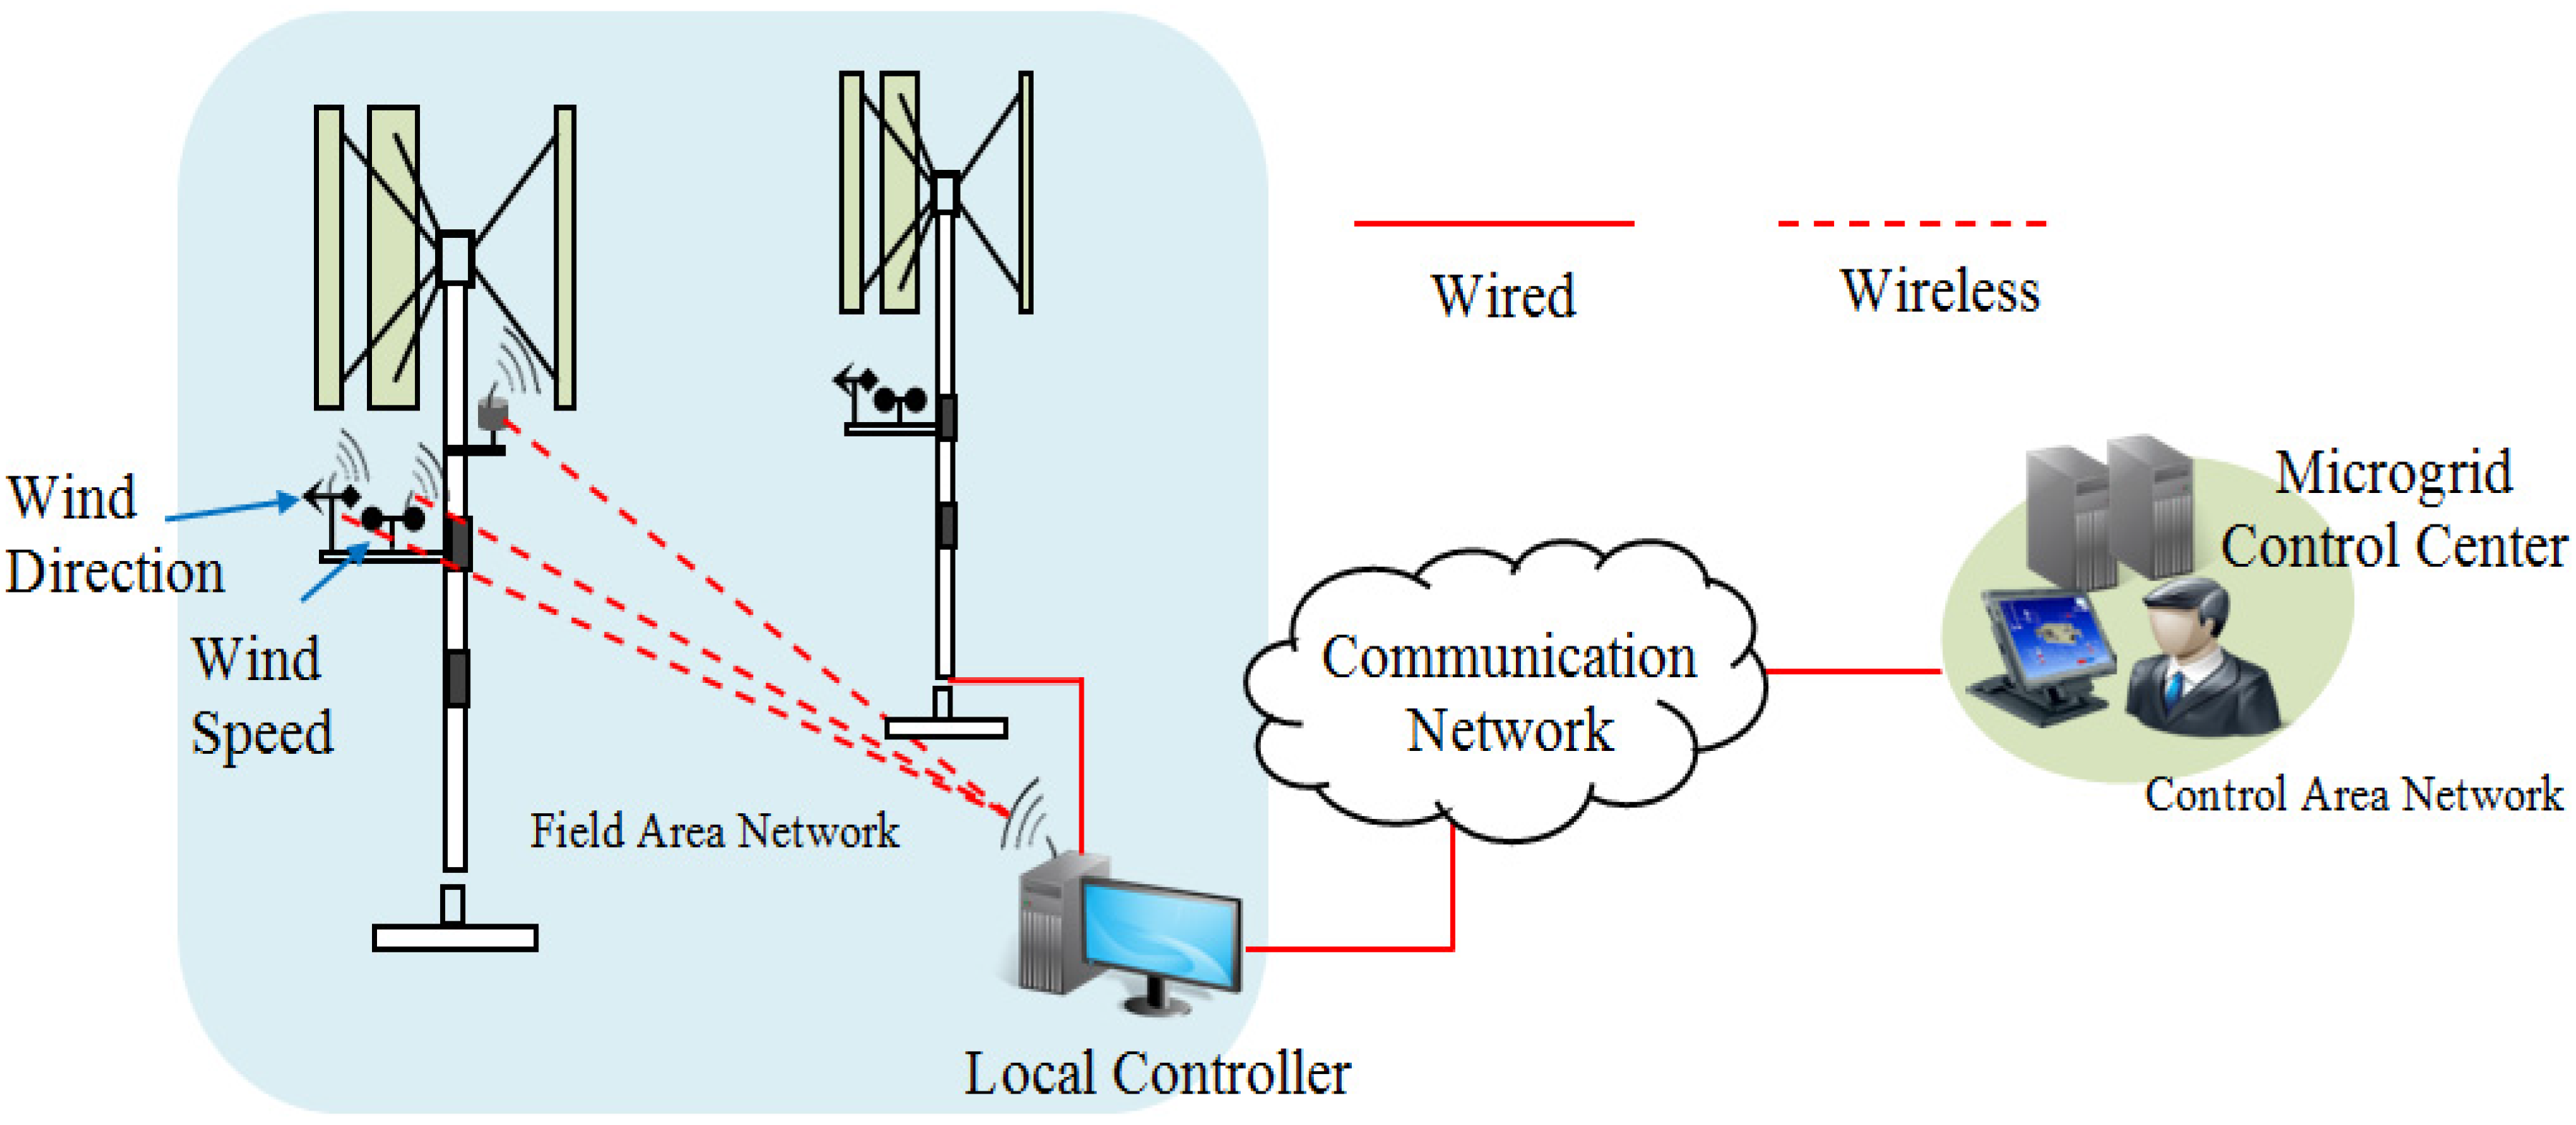
The communication network is considered an essential component to ensure a reliable and stable renewable energy systems operation. When designing the microgrid communication network, the three major factors that should be considered are the microgrid components, traffic volume, and number of renewable energy systems. 
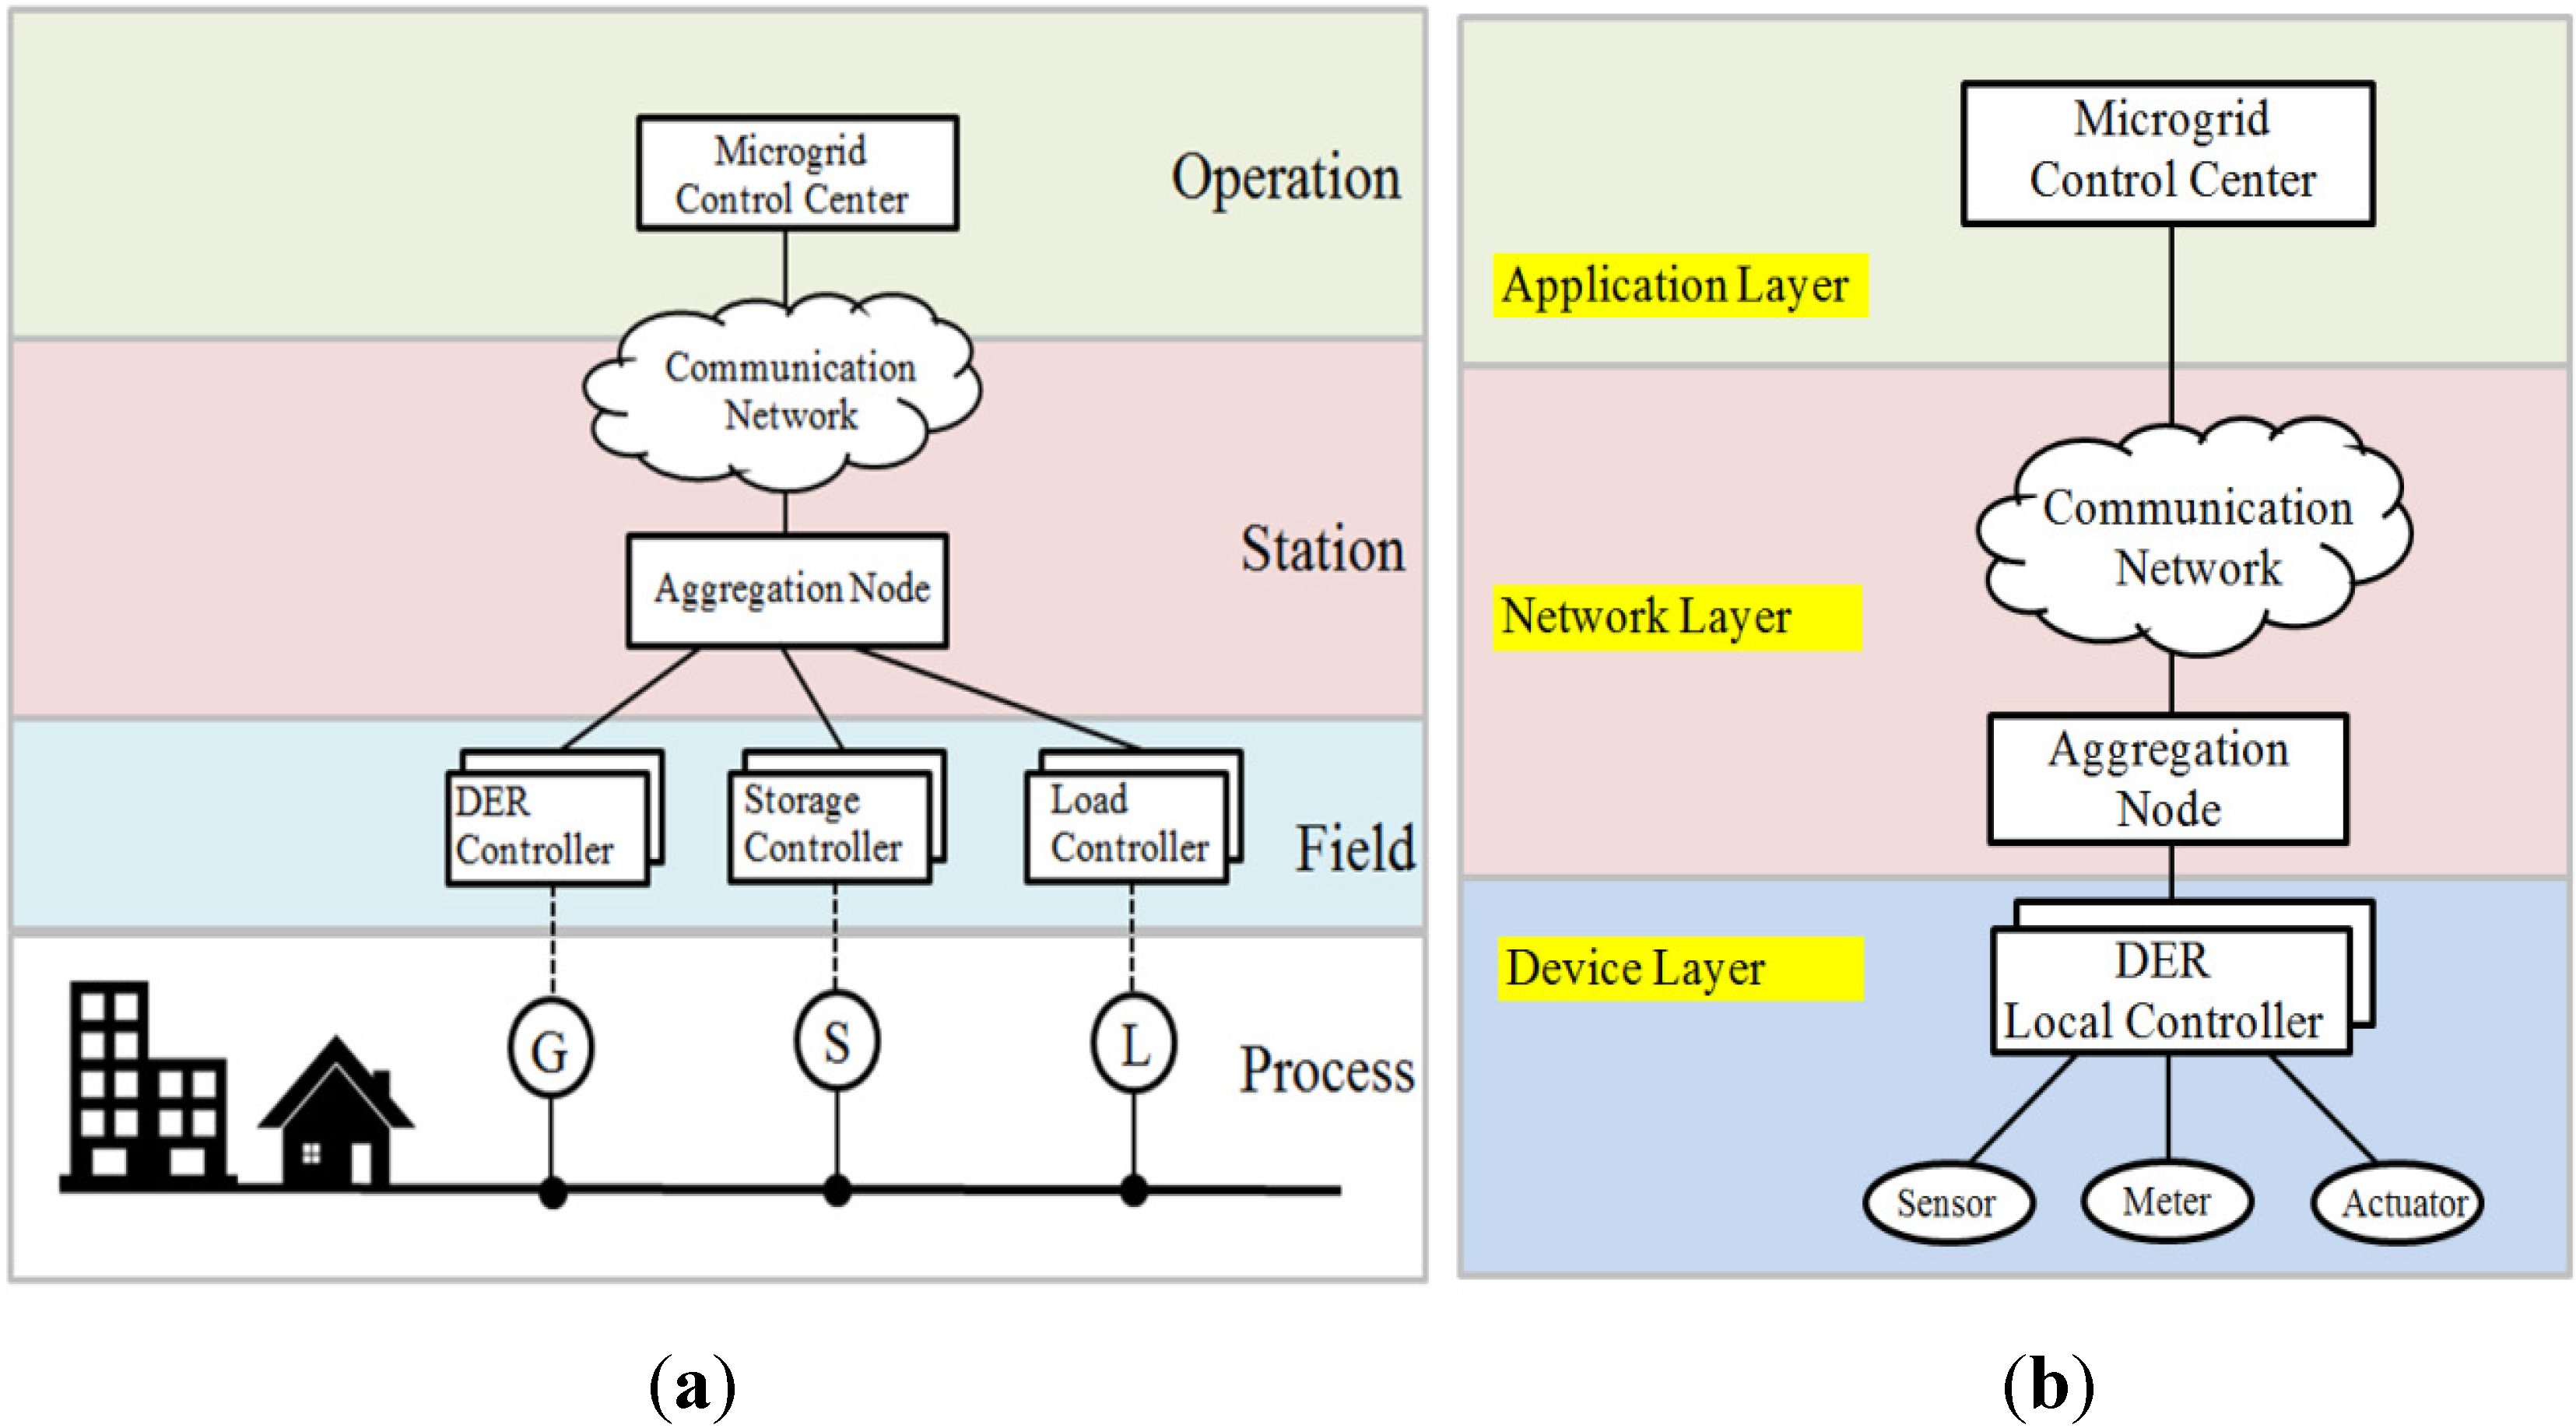
Figure 3 shows the three layers of communication architecture of the microgrid based on the smart grid coordination group [20]: the device layer, network layer, and application layer.
  • The device layer represents various devices including sensor nodes and meters which are used to capture different measurements such as voltage, current, and temperature from the renewable energy units. Each renewable energy unit has a local controller. The local controller monitors and controls the operation of the renewable energy unit based on local measurements.
  • The network layer is used to connect the device layer components and the microgrid control center. The network layer should support real-time monitoring and control of the microgrid system. It can be established either using wired or wireless-based technologies.
  • The application layer is responsible for energy management and remote monitoring and control of the microgrid system. It includes the SCADA system that receives the measurement data via the network layer.
Figure 3. (a) Smart grid customer premises domain and hierarchical zones; (b) Microgrid three layers communication network architecture.
Energies 08 08716 g003

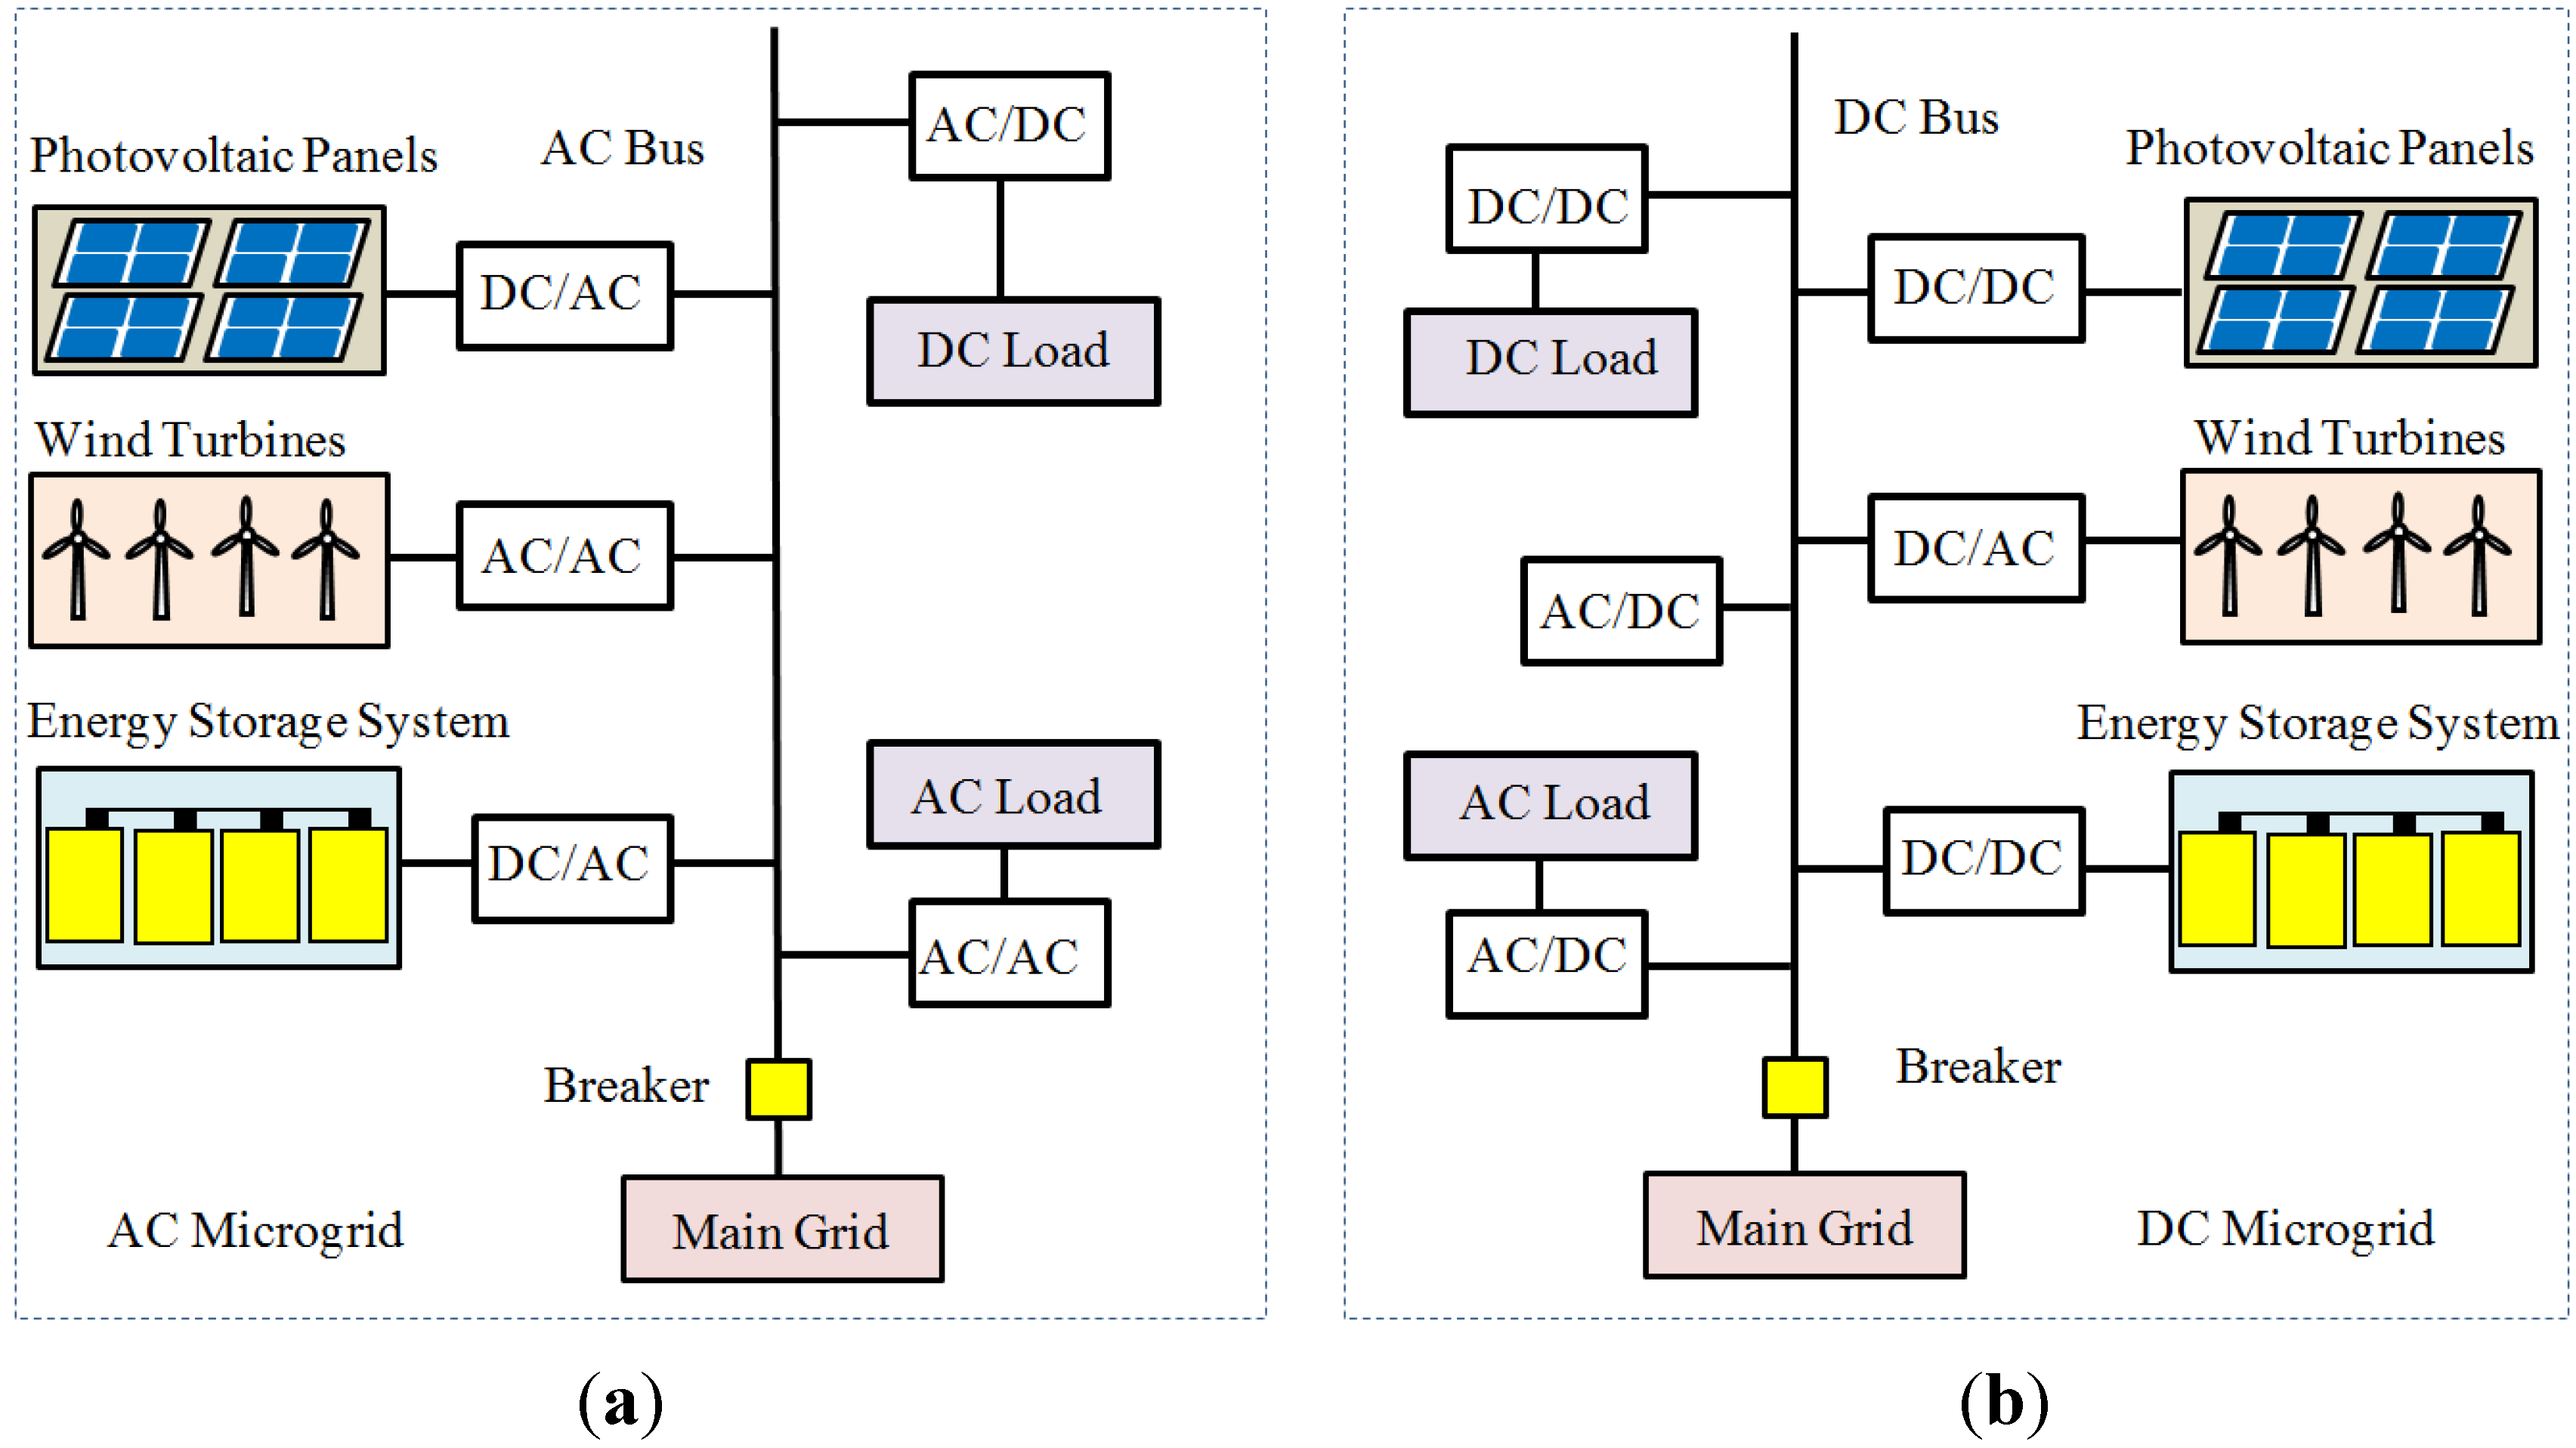
3.1. Network Model of PV System

The PV power system is used to convert the solar energy into electricity. It consists of several modules connected to form module strings. The modules are connected in different topologies in series or parallel to form an array. The PV power system can be operated in a standalone mode, combined with other renewable energy sources, or connected to the main power system. The output voltage of the PV system may be affected if a fault occurs in any single module that may degrade the system output. Other factors that may degrade the system performance are shading and dust. In this study, the International Electrotechnical Commission (IEC) 61724 standard is used to describe general guidelines for monitoring and analysis of the PV systems [21]. Based on IEC 61724, we defined the real-time monitoring parameters of the PV system as given in Table 3. All monitoring parameters should be continuously measured, and the sampling interval should be 1 min or less.
Table 3. Monitoring parameters of a PV system based on IEC 61724.
TypeMeasurementAccuracy RangeSampling Freq.
MeteorologyTotal Irradiance<5%1 min or less
Ambient Air Temperature<1 °C
Wind Speed<0.5 m/s for speed <5 m/s, <10% of the reading for speed >5 m/s
PV ArrayOutput Voltage<1% of the reading1 min or less
Output Current<1% of the reading
Output Power<1% of the reading
Module Temperature<1 °C
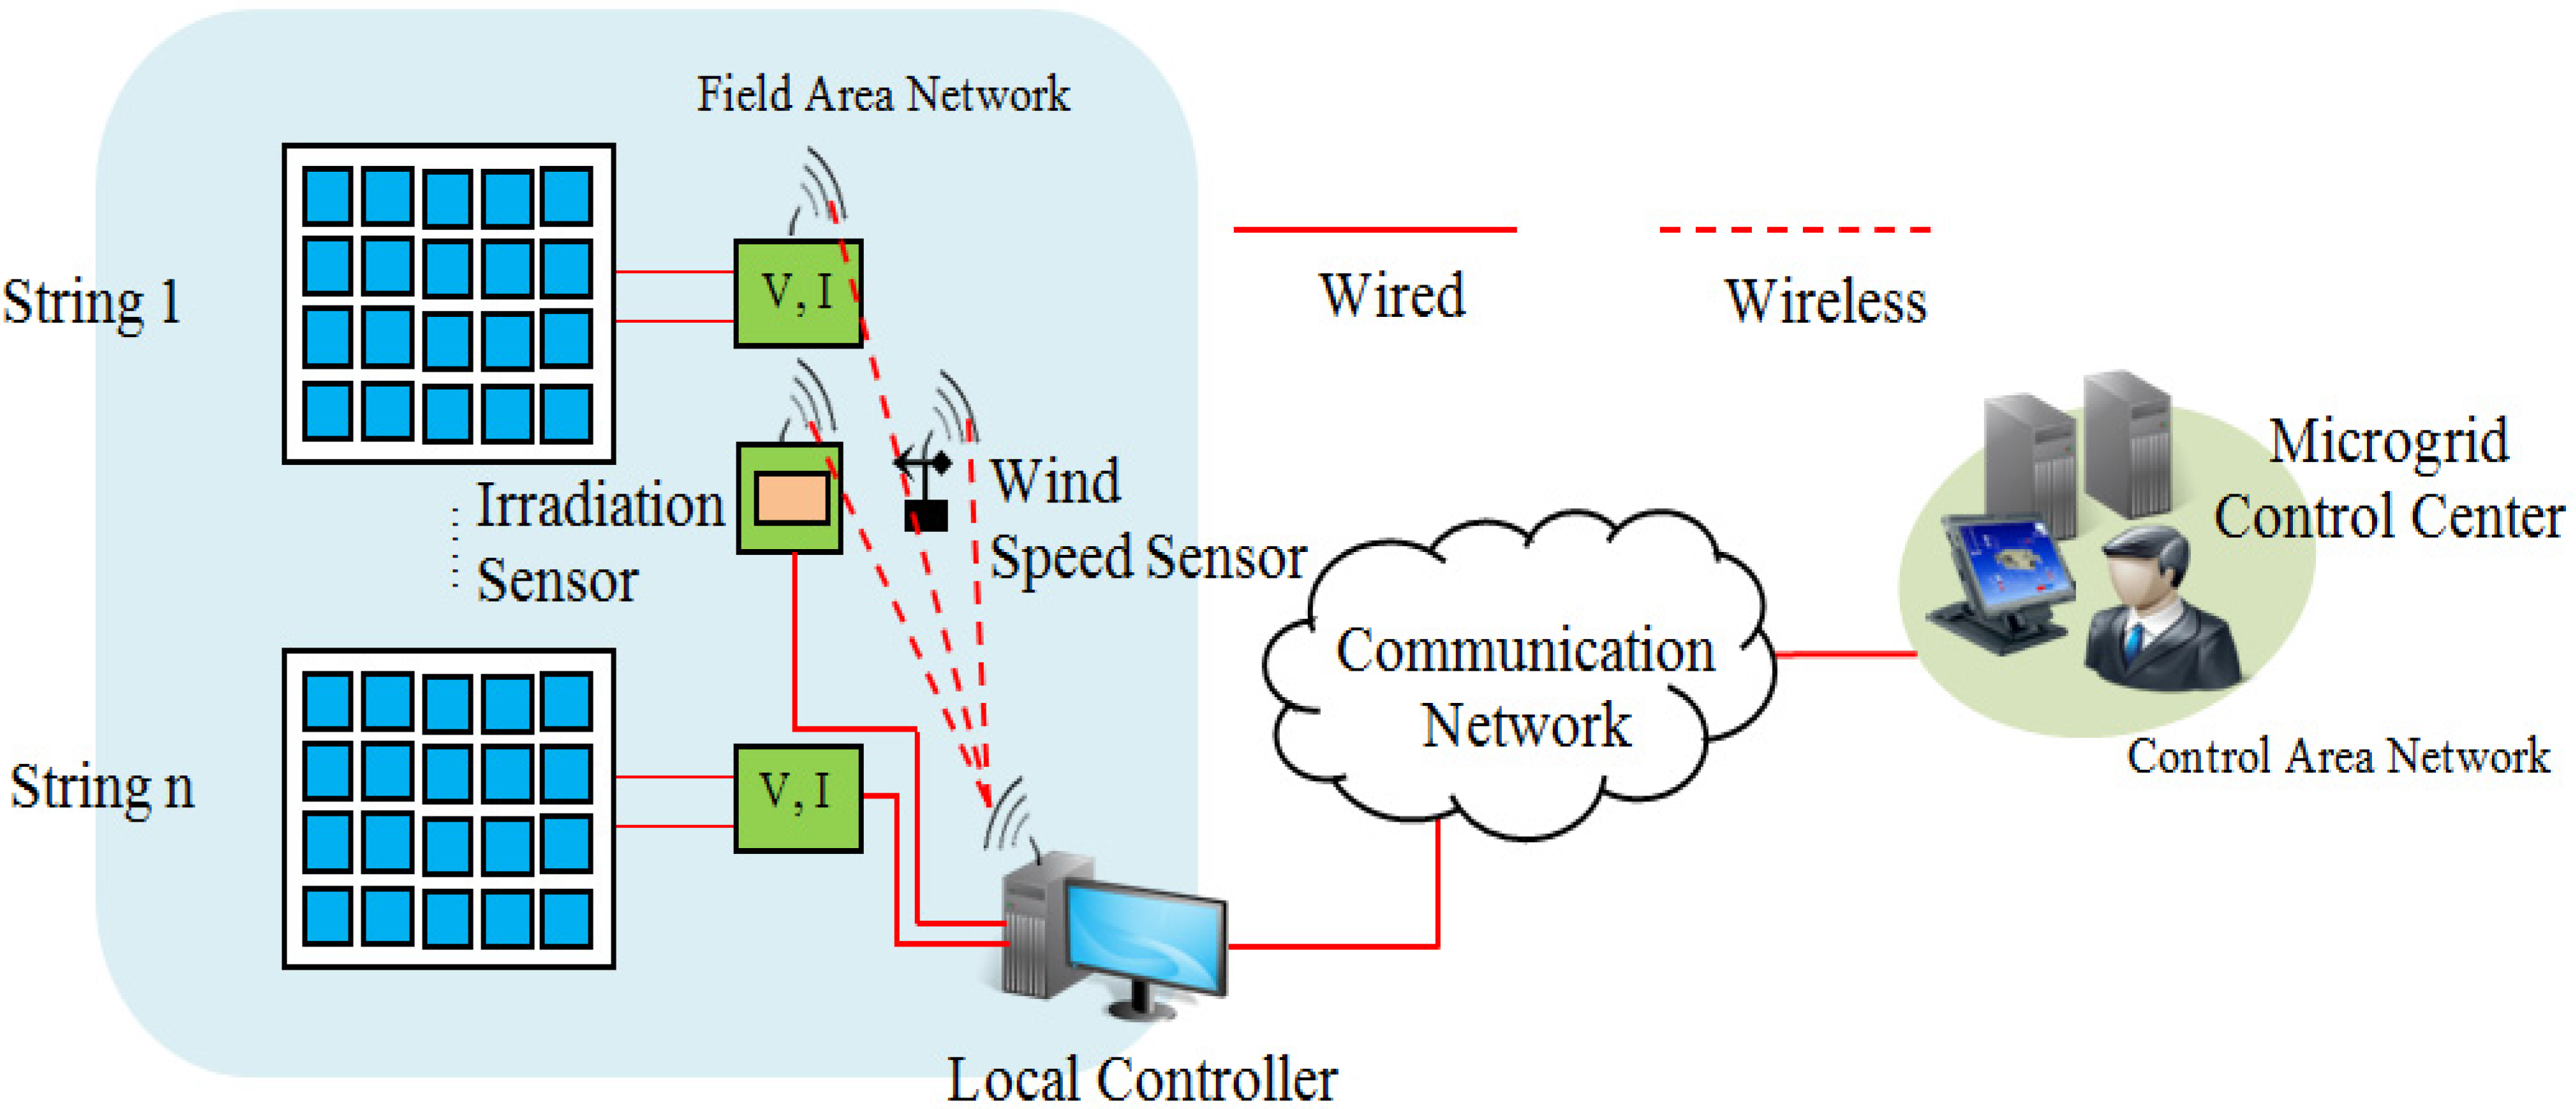
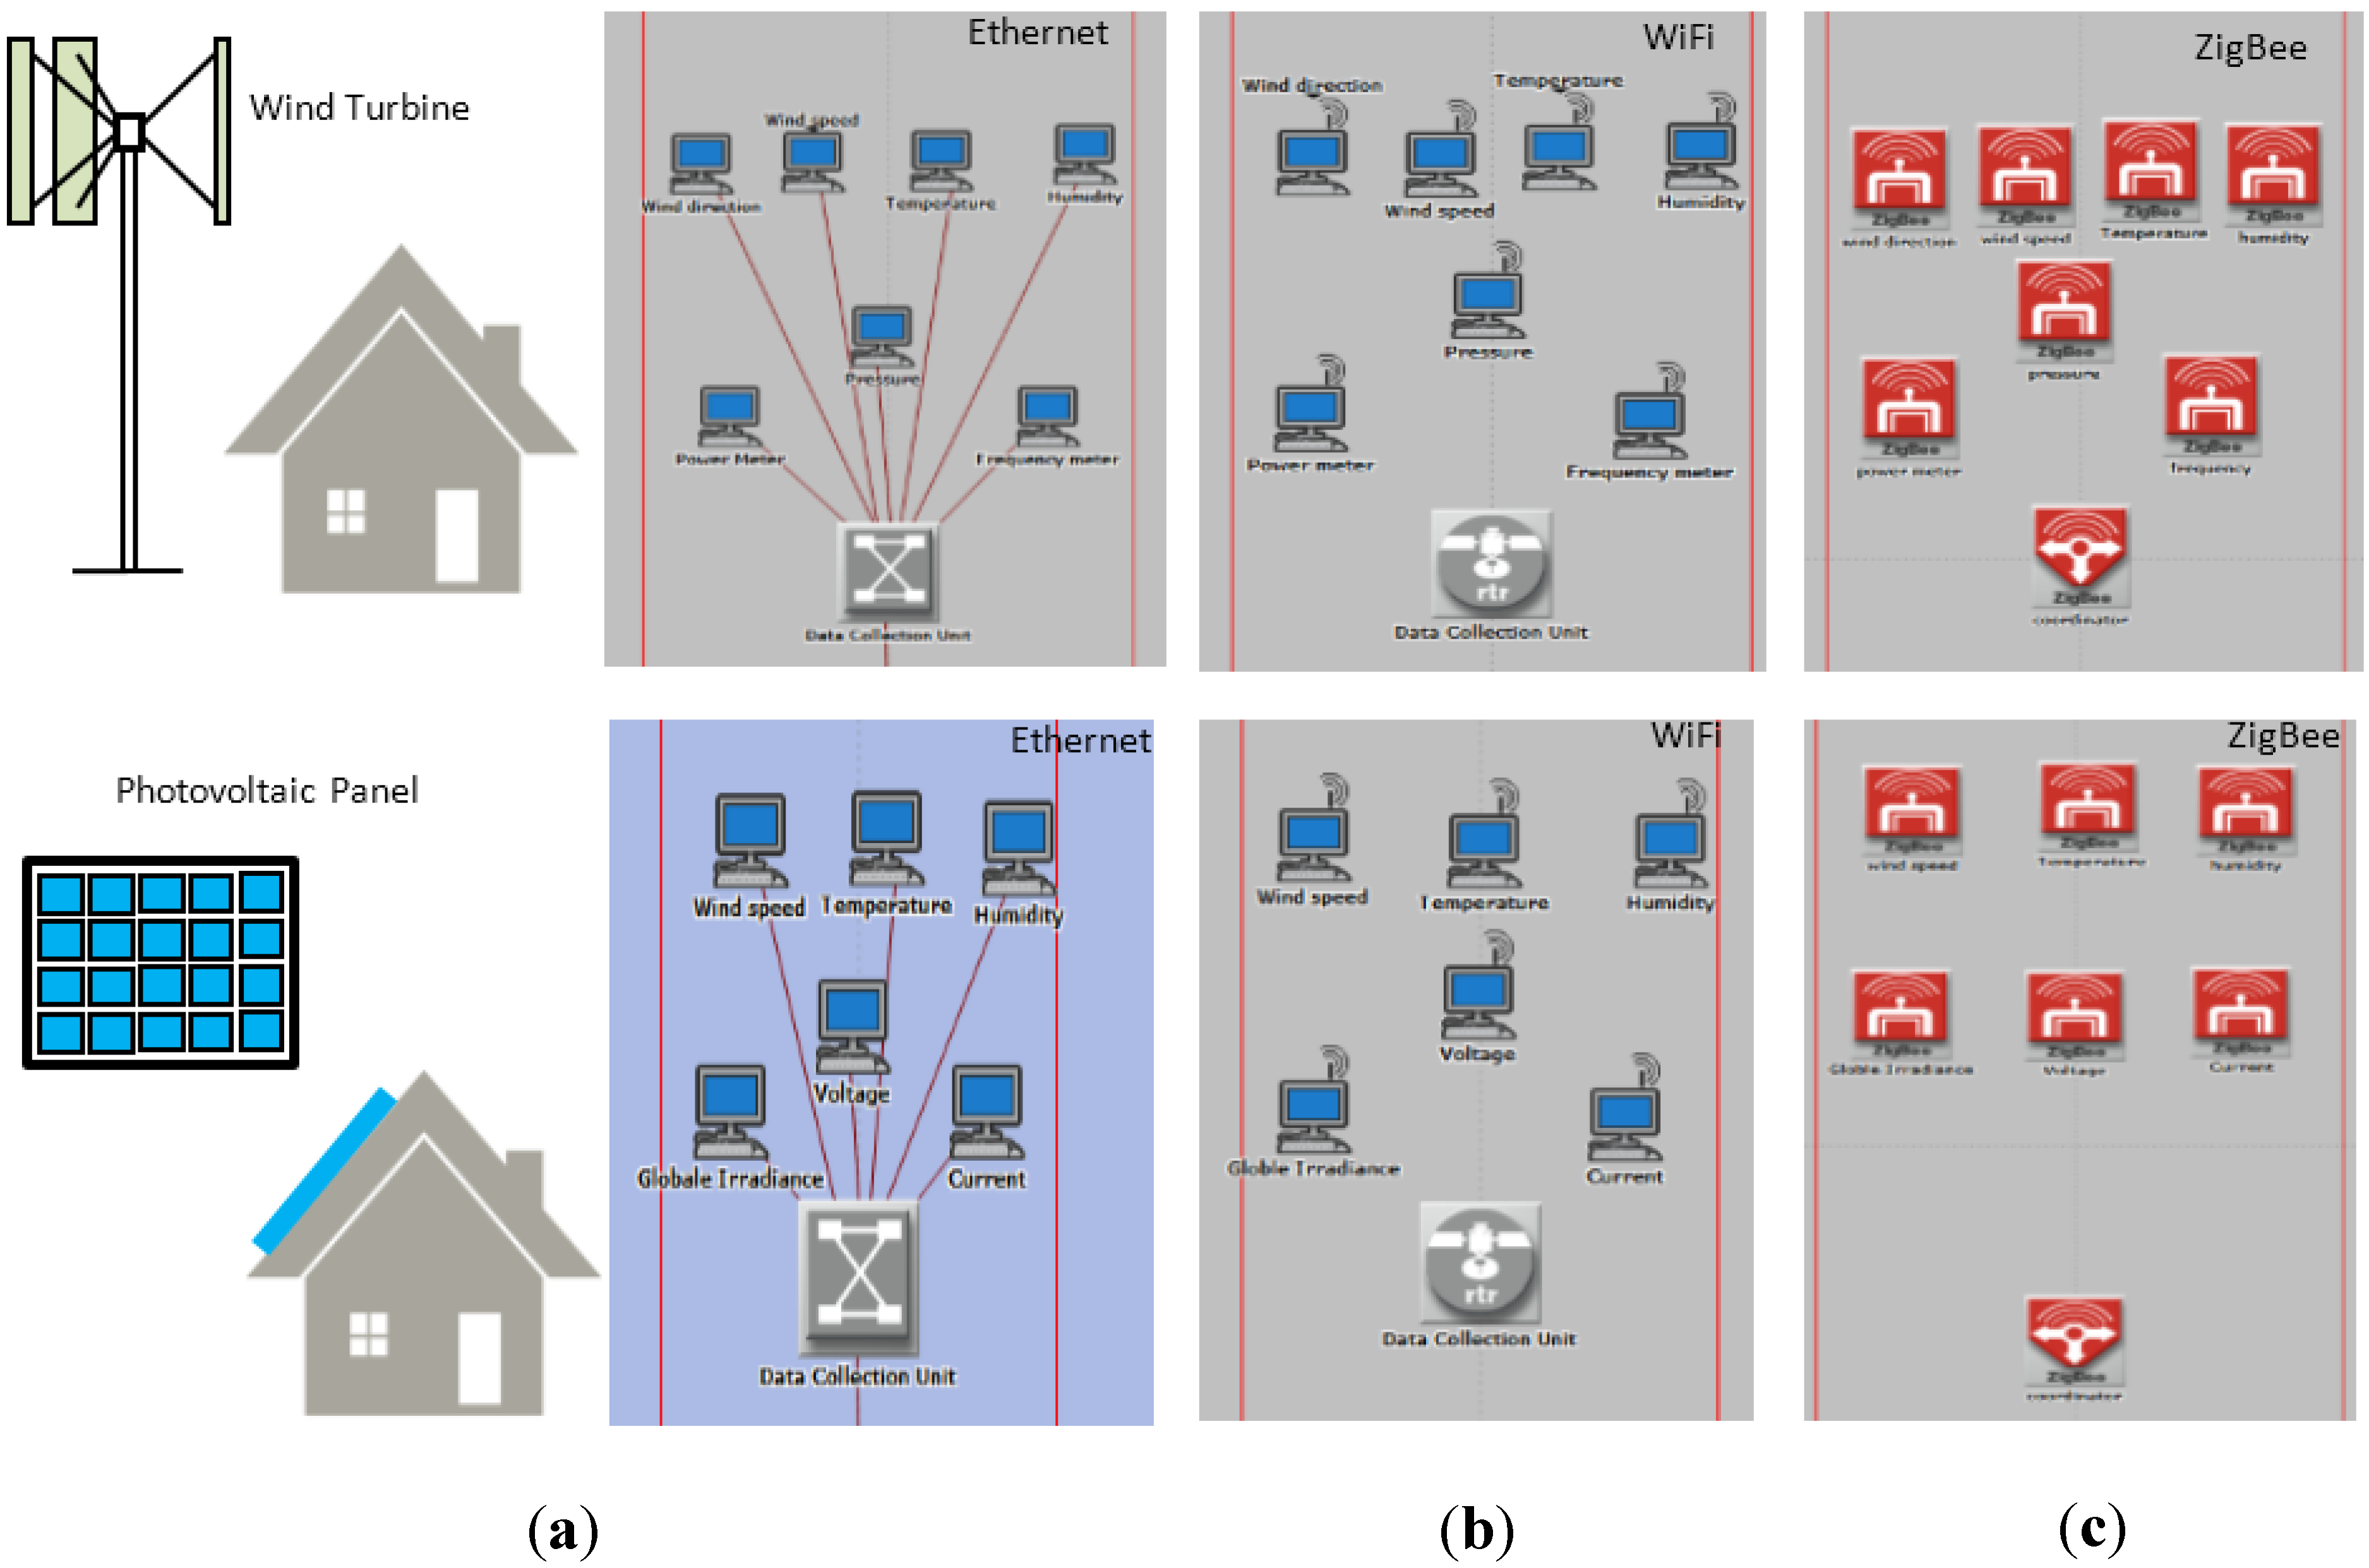
Figure 4 shows the communication network for the PV system. To monitor the system continuously, different sensor nodes are installed that enable the control center operator to detect any fault and allow a rapid response to control the system operation. The monitored parameters include voltage, current, power, panel temperature, wind speed, air temperature, and irradiation sensors. All sensing data are collected at the control center level.
Figure 4. Communication network for a PV system.
Energies 08 08716 g004

3.2. Network Model of Small-Scale WT System

WTs can be classified based on power production into three types: utility scale, industrial scale, and residential scale. Large WTs are used for utility power generation in wind farms whereas small-scale WTs are better suited for residential and small business. In this study, the monitoring requirements of small-scale WTs are based on Commonwealth wind incentive program [22] and Ahmed et al. [23]. The measurement parameters include wind speed, wind direction, outdoor temperature, and turbine output power, as shown in Table 4. The wind speed is measured by an anemometer and the wind direction is measured by a wind vane. Figure 5 shows the communication network for a small-scale WT.
Table 4. Monitoring parameters of small-scale WT.
MeasurementEquipmentAccuracy RangeSampling Freq.
Wind SpeedAnemometer±0.1 m/s1 min or less
Wind DirectionWind Vane±5°
Outdoor TemperatureTemperature Sensor±2 °C
Turbine Output PowerWatt Transducer±1% of reading
PressurePressure Sensor
Figure 5. Communication network for a small-scale WT.
Energies 08 08716 g005

3.3. Network Model of Microgrid Control Center

The microgrid control center includes the human machine interface, energy management system, and data storage servers. It collects all information from renewable energy systems, energy storage systems, and loads through the communication networks.

3.4. Measuring Requirements for Sensor Data

This section shows the different measurements that should be considered in order to perform real-time monitoring of renewable energy systems. Table 5 lists all the measurements and their sampling frequency [24]. These sensors collect data and transmit them to the data collection unit (DCU), located at the WT or PV site. For each sensor node, we defined the measurement type, the sampling frequency, and the number of channels needed. As shown in Table 5, we calculated the amount of data transferred per second from each sensor node to the DCU, assuming that each sample is represented by 16 bits (2 bytes) [25]. Data rate can be calculated according to Equation 1 where, Nc and fs represent the number of channels and sampling frequency, respectively.
Data rate  =   2 × N c × f s
The total amount of traffic for a WT and a PV system can be calculated according to the number of sensors. Real-time measurements considered for WTs include wind speed, wind direction, temperature, humidity, pressure, frequency, and output power, whereas those for PV systems include voltage, current, wind speed, humidity, irradiation, and module temperature.
Table 5. Measuring requirements for sensor data.
MeasurementUnitSampling Frequency# of ChannelsDirectionSize (Bytes)
TemperatureC1 Hz1Uplink/Continuous2
PressurePa100 Hz1Uplink/Continuous100
PowerW5 Hz1Uplink/Continuous10
Wind Directiondeg3 Hz1Uplink/Continuous6
Wind Speedm/s3 Hz1Uplink/Continuous6
FrequencyHz10 Hz1Uplink/Continuous20
Global IrradiancePa100 Hz1Uplink/Continuous200
Humidity%1 Hz1Uplink/Continuous2
VoltageV360 Hz1Uplink/Continuous720
CurrentA360 Hz1Uplink/Continuous720
WT246 bytes/s ≈ 1968 bit/s
PV1452 bytes/s ≈ 11,616 bit/s

4. Performance Evaluation

The OPNET Modeler is used to evaluate the performance of a microgrid system including small-scale renewable energy systems. The OPNET uses an object-oriented modeling approach to construct the models, which enables modeling of all types of networks and technologies. Two scenarios are considered: a smart-house and a smart-building. The network performance of the proposed network models is evaluated in terms of the following metrics:
  • ETE delay for the monitoring data: represents time (in seconds) for the monitoring data to be delivered from the source (WT/PV) to the control center server.
  • Received traffic at the server (bytes/s): compares the amount of generated transmission data with the amount of received traffic at the server.
  • Reliability: represents the ratio of bits successfully received to bits of data transmitted.
  • Network cost: represents the cost of active devices and cost of passive components.
Note that the positions of the sensor nodes are fixed for both the small-scale WT and the PV system. The simulation parameters for different technologies (wired and wireless) are given in Table 6. The technical specifications of the small-scale WT dimensions given in [23] are considered to build the communication network model, as shown in Table 7. For the PV system, the communication network model is configured based on the IEC 61724 standards discussed in Section 3. The WT network model includes seven sensor nodes whereas the network model of the PV system consists of six sensor nodes.
Table 6. OPNET simulation assumptions; SN: Sensor Node.
ParameterDescription
Number of SNs for a WT7
Number of SNs for a PV module6
Wired MediaEthernet (IEEE 802.3)
Wireless MediaWiFi (IEEE 802.11), ZigBee (IEEE 802.15.4)
Simulation Time60 min
Table 7. Technical specifications of a small-scale WT.
ParameterTurbine Characteristics [13]Turbine Characteristics [23]
Rated Electrical Power300 W1.8 kW
Rotor Diameter/Height1.24 m/–2 m/2 m
Rotation AxisVertical AxisVertical Axis
Rated Wind Speed13.5 m/s12 m/s
ModelDS-300EXAME

4.1. Smart-House Scenario

The configuration of the smart-house topology is set to 10 m × 10 m, where the server is located 10 m away from the renewable energy system (WT/PV). Three technologies are considered to build the communication network model: Ethernet, WiFi, and ZigBee. In the Ethernet-based architecture, all sensor nodes are connected to the DCU using dedicated wired communication links in a star configuration as shown in Figure 6a. In this configuration, Ethernet links are used to connect the sensor nodes and the DCU (Ethernet switch). The same link capacity is used between the DCU and the server.
Figure 6. (a) Ethernet star network architecture; (b) WiFi infrastructure mode architecture; (c) ZigBee star network architecture.
Energies 08 08716 g006
For the WiFi-based architecture, two different topologies are considered, with and without access point (AP). With an AP configuration, all sensor nodes are configured to send the sensing data to the AP, and then the AP relays the traffic to the server wirelessly as shown in Figure 6b. In the second configuration, without an AP, all sensor data are directly connected to the server. In the case of ZigBee-based architecture, the network configuration is similar to the Wi-Fi-based architecture without AP. The ZigBee network consists of two different devices, a coordinator node, and many end devices, as shown in Figure 6c. We configured the ZigBee network architecture as a star topology, which has the advantages of simple operation and lower power consumption for the sensor node battery compared with a mesh topology.
Figure 7 shows the communication network architecture of small-scale standalone WT and PV system.
Figure 7. Communication network architecture of small-scale renewable energy systems for a smart-house in OPNET. (a) Ethernet; (b) WiFi; (c) ZigBee.
Energies 08 08716 g007
Table 8. Node model used in OPNET simulation.
NameEthernetWiFiZigBee
Sensor Nodeethernet_wkstn_advwlan_wkstn_advZigbee_End_Device
Data Collection Unitethernet16_switchwlan_ethernet_slip4_advZigbee_Coordinator
Local Controllerethernet_serverwlan_server model
The detailed OPNET nodal model used to build the communication network is given in Table 8. We validated our simulation models by measuring the amount of received traffic at the server. For Ethernet-based architecture, Figure 8a shows a sample of the received traffic at the control center server from different sensors. The amount of traffic received at the server agrees with our calculation given in Table 5. For ZigBee-based architecture, the total traffic received at the ZigBee coordinator agrees with our calculation of approximately 1.968 kbps and 11.616 kbps for WT and PV system, respectively, as shown in Figure 8b,c. All received traffic is consistent with our calculations.
For the smart-house scenario, Figure 9 and Figure 10 show the average ETE delay for the standalone WT and PV system, respectively, using three different communication technologies, Ethernet-based (a), WiFi-based (b), and ZigBee-based (c). The difference in total ETE delay between the WT and the PV system reflects the amount of transmitted data. Based on these results, fast Ethernet communication links represent the lowest delay, which is approximately 0.0398 ms in the case of a WT and 0.0428 ms for the PV system. The ZigBee-based architecture has the highest delay, 3.14 ms for the WT and 9.75 ms for the PV system.
Figure 8. Traffic received at the server. (a) Ethernet-based architecture for WT; (b) WiFi-based architecture for PV; (c) ZigBee-based architecture for both a WT and PV.
Energies 08 08716 g008
Figure 9. Average ETE delay for a small-scale WT. (a) Ethernet-based architecture; (b) WiFi-based architecture; (c) ZigBee-based architecture.
Energies 08 08716 g009
Figure 10. Average ETE delay for PV system. (a) Ethernet-based architecture; (b) WiFi-based architecture; (c) ZigBee-based architecture.
Energies 08 08716 g010

4.2. Smart-Building Scenario

Nowadays, many large buildings are integrating small-scale renewable energy sources such as solar or wind to produce some of their energy needs locally. In that case, the microgrid system represents a cheap and efficient solution compared with centralized power systems. In our model, it is the responsibility of the building to monitor, manage, and control the microgrid system. Communication infrastructure is an important component to enable real-time monitoring and control the operation of these systems. In a real scenario, there are different communication networks inside the building that are used for different applications. For example, one network is used for building automation systems such as building security, fire, and safety. Another network is used for energy management and grid integration systems. Other applications such as voice, video, and data can be managed by building management information technology networks [14]. Each network is separate from the others and has its own devices and protocols.
We considered renewable energy systems (WTs and PVs) that are integrated with the building and can be operated either in a grid-connected mode or island mode. Each building can include small WTs and PV units mounted on the rooftop. The OPNET model of the communication network architecture for integrating the renewable energy systems with the building is shown in Figure 11a. For the smart-building scenario, The communication network is considered based on reference [13] for a high-rise residential building in Seoul, South Korea. Two scenarios are considered: one-level dedicated network architecture and two-level shared network architecture. Wired-based and wireless-based architectures have been considered for a building with a height of 50 m. For the one-level dedicated network architecture, a data collection unit collects monitoring data from renewable energy systems through a wired/wireless system where the server is located in the center of level 1. For the two-level shared network architecture, a data collection unit in level 1 collects monitoring data from renewable energy systems and then a shared link is used to connect between the DCU and the control center server. Different scenarios are configured, simulated, and compared with respect to ETE delay. The renewable energy systems are located in an area of 100 m × 100 m. The number of renewable energy systems considered is 4 WTs, 6 WTs, 4 PVs, and 6 PVs. The next section explains the results of two architectures that have been studied for the smart-building scenario: one-level dedicated network architecture and two-level shared network architecture.
To validate the network model, we compared the calculated data transmission from the renewable energy systems with the amount of received traffic at the server. In Figure 12a, considering the case of 4 WTs as an example, the calculated sensing data for one wind speed sensor is 6 bytes/sec, thus the total received data from 4WTs is 24 bytes/s. The same results are verified for sensor nodes of humidity, power, and frequency. The total received sensing data in the case of ZigBee-based architecture is 7872 bytes/s for WTs, as shown in Figure 12b.
Figure 13 shows the average ETE delay for the smart-building scenario. Taking four WTs as an example, it can be observed that the maximum delay in the case of Ethernet, WiFi, and ZigBee is 0.55 ms, 0.485 ms, and 4.98 ms, respectively. Table 9 lists the average ETE delay for the smart-building with the one-level dedicated network architecture scenario.
Figure 11. Network model for the smart-building (a) one-level wired network architecture; (b) Two-level Ethernet-based network architecture for the integration of PV systems.
Energies 08 08716 g011
Figure 12. Received traffic at the server for small WTs in the smart-building scenario. (a) Ethernet-based architecture; (b) ZigBee-based architecture.
Energies 08 08716 g012
Figure 13. Average ETE delay for the smart-building scenario. (a) Four WTs; (b) Six PVs.
Energies 08 08716 g013
Table 9. Simulation results of the smart-building. (one-level network architecture).
Number of UnitsNetwork TechnologyAverage ETE Delay
4 WTEthernet (10 Mbps)0.550 ms
6 WT0.553 ms
4 PV0.595 ms
6 PV0.5988 ms
4 WTWiFi (54 Mbps)0.485 ms
6 WT0.522 ms
4 PV0.497 ms
6 PV0.531 ms
4 WTZigBee (250 kbps)4.98 ms
6 WT5.74 ms
4 PV13.35 ms
6 PV20.30 ms
Figure 11b shows the two-level communication network architecture for the smart-building. The communication medium used to connect among the WTs/PVs in our simulation is 10BaseT. The maximum cable length between the DCU and the renewable energy system is approximately 100 m. Two scenarios are considered, with and without background traffic. The background traffic is used to represent the shared medium when there is other traffic such as the building automation network or building energy management network. The average ETE delay with different percentages of background traffic is shown in Figure 14. The amount of background traffic is configured in the link between the server and the DCU (level 2) as 50% (5 Mbps) and 75% (7.5 Mbps). It can be observed from the simulation results that the Ethernet delay increases as the background traffic increases. The details of average ETE delay for different scenarios are given in Table 10.
Figure 14. (a) Average ETE delay of Ethernet-based architecture for four WTs; (b) Average ETE delay of Ethernet-based architecture for four PVs.
Energies 08 08716 g014
Table 10. Average ETE delay (ms) of Ethernet-based architecture for the smart-building. (two-level network architecture, server is 50 m away).
Number of UnitsNetwork TechnologyBackground Traffic
0%50%75%
4 WTEthernet (10 Mbps)0.552 ms0.737 ms1.070 ms
6 WT0.554 ms0.738 ms1.082 ms
4 PV0.596 ms0.747 ms1.039 ms
6 PV0.599 ms0.757 ms1.071 ms

4.3. Reliability

In this work, the reliability is used as a measure to show how reliable the communication network during data transmission. We define the reliability as the ratio of bits of data successfully received to bits of data transmitted [26,27] as shown in Equation (2).
Reliability =   Successfully received data in bits Transmitted data in bits
Table 11 shows the reliability results for the smart-house and the smart-building scenarios. Reliability with 100% means the communication network is reliable and all transmitted data received successfully. In OPNET Modeler, the simulation results of received data show that the reliability is 100% for Ethernet-based and WiFi-based architectures. In case of ZigBee-based architecture, the reliability of the smart-house scenario was 100%. However, the reliability was decreased with increasing the number of monitored PV units due to data drop. For example, the network reliability for ZigBee-based architecture in smart-building scenario is about 99.9827%. The retransmission of data drop will improve the system reliability but the delay will be increased.
Table 11. Reliability results for smart-house and smart-building scenarios.
TechnologyScenarioReliability
EthernetSmart-houseWT100%
PV
Smart-building4WT100%
6WT
4PV
6PV
WiFiSmart-houseWT100%
PV
Smart-building4WT100%
6WT
4PV
6PV
ZigBeeSmart-houseWT100%
PV
Smart-building4WT100%
6WT100%
4PV100%
6PV99.9956%
8PV99.9827%

4.4. Network Cost

The communication network cost can be divided into two parts: cost of active devices (chip module, network switches and routers) and cost of passive components (network cables) [18,26]. The total cost of communication network can be calculated based on Equation (3).
C T o t a l = C A c t i v e + C P a s s i v e
where, CActive and CPassive represent the costs of active devices and passive components, respectively. Equations (4)–(6) show the total network cost for Ethernet-based (CEthernet), WiFi-based (CWiFi) and ZigBee-based (CZigBee) architectures, where, CCM, CESW, CCable, and CAP represent the costs of chip module, Ethernet switch, network cable and access point, respectively. For example, the total network cost for Ethernet-based architectures represents the equipment cost of the Ethernet switch and the costs of network cables.
C E t h e r n e t = C C M + C E S W + C C a b l e
C W i F i = C C M + C A P
C Z i g B e e = C C M
Table 12 shows the implementation cost for different communication technologies scenarios based on [26]. Compared with Zigbee-based architecture, extra network cables are needed in Ethernet-based architecture. Also, an AP can be used to extend the network range in case of WiFi-based architecture.
Table 12. Implementation cost for different communication technologies scenarios.
TechnologyActive devicesPassive components
Chip costESW/APCable cost
Ethernet~$1–$13 per unit~$20–$50 (ESW)~$1 per meter
WiFi~$3–$20 per unit~$20–$50 (AP)$0
ZigBee~$2.75–$3.5 per unit$0$0

5. Conclusions

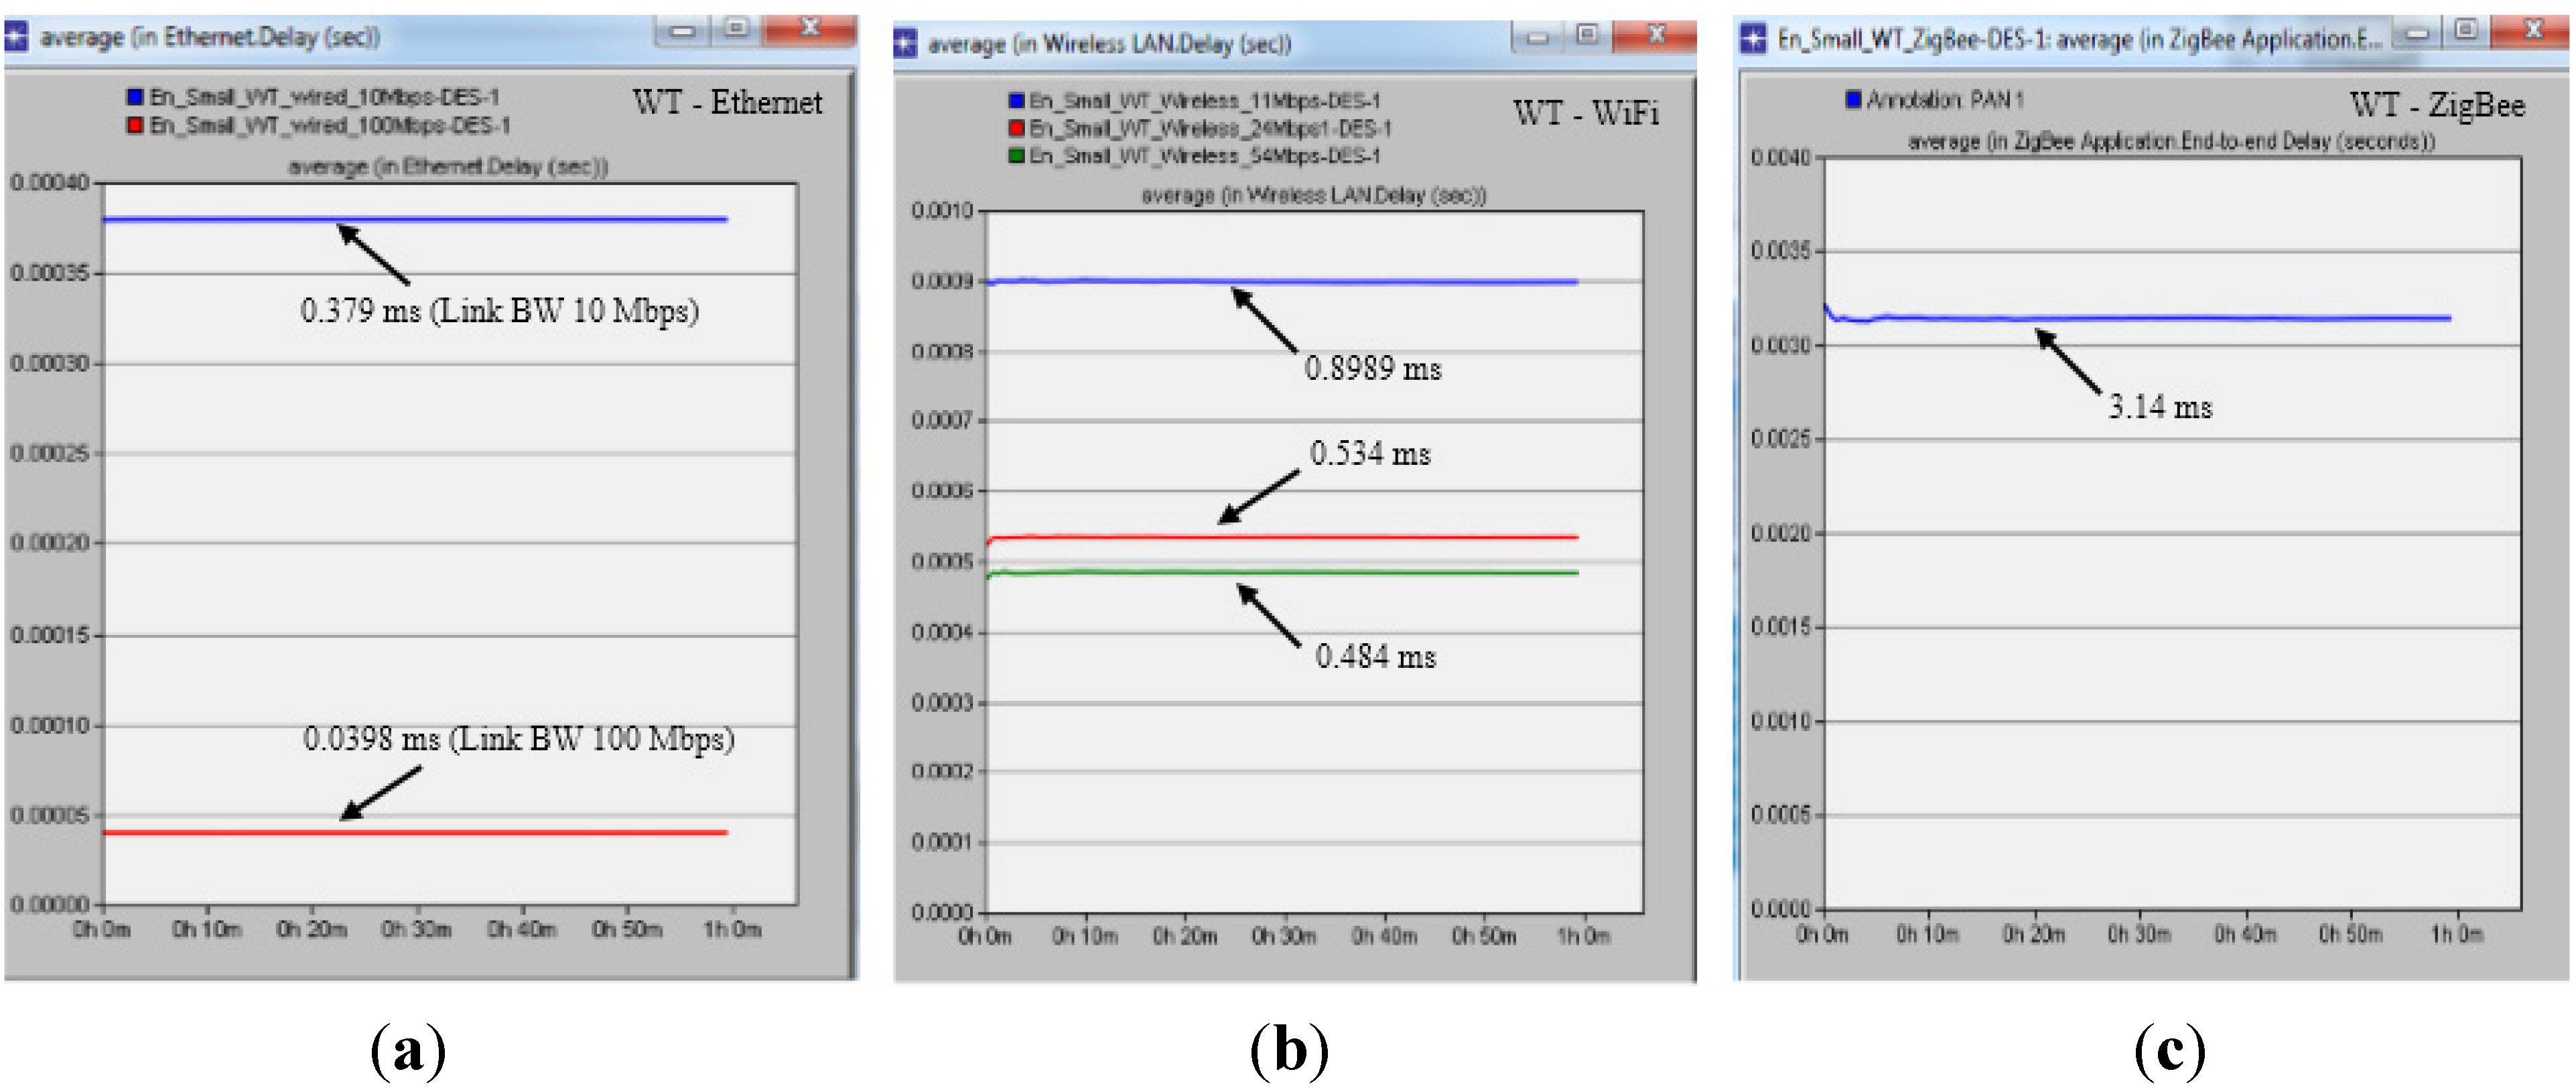
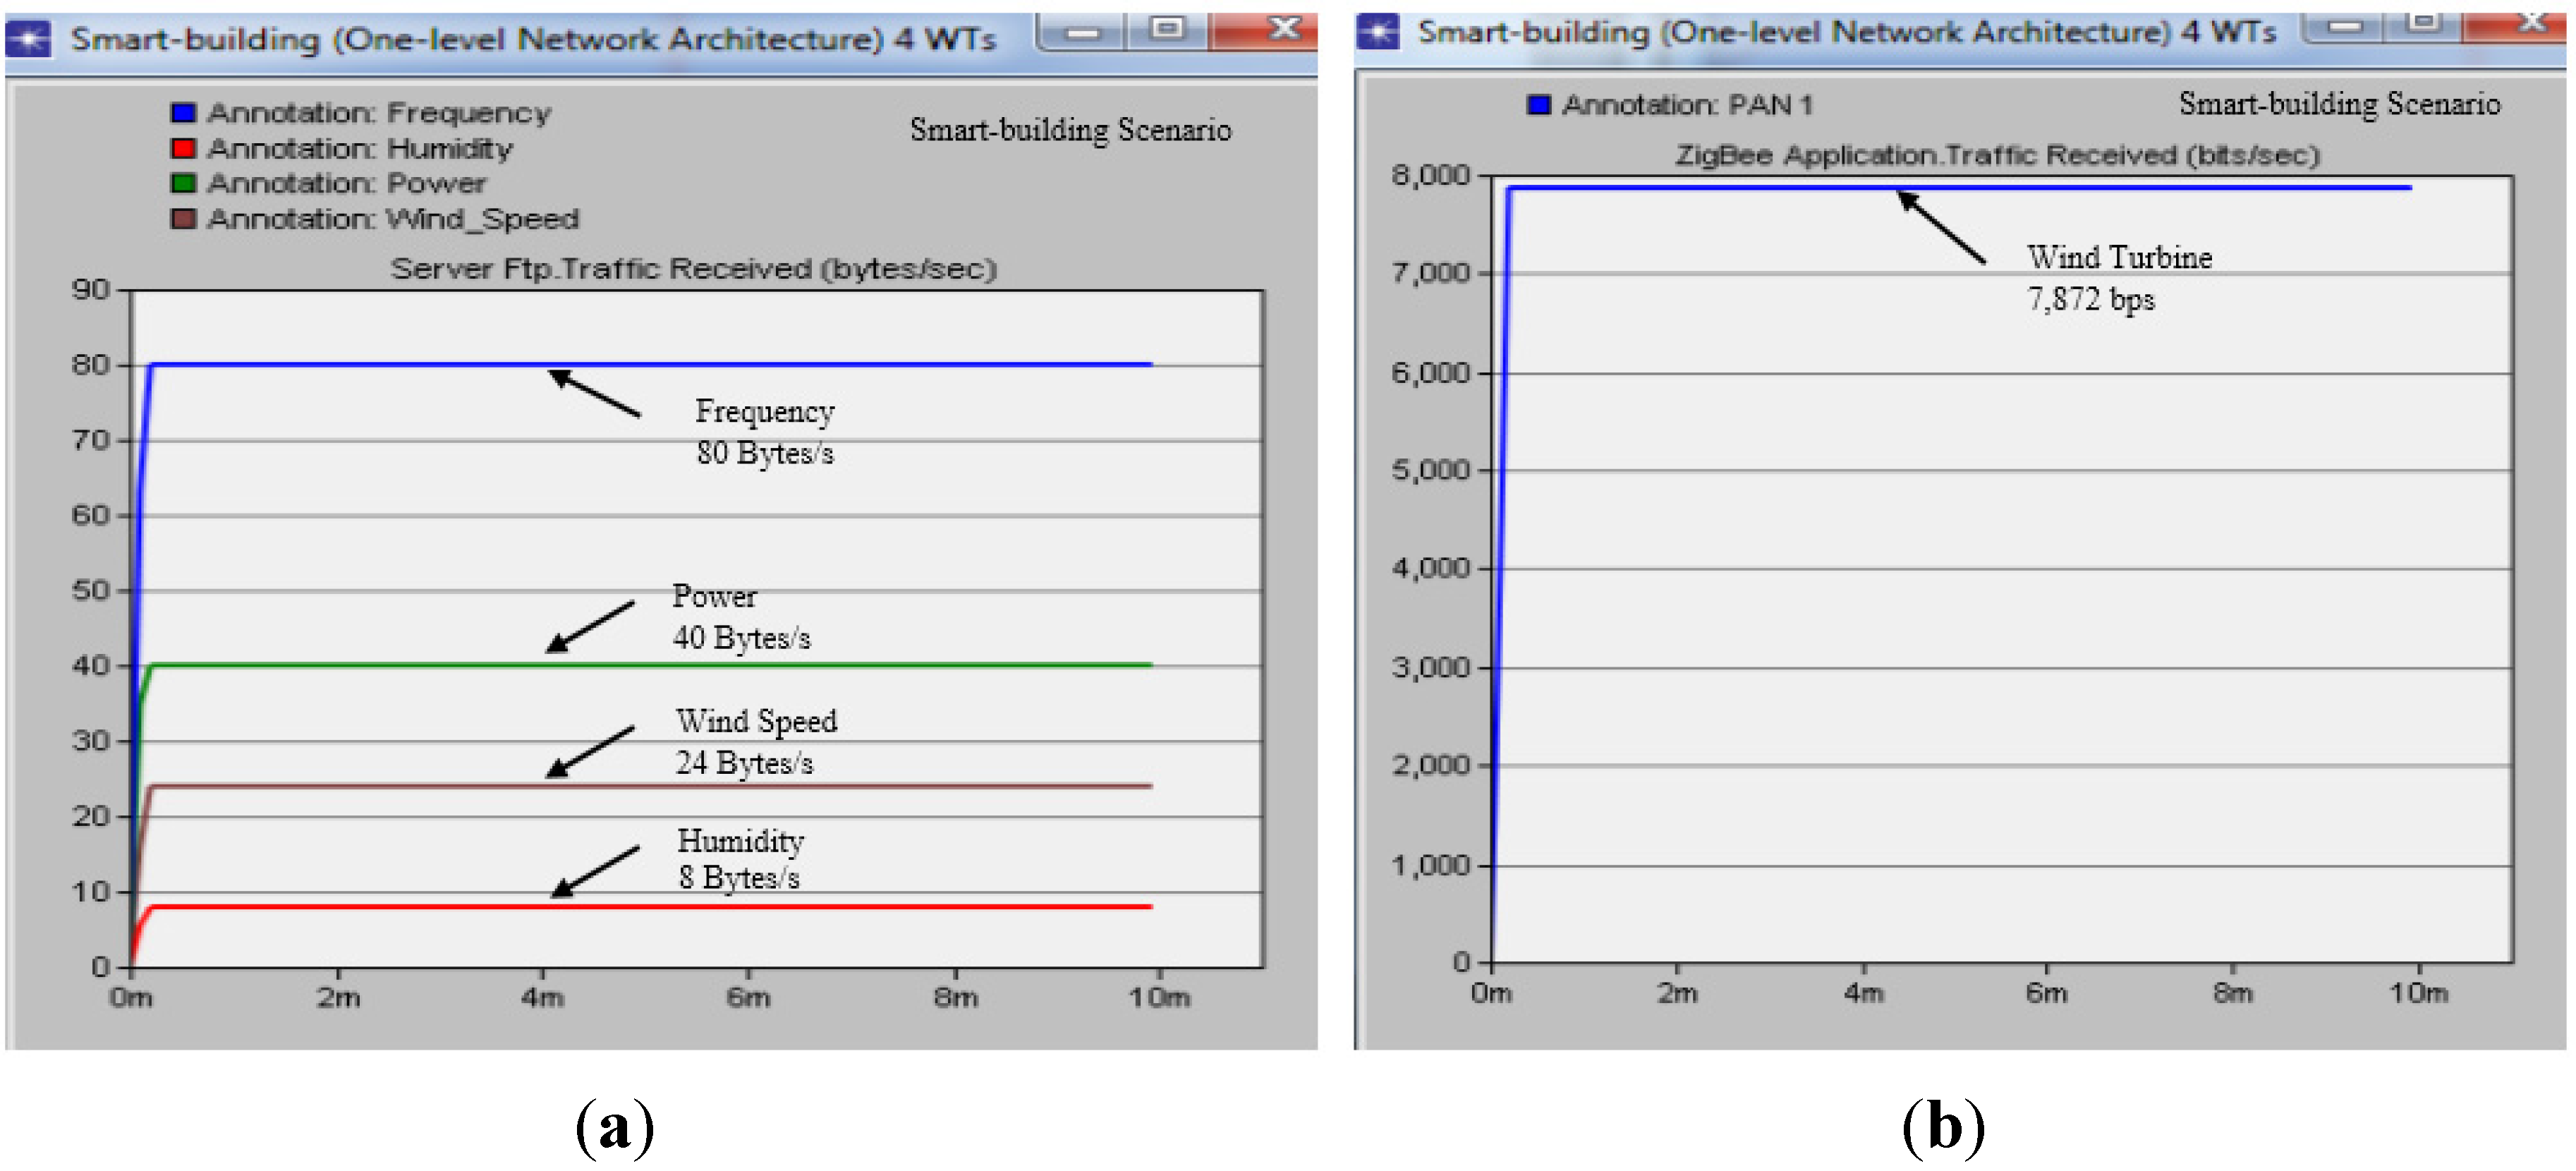
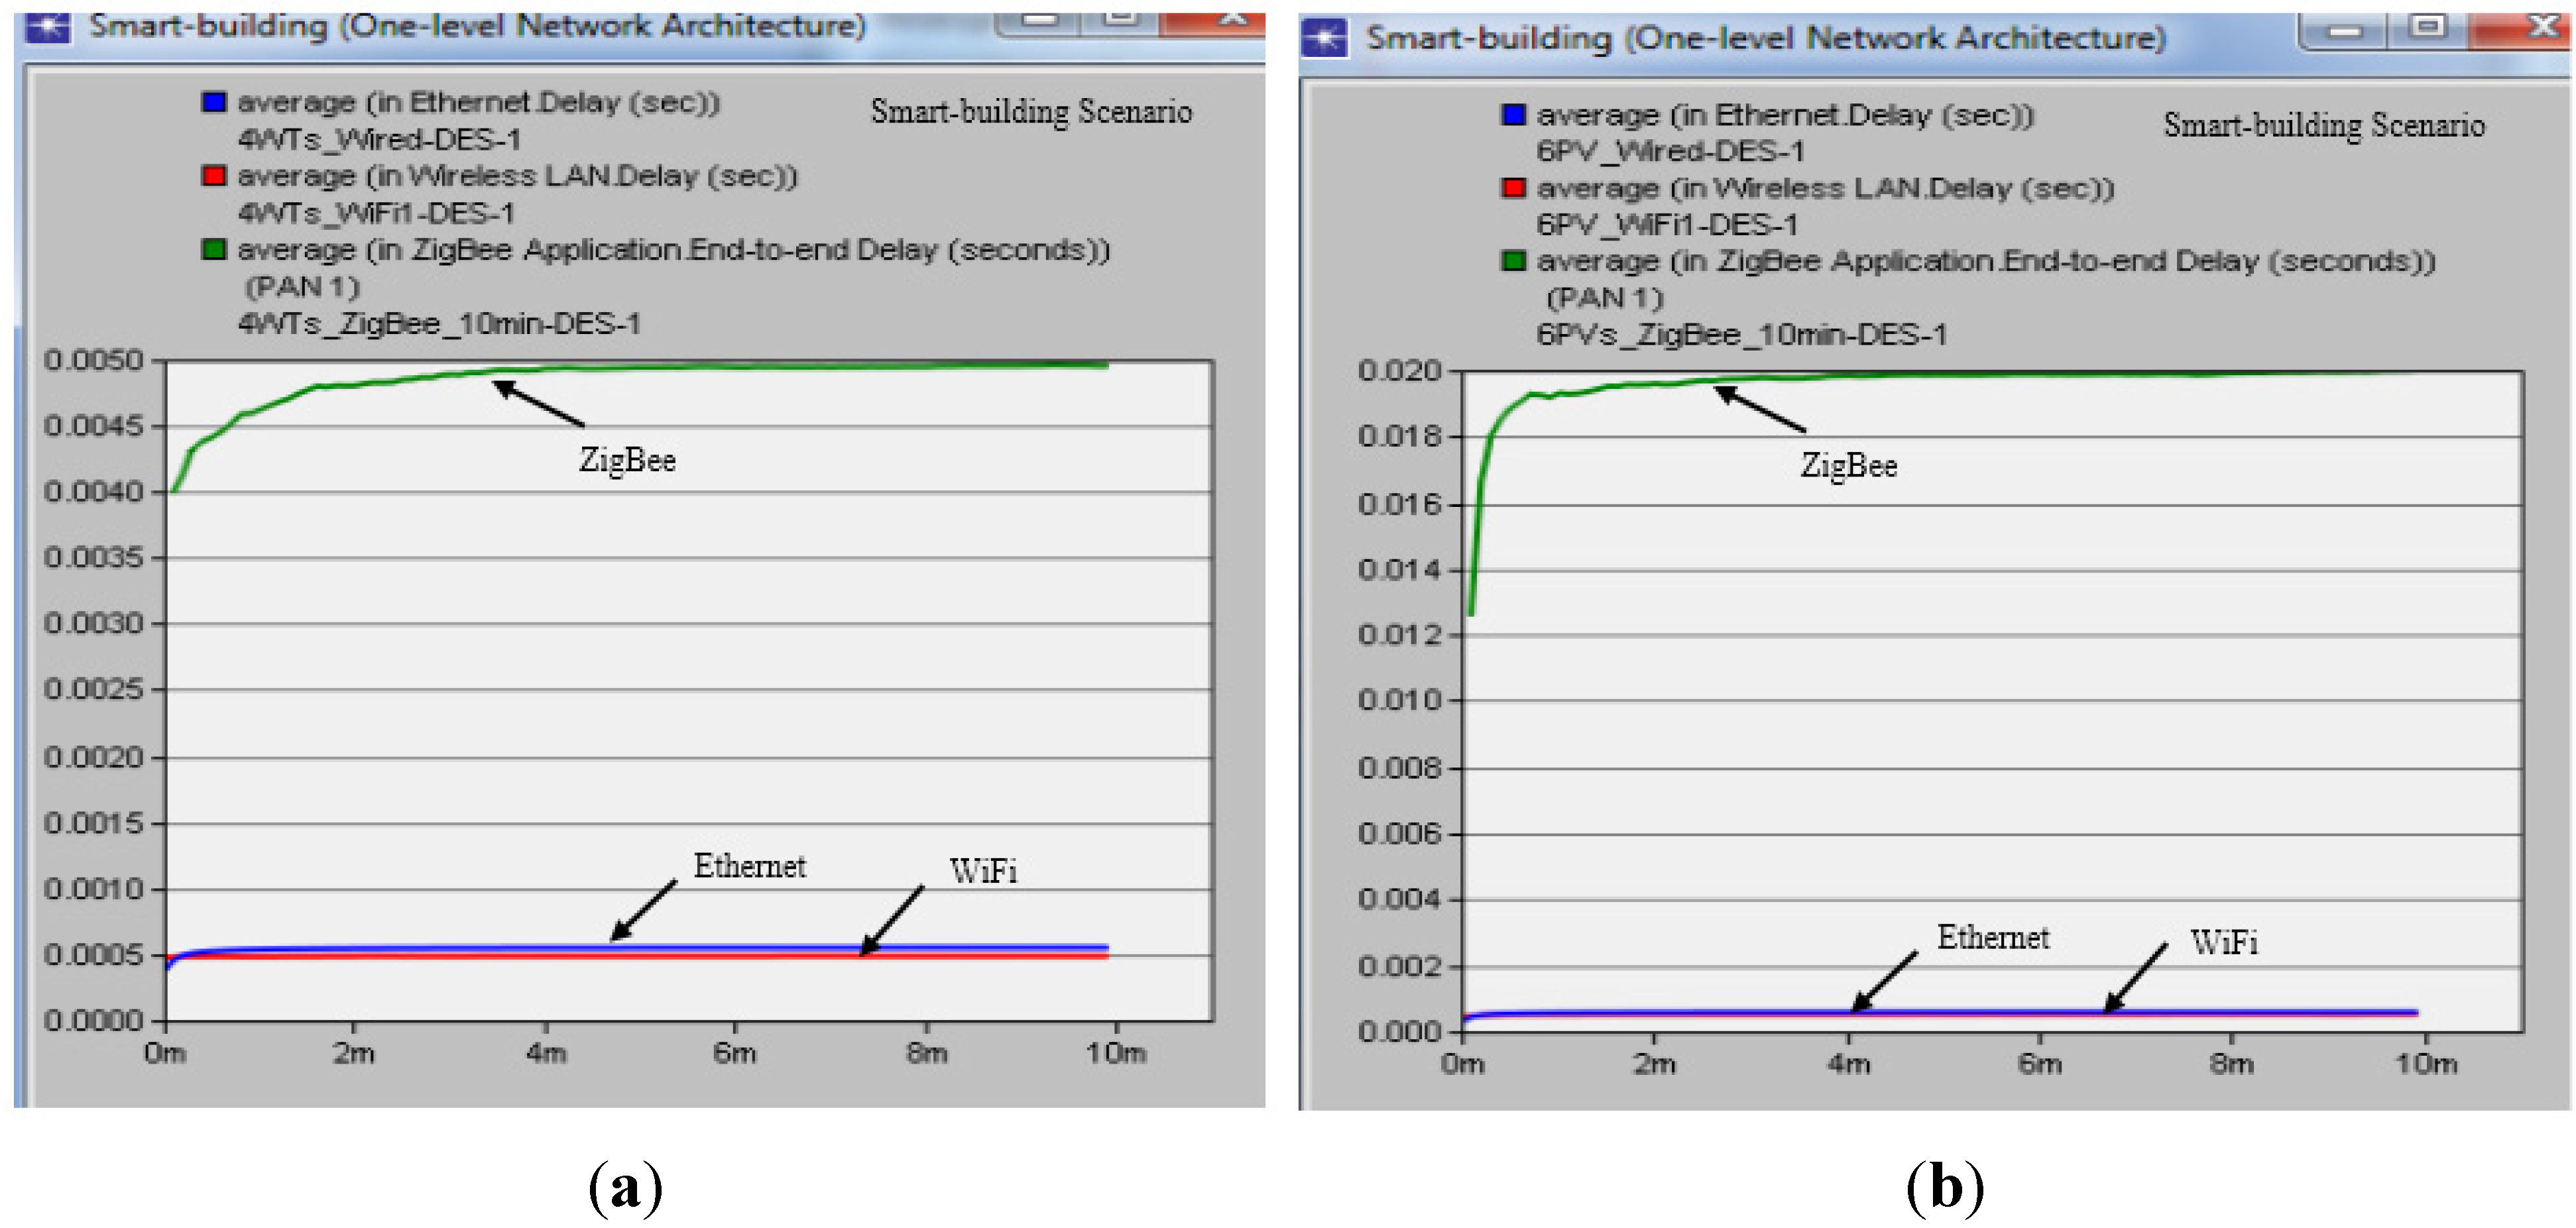
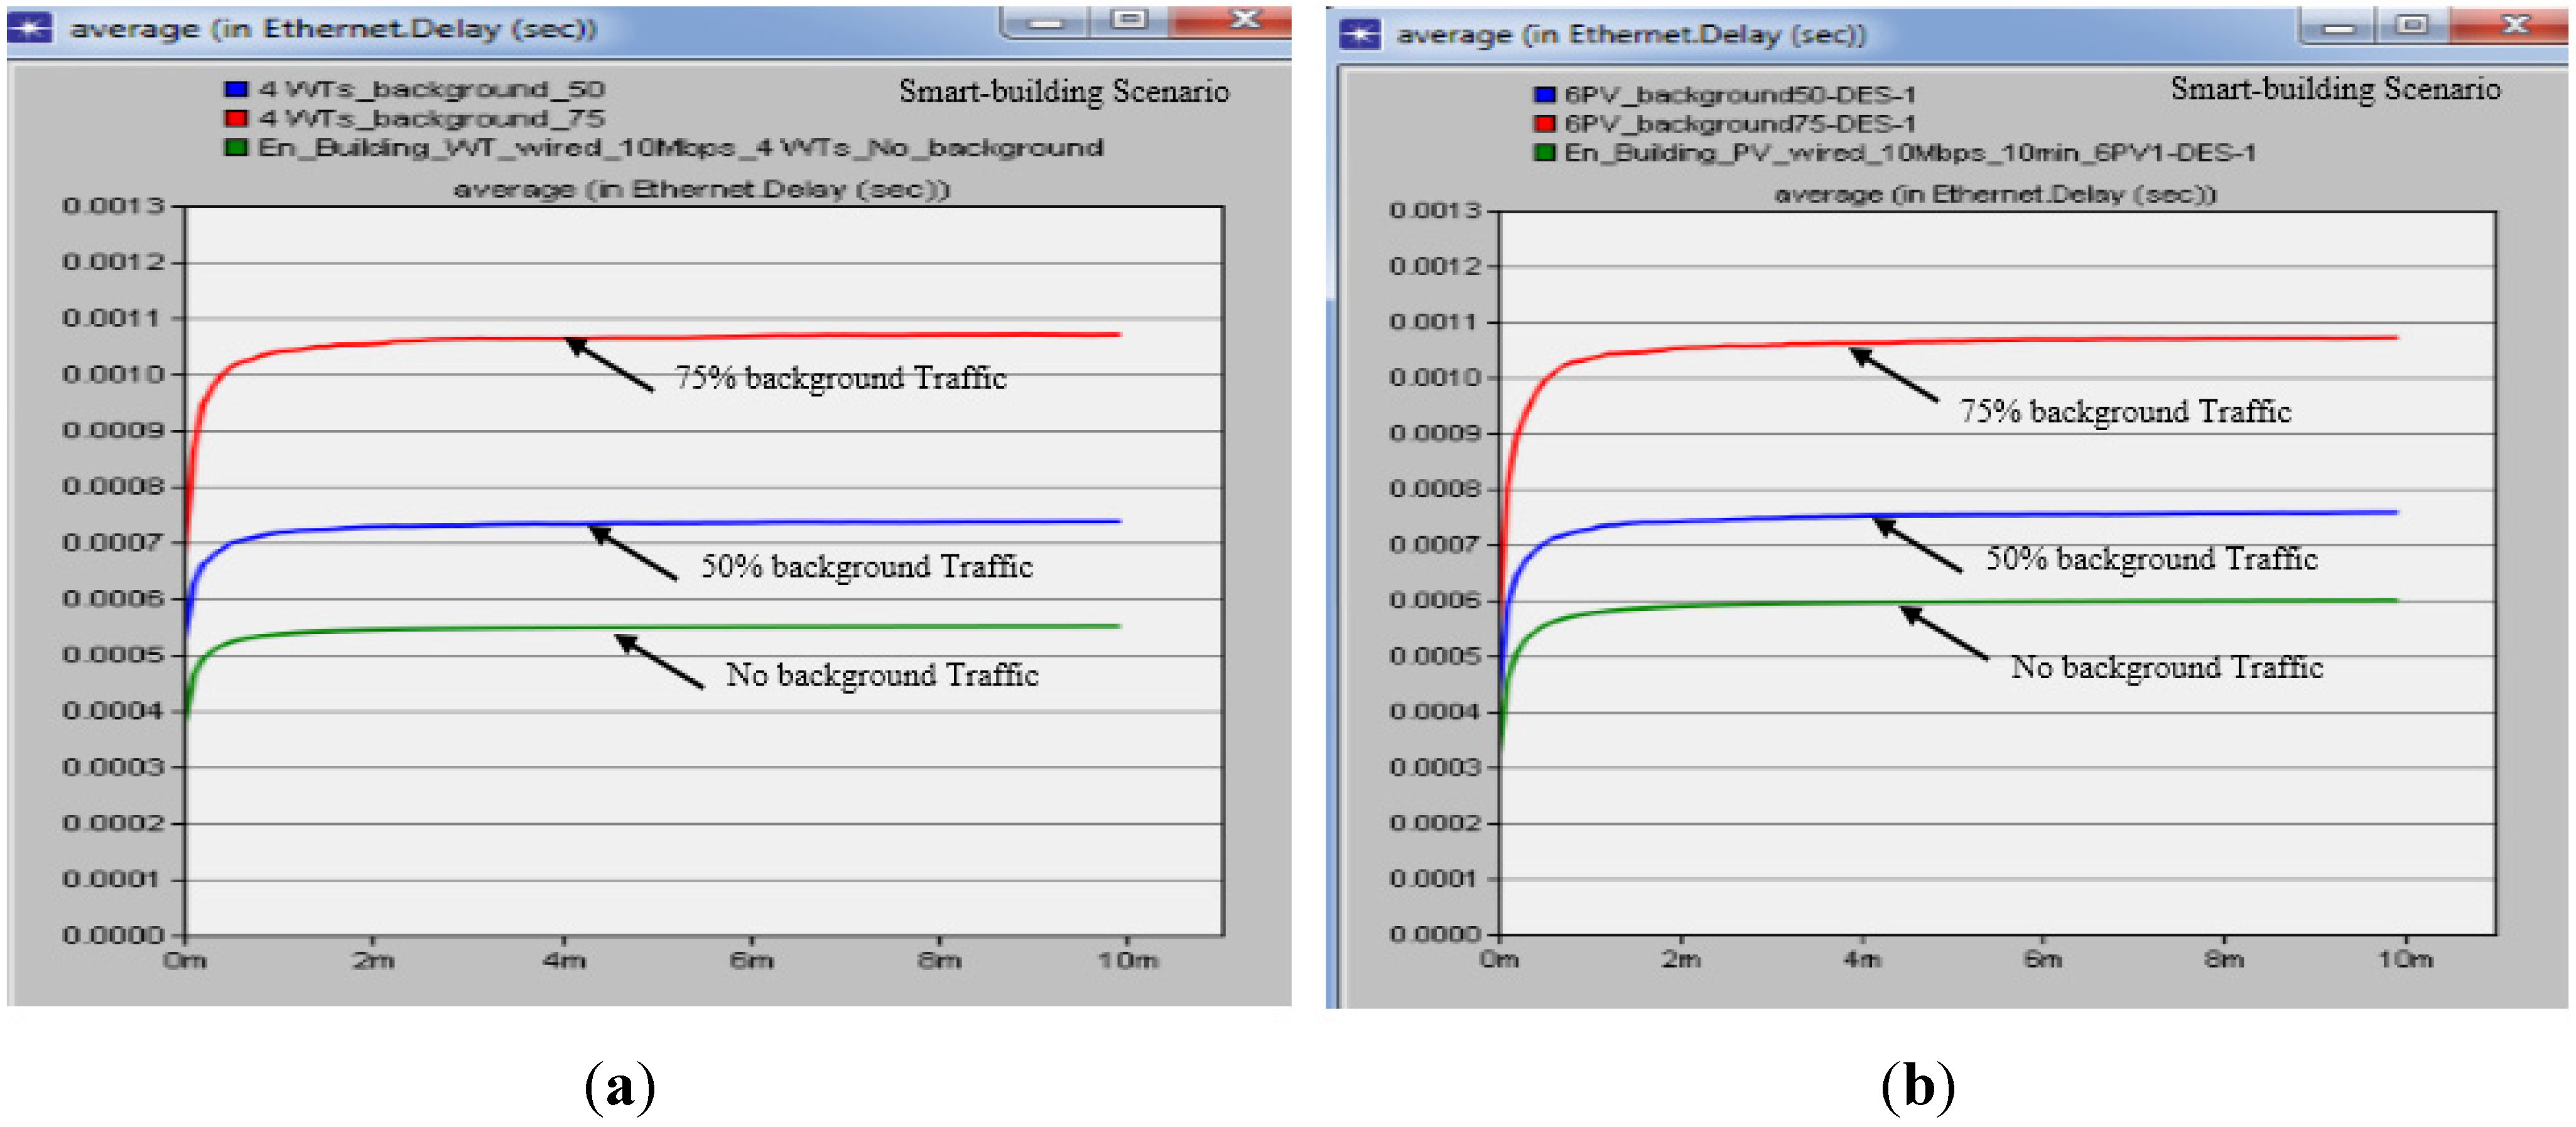
In this paper, we proposed three alternative communication network architectures for monitoring the behavior of small-scale renewable energy system with small WTs and PVs. We defined the measurement requirements, traffic profile, and data packet size of renewable energy systems according to the IEC standard. We also explored network architectures and topologies using both wireless and wired technologies. The proposed communication network architectures were modeled and simulated by an OPNET Modeler. Our simulator was validated by comparing the amount of received traffic at the server with results of numerical analysis. Two scenarios were considered: a smart-house and a smart-building.
For the smart-house scenario, we observed that the average ETE delay for the PV system was approximately 0.409 ms, 0.476 ms, and 9.75 ms for Ethernet (10 Mbps), WiFi (54 Mbps) and ZigBee (250 kbps), respectively. Simulation results of the proposed architectures were within the upper boundary of 4 ms required for power system protection except for the ZigBee-based architecture. For the smart-building scenario, the average ETE delay for the four PV systems was approximately 0.595 ms, 0.497 ms, and 13.35 ms for Ethernet (10 Mbps), WiFi (54 Mbps), and ZigBee (250 kbps), respectively. For the Ethernet-based architectures under background traffic, the average ETE delay was approximately 0.747 ms and 1.039 ms for background of 50% and 75%, respectively. Also, the simulation results of the smart-building were within the upper boundary of 4 ms. Reliability results were higher than 98%, which conform the three communication technologies as suitable candidates for monitoring small-scale renewable energy system in the customer premises domain. The main contribution of this work is the development of a cost-effective and efficient communication network for monitoring and controlling small-scale renewable energy systems. The results highlight the performance of different information and communication technologies for small-scale renewable energy installations. Future work aims to expand the network model for large-scale installations of renewable energy systems with different technologies.

Acknowledgments

This work was supported by the National Research Foundation of Korea (NRF) funded by the Korea government (MSIP) (No. 2010-0028509).

Author Contributions

All the authors contributed to publish this paper. Mohamed A. Ahmed, Young-Chon Kim, and Yong Cheol Kang mainly proposed the scheme of this paper. Mohamed A. Ahmed has carried out the simulation and Young-Chon Kim has checked the simulation results. Writing was done by Mohamed A. Ahmed, Young-Chon Kim, and Yong Cheol Kang. Final review was done by Mohamed A. Ahmed, Young-Chon Kim, and Yong Cheol Kang.

Conflicts of Interest

The authors declare no conflict of interest.

References

  1. Bacha, S.; Picault, D.; Burger, B.; Etxeberria-Otadui, I.; Martins, J. Photovoltaics in microgrids: An overview of grid integration and energy management aspects. Ind. Electron. Mag. IEEE 2015, 9, 33–46. [Google Scholar] [CrossRef]
  2. Erol-Kantarci, M.; Kantarci, B.; Mouftah, H.T. Reliable overlay topology design for the smart microgrid network. Network IEEE 2011, 25, 38–43. [Google Scholar] [CrossRef]
  3. Gomez-Sanz, J.J.; Garcia-Rodriguez, S.; Cuartero-Soler, N.; Hernandez-Callejo, L. Reviewing microgrids from a multi-agent systems perspective. Energies 2014, 7, 3355–3382. [Google Scholar] [CrossRef]
  4. Liang, H.; Zhuang, W. Stochastic modeling and optimization in a microgrid: A survey. Energies 2014, 7, 2027–2050. [Google Scholar] [CrossRef]
  5. Yu, F.R.; Zhang, P.; Xiao, W.; Choudhury, P. Communication systems for grid integration of renewable energy resources. Network IEEE 2011, 25, 22–29. [Google Scholar] [CrossRef]
  6. Bouhafs, F.; Mackay, M.; Merabti, M. Links to the future: Communication requirements and challenges in the smart grid. Power Energy Mag. IEEE 2012, 10, 24–32. [Google Scholar] [CrossRef]
  7. Ambia, M.N.; Islam, M.K.; Shoeb, M.A.; Maruf, M.N.I.; Mohsin, A.S.M. An analysis & design on micro generation of a domestic solar-wind hybrid energy system for rural & remote areas-perspective Bangladesh. In Proceedings of the 2nd International Conference on Mechanical and Electronics Engineering (ICMEE), Kyoto, Japan, 1–3 August 2010; Volume 2, pp. 107–110.
  8. Fesli, U.; Bayir, R.; Ozer, M. Design and implementation of a domestic solar-wind hybrid energy system. In Proceedings of the International Conference on Electrical and Electronics Engineering (ELECO), Bursa, Turkey, 5–8 November 2009; Volume I, pp. 29–33.
  9. Sharafat, M.R.; Lopes, L.A.C. A distributed Ethernet-based communication network for actively controlled RETs in hybrid mini-grids. In Proceedings of the 24th Canadian Conference on Electrical and Computer Engineering (CCECE), Niagara Falls, ON, Canada, 8–11 May 2011; pp. 1019–1023.
  10. Rashidi, Y.; Moallem, M.; Vojdani, S. Wireless Zigbee system for performance monitoring of photovoltaic panels. In Proceedings of the 37th IEEE Photovoltaic Specialists Conference (PVSC), Seattle, WA, USA, 19–24 June 2011; pp. 3205–3207.
  11. Salas, P.; Guerrero, J.M.; Sureda, F. Mas Roig mini-grid: A renewable-energy-based rural islanded microgrid. In Proceedings of the IEEE International Energy Conference (ENERGYCON), Cavtat, Croatia, 13–16 May 2014; pp. 975–982.
  12. Kang, K.-Y.; Ahmed, M.A.; Kim, Y.-C. Implementation of condition monitoring and control system for small-scale wind turbines. In Proceedings of the 40th Annual Conference of the IEEE Industrial Electronics Society (IECON), Dallas, TX, USA, 29 October–1 November 2014; pp. 2122–2127.
  13. Park, S.-H.; Park, J.-H.; Park, J.-C.; Lee, E.-T. The performance of small wind power generation systems on super high-rise buildings. Int. J. Steel Struct. 2014, 14, 489–499. [Google Scholar] [CrossRef]
  14. Pan, J.; Jain, R.; Paul, S. A survey of energy efficiency in buildings and microgrids using networking technologies. IEEE Commun. Surv. Tutor. 2014, 16, 1709–1731. [Google Scholar] [CrossRef]
  15. Kuo, M.-T.; Lu, S.-D. Design and implementation of real-time intelligent control and structure based on multi-agent systems in microgrids. Energies 2013, 6, 6045–6059. [Google Scholar] [CrossRef]
  16. Zhu, X.; Han, X.; Qin, W.; Wang, P. Past, today and future development of micro-grids in China. Renew. Sustain. Energy Rev. 2015, 42, 1453–1463. [Google Scholar] [CrossRef]
  17. Justo, J.J.; Mwasilu, F.; Lee, J.; Jung, J.-W. AC-microgrids versus DC-microgrids with distributed energy resources: A review. Renew. Sustain. Energy Rev. 2013, 24, 387–405. [Google Scholar] [CrossRef]
  18. Shahraeini, M.; Javidi, M.H.; Ghazizadeh, M.S. Comparison between communication infrastructures of centralized and decentralized wide area measurement systems. IEEE Trans. Smart Grid. 2011, 2, 206–211. [Google Scholar] [CrossRef]
  19. Kuzlu, M.; Pipattanasomporn, M.; Rahman, S. Communication network requirements for major smart grid applications in HAN, NAN and WAN. Comput. Networks 2014, 67, 74–88. [Google Scholar] [CrossRef]
  20. Smart Grid Coordination Group: Smart Grid Reference Architecture; European Commission: Brussels, Belgium, 2012.
  21. IEC 61724:1998 Photovoltaic System Performance Monitoring-Guidelines for Measurement, Data Exchange and Analysis; Internationl Electrotechnical Commission: Brussels, Belgium, 1998.
  22. Commonwealth Wind Incentive Program: Micro Scale, Solicitation No. 2011-CWIPMS-04. Available online: http://images.masscec.com.s3.amazonaws.com/uploads/programdocs/CWIPMS-04_Solicitation.pdf (accessed on 1 June 2015).
  23. Petitfils, V. Setup and performance test of a small-scale vertical axis wind turbine. Master Thesis, Lund University, Lund, Sweden, 2011. [Google Scholar]
  24. Ahmed, M.A.; Kim, Y.-C. Communication networks of domestic small-scale renewable energy systems. In Proceedings of the 4th International Conference on Intelligent Systems Modelling Simulation (ISMS), Bangkok, Thailand, 29–31 January 2013; pp. 513–518.
  25. Wijetunge, S.; Gunawardana, U.; Liyanapathirana, R. Wireless sensor networks for structure health monitoring: Considerations for communication protocol design. In Proceedings of the 17th ICT International Conference on Telecommunication, Doha, Qatar, 4–7 April 2010; pp. 694–699.
  26. Bian, D.; Kuzlu, M.; Pipattanasomporn, M.; Rahman, S. Assessment of communication technologies for a home energy management system. In Proceedings of the Innovative Smart Grid Technologies Conference (ISGT), Washington, DC, USA, 19–22 February 2014; pp. 1–5.
  27. Sohraby, K.; Minoli, D.; Znati, T. Wireless Sensor Networks Technology, Protocols, and Applications; John Wiley & Sons, Inc.: Hoboken, NJ, USA, 2007; pp. 283–301. [Google Scholar]

