1. Introduction
In the wide area cellular network, the most energy-demanding element is a macro base station (BS) [
1]. According to [
2], up to 50 percent of the total operational expenditure (OPEX) of an operator is made by the energy consumption of radio BSs. This is because mobile operators for ensuring seamless signal coverage over national areas, which can have different morphology (rural, urban or suburban), must deploy large numbers of base station sites (BSSs). Average yearly consumption of single BSS is estimated at 25 MWh, and at present, the number of macro BSSs installed worldwide exceeds four million [
3]. The twofold increase in the number of installed macro BSSs was registered between 2007 and 2013 in developing regions, and the continuation of this trend is foreseen in the upcoming years.
Of the total number of installed macro BSSs in the developing regions of the world, in 2012 approximately 40% were off-grid BSSs lacking connection to the electricity grid [
4]. On the global level, most of these BSSs use standalone systems as a power supply based on a fuel (diesel) generator. In comparison with on-grid BSSs having a permanent connection to the electricity grid, the OPEX of the off-grid diesel powered BSSs can be ten times higher and on a yearly level equals approximately $3,000 [
3]. In addition, one diesel powered off-grid BSS emits in the atmosphere approximately 33.3 tons of carbon dioxide (CO
2) on a yearly level [
5].
These are the reasons why during the last few years a number of off-grid macro BSSs powered from renewable energy supply (RES) system have started to increase on the global level. For a power supply, such BSSs can harvest the energy of the sun, wind, hydrogen, biomass, earth heat or some combination of these renewable energies with or without micro-hydro and/or fossil fuel generators as a backup energy source. Due to the self-sustainable nature of these power supply sources, such BSSs are also called “green BSSs”. According to predictions, the yearly number of green BSS deployments will grow from 13,000 worldwide in 2012 to more than 84,000 by 2020 [
6]. Overall, during this period, more than 390,000 green BSSs are expected to be deployed globally. Hence, for many developing countries the 2012–2020 green BSS concept is seen as a means of providing a power supply to BSs located in remote areas [
7].
Implementation of green BSSs brings savings to cellular network operators in their OPEX and also makes a contribution to the low-carbon economy. The OPEX reductions are reflected in the partial or complete elimination of costs for expensive diesel fuel and its transport to the BSS location in order to run diesel generators. In addition, reduction of the CO
2 emissions through harvesting renewable energy for the cleaner generation of electric power used for powering BSSs is in line with the low-carbon economy concept [
8].
The main drawback of green BSS power supply systems is the instability of energy generation caused by variations in the intensity of some energy sources, such as wind or the sun. To ensure an uninterruptible power supply of such green BSSs, continuous monitoring of the quantities related to the operation of power supply systems is gaining the interest of cellular operators. Through such monitoring systems, operators can obtain relevant and timely information that is necessary for detecting causes of possible power supply disruptions or performance degradations. An example of such monitoring system with the capabilities of sensing quantities related to the power supply of green BSSs is presented in this paper. Developed monitoring system is based on the principles of wireless sensor networks. Monitoring results obtained through such system are presented for three real and fully operated BSSs with different BS configurations/technologies and renewable energy sources. Hence, the main contribution of this paper is the presentation of many useful data about power supply parameters of different green BSSs. In the case of powering those BSS with standalone systems based on a fuel generators, models indicating interdependence among average generator daily load and fuel consumption are proposed. This has allowed for an additional paper contribution, which can be found in the presentation of the OPEX savings and CO2 reductions incurred for each green BSS due to the transformation from fuel powered into the RES powered BSS.
The rest of the paper is organized as follows:
Section 2 presents an overview of the previous research activities in the area of improving cellular network energy efficiency with emphasis placed on RES solutions. A description of analyzed green BSSs dedicated to the technical characteristics of installed BS equipment, their micro-climate characteristics and the architecture of cellular network topology are presented in
Section 3. A detailed explanation of the developed monitoring system based on a wireless sensor network is given in
Section 4. The monitoring results for analyzed RES systems that were obtained are presented and discussed in
Section 5. Modeling interdependence among fuel consumption and generator load and savings in terms of the OPEX and CO
2 reductions due to the transformation of analyzed BSSs into green BSSs is presented in
Section 6. Additionally, analyses showing differences among capital expenditures (CAPEX) of the RES and fuel generator power supply system is presented in
Section 7. Finally, concluding remarks can be found in
Section 8.
2. Related Work
Reducing the energy consumption and CO
2 emissions of mobile cellular networks has recently gained the attention of mobile operators, academia and industry. It is expected that significant improvements in the energy-efficiency of cellular networks can be accomplished through approaches which must be jointly combined. Such approaches take into account: the dynamic management of wireless network resources through access points/BSs sleep modes or cell zooming techniques [
9,
10,
11], improvements in the energy-efficiency of BSs hardware [
12], a self-organizing network (SON) concept [
13] or the implementation of RES for powering BSSs [
14].
For providing continuous service, BSSs require safe, uninterruptible and long life power supply. Classification of the research problems and different demands that need to be satisfied in order to ensure uninterrupted power supply of green BSSs using RES have been presented in [
15]. Renewable energy sources are found to be very promising in satisfying such demands [
16]. This explains the significant amount of published research work in the area related to BSSs’ power supply solutions based on RES. Generally, such power supply solutions for green BSSs can be classified into two broad categories. The first category is an on-grid hybrid power supply system based on the combination of an electrical grid power supply and renewable energy sources such as the energy of sun or wind [
17]. Recent studies show that such systems can offer significant energy savings if a joint energy and communication cooperation approach will be implemented. Actually, in the [
18] and [
19] novel paradigm based on the transfer of energy between BSSs over the electrical grid is presented, where the grid can be considered as an energy reservoir with ideally infinite capacity which enables two-way energy transfer among distributed BSSs. Such a concept allows the one BSS that has excess of energy to compensate the other that has a deficit due to either lower generation of renewable energy or higher demand of the users connected to the BS.
However, the second category, classified as green off-grid BSSs, dominates in terms of practical implementation. For BSSs in this category, energy can be generated from a single renewable energy source or a combination of renewable energy sources with or without a fuel (diesel) generator as a backup power supply. Power supply control systems for standalone green BSSs powered solely from the energy of the sun or wind are discussed in [
20,
21,
22], respectively. In [
23,
24,
25], independent hybrid power supply systems, which combine the energy of the sun and wind generated from solar photovoltaic (PV) modules and wind turbines, are presented. Dimensioning PV panels and wind turbines together with their associated energy storage for practical realization of the LTE cellular access networks, which solely rely on renewable energy, is presented in [
26]. It is shown that with current PV and wind turbine technology, the size of the renewable energy power system is challenging, but the use of BS sleep modes can provide a significant reduction of the system size.
Additionally, a hybrid power supply system based on solar and hydrogen energy and used for powering remote BSSs is analyzed in [
27]. Results are obtained by means of the HOMER simulator [
28], which shows that fuel cell technology can compete with diesel generators in the case of limiting the annual hydrogen consumption, with more hydrogen refueling frequency during a given year. On the other hand, renewable energy harvested on the BSS is used to power communication equipment while storing the excess energy in batteries or capacitors. The combination of three different battery technologies as storage systems—lead-acid, Li-ion and redox-flow batteries—is investigated for the energy storage of BSS powered by PV/wind energy and a diesel generator as backup [
29]. Another innovative technology for energy storage presented in [
30] is based on water electrolyzer and a Polymer Electrolyte Membrane (PEM) hydrogen fuel cell integrated together with a solar panel and wind turbine. It is shown that such an energy storage system can replace the legacy lead acid batteries, which ensures that BS can work constantly off-grid with zero carbon emissions.
One of the most recent projects in the energy harvesting (EH) area is E-CROPS, dedicated to the development of a system-wide approach to using EH and smart energy management technologies in communication and mobile devices [
31]. As part of the E-CROPS project, authors in [
32] examined the role of transmit power levels in devices as a means to minimize the overall energy consumption per unit of data transmitted in the presence of noise and interference. It is shown that, depending on whether the receiver or the sender is used to mitigate for errors, the power level will influence the energy consumption per bit via both the power and the effective transmission time. In this context, authors in [
33] modeled cognitive users operating as secondary users of a cognitive channel. Using an on-off model of channel occupancy, the obtained results show that the duration of the sensing and the packet’s length can both be tuned to optimize the energy of cognitive users.
Hybrid power supply systems based on a fuel (diesel) generator as a backup source of energy are analyzed in [
34,
35,
36,
37,
38,
39]. In [
34], the authors propose a power supply system based on hybrid wind, solar and diesel energy, controlled with an intelligent controller, which as additional input parameters uses the weather conditions and the state of batteries. Through simulations, the authors in [
35,
36] show that a hybrid sun/wind/diesel powering system can reduce the diesel consumption of BSSs by 80 percent and CO
2 emissions by 90 percent on a yearly level. According to the comparison of investment and operating costs for standalone solar, wind, diesel or hybrid power supply systems of the same BSS, a diesel generator has the lowest investment and the highest operating and maintenance costs [
37,
38,
39]. Hence, each of the referenced works confirms that power supply systems based on fossil fuels are less cost-effective and environmentally worse solutions in comparison to RES. In addition, Faruk
et al. in [
7] show that hybrid PV/diesel generator systems have a higher reliability rate while a standalone PV system has a significantly better mean-time between failures, when compared with standalone power supply systems based on a fuel generator.
One of the first analyses that consider challenges for telecom operators, suppliers and standardization committees related to the remote control and monitoring of telecommunication power systems was found in [
40]. Work [
41] presents the integrated monitoring system of power supply and air conditioning equipment for 10,000 on-grid sites of mobile operators offering fixed and mobile services. In [
42], the authors present the concept of the centralized monitoring of a renewable power supply system that can be used for powering green BSSs. There are many proprietary commercial solutions for remote monitoring of the BSS power supply system, such as Huaweis NetEco [
43] or HMS Netbiter [
44].
Based on our knowledge, this is the first paper which presents comprehensive monitoring data of the RES systems, which were obtained during a period of one year from real green BSSs with different renewable power supply systems, BS types and corresponding configurations.
Furthermore, in this paper, for the first time, on/off powering of fuel generators and different approaches to the BSS air-conditioning have been studied, as means for the OPEX savings and CO2 reductions. An analysis is performed for a standalone BSS power supply system based on fuel generators working in different daily operating modes.
3. Cellular Network Topology
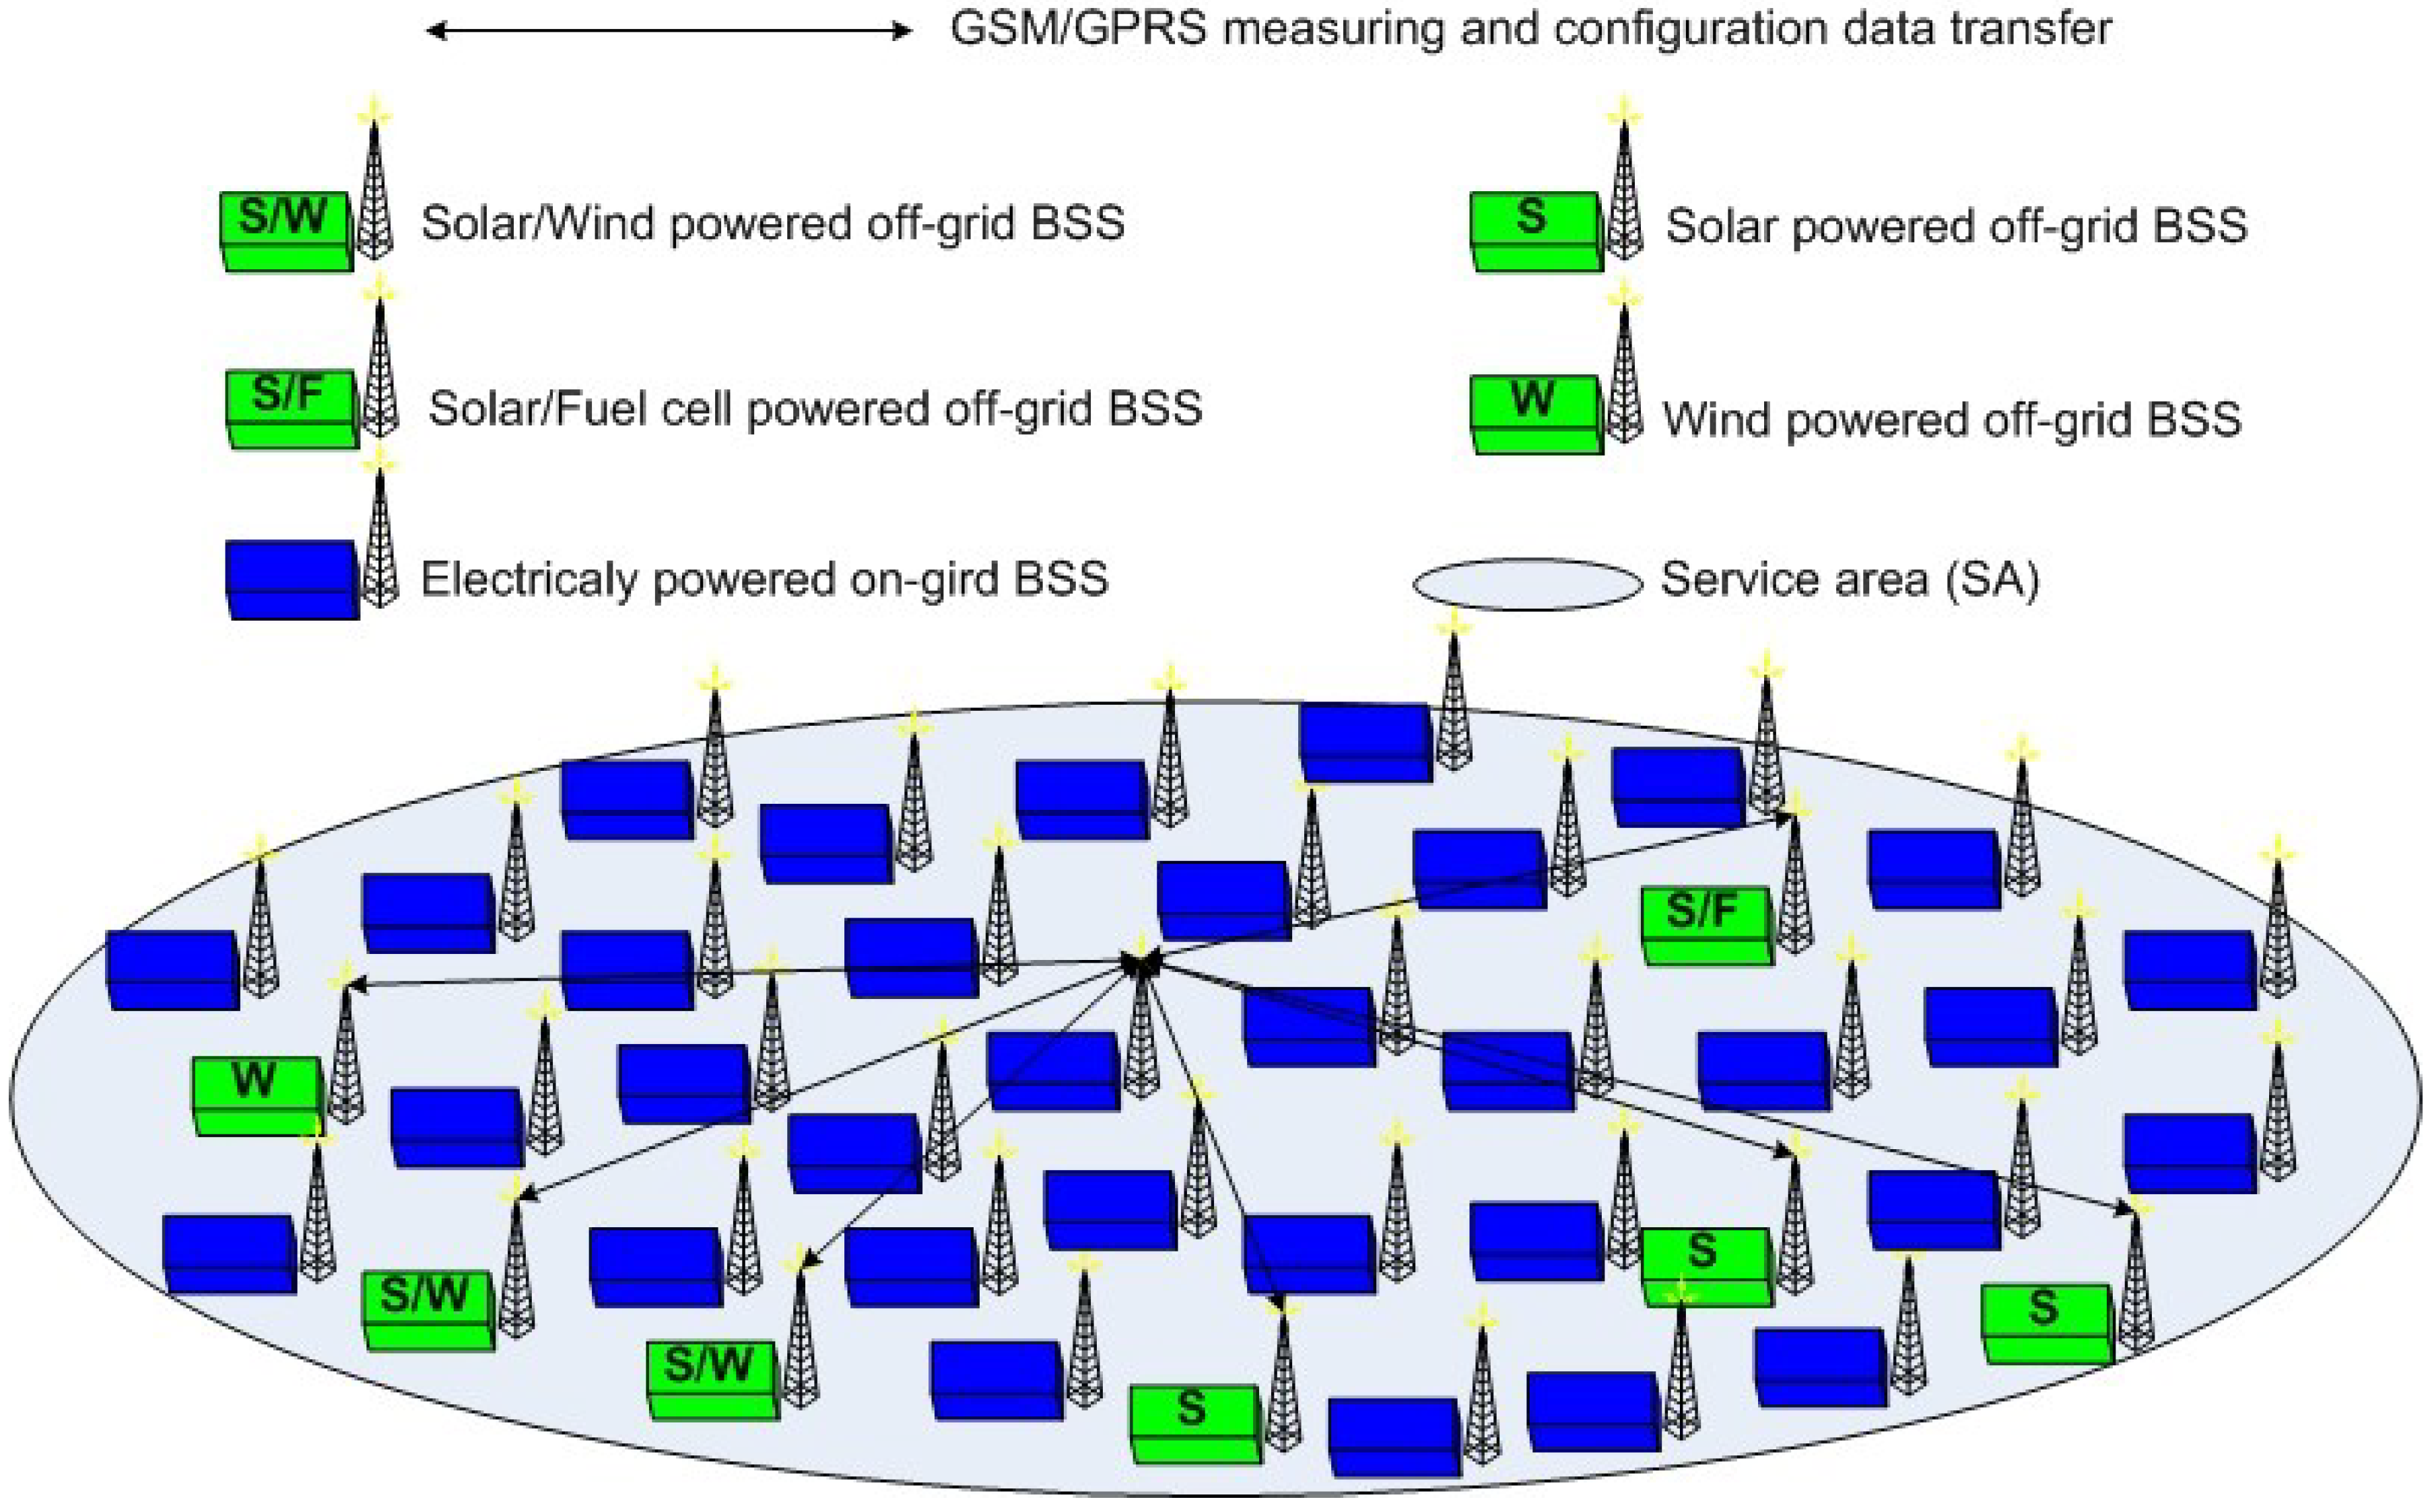
In accordance with the global trend dedicated to the transformation of diesel powered BSSs into green BSSs, a cellular network operator contains a number of green BSSs powered solely by the energy of the sun, wind, fuel cells or a combination of these energy sources. In order to ensure national coverage with a cellular signal, such off-grid green BSSs have been geographically dispersed along with on-grid BSSs. In
Figure 1, the logical topology of the radio part of the operator cellular network with mostly dominating on-grid BSSs has been illustrated. Most of the installed green BSSs have been powered solely by means of solar energy (S), while only a few BSSs have been powered by wind energy (W) or a hybrid power supply system based on a combination of solar and wind energy (S/W). In addition, in the testing phase is one BSS powered by a combination of solar and fuel cell (hydrogen) energy (S/F).
All green BSSs are located in rural areas and contain BSs of different technologies. As an example, three green BSSs will be selected for the verification and validation of real sensor networks that are deployed to monitor the performance of the power supply system (
Table 1). The first and second BSSs, namely sites A and B, are solar powered BSSs, while third analyzed BSS named site C is powered by hybrid solar/wind energy. Those BSSs are typical representatives of all mobile operator green BSSs. According to
Table 1, on all analyzed green BSSs installed BSs have configurations with low capacities, which result in the kind of lower power consumption that is suitable for powering those sites throughout the year from renewable energy sources.
Figure 1.
Allocation of on and off-grid base station sites (BSSs).
Figure 1.
Allocation of on and off-grid base station sites (BSSs).
Table 1.
Technical characteristics of analyzed BSSs.
Table 1.
Technical characteristics of analyzed BSSs.
| Parameter/BSS | A | B | C |
|---|
| Renewable energy source | sun | sun | sun & wind |
| Macro BS technology(s) | GSM/UMTS | GSM | GSM |
| Configuration | 2 × 4 | 2 × 2 | 2 × 2 × 2 |
| Numbered of sectors (RRUs) | 2 | 2 | 3 |
| Total number of active TRXs | 6 | 4 | 6 |
| Total number of voice channels | 16 | 16 | 24 |
| Battery power supply voltage (V) | 48 | 48 | 48 |
| Peak installed power of renewable energy source(s) (kW) | 4 | 4 | 4/1.3 (5.3) |
| Batteries capacity (Ah) | 1200 | 1200 | 1200 |
| Maximal BS power consumption (W) | 627/310 (937) | 427 | 627 |
| AC BS power supply (V/Hz) | 220/50 | 220/50 | 220/50 |
For the sake of confidentiality, information regarding the cellular operator name, locations of analyzed BSSs and models of BS installed on those sites will be omitted. However, technical parameters of BSs installed on each BSSs are given in
Table 1. GSM (Global System for Mobile Communications) and UMTS (Universal Mobile Telecommunications System) BSs installed on analyzed green BSSs consist of the Main Unit (MU) and one per sector Remote Radio Units (RRUs). The RRUs are installed near antenna elements and connected through fiber optical cable with the MU located inside the BSS equipment rack (
Figure 2). Since one RRU is used for covering one sector of BSS, the number of RRUs installed on the BSSs corresponds to the number of covered sectors (
Table 1). Each RRU contains a power amplifier (PA) as the most energy demanding and heat dissipating component of BSs. Due to such configuration, the temperature regulation inside container of each green BSS is based on natural air cooling (circulation), without the need for installation of a separate air conditioning device. For that reason, the total power consumption of green BSSs is significantly reduced, which additionally justifies the applicability of renewable energy sources as exclusive sources of power supply.
Figure 2.
Blok diagram of green BSS architecture with centralized monitoring system.
Figure 2.
Blok diagram of green BSS architecture with centralized monitoring system.
According to
Table 1, BSSs containing BSs of different configurations will have different maximal power consumptions. Higher power consumptions will be for BSs with stronger configurations in terms of the active number of transceivers (TRXs). Eight voice channels are allocated per each sector covered by the BS installed on the analyzed green BSSs (
Table 1). Based on the radio planning predictions, on a green BSS A, a macro BSs of two different technologies (GSM and UMTS) working in parallel has been collocated. On the other two green BSSs (B and C), only GSM macro BSs are installed. Meteorological characteristics of analyzed BSS locations are presented in
Table 2.
Table 2.
Meteorological characteristics of analyzed BSSs locations.
Table 2.
Meteorological characteristics of analyzed BSSs locations.
| Parameter/BSS | A | B | C |
|---|
| Average number of yearly sunny hours (h) | 2700 | 2600 | 2700 |
| Average yearly irradiation of horizontal surface (kWh/m2) | 1550 | 1500 | 1550 |
| Average temperature in January (°C) | 9 | 7.8 | 6.4 |
| Average temperature in August (°C) | 25 | 23.5 | 24.1 |
| Average yearly wind speed (m/s) | <2 | <2 | 6.4 |
Accordingly, it can be noticed that locations hosting green BSSs (A, B and C) have climates with mildly average temperatures in winter and summer months. Due to allocation in moderate climate zones, all analyzed green BSSs have a large number of average yearly sunny days. In addition, BSS C is in a geographical location with a convenient level of average yearly wind speed.
Taking into consideration the cognitions about the maximal power consumption (
Table 1) and the renewable energy potential (
Table 2) of each BSS, the estimation of necessary installed power generated from renewable energy sources is performed. Based on this estimation, on BSS A, B and C, two arrays of solar panels with a total of 4 kWp of nominal power are installed. The nominal power of each array equal to approximately 2 kWp is obtained through seven serially connected solar modules of 280 Wp. The technical data of solar modules installed on green BSSs in the case of 1000 W/m
2 irradiation and a temperature of 25 °C are presented in
Table 3. In addition, on the BSS C small wind turbine with a nominal power of 1.3 kWp is installed as an additional renewable energy source for this BSS (
Table 1). A datasheet of installed wind turbines is also presented in
Table 3. The estimated installed power of renewable energy sources should ensure an uninterrupted power supply of green macro BSSs throughout a year.
Table 3.
Technical data of solar modules and wind turbines installed on analyzed green BSSs.
Table 3.
Technical data of solar modules and wind turbines installed on analyzed green BSSs.
| Solar Module | Wind Turbine |
|---|
| Nominal power Pmpp (Wp) | ≥280 | Rated power output (kWp) | 1.3 |
| Voltage at nominal power Umpp (V) | 39.1 | Type | 3 blades, horizontal axis |
| Current at nominal power Impp (A) | 7.16 | Generator | Gearless, brushless, permanent magnet |
| Open-circuit voltage Uoc (V) | 48.1 | Swept area (m2) | 6.8 |
| Short-circuit current Isc (A) | 7.95 | Blade diameter (m) | 2.9 |
| Maximal system voltage (VDC) | 1000 | Voltage/phase rated power (Vac peak) | 125 |
| Maximal reverse current IR (A) | 20 | Current/Phase rated power (Aac peak) | 3.6 |
| Operating module temperature (°C) | −40 … + 85 | Rated wind Speed (m/s) | 11 |
| Module efficiency η (%) | 12.7 | Start-up wind speed (m/s) | 3 |
| Temperature coefficient of power (%/K) | −0.43 | RPM at rated Power (RPM) | 800 |
| Solar cells per module | 80 | Survival wind speed (m/s) | 45 |
| Module type | Polycrystalline | Survival RPM (RPM) | 1400 |
| Cell dimensions (mm) | 156 × 156 | Generator NEMA Rating | Class B, 2 HP |
| Module dimensions (mm) | 1685 × 1313 × 50 |
4. Architecture of the Sensor Network
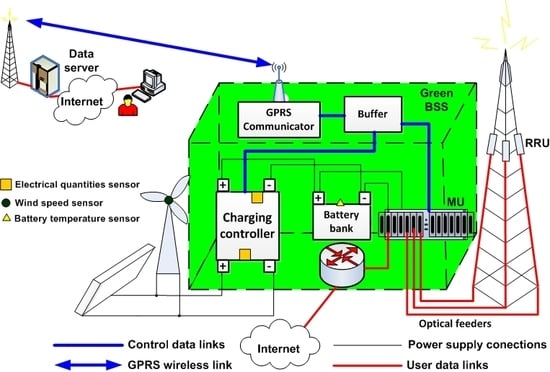
In order to monitor the real-time performance of green BSS power supply systems, a sensor network has been developed for each BSS. The sensor network combines different elements in the secure and reliable transfer of measuring information. Independently of the renewable power supply source, the typical architecture of each green BSS is illustrated in
Figure 2.
According to
Figure 2, each analyzed green BSS is composed of a container for equipment placement, BS elements (MU/RRU and optical feeders), antenna tower, battery bank, charging controller, solar modules and/or a wind turbine. Electricity generated by the BSS by harvesting renewable energy will be accumulated in batteries. In order to perform precise measurements and collect electrical (current, voltage, power consumption) and non-electrical (temperature, wind speed, humidity) quantities, a real sensor network as presented in
Figure 2 was deployed.
The sensor network architecture is composed of sensors that are used for the continuous detection and collection of these quantities. More specifically, for measuring temperature oscillations on the surface of batteries, temperature sensors are allocated directly on the battery bank (
Figure 2). In addition, the sensor installed near the wind turbine is used for sensing the wind speed. Further, for detecting electrical quantities such as battery voltage, battery charging/discharging current, produced/consumed energy,
etc. the sensors installed inside the charging controller are used. All sensing information is logged by the charging controller. Most of the higher class charging controllers (such as Morningstar Prostar [
45] or Xantex XW [
46]) can offer a proprietary web-based interface to the logged data for the purpose of post-processing and data visualization. However, our approach is based on the development of our own visualization and post-processing system of the logged data for all green BSSs. For that reason, sensed information is transferred through a wire Ethernet connection from the charging controller (sensors) to the buffering element installed on BSS (
Figure 2). Besides the buffering of logged data that is characteristic for the power supply system of BSSs, this buffering element is used for buffering other operational and critical information, such as alarms and warnings coming from BSs during its operation. Additionally, intermediate data storage buffering may perform specific activities such as consolidation or pre-processing of data and the filtering of un-required data.
The buffering element is connected through a wired Ethernet connection with a GSM/GPRS (General Packet Radio Service) data communicator (
Figure 2). The main task of this communicator is the wireless transport of logged data from BSSs to the centralized database server, which is used for the permanent storage of measured information (
Figure 1 and
Figure 2). Logged data is transferred over operators’ GPRS networks by means of TCP/IP protocol. A developed monitoring system enables access to the database server through a web-based interface. Hence, the collected data can be accessible from anywhere on the Internet, as long as a network connection to the server exists (
Figure 2).
A developed web-based interface enables the direct presentation of measured results in numerical and graphical form for every measured quantity of each green BSS. Hence, a developed database performs classification and separate storage of all measured and logged results for each green BSS. It is worth emphasizing that the implemented system currently enables simultaneous monitoring of collected information from many fully operated green BSSs. By selecting specific green BSSs through a web interface, for every of the monitored quantities, the developed system directly presents current values complemented with the possibility of post-processing visualization in the form of graphs on an hourly, daily, monthly or yearly basis.
For each BSS, on average six different parameters (such as battery voltage, charging/discharging current, battery temperature, produced/consumed energy, wind speed, indoor/outdoor temperature, humidity, etc.) can be instantaneously reached for the purpose of numerical and graphical presentation of the current and historical data. In this way, concurrent and/or correlated presentations of different quantities obtained from one or more BSSs can be performed. In the next section, the measured quantities related to the performance of the renewable power supply systems of green BSSs obtained through a developed centralized monitoring system are presented and discussed.
5. Results
Among the different quantities that can be detected by a developed monitoring system, in this section the monitoring results that consider battery voltage and charging/discharging current will be presented and discussed for each of the analyzed BSS. Only those results will be presented since they constitute the most important sensed quantities in terms of monitoring the power production/consumption process of each green BSS. By observing these processes, a developed sensor network can offer instantaneous and historical insight into all information related to the power supply system of specific green BSS. Therefore, a developed monitoring system can give real-time useful cognition to the cellular operator in terms of the satisfactory level of power delivery and the reasons for any possible equipment malfunctioning due to the lack of a large enough power supply. Additionally, through the post-processing of historical data, a cellular operator can predict the energy needs for future deployments of newer BS technologies. In addition, by means of data post-processing, an operator can also plan an extension of existing services through performance improvements of the power supply system.
A centralized monitoring system based on a sensor network described in the previous section is set up for collecting each of the sensing quantities every 15 min. This results in 96 sensed values for each monitored parameter in one day or 35,040 collected values per year in total. By taking into account the fact that the system concurrently monitors more than six different parameters for more than 20 green BSSs, the number of collected individual values on a yearly level exceeds 4,200,000 sensed values in total. It is reasonable to believe that such logging frequency can offer a satisfactory level of measuring precision, while keeping the amount of logged data on the levels applicable for post-processing. In the upcoming subsections, the monitoring results obtained for each of the analyzed green BSSs ware presented and discussed. It is worth emphasizing that the presented monitoring results have been obtained for real, fully operated green BSSs. Due to operator restrictions, the monitoring results are not presented directly from the monitoring system in the form of a snapshot.
They are exported to Excel and from Excel they are filtered and plotted using Matlab. However, the presented graphs are equal to those presented in the operators’ monitoring application and accessed through a web browser.
5.1. Monitoring Results for Site A
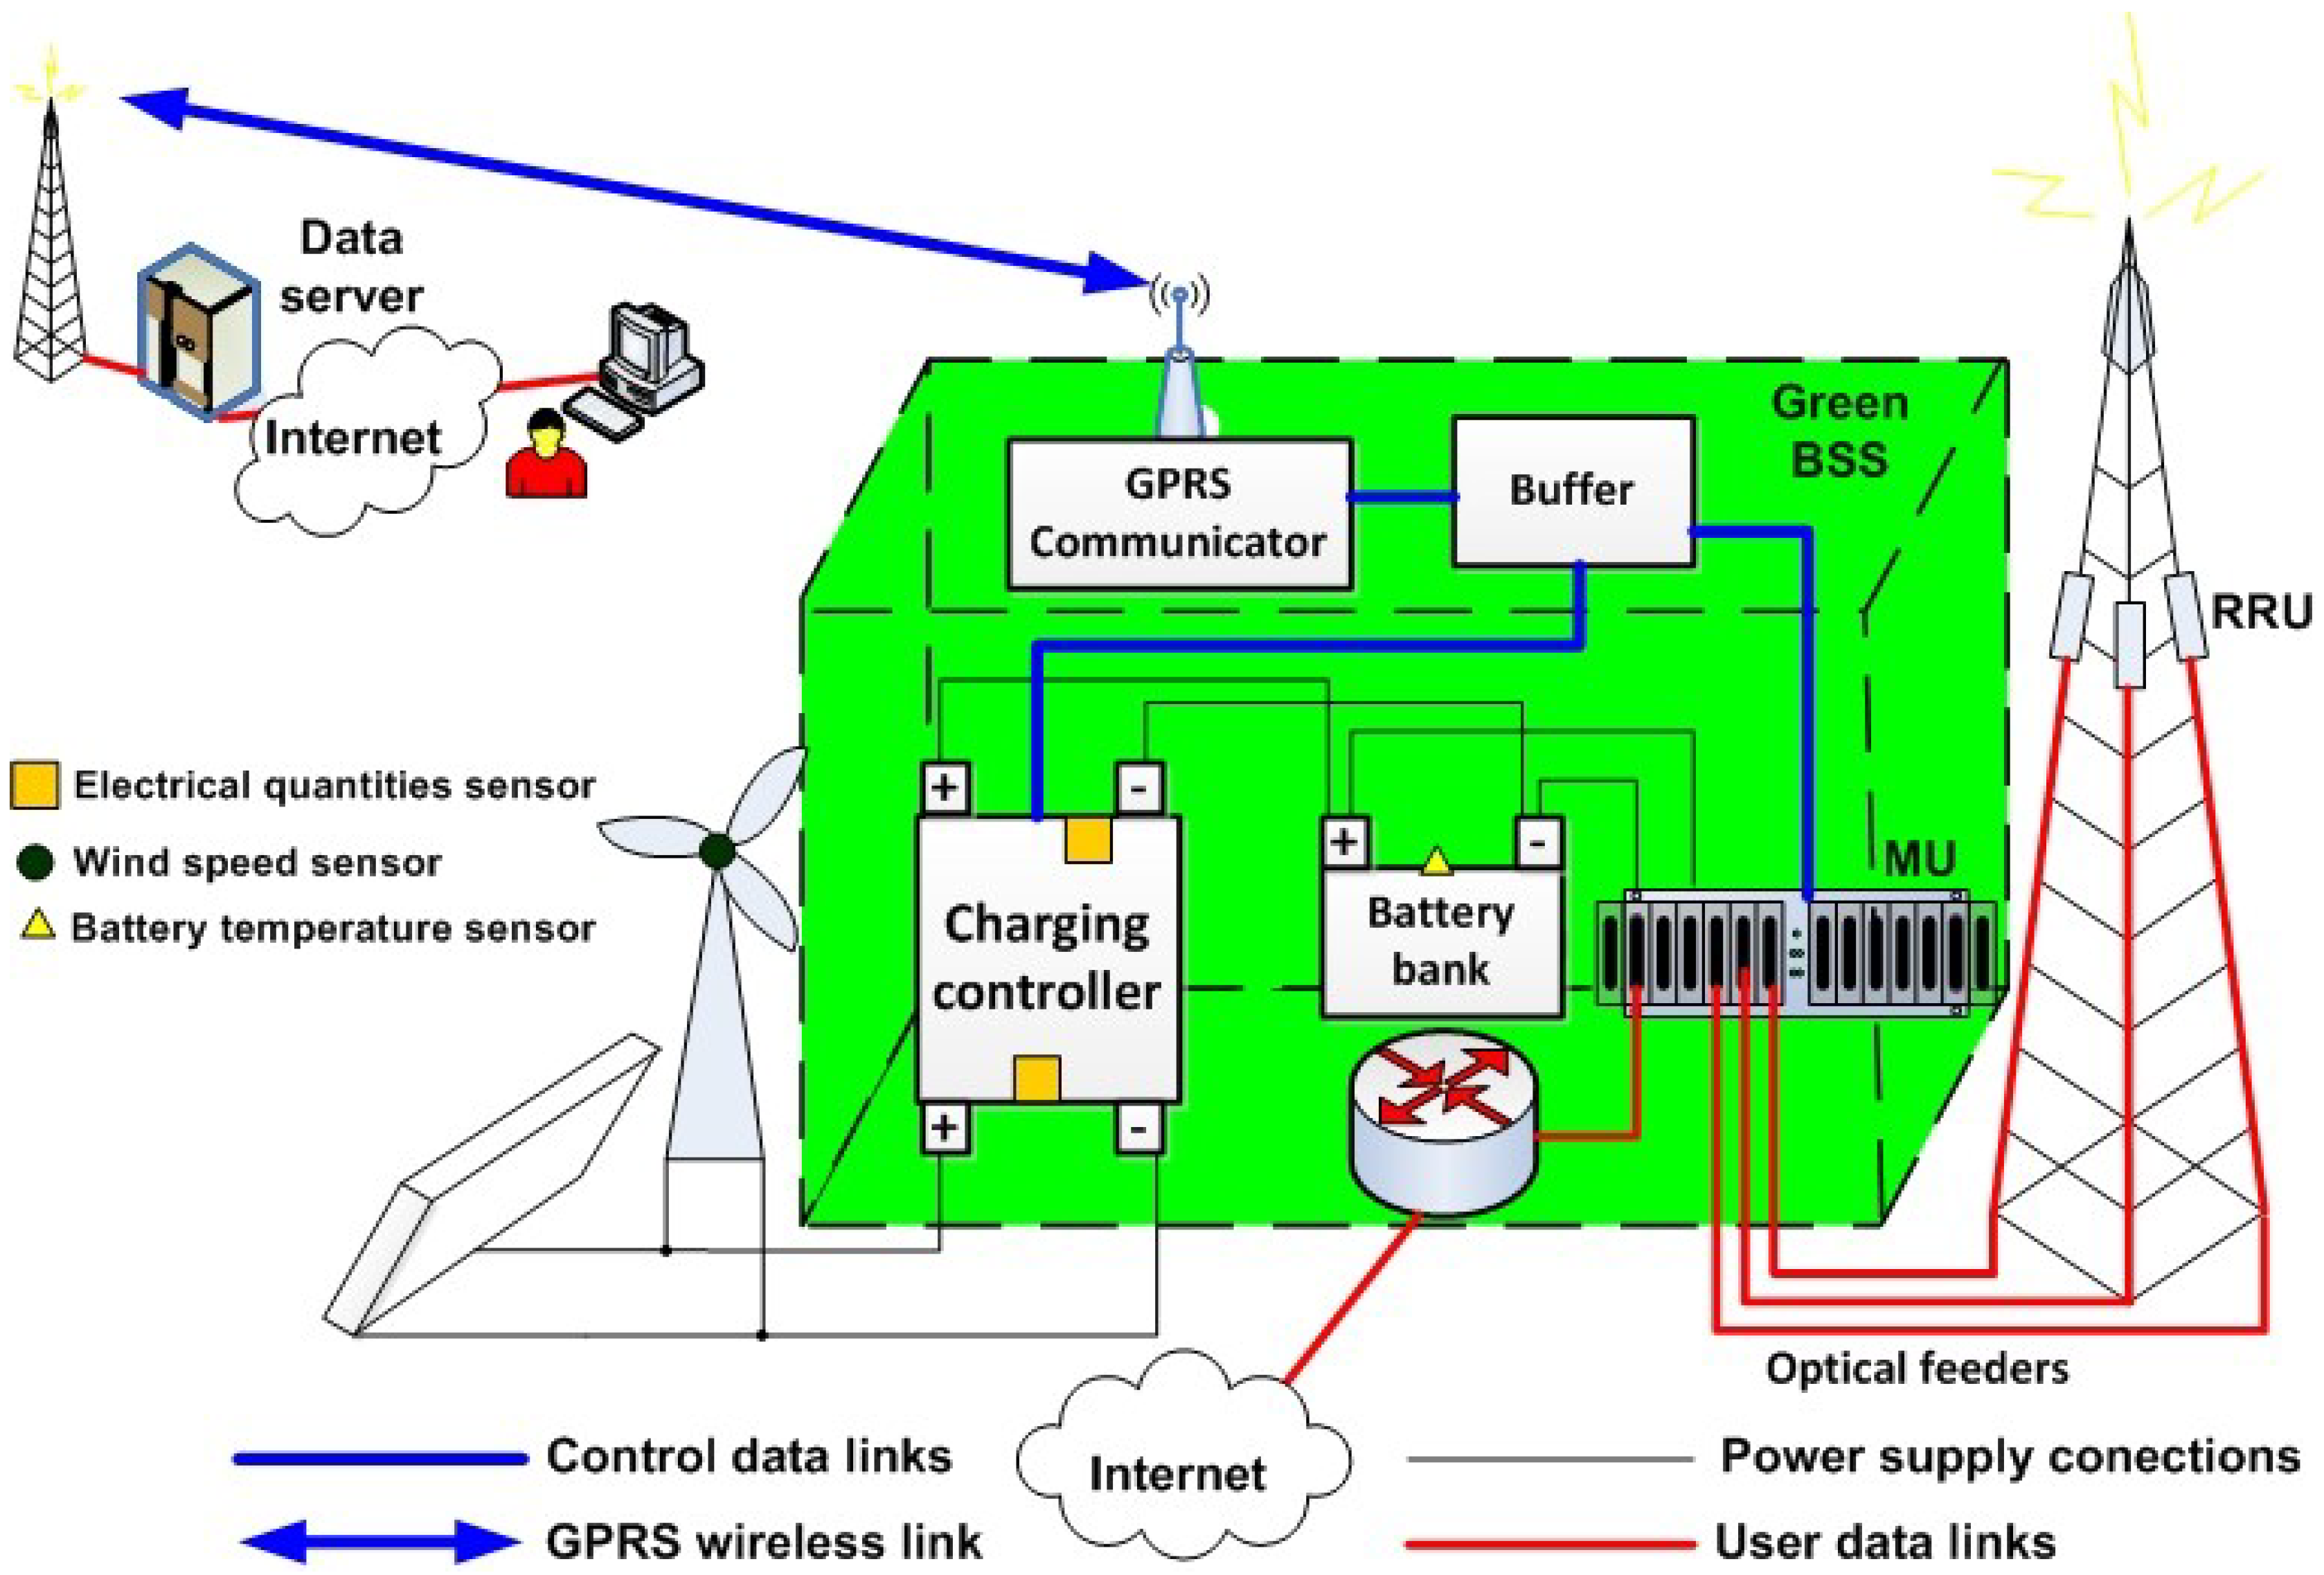
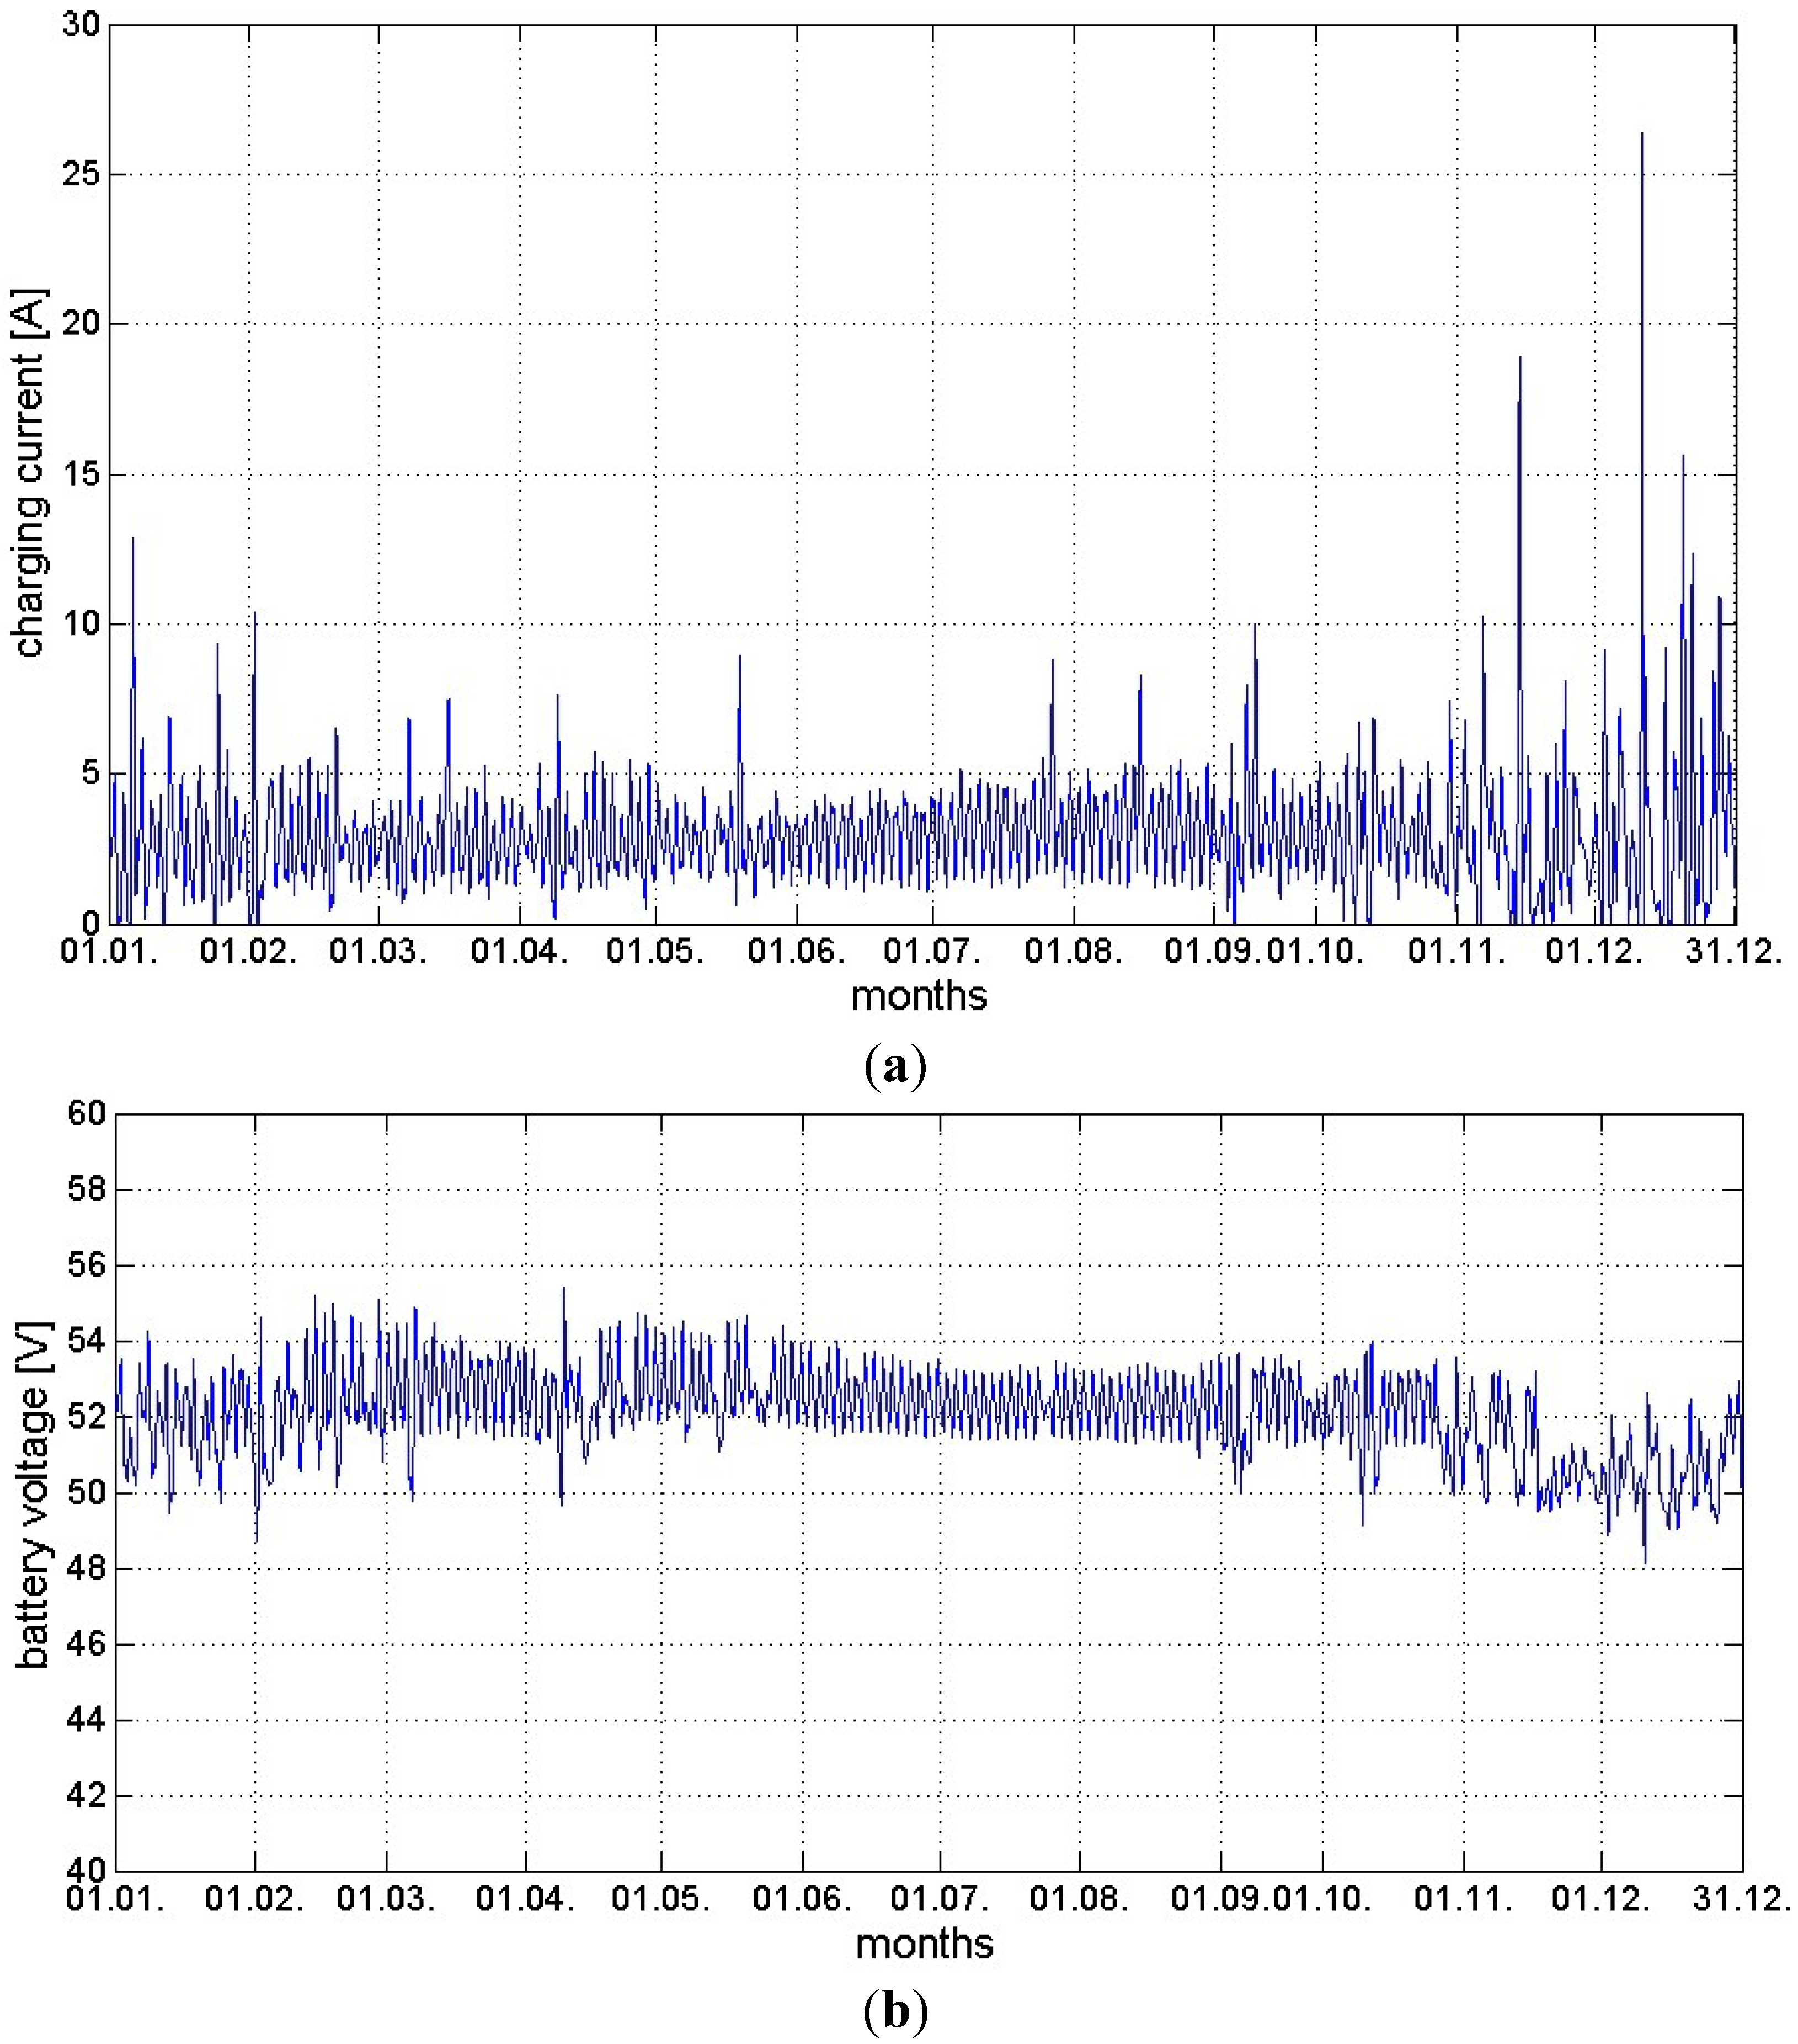
In
Figure 3a,b, the oscillations of charging current produced by the renewable energy source installed on BSS A were presented on a yearly and monthly basis, respectively. Measured results are depicted for only one PV panel array of nominal installed power equal to 2 kWp. Hence, the total charging current generated from an installed renewable energy source on BSS A is approximately twice as large in any moment than those presented in
Figure 3a,b. According to
Figure 3a, the intensity of the current generated from the PV modules varies during different periods of a given year. In the case of BSS A, it can be noticed that highest current generation is during the summer (June–August) due to the highest number of sunny days and the largest irradiation level.
Figure 3.
Variation of the charging current in the case of one solar array for the BSS A during: (a) a year; (b) December.
Figure 3.
Variation of the charging current in the case of one solar array for the BSS A during: (a) a year; (b) December.
This current generation pattern is typical for BSS locations in the north hemisphere that have summer months during the period of June–August. Peaks of the electric current generation are a consequence of daily and monthly variations of the sun’s irradiation pattern. In
Figure 3b, daily variations of the generated electric current are presented for January, as one of the months with the lowest yearly irradiation level. It can be clearly noticed that the daily energy production is modulated by the sun irradiation of that day, which explains the zero current generation during night periods and the maximal production during the middle of a sunny day.
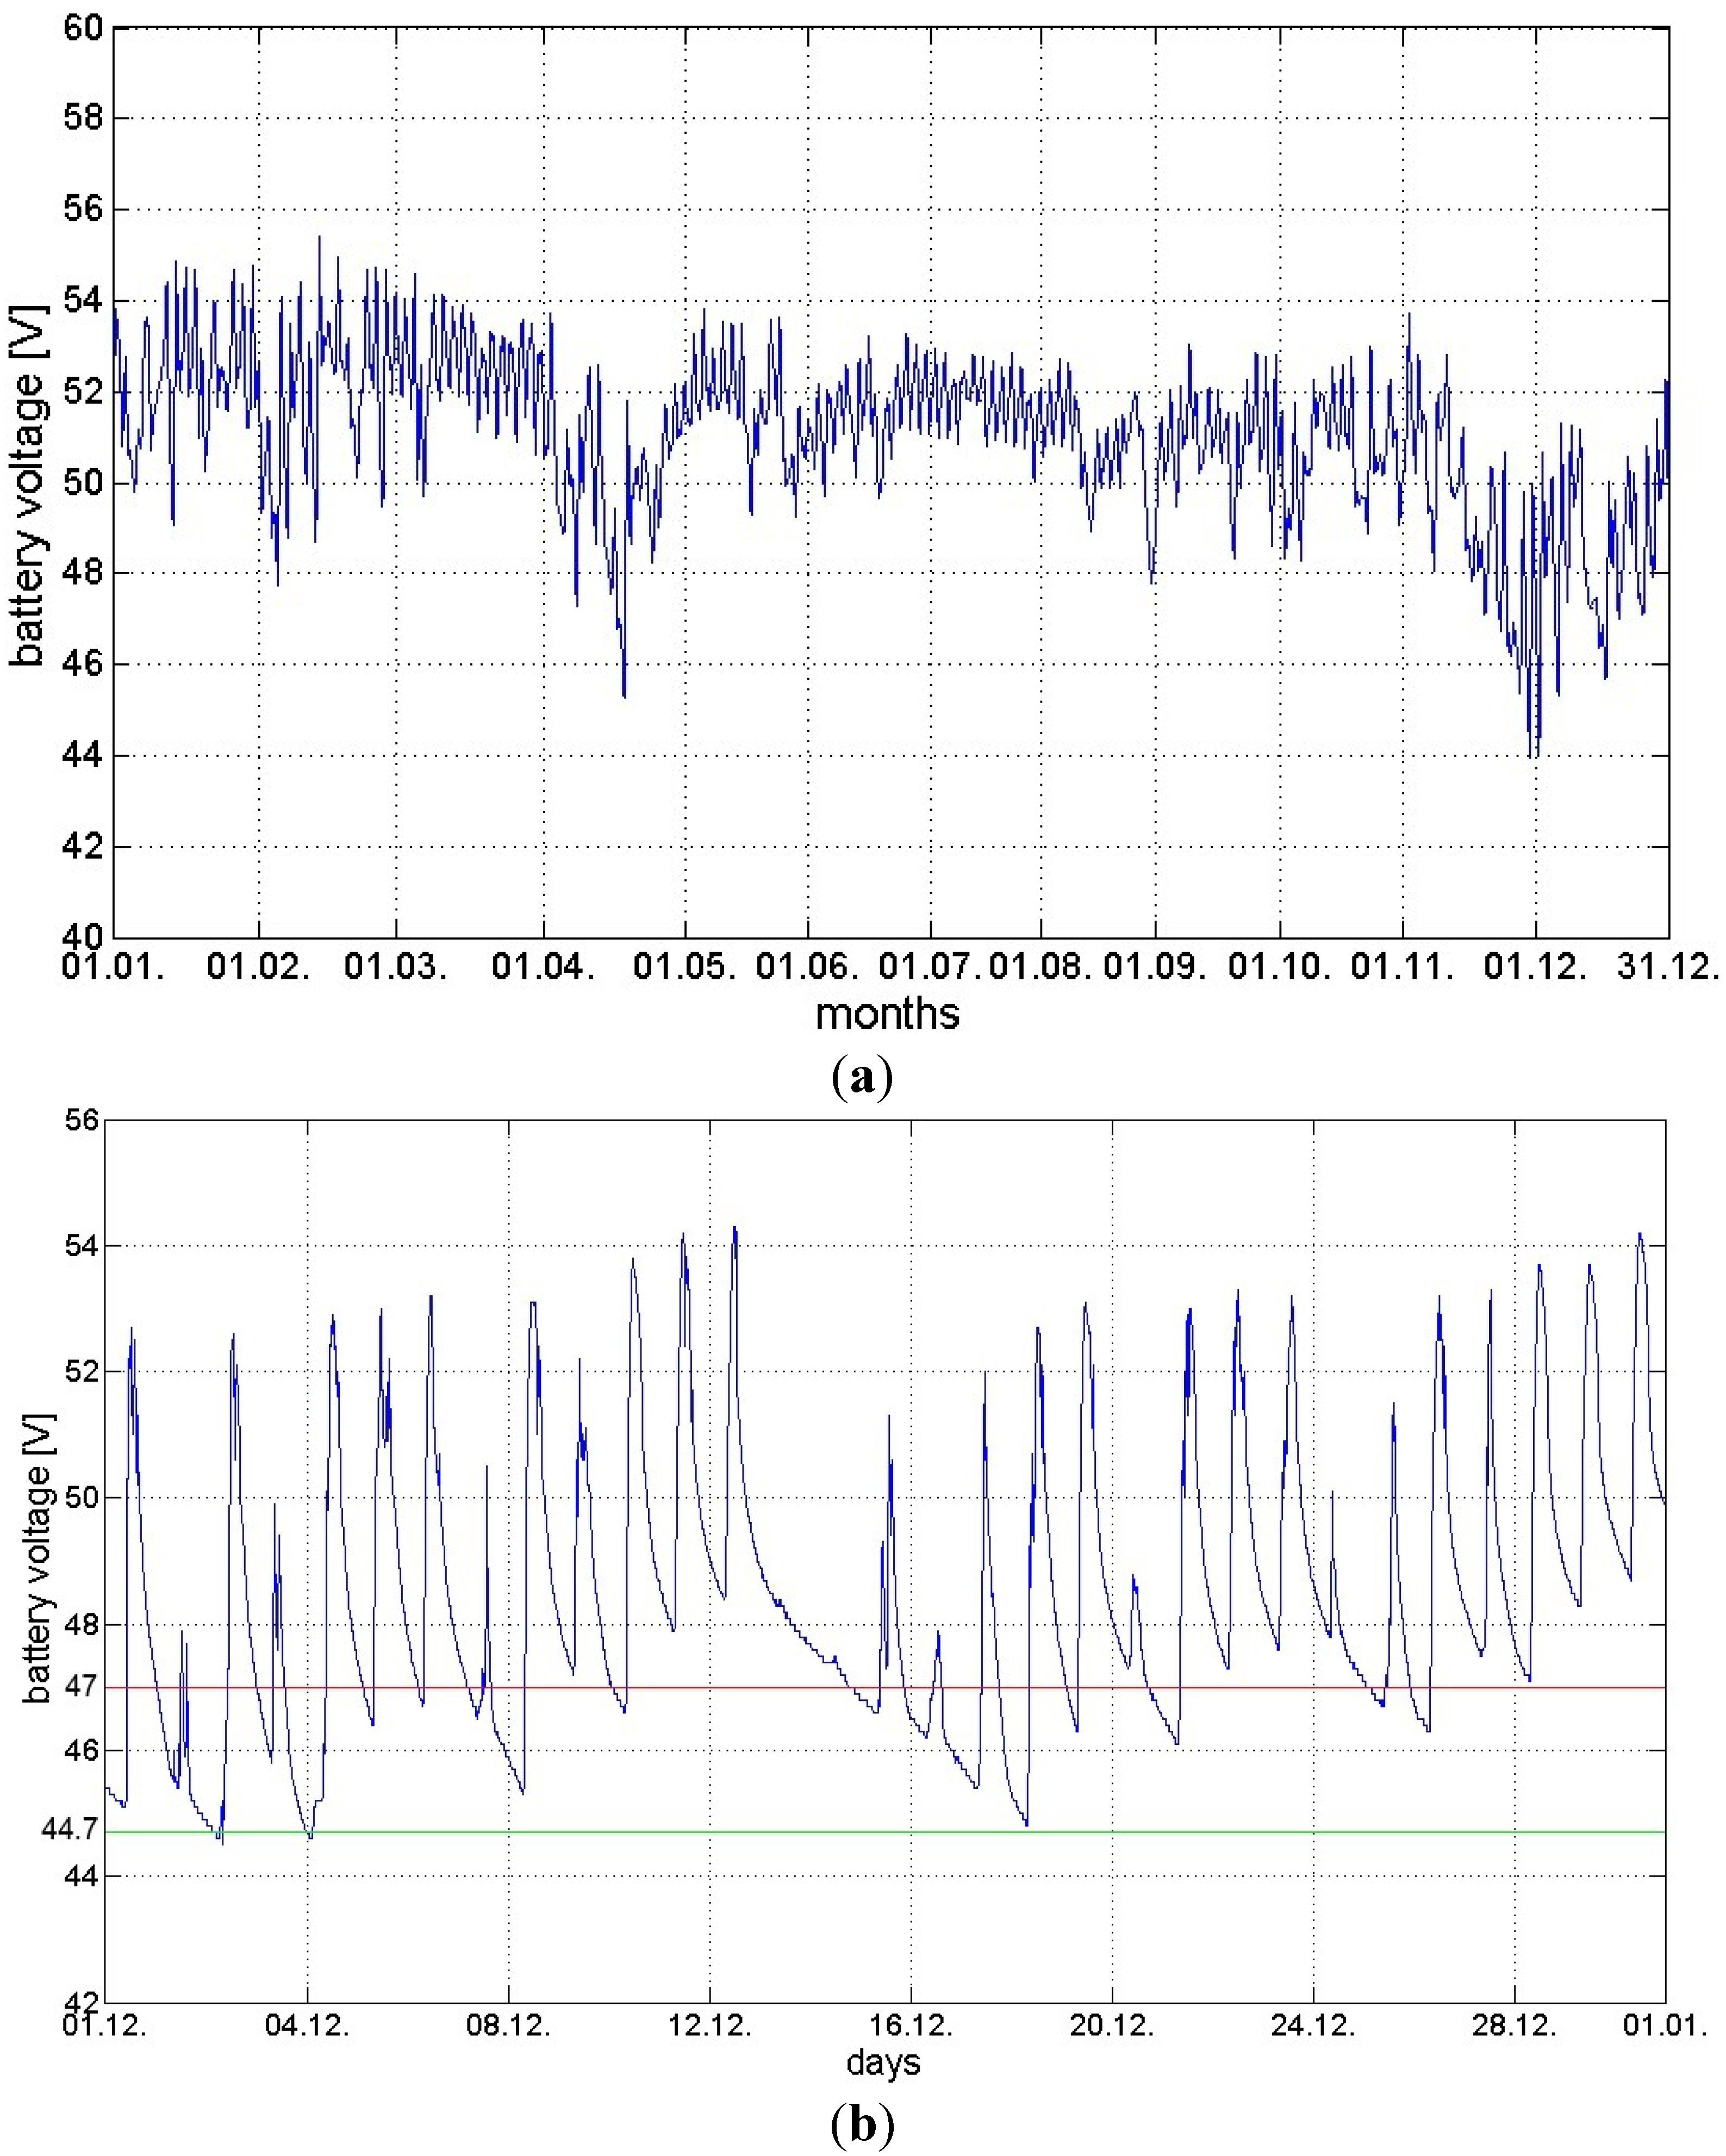
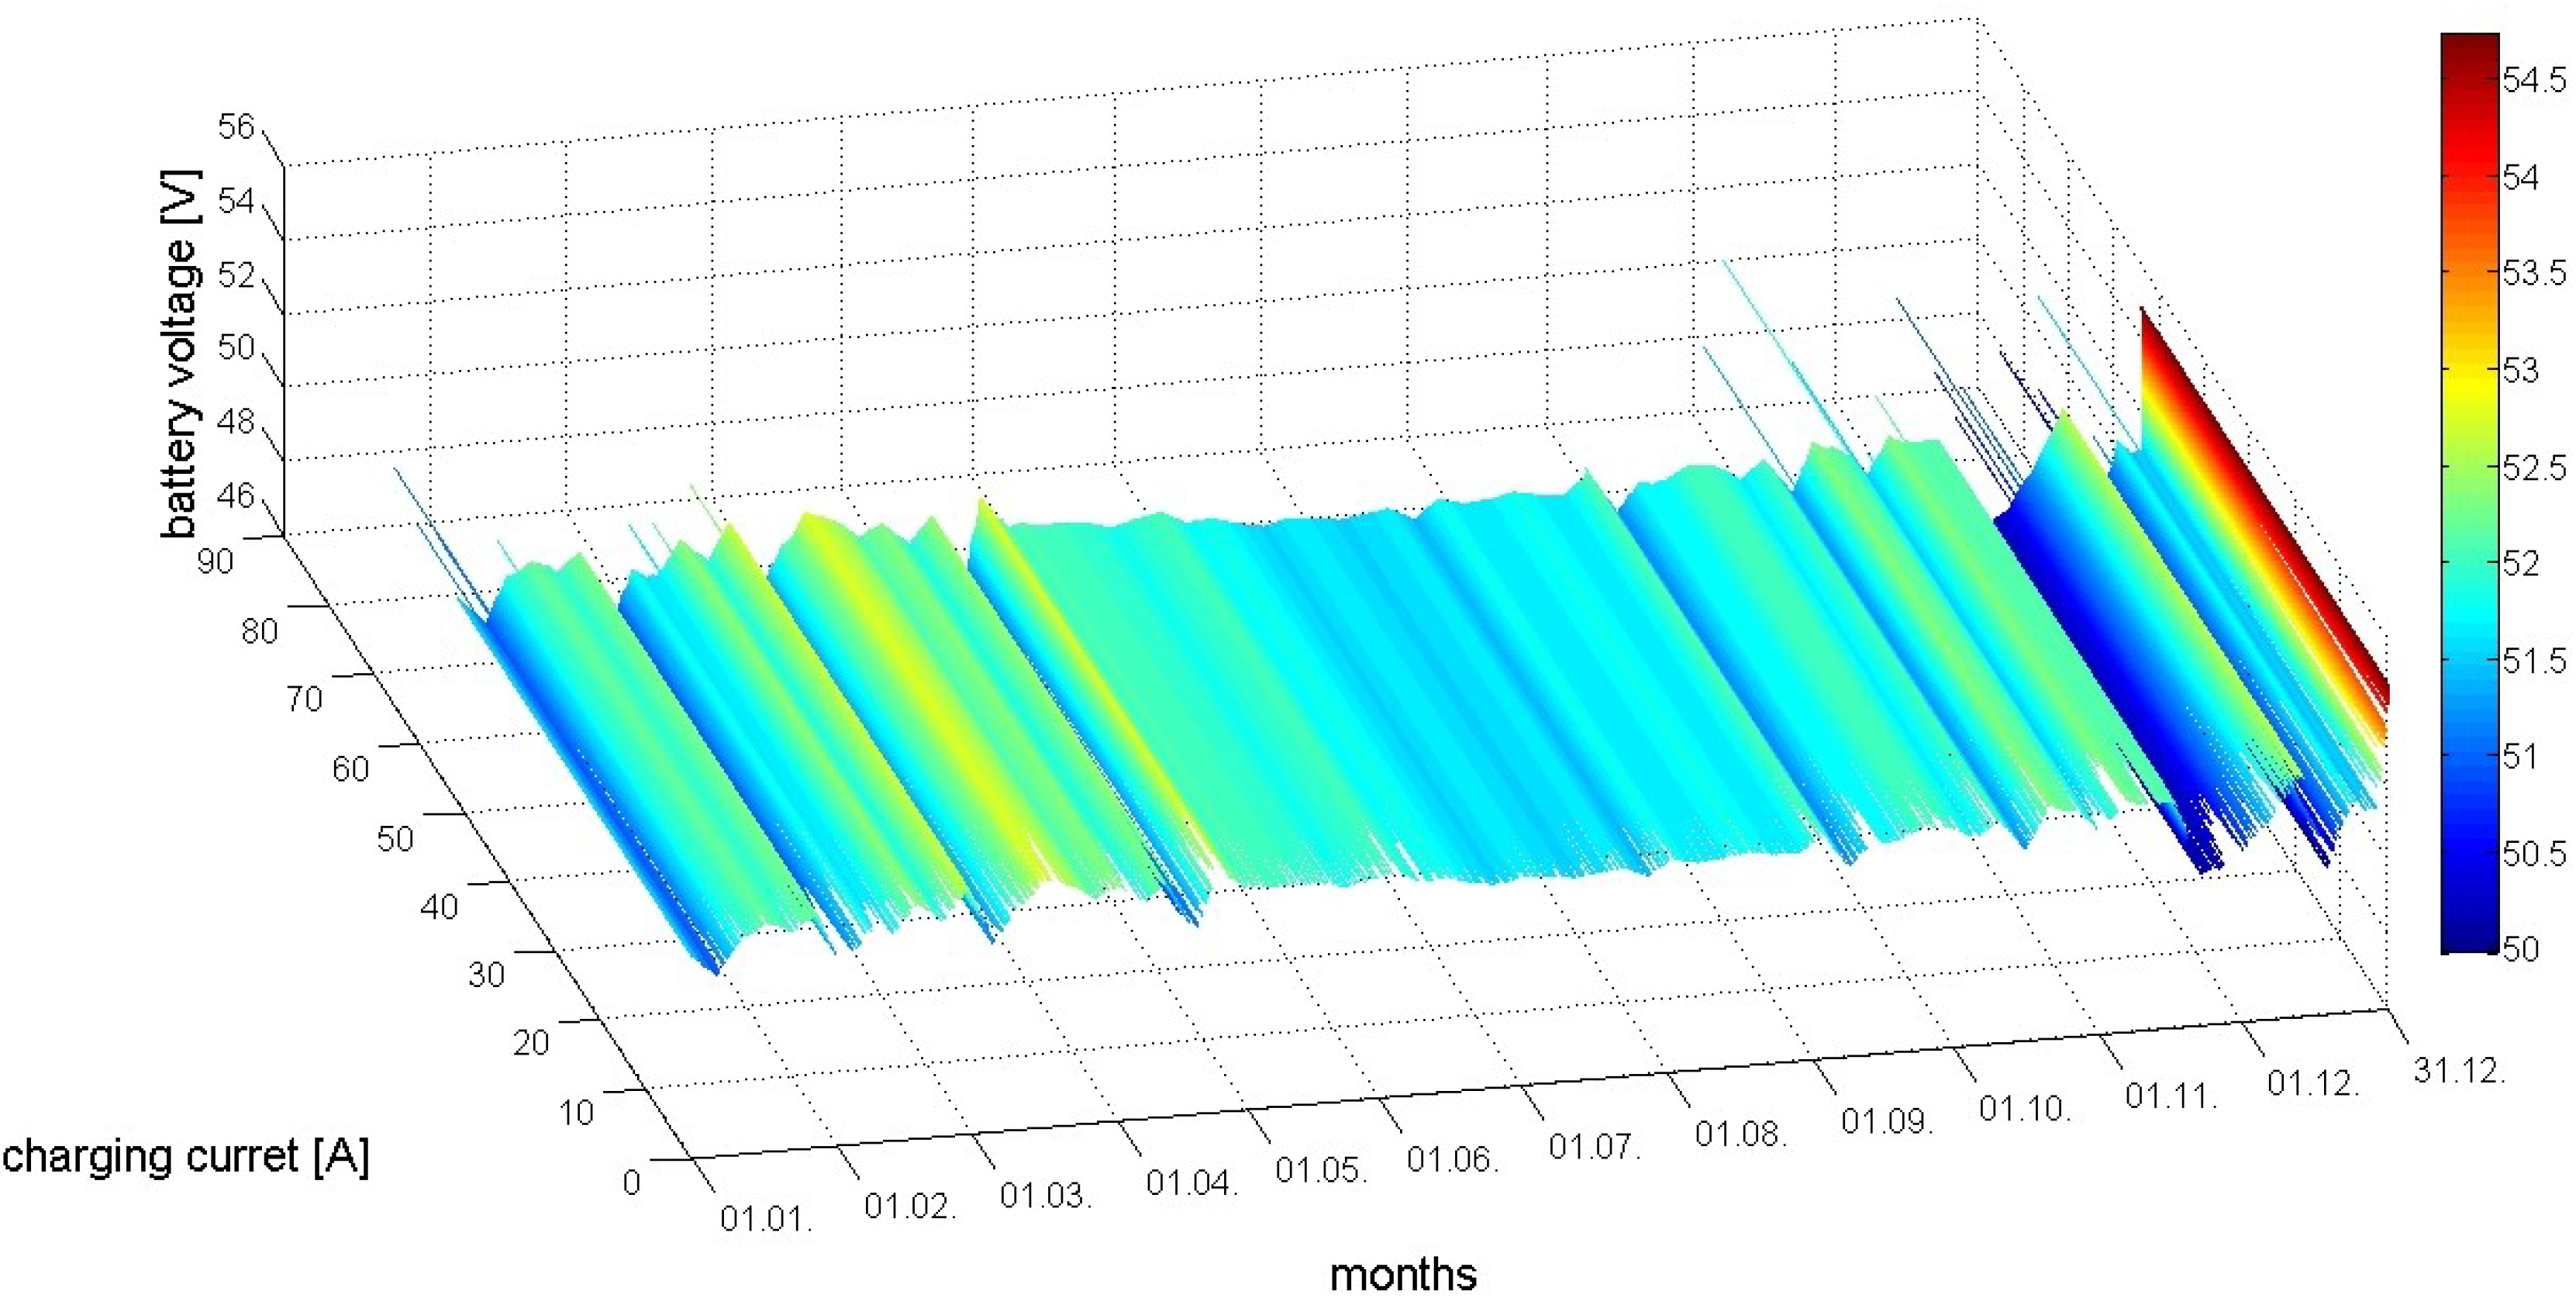
Figure 4a,b present the variations of battery voltage during the period of one year and one month, respectively. In
Figure 4a, the peak variations of battery voltage range from 44 V up to 55 V. To protect the BS equipment, a power supply system of BSS A is set up in a way such that UMTS and GSM BSs will be turned off when the battery voltage falls below 47 V and 44.7 V, respectively. According to
Figure 4a, a somewhat higher voltage drop can be noticed in April, November and December, while in
Figure 4b detailed variations of battery voltage for December can be perceived. As an example, we can notice that during a very short period of time, on the 3rd and 4th December, the battery voltage reaches values below 44.7 V. This means that the complete BSS A was inactive and did not offer any service during a very short time period in November and December (
Figure 4a,b). This can be confirmed in the form of the sharp decrease of discharging (draw) current presented in
Figure 5 during the end of November and the beginning of December. Although the graph resolution in
Figure 5 reduces the precise visibility of these rapid current decreases, a developed monitoring system enables the historical visualization of each measured quantity on a daily and hourly basis. This enables precise insight into the variation level of the monitored quantity.
Figure 4.
(a) Yearly variation of battery voltage for the BSS A; (b) the BSS A battery voltage variation during January.
Figure 4.
(a) Yearly variation of battery voltage for the BSS A; (b) the BSS A battery voltage variation during January.
Figure 5.
Interdependence of total charging and discharging currents for the BSS A during one year.
Figure 5.
Interdependence of total charging and discharging currents for the BSS A during one year.
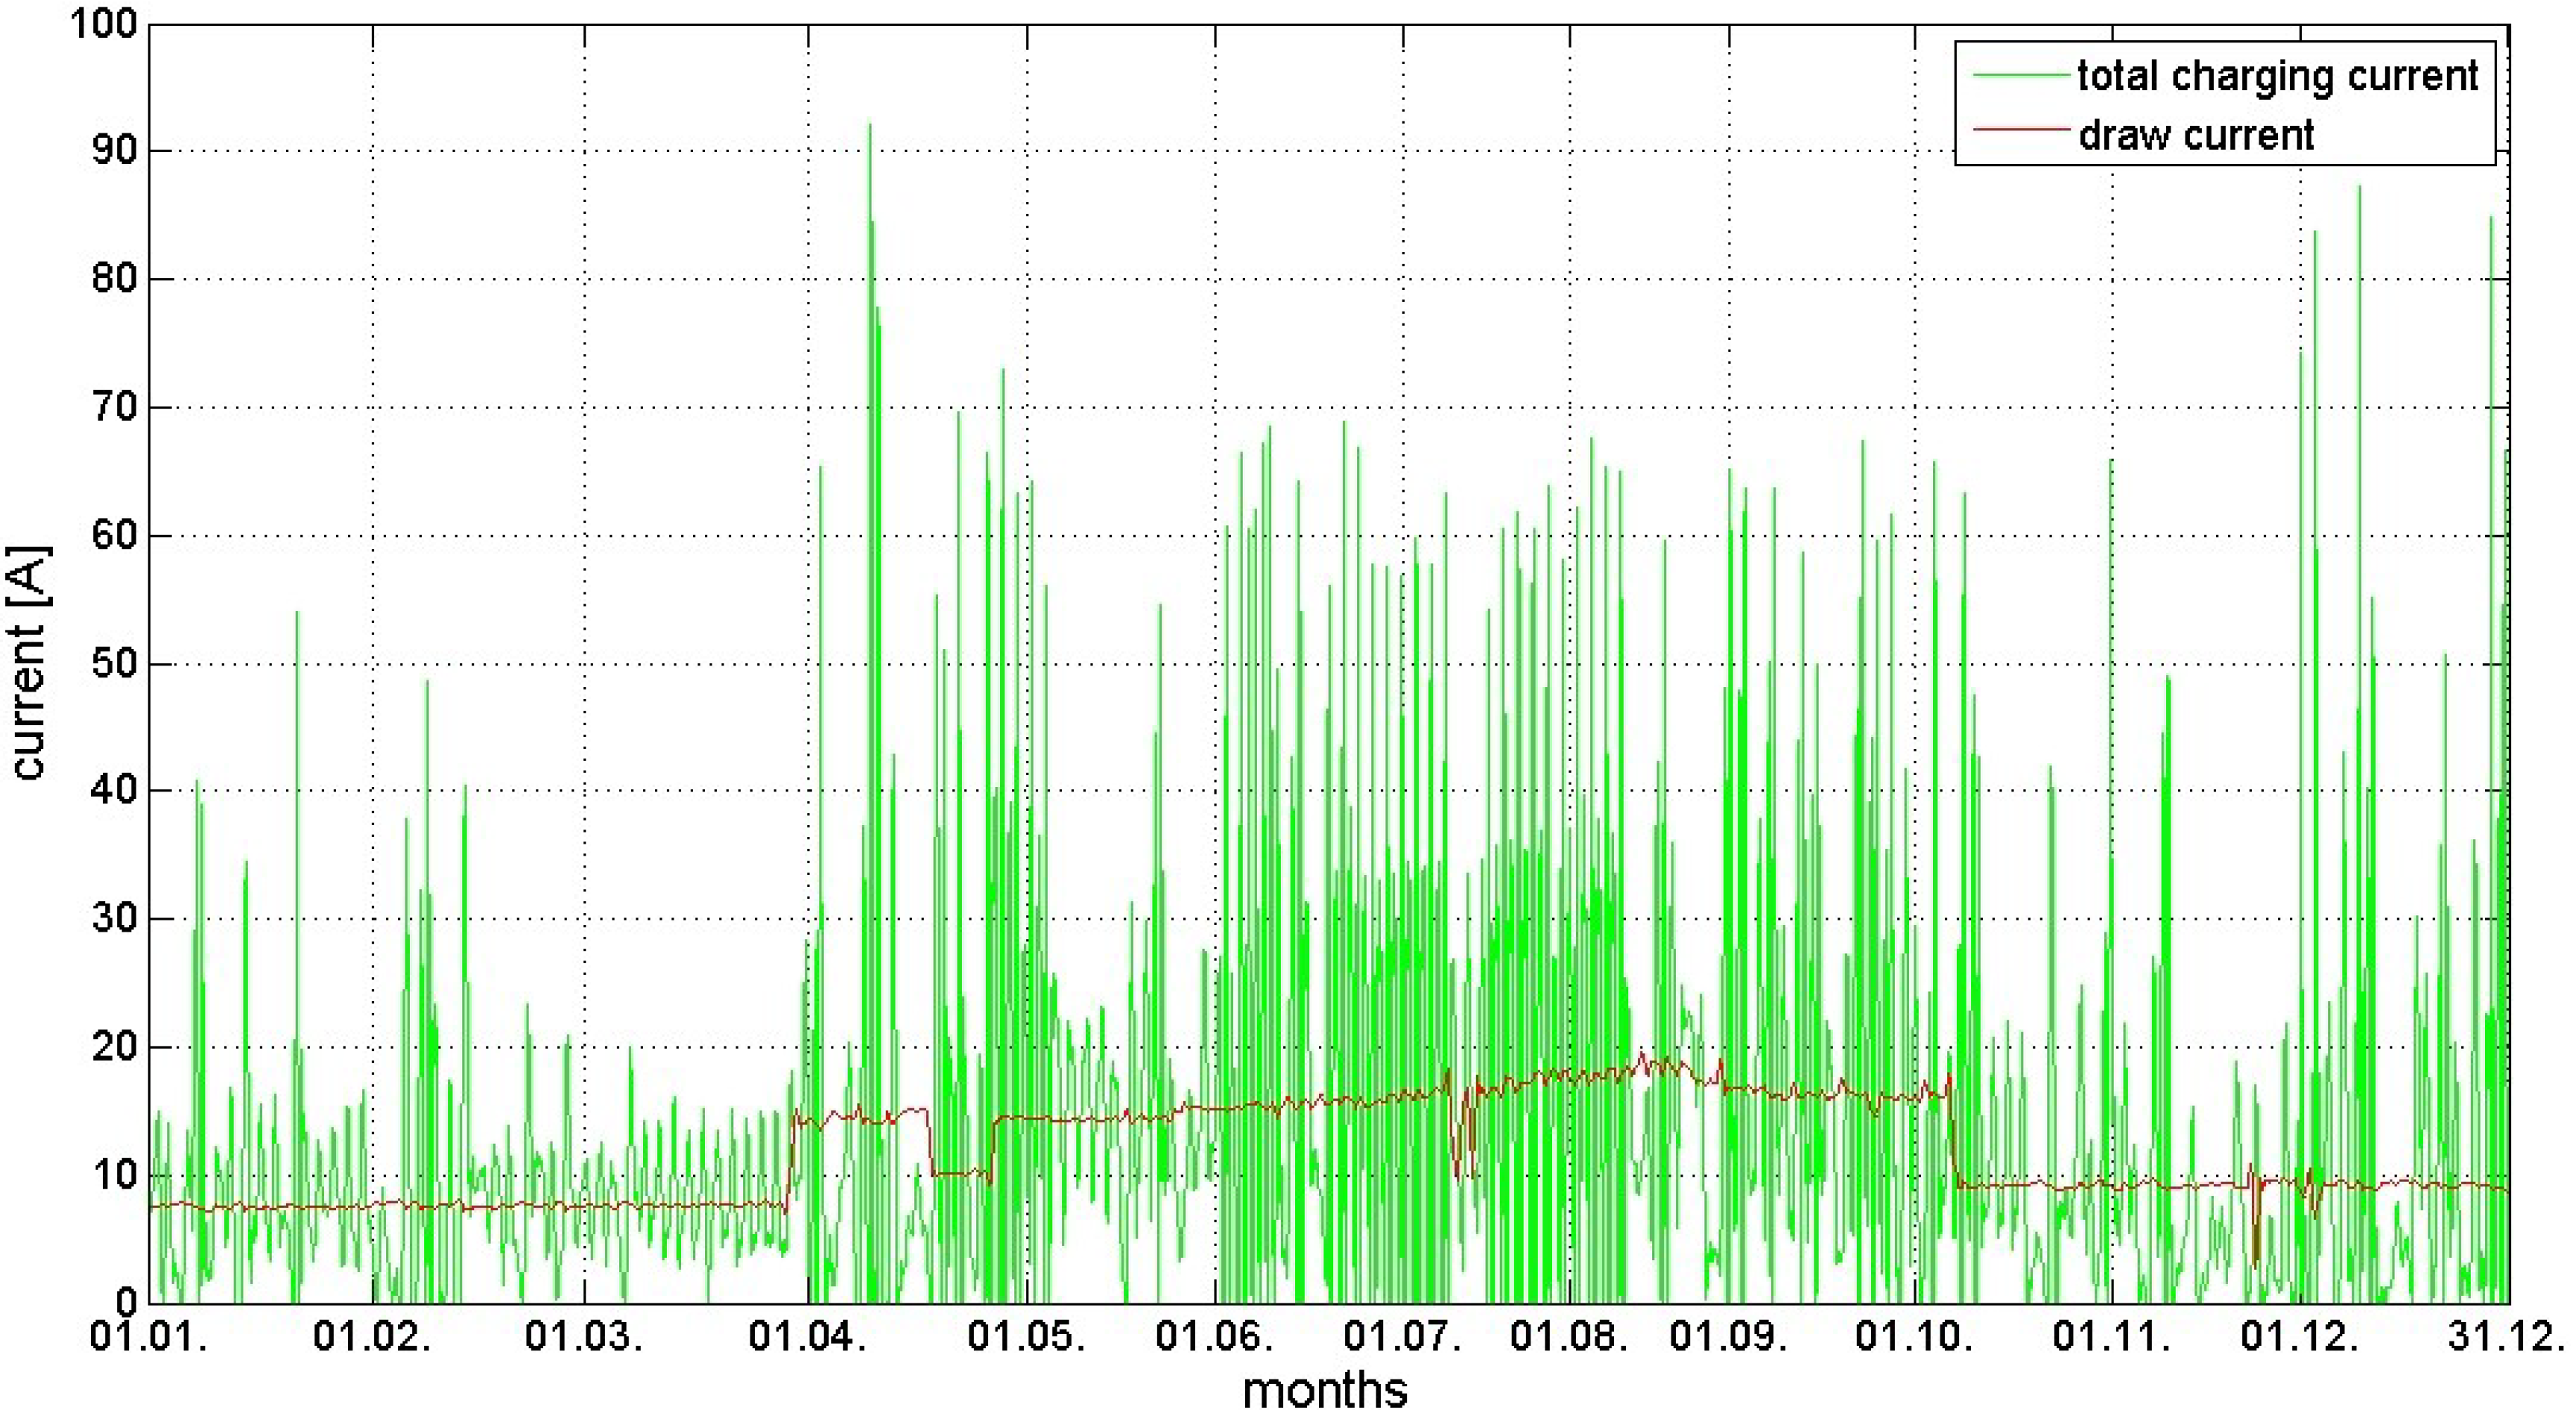
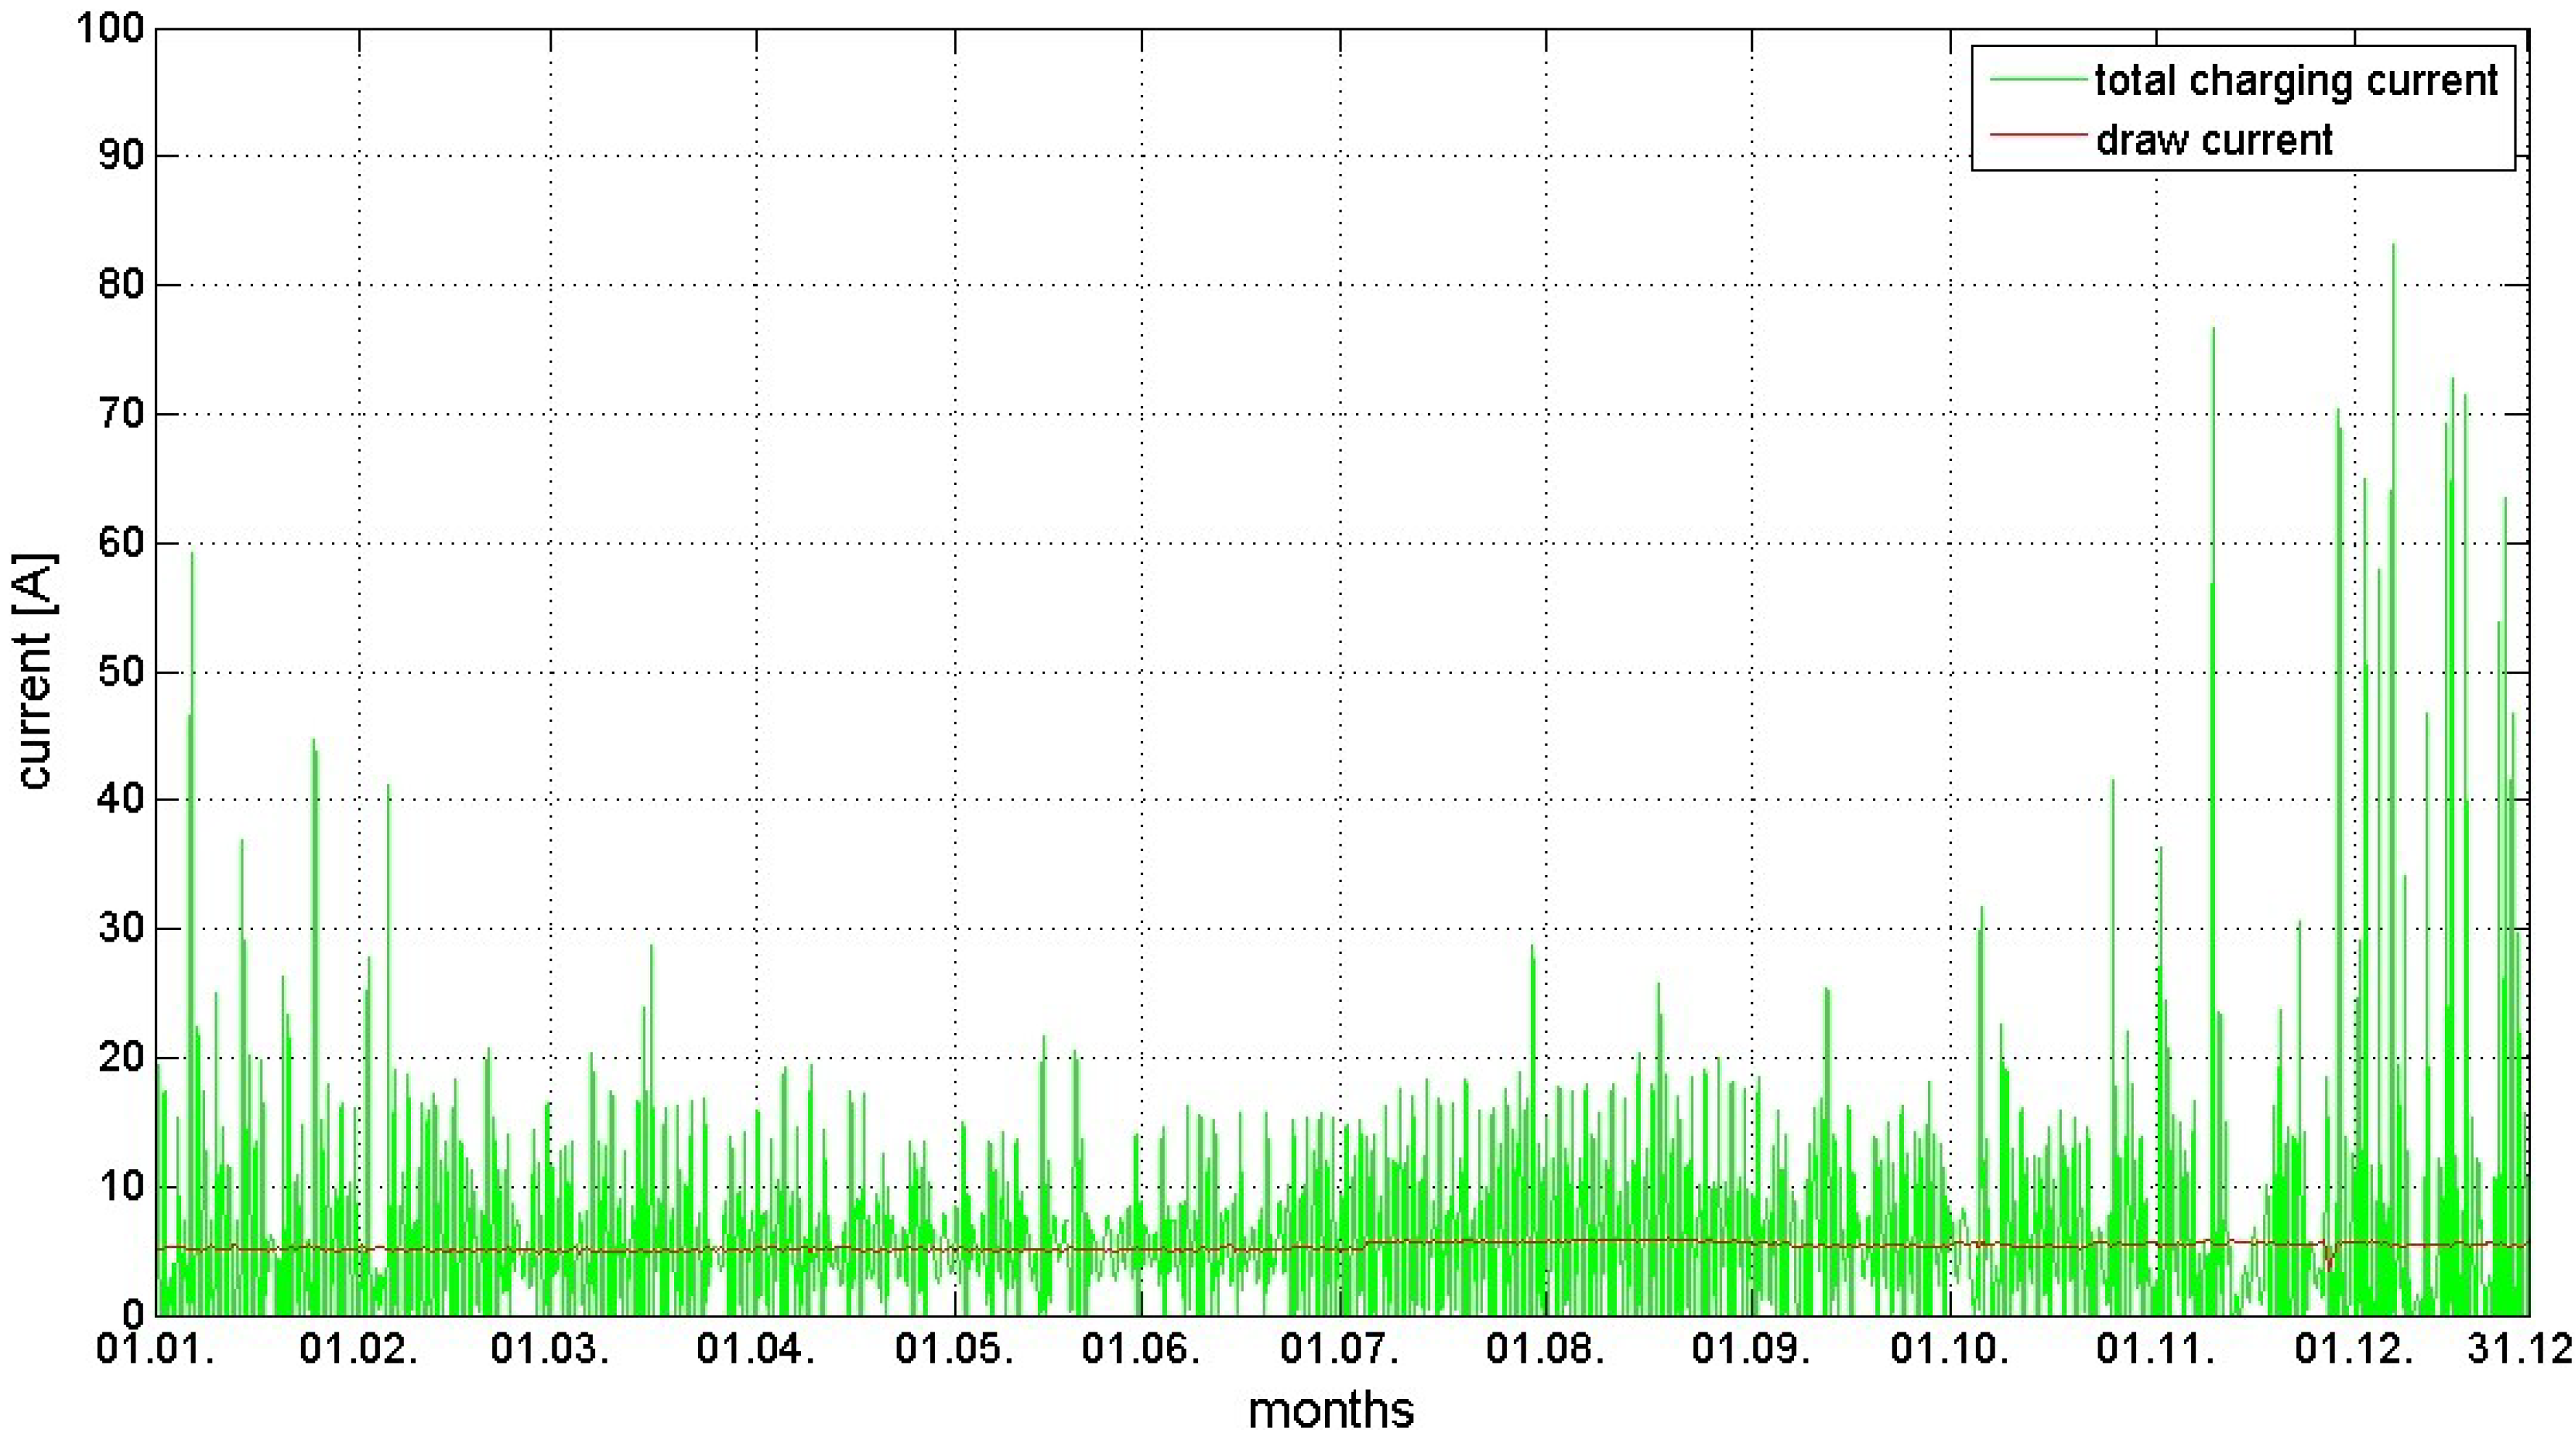
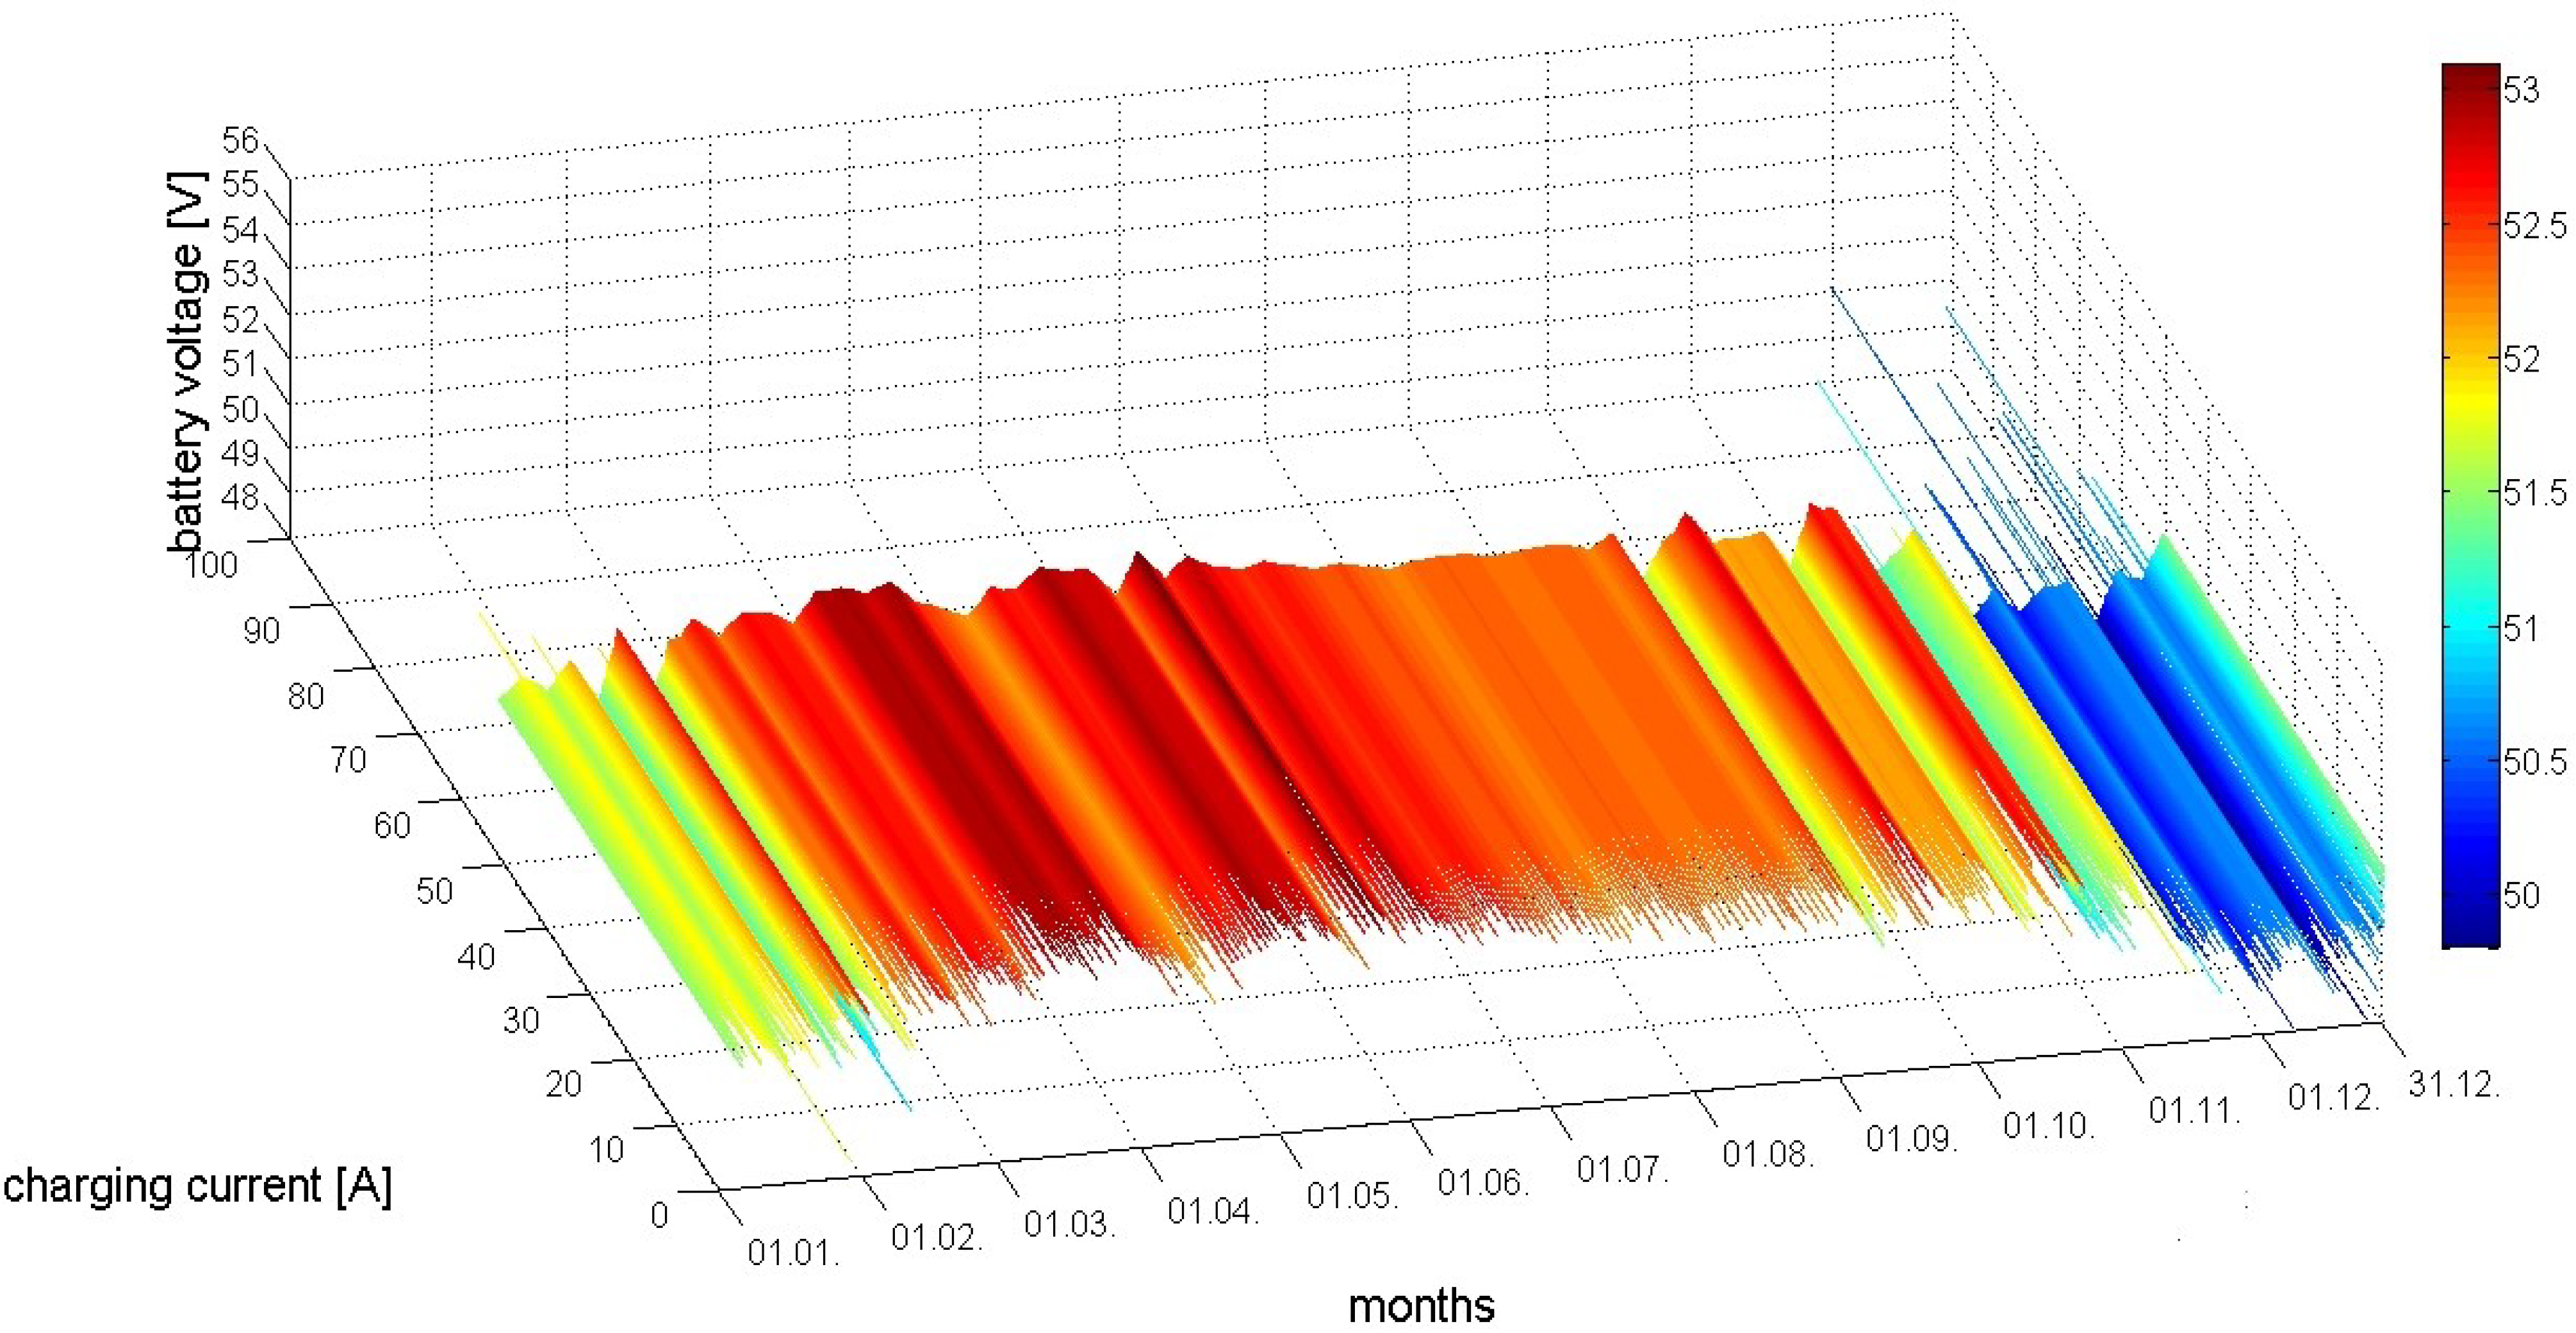
According to
Figure 6 and
Figure 7, both charging and discharging (draw) current has an influence on battery voltage. Although the charging current reaches its highest values during the summertime (
Figure 4a), according to
Figure 6 the battery voltage is not directly proportional to the total charging current. This is a consequence of the significant increase of discharging (draw) current, which can be noticed in
Figure 5 and
Figure 7 for the period from April to December. This increase is induced by the activation of the UMTS BS installed on BSS A. Explanations of macro BSS power consumption variations caused by the activation of new BS elements or changing BS Tx power can be found in the extensive study presented in [
47].
Figure 6.
Interdependence of total charging current and battery voltage for the BSS A on a yearly basis.
Figure 6.
Interdependence of total charging current and battery voltage for the BSS A on a yearly basis.
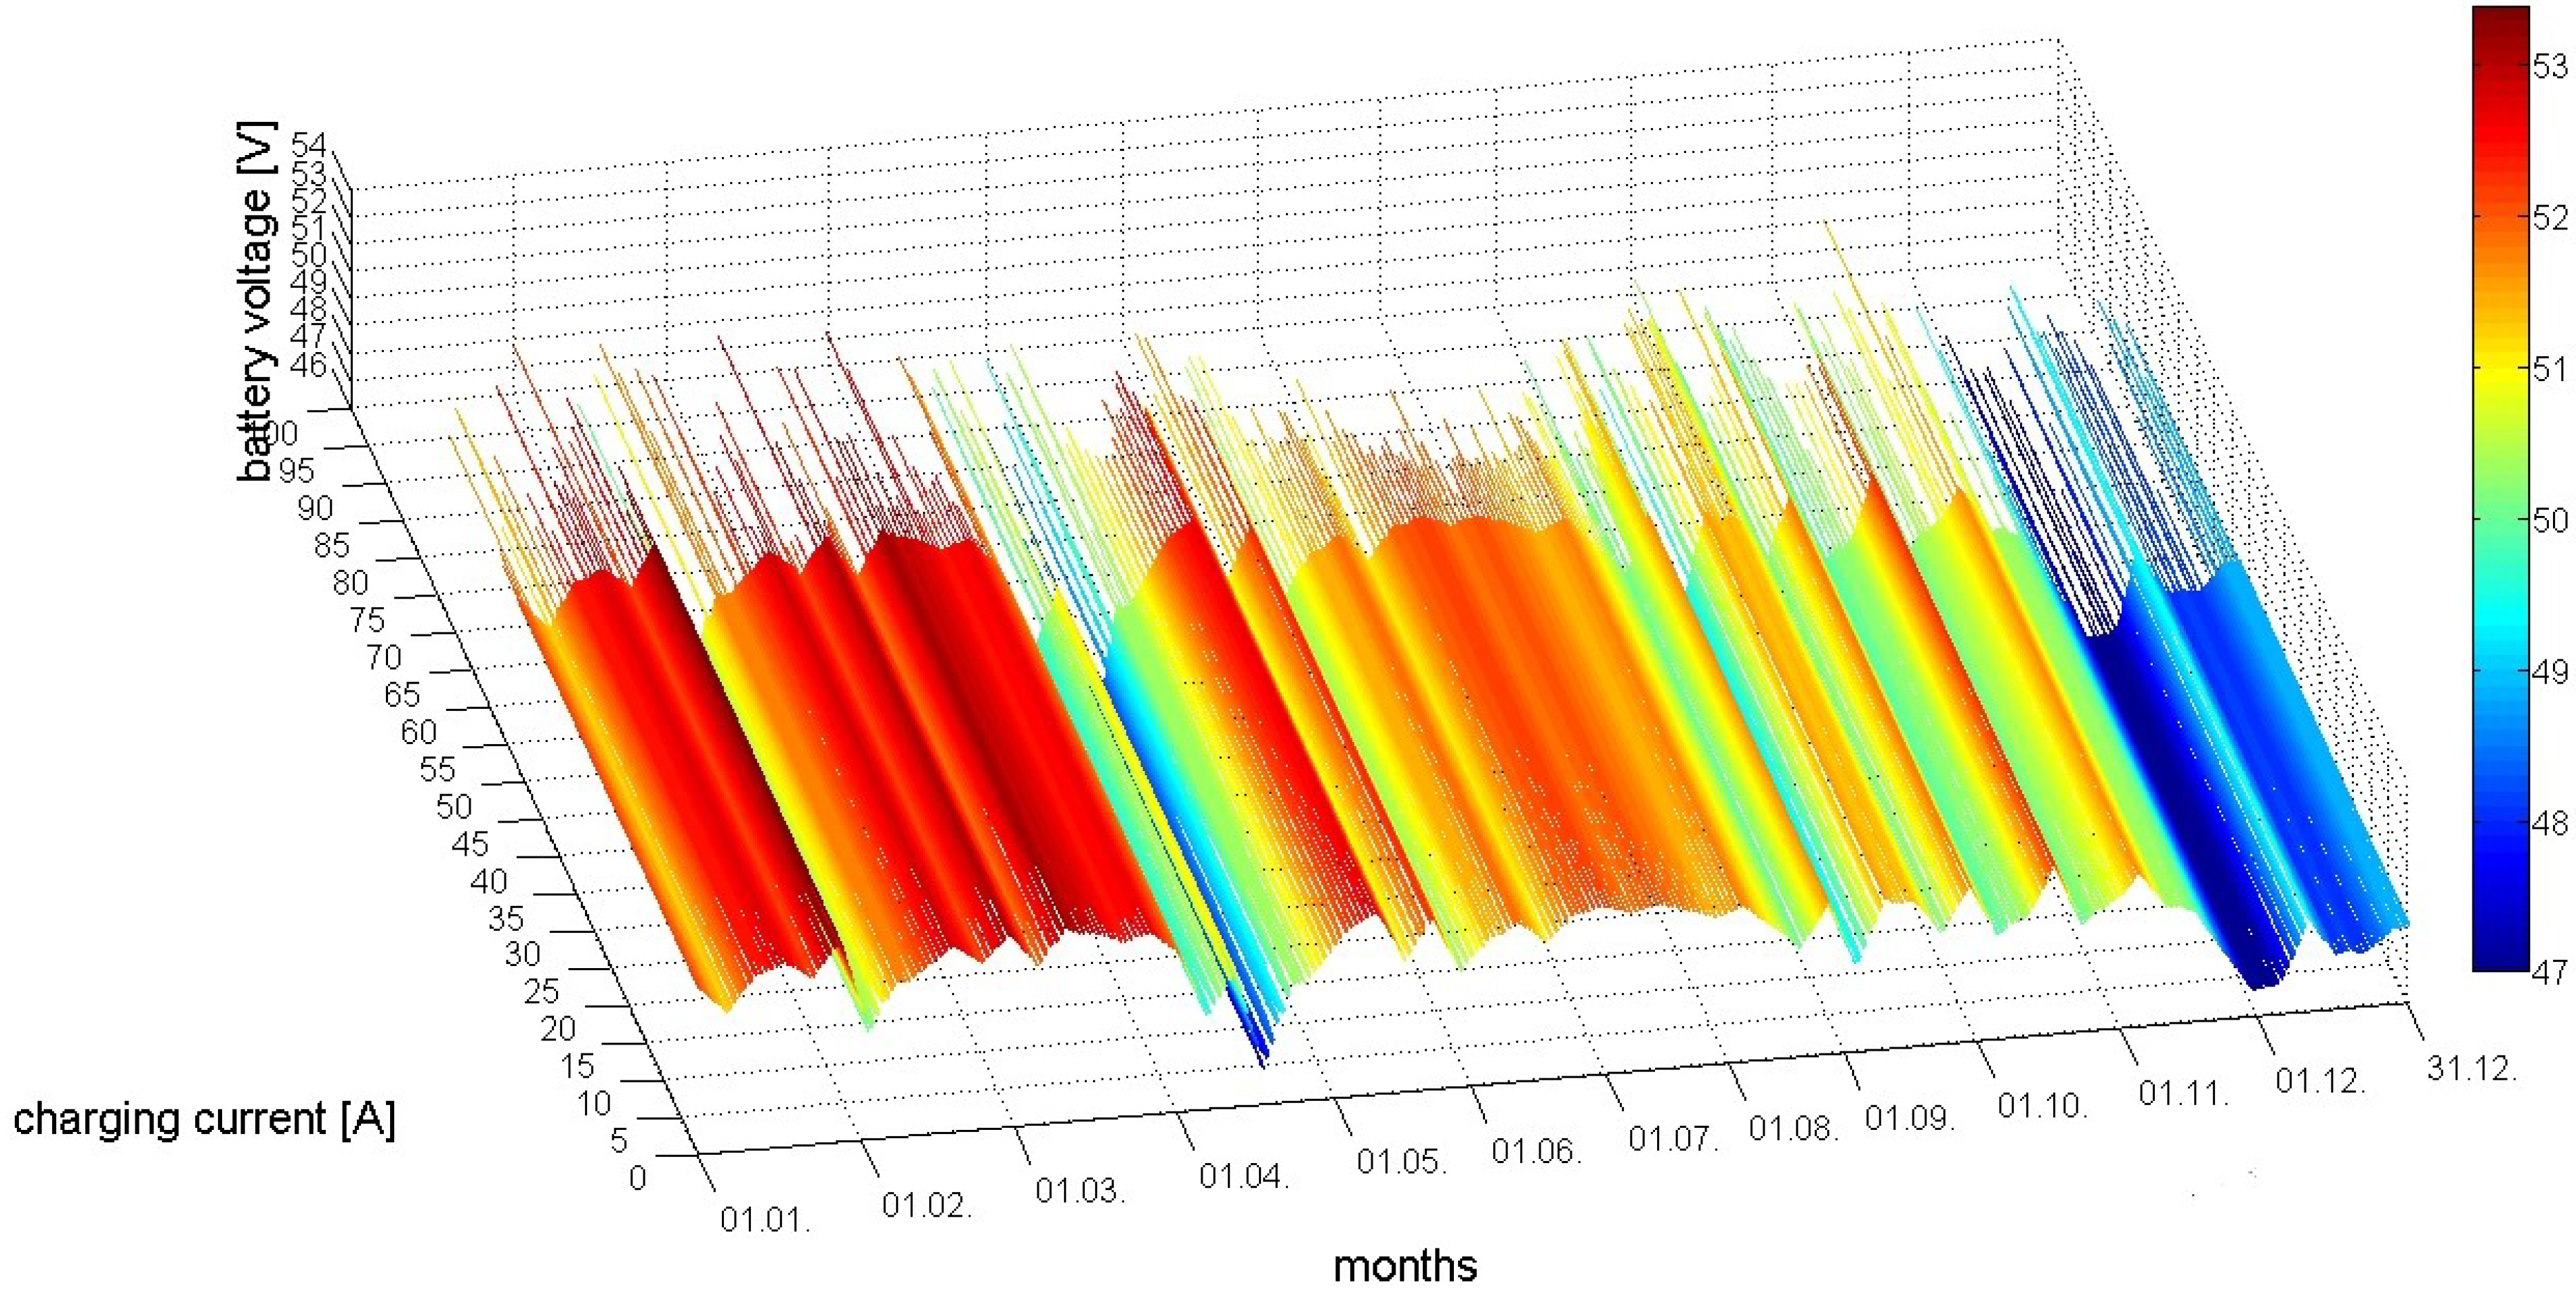
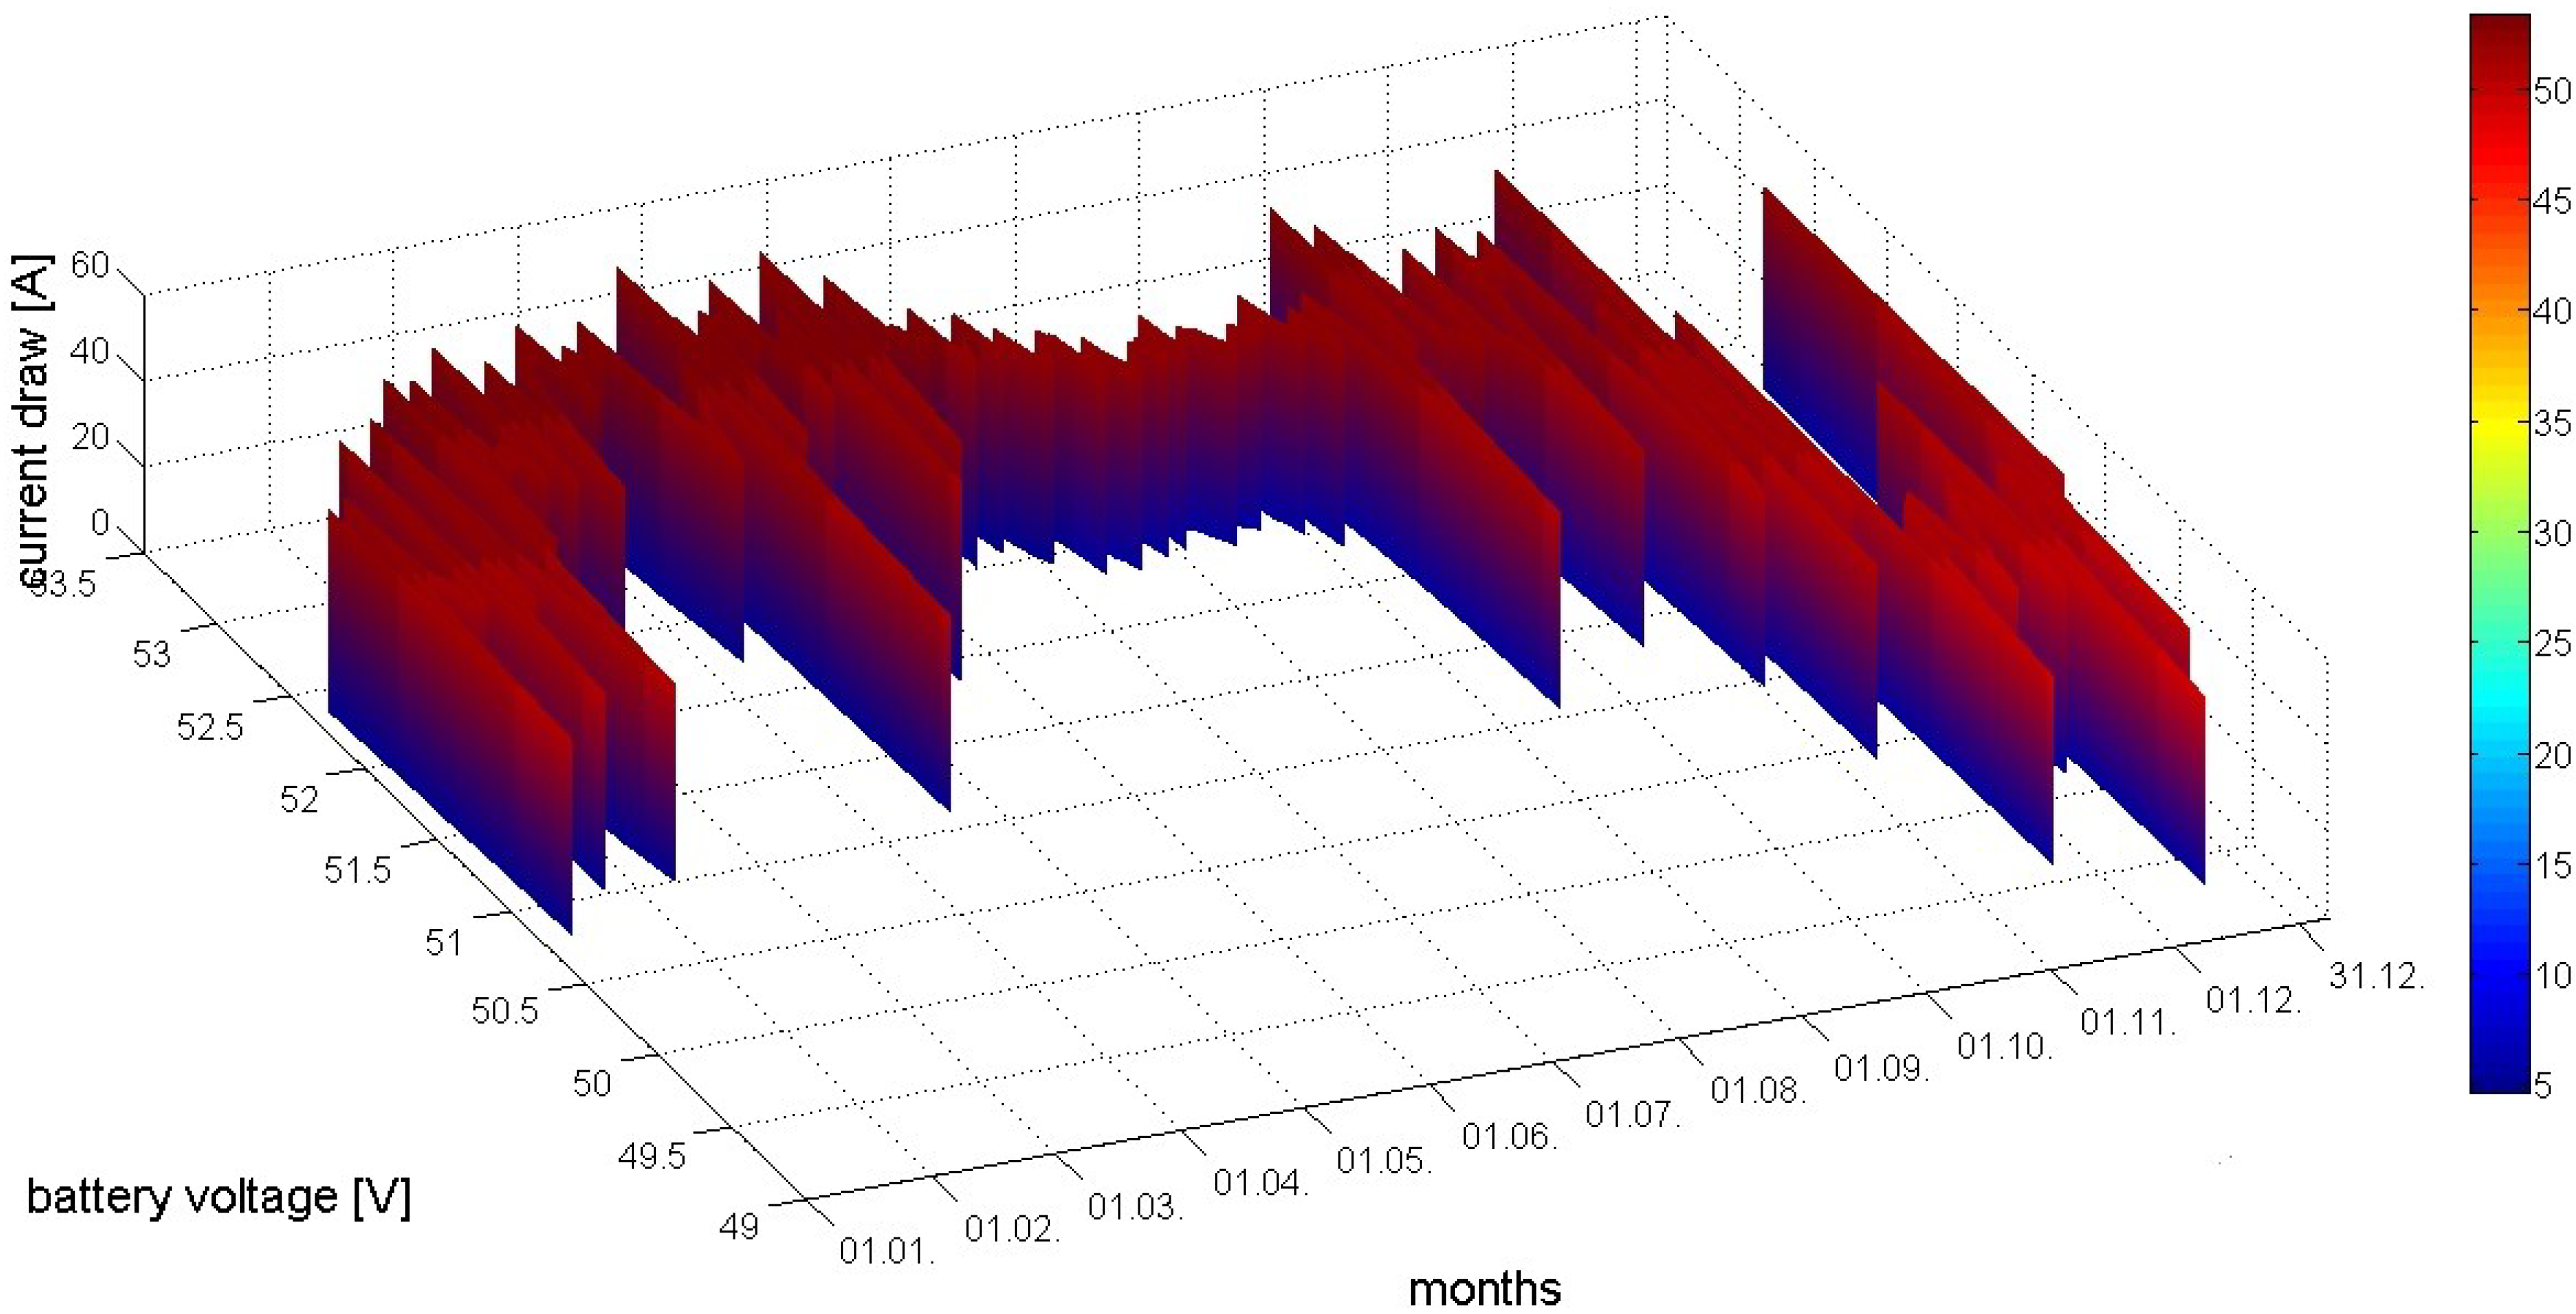
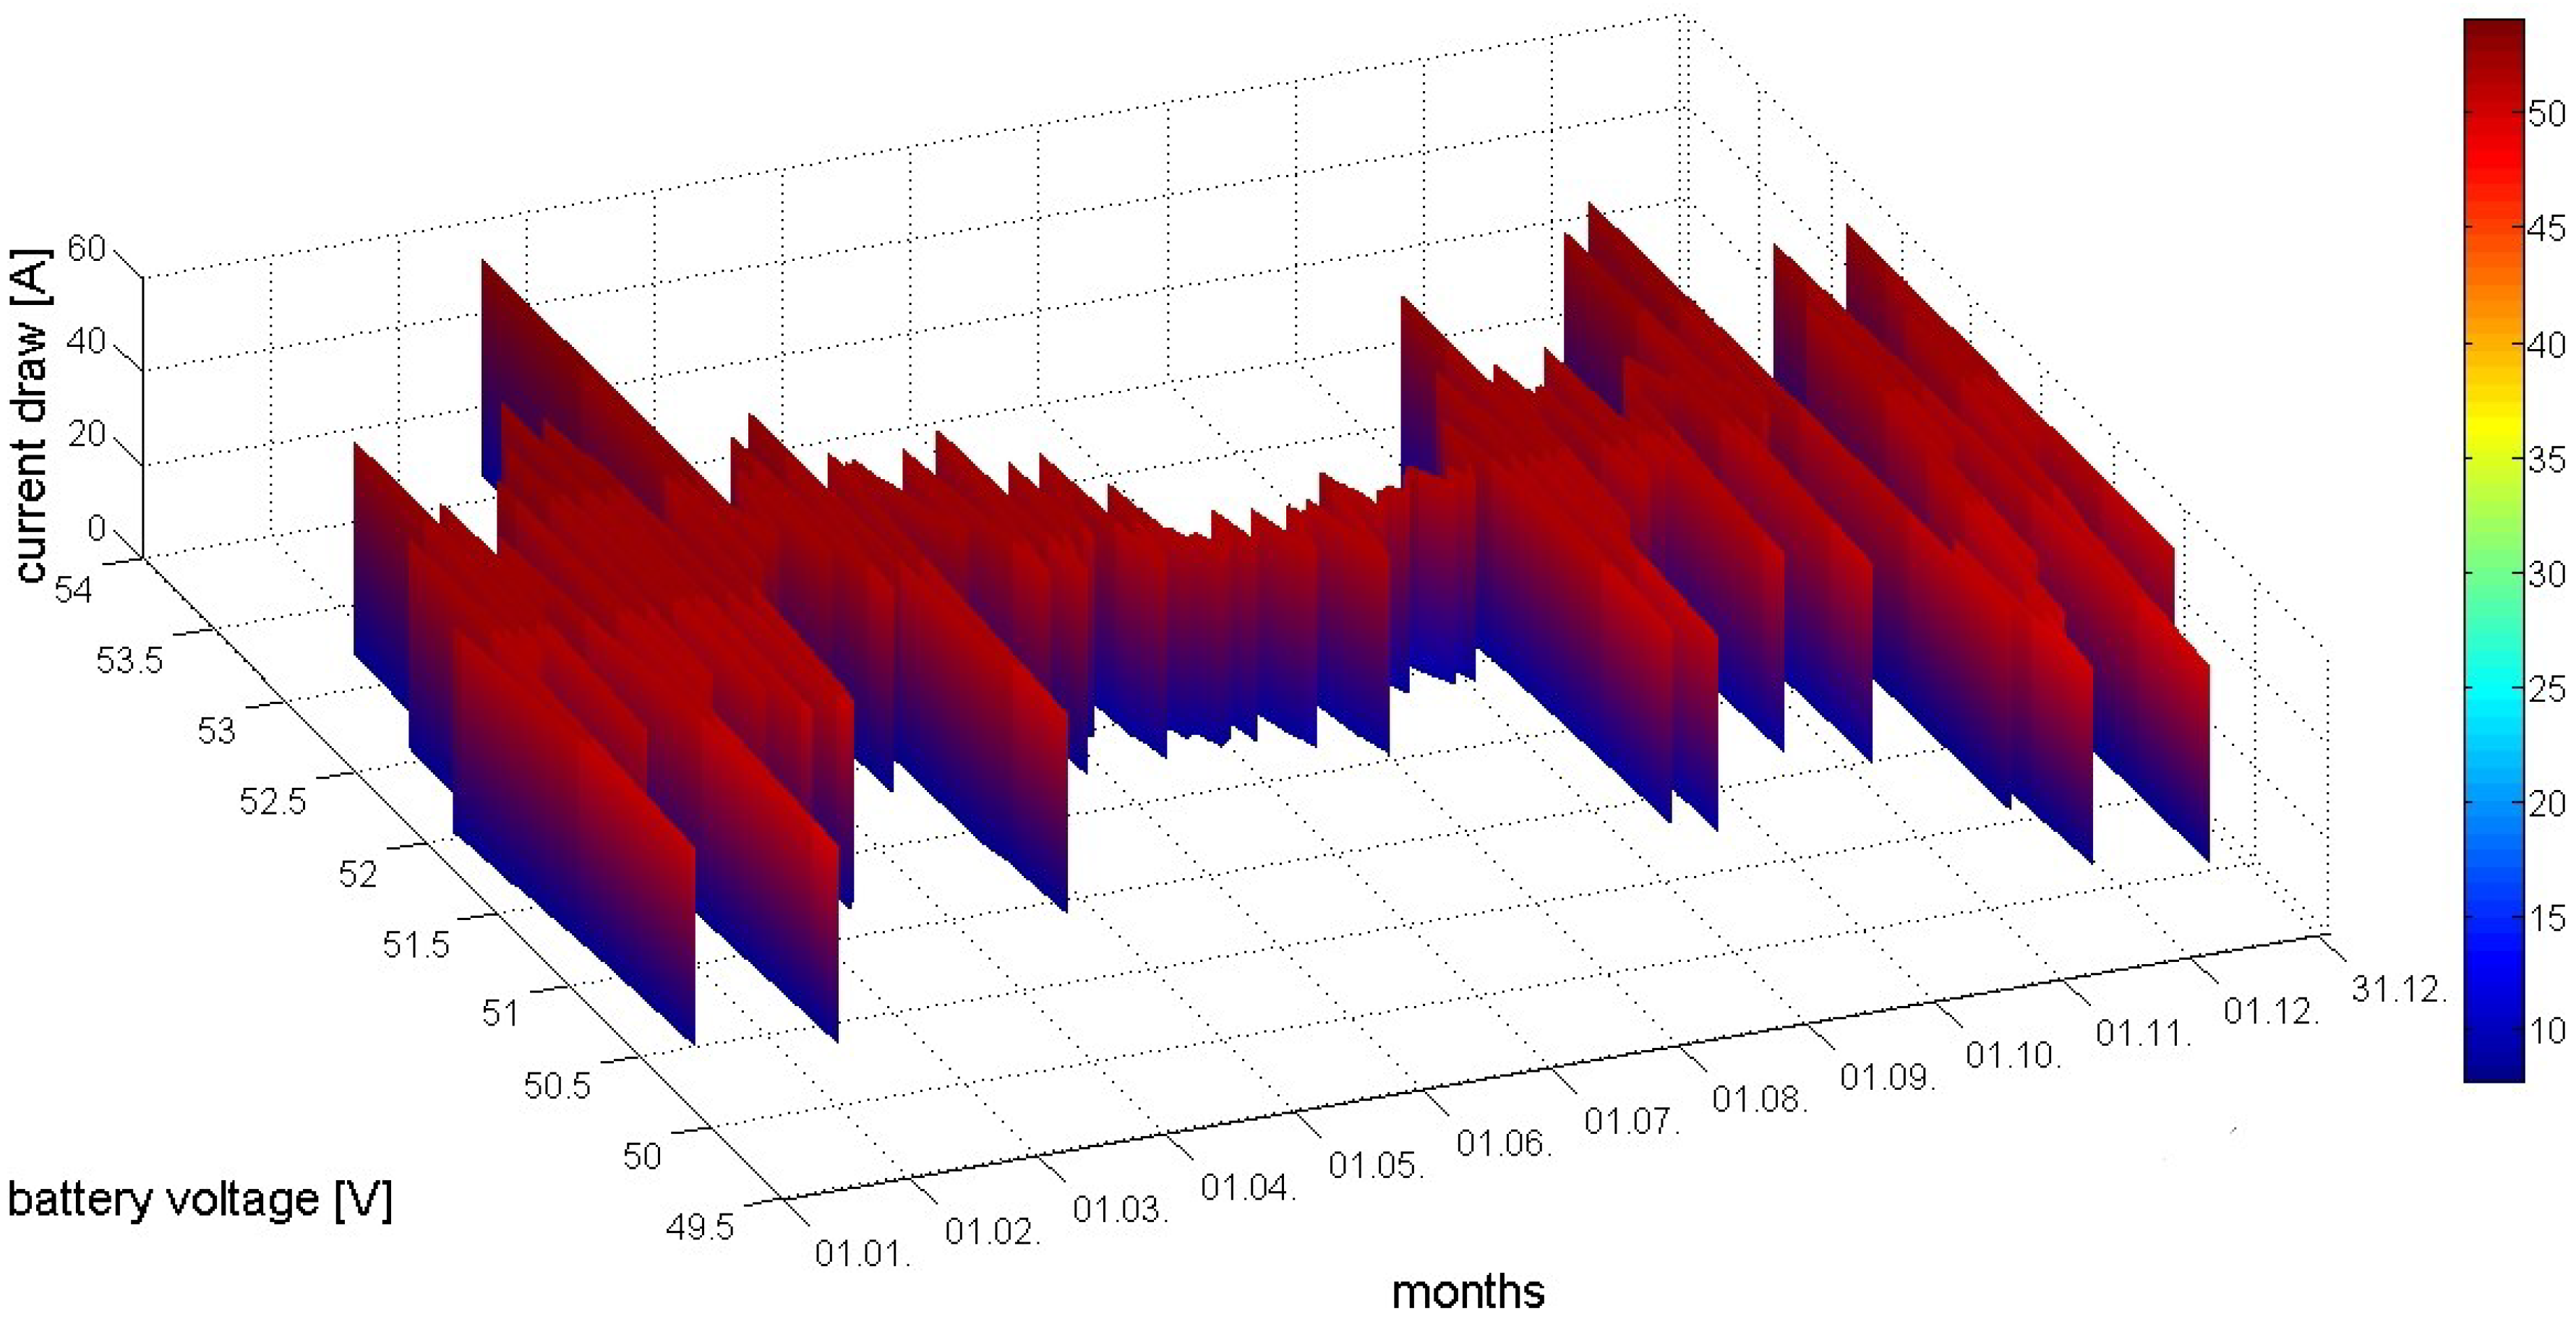
Figure 7.
3D visualization of interdependence among battery voltage and the total current draw for the BSS A during one year.
Figure 7.
3D visualization of interdependence among battery voltage and the total current draw for the BSS A during one year.
Nevertheless, it is worth emphasizing that the operating principle of BSS A is based on the active operation of the UMTS BS during the summer period, and the deactivation of this BS technology during other periods of the year. Since BSS A is allocated in a tourist-heavy region, its operating principle is based on the necessity for increasing BSS A capacity caused by huge increases in the number of users during this period of the year. Based on the monitored results for BSS A obtained during one year, it can be deduced that an installed power supply system cannot ensure an uninterrupted power supply of BSS A during the whole year. Hence, the network operator must upgrade the renewable power supply system in order to offer uninterrupted service from BSS A throughout a whole year. However, approaches to capacity and power generation improvements of renewable power supply systems are outside of the scope of this paper.
5.2. Monitoring Results for Site B
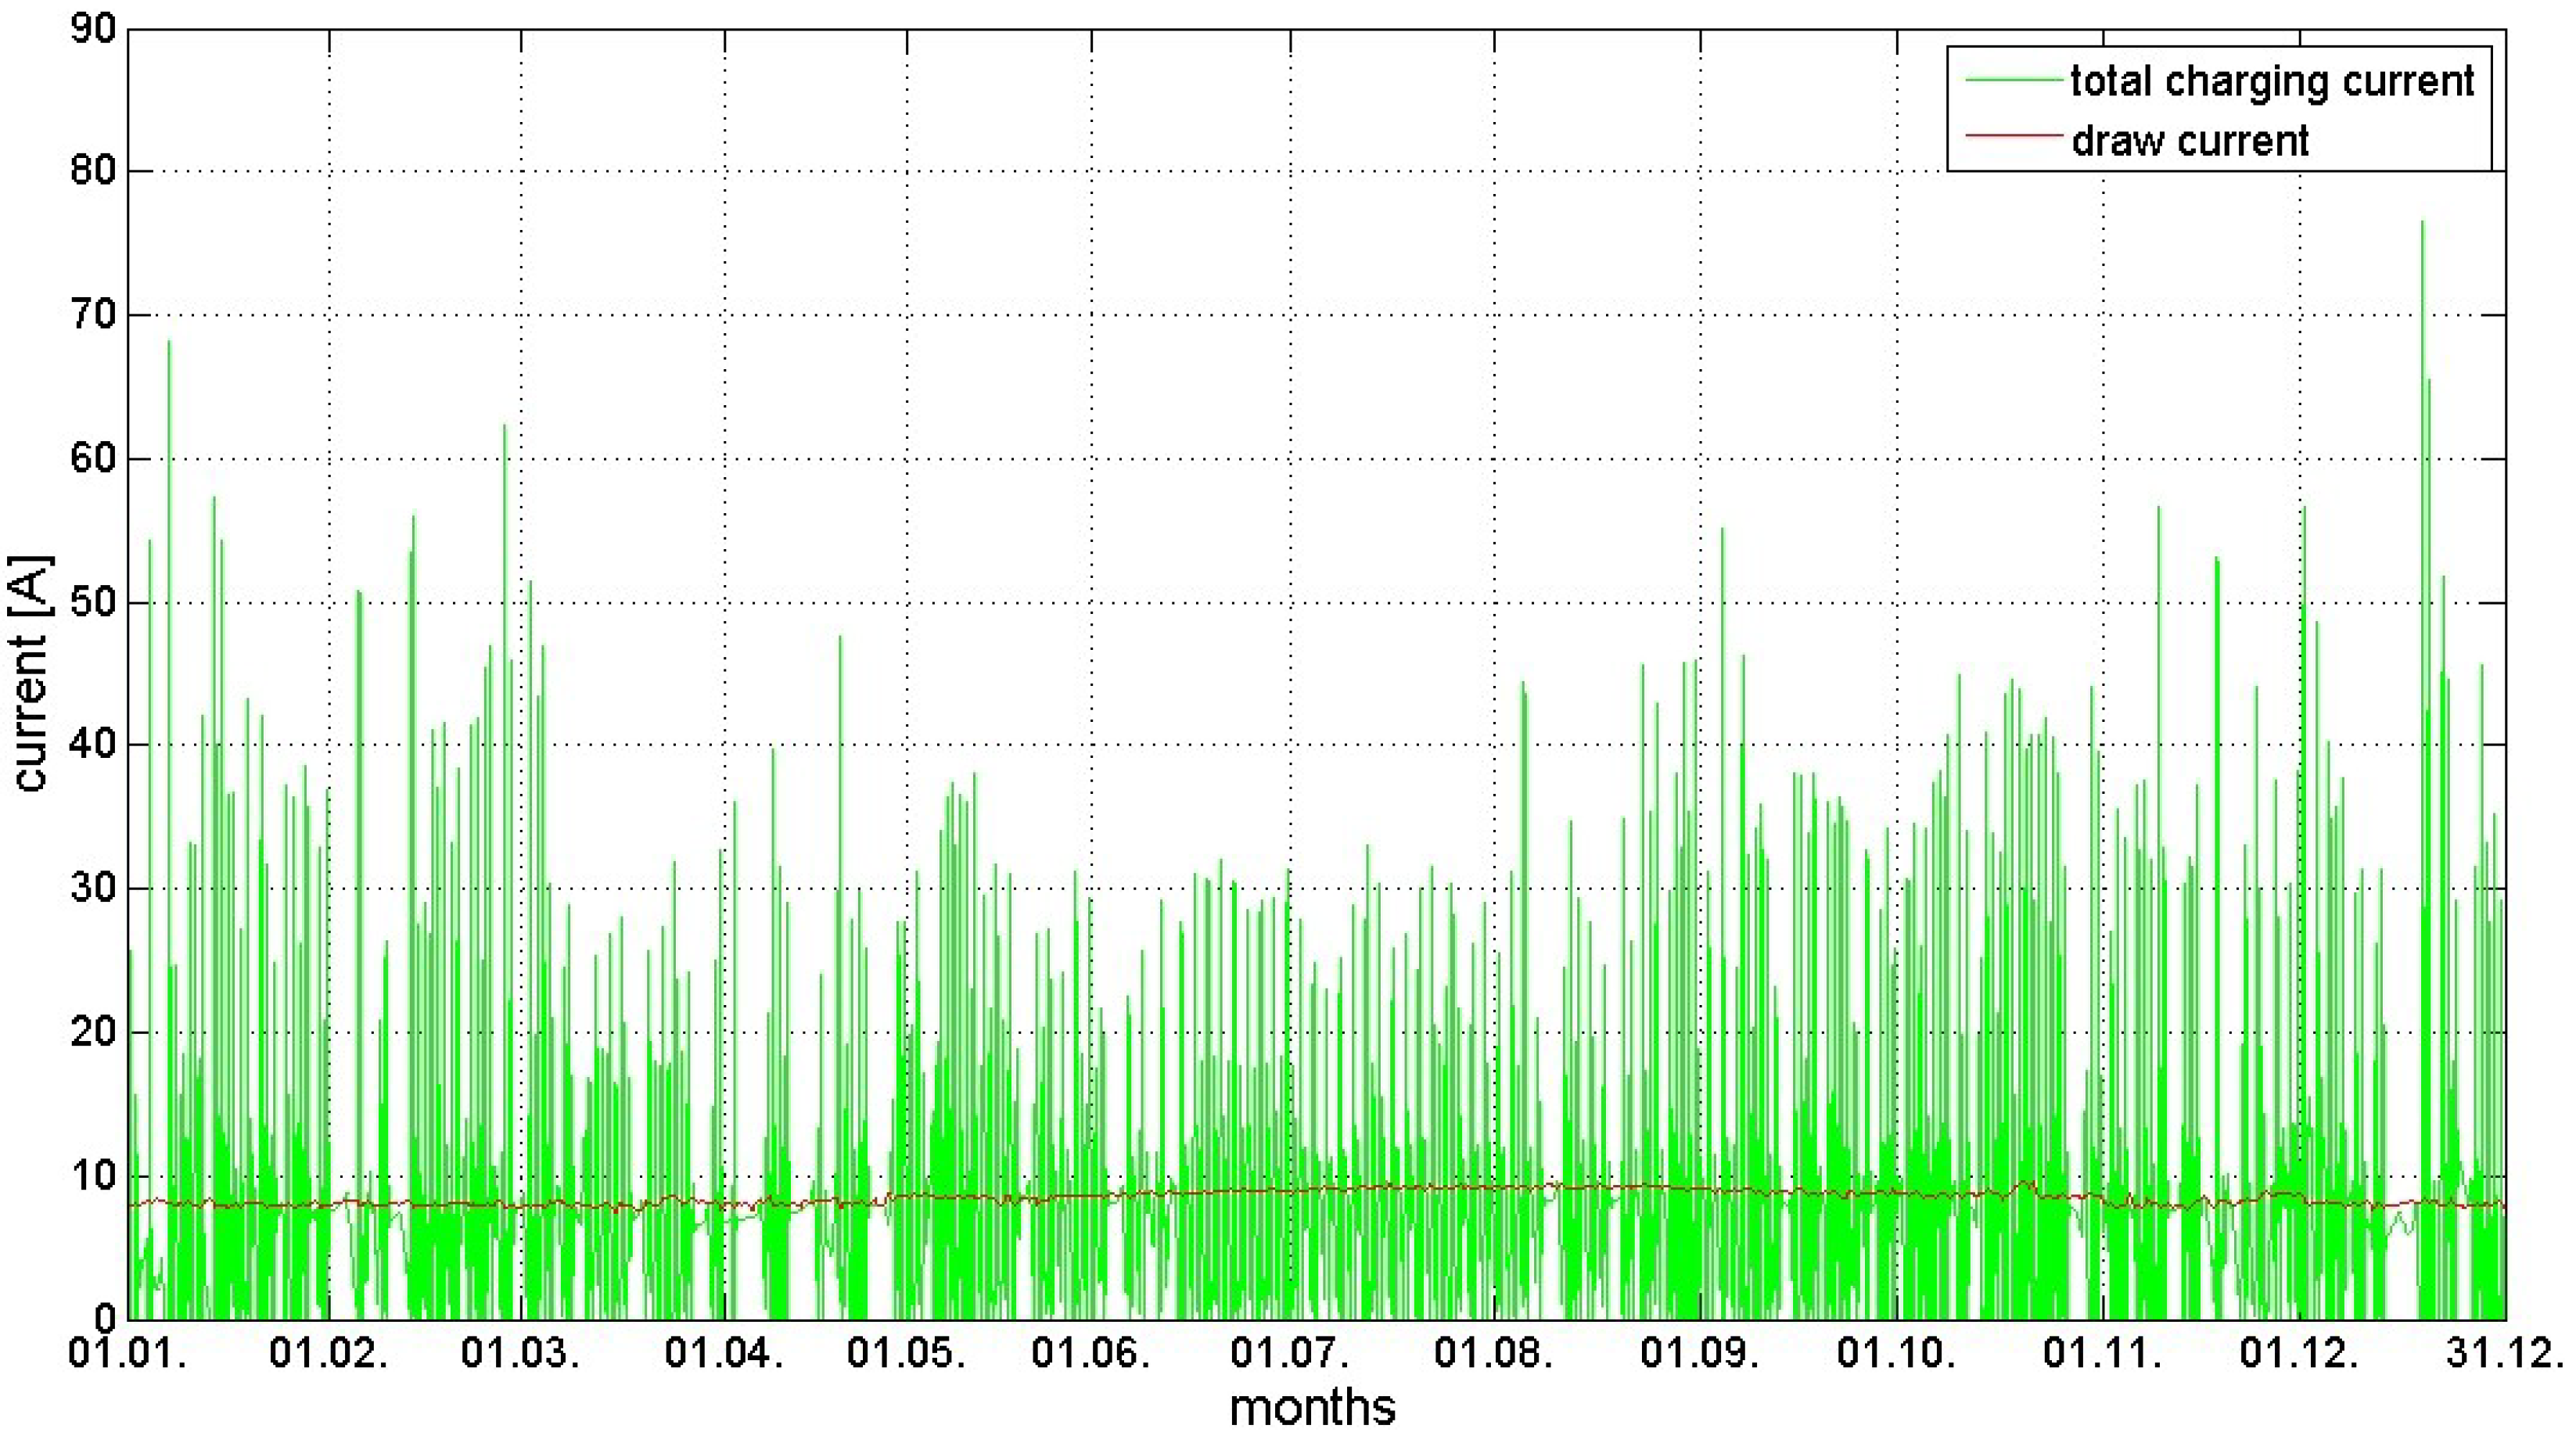
Another example of monitoring results obtained for the power supply system of the BSS B will be presented. In
Figure 8a and
Figure 9, the yearly charging current variation of the BSS B for the case of one PV array and both PV arrays is depicted, respectively. Compared with the measuring results presented in
Figure 4a for the BSS A, it can be noticed that the variation of charging current intensity on a yearly level is lower than those for the BSS A. This can be explained with somewhat inferior climate properties of the BSS B in terms of average yearly sunny hours and temperatures (
Table 2).
In addition, the charging current intensity of the BSS B that is presented in
Figure 8a and
Figure 9 is opposite to those of the BSS A presented in
Figure 4a and
Figure 5. Contrary to what was expected, higher charging current intensities are sensed during autumn and winter months, while during spring and summer months
Figure 8a and
Figure 9 show the smallest current generation intensity. The reason for such an unexpected yearly charging current pattern was caused by a dusty and salted surface of the PV panels during the spring and summer months. Although these months have been characterized with higher solar irradiation, they are also specific in terms of the lower rain intensity, which can contribute to the removal of impurities from the surface of PV modules. Lack of rain during these months results in a longer presence of impurities on the PVs surface, which blocks part of the sun irradiation and further causes the lower charging current intensity.
Figure 8.
(a) Variation of charging current in case of one solar array for the BSS B during a year; (b) Yearly variation of battery voltage for the BSS B.
Figure 8.
(a) Variation of charging current in case of one solar array for the BSS B during a year; (b) Yearly variation of battery voltage for the BSS B.
Still, this anomaly does not have a significant influence on the yearly variation of battery voltage as presented in
Figure 8b and
Figure 10. For the case of BSS B, it can be noticed that the voltage did not decrease below 44.7 V in any moment during a given year. Hence, the power supply system installed on the BSS B can ensure an uninterrupted power supply of the GSM BS installed on that site throughout a year. Compared with BSS A, the main reason for such a performance is a lower and relatively constant current draw throughout a year, as presented in
Figure 9 and
Figure 11. Such a discharging (draw) current pattern is caused by the “weaker” configuration of the BSS B containing only one 2 × 2 GSM BS (
Table 1). When compared with power demands of BS configurations installed on the BSS A and C, the BSS B configuration in terms of power demand is least. This is because BSS A contains a BS of one additional technology (UMTS), while the BSS C contains a GSM BS with a stronger 2 × 2 × 2 configuration (
Table 1). Based on the monitored results obtained for the BSS B, a mobile operator can conclude that an appropriate power supply system for the BSS B is used in terms of installed power supply capacity. In order to further improve the performance of the power supply system, more frequent cleaning of the PV surface throughout the year can increase power generation.
Figure 9.
Interdependence of total charging and discharging current for the BSS B during one year.
Figure 9.
Interdependence of total charging and discharging current for the BSS B during one year.
Figure 10.
Interdependence of total charging current and battery voltage for the BSS B on a yearly basis.
Figure 10.
Interdependence of total charging current and battery voltage for the BSS B on a yearly basis.
Figure 11.
3D visualization of interdependence among battery voltage and total current draw for the BSS B during one year.
Figure 11.
3D visualization of interdependence among battery voltage and total current draw for the BSS B during one year.
5.3. Monitoring Results for Site C
As mentioned in the previous subsection, the BSS C has a “stronger” GSM configuration than the BSS B (
Table 1). To satisfy the higher demand for power supply, besides two PV arrays equal to those installed on the BSS A and B, one wind turbine generator is installed on the BSS C.
Figure 12a,b present the yearly charging current variations for one PV array and the wind turbine generator, respectively. The presented variations are primarily caused by oscillations in sun irradiation or wind intensity during a year. In comparison with the yearly charging current variations of the PV array (
Figure 12a), higher variations of charging current can be noticed in the case of the wind turbine (
Figure 12b). This is due to the larger prevalence of wind direction and speed oscillations. This oscillation influences the total yearly charging current presented in
Figure 13 as a contribution to the charging currents from both renewable energy sources. For that reason, the total yearly charging current of the BSS C is more balanced and reaches its highest peak values more frequently when compared with the total yearly charging currents of the BSS A and B, as presented in
Figure 5 and
Figure 9, respectively. This positively influences the battery voltage, which according to
Figure 14 and
Figure 15 is above 44.7 V through a year. In the December-April period,
Figure 14 and
Figure 15 demonstrate that the battery voltage has reached its highest values. This is a consequence of the highest average wind speed intensities that are characteristic for the BSS C during this period. Higher wind speed intensities cause a higher contribution of wind-generated charging current to the total charging current, which is also reflected on the battery voltage in this period.
Another influence on the battery voltage is induced by the discharging current (draw).
Figure 13 presents the relationship between charging and the discharging current of the BSS C, while
Figure 16 shows the discharging (draw) current
vs. the battery voltage in the form of a 3D graph on the yearly level. According to
Figure 10 and
Figure 16, the discharging current (draw) slightly varies throughout a year with somewhat increased values detected during the summer. According to
Figure 5 and
Figure 9, similar results were obtained for the BSSs A and B, respectively. Such results are obtained due to the BSS C location, which like the BSSs A and B is situated in the touristic region. The highest traffic intensity during the summer months causes an increase of the BSs power consumption. However, in the case of the BSS B, the increase of discharging current during the summer (
Figure 11) is somewhat less pronounced in comparison to the BSS C (
Figure 16). This is due to the “weaker” GSM BS configuration installed on the BSS B (
Table 1), which can serve a lower number of users and transfer less traffic during a given moment. This fact influences a less visible total discharging current deviation during the summer period. Interested readers can find more information on the phenomena of macro BS power consumption variations caused by oscillations of traffic intensity in [
48,
49].
According to
Figure 13 and
Figure 14, an increase of discharging current during the summer period did not significantly influence battery voltage, which remained stable and at appropriate levels. It can be stated that BSS C has a properly capacitated power supply system, which ensures an uninterrupted supply all year round. This confirms that combining multiple sources of renewable energy for powering BSSs can offer a more reliable power supply system with higher installed nominal powers.
Figure 12.
Variation of charging current on the BSS C during a year for: (a) one solar array; (b) wind turbine.
Figure 12.
Variation of charging current on the BSS C during a year for: (a) one solar array; (b) wind turbine.
Figure 13.
Interdependence of total charging and discharging current for the BSS C during one year.
Figure 13.
Interdependence of total charging and discharging current for the BSS C during one year.
Figure 14.
Yearly variation of battery voltage for the BSS C.
Figure 14.
Yearly variation of battery voltage for the BSS C.
Figure 15.
Interdependence of total charging current and battery voltage for the BSS C on a yearly basis.
Figure 15.
Interdependence of total charging current and battery voltage for the BSS C on a yearly basis.
Figure 16.
3D visualization of interdependence among battery voltage and total current draw for the BSS C during one year.
Figure 16.
3D visualization of interdependence among battery voltage and total current draw for the BSS C during one year.
6. Comparison with Fuel Powered Systems
Comparison of the OPEX savings and CO
2 reductions obtained by an operator due to the implementation of RES for powering BSSs will be presented in this section. This is performed for a standalone BSS power supply system based on a fuel generator working in different operating modes. While the benefits of implementing RES have been compared in the literature with those of a fuel generator taking into account the energy needed for air conditioning of the BSSs [
36,
37,
39], our approach will extend comparative analyses on the cases when BSSs lack a classical air conditioning device.
Before “greening” BSSs, an operator uses conventional fuel generators for powering them. In
Table 3, the start-up/operating power consumptions of BSSs with anticipated redundant power consumptions have been presented. Almost twice as high power consumption of BSs during the start-up phase is assumed as a common phenomenon in most of the electronic devices. In addition, most of the operators in the planning phase anticipate increasing trend of BSSs power consumption in terms of the future needs. This trend is caused by BSSs reuse through the installation of additional BS equipment or newer generations of BSs.
As stated in
Section 3, installed BS equipment on the BSSs A, B and C, and all other green BSSs of an operator, does not require a separate air-conditioning device. This is because the operator installed a so-called “free cooling system”, based on a low power ventilator (10 W), which is activated when the temperature inside the BS rack increases. Although the ventilator power consumption is negligible, it improves natural air circulation through the BS door flap, which is dynamically opened based on ventilator activity. Before installation of the free cooling system, an operator uses a classical air conditioning device. Average power consumption of air-condition devices capacitated for different BSSs have been presented with corresponding operating and start-up power consumptions in
Table 4.
In addition, taking into account the type of temperature regulation system installed on BSSs, installed generators must be able to carry the start-up, operating and redundant load for each of the analyzed BSS (A, B and C). Hence, the installed generators have been sized to leave space for upgrades of the BSSs, and they never run above 85% of the load in order to avoid excessive mechanical strain. In
Table 4, the required generator sizing in terms of power supply capacity expressed in watts (W) and using a generator’s power factor 0.8 in volt- amperes (VA) are presented for each BSS. In general, it can be noticed that new design considerations and technology improvements in BS equipment and racks are dropping the fuel generator size needed for BSS power supply. For example, a typical macro outdoor BSS with an air-conditioning system requires a fuel generator with 10 kW–20 kW of generated power capacity, while an almost three times lower generator capacity is required for powering BSSs lacking a separate air-conditioning device. All installed fuel generators were single phase 50 Hz/230 V (gasoline/diesel) generators from the manufacturer Cummins Power (Onan). According to the manufacturer data sheets [
50], generators fueling consumption in liters per hour (L/h) are indicated in
Table 4 for different generator loads
p. By means of linear interpolation, models indicating fuel consumption
C for any load
p have been developed and presented in
Table 5.
Table 4.
Parameters of power consumption and power generation system of the BSSs with temperature regulation based on free cooling and air conditioning.
Table 4.
Parameters of power consumption and power generation system of the BSSs with temperature regulation based on free cooling and air conditioning.
| BSS Parameters | Free Cooling (without Air Conditioning) | With air Conditioning |
|---|
| BSS A | BSS B | BSS C | BSS A | BSS B | BSS C |
|---|
| Operating/start-up BSSs power consumption (W) | 937/1800 | 427/800 | 627/1200 | 937/1800 | 427/800 | 627/1200 |
| Redundant consumption for future needs (W) | 3000 | 1500 | 2400 | 3000 | 1500 | 2400 |
| Start-up/operating air conditioning power consumptions (W) | / | / | / | 7000/3500 | 5000/2500 | 6000/3000 |
| Installed fuel generators power (W/VA) | 4800/6000 | 2300/2875 | 3600/4500 | 13,500/16,875 | 9500/11,850 | 11,000/13,750 |
Average fuel consumption at: 0%/25%/50%/75%/100%
load (L/h) | 0.95/1.21/1.47/1.87/2.27 | 0.6/0.85/1.1/1.25/1.4 | 0.8/1.1/1.4/1.8/2.2 | 1.1/1.9/2.7/3.6/4.8 | 0.8/1.4/2.1/2.8/3.4 | 0.9/1.5/2.2/3/4 |
| Fuel type | Diesel | Gasoline | Gasoline | Diesel | Diesel | Diesel |
| Average daily operating load p without/with air conditioning (%) | 19.5 | 18.5 | 17.41 | 32.86/6.9 Yearly average: 19.88 | 30.81/4.4 Yearly average: 17.6 | 32.97/5.7 Yearly average: 19.33 |
| Average operating load p during first 2 h/4 h for 22 h/20 h daily generator activity (%) | 39 | 37 | 34.82 | 39.76 | 35.2 | 38.66 |
Table 5.
Interdependence of fuel consumption and generator load with corresponding consumptions for different operating modes.
Table 5.
Interdependence of fuel consumption and generator load with corresponding consumptions for different operating modes.
| Operating Mode of Fuel Generator | Fuel Consumption Model (L/h) | Average Fuel Consumption for Constant 24 h Daily Generator Activity (L/h) | Average Fuel Consumption during First 2 h/4h for 20 h/22 h Daily Generator Activity (L/h) |
|---|
| BSS A (free cooling) | C = 0.95 + p × 1.22 | 1.187 | 1.424 |
| BSS B (free cooling) | C = 0.6 + p × 0.866 | 0.760 | 0.92 |
| BSS C (free cooling) | C = 0.8 + p × 1.33 | 1.031 | 1.26 |
| BSS A (air conditioning) | C = 1.1 + p × 3.44 | 1.775 | 2.46 |
| BSS B (air conditioning) | C = 0.8 + p × 3 | 1.328 | 1.856 |
| BSS C (air conditioning) | C = 0.9 + p × 3.2 | 1.518 | 2.13 |
For each BSS, three different fuel generator operating modes have been selected for analysis. The first one is the most common mode where the fuel generator continually works 24 h throughout a year. Based on the fuel generator capacity installed on each BSS, an average daily operating load of each generator used for powering BSS with/without separate air-conditioning device is assumed and presented in
Table 4. In case of the BSSs with an air conditioning device, it is assumed that it is activated for half of a day (12 h).
Table 4 lists yearly average load as a mean value of loads with and without an active air conditioner.
However, some operators might implement somewhat more energy efficient schemes based on the temporary shutting down of a fuel generator in the period of the lowest daily energy consumption. During these periods, the energy needed for uninterrupted operation of BS equipment installed on BSS is assured from the batteries located on the BSS. In terms of this approach, we take into account two conservative cases based on the 22 and 20 continuous daily operating hours of the fuel generators. In practice, it is common that battery capacities on most of the BSSs are capacitated for at least 4 h of backup power supply. Hence, for the case of the 22 and 20 h daily generator activity, the fuel generator is turned off for 2 or 4 h during each day, respectively. This scheme is suitable in the areas where connecting BSS on the electricity grid is not economically justified, while BSSs location lacks appropriate level of the energy from renewable sources.
With this approach, however, it is necessary to take into account higher generator load due to the battery discharge induced in the periods when generators are in the off state (last row in
Table 4). After turning on the fuel generator, besides the load caused by BS equipment, an additional load is induced as a consequence of the larger charging current that is necessary for recharging partially discharged batteries. It is reasonable to assume that an equal number of hours during which the generator was in the off state are necessary for recharging the batteries after the generator is turned on. This means that for the operating mode based on 22 h of daily generator activity, the load during 20 h corresponds to the average daily load (
Table 4), while the load during first two operating hours corresponds to the higher load. As presented in
Table 4, in these periods we assume a twice as high generator load then those that are characteristic for the average daily operating load. Similarly, this is also true for the mode based on 20 h of daily generator activity. For average daily operating loads and for the case of higher loads in periods of recharging batteries, the fuel consumption for generators installed on analyzed BSS is calculated based on developed linear models (relations) and is presented in
Table 5.
Energy Efficiency Comparison
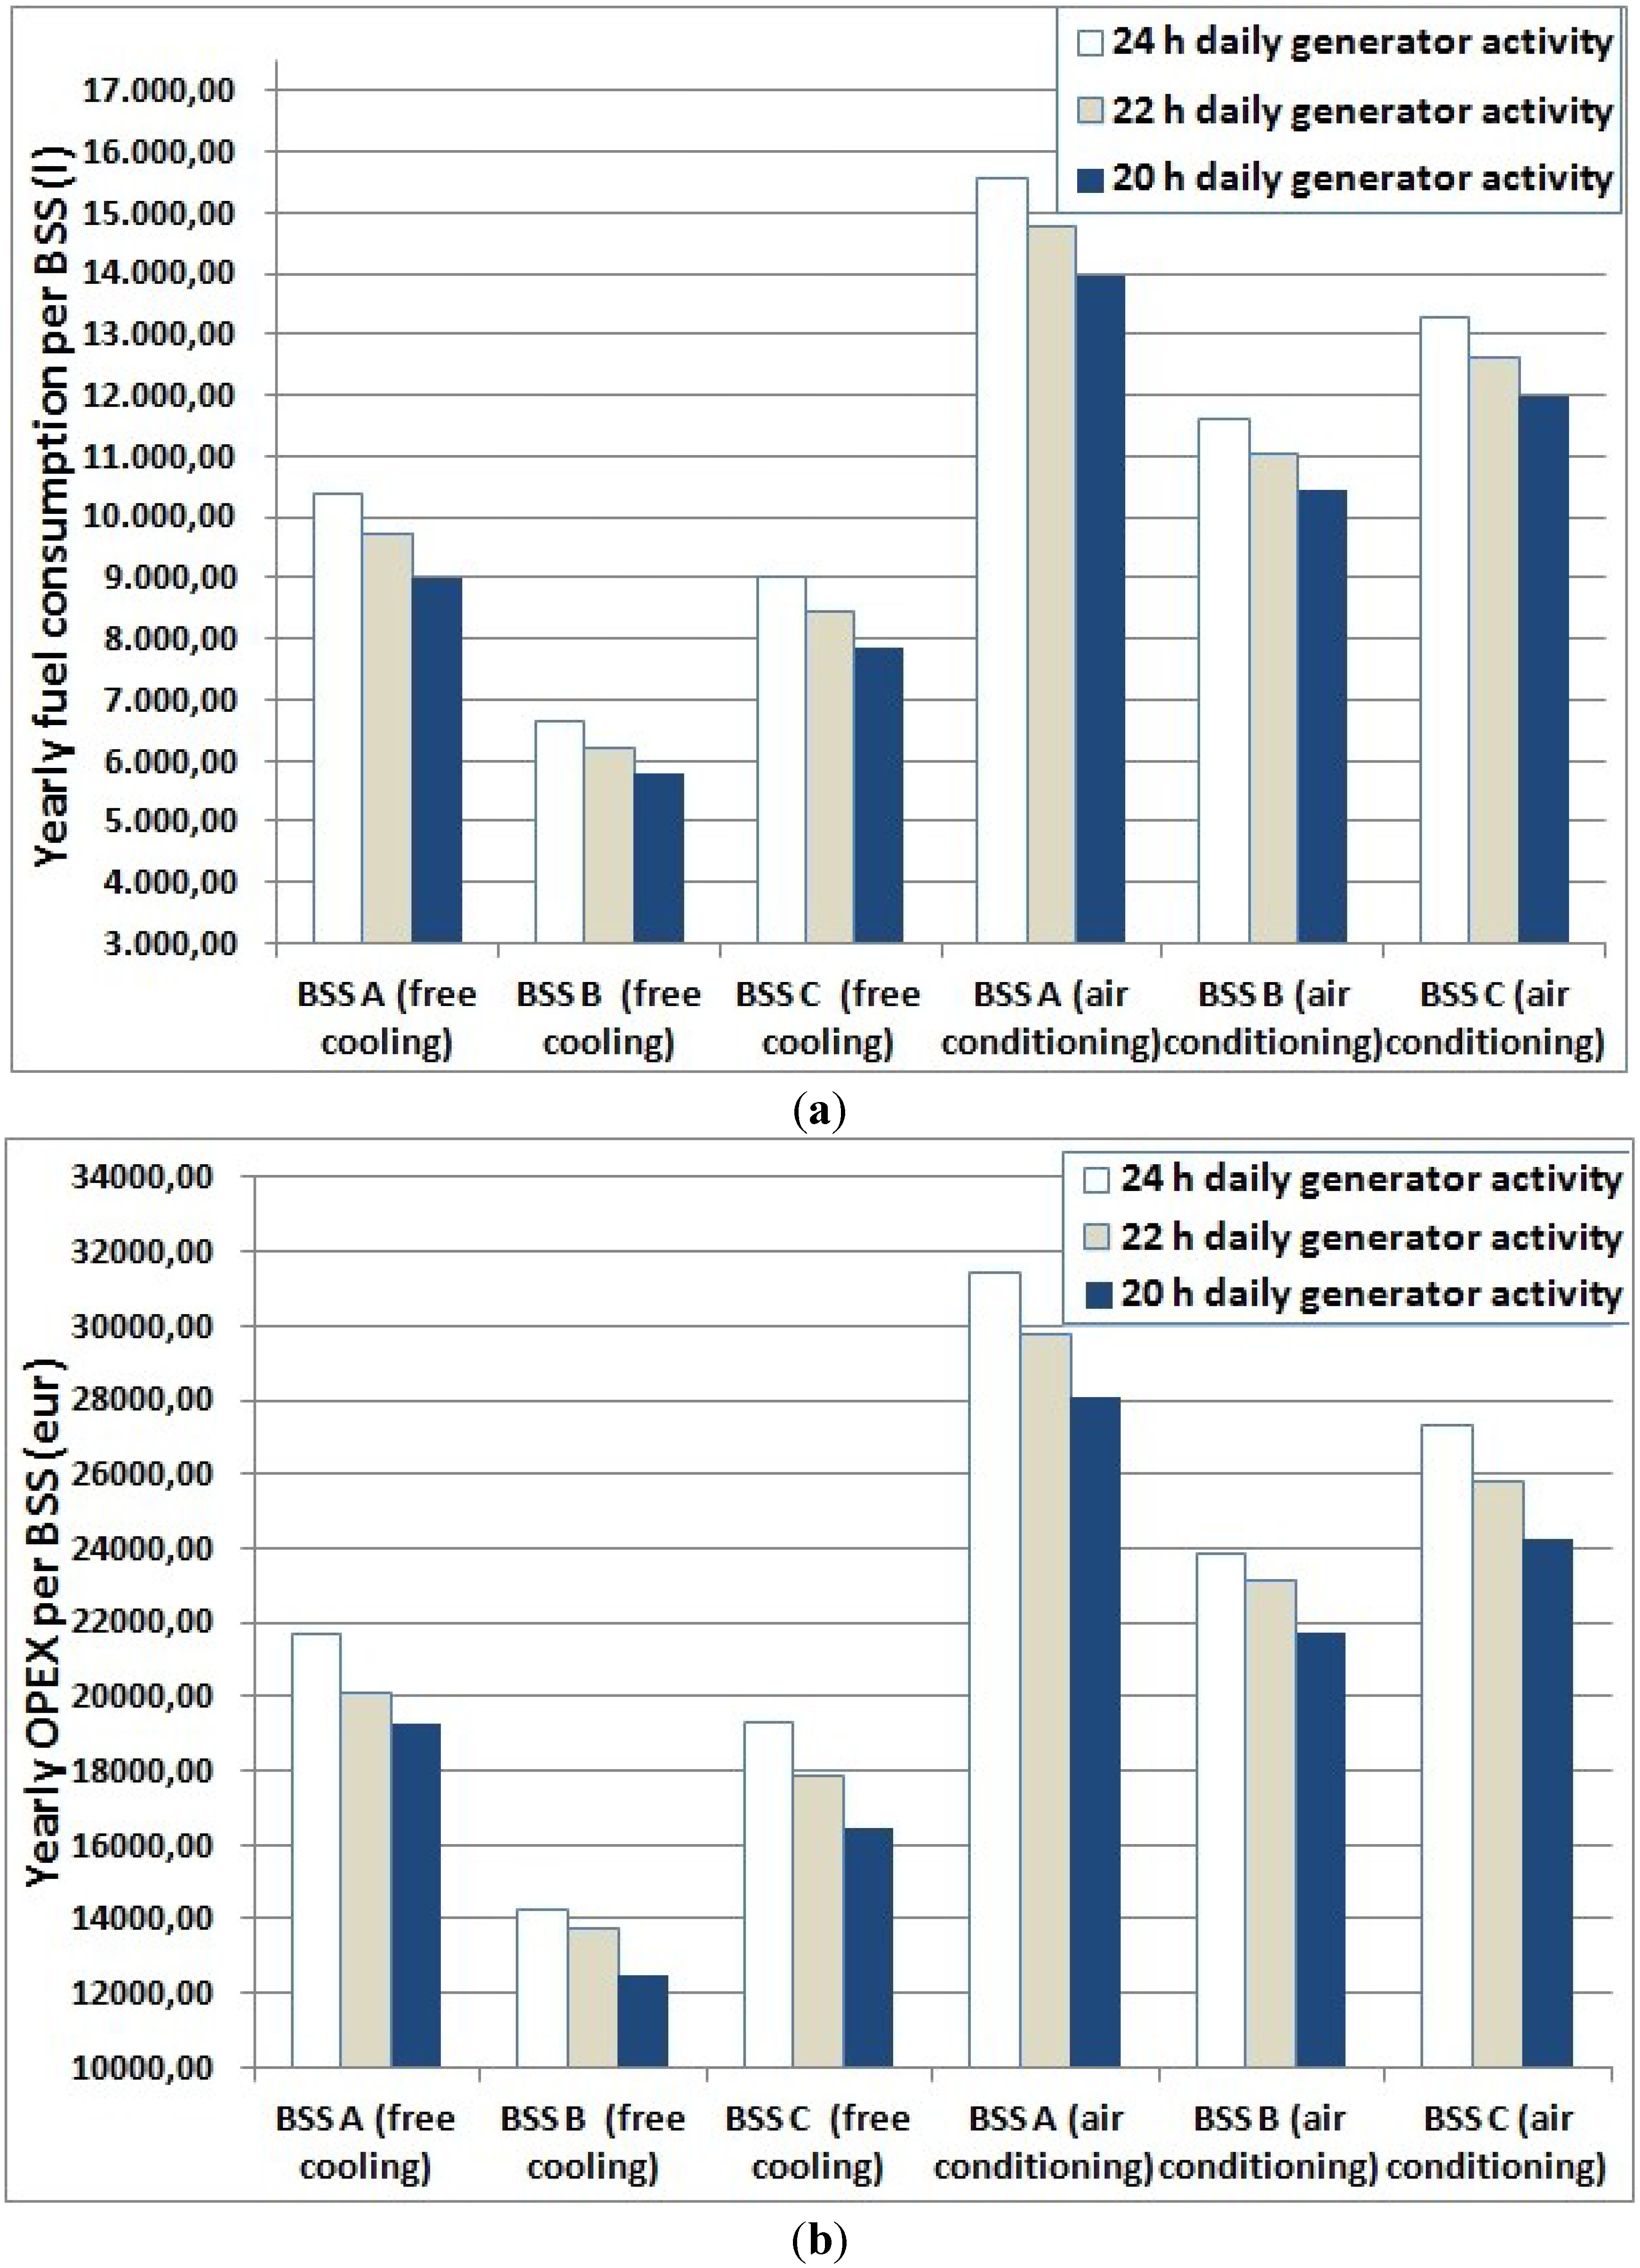
The graphs in
Figure 17a indicate the yearly fuel consumption of each generator installed on analyzed BSSs. BSSs A and B have the highest and the lowest yearly fuel consumption, respectively. This is because yearly fuel consumption is dominantly influenced by the strength of the installed fuel generator. According to
Table 4, the generators with higher power generation capacity consume more fuel per hour for the same load, and vice versa. Yearly fuel consumption directly influences yearly OPEX as presented for each BSS in
Figure 17b. Based on the information obtained from an operator, one refueling of 1000 liter (L) fuel tank for one BSS costs €3,125. This cost includes fuel, transportation and transhipment costs. Hence, higher yearly fuel consumption results in a higher amount of refueling, which consequently increases OPEX. For example, yearly OPEX for BSS A with and without air conditioning and 24 h daily generator activity equals to €31,458.80 and €21,652.74, respectively. This is almost a €10,000 yearly OPEX difference per BSS, which emphasizes the advantages of a free cooling system lacking the need for installation of a separate air conditioning device. Hence, in areas indigent with energy from RES or for on-grid BSSs containing BS(s) of the weaker hardware configurations, implementation of the free cooling system can significantly reduce OPEX.
In addition,
Figure 17a,b show lower yearly fuel consumption and consequently lower OPEX for the same BSS in case of implementing 22 h or 20 h daily generator activity modes. As an example, OPEXs for BSS C with a free cooling system equals to €19,287.87, €17,860.32 and €16,432.76 for 24 h/22 h/20 h daily generator activity modes, respectively. Hence for off-grid BSS located in areas lacking energy from RES, the implementation of on/off fuel generator activity modes can bring significant OPEX reductions.
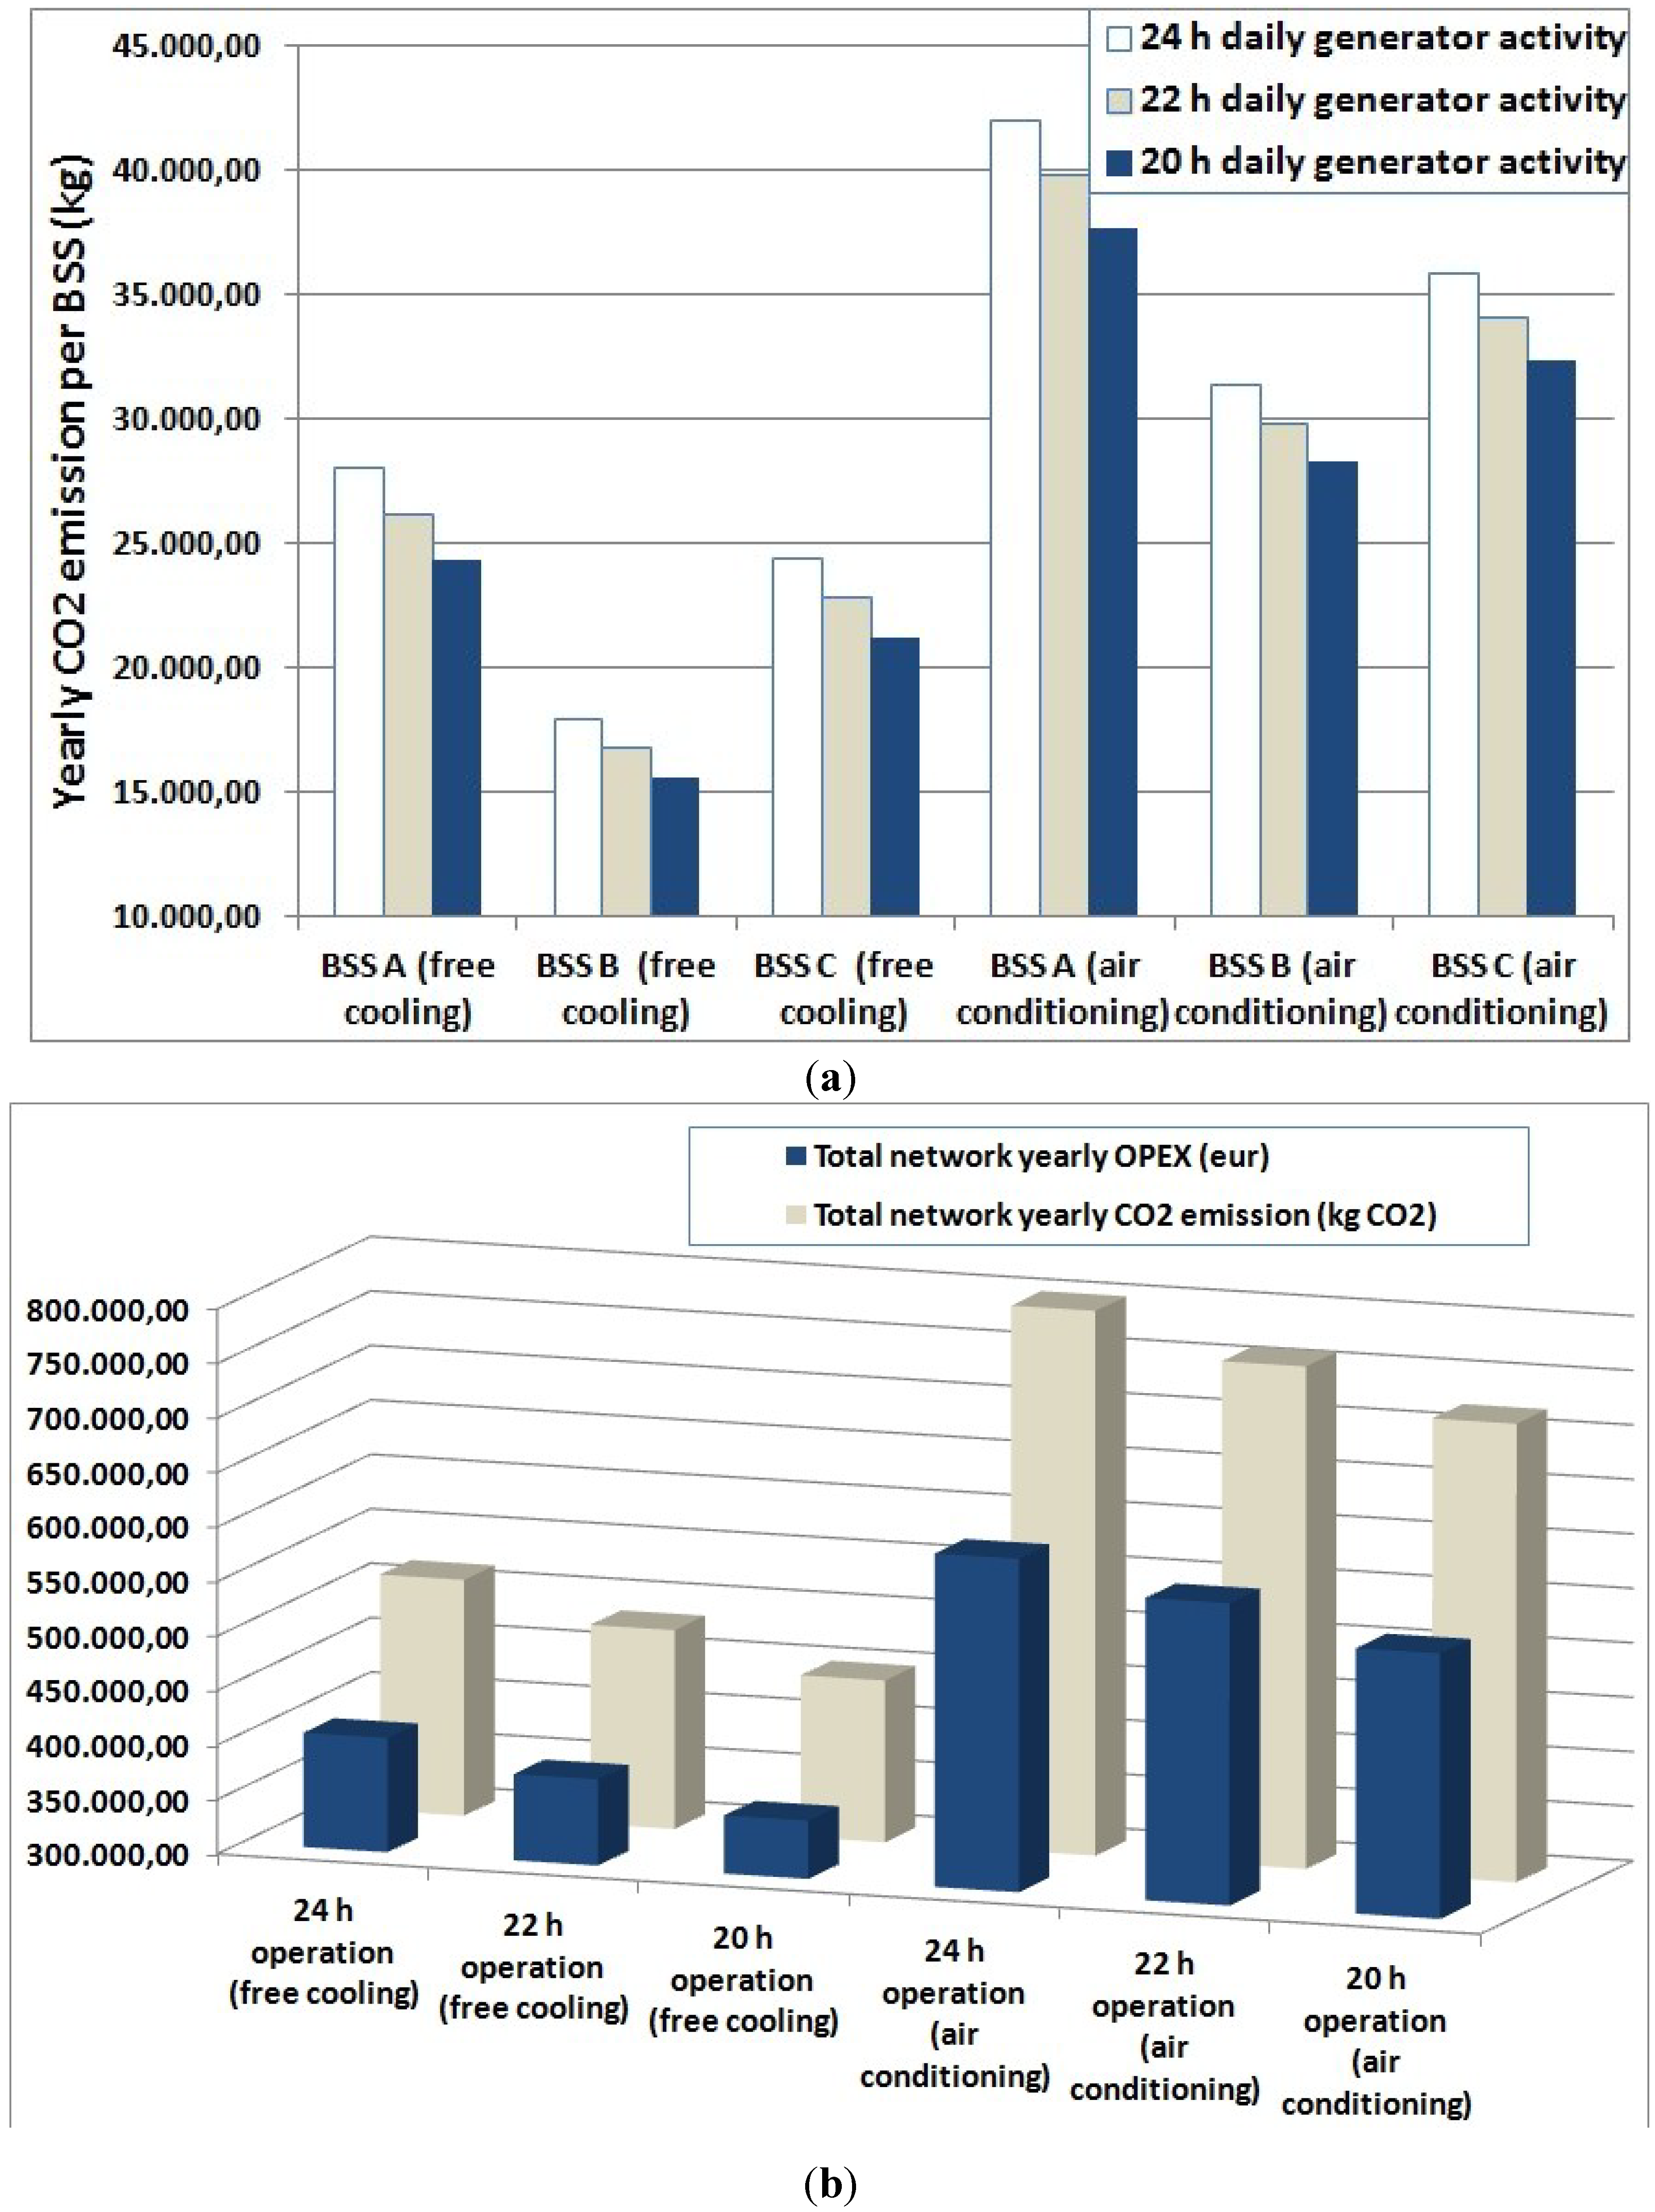
Yearly CO
2 emissions per BSS have been presented in
Figure 18a. It can be noticed that generator fuel consumption also directly influences the CO
2 emissions, since fuel generators having lower power capacities consume less fuel per hour. By taking this into account, for 1 liter of consumed diesel fuel, 2.7 kg of CO
2 is emitted in the atmosphere. Hence, the highest polluters are BSSs powered with 24-h. active generator having the highest power capacities. According to
Figure 18a, a 24-h active fuel generator used for powering BSS A with air conditioning emits 41.92 tons (t) of CO
2 in the atmosphere during one year, while in the case of BSS A with a free cooling system this accounts for 28.074 t of CO
2. It can be noticed that, besides the reduction in OPEX, the implementation of a free cooling system reduces yearly CO
2 emissions. This is also true in the case of implementing the 22 h/20 h daily generator activity mode. As an example, for BSS B with free cooling, CO
2 emissions have been reduced from 17.97 t (24 h operating mode) to 16.79 t/15.61 t (
Figure 18a), respectively.
Since three analyzed BSSs represent typical operators green BSSs, through averaging results for the OPEX and CO
2 emissions of those BSSs we managed to approximate the total network yearly OPEX and CO
2 emissions. For different daily generator activity modes and for BSSs with free cooling and air conditioning, the total yearly OPEX and CO
2 emissions have been presented in
Figure 18b. Since the operator currently has 22 fully operated green BSSs,
Figure 18b indicates for this number of green BSSs, the total yearly OPEX savings and reductions of the CO
2 emissions. Those savings and reductions are a consequence of transforming fuel generator powered BSSs into green BSSs powered from RESs. Depending on the implemented generator activity mode and type of temperature regulating system, on the level of total network, an operator can make OPEX savings ranging between €353,349,56 (free cooling/20 h generator activity mode) and €605,923.64 (air condition/24 h generator activity mode). In addition, reductions of the CO
2 emissions on the yearly level range between 20.38 t (free cooling/20 h generator activity mode) and 516.528 t (air condition/24 h generator activity mode). According to the presented analyses, the implementation of RESs brings significant monetary savings to the operator on the yearly level and reductions of CO
2 emissions, which makes network operators more ecologically aware.
Figure 17.
For different operating modes of power generators: (a) yearly fuel consumption per analyzed BSS; (b) yearly OPEX savings per analyzed BSS.
Figure 17.
For different operating modes of power generators: (a) yearly fuel consumption per analyzed BSS; (b) yearly OPEX savings per analyzed BSS.
Figure 18.
For different operating modes of power generators: (a) yearly CO2 emissions reduction per analyzed BSS; (b) total network yearly CO2 emission and OPEX reductions.
Figure 18.
For different operating modes of power generators: (a) yearly CO2 emissions reduction per analyzed BSS; (b) total network yearly CO2 emission and OPEX reductions.
7. CAPEX Comparison
Besides the OPEX comparison considering different BSSs power supply and temperature regulation systems, analogy related to the capital expenditure (CAPEX) among the RES and fuel generator systems is another topic of an operator’s interest. In
Table 6, the CAPEX comparison among the power supply systems, with respect to different temperature regulation systems is presented. Data presented in
Table 6 were obtained directly from the equipment vendors and through communication with an operator. Analyses presented in
Table 6 have been performed for the previously analyzed BSSs with characteristics presented in
Table 1, having the power generation and temperature regulation systems as those presented in
Table 4. Recall that capacitating of each power supply system has been performed according to yearly energy demand obtained through presented on-site measurements. To have comprehensive analyses, in the case of the BSSs with air- conditioning systems, the RES system with the twice higher installed power (Wp) than those for previously analyzed green BSSs is assumed in
Table 6. It is reasonable to believe that such capacitating of the RES system can satisfy increased energy needs of the BSSs with air-conditioning system (recall that the BSS A does not have satisfactory RES power supply capacity).
In addition, it is worth to indicate that the fuel generator installation costs might significantly vary depending on the transport complexity to a BSS location. Some average values obtained from an operator are used for analyses. Although significantly contributing to the overall CAPEX of a BSS, the batteries’ cost is not included in the analyses due to the fact that the RES and fuel generator power supply system must have batteries which CAPEX is assumed to be the same.
According to the results presented in
Table 6, overall CAPEX for the BSSs A and B powered with the RES systems (only solar) is lower when compared with the corresponding CAPEX of the fuel generator system. This is due to the costs of the PV system which is lower than those of the fuel generator system. In the case of BSS C power supply systems, the CAPEX for the RES system (solar and wind) is higher than those for the fuel generator system. Hence, combining more than one RES type as power supply source can significantly increase the total CAPEX of a power supply system. When compared with the fuel generator power supply system, this consequently results with the higher RES system CAPEX. However, if installation costs due to the complex fuel generator transportation are high (can be up to 10 times higher than cost of the fuel generator), the CAPEX of corresponding RES system will always outperform those of the fuel generator.
Analyses of the CAPEX per kWp of installed BSS energy supply peak power (€/kWp), shows similar values for both supply systems. This is mainly consequence of decreasing trend in the unit price of the RES power supply system elements (PV modules, wind turbine) during last decade. In addition, in
Table 6, it can be noticed that the type of the temperature regulation system does not have significant influence on the overall CAPEX of a BSS. Additionally,
Table 6 indicates that the CAPEX savings which are specific for each BSS can be treated as one-time savings, and they range from 5% to 42%. In the case when operators reuse BSSs by replacing older with newer equipment while retaining existing power supply system, the CAPEX of power supply system as parameter in a cellular network planning phase cannot be pronounced as more significant than the OPEX of power supply system. This is because the OPEX savings, through long BSS lifetime, outperform such one-time CAPEX savings.
Table 6.
Capital expenditure (CAPEX) comparison among the BSSs power supply systems with respect to the different temperature regulation systems.
Table 6.
Capital expenditure (CAPEX) comparison among the BSSs power supply systems with respect to the different temperature regulation systems.
| BSS Power Supply Parameters | Free Cooling (without Air Conditioning) | With air Conditioning |
|---|
| BSS A | BSS B | BSS C | BSS A | BSS B | BSS C |
|---|
| Peak installed power of fuel generator systems (pW) | 4800 | 4200 | 3600 | 13,500 | 9500 | 11,000 |
| Fuel generator cost (€) | 7300 | 3100 | 3800 | 11,000 | 9800 | 10,200 |
| Fuel generator installation cost (€) | 2000 | 2000 | 2000 | 4000 | 4000 | 4000 |
| External double sheeted fuel tank (1000 L) cost (€) | 1250 | 1250 | 1250 | 1250 | 1250 | 1250 |
| Air conditioning (including installation) cost (€) | / | / | / | 1000 | 600 | 800 |
| Ventilator with thermostat (€) | 130 | 130 | 130 | / | / | / |
| Peak installed power of RES systems (pW) | 4000 | 4000 | 5300 | 8000 | 8000 | 10,600 |
| PV modules costs including cables (€) | 4000 | 4000 | 4000 | 8000 | 8000 | 8000 |
| Installation cost of PV system including mounting elements (€) | 2000 | 2000 | 2000 | 4000 | 4000 | 4000 |
| Wind turbine system cost (€) | / | / | 2000 | / | / | 4000 |
| Installation cost of wind turbine system (€) | / | / | 1000 | / | / | 1500 |
| Total CAPEX of fuel generator based systems (€) | 10,680 | 6480 | 7180 | 17,250 | 15,650 | 16,250 |
| CAPEX per kW of installed strength—fuel generator power supply systems (€/kWp) | 2.23 | 1.54 | 1.99 | 1.28 | 1.65 | 1.48 |
| Total CAPEX of RES based systems (€) | 6,130 | 6130 | 9130 | 12,000 | 12,000 | 17,500 |
| CAPEX per kW of installed strength—RES power supply systems (€/kWp) | 1.53 | 1.53 | 1.72 | 1.50 | 1.50 | 1.65 |
| CAPEX savings among fuel generator and RES power supply system (€) | 4550 | 350 | 1950 | 5250 | 3650 | 1250 |
| Percentage of CAPEX savings (%) | 42.60% | 5.40% | 27.16% | 30.43% | 23.32% | 7.69% |
8. Conclusions
Due to increases in the worldwide deployments of green BSSs powered by means of RES systems, implementation of a wireless sensor network for remote monitoring of such power supply systems has been presented. Since such a monitoring system gives cellular operators an insight into the instant values of sensing quantities and the possibility of historical analyses of the collected data, much useful information considering the performance of the green BSSs power supply systems have been presented. More specifically, based on the sensed quantities related to charging/discharging current and battery voltage, detailed performance analyses of the RES systems for three green BSSs containing different BS technologies and renewable energy sources has been performed. It is shown that careful capacity planning of the RES systems for the green BSSs must be done in order to eliminate the power supply outages throughout a year, caused by variations in the intensity of some energy sources, such as the sun or wind.
In addition, the linear models expressing interdependence among a fuel generator load and the fuel consumption are proposed for analyzed BSSs. Based on developed models, analyses showing huge OPEX savings and the CO2 reductions incurred for each green BSS due to the transformation from a generator powered into the RES powered BSS are presented on the level of each BSS and a complete operator network. In addition, paper proposes novel approach to the fuel consumption reduction of the fuel generators. The approach is based on regulation of a daily fuel generator activity through on/off switching and implementation of the free-cooling system for air-conditioning of the BSSs. Through such analyses, it is shown that the free-cooling and regulation of the fuel generators daily activity significantly influence on the OPEX savings and CO2 reduction. Additionally, when compared with the corresponding fuel generator power supply systems, analyses shows advantage of most of the RES systems in terms of the CAPEX savings.
Our future research activities will be focused on further improvements of the developed monitoring system in terms of the intelligent predictions of possible power supply interruptions or necessary upgrades.


