
Pre-Sizing Approach of a Fuel Cell-Battery Hybrid Power System with Interleaved Converters


ESTACA, ESTACA’Lab, Paris-Saclay, 78066 Paris, France
*
Authors to whom correspondence should be addressed.
Energies 2023, 16(10), 4068; https://doi.org/10.3390/en16104068
Submission received: 3 April 2023
/
Revised: 8 May 2023
/
Accepted: 8 May 2023
/
Published: 12 May 2023
(This article belongs to the Section E: Electric Vehicles)
Abstract
:This paper proposes a design methodology that is dedicated to improving the concept of a modular hybrid power chain that uses interleaved converters. The approach involves optimising the system under multi-physical constraints, where the number of cells in the interleaved converters is considered as a key modular parameter. The methodology uses analytical models to strike a balance between computation time and result accuracy. This compromise is indispensable to the construction of a smart design approach under multi-physical constraints, such as electric, efficiency, volume, and thermal constraints. The proposed approach has been applied to a hybrid fuel cell and battery power system for automotive applications; the goal is to obtain a global optimal architecture chain by optimising the number of interleaved converter cells and by determining appropriate power electronics components and the optimal sizing of sources. This constitutes the primary step for providing an effective pre-design support tool for considering architecture modularity, facilitating the use of new technologies in the early design stage. The results showed that the interleaving concept allows for better flexibility in respecting the design constraints to improve the design of hybrid power systems. The analysis also highlights the current limitations and performance of the optimisation method and suggests new areas for future work.
1. Introduction
Global warming and air pollution are serious issues that affect our everyday life [1]. Air pollution is a significant problem in many industrialized cities worldwide, and vehicle emissions are one of the primary contributors. The transportation sector is indeed a vital aspect of human development and economic growth [2]; however, it also has negative environmental impacts that must be addressed to ensure a sustainable future. Governments, businesses, and individuals must take action to reduce their carbon footprint and promote sustainable practices in transportation and other sectors. Fortunately, an important goal in the automotive industry continues to be the development of alternative and new solutions for mobility transition, which results in a constant evolution of the industry. This is reflected by the integration of new solutions that are, in essence, based on the electrification concept. While electric vehicles (EVs) and hybrid electric vehicles (HEVs) have certainly made progress towards reducing emissions, they still face the limitations of battery technology and charging infrastructure: autonomy, security, refueling, durability, etc., hence the importance of introducing other promising solutions for mobility transition [3,4].
The fuel cell electric vehicle (FCEV) is one of the key solutions for this transition; it is often based on the concept of hybridization, particularly the use of PEMFC technology (proton exchange membrane fuel cell) as the main source and a battery or supercapacitor as the electric assistance [5]. Compared with conventional EVs, this class of vehicle allows for a better driving range and faster refueling time, but it requires the construction of a complex system. Improving the design process and system integration is essential for increasing the market penetration of FCEVs and for overcoming some of the challenges that are associated with this technology, such as efficiency, durability/reliability, and cost. This implies the need for design methodologies to have the ability to consider the multi-physical constraints and available technologies, topologies, and strategies (control/energy management) to achieve the system integration according to the considered performance indexes [6].
The concept of hybridization allows for the possibility of having multiple architectures. Each architecture differs from the converter(s) used; it constitutes an essential element, which is either used to increase the voltage of the energy source or lower it and have the appropriate degrees of freedom for energy management strategy. Several converters have been introduced in the literature for such an application (boost, buck, buck–boost, etc.) In [7,8,9], brief studies on the different power conversion topologies were presented before the designing of a multi-phase boost converter. These standard structures do not provide any degree of freedom for the sizing, energy efficiency, continuity of service, etc. Another promising concept that is emerging is named the interleaving technique; it consists of the parallel arrangement of switching cells [10,11,12], which allows for the power to flow through the different cells. Figure 1 illustrates the representation of an interleaved boost converter.
This construction allows for a stress reduction on each cell (active and passive components), which increases the possibilities for technical choices and thus favors the use of more “standard” components. Another advantage of this type of architecture is the apparent frequency that is increasing inside the converter, as shown in Figure 2, which proportionally increases with the number of cells, thus reducing the need for filtering. Refs. [11,13,14] present the different benefits of an interleaving boost converter in terms of efficiency, fault tolerance, etc. The interleaving concept also allows for a current ripple reduction at the input of the converter, which preserves the energy source from high current fluctuations. This principle provides a better flexibility for respecting the design constraints, and it expands the margin between the limit and its boundary, thus making it possible for the technology to operate closer to its limits without exceeding them; this can allow for a more compact and cost-effective design.
However, interleaving implies the implementation of an appropriate control that allows for a balanced distribution between the cells and allows for the ability to perform reconfiguration to benefit from the modularity [15]. It consists of a close control that follows the same duty cycle () and is regularly shifted from one cell to another (Td/q).
It can also be noted that the complexity of the powertrain is amplified by hybridization, leading to various additional parameters, constraints, and multidisciplinary issues. This includes a strong interaction between the components, new driving conditions, and other challenges. To address this system complexity, numerous performance indexes and a range of factors must be considered, such as the most suitable components, optimal sizes, and associated energy management strategy; hence there is an industrial challenge to improve the design process and enhance the performance and efficiency. This paper deals with these challenges by developing an effective sizing approach that also addresses the modularity concept by introducing the interleaved architecture.
Compared with other pre-sizing approaches that only focus on the interleaved converter [16,17,18], the present design deals with a global hybrid architecture that employs a fuel cell by addressing the interaction between the sources and the associated power electronics; these interactions can have a significant impact on the performance of the hybrid powertrain and must be carefully managed to ensure optimal operation, which can be conducted by offering a more effective solution for optimising the performances and efficiency.
This paper is structured as follows: the first part will detail the existing and used topologies in the current studies of the field. Another section explains all the representations used in this work. Finally, some results and an analysis will be exposed in the last part.
2. State-of-the-Art
After explaining the scientific concept of this study, this section will discuss the state-of-the-art in the field considered, starting with the global architecture and then zooming in on the components, namely the sources and converters within the power chain.
2.1. Architecture/Components
In this context, many FCEV architectures are possible, which differ according to the energy sources chosen and the associated power electronics. Several topologies are possible, as explained in [19,20]. An FCEV is usually composed of a fuel cell (FC), which is considered to be an energy device with low dynamics (cannot provide power quickly), along with an energy-storage system (ESS). The ESS can comprise various equipment, such as a battery pack, ultra-capacitors, etc. For our use case, we chose to have a battery pack as a power/energy storage system to create a hybrid architecture with FC downsizing that is not supported by an ultracapacitor (power storage system). The three structures are mainly used according to [21]:
- The two-converter structure, consisting of the association of a converter for each source. Although it is the arrangement with the largest number of degrees of freedom, it remains a complex system in terms of control design.
- The direct parallel structure, which directly connects the sources to the load. This disposition, however, requires an over-sized FC to provide the demanded power to the load.
- The one-converter structure, which only places one converter at one source (usually the FC) to downsize the associated source. It presents some constraints related to the management of the battery state of charge.
Regarding the technology of the sources, many different fuel cell technologies have been developed [22]; these are typically based on the operating temperature and electrolyte type used. In the transport sector, low-temperature fuel cells are preferred, such as the PEMFC, which has a low operating temperature (30–100 °C) and a solid membrane that absorbs system vibrations [20,23,24,25,26]. In terms of modelling, there are several different approaches depending on the level of detail required and the specific application (chemical, electrochemical, efficiency, hydrogen consumption, etc.). Static models are one type of fuel cell model that are commonly used based on steady-state operating conditions. They can be relatively simple, with only a few parameters, or they can be more complex, with multiple variables and inputs [27].
On the other hand, modelling batteries is also a complex task that requires the consideration of various parameters, including the type of battery, its chemistry, and its operating conditions. The choice of an appropriate battery model depends on the application and purpose for which the battery will be used. There are several different types of battery models that can be used, each with their own advantages and disadvantages. Some common types of battery models include empirical models, equivalent circuit models, and electrochemical models, as explicated in [28].
Concerning the power converters, as in this case, both energy sources provided a DC voltage, i.e., only DC–DC converters were treated. There are different types of DC–DC converters that are well explained in the literature [29,30] (step-down, step-up, galvanically isolated or not, reversible or not, etc.). The choice of the appropriate DC–DC converter for a fuel cell/battery system depends on several parameters, including the input and output voltage, power rating, efficiency, size and weight, etc.
2.2. Design Approach
In the literature, several studies have proposed various approaches to design a hybrid system that combines different power sources; two methods have emerged in HEV design applications: empirical approaches and computational approaches, as explained in [31]. With the rise of computer science, optimisation-based approaches have become increasingly popular for the design of hybrid systems. Compared with the traditional approaches that make a solution according to the rated conditions, systemic approaches involving a sequential process of individual optimisations or multi-objective optimisation methods have also been introduced; they provide more comprehensive solutions that take into account multiple performance criteria and constraints. Their implementation depends on the compromise between the complexity of the structure, the computation time, and the exploration capabilities. On this topic, many optimisation algorithms have emerged [32]; among them, two relevant techniques were selected: the particle swarm optimisation (PSO) technique and the genetic algorithm (GA) [33]. Both techniques are rather simple to implement and fast to process and a comparative study is essential in order to make a choice between them according to the considered requirements.
3. Implementation and Modelling
3.1. Approach Description
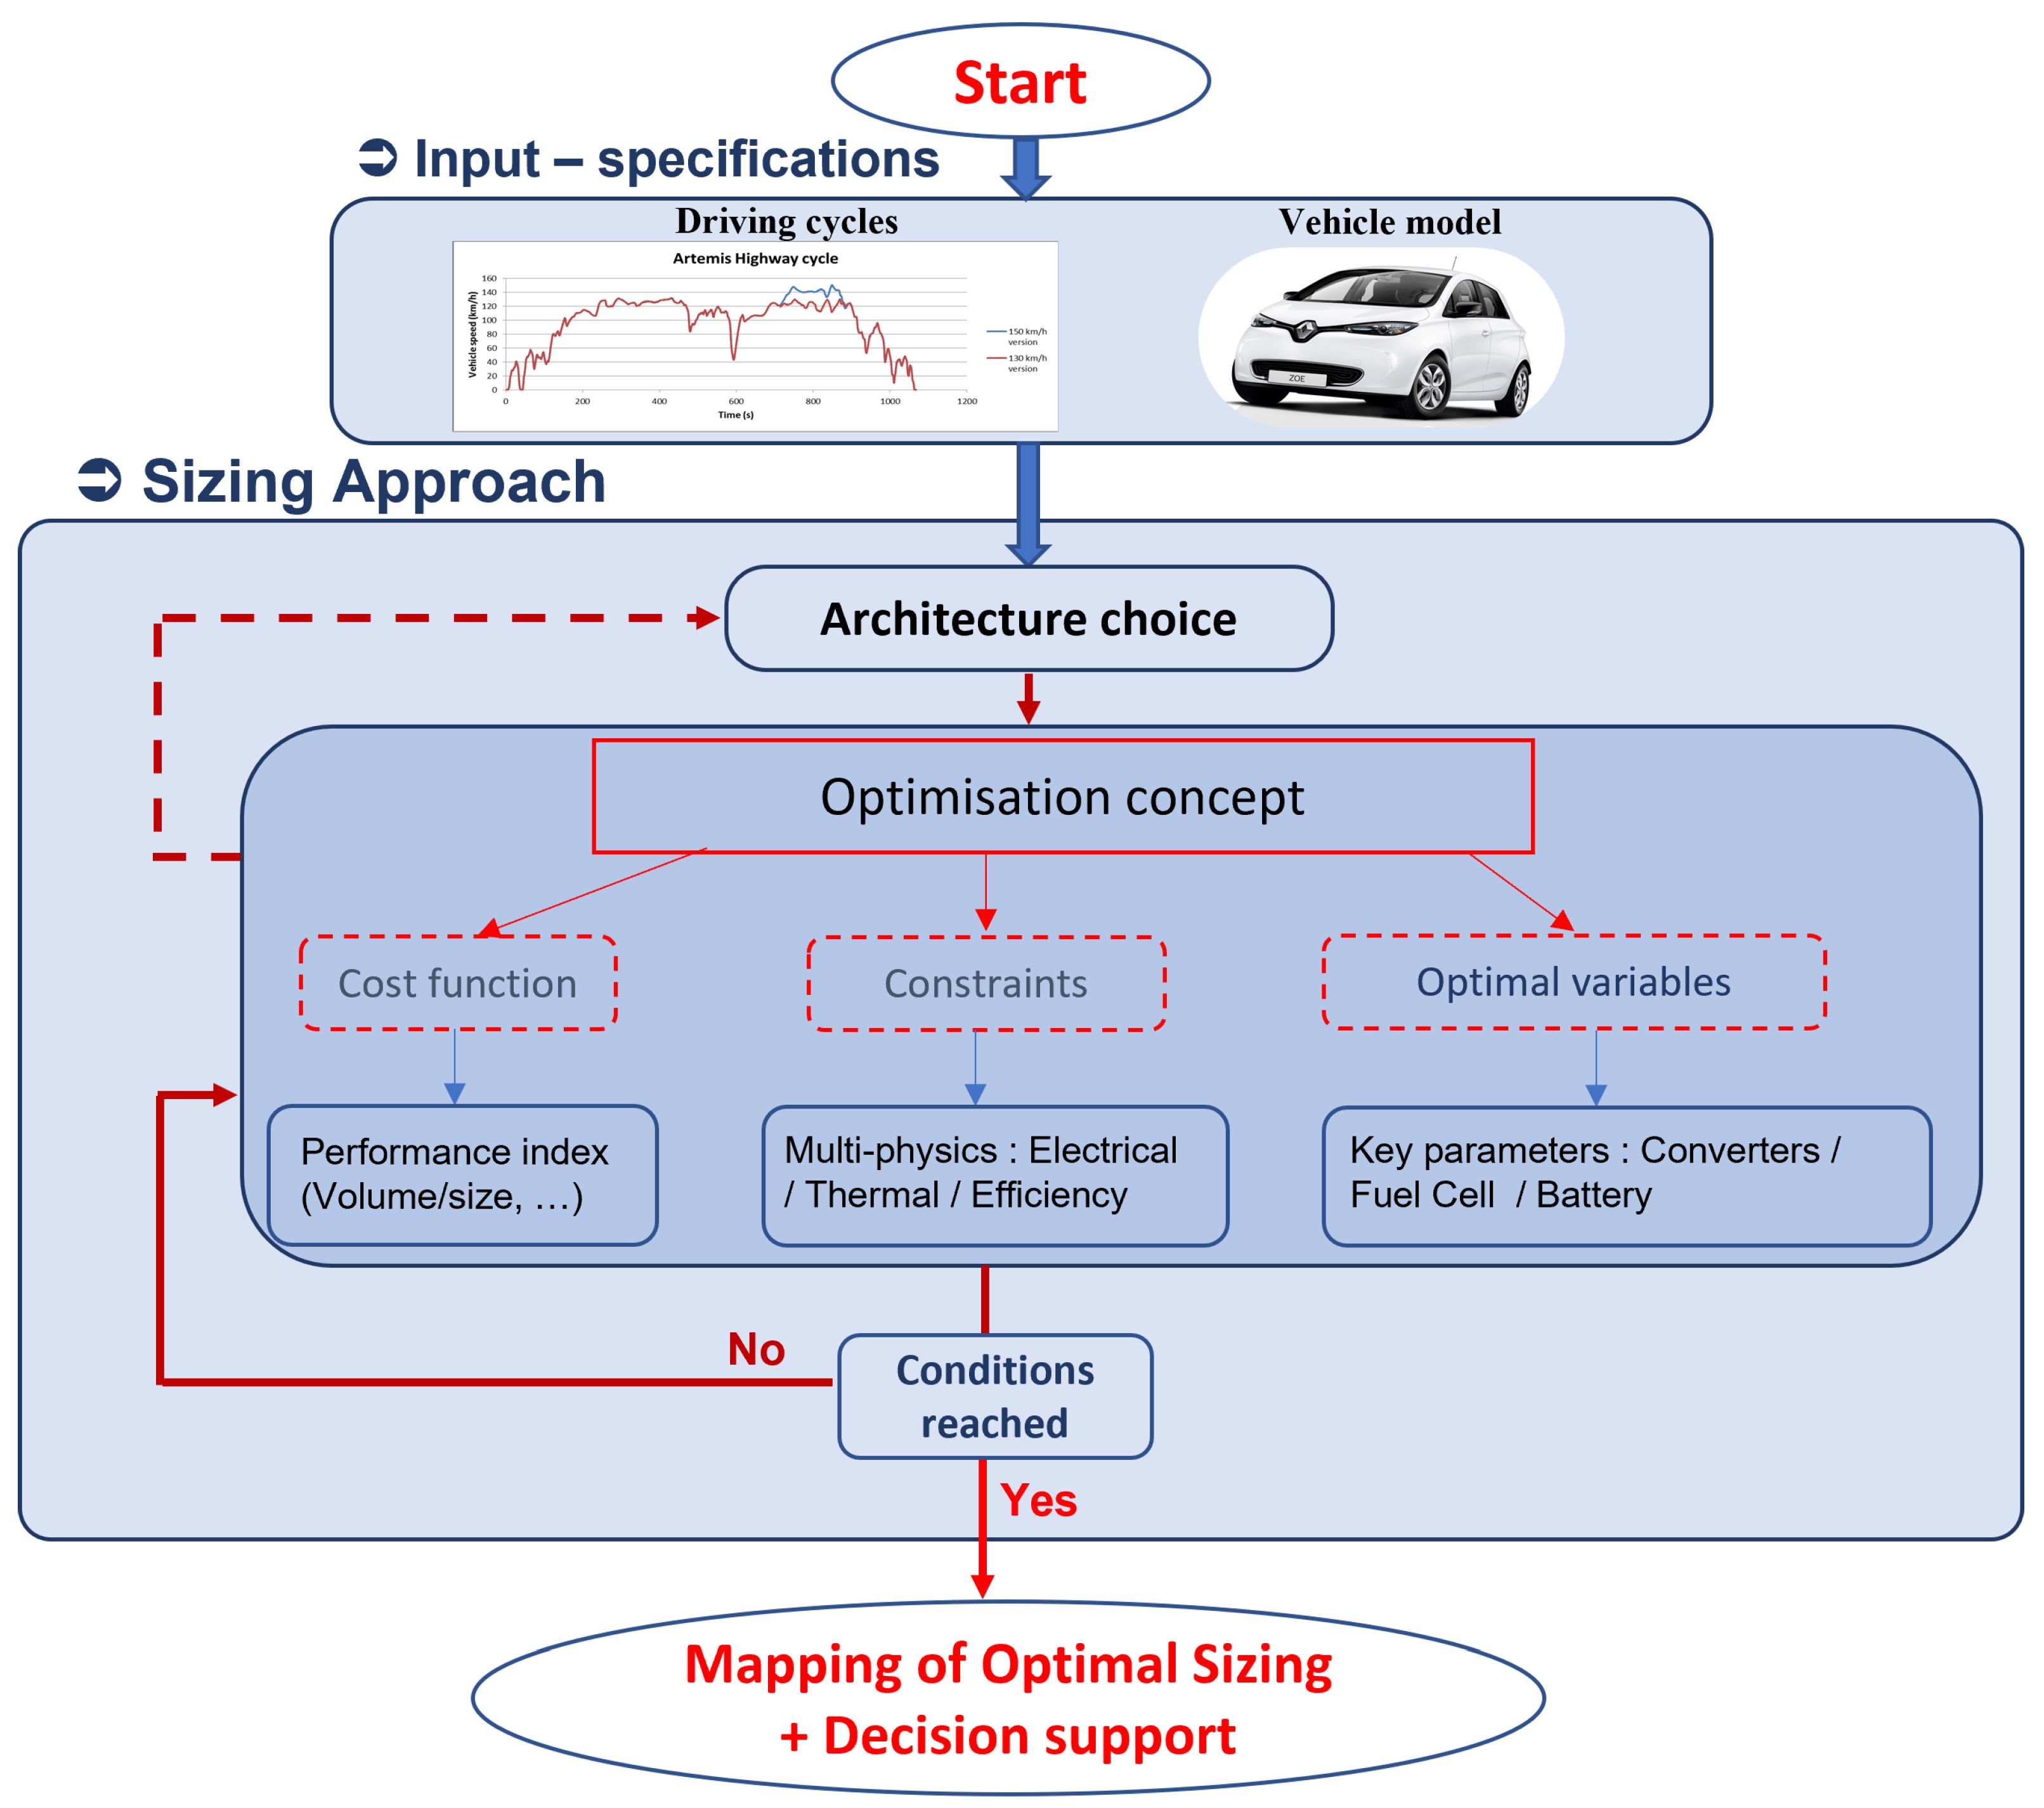
Our use case was based on a hybrid fuel cell/battery architecture with two boost converters. The load was represented as a power demand based on a small city car driving through a preset circuit. The pre-sizing approach here, shown in Figure 3, involves an optimisation process with multi-physic constraints. These two algorithms (PSO and GA) have been separately tested and compared in terms of computing time, convergence speed, and accuracy; it results in a better convergence speed for the GA, although its computing time for one iteration is clearly above that of the PSO. With respect to the accuracy, the PSO provides better results and remains more accessible to manipulating and changing its internal parameters. As it remains more flexible to exploit, the PSO algorithm was used here; it realises the optimisation of the main sizing parameters, which were tested within an objective function for minimisation purposes. This optimisation was constrained by different condition limits according to the architecture’s integrity and specifications. The optimisation loop will experiment a defined size for each particle according to a considered driving cycle. After reaching the end of the cycle, some physical constraints (for example, the SoC deviation throughout the simulation must be less than one) are evaluated and added to the cost function as penalties. If the constraint is not respected, it adds a cost to the objective function to exclude this solution. The load power profile is determined using the longitudinal dynamics model, which takes into account the vehicle speed and forces resulting from acceleration, drag, friction, and road slope [34].
There are several performance indexes that can be chosen as the cost function, such as the overall volume, components lifespan, efficiency, etc. For this primary step of our support tool, the objective function to minimise here was the system global volume as it remains an industrial challenge in the development of FCEVs. Through the article, the different constraints associated with the cost function will be developed as electrical, thermal, and efficiency constraints.
To implement the optimisation problem, the first step is to model the volume of each component to evaluate the cost function. Then, the behaviour of the sources and converters are modelled. After that, the various ripples inside the converter will be described. To express the converter’s efficiency, the losses in terms of the electrical losses will be developed along with the thermal behaviour, which is also considered as a constraint. The optimisation algorithm will be developed and explained in the last part. All of the following implementations will follow the described formalism contained in Table 1.
3.2. Volume Cost Function
As the purpose here is to focus on the interleaving boost converter architecture, the principal criterion about this part is the overall volume, including the volume of the sources and converters. This study also gathered the constraints related to many different domains (electrical, thermal, etc.) and therefore remains as an interesting case study. This converter volume includes the passive and active components. The volume of the active components is mainly represented by the heat sink volume. Regarding the converter volume, the volume of the passive and active components volume are considered here, with the heat sink volume largely constituting the volume of the active components. Analytical models were computed to estimate the volume of inductance, capacitor, heat sink, and energy sources.
3.2.1. Fuel Cell Volume
The fuel cell sizing mainly depends on the application area and operating conditions (static or embedded environment). Modelling the fuel cell volume can be a complex task as it involves taking into account various factors. For PEMFC technology, it is estimated that the volume of the stack takes 30% of the overall system. Consequently, 70% is held by the auxiliaries. It is common to refer to the Ragone diagram when estimating the system volume. Using the data extracted from this diagram as well as the data from existing vehicles such as the Toyota Mirai [35], it is possible to estimate that each kW of fuel cell power required is equivalent to a volume increase of 1.5625 dm. A fuel cell with a maximum power of 10 kW will then have a volume of about 15.6 L, i.e.,
3.2.2. Battery Volume
The battery pack of an electric vehicle is an assembly of serial or parallel electric cells. Therefore, based on the cell used in the battery pack of the Renault Zoé, the LG Chem E63, it is possible to estimate the volume of the battery pack as a function of the cell’s dimensions, i.e.,
where = 325 mm, = 125 mm, and = 11.5 mm are the cell’s dimensions, is the number of serial cells of one stack, and is the number of parallel stacks.
3.2.3. Converter Volume
The converter volume is composed of the inductance, capacitor, and active components volume. The heat sink volume represents the volume of the active components. As several switching cells can be interconnected, each volume model presented here is given with respect to an elementary cell.
- Inductance volume:
The volume of an inductance is proportional to the stored energy, i.e.,
where is a constant factor that describes the relationship between the stored energy and the coil volume, L is the inductance value, and is the average current flowing through the inductance. can be calculated from the manufacturer’s databases for different magnetic core sizes, inductance values, and current values. However, an approximation of the volume can also be written by [36]:
where the parameters , , and depend on the shape of the coil. Here, only toroidal cores are considered because of their high volume-to-inductance ratio.
- Capacitor volume:
The volume of a capacitor depends on the geometry and material of the component. It is also proportional to the stored energy plus a factor representing the voltage between the capacitor terminals [36]:
where the parameter describes the relationship of the capacitor volume and the stored energy and is a voltage-dependent factor. These factors can be determined using the data of the manufacturers. C is the capacitance value and is the voltage of the capacitor.
- CActive component volume:
The heat sink is chosen to respect a maximum junction temperature of 130 °C for the semiconductors and occupy a volume that is as small as possible. Furthermore, the volume of the diode and controlled switch are negligible in front of the heat sink volume. The model used to calculate the volume of the heat sink as a function of the thermal resistance was developed from the work of [37]. This gives the following formula:
where the coefficients and are provided in the manufacturers’ charts [10].
3.3. Constraints
After illustrating the volume of the different components, the different multi-physics constraints (electrical, thermal, etc.) will be explained in this section as part of the components modelling (sources and converters).
3.3.1. Fuel Cell System
- Behaviour:
There are several fuel cell modelling approaches that are based on different parameters, which depend on the level of detail and complexity required for the application (electrochemical, efficiency, hydrogen consumption, etc.), as previously explained. FC modelling allows us to identify which parameters have the greatest impact for a future optimisation. From a systemic point of view and for energy considerations, the number of cells in the FC system and the active surface area of each cell are the two most important parameters. These parameters will be used in the formulation of the optimisation problem. In this context, the FC model used here was based on the electrochemical model described in [23]. The fuel cell for one cell is modelled as:
with
where is the fuel cell temperature, and are the partial pressures of and , R is the ideal gas constant, z is the number of exchanged electrons, is the charge transfer coefficient, F is the Faraday constant, i is the current density, is the internal current density, is the current density exchanged between the electrodes, r is the area-specific resistance, and is the limited current density. Note that the current density is a function of the active surface area.
The total voltage across the fuel cell is expressed as follows:
where represents the FC stack serial cells and represents the FC efficiency.
3.3.2. Battery Pack
- Behaviour:
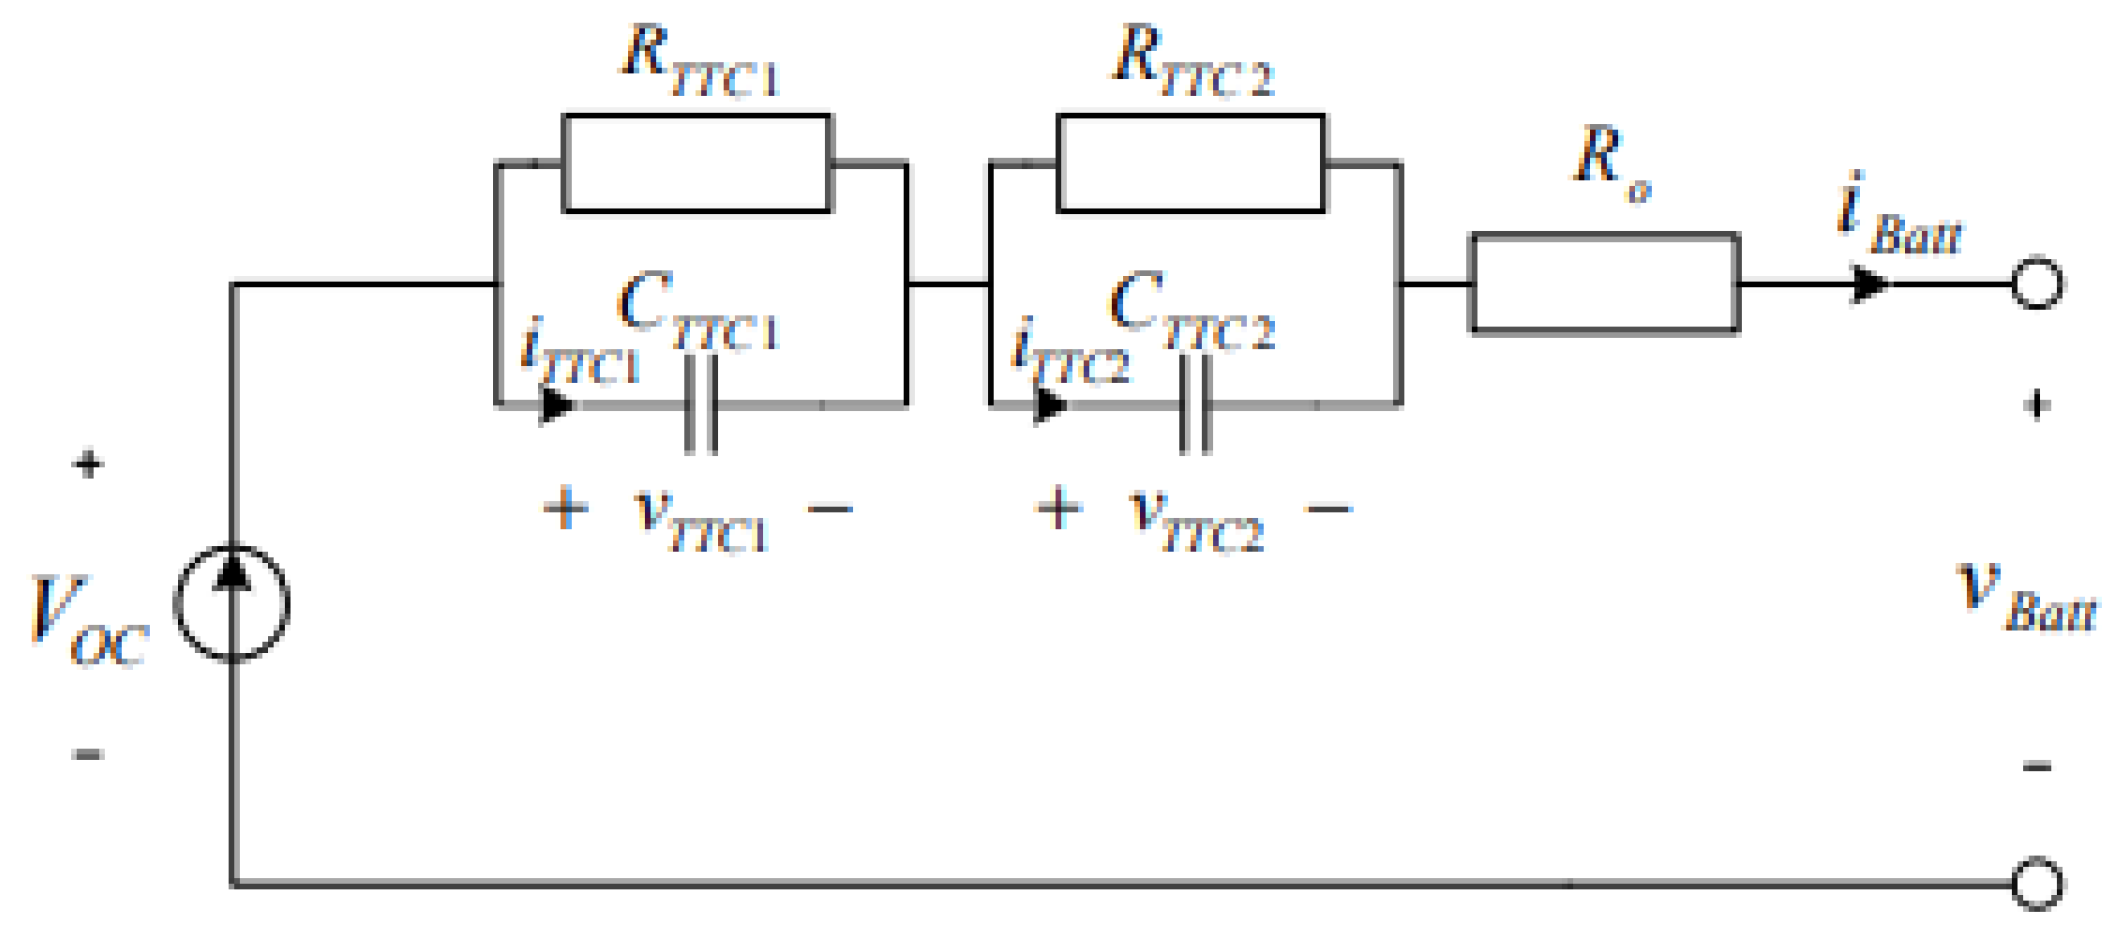
To model the battery pack, there are numerous representations that distinguish themselves from the physical constraint that they want to model. Here, temperature is not taken into account. Consequently, only electrical models are considered interesting. The battery model used is a two-time constant Thevenin model (two parallel RC networks), which provides the best accuracy, as explained in [38]. It consists of a resistor in series that is used to describe the ohmic resistance of the battery, which is associated with two parallel RC networks (polarization aspects) as shown in Figure 4 [39].
All of the parameters of this representation are a function of the state of charge , which is calculated as:
with being the initial state of charge, being the nominal capacity, and being the current. Note that the nominal capacity here is expressed in .
3.3.3. Converter
- Behaviour:
The average model of the converter includes two equations, one for the converter behaviour and the other reflecting the DC bus behaviour:
where is the elementary inductance, is the current flowing through the inductor, is the input voltage, is the output voltage, is the duty cycle, and q is the number of switching cells. Regarding the DC bus, it is a function of all of the current flowing through the capacitor; hence:
where C is the capacitor value and is the current demand from the load. The capacitor is common to both sources, so it is important to keep in mind not to forget to sum all of the currents from each source.
- Electrical constraints:
The examined electrical constraints include the input inductance current ripple, output capacitor voltage ripples, and current ripples in the elementary cell inductors. These are the main ripples that are studied in this system. Additionally, models related to electrical quantities, such as the mean, root mean square (RMS), and maximum currents, were employed to determine the losses and thermal constraints. Note that this work only focuses on the continuous conduction mode (CCM), i.e., the discontinuous conduction mode (DCM) will not be discussed here. It is also assumed that all inductance values are assumed to be the same, i.e., . Therefore, the provided continuous conduction mode modelling is formulated as follows:
Inductance current ripple:
Output voltage ripple:
Input current ripple:
where is the voltage at the output of the converter, is the duty cycle, L is the inductance value, f is the commutation frequency for one cell, C is the capacitor value, is the output current of the converter, and q is the number of cells. Note that because the control strategy is conducted without overlapping, (19) is only valid when . Time-domain simulations were utilised to validate these electrical models.
- Efficiency:
To restrain the converter’s efficiency, loss analytical models for semiconductors and passive components (i.e., inductors and capacitors) were employed. They will be split into the semi-conductor losses at first, and then the inductance and capacitor losses will be described. The global efficiency formula will be given in a last part.
Semi-Conductors Loss Models
Concerning the semi-conductors losses, there are three types of losses:
- Switching losses when opening the semi-conductor ;
- Conduction losses ;
- Switching losses when closing ;
The total losses are hence calculated as follows:
Diode commutation losses are ignored. The only losses expressed here are the conduction losses, which are represented as an equivalent circuit shown in Figure 5:
Consequently, the diode losses are expressed as:
where and are the RMS current and average current in the diode, respectively; is the diode dynamic resistance and is the diode voltage drop. These two parameters depend on the temperature and current. They are obtained from the manufacturer’s data.
The equivalent circuit of a transistor in the conduction phase is similar to the diode’s circuit. The expression concerning the conduction losses remains almost identical except that here, the threshold voltage is negligible, thus changing Equation (21) into:
where is the switch dynamic resistance in the conduction state, is the RMS current, and is the current flowing through the inductor of each cell.
The transistor commutation losses correspond to the energy lost in the switch’s activation and closing phases. By neglecting the current peaks and by assuming that the current and voltage variations are linear, we can express the switching losses as:
where is the output voltage of the converter, is the maximum current flowing through the transistor, and are the duration of the firing and blocking phases, respectively, and f is the switching frequency of the transistor.
Finally, the total semi-conductor losses are expressed by:
where is the diode conduction losses, is the transistor commutation losses, and is the transistor conduction losses.
Inductor Losses models
Inductance losses are composed of copper losses in the winding and core losses created by the magnetic field. Copper losses are divided into two phenomena, the skin effect losses and the proximity effect losses. The geometry of the wire (cylindrical or square) is assumed to not influence the representation of the losses. It will be modelled by:
where is the resistance factor for the skin effect and is for the proximity effect. is the RMS current through the inductance, and the DC resistance defined by
where is the resistivity of the material, l is the length of the conductor, and S is the cross-sectional area of the conductor. The factor is determined using Levasseur’s formula for cylindrical conductors [40]:
where S is the cross-sectional area, is the perimeter of the conductor, and is the skin thickness, defined by
where is the material resistivity, is the vacuum permeability, is the material permeability, and f is the chopping frequency.
Core losses in an inductance are due to hysteresis and eddy current losses. These losses augment with the switching frequency and surface area of the magnetic circuit. They increase with the square of the frequency and conductivity of the material. Hysteresis losses are expressed using the formula of Steinmetz:
where is the power loss, f is the switching frequency, is the volume of the magnetic core, is the peak magnetic flux density, and k, X, and Y are the coefficients that are specific to the material used. However, this formula is only applicable to a sinusoidal alternating current and is therefore not suitable for our application. It then can be modified so that it is suitable in this case [41]:
where is the magnetic induction change, is the duty cycle, and T is the switching period. The parameters m and n are material-specific constants, which are obviously not the same as those of Equation (31) as the core excitation is not of the same form. They are taken as , , and , as stated in [41]. When the duty cycle is 50%, this equation finds the same form as the Steinmetz Formula (31).
Capacitor Losses
The capacitor losses are expressed using an equivalent circuit of a capacitor with an equivalent resistance as shown in Figure 6.
Losses in the dielectric material are generally represented by a dissipation factor constant in frequency.
where is the constant frequency dissipation factor, C is the capacitance of the capacitor, and is the pulsation. The manufacturers provide charts that provide the value of these parameters, which also depend on the temperature.
Total Losses
The efficiency of the converter is then calculated using the following model:
- Thermal:
Only the major thermal stresses that are associated with semiconductors are considered here. Even if all of the components are not ideal, because of their losses, they are subject to a temperature rise. These temperature increases are negligible compared with those of semiconductors. The thermal circuit of the components is represented by a set of thermal resistances characterising each part of the component. Based on the model shown in Figure 7, when assuming a shared heat sink, it is possible to estimate the switch and diode junction temperatures ( and ) of an elementary cell. This model takes into account the switch and diode losses ( and ) as heating sources. The thermal resistances (junction case: and ; case sink: and ; sink air: ) are used to simulate the thermal exchanges between the semiconductor junction and its case, between the case and the heat sink and between the heat sink and the environment.
For the diode:
4. Results and Analysis
4.1. Use Case
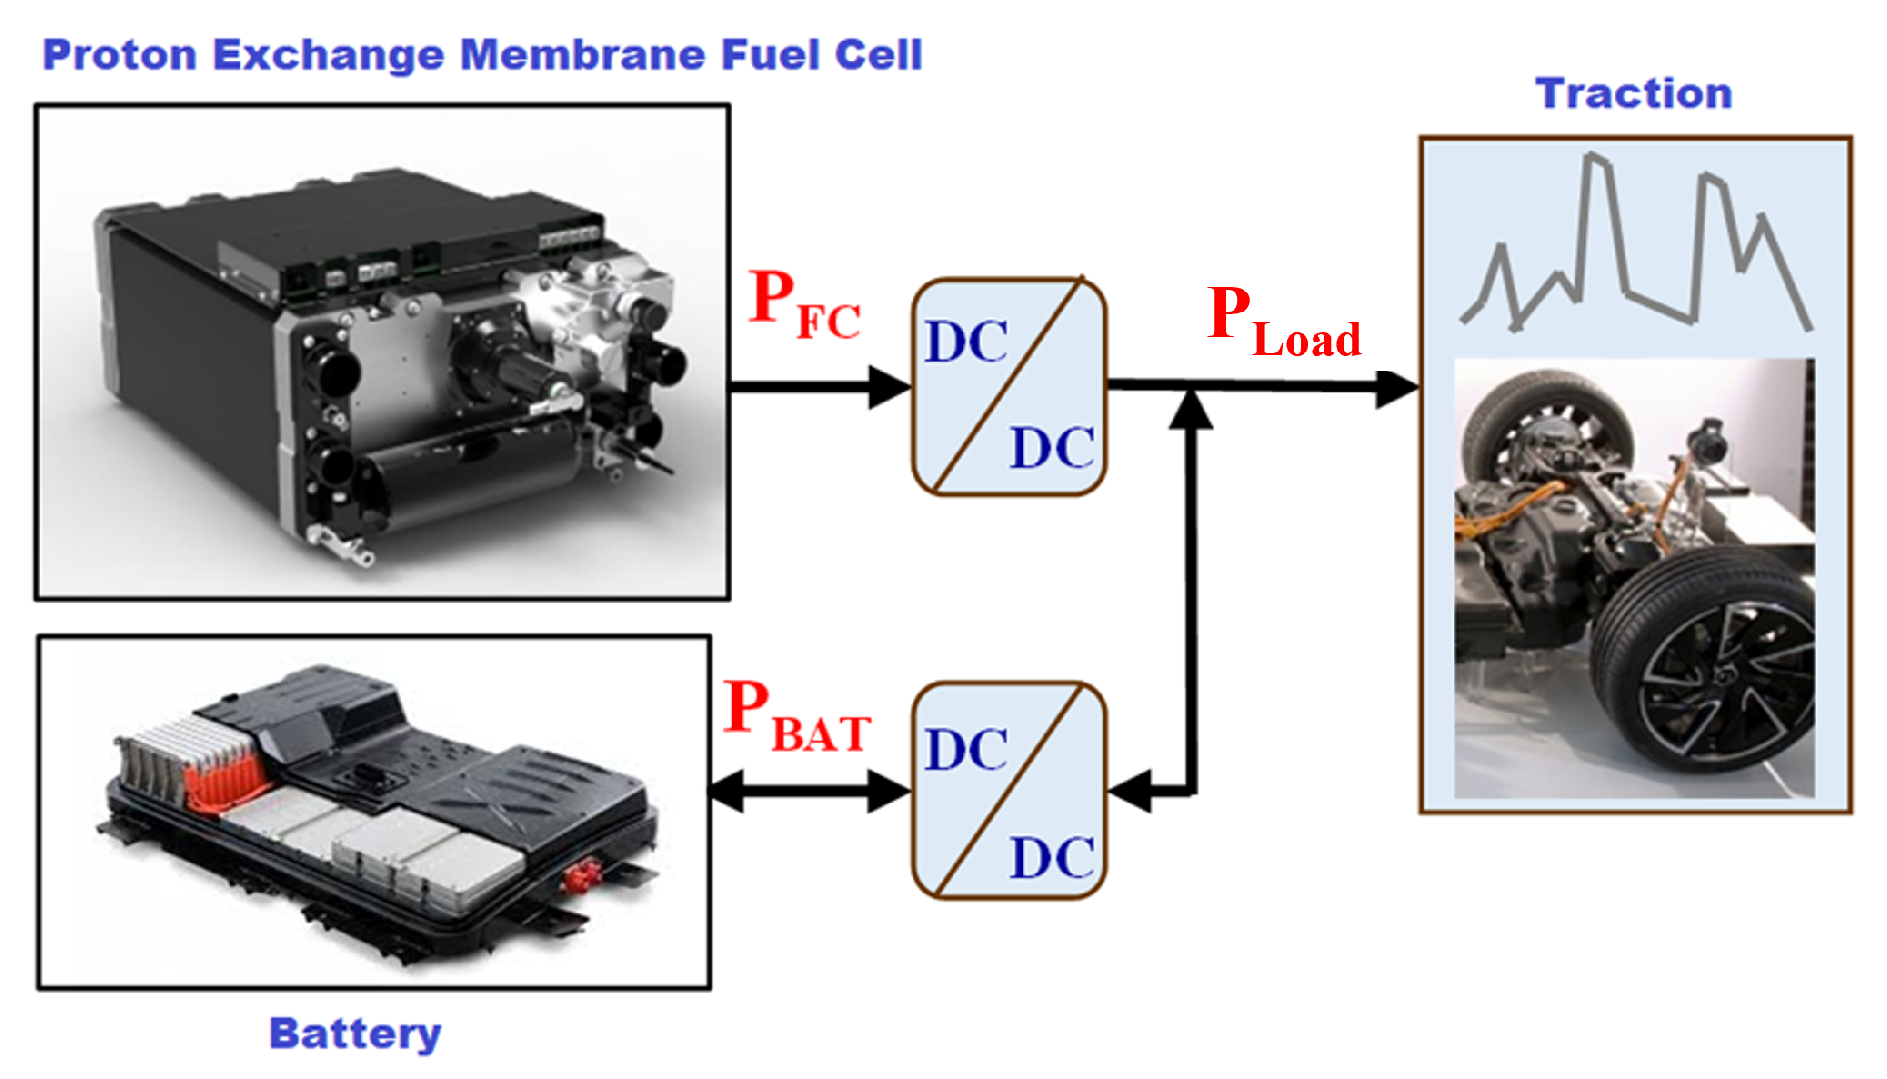
Our architecture is a parallel hybrid fuel cell/battery architecture that uses a specific power converter that is connected to each source. It is well suited for optimal design and energy management, which is related to its high freedom degrees [21]. Figure 8 shows this architecture, where the fuel cell is used as the main energy source and the battery is the auxiliary energy source or ESS. The fuel cell adopted is a Ballard PEMFC. The battery pack is considered to be a lithium ion cell stack as it is the most current developed type of cell. It is treated as an auxiliary source whose main purpose is to provide peak power when demanded by the load. Indeed, the fuel cell dynamic remains quite slow and cannot provide the demanded power as fast as the battery pack would. The energy management system consists of a frequency decomposition (using a two-order Butterworth analog filter). Thus, small power fluctuations are taken by the fuel cell, and high fluctuations are absorbed by the battery.
The use case specifications considered are related to a city car that is similar to a Renault Zoé model, which is shown in Table 2. The load is a power demand working at a specific voltage. The chosen driving cycle is the WLTC cycle.
The approach has been deployed and implemented in a Matlab R2020b environment, and the optimisation algorithm was self-coded to have a flexibility concerning its parameters.
The main optimisation parameters regarding the power converter are the number of cells , which are considered to be a key optimisation parameter for determining the converter architecture, switching frequency , elementary cell inductance , and output capacitance . Due to the significant impact of passive component technology on both the constraints and objective function, the technology parameters for each component are incorporated as optimisation parameters. With respect to the sources, the two parameters integrated in the optimisation process for the fuel cell are the number of cells in series and the active surface area. For the battery pack, only the number of cells that are in series are optimised here.
The optimisation aims to determine the optimal range values for minimising the objective function according to considered constraints.
4.2. Optimisation Results
First, to validate the interest of interleaving in a FCEV, the initial step presented here consists of analysing the benefits of the interleaving technique in a mono-source power chain. It is represented as a fuel cell and its boost converter, which is associated with the load, as shown in Figure 9:
The main specifications considered in this case are the following:
- Output network voltage: 360 V
- Output power: 20 kW
- Number of cells:
Moreover, the associated problem formulation is exposed in Table 3:
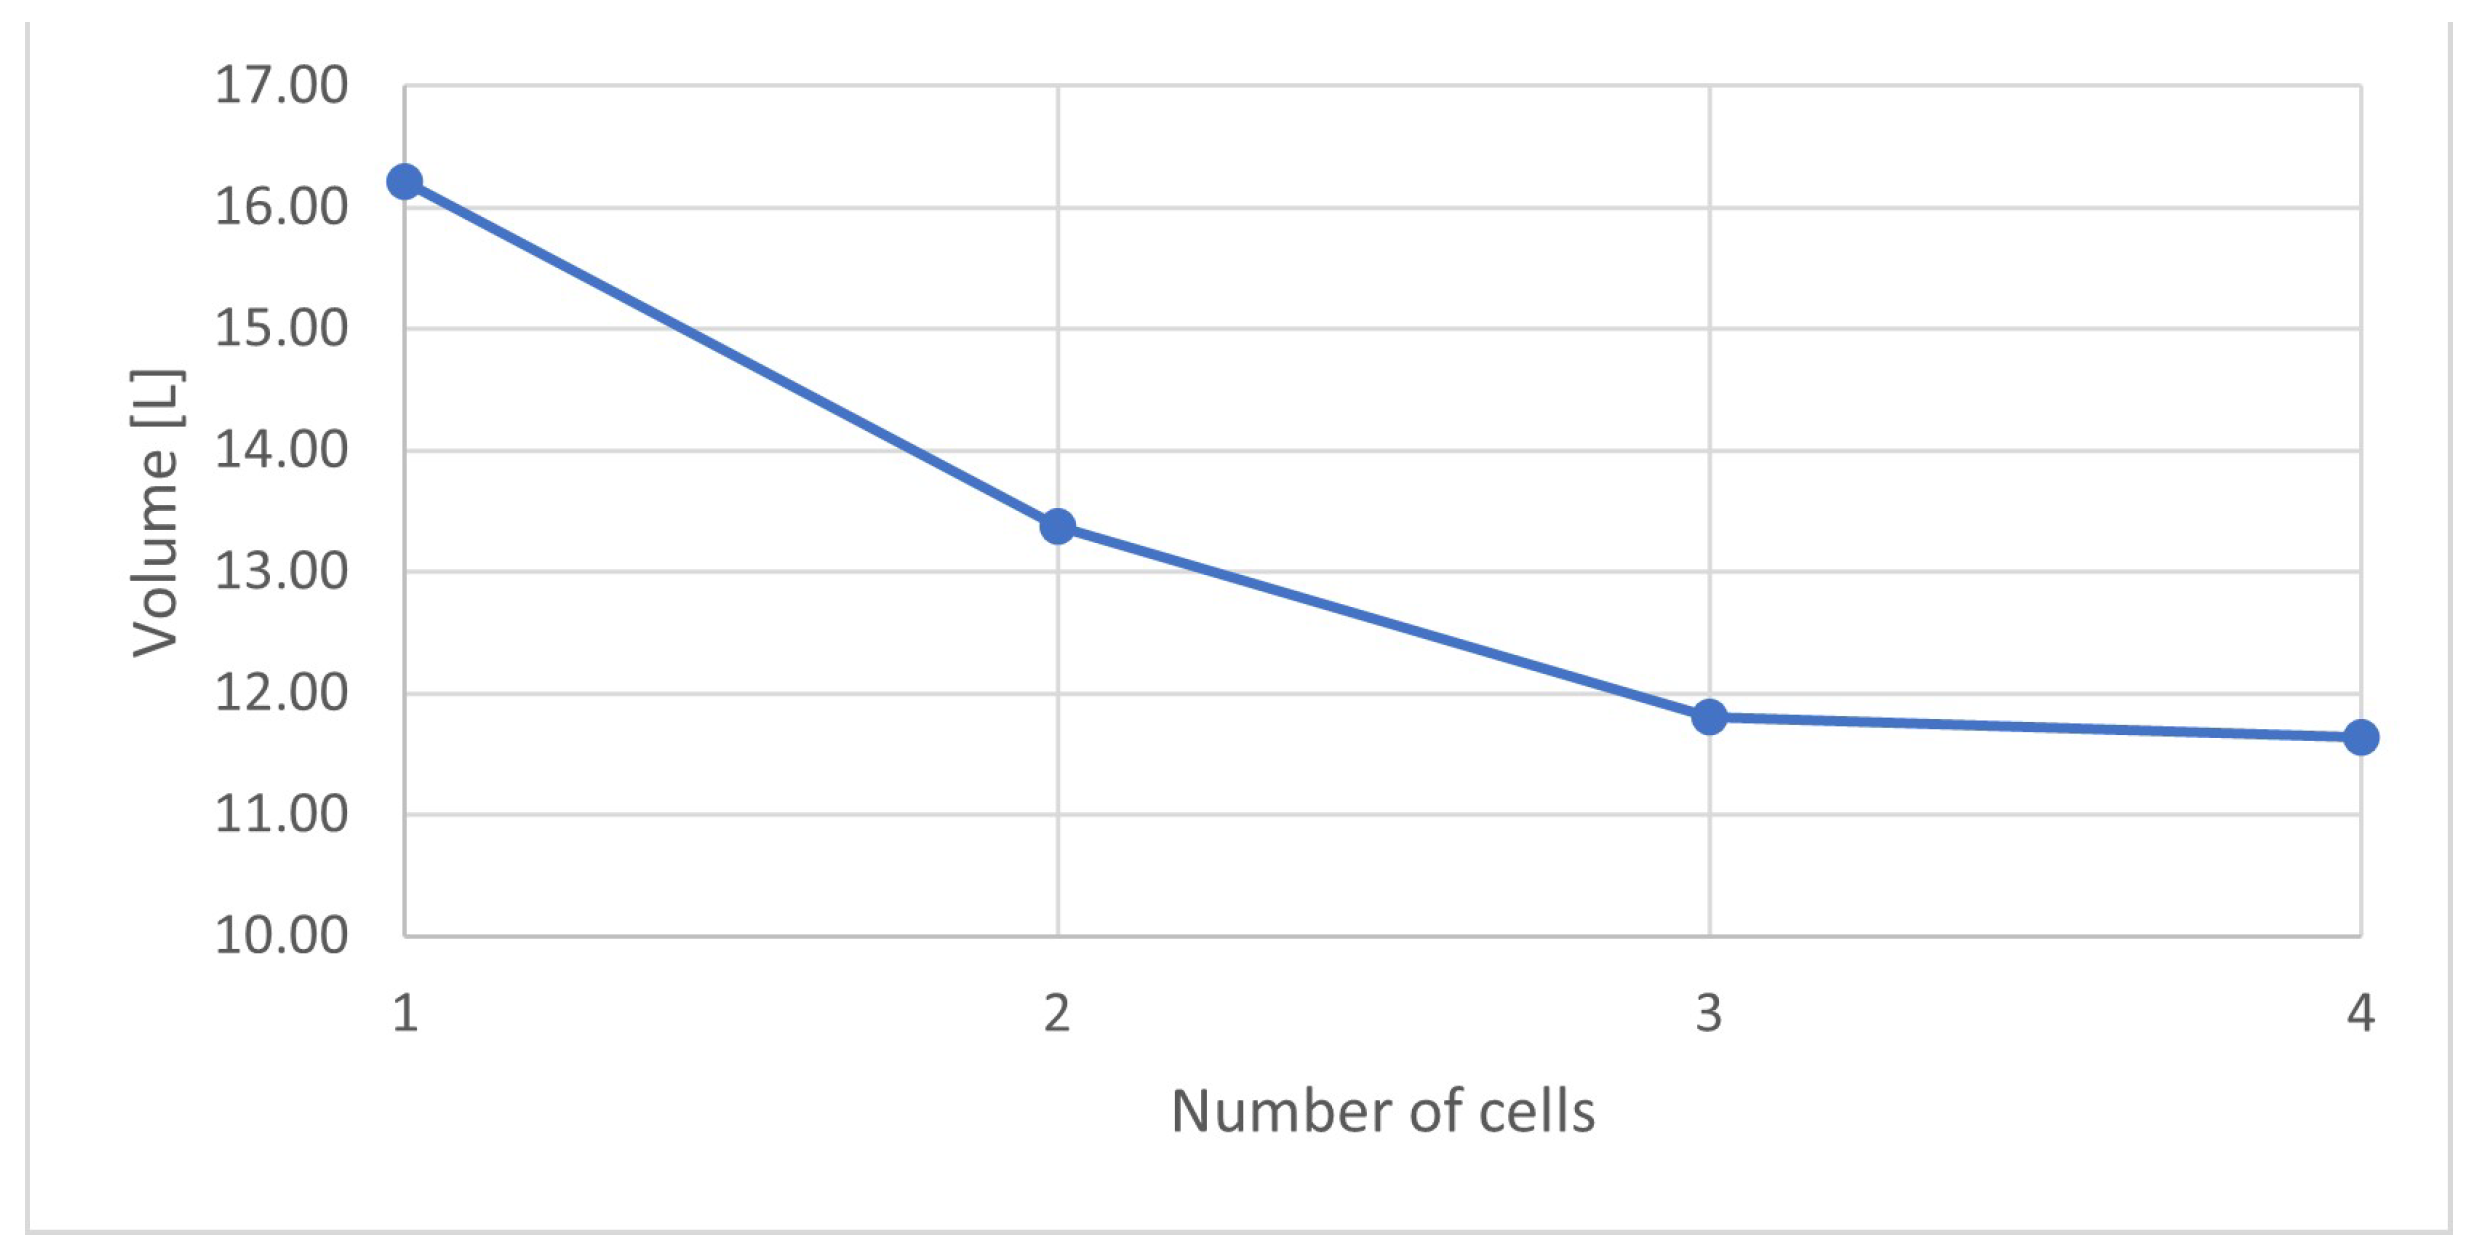
The results of the obtained volumes are shown in Figure 10 and Figure 11 when the number of switching cells is a fixed parameter that is considered as a specification.
According to these figures, it appears that increasing the number of switching cells results in a reduction in the overall volume of the converter. The reduction in volume is most significant when moving from a one-cell converter to a two-cell converter, which results in a reduction of almost 20% in volume compared with the previous configuration. There is a diminishing return on the volume gain as the number of switching cells is increased due to the presence of a “dead” volume in each component. This “dead” volume cannot be made as small as possible, which limits the overall reduction in volume as more cells are added to the converter (Figure 12).
As shown in this figure, an optimal number of cells that minimises the overall volume for each power level can be observed. As a result, for high power levels, interleaving results in a significant reduction in the converter volume. On the other hand, the reduction in volume gain is insignificant for low power levels. For the next validation, different sizing will be presented and compared. In fact, the decomposition shows a maximum power provided by the fuel cell of 40 kW with a cut-off frequency of 50 mHz, as evaluated in [42]. This will be taken as the most undersized structure (“dim1”) shown in Figure 13. The other sizings are 50 kW, 60 kW, 70 kW, and 80 kW for “dim5”. The parameters chosen for the converter and FC sizing of 40 kW are given in Table 4:
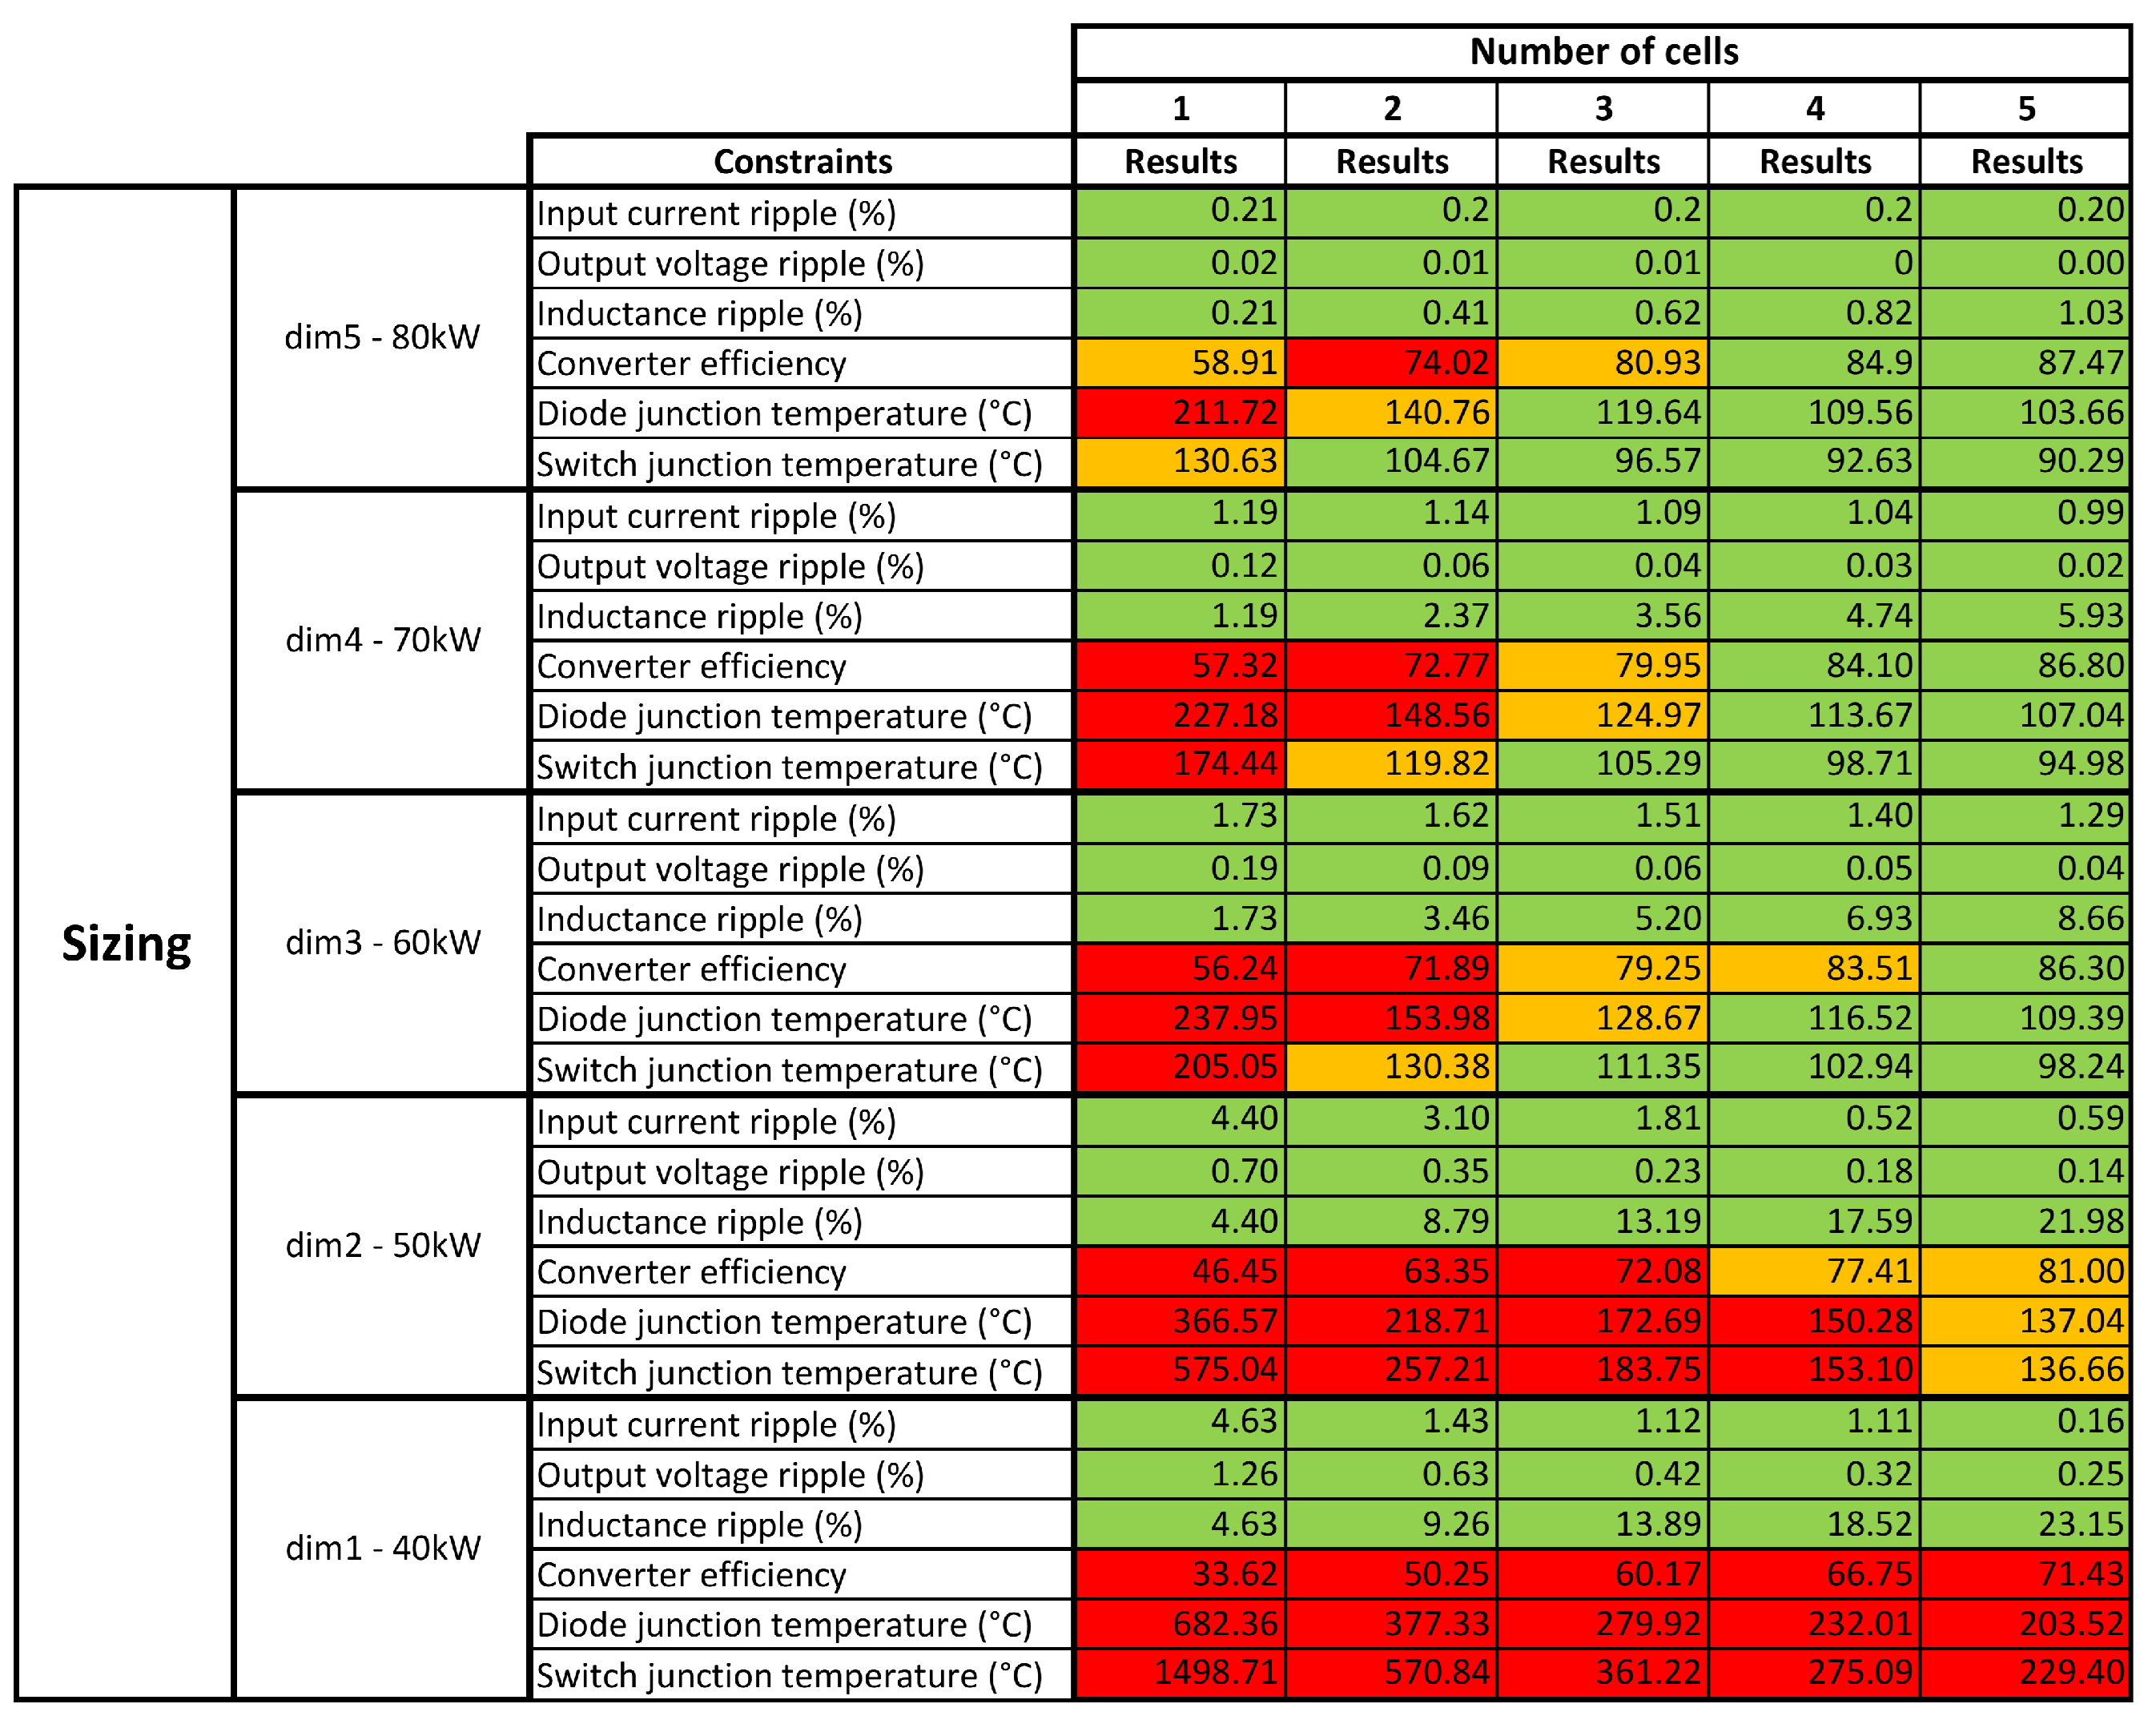
Note that these parameters have been chosen based on the optimisation results for an operating point of 40 kW. The following sizings are designed by increasing either the number of cells or the active surface area. Hence, the results of all constraints with respect to the sizings are presented in Figure 13.
The above table presents the constraint values of each sizing in relation to the number of switching cells. The colour red highlights the constraints that stand well below their limit. On the contrary, the colour green emphasizes the respected constraints. Finally, the colour orange designates the constraints located around their boundary that are either above or below the limit.
According to the table, the 60 kW sizing with five switching cells gives the same results as the 80 kW sizing with three cells. Both have an efficiency that is close to the boundary, but the other constraints are properly respected. Consequently, to respect all of the constraints, there are two choices: either oversize the power chain, which leads to a serious volume increase, or add several switching cells to the converter, which causes a smaller volume augmentation as seen previously.
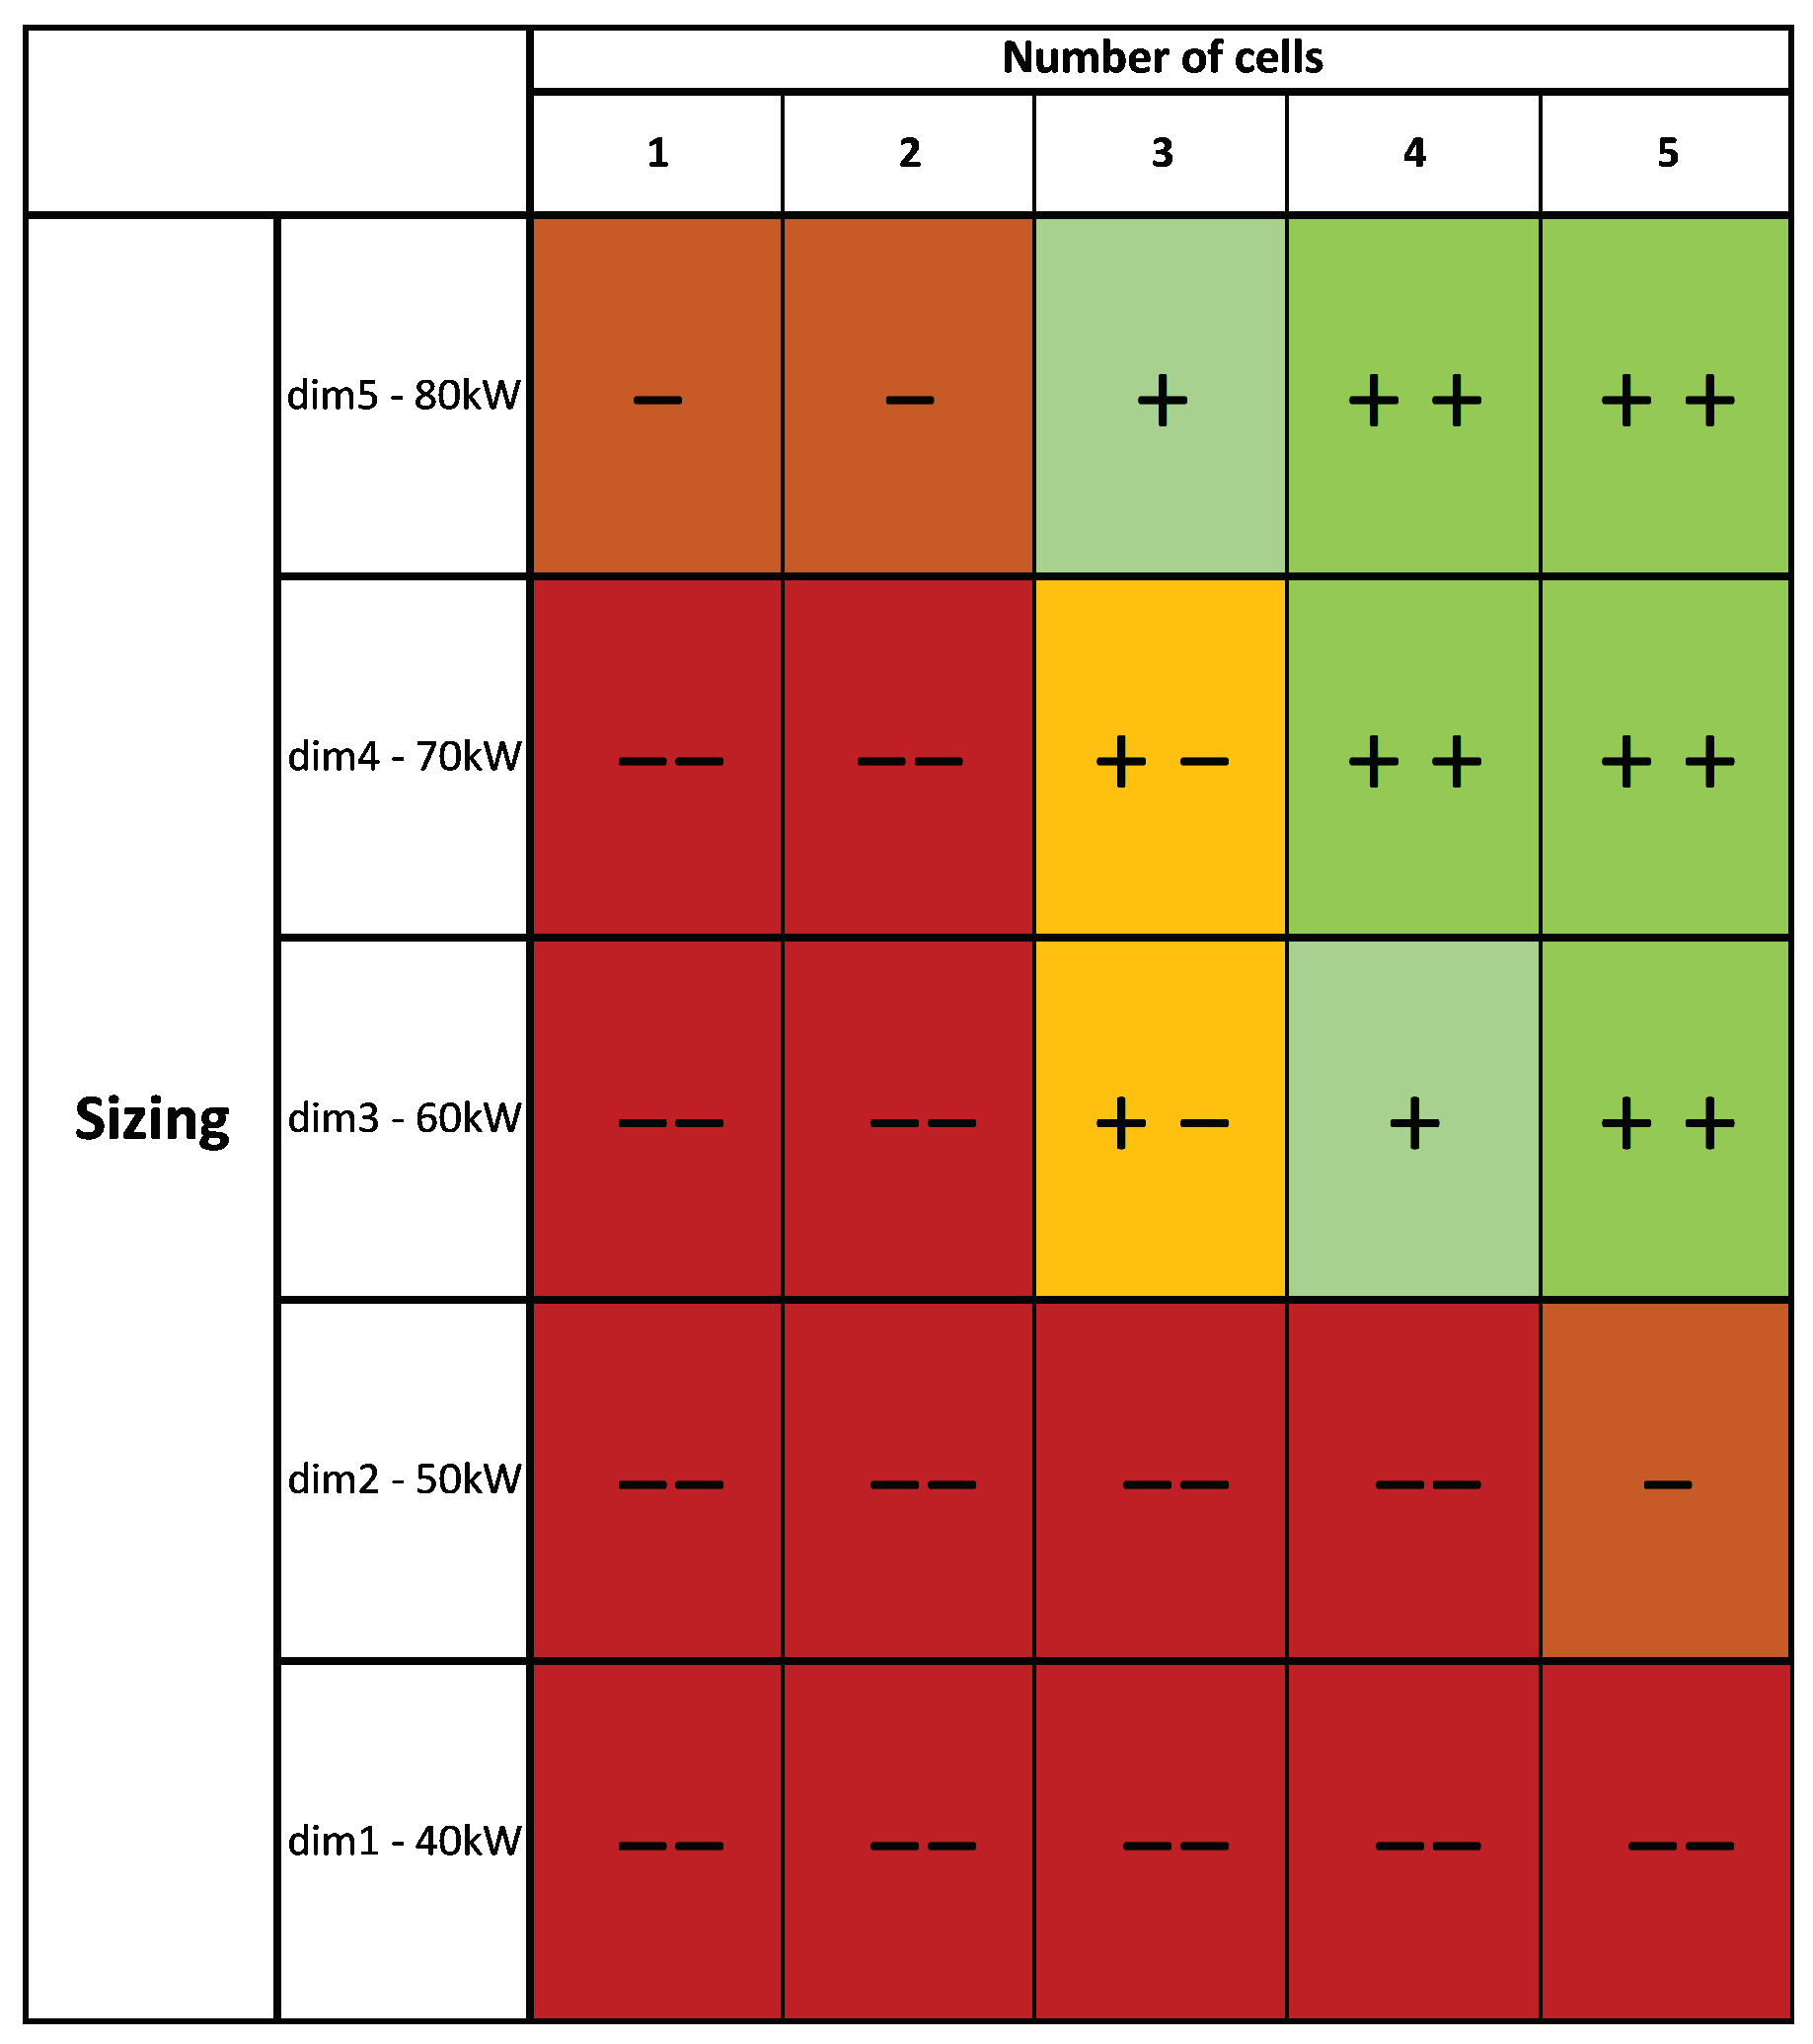
To simplify the reading of the previous figure, Figure 14 shows a schematic representation of the data collected. It can be read as follows: the sign “−” means that at least one constraint is not respected, and “+” consequently means that almost all constraints are respected. Note that the constraints here are the same as mentioned before. The two boxes with only one “+” sign are the sizings that respect all constraints, but some of them are located just above the limit. In contrast, the two boxes with “+−” have some constraints that are just under their limits. For this reason, the red boxes show that the sizing chosen does not respect the imposed constraints, whereas the green ones are the sizings that fulfill all conditions.
According to these figures, choosing a sizing of 60 kW with five switching cells for the converter gives the same results as selecting a structure of 80 kW with three or four switching cells. In comparison, a sizing of 60 kW and five switching cells gives an overall volume of 0.1265 m or 126.5 L, whereas a sizing of 80 kW and three cells presents a volume of 0.1625 m or 162.5 L. This is due to the fact that the source occupies a larger volume than the converter, thus having a greater impact. These analyses show the benefits of the interleaving principle, which permits to downsize a power chain, leading to a smaller volume of overall architecture. Thanks to this interleaving approach, a single-cell design that is considered as downsized (as it does not respect the constraints) becomes suitable from a certain level of interleaving as the constraints become respected one-by-one. The results can be improved by considering other performance indexes, such as: consumption/efficiency, reliability, etc., in keeping with real expectations. Therefore, the choice of the number of switching cells should be carefully evaluated based on a trade-off analysis between theses performance indexes.
5. Conclusions
This paper presents a pre-sizing approach that is intended for a hybrid battery-fuel cell system with interleaved converters. The objective of the proposed approach is to assist designers in obtaining an optimal sizing of power structures in accordance with the highly restrictive specifications. By introducing the interleaving technique, the method leads to a better flexibility for respecting the design constraints and enhances the performance. The approach is based on an optimisation process using a PSO algorithm under multi-physical constraints. A use case based on a hybrid power source system was considered to analyse the benefits of the interleaving concept. Analytical models were used to represent the behaviour of the studied system, including the sources and converters, as well as the associated constraints (volume, electric, thermal, and efficiency). These models are dependent on the number of switching cells of the converters, which is a key modular design parameter.
The results of the first validation show that the overall volume of the mono-source power chain decreases with the increase in the number of switching cells, reducing the volume by up to 15%. In the second validation on a hybrid architecture with a simple energy management system, the constraints on the architecture (such as electrical, thermal, and efficiency constraints) were found to be enhanced when the number of cells increases. This means that adding switching cells to an undersized architecture operating with only one converter cell can improve its constraints without significantly increasing the overall volume. In this example, an overall volume reduction of 22% was achieved. It is also worth noting that the sources (i.e., fuel cells and batteries) take up the most significant portion of the overall volume.
The limitations mentioned in the paper are important to consider for future work. A mono-objective optimisation may not always be sufficient for capturing all aspects of system performance, and a multi-objective optimisation could be used to find trade-offs between different performance indexes such as power efficiency and component lifespan to select the most suitable design solution based on the designer’s preferences. Additionally, the reactive energy management approach used in this work may not be ideal for all applications, and a more proactive approach could be explored by incorporating fault tolerance considerations to enhance the performance and the reliability of the system.
Author Contributions
Conceptualisation, V.M., A.C., T.A., and C.L.; methodology, V.M., A.C., and T.A.; software, V.M. and A.C.; validation, V.M. and A.C.; writing—original draft preparation, V.M.; writing—review and editing, V.M., A.C., and T.A.; supervision, T.A. and C.L. All authors have read and agreed to the published version of the manuscript.
Funding
This research received no external funding.
Conflicts of Interest
The authors declare no conflict of interest.
Abbreviations
The following abbreviations are used in this manuscript:
| EV | Electric vehicle |
| HEV | Hybrid electric vehicle |
| FCEV | Fuel cell electric vehicle |
| PEMFC | Proton exchange membrane fuel cell |
| FC | Fuel cell |
| ESS | Energy storage system |
| SoC | State of charge |
| SoH | State of health |
| DC | Direct current |
| PSO | Particle swarm optimisation |
| GA | Genetic algorithm |
| RMS | Root mean square |
| CCM | Continuous conduction mode |
| DCM | Discontinuous conduction mode |
References
- Ogunbode, C.A.; Doran, R.; Böhm, G. Exposure to the IPCC special report on 1.5 °C global warming is linked to perceived threat and increased concern about climate change. Clim. Chang. 2020, 158, 361–375. [Google Scholar] [CrossRef]
- Chakraborty, S.; Kumar, N.M.; Jayakumar, A.; Dash, S.K.; Elangovan, D. Selected Aspects of Sustainable Mobility Reveals Implementable Approaches and Conceivable Actions. Sustainability 2021, 13, 12918. [Google Scholar] [CrossRef]
- Muneer, T.; Kolhe, M.; Doyle, A. Electric Vehicles: Prospects and Challenges; Elsevier: Amsterdam, The Netherlands, 2017. [Google Scholar]
- Zhang, F.; Hu, X.; Langari, R.; Cao, D. Energy management strategies of connected HEVs and PHEVs: Recent progress and outlook. Prog. Energy Combust. Sci. 2019, 73, 235–256. [Google Scholar] [CrossRef]
- Jayakumar, A.; Chalmers, A.; Lie, T.T. Review of prospects for adoption of fuel cell electric vehicles in New Zealand. IET Electr. Syst. Transp. 2017, 7, 259–266. [Google Scholar] [CrossRef]
- Ceschia, A.; Azib, T.; Bethoux, O.; Alves, F. Optimal design methodology for sizing a fuel cell/battery hybrid power source. Proc. Inst. Mech. Eng. Part A: J. Power Energy 2021, 235, 3–16. [Google Scholar] [CrossRef]
- Zivanov, M.; Sasic, B.; Lazic, M. Desing of Multiphase Boost Converter for Hybrid Fuel Cell/Battery Power Sources. In Paths to Sustainable Energy; Nathwani, J., Ng, A., Eds.; IntechOpen: Rijeka, Croatia, 2010; Chapter 19. [Google Scholar] [CrossRef]
- Saadi, R.; Hammoudi, M.; Kraa, O.; Ayad, M.; Bahri, M. A robust control of a 4-leg floating interleaved boost converter for fuel cell electric vehicle application. Math. Comput. Simul. 2020, 167, 32–47. [Google Scholar] [CrossRef]
- Sorlei, I.S.; Bizon, N.; Thounthong, P.; Varlam, M.; Carcadea, E.; Culcer, M.; Iliescu, M.; Raceanu, M. Fuel cell electric vehicles—A brief review of current topologies and energy management strategies. Energies 2021, 14, 252. [Google Scholar] [CrossRef]
- Samosir, A.S.; Mohd Yatim, A.H. Simulation and implementation of interleaved boost DC-DC converter for fuel cell application. Int. J. Power Electron. Drive Syst. 2011, 1, 168–174. [Google Scholar] [CrossRef]
- Faraj, K.S.; Hussein, J. Analysis and comparison of DC-DC boost converter and interleaved DC-DC boost converter. Eng. Technol. J. 2020, 38, 622–635. [Google Scholar] [CrossRef]
- Kascak, S.; Prazenica, M.; Jarabicova, M.; Paskala, M. Interleaved DC/DC boost converter with coupled inductors. Adv. Electr. Electron. Eng. 2018, 16, 147–154. [Google Scholar] [CrossRef]
- Guilbert, D.; Gaillard, A.; N’Diaye, A.; Djerdir, A. Energy efficiency and fault tolerance comparison of DC/DC converters topologies for fuel cell electric vehicles. In Proceedings of the 2013 IEEE Transportation Electrification Conference and Expo (ITEC), Metro Detroit, MI, USA, 16–19 June 2013; pp. 1–7. [Google Scholar] [CrossRef]
- Farhani, S.; N’Diaye, A.; Djerdir, A.; Bacha, F. Design and practical study of three phase interleaved boost converter for fuel cell electric vehicle. J. Power Sources 2020, 479, 228815. [Google Scholar] [CrossRef]
- Younsi, M.O.; Bendali, M.; Azib, T.; Larouci, C.; Marchand, C.; Coquery, G. Current-sharing control technique of interleaved buck converter for automotive application. In Proceedings of the 7th IET International Conference on Power Electronics, Machines and Drives (PEMD 2014), Manchester, UK, 8–10 April 2014; pp. 1–6. [Google Scholar] [CrossRef]
- Bendali, M.; Larouci, C.; Azib, T.; Marchand, C.; Coquery, G. Design methodology with optimization of an interleaved buck converter for automotive application. In Proceedings of the Eurocon 2013, Zagreb, Croatia, 1–4 July 2013; pp. 1066–1072. [Google Scholar] [CrossRef]
- Pniak, L.; Revol, B.; Quéval, L.; Magambo, J.S.N.T.; Béthoux, O. Pre-sizing of a modular high power density DC/DC converter with GaN components. Math. Comput. Simul. 2023. [CrossRef]
- Delhommais, M.; Delaforge, T.; Schanen, J.L.; Wurtz, F.; Rigaud, C. A Predesign Methodology for Power Electronics Based on Optimization and Continuous Models: Application to an Interleaved Buck Converter. Designs 2022, 6, 68. [Google Scholar] [CrossRef]
- Xun, Q.; Liu, Y.; Holmberg, E. A comparative study of fuel cell electric vehicles hybridization with battery or supercapacitor. In Proceedings of the 2018 International Symposium on Power Electronics, Electrical Drives, Automation and Motion (SPEEDAM), Amalfi, Italy, 20–22 June 2018; pp. 389–394. [Google Scholar] [CrossRef]
- Pan, G.; Bai, Y.; Song, H.; Qu, Y.; Wang, Y.; Wang, X. Hydrogen Fuel Cell Power System—Development Perspectives for Hybrid Topologies. Energies 2023, 16, 2680. [Google Scholar] [CrossRef]
- Azib, T.; Bethoux, O.; Remy, G.; Marchand, C.; Berthelot, É. An innovative control strategy of a single converter for hybrid fuel cell/supercapacitor power source. IEEE Trans. Ind. Electron. 2010, 57, 4024–4031. [Google Scholar] [CrossRef]
- Thounthong, P.; Davat, B.; Rael, S.; Sethakul, P. Fuel cell high-power applications. IEEE Ind. Electron. Mag. 2009, 3, 32–46. [Google Scholar] [CrossRef]
- Dicks, A.; Rand, D.A.J. Fuel Cell Systems Explained, 3rd ed.; Wiley: Hoboken, NJ, USA, 2018. [Google Scholar]
- Mebarki, N.; Rekioua, T.; Mokrani, Z.; Rekioua, D.; Bacha, S. PEM fuel cell/battery storage system supplying electric vehicle. Int. J. Hydrog. Energy 2016, 41, 20993–21005. [Google Scholar] [CrossRef]
- Ajayan, S.; Selvakumar, A.I. Modeling and simulation of PEM fuel cell electric vehicle with multiple power sources. Int. J. Recent Technol. Eng. 2020, 8, 2967–2975. [Google Scholar] [CrossRef]
- Visvanathan, V.K.; Palaniswamy, K.; Ponnaiyan, D.; Chandran, M.; Kumaresan, T.; Ramasamy, J.; Sundaram, S. Fuel Cell Products for Sustainable Transportation and Stationary Power Generation: Review on Market Perspective. Energies 2023, 16, 2748. [Google Scholar] [CrossRef]
- Saadi, A.; Becherif, M.; Aboubou, A.; Ayad, M. Comparison of proton exchange membrane fuel cell static models. Renew. Energ. 2013, 56, 64–71. [Google Scholar] [CrossRef]
- Saldaña, G.; San Martín, J.I.; Zamora, I.; Asensio, F.J.; Oñederra, O. Analysis of the current electric battery models for electric vehicle simulation. Energies 2019, 12, 2750. [Google Scholar] [CrossRef]
- Kabalo, M.; Blunier, B.; Bouquain, D.; Miraoui, A. State-of-the-art of DC-DC converters for fuel cell vehicles. In Proceedings of the 2010 IEEE Vehicle Power and Propulsion Conference, Lille, France, 1–3 September 2010; pp. 1–6. [Google Scholar] [CrossRef]
- İnci, M.; Büyük, M.; Demir, M.H.; İlbey, G. A review and research on fuel cell electric vehicles: Topologies, power electronic converters, energy management methods, technical challenges, marketing and future aspects. Renew. Sust. Energ. Rev. 2021, 137, 110648. [Google Scholar] [CrossRef]
- Ceschia, A.; Azib, T.; Bethoux, O.; Alves, F. Multi-Criteria Optimal Design for FUEL Cell Hybrid Power Sources. Energies 2022, 15, 3364. [Google Scholar] [CrossRef]
- Niu, M.; Wan, C.; Xu, Z. A review on applications of heuristic optimization algorithms for optimal power flow in modern power systems. J. Mod. Power Syst. Clean Energy 2014, 2, 289–297. [Google Scholar] [CrossRef]
- Rahmat-Samii, Y. Genetic algorithm (GA) and particle swarm optimization (PSO) in engineering electromagnetics. In Proceedings of the 17th International Conference on Applied Electromagnetics and Communications, Dubrovnik, Croatia, 1–3 October 2003; pp. 1–5. [Google Scholar] [CrossRef]
- Ceschia, A.; Azib, T.; Bethoux, O.; Alves, F. Reliability Impact in Optimal Sizing of Fuel Cell/Battery Hybrid Power Sources. Energies 2020, 13, 3510. [Google Scholar] [CrossRef]
- Martin, E.; Papageorgopoulos, D. DOE Hydrogen and Fuel Cells Program Record; Technical Report; US Departament of Energy: Washington, DC, USA, 2015. [Google Scholar]
- Raggl, K.; Nussbaumer, T.; Kolar, J.W. Model based optimization of EMC input filters. In Proceedings of the 2008 11th Workshop on Control and Modeling for Power Electronics, Zurich, Switzerland, 17–20 August 2008; pp. 1–6. [Google Scholar] [CrossRef]
- Ejjabraoui, K.; Larouci, C.; Lefranc, P.; Marchand, C. A pre-sizing approach of DC-DC converters, application to design a Buck converter for the automotive domain. In Proceedings of the 2009 IEEE 6th International Power Electronics and Motion Control Conference, Wuhan, China, 17–20 May 2009; pp. 517–523. [Google Scholar] [CrossRef]
- Lin, X.; Perez, H.E.; Mohan, S.; Siegel, J.B.; Stefanopoulou, A.G.; Ding, Y.; Castanier, M.P. A lumped-parameter electro-thermal model for cylindrical batteries. J. Power Sources 2014, 257, 1–11. [Google Scholar] [CrossRef]
- Tran, M.K.; DaCosta, A.; Mevawalla, A.; Panchal, S.; Fowler, M. Comparative study of equivalent circuit models performance in four common lithium-ion batteries: LFP, NMC, LMO, NCA. Batteries 2021, 7, 51. [Google Scholar] [CrossRef]
- Aitakkache, M.; Enrici, P.; Matt, D.; Boubaker, N.; Piscini, L. Concept, Feasibility of Cylindrical Bar Winding for Low Voltage Permanent Magnet Synchronous Motor. Energies 2022, 15, 1507. [Google Scholar] [CrossRef]
- Liu, J.; Wilson, T.; Wong, R.; Wunderlich, R.; Lee, F. A method for inductor core loss estimation in power factor correction applications. In Proceedings of the APEC. Seventeenth Annual IEEE Applied Power Electronics Conference and Exposition (Cat. No.02CH37335), Dallas, TX, USA, 10–14 March 2002; pp. 439–445. [Google Scholar] [CrossRef]
- Azib, T.; Larouci, C.; Chaibet, A.; Boukhnifer, M. Online energy management strategy of a hybrid fuel cell/battery/ultracapacitor vehicular power system. IEEJ Trans. Electr. Electron. Eng. 2014, 9, 548–554. [Google Scholar] [CrossRef]
Figure 1.
Diagram of the N-cell interleaved boost converter.

Figure 2.
Waveforms of a three-phase boost converter.

Figure 3.
Overview of the suggested design approach.

Figure 4.
Second order battery modelling.

Figure 5.
Equivalent circuit of a diode.

Figure 6.
Equivalent circuit of a capacitor.

Figure 7.
Thermal model of a semiconductor.

Figure 8.
Parallel hybrid power source architecture.

Figure 9.
Mono-source power chain.

Figure 10.
Optimal global volume.

Figure 11.
Converter global volume.

Figure 12.
Optimal number of cells for different output power.

Figure 13.
Comparison of different sizings with different numbers of cells data.

Figure 14.
Comparison of different sizings with different numbers of cells, simplified.


Table 1.
Optimisation problem formulation.
| Formalism | Mathematical Definition |
|---|---|
| Cost function | |
| Optimisation parameters | Converter parameters, FC parameters, and BAT parameters |
| Constraints | |
Table 2.
Renault Zoé vehicle parameters.
| Parameter | Values |
|---|---|
| M | 1425 (kg) |
| L | 4.804 (m) |
| l | 1.730 (m) |
| H | 1.568 (m) |
| S | l × H (m2) |
| Cx | 0.29 |
| Cr | 0.012 |
| α | 0 |
| g | 9.81 (m·s−2) |
| ρ | 1.184 (kg·m−3) |
Table 3.
Optimisation problem formulation.
| Formalism | Mathematical Definition |
|---|---|
| Cost function | |
| Optimisation parameters | Inductance, capacitance, frequency, magnetic density, wire diameter, winding number, heat sink thermal resistance, active surface area, number of FC cells |
| Constraints | Input current ripple |
| Inductance current ripple | |
| Output voltage ripple | |
| Junction temperature MOSFET °C | |
| Junction temperature diode °C | |
| Efficiency | |
| Output voltage | |
| Input converter current < limited FC current | |
Table 4.
Sizing parameters.
| Parameter | Values |
|---|---|
| L | 0.001 (H) |
| C | 0.001 (F) |
| freq | 10,000 (Hz) |
| B | 1.2 (T) |
| Diameter | 1 · 10−4 (m) |
| Winding number | 300 |
| Heat sink thermal resistance | 0.5 °(C/W) |
| Number of FC cells | 240 |
| Active surface area | 140 (m2) |
Disclaimer/Publisher’s Note: The statements, opinions and data contained in all publications are solely those of the individual author(s) and contributor(s) and not of MDPI and/or the editor(s). MDPI and/or the editor(s) disclaim responsibility for any injury to people or property resulting from any ideas, methods, instructions or products referred to in the content. |
© 2023 by the authors. Licensee MDPI, Basel, Switzerland. This article is an open access article distributed under the terms and conditions of the Creative Commons Attribution (CC BY) license (https://creativecommons.org/licenses/by/4.0/).
Share and Cite
MDPI and ACS Style
Mercier, V.; Ceschia, A.; Azib, T.; Larouci, C. Pre-Sizing Approach of a Fuel Cell-Battery Hybrid Power System with Interleaved Converters. Energies 2023, 16, 4068. https://doi.org/10.3390/en16104068
AMA Style
Mercier V, Ceschia A, Azib T, Larouci C. Pre-Sizing Approach of a Fuel Cell-Battery Hybrid Power System with Interleaved Converters. Energies. 2023; 16(10):4068. https://doi.org/10.3390/en16104068
Chicago/Turabian StyleMercier, Victor, Adriano Ceschia, Toufik Azib, and Cherif Larouci. 2023. "Pre-Sizing Approach of a Fuel Cell-Battery Hybrid Power System with Interleaved Converters" Energies 16, no. 10: 4068. https://doi.org/10.3390/en16104068
Note that from the first issue of 2016, this journal uses article numbers instead of page numbers. See further details here.