
Design and Implementation of Node-Red Based Open-Source SCADA Architecture for a Hybrid Power System


Department of Electrical and Computer Engineering, Memorial University of Newfoundland, 230 Elizabeth Ave, St. John’s, NL A1C5S7, Canada
*
Authors to whom correspondence should be addressed.
Energies 2023, 16(5), 2092; https://doi.org/10.3390/en16052092
Submission received: 11 January 2023
/
Revised: 10 February 2023
/
Accepted: 17 February 2023
/
Published: 21 February 2023
(This article belongs to the Special Issue Stability Issues and Challenges in Modern Electric Power Systems)
Abstract
:At present, hybrid renewable power systems (HRPS) are considered reliable combinations for power generation under various conditions. The challenge facing researchers and engineers today is designing and implementing a reliable, efficient, and applicable SCADA system for adequate monitoring and control of hybrid power systems. In order to analyze, observe, and control the essential parameters of an HRPS, a SCADA system is crucial. As part of this study, a low-cost, low-power, open-source SCADA (Supervisory, Control, and Data Acquisition) system for hybrid renewable energy systems is presented. The system utilizes two remote terminal units (RTUs), an Arduino Mega2560 and a Wio terminal, to communicate with all actuators and measure vital system characteristics such as voltage, current, and power. Using the Firmata protocol, a laptop serves as the main terminal unit (MTU) to communicate with the Arduino. In addition to being the system’s central component, Node-Red is utilized for processing, analyzing, storing, and displaying data. In contrast, a Wio terminal is used to display the values of all sensors in real-time on its LCD screen. As a whole, the proposed SCADA system is designed to keep the HRPS running smoothly and safely by displaying vital parameters, reporting any significant faults, and controlling the generator so that the batteries can be charged and discharged correctly. This article presents a complete description of all algorithms, experimental setups, testing, and results.
1. Introduction
Increasingly, clean and renewable energy sources are being integrated into today’s power systems as energy professionals seek ways to harness these resources for the benefit of humanity. These sources of clean, renewable energy are combined with traditional energy production methods to create highly efficient power systems. Even so, battery storage is generally necessary for the subsequent hybrid energy systems and sustainable energy sources, including wind and solar energy, which are intermittent and highly influenced by climate-related factors. As a multisource system, hybrid systems with energy storage are the solution to overcoming these obstacles by supplying reliable power while meeting environmental standards. Energy production and supply can, however, be difficult to integrate due to several issues relating to grid synchronization, frequency control, voltage tolerances, power quality and monitoring, data transfer between parts, and the security and safety of both the investment and personnel [1]. Electrification of rural areas has long been regarded as a successful strategy for the long-term development of such areas, both in developing and developed countries. Globally, an increasing number of countries have expressed interest in deploying hybrid power systems (HPSs) using wind-diesel, PV-diesel, and wind-PV-diesel. In spite of the growing number of demonstrative projects, a large market for these systems does not appear to have materialized despite various indications that they may be in demand in the near future [2]. The HPS typically consists of a multitude of sensors, microcontrollers, actuators, etc. that are installed at different points to collect valuable data, namely power, voltage, and current, as well as for real-time monitoring of remotely installed devices. A state-of-the-art SCADA system is the ideal solution for achieving these objectives. As these HPSs and their equipment are set up in remote locations, a SCADA system is crucial to monitor, control, and record external devices, actuators, and other field instrumentation devices (FIDs) connected to the different focal points remotely. It allows real-time remote control, monitoring, and processing of the power, voltage, and current generated by these variably dispersed sensors and actuators using the SCADA system [3].
An initial version of SCADA was developed in the 1950s for minicomputers and telephone relay systems [4]. Early “SCADA” systems collected data using meter panels, lights, and strip chart recorders. Factory, industrial, and power production facilities have used and continue to use these systems for supervisory control and data processing [4,5]. According to [6], there are four generations in SCADA architecture: the first generation is monolithic SCADA, the second generation is distributed SCADA, the third generation is networked SCADA, and the fourth generation is Internet of Things (IoT)-based SCADA. Before networks became widely used, the first SCADA systems were developed, which involved independent systems that had little or no connectivity to each other. Wide Area Networks (WANs) were constructed using two identically configured mainframe computers, and they only communicated through Remote Terminal Units (RTUs). As part of the system, proprietary software was utilized primarily, and all of the RTUs were connected to a backup mainframe to ensure a long service life. As part of the second generation of SCADA systems, LAN technology is used to disseminate information and procedures across multiple platforms. As compared with their predecessors, these systems were more affordable and smaller. Near-real-time data exchange took place between stations, each of which had its own set of duties. In addition to increasing the system’s processing power, stability, and reliability, distribution was restricted to the local region, and most LAN protocols used were proprietary. System operations and processes were distributed across many platforms using LAN technology in the second generation of SCADA systems. These systems were considerably less expensive and smaller than their counterparts. Between stations, each with its own set of duties, data were exchanged almost instantly.
The third generation of SCADA included several linked systems communicating across WANs, sharing master station responsibilities, and leveraging PLCs for monitoring. This generation shared characteristics with the second generation in that it offered remote SCADA capabilities across a WAN. However, unlike the second version, it could use Internet Protocol (IP) to connect to the internet and peripherals from other manufacturers. The fourth generation of SCADA systems now includes sophisticated software, powerful microprocessors, the cloud, wireless, and the Internet of Things (IoT) [7,8]. As a result of combining traditional SCADA with the cloud, IoT provides fourth-generation SCADA systems with a viable alternative to PLCs. Through the use of intricate data modeling and algorithm modeling, the system enhances data availability, adaptability, accessibility, scalability, and cost-effectiveness. The authors used Node-Red as an IoT platform for monitoring and controlling self-generated energy [9].
An efficient, versatile SCADA system has been designed, implemented, and experimentally validated for an isolated hybrid renewable power system as a part of this study. The sizing and dynamic modeling of the developed system are presented in [10]. To achieve the purpose of this research, an Arduino Mega 2560 has been used as an RTU. The Arduino collects data from five current sensors and one voltage sensor and sends it to the MTU using the Firmata protocol through a serial port. Moreover, it receives all operating signals from the MTU to control the diesel generator and show the healthy behavior status of other essential components in the system; a PC has been utilized as an MTU to handle the communication between the RTU and the analyzer and monitor unit. Node-Red is used as an analyzer and monitoring unit for the purpose of receiving real-time data and processing, analyzing, and displaying it. Moreover, it derives some information regarding any fault in the system and controls charging and discharging the battery by turning the diesel generator on/off. Furthermore, a Wio terminal is used as a standalone low-cost and low-power RTU to receive and display all sensor values individually on an LCD. The Wio terminal allows the user to specify which sensor value to monitor by giving a binary value. The users can access the Node-Red dashboard remotely by connecting their cell phones to the main Node-Red server. To add to this, a CSV file is used to store all data.
2. Literature Review
There has been considerable effort made by many research communities around the globe in developing and improving SCADA systems to be used in various applications. A concern has been raised in [11] concerning the detection of damage on wind turbine blades following each lightning strike, which has been addressed with a SCADA system. For this reason, a SCADA system has been designed to detect any blade damage caused by lightning strikes so that the wind turbine can still run for a shorter period of time. In order to make the SCADA system capable of recognizing anomalies in blades, the following concepts have been studied: the relationship between wind speed and rotational speed; the relationship between wind speed and power generated; and the relationship between wind speed and pitch angle. As described in [12], the researchers developed a SCADA system to detect equipment faults in power plants or other industrial infrastructures caused by replay attacks, a more complex form of cyberattack. To detect and differentiate equipment’s characteristics, the author claims to utilize state space, the Kalman filter, and linear-quadratic Gaussian controller modeling frameworks. They have been able to detect anomalies and faults in various scenarios through the design and development of this SCADA system. According to [13], a low-cost open-source Internet of Things (IoT)-based SCADA system has been developed using an ESP32 connected to ThingsBoard via the Message Queuing Telemetry Transport (MQTT) protocol. The purpose of this SCADA system is to remotely monitor, process, and control the voltage, current, and power of an isolated photovoltaic (PV) system. Monitoring and controlling a renewable power system remotely can be achieved using the MQTT protocol over a private WiFi connection using the ESP32 and ThingsBoard server nodes as MQTT masters. An open-source, low-cost SCADA system was designed and implemented in [14] for the purpose of logging data locally from a PV plant. Using a remote terminal unit (RTU), an Arduino, and a master terminal unit, an RPI, the author designed this system to record and monitor the logged data from current and voltage sensors. A total of CAD $761.72 is claimed for this system, which has a power consumption of 30 watts.
The development of a SCADA system for the detection, monitoring, and recognition of faults in wind turbines has been illustrated in [15]. To improve the functionality of this system, they present a covariate-adjusted preprocessing method to clarify different weather working situations for the wind turbine. Moreover, to observe the overall situation, functionality, and performance of the wind turbine, a global monitoring statistic has been constructed based on all temperature functioning variables. By designing this system, they achieve the goal of making a historical database for a wind turbine; they also make a system that is able to isolate a fault after happening through a variable selection method; therefore, they design an applicable SCADA system to observe a wind turbine and detect and isolate any fault faster without relying on historical data or any expert knowledge. To estimate and temper the impact of any fault or disturbance in integrated AC/DC grids, a Faster Than SCADA system based on a flexible time-stepping algorithm and field-programmable gate arrays (FPGAs) has been proposed in [16]. On FPGA, by utilizing a flexible time-stepping algorithm, the researchers are able to adjust the time step value range from 1 ms to 10 ms, which provides the faster SCADA system emulation of a sophisticated power transmission system much faster due to the considerable parallelism in FPGAs. The authors of [17] developed a SCADA system based on IoT for monitoring and controlling inverters remotely. They split their approach into four layers for installation, dubbed the monitor, server, cloud, and client layers. The sensor, WiFi data collector, inverter, and wireless router components make up the monitor layer. The server layer was made up of a PC server, the cloud layer was made up of a database, and the client plane comprised a laptop, a tablet, and a smartphone. The human-machine interface (HMI) for inverter data monitoring was constructed using Asynchronous JavaScript and XML (AJAX) and Responsive Web Design (RWD) tools. The inverter data, such as voltage and frequency, were communicated over a Wireless Sensor Network (WSN) to the database in the cloud. Through an RS-485 connection and the Modbus protocol, the inverter’s voltage and frequency may also be controlled remotely.
In [18], an open-source-based SCADA system has been designed and implemented for solar-powered reverse osmosis in a community. To log and display the related data of the reverse osmosis system, an Arduino has been used as an RTU, a Debian system has been utilized as an MTU, and there is also a Node-Red-based dashboard to display the information that has been processed by the MTU. Grafana and InfluxDB are other tools that have been applied to analyze and store the data. In [19], the researchers applied an adaptive control technique and model predictive control to provide electrical frequency control for a hybrid renewable power system based on the Multi-Objective Practical Swarm Optimization Algorithm (MOPSO). This study provides the optimal point of the control algorithm coverage, which improves the system’s robustness. A SCADA system has been developed in [20] to predict and detect any anomalies in a wind turbine using collected data from a healthy wind turbine to model the regular behavior of a wind turbine and generate a Mahalanobis space to refer to and compare data. Results indicate that it can determine matching breakdown components and identify abnormalities before the wind turbines need to be taken offline for repair. The author of [21] provides an example of a monitoring method involving WiFi for hybrid renewable energy-based power sources. A PV, wind, and battery-integrated system with an IoT-based SCADA has been developed to monitor and operate the various components remotely. Through the ThingSpeak website, electrical characteristics, including voltage, current, and power, are continuously monitored and displayed. Via the KEPServerEX client, the Matlab/Simulink software tool is linked with the SCADA system. The suggested SCADA system in [22] is built on the Internet of Things SCADA framework, which combines web applications with conventional (traditional) SCADA for more reliable supervisory control and monitoring. It consists of an ESP32 Thing, a Raspberry Pi, analog current and voltage sensors, a regional WiFi router, and ESP32 microcontrollers. The current and voltage sensors in its installation obtain the required information from the processing facility, and the ESP32 microcontroller collects, analyzes, and communicates the acquired sensor data to the Thinger through a WiFi connection. It is described in [23] how to develop a low-cost SCADA system for remote Base Transceiver Stations (BTS) using the ESP32 and Arduino IoT Cloud. A WiFi network exchange of information is used to analyze and send the observed data to the Arduino IoT Cloud. Current, voltage, temperature, and humidity sensors are configured to detect pertinently desired parameters. The authors in [24] also used a Node-Red-based monitoring and control system for peer-to-peer energy trading to monitor renewable energy. In [25,26], data acquisition, monitoring, and control of renewable energy generation are carried out using an IoT server.
During the course of this research, a considerable amount of literature has been reviewed, and some issues that have been identified in the literature cited above include lack of simplicity, overuse of tools and components, inability to access ultra-low power tools, and difficulty during installation. Moreover, some studies lack active control of components and take action based on the system’s current situation. The need for real-time data storage is evident in some research. To the best of the author’s knowledge, a state-of-the-art design and implementation of a SCADA system with the following key contributions have not been presented before.
- With regard to its use and application, this study has distinguished itself as a pioneer in the development of open-source SCADA systems that are low-cost and low-power in their design.
- As a result of the system’s ability to detect three major alerts, including the inverter fault check alert, the generator fault check alert, and the low battery alert, the HRPS’s health can be monitored.
- Since the energy storage system is an essential part of a HRPS, in order to control the charging and discharging current of the battery to provide a safe margin of the available power for the consumers and keep the battery lifetime at a high level, the diesel generator is controlled by the SCADA system.
- A Wio terminal has been used as a low-power and low-cost observer for the system. This observer has been programmed to collect and process all required parameters on its own and display them on a built-in small LCD screen.
- The design setup is completely based on open-source software and hardware.
- The design system is secure and can operate in isolated mode without the internet.
Following is the description of the rest of the paper organization. There are eight sections in this article. The introduction, advantages, and objectives of SCADA systems for HPSs and HRPSs are highlighted in the first section. An extensive overview of several relevant recent texts has been covered in the section. The system is described in the third part. All employed components are described in the fourth part, which also discusses the relevant details. The implementation method is discussed in the fifth part. Experimental setup and results are proposed and discussed in Section 6. The work has been addressed, and its key components are outlined in Section 7. The task is finished in the final segment.
3. System Description
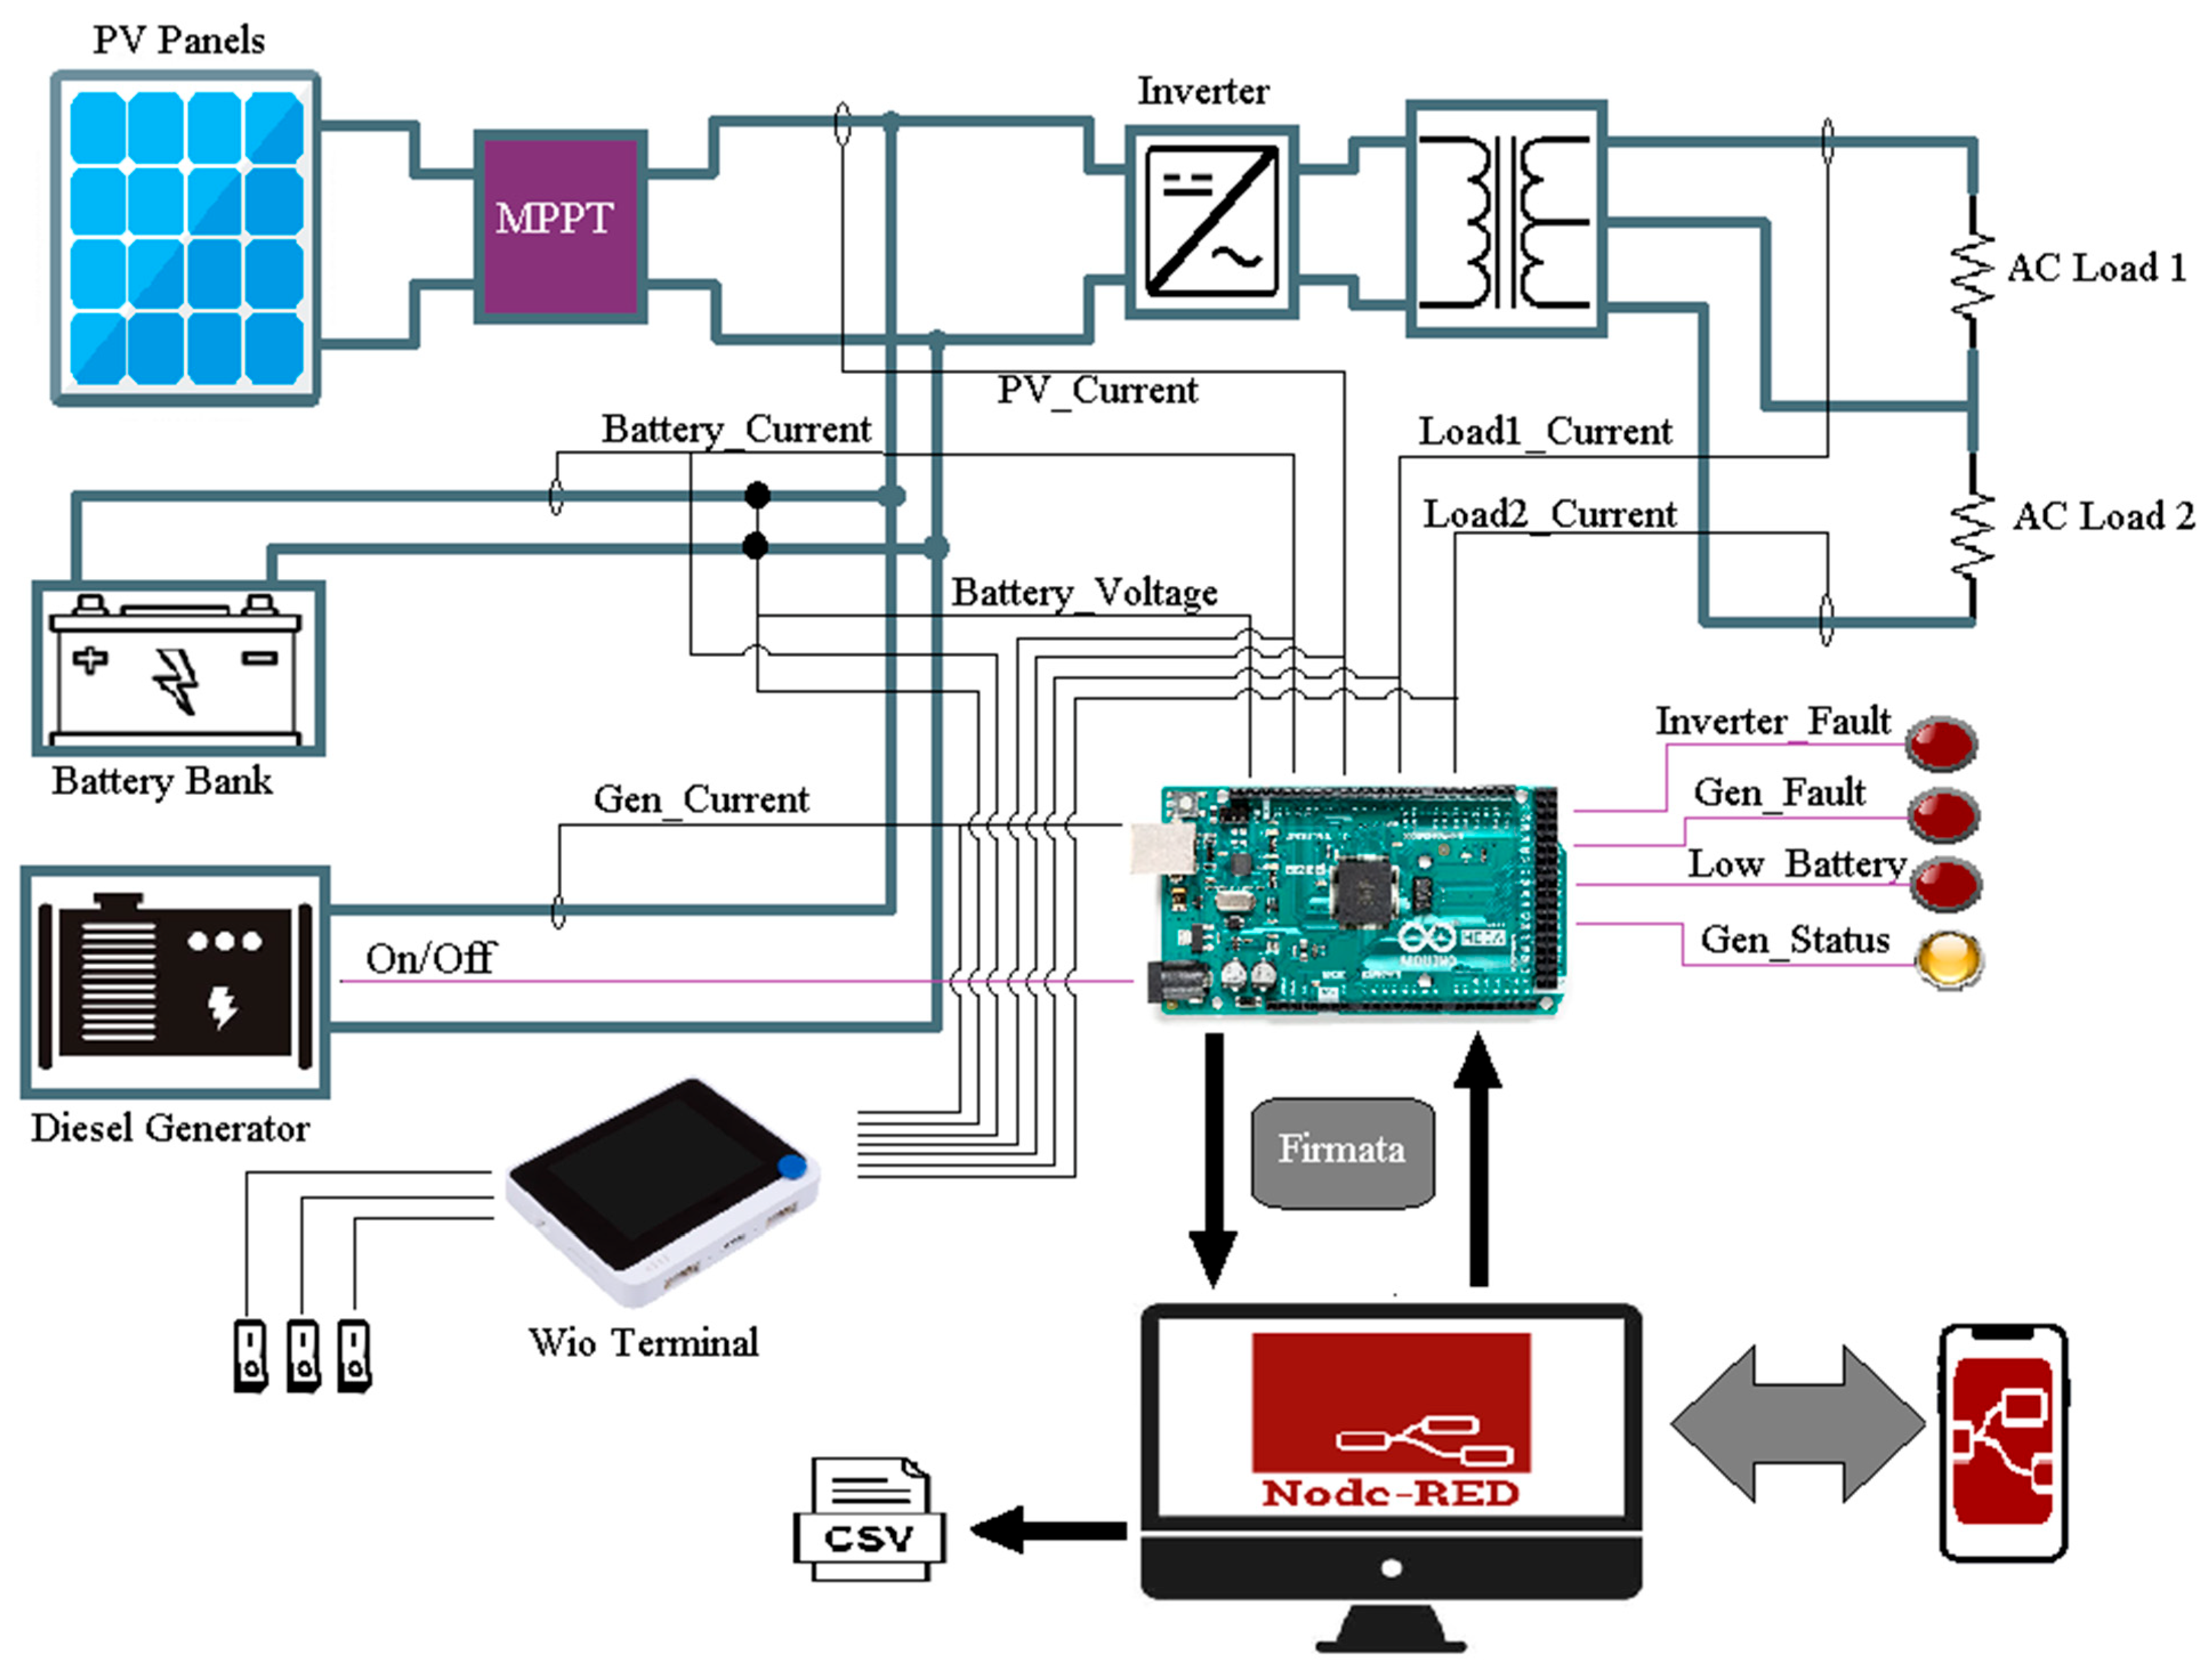
A schematic illustration of the proposed open-source SCADA system designed for the HRPS can be found in Figure 1. In the SCADA system demonstrated in Figure 1, there are six sensors, including one voltage sensor and five current sensors, to measure battery voltage, battery current, solar panel current, generator current, and load currents, respectively. In photovoltaic systems, the solar panels are connected to the Maximum Power Point Tracker (MPTT) to keep the output power at an optimum level. The PV sensor is connected to the output of the MPPT. Secondly, a diesel generator is used to generate power. The generator current sensor is attached to the generator output to sense the generator output current. The generated power is stored in a battery bank. Therefore, the battery voltage sensor and battery current sensor are connected to the battery bank ports to measure DC bus voltage and battery current.
Furthermore, the DC voltage is converted to AC voltage. An AC transformer isolates the system from the load and increases the voltage value to the local accepted voltage level. Two current sensors are connected to the AC transformer output ports to measure the actual value of load currents. All sensors measure values received by two RTUs, including an Arduino Mega 2560 and a Wio terminal. The Wio terminal receives all data in real time from sensors, processes and scales values, and displays them individually on its LCD screen, based on three command ports. The commanding ports specify the value that has to be processed and displayed on the screen. Since the Wio terminal is a very low-power module, the monitoring part of this system can be done with very low power consumption by utilizing the Wio terminal as the monitoring RTU. On the other part, Arduino receives all values and transmits them to the MTU based on the Firmata protocol, utilizing a serial port. The operating system for the minimal computer utilized in this investigation was Microsoft Windows 11 Home, which was installed on a 64-bit CPU. The PC is equipped with an Intel i5, a 4-core CPU, and 8 GB of RAM. Node-Red 3.0.2, Node.js 16.16.0, and Dashboard 3.1.7 are installed within the programming terminal for programming and Human Machine Interface (HMI) design. In Node-Red, all data are processed to be prepared for monitoring on the dashboard. Moreover, the Node-Red produces one controlling signal and three warning signals. The controlling signal is generated to turn the diesel generator on/off, and the warning signals, which are inverter fault check, generator fault check, and low battery, are produced to notify the user about the current system situation. Moreover, while the system is processing data and displaying values, all information is stored in a CSV file.
4. System Components
The RTU collects field device data and transmits them to the Windows-Node-Red server. Furthermore, the Wio terminal, a low-cost, low-power monitoring gadget, analyzes and displays the data using the Node-Red-based graphical user interface. Additionally, the information is saved as a CSV file for later analysis. Field instrumentation devices are an integral part of the system’s operation and are used to measure system activity. The Node-Red open-source server receives the values from the FIDs, feeds them to RTU, and then displays them.
4.1. Sensors
4.1.1. ACS 712 Hall-Effect-Based Linear Current Sensor Module
Allegro MicroSystems, LLC is the manufacturer and supplier of this fully integrated, low-cost current sensor, as depicted in Figure 2. The sensor operates on the Hall effect principle. This work uses a 30 A DC module with an output sensitivity of 66 to 185 mV/A and runs on a single 5 V source. The current running via the copper conductivity line creates a magnetic field when this 5 V supply voltage is provided, which the Hall IC subsequently transforms into a proportional output voltage. The specifications of the ACS712 are listed in Table 1 [27].
4.1.2. F 031-06 Voltage Sensor Module
F 031-06 is a low-cost voltage sensor. Two types of sensors were used in the system, including the ACS 712 Hall effect-based linear current sensor module (Figure 2) and the F031-06 voltage sensor module (Figure 3). Moreover, the F031-06 specifications are illustrated in Table 2. Figure 3 represents the voltage sensor used as a part of this study.
4.2. Remote Terminal Units
4.2.1. Arduino Mega 2560
The first RTU is a microcontroller board called the Arduino Mega 2560 [28], as illustrated in Figure 4. It is based on the Atmega 2560 controller chip. There are 54 input and output ports on the board, 14 of which can function as output pins for pulse width modulation (PWM). Additionally, the board is equipped with four universal asynchronous receiver transmitter pins (UARTs) and 16 analog inputs. This board includes a 16 MHz crystal oscillator, a USB connection, a reset button, an in-circuit serial programming (ICSP) connector, and a power jack. The Arduino Mega 2560 is further described in Table 3. The Arduino Integrated Development Environment (IDE) is used to configure the Arduino Mega. The IDE is a flexible editor where programmers may use various libraries, create their own programs, and debug them to look for faults. Sketches refer to the code created in an IDE. The usefulness of Arduino programming is improved by adding different procedures and operations. For real-time observation and debugging, the programmer can communicate with the board via the IDE’s serial monitor option. A type A/B cable is used to connect an Arduino to the serial port of a computer so that it may be programmed and communicated with. First, the field instrument parameters are determined using an Arduino program named “sketches” created in an IDE. Then, using the appropriate baud rate—in our example, 57,600 bits per second—the values of these parameters are measured [28].
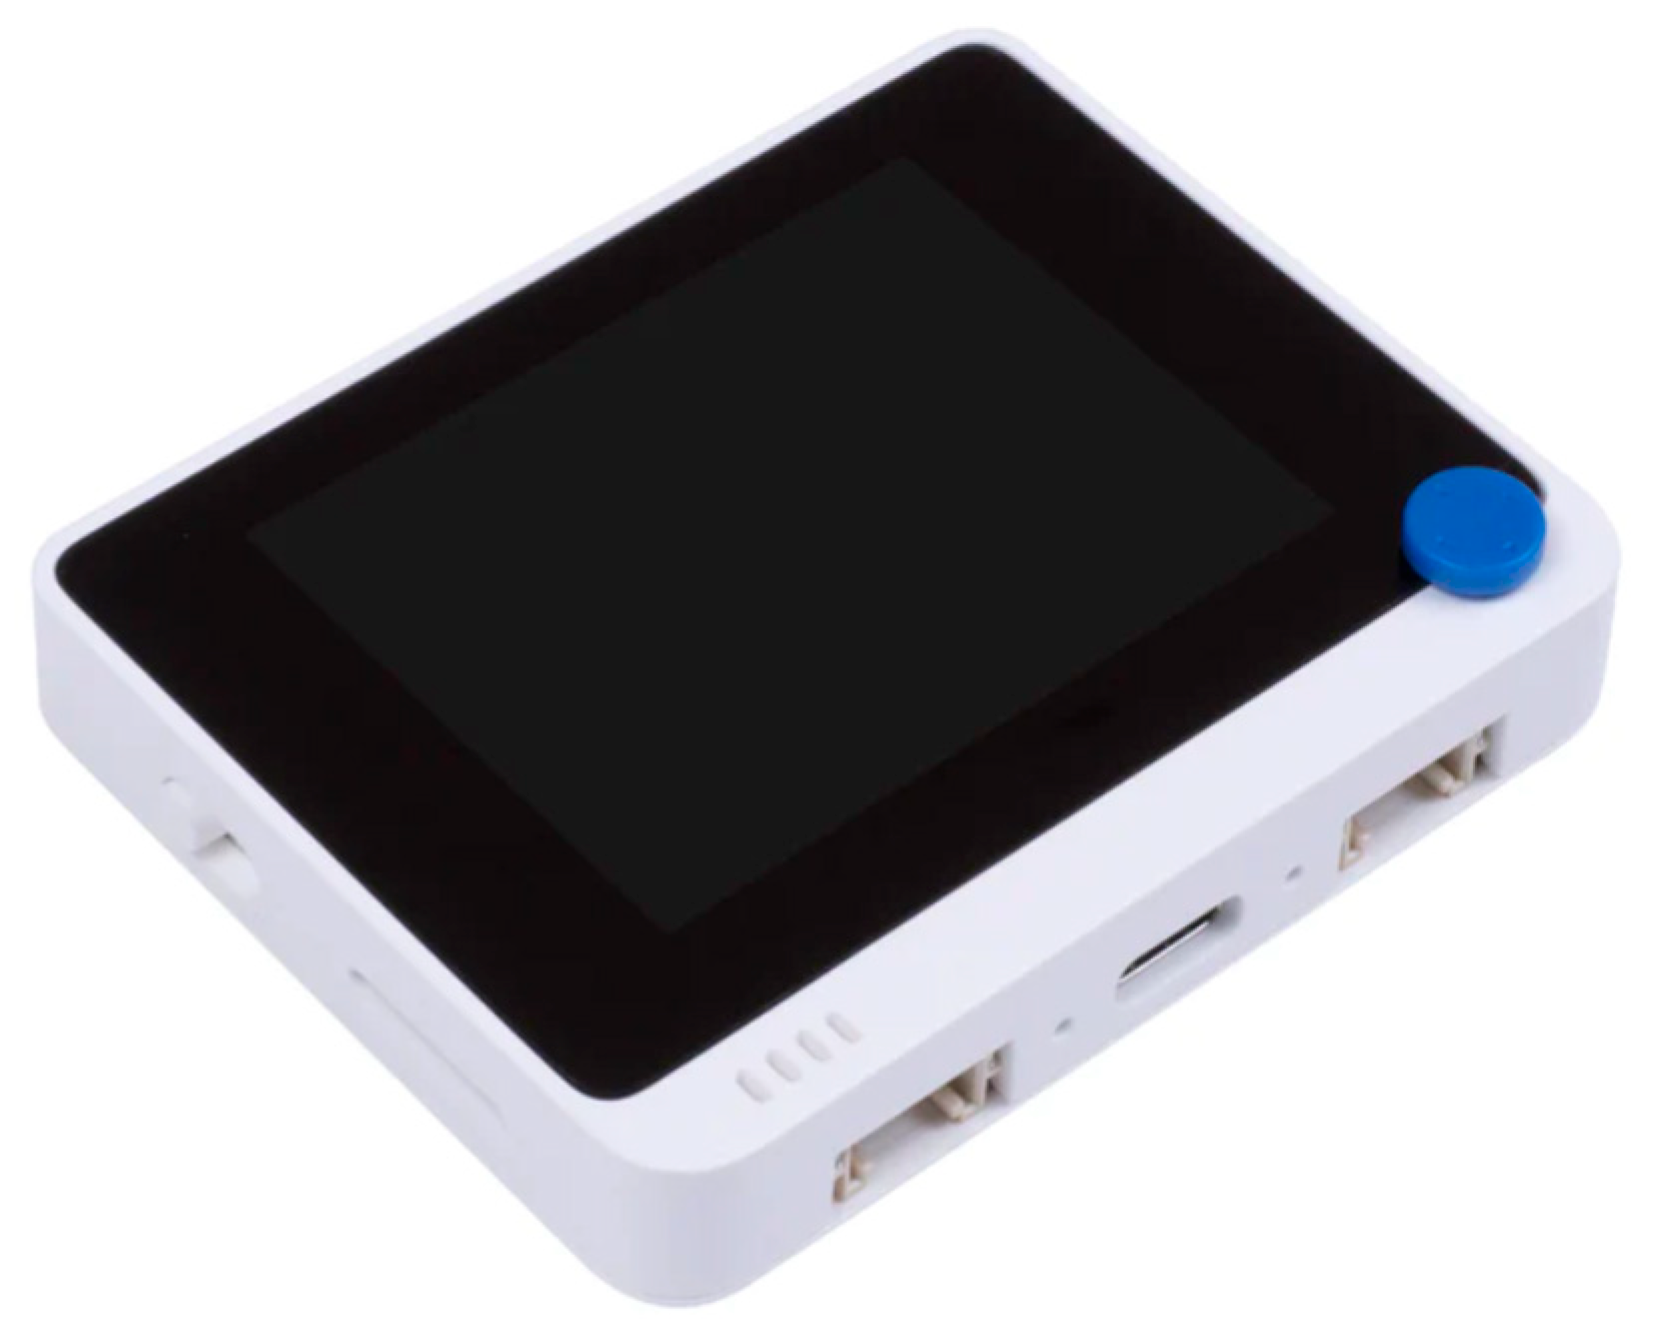
4.2.2. Wio Terminal
Figure 5 shows the Wio terminal, which is an Arduino and MicroPython compatible SAMD51-based microcontroller with built-in wireless connectivity powered by Realtek RTL8720DN. It has 192 KB RAM, 4 MB External Flash, and 120 MHz (boost up to 200 MHz) of processing speed. This terminal provides a foundation for IoT applications with support for Bluetooth and Wi-Fi. A 2.4” LCD screen, an inbuilt IMU (LIS3DHTR), a microphone, a buzzer, a microSD card slot, a light sensor, and an infrared emitter are all included with the Wio terminal (IR 940 nm). Additionally, it includes 40 Raspberry Pi compatible pins for GPIO and two multipurpose Grove connectors for the Grove Ecosystem, allowing for additional add-ons [29]. Table 4 illustrates the specifications of the Wio terminal. In Figure 6, we have shown an overview of the hardware of the Wio terminal, and the RPI pinout of the Wio terminal is depicted in Figure 7.
4.3. Main Terminal Unit
4.3.1. Hardware
The main terminal unit is a vital component of this system. This is in charge of data storage, information illustration, data programming, and data logging. This course can be broken down into two categories—hardware and software—for easier comprehension. In the hardware part, a Dell Inspiron 15 3000 machine has been utilized as a regular and widely accessible piece of hardware for most people. The related specifications of the device are shown in Table 5.
4.3.2. Software
Two sections can be distinguished in the software component, namely the operating system (OS) and the Node-Red server. As a part of this research, we have used Microsoft Windows 11 Home OS to set up a Node-Red server. It provides the opportunity for different install applications, ranging from small-scale to industrial ones. Node-Red is the application software employed in the system’s development. Flow-based visual programming, which was created by IBM’s emerging technology services division, is used in the Node-Red editor. With Node-Red, you may develop a program and use online coding to connect the actual technology. It has a browser-based development environment where you can set up a number of libraries to connect to and converse with the real world. The main advantage of utilizing Node-Red is that it makes use of a visual programming language that allows you to see how the code will be executed and how the node flows. There are so-called “nodes” in programming, which can be connected by line programming for the flow of data and have easily outlined purposes. The software may be employed by a wide range of users thanks to the design, which includes a visual depiction of the flows. Node.js is the foundation of the web-based programming tool used to change flows. As the software has a large community where developers may code their nodes and share them with the rest of the community, new nodes can be readily imported. The new flow may then be quickly shared as JSON files, which stand for Javascript Object Notation [30]. The system was developed using Node-Red version 3.0.2 and Node.js version 16.17.1. To maintain system security and privacy, the authors in [13,17,30] utilized Node-Red as their recommended IoT platform and highlighted the necessity of setting up the system locally. The dashboard module is one of the most notable aspects of the Node-Red. Users may easily develop a dynamic dashboard for observing variables. For the system’s development, Node-Red dashboard version 3.2.0 was installed.
5. Implementation Methodology
In order to implement the system, all sensors, actuators, and LEDs must be connected to the RTUs. The interconnection of all devices to the Arduino, as the first RTU, is illustrated in Table 6.
Using serial communication, the sensor data that is received by the RTU is sent to the MTU. The Firmata protocol is included within the RTU to speed up and simplify communication. Firmata is a computer-based software protocol for interacting with microcontrollers. To enable the device to function, the firmware of the microcontroller includes this protocol. Firmata for Arduino is the most widely used implementation. Node-Red programming is completed when the link between the RTU and MTU is established utilizing the Firmata protocol. Algorithms are used to describe Node-Red execution and development.
In Algorithm 1, Arduino receives data from sensors and sends all values to MTU using the Firmata protocol via serial communication. Node-Red receives data and calculates PV power and generator power values using other parameters. It then displays all the calculated values and stores them in a CSV file. While displaying and storing files, Node-Red produces three alert signals and one controlling signal, including inverter fault, generator fault, low battery, and generator status signals, respectively. If the battery voltage exceeds 14 V, it turns the generator off; otherwise, it keeps it on. To produce a generator fault check signal, Node-Red checked the generator status signal and the generator output current value. If the generator status signal is on but there is no current, or if the generator status signal is off but the generator output signal is not zero, Node-Red turns the generator fault check light on; otherwise, it keeps it off. In order to generate the inverter fault check signals, the Node-Red server checks the battery voltage and the load current, assuming that the load is on. If the battery voltage is not zero and the load currents are zero, it turns the invertor fault check light on. By checking the battery voltage and determining that it is below 11 V at a certain level, it turns the low battery check light on. If no data are received from Arduino, Node-Red tries to connect after 5 s until it gets any signal, at which point it resumes the whole procedure.
| Algorithm 1: Data Acquisition and Control System Algorithm |
| Initialization; |
| 1. Arduino reads sensors values on Analog pins A0, A1, A2, A3, A4, and A5 from battery voltage, battery current, PV current, generator current, load 1 current, and load 2 current sensors; |
| 2. Arduino sends data to Node-Red through Firmata protocol |
| while Data is being received from Arduino; |
| 3. Calculate PV power as a product of PV current and battery voltage; 4. Calculate generator power as a product of generator current and battery voltage; 5. Display all sensors values and calculated values on dashboard for data visualization; 6. Convert all data to JSON file and store in a CSV file; if Battery voltage exceeds a certain value then 7. Turn the generator off (the yellow LED); else 8. Turn the generator on (the yellow LED); end if Generator is on AND generator current is zero then 9. Turn the generator fault check light on; else if Generator is off AND generator current is not zero then 10. Turn the generator check light on; else 11. Turn the generator check light off; end if Battery voltage is not zero AND loads currents are zero then 12. Turn the inverter check light on; else 13. Turn the inverter check light off; end if Battery voltage is less than a certain amount then 14. Turn the Low Battery light on; else 15. Turn the Low Battery light off; end if end while if No data is received from Arduino then 16. Retry to connect for 5 s; else 17. Go to step 3. |
The interconnections of the sensors to the Wio terminal are depicted in Table 7.
All sensors were connected to the Wio terminal ports. Since there are 9 GPIOs, six ports were allocated to the six sensors, and three ports were assigned to the three commanding ports as the Wio terminal has one screen. Therefore, in order to display each sensor value individually, three command ports were specified. In Algorithm 2, the procedure for receiving data from sensors and commanding ports was discussed. Moreover, the analysis, selection modes, display setup, calculations, and visualization were illustrated. The Wio terminal has nine input pins, as illustrated in Figure 7. Six of these input pins, which are A0, A1, A2, A3, A4, and A5, were connected to the six sensors used in this study, which are battery voltage, battery current, PV current, generator current, load current 1, and load current 2. Similar to the Node-Red algorithm, PV power and generator power are calculated by the Wio terminal. Moreover, the last three pins, which are D6, D7, and D8, were allocated to three command switches to select one of the eight selecting modes to display the eight values. By connecting the three commanding signals to the ground and to 5 V ports, the user can select the mode to display the target value. Connecting to the ground port means “low” or “0”, and connecting to the 5 V port means “high” or “1”. Eight modes, the order of the commanding ports, and the target values are as follows:
1. If (D6, D7, D8) is equal to (0, 0, 0), target value is battery voltage.
2. If (D6, D7, D8) is equal to (0, 0, 1), target value is battery current.
3. If (D6, D7, D8) is equal to (0, 1, 0), target value is PV current.
4. If (D6, D7, D8) is equal to (0, 1, 1), target value is generator current.
5. If (D6, D7, D8) is equal to (1, 0, 0), target value is load current 1.
6. If (D6, D7, D8) is equal to (1, 0, 1), target value is load current 2.
7. If (D6, D7, D8) is equal to (1, 1, 0), target value is PV power.
8. If (D6, D7, D8) is equal to (1, 1, 1), target value is generator power.
| Algorithm 2: Wio terminal programming and setup |
| Setup: 1. Connect A0, A1, A2, A3, A4, and A5 ports to battery voltage, battery current, PV current, generator current, load 1 current, and load 2 current sensors signal ports, respectively; 2. Connect D6, D7, and D8 to selection section; Initialization: |
| 1. Consider A0, A1, A2, A3, A4, and A5 as analog input port; |
| 2. Consider D6, D7, and D8 as Digital input port; Processing and Displaying: if (D6, D7, D8) is equal to (0, 0, 0) then 1. Receive data from A0 and ignore other ports; 2. Consider this data as the battery voltage and derive the actual value; 3. Setup the LCD screen graphical plot and its scale for battery voltage values; else if (D6, D7, D8) is equal to (0, 0, 1) then 4. Receive data from A1 and ignore other ports; 5. Consider this data as the battery current and derive the actual value; 6. Setup the LCD screen graphical plot and its scale for battery current values; else if (D6, D7, D8) is equal to (0, 1, 0) then 7. Receive data from A2 and ignore other ports; 8. Consider this data as the PV current and calculate the real value; 9. Setup the LCD screen graphical plot and its scale for PV current data; else if (D6, D7, D8) is equal to (0, 1, 1) then 10. Receive data from A3 and ignore other ports; 11. Consider this data as the generator current and calculate the real value; 12. Setup the LCD screen graphical plot and its scale for generator current data; else if (D6, D7, D8) is equal to (1, 0, 0) then 13. Receive data from A4 and ignore other ports; 14. Consider this data as the load 1 current and calculate the real value; 15. Setup the LCD screen graphical plot and the scale for load 1 current data; else if (D6, D7, D8) is equal to (1, 0, 1) then 16. Receive data from A5 and ignore other ports; 17. Consider this data as the load 2 current and scale it to the actual value; 18. Setup the LCD screen graphical plot and its scale for load 2 current data; else if (D6, D7, D8) is equal to (1, 1, 0) then 19. Receive data from A0 and A2 and ignore other ports; 20. Calculate the product of these two values; 21. Consider it as the PV power and scale it to the actual value; 22. Setup the LCD screen graphical plot and its scale for PV power data; else if (D6, D7, D8) is equal to (1, 1, 1) then 23. Receive data from A0 and A3 and ignore other ports; 24. Calculate the product of these two values; 25. Consider it as the generator power and scale it to the actual value; 26. Setup the LCD screen graphical plot and its scale for generator power data; end if 27. Plot the obtained value with related topic. |
6. Experimental Setup and Results
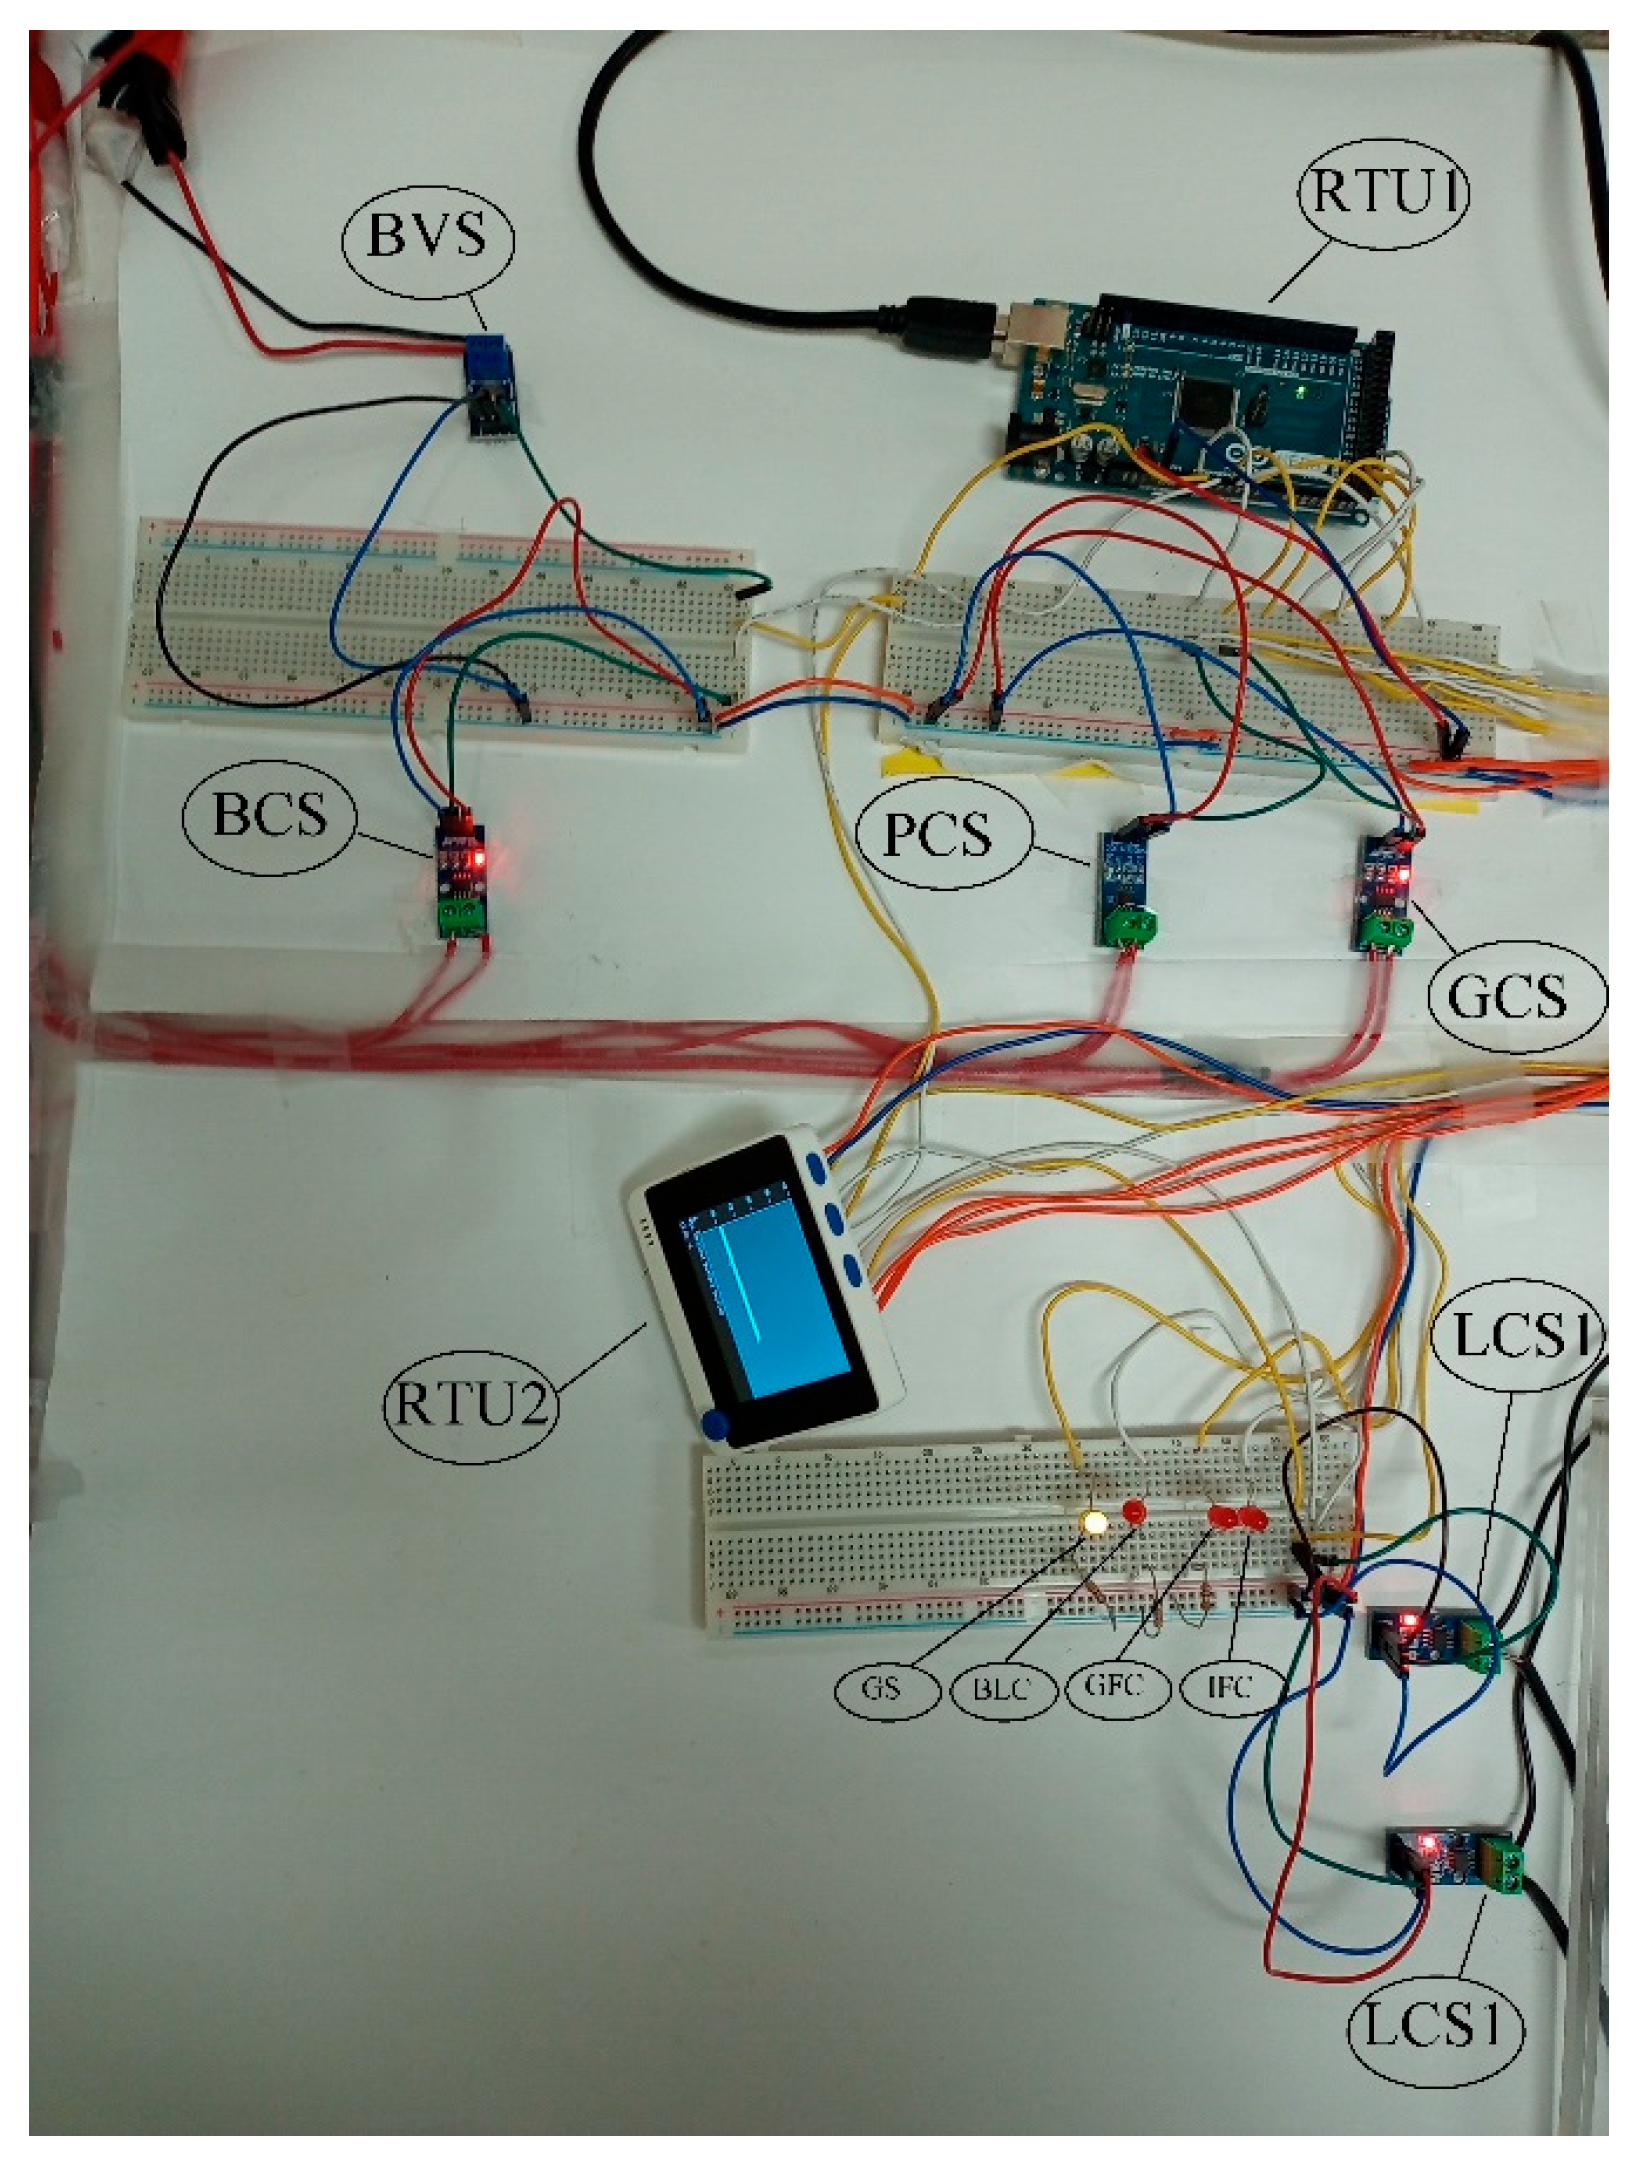
The experimental setup of the proposed system is illustrated in Figure 8. The hardware components discussed earlier were used to implement the system. Figure 9 illustrates the hardware configuration of the proposed system. A DC power supply as well as the DC diesel generator were installed. Figure 10 depicts the battery bank as an energy storage system. Moreover, there was an MPPT panel powered by rooftop PV panels (Figure 11). It consisted of a 130 W, 12 V solar module that is able to generate 20 A of current on a sunny day. The outputs of the solar panel, the battery bank, and the power supply were connected to the DC bus as well as the DC/AC inverter input. A 200 W Sunforce DC/AC inverter was implemented to convert the DC voltage to AC voltage properly. There were two 40 W 120 V AC light bulbs connected to the AC bus as the load. As shown in Figure 9, the Battery Voltage Sensor (BVS), Battery Current Sensor (BCS), PV Current Sensor (PCS), Generator Current Sensor (GCS), Load Current Sensor 1 (LCS1), and Load Current Sensor 2 (LCS2) were implemented to measure the mentioned values and send them to RTUs.
In order to connect to the DC bus, the power supply was set to the same voltage as the DC bus. As part of this setup, the Arduino was first programmed with the Firmata protocol, and the Wio terminal was then programmed with the help of computer code. The Node-Red server is run on a Windows machine. The Arduino connected to the MTU and began to send and receive data. The power supply was then turned on. All possible scenarios were tested by turning on and off the inverter and changing the connection of the light bulb.
One of the essential parts of this system setup is the processing unit, which is the Node-Red server and dashboard. All required processes were done using the Node-Red server. Moreover, the visualization of processed data and the controlling and fault check mechanisms were designed using Node-Red. Figure 12 depicts the Node-Red flow developed to set up the Node-Red server. On the left side, all sensor values were received from allocated ports. Then, the process of scaling and calculating was done for the specified functions. In addition, while the required process was being done, the data were converted to be stored in a CSV file using a JSON fn node. On the right side of the setup, the visualization part was done, and the warning data and control signal were sent to the RTU. The Node-Red flow created as a part of this research is shown in Figure 12. As seen in Figure 12, the signals that were received from Arduino were processed using some function nodes. The basic formula for the current values, based on the sensor characteristics, is as below:
which and are actual current value and the Arduino output signal value, respectively.
For calculating the actual voltage value from the BVS signal value, the following formula was used:
which is the actual battery voltage and is related to the Arduino output signal value. It is worth mentioning that these formulas have also been used in Wio terminal code to calculate the real values.
After this step of calculation, at Figure 12, there were two function nodes, named “PV_Power_fn” and “Gen_Power_fn,” to calculate the product of battery voltage and PV current to achieve PV power, and to calculate the product of battery voltage and generator current to achieve generator power. The results of all these functions were connected to some nodes named “chart” to display. Moreover, at this step, there were some more function nodes named “Battery Fault Check”, “Generator Status”, “Generator Fault Check”, and “Inverter Fault Check” that processed the values to generate the fault check signals based on the procedures that were explained in Algorithm 1. Furthermore, all calculated values were converted using a JSON node and stored in a CSV file with related titles.
Figure 13 illustrates the results of the successful testing of the system. In Figure 13, there are four LEDs; the first three LEDs illustrate the fault, which means when any of these LEDs turn on, the system detects the related fault specified in its description. The last LED represents the status of the generator; when it is on/off, it turns the generator on/off, respectively. Based on the experimental results of the system for different scenarios such as different battery voltage values, connected/disconnected loads, and an on/off generator, the procedure of generating the LED signals, which was discussed in Algorithm 1, is confirmed to be capable of controlling the system and generating warning signals correctly. On the other part of Figure 13, four different sections are specified, named PV, Battery, Generator, and Load. In the PV section, two charts were allocated to display PV current and PV power. In the second section, “Battery,” two charts are shown for the monitoring of the battery voltage and battery current. In the generator section, generator current and generator power are illustrated in two clearly defined charts. In the load section, which is the last one, two load currents are displayed in two charts named Load_Current1 and Load_Current2. The results illustrate that the real-time monitoring, processing section, and controlling parts work properly. Therefore, it can be concluded that the system is a capable SCADA system that can monitor, analyze, and control the system in real-time. The Node-Red server is accessible at http://localhost:1880/, which ensures remote monitoring and control of the proposed SCADA system. Additionally, all sensors were connected to the Wio terminal. As a result of switching the commanding ports, the Wio terminal LCD screen was prepared to display the relevant value. As shown in Figure 14, the Wio terminal screen shows the battery voltage value. As mentioned before, the Wio terminal was connected to all six sensors and three command ports and was programmed to display all nine parameters. In Figure 14, one of the variables is illustrated, namely the battery voltage, since the command ports were connected based on Mode 1, which is (D6, D7, D8), which is equal to (0, 0, 0). However, all modes were tested, and their functionalities have been confirmed.
7. Discussion
Following successful testing, this section highlights some of the key characteristics and advantages of the open-source, low-cost SCADA system developed for a site in Paradise, NL, Canada.
- System Design: The system is built in a special way where both logical programming and data analytics are done using a web-based method.
- System security: To guarantee that the system side is safeguarded in the event of unusual situations, all the actuators are separated via an RTU.
- Minimal and Open Source: Most of the suggested SCADA system parts are produced and provided by many manufacturers, making them affordable and readily available. The parts are assembled well with parts from various manufacturers and associated facilities. As a result, one of the major characteristics of an open-source system is that the consumer is not reliant on a specific manufacturer or provider. Moreover, only two types of sensors are used, which are easily accessible and affordable.
- Data collection and archive storage: The SCADA system archives and saves real-time data.
- Novelty in visualization: For visualization purposes, Wio terminals are used as remote terminal units (RTUs) to display real-time data.
- Remote monitoring and control: Alerting signals are also provided by this system, which gives the user information about the system’s health status and functionality. Additionally, the Node-Red server enables the system to be accessed and controlled remotely.
- Low-Cost and Open-Source: This design utilizes hardware components that are easily available at a reasonable price and that are also low-power. The power and cost breakdown of each component utilized in the development of the proposed design are shown in Table 8, which provides the details of the price and power consumption of each component. Another contributing factor to the system’s low cost and no annual fee is free and open-source software. Moreover, a brief comparison with two similar works [13,14] shows that the total cost of hardware setup for the proposed system is considerably lower than the mentioned works. Based on [13,14], the hardware setup cost is CAD 210 and CAD 760, respectively. However, the hardware setup cost of the proposed system is only CAD 107.
- System Limitations: The design system uses a USB-to-serial device (an FTDI chip) that is installed on the Arduino kit. The system is not compatible with the IEC 61850 communication protocol.
8. Conclusions
Research and efforts in this paper have been primarily motivated by the need for a low-cost, open-source, and low-power SCADA system for a hybrid renewable energy system. An essential feature of a SCADA system for a HRPS is the ability to monitor and track system changes. This purpose was achieved by using six sensors to gather the voltage, current, and power of vital components in the system. In addition, two different methods have been proposed to display all the received data. The first approach is to use an Arduino as an RTU to receive data and transmit it to a Node-Red-based MTU to monitor and control real-time data remotely. Additionally, a low-power, low-cost option is to use a Wio terminal to receive all sensor data and display it on a small LCD screen using three different command interfaces. Another important element of a SCADA system is the ability to monitor the overall health of the system by sensing, processing, and analyzing it to identify and report all important faults. Node-Red was programmed with an algorithm that produces three crucial check alerts, including an inverter fault check alert, a generator fault check alert, and an alert for low batteries. In providing this feature, the system health is being monitored in real time, and reliable available energy is being provided. Thirdly, this system controls the charging and discharging current of the battery to maintain the battery’s state of charge within a reasonable range and to increase its lifetime. Node-Red was configured to produce a controlling signal that turns the diesel generator on and off based on the analysis of the system. A CSV file is also maintained for future studies of all received and calculated data. Additionally, all displayed data, generated fault check alerts, and controlling signals can be viewed remotely using HMIs.
Author Contributions
System design, experimental results, and writing the manuscript have been done by S.A.O. Review and editing have been performed by M.J.A.B. and M.T.I. In addition, M.T.I. provided the required components and contributed research ideas throughout the research. All authors have read and agreed to the published version of the manuscript.
Funding
This research was funded by the Natural Sciences and Engineering Research Council of Canada (NSERC) and the School of Graduate Studies (SGS) at Memorial University.
Data Availability Statement
Data is contained within the article and references.
Conflicts of Interest
The authors declare that there is no conflict of interest regarding the publication of this paper.
Abbreviations
The following abbreviations are used in this manuscript:
| HRPSs | Hybrid Renewable Power Systems |
| SCADA | Supervisory, Control, and Data Acquisition |
| RTUs | remote terminal units |
| MTU | main terminal unit |
| HPSs | hybrid power systems |
| FIDs | field instrumentation devices |
| IoT | Internet of Things |
| MOPSO | Multi-Objective Practical Swarm Optimization Algorithm |
| GPIO | General-Purpose Input/Output |
| RWD | Responsive Web Design |
| AJAX | Asynchronous JavaScript and XML |
| IDE | Integrated Development Environment |
| HMI | Human–Machine Interface |
| CSV | common-separated value |
| LCD | Liquid Crystal Display |
| LED | light emitting diode |
| PV | photovoltaic |
| MPPT | Maximum Power Point Tracker |
| JSON | JavaScript Object Notation |
| DC | direct current |
| AC | alternative current |
| V | voltage |
| A | Ampere |
| W | Watt |
| kW | Kilowatt |
| BVS | battery voltage sensor |
| BCS | battery current sensor |
| PCS | PV current sensor |
| GCS | generator current sensor |
| LCS | load current sensor |
| CAD | Canadian dollar |
| Gen | generator |
| fn | function |
| OS | operating system |
| RAM | random access memory |
| CPU | central processing unit |
| MHz | mega hertz |
| GB | gigabyte |
| PWM | pulse width modulation |
| UART | universal asynchronous receiver transmitter pins |
| USB | universal serial bus |
| ICSP | in-circuit serial programming |
| BTS | Base Transceiver Stations |
References
- Aghenta, L.O.; Iqbal, M.T. Design and Dynamic Modelling of a Hybrid Power System for a House in Nigeria. Int. J. Photoenergy 2019, 2019, 6501785. [Google Scholar] [CrossRef] [Green Version]
- Drouilhet, S.M. Power Flow Management in a High Penetration Wind-Diesel Hybrid Power System with Short-Term Energy Storage; National Renewable Energy Lab. (NREL): Golden, CO, USA, 1999. Available online: https://www.osti.gov/biblio/12196 (accessed on 20 December 2022).
- Lee, J.; Lee, S.; Cho, H.; Ham, K.S.; Hong, J. Supervisory control and data acquisition for Standalone Hybrid Power Generation Systems. Sustain. Comput. Inform. Syst. 2018, 20, 141–154. [Google Scholar] [CrossRef]
- Guide to Industrial Control Systems (ICS) Security 2015. Available online: https://csrc.nist.gov/publications/detail/sp/800-82/rev-2/final (accessed on 30 December 2022).
- Aghenta, L.O. Open-Source SCADA Systems for Small Renewable Power Generation; Memorial University of Newfoundland: St. John’s, NL, Canada, 2020. [Google Scholar] [CrossRef]
- Sajid, A.; Abbas, H.; Saleem, K. Cloud-Assisted IoT-Based SCADA Systems Security: A Review of the State of the Art and Future Challenges. IEEE Access 2016, 4, 1375–1384. [Google Scholar] [CrossRef]
- Al-Fuqaha, A.; Guizani, M.; Mohammadi, M.; Aledhari, M.; Ayyash, M. Internet of Things: A Survey on Enabling Technologies, Protocols, and Applications. IEEE Commun. Surv. Tutor. 2015, 17, 2347–2376. [Google Scholar] [CrossRef]
- Shammar, E.A.; Zahary, A.T. The Internet of Things (IoT): A survey of techniques, operating systems, and trends. Libr. Hi Tech 2019, 38, 5–66. [Google Scholar] [CrossRef]
- Baig, M.J.A.; Iqbal, M.T.; Jamil, M.; Khan, J. IoT and Blockchain Based Peer to Peer Energy Trading Pilot Platform. In Proceedings of the 2020 11th IEEE Annual Information Technology, Electronics and Mobile Communication Conference (IEMCON), Vancouver, BC, Canada, 4–7 November 2020; pp. 402–406. [Google Scholar] [CrossRef]
- Omidi, S.A.; Iqbal, M.T. Sizing and dynamic modeling a Hybrid Renewable Power System for Paradise River, NL, Canada. In Proceedings of the 2022 IEEE 13th Annual Ubiquitous Computing, Electronics & Mobile Communication Conference (UEMCON), New York, NY, USA, 26–29 October 2022; pp. 269–276. [Google Scholar] [CrossRef]
- Matsui, T.; Yamamoto, K.; Sumi, S.; Triruttanapiruk, N. Detection of Lightning Damage on Wind Turbine Blades Using the SCADA System. IEEE Trans. Power Deliv. 2020, 36, 777–784. [Google Scholar] [CrossRef]
- Li, D.; Gebraeel, N.; Paynabar, K. Detection and Differentiation of Replay Attack and Equipment Faults in SCADA Systems. IEEE Trans. Autom. Sci. Eng. 2020, 18, 1626–1639. [Google Scholar] [CrossRef]
- Aghenta, L.O.; Iqbal, M.T. Design and implementation of a low-cost, open source IoT-based SCADA system using ESP32 with OLED, ThingsBoard and MQTT protocol. AIMS Electron. Electr. Eng. 2020, 4, 57–86. [Google Scholar] [CrossRef]
- Ahsan, L.; Baig, M.J.A.; Iqbal, M.T. Low-Cost, Open-Source, Emoncms-Based SCADA System for a Large Grid-Connected PV System. Sensors 2022, 22, 6733. [Google Scholar] [CrossRef] [PubMed]
- Liu, X.; Du, J.; Ye, Z.-S. A Condition Monitoring and Fault Isolation System for Wind Turbine Based on SCADA Data. IEEE Trans. Ind. Inform. 2021, 18, 986–995. [Google Scholar] [CrossRef]
- Cao, S.; Lin, N.; Dinavahi, V. Flexible Time-Stepping Dynamic Emulation of AC/DC Grid for Faster-Than-SCADA Applications. In Proceedings of the 2021 IEEE Power & Energy Society General Meeting (PESGM), Washington, DC, USA, 25–29 July 2021; p. 1. [Google Scholar] [CrossRef]
- Kao, K.-C.; Chieng, W.-H.; Jeng, S.-L. Design and development of an IoT-based web application for an intelligent remote SCADA system. IOP Conf. Ser. Mater. Sci. Eng. 2018, 323, 012025. [Google Scholar] [CrossRef] [Green Version]
- Uddin, S.U.; Baig, M.J.A.; Iqbal, M.T. Design and Implementation of an Open-Source SCADA System for a Community Solar-Powered Reverse Osmosis System. Sensors 2022, 22, 9631. [Google Scholar] [CrossRef] [PubMed]
- Elgammal, A.; Ramlal, T. Optimal Model Predictive Frequency Control Management of Grid Integration PV/Wind/FC/Storage Battery Based Smart Grid Using Multi Objective Particle Swarm Optimization MOPSO. WSEAS Trans. Electron. 2021, 12, 46–54. [Google Scholar] [CrossRef]
- Jin, X.; Xu, Z.; Qiao, W. Condition Monitoring of Wind Turbine Generators Using SCADA Data Analysis. IEEE Trans. Sustain. Energy 2020, 12, 202–210. [Google Scholar] [CrossRef]
- Qays, O.; Ahmed, M.M.; Mahmud, M.A.P.; Abu-Siada, A.; Muyeen, S.M.; Hossain, L.; Yasmin, F.; Rahman, M. Monitoring of renewable energy systems by IoT-aided SCADA system. Energy Sci. Eng. 2022, 10, 1874–1885. [Google Scholar] [CrossRef]
- Aghenta, L.O.; Iqbal, M.T. Low-Cost, Open Source IoT-Based SCADA System Design Using Thinger.IO and ESP32 Thing. Electronics 2019, 8, 822. [Google Scholar] [CrossRef] [Green Version]
- Oton, C.N.; Iqbal, M.T. Low-Cost Open Source IoT-Based SCADA System for a BTS Site Using ESP32 and Arduino IoT Cloud. In Proceedings of the 2021 IEEE 12th Annual Ubiquitous Computing, Electronics & Mobile Communication Conference (UEMCON), New York, NY, USA, 1–4 December 2021; pp. 0681–0685. [Google Scholar] [CrossRef]
- Baig, M.J.A.; Memorial University of Newfoundland; Iqbal, M.T.; Jamil, M.; Khan, J.; Hydro, B. Peer-to-Peer Energy Trading in a Micro-grid Using Internet of Things and Blockchain. Electron. ETF 2021, 25, 39–49. [Google Scholar] [CrossRef]
- Baig, M.J.A.; Iqbal, M.T.; Jamil, M.; Khan, J. Blockchain-Based Peer-to-Peer Energy Trading System Using Open-Source Angular Framework and Hypertext Transfer Protocol. Electronics 2023, 12, 287. [Google Scholar] [CrossRef]
- Baig, M.J.A.; Iqbal, M.T.; Jamil, M.; Khan, J. A Low-Cost, Open-Source Peer-to-Peer Energy Trading System for a Remote Community Using the Internet-of-Things, Blockchain, and Hypertext Transfer Protocol. Energies 2022, 15, 4862. [Google Scholar] [CrossRef]
- ACS 712. Available online: https://www.sparkfun.com/datasheets/BreakoutBoards/0712.pdf (accessed on 5 December 2022).
- Arduino Mega Pinout. Available online: https://www.electronicshub.org/arduino-mega-pinout/ (accessed on 14 December 2022).
- Wio Terminal. Available online: https://wiki.seeedstudio.com/Wio-Terminal-Getting-Started/#specification (accessed on 14 December 2022).
- Baig, M.J.A.; Iqbal, M.T.; Jamil, M.; Khan, J. Design and implementation of an open-Source IoT and blockchain-based peer-to-peer energy trading platform using ESP32-S2, Node-Red and, MQTT protocol. Energy Rep. 2021, 7, 5733–5746. [Google Scholar] [CrossRef]
Figure 1.
Designed SCADA system for a hybrid renewable power system.

Figure 2.
ACS712 current sensor module.

Figure 3.
F031-06 voltage sensor module.

Figure 4.
Arduino Mega 2560.

Figure 5.
Wio terminal as the second RTU.

Figure 6.
Hardware overview of the Wio terminal.

Figure 7.
Wio terminal RPI pinout schematic.

Figure 8.
Experimental setup.

Figure 9.
Hardware implementation of proposed system.

Figure 10.
Battery bank.

Figure 11.
Rooftop solar panel.

Figure 12.
Node-Red flow.

Figure 13.
Node-Red dashboard for visualization.

Figure 14.
Wio terminal battery voltage display (Mode 1).


Table 1.
Technical characteristics of ACS 712 [27].
Table 1.
Technical characteristics of ACS 712 [27].
| Characteristics | Range | Unit |
|---|---|---|
| Supply Voltage | 4.5–5.5 | V |
| Supply Current | 0–13 | mA |
| Nonlinearity | 1.5 | % |
| Zero Current Output Voltage | Vcc × 0.5 | V |
| Sensitivity | 96–104 | mV/A |
| Optimized accuracy range | −20–20 | A |
Table 2.
Technical characteristics of F 034-06.
| Characteristics | Range | Unit |
|---|---|---|
| Input Voltage Range | 0–25 | V |
| Voltage Detection Range | 0.02445–25 | V |
| Analog Voltage Resolution | 0.00489 | V |
Table 3.
Technical specifications of Arduino Mega 2560 [28].
Table 3.
Technical specifications of Arduino Mega 2560 [28].
| Specifications | Values | Units |
|---|---|---|
| Operating Voltage | 5 | V |
| Input Voltage | 7–12 | V |
| Digital I/O | 54 | Pins |
| Analog Input | 16 | Pins |
| I/O Pin Current (Individually) | 40 | mA |
| Flash Memory | 256 | KB |
| Clock Speed | 16 | MHz |
| Static Random Access Memory | 8 | KB |
| Electrically Erasable Programmable Read-Only Memory | 4 | KB |
Table 4.
Specification of the Wio terminal [29].
Table 4.
Specification of the Wio terminal [29].
| Specifications | Values |
|---|---|
| Manufacturer Part Number | ATSAMD51P19 |
| Core Processor | ARM® Cortex®-M4F |
| CPU Speed | 120 MHz (Boost up to 200MHz) |
| Program Memory Size | 512 KB |
| External Flash | 4 MB |
| RAM Size | 192 KB |
| Operating Temperature | −40 °C~85 °C |
| Display Size | 2.4 inch |
| Resolution | 320 × 240 |
| GPIO | 40-PIN (Raspberry Pi Compatible) |
| Grove | 2 (Multifunction) |
Table 5.
Dell Inspiron 15 3000 laptop specifications.
| Specifications | Value |
|---|---|
| System Manufacturer | Dell Inc. |
| System Model | Inspiron 15 3511 |
| System Type | x64-based PC |
| Processor | Intel(R) Core(TM) i5@ 2.40 GHz, 2419 MHz, 4 Core(s) |
| Installed Physical Memory (RAM) | 8.00 GB |
| Graphic card adapter description | Intel(R) Iris(R) Xe Graphics |
| Adapter RAM | 1.00 GB (1,073,741,824 bytes) |
| Display Size | 15.6 inches |
| Resolution | 1920 × 1080 × 60 hertz |
Table 6.
The Arduino interconnections with sensors, LEDs, and actuators.
| Device # | Specification | Value | Pin # |
|---|---|---|---|
| 1 | PV current Sensor | Analog | A0 |
| 2 | Battery voltage Sensor | Analog | A1 |
| 3 | Battery current sensor | Analog | A2 |
| 4 | Generator current sensor | Analog | A3 |
| 5 | Load 1 current sensor | Analog | A4 |
| 6 | Load 2 current sensor | Analog | A5 |
| 7 | Inverter fault check | Digital | 49 |
| 8 | Generator fault check | Digital | 50 |
| 9 | Low battery check | Digital | 51 |
| 10 | Generator status | Digital | 52 |
Table 7.
The Wio terminal interconnections with sensors.
| Device # | Specification | Value | Pin # |
|---|---|---|---|
| 1 | PV current Sensor | Analog | A0 |
| 2 | Battery voltage Sensor | Analog | A1 |
| 3 | Battery current sensor | Analog | A2 |
| 4 | Generator current sensor | Analog | A3 |
| 5 | Load 1 current sensor | Analog | A4 |
| 6 | Load 2 current sensor | Analog | A5 |
| 7 | Command port 1 | Digital | D6 |
| 8 | Command port 2 | Digital | D7 |
| 9 | Command port 3 | Digital | D8 |
Table 8.
Power consumption and price of hardware components.
| Sr. # | Components | QTY | Price (CAD) | Power Consumption (W) |
|---|---|---|---|---|
| 1 | ACS0712 | 5 | 3.5 | 0.4 |
| 2 | F031-06 | 1 | 3.5 | 0.006 |
| 3 | Arduino Mega 2560 | 1 | 49 | 0.27 |
| 4 | Wio Terminal | 1 | 37 | 1.2 |
Disclaimer/Publisher’s Note: The statements, opinions and data contained in all publications are solely those of the individual author(s) and contributor(s) and not of MDPI and/or the editor(s). MDPI and/or the editor(s) disclaim responsibility for any injury to people or property resulting from any ideas, methods, instructions or products referred to in the content. |
© 2023 by the authors. Licensee MDPI, Basel, Switzerland. This article is an open access article distributed under the terms and conditions of the Creative Commons Attribution (CC BY) license (https://creativecommons.org/licenses/by/4.0/).
Share and Cite
MDPI and ACS Style
Omidi, S.A.; Baig, M.J.A.; Iqbal, M.T. Design and Implementation of Node-Red Based Open-Source SCADA Architecture for a Hybrid Power System. Energies 2023, 16, 2092. https://doi.org/10.3390/en16052092
AMA Style
Omidi SA, Baig MJA, Iqbal MT. Design and Implementation of Node-Red Based Open-Source SCADA Architecture for a Hybrid Power System. Energies. 2023; 16(5):2092. https://doi.org/10.3390/en16052092
Chicago/Turabian StyleOmidi, Sayed Arash, Mirza Jabbar Aziz Baig, and Mohammad Tariq Iqbal. 2023. "Design and Implementation of Node-Red Based Open-Source SCADA Architecture for a Hybrid Power System" Energies 16, no. 5: 2092. https://doi.org/10.3390/en16052092
Note that from the first issue of 2016, this journal uses article numbers instead of page numbers. See further details here.