

Declining Renewable Costs, Emissions Trading, and Economic Growth: China’s Power System at the Crossroads

1
State Key Joint Laboratory of Environment Simulation and Pollution Control (SKLESPC), School of Environment, Tsinghua University, Beijing 100084, China
2
Department of Agricultural and Resource Economics, 207 Giannini Hall, University of California, Berkeley, CA 94720, USA
3
National School of Development, Peking University, Beijing 100871, China
*
Authors to whom correspondence should be addressed.
Energies 2023, 16(2), 656; https://doi.org/10.3390/en16020656
Submission received: 28 November 2022
/
Revised: 22 December 2022
/
Accepted: 26 December 2022
/
Published: 5 January 2023
(This article belongs to the Special Issue Energy Economic Policy of Low Carbon City)
Abstract
:As China reaffirms its commitments to limit the climate change risk and improve air quality, a combination of new policy and technology opportunities is presenting itself. A national emission trading scheme (ETS) begun in 2017 and is showing great promise, creating decentralized incentives for cost effective pollution mitigation. At the same time, sustained energy sector innovation is driving the costs of renewable electric power generation below those of fossil fuel substitutes. Early economic evidence of ETS measured pollution reductions, but has not addressed important economy-wide net benefits. This paper focuses on technology and energy cost savings and is the first to account for three multiplier effects—shifting consumption patterns, job growth, and the benefits of induced productivity growth—that would result from accelerated renewable electricity deployment in China. Results from a dynamic recursive computable general equilibrium model for 2017 to 2030 show that expanding renewable deployment can interact with the ETS to slash GHG emissions, as well as energy costs, stimulating significant long-term economic growth. These results suggest that China should accelerate its clean energy transition, not only for the air-quality and climate benefits, but to fulfill the energy sector’s potential to promote innovation, employment, and economic growth.
1. Introduction
The People’s Republic of China is the world’s largest emitter of greenhouse gases (GHG), 44% (4143 MtCO2) of which came from the electric power system in 2017 [1]. According to its nationally determined contribution (NDC) to the United Nation’s Framework Convention on Climate Change (UNFCCC), the Chinese government pledged to lower CO2 emissions per unit of GDP by 60% to 65%, relative to the 2005 emissions, increasing the share of non-fossil fuels in primary energy consumption to around 25% by 2030. Accelerating the replacement of traditional energy with renewable substitutes would help transform the power system and reduce carbon emissions. China has already demonstrated rapid growth in renewable electricity generation, which increased from 736 TWh (17% of total electricity generation) to 1931 TWh (26%) between 2010 and 2019 [2].
Renewable energy costs have experienced an unprecedented decline. Over the past decade, the global weighted-average levelized cost of electricity (LCOE) has fallen by 82% for photovoltaics (PV), 39% for onshore wind, and 84% for battery storage [3,4]. Even without accounting for the social cost of carbon, the all-inclusive costs of electricity from new PV and onshore wind are now below the marginal operating costs of an increasing number of existing coal-fired power plants [5]. In market economies, this cost trend will support autonomous power system transformation, reduce fossil fuel dependence and related environmental impacts, and reduce wholesale and retail electricity costs [6,7]. As a result, new opportunities will arise for cutting consumer and manufacturer energy costs, improving human welfare, and boosting economic growth.
Government policy is also driving the renewable transition. Dechezleprêtre and Sato [8] found “strong evidence that environmental regulations induce innovation activity in cleaner technologies”. The carbon emission trading scheme (ETS) is among the most potentially impactful approaches to driving the renewable transition. In 2011, China launched a pilot ETS covering seven leading provinces and cities, including Beijing, Shanghai, Guangdong, Shenzhen, Tianjin, Chongqing, and Hubei. By the middle of 2019, the cumulative trading volume of the pilot ETS covered 330 MMT CO2e of emissions, with a cumulative transaction value of 7.11 billion RMB [9]. In December 2017, China officially launched its national ETS, and electric power was the first industry included in the system [10]. To date, active research literature has evaluated China’s ETS, which suggests that China’s ETS mitigates CO2 emissions and promotes renewable energy deployment, but hinders the economy—although there is significant disagreement about the magnitude and direction of the net economic impacts. However, few studies focus on the comprehensive impact of renewable technology improvement and the ETS in the context of the renewable energy cost crossover.
Further, the existing literature does not account for the three critical indirect benefits of China’s clean energy transition that could magnify the impacts of accelerating China’s renewable electricity transition through technology improvement and the ETS. Falling energy expenditure, even in the presence of “rebound effects” that may partially offset energy cost savings, offers many such benefits via higher real income and expenditure shifting. More accommodating labor markets can also amplify economic gains, due to the expenditure stimulus, particularly in the long-term. Additionally, increasing renewable energy use may increase regional total factor productivity (TFP), supporting the anecdotal narrative of a virtuous productivity cycle linking renewable energy deployment to other technological innovations.
To better understand all these interactions, this study employs a dynamic recursive CGE model with a diverse portfolio of electric power technologies. The model is used to evaluate scenarios that combine changing renewable energy costs with specific ETS strategies, assuming different degrees of adjustment flexibility. The study is important, as it examines how falling renewable energy technology costs can interact with ETS and shows that dramatic GHG reductions can be achieved with net positive aggregate economic growth. Such findings are also key during the post-COVID period, when governments are searching for ways to reboots the economy. Section 2 summarizes the literature on the economic impact analysis with technology improvement and ETS and demonstrates the research basis of the three multiplier effects. Section 3 focuses on the methods, data, and scenario settings of this study. Section 4 shows the results, and the discussion and implications are in Section 5.
2. Literature Review
Recent studies have evaluated the macroeconomic impacts of renewable transition around the globe. The International Energy Agency (IEA) used its world energy model (WEM), a large-scale simulation model, with linkage to multiple other models, including the greenhouse gas and air pollution interactions and synergies (GAINS) model of the International Institute for Applied Systems Analysis (IIASA) and the global integrated monetary and fiscal (GIMF) model of the international monetary fund (IMF) to evaluate the impacts of a net zero carbon emission pathway of the world by 2050 [11]. Gielen, Boshell, Saygin, Bazilian, Wager, and Gorini [12] used a global macro-econometric model to estimate the impacts of an accelerated energy transition to 2050 on employment and GDP around the world. Bulavskaya and Reynes [13] used a neo-keynesian computable general equilibrium (CGE) model to evaluate the long-term effects of renewable energy on GDP and jobs in Netherland. Dai, Xie, Xie, Liu, and Masui [14] used a dynamic CGE model to assess the economic impacts and environmental co-benefits of increasing penetration of renewable energy in China toward 2050.
The computable general equilibrium (CGE) model is an important tool for studying macroeconomic impacts with detailed linkage and interaction among different sectors throughout the overall economy for a single country. Recent studies mainly used two ways to measure technology improvement in such models. First, the progress of technology is considered as endogenous by introducing knowledge as a new input factor and separating R&D sector as knowledge investments and stocks [15]. This method could measure the interaction between innovation and human capital, but it is hard to reflect technological progress in specific sectors. The second method characterizes the progress of technology as exogenous parameters. Homogeneous autonomous energy efficiency improvement (AEEI) across the economy [16] or average AEEIs for different energy-consuming sectors [17] are commonly used to demonstrate the energy technology improvement on the demand side, but these legacy approaches fail to distinguish the technological improvement for different energy sources. Huang, Roland-Holst, Springer, Lin, Cai, and Wang [18] and Li, Lu, and Zhang [19] used an exogenously specified mix of fossil and renewable energy to describe the process of renewable energy substitution along China’s future low-carbon development pathway. These studies considered the exogenously specified generation mix as policy control, instead of an adjustment caused by technological progress and cost reduction. Neither recent cost crossover—with the cost of renewables dropping below the cost of coal power—nor the full economic impacts of technology improvement are fully recognized.
Carbon emission trading schemes (ETS) are among the most potentially impactful approaches to facilitating renewable energy transition. A large and growing research literature has developed around China’s national ETS (Table 1). To date, the research literature suggests that China’s ETS mitigates CO2 emissions and promotes renewable energy deployment but hinders the economy—although there remains significant disagreement about the magnitude and direction of net economic impacts. Liu, Tan, Yu, and Qi [20] found that a 1% carbon emission reduction would reduce GDP by 0.06%, whereas Zhang, Li, and Jia [17] indicate that the ETS could reduce carbon intensity by 20% reduction without GDP loss. Most studies show a negative net impact on the economy due to the ETS, ranging from 0.08% to 5.61% of real GDP, depending on the mechanism and coverage considered [21]. However, the price-directed nature of the ETS still confers efficiency gains, compared with mandated emission caps [22].
The literature considers economic impacts for various ETS policy designs. In terms of allowance allocation, both Zhang, Li, and Jia [17] and Li and Jia [23] found that the GDP impacts of different allocation mechanisms in the power sector differed by less than 1.4%. Regarding ETS coverage, some researchers suggested that including more sectors and regions would improve diversity and efficient cost allocation across the carbon market [16,24], whereas others advocated limiting the coverage of sectors to cement, chemicals, and electric power to improve carbon price and allocation effects [25]. Different methods of redistributing ETS revenue have also been considered, such as promoting the development of renewable energy [26], targeting specific adjustment needs, and improving social equity [18]. There is a need to consider both the plummeting renewable energy costs and the associated economic impacts.

Table 1.
A Summary of studies on economic impacts of China’s ETS.
| Research Contents | Region | Sectors | Time | Method |
|---|---|---|---|---|
| Economic impacts of launching ETS: National and Regional Economy | ||||
| [27] | National | 35 sectors | 2006–2015 | DEA a based optimization model |
| [28] | National | - | 1995–2012 | SFA b, DID c, & NLP d |
| [29] | National | - | 2020 | DEA a |
| [30] | Shanghai & National | Part | 2007–2030 | CGE Model |
| [20] | Hubei | Part | 2014 | CGE Model |
| [22] | Shanghai | Part | 2007–2030 | CGE Model |
| [31] | Guangdong | Part | 2007–2020 | CGE Model |
| Economic impacts of launching ETS: Sectoral Impacts | ||||
| [32] | National | Coal-to-material industry | 2020 | Cournot-based model |
| [33] | National | heavy chemical industry | 2017–2030 | STIRPAT regression & CGE Model |
| Economic impacts with different policy designs in ETS | ||||
| Allowance allocation | ||||
| [17] | National | Power sectors | 2012–2030 | CGE Model |
| [21] | National | All | 2012–2030 | CGE Model |
| [22] | National | Part | 2010–2035 | CGE Model |
| [34] | National | All | 10 years | Multi-agent-based approach |
| Carbon price | ||||
| [35] | National | Part | 2010–2030 | CGE Model |
| Revenue redistributions | ||||
| [26] | National | Part | 2017–2030 | CGE Model |
| [18] | National | All | 2012–2050 | CGE Model |
| Coverage | ||||
| [24] | National | Different e | 2010–2030 | CGE Model |
| [16] | National | Different e | 2012–2030 | CGE Model |
| [25] | National | Different e | 2017–2030 | CGE Model |
| Government fines | ||||
| [36] | National | Part | 2012–2030 | CGE Model |
| Economic impacts with multiplier effects: Air quality and Co-benefit | ||||
| [37] | National | All | 2012–2030 | Integrated Analysis Model (Provincial) |
Note: a DEA, Data envelopment analysis; b SFA, Stochastic Frontier Analysis; c DID, the Difference-in-difference Model; d NLP, the Nonlinear Programming Technique; e different in scenario settings.
Further, the existing literature does not account for three critical multiplier effects that could amplify the beneficial impacts of accelerating China’s renewable electricity transition through technology improvement and the ETS. First, households can be expected to divert their electricity cost savings toward other expenditures, promoting broad-based economic growth from the demand side.
Second, China’s labor market generally has a higher elasticity of labor supply, compared with labor markets in developed countries. This more accommodating labor supply will amplify economic gains due to the expenditure stimulus, particularly in the long-term.
Third, renewable energy use may affect regional total factor productivity (TFP), supporting the anecdotal narrative of a virtuous productivity cycle linking renewable energy deployment to other technology innovation. Although the exact mechanisms are difficult to disentangle, studies in diverse settings suggest a positive linkage. Ladu and Meleddu (2014) examined the causal relationship between energy consumption and TFP in Italy, applying the dynamic panel estimation technique to data for 1996–2008 and finding a bidirectional relationship between the variables [38]. Tugcu [39] applied the autoregressive distributed lag (ARDL)-bound testing to 1970–2011 economic data from Turkey, concluding that renewable energy consumption has a positive impact on TFP, but fossil fuel energy consumption has a negative impact [39]. That study calculated TFP using the Cobb–Douglas production function with two factors; the estimated long-run growth elasticities were −2.1 (fossil consumption) and 0.8 (renewable consumption), and the short-run estimates were −1.7 (fossil consumption) and 0.7 (renewable consumption). Tugcu and Tiwari [40] used a panel bootstrap Granger causality test to investigate the causal relationship between energy consumption and TFP growth in the BRICS from 1992 to 2012, finding no remarkable causal link between renewable energy consumption and TFP growth, but finding a bidirectional causal link between non-renewables and TFP growth in Brazil and South Africa. Rath, Akram, Bal, and Mahalik [41] examined the relationship between energy consumption and TFP growth with data from 36 countries during 1981–2013, finding that renewable energy consumption is associated with higher TFP growth, whereas fossil fuel consumption is correlated with lower TFP growth. Yan, Zou, Du, and Li [42] studied the relationship between renewable energy technology innovations and China’s green productivity growth, finding a significant effect in provinces where income is above a certain threshold; the positive correlation of income with average education levels suggests a “readiness” component in this innovation effect.
3. Material and Methods
We use the PRC aggregated national development assessment (PANDA) model (PANDA was developed in 2005 by David Roland-Holst and is fully documented here: http://www.bearecon.com/PANDA_Technical191015.pdf, accessed on 21 December 2022), a dynamic CGE model of the Chinese economy constructed at the University of California, Berkeley, which has been used to analyze China’s energy and climate policies [18,43]. The current version of the PANDA model is calibrated to the 2017 China input–output table [44], with 42 aggregated production sectors. To better analyze the economic impacts of renewable energy cost reductions, we disaggregate the power sector into electricity transmission, electricity storage, and eight different generation technologies (coal, natural gas, oil, nuclear, hydropower, wind, solar, and biomass) following the methods of Mu, Wang, and Cai [16] and Wing [45]. The generation shares by technology type are based on data from the China Electricity Council (2020), whereas the cost shares by investment, O&M, and fuel for each technology are based on levelized cost data from the International Energy Agency [46] and He, Lin, Sifuentes, Liu, Abhyankar and Phadke [7].
3.1. Core Model
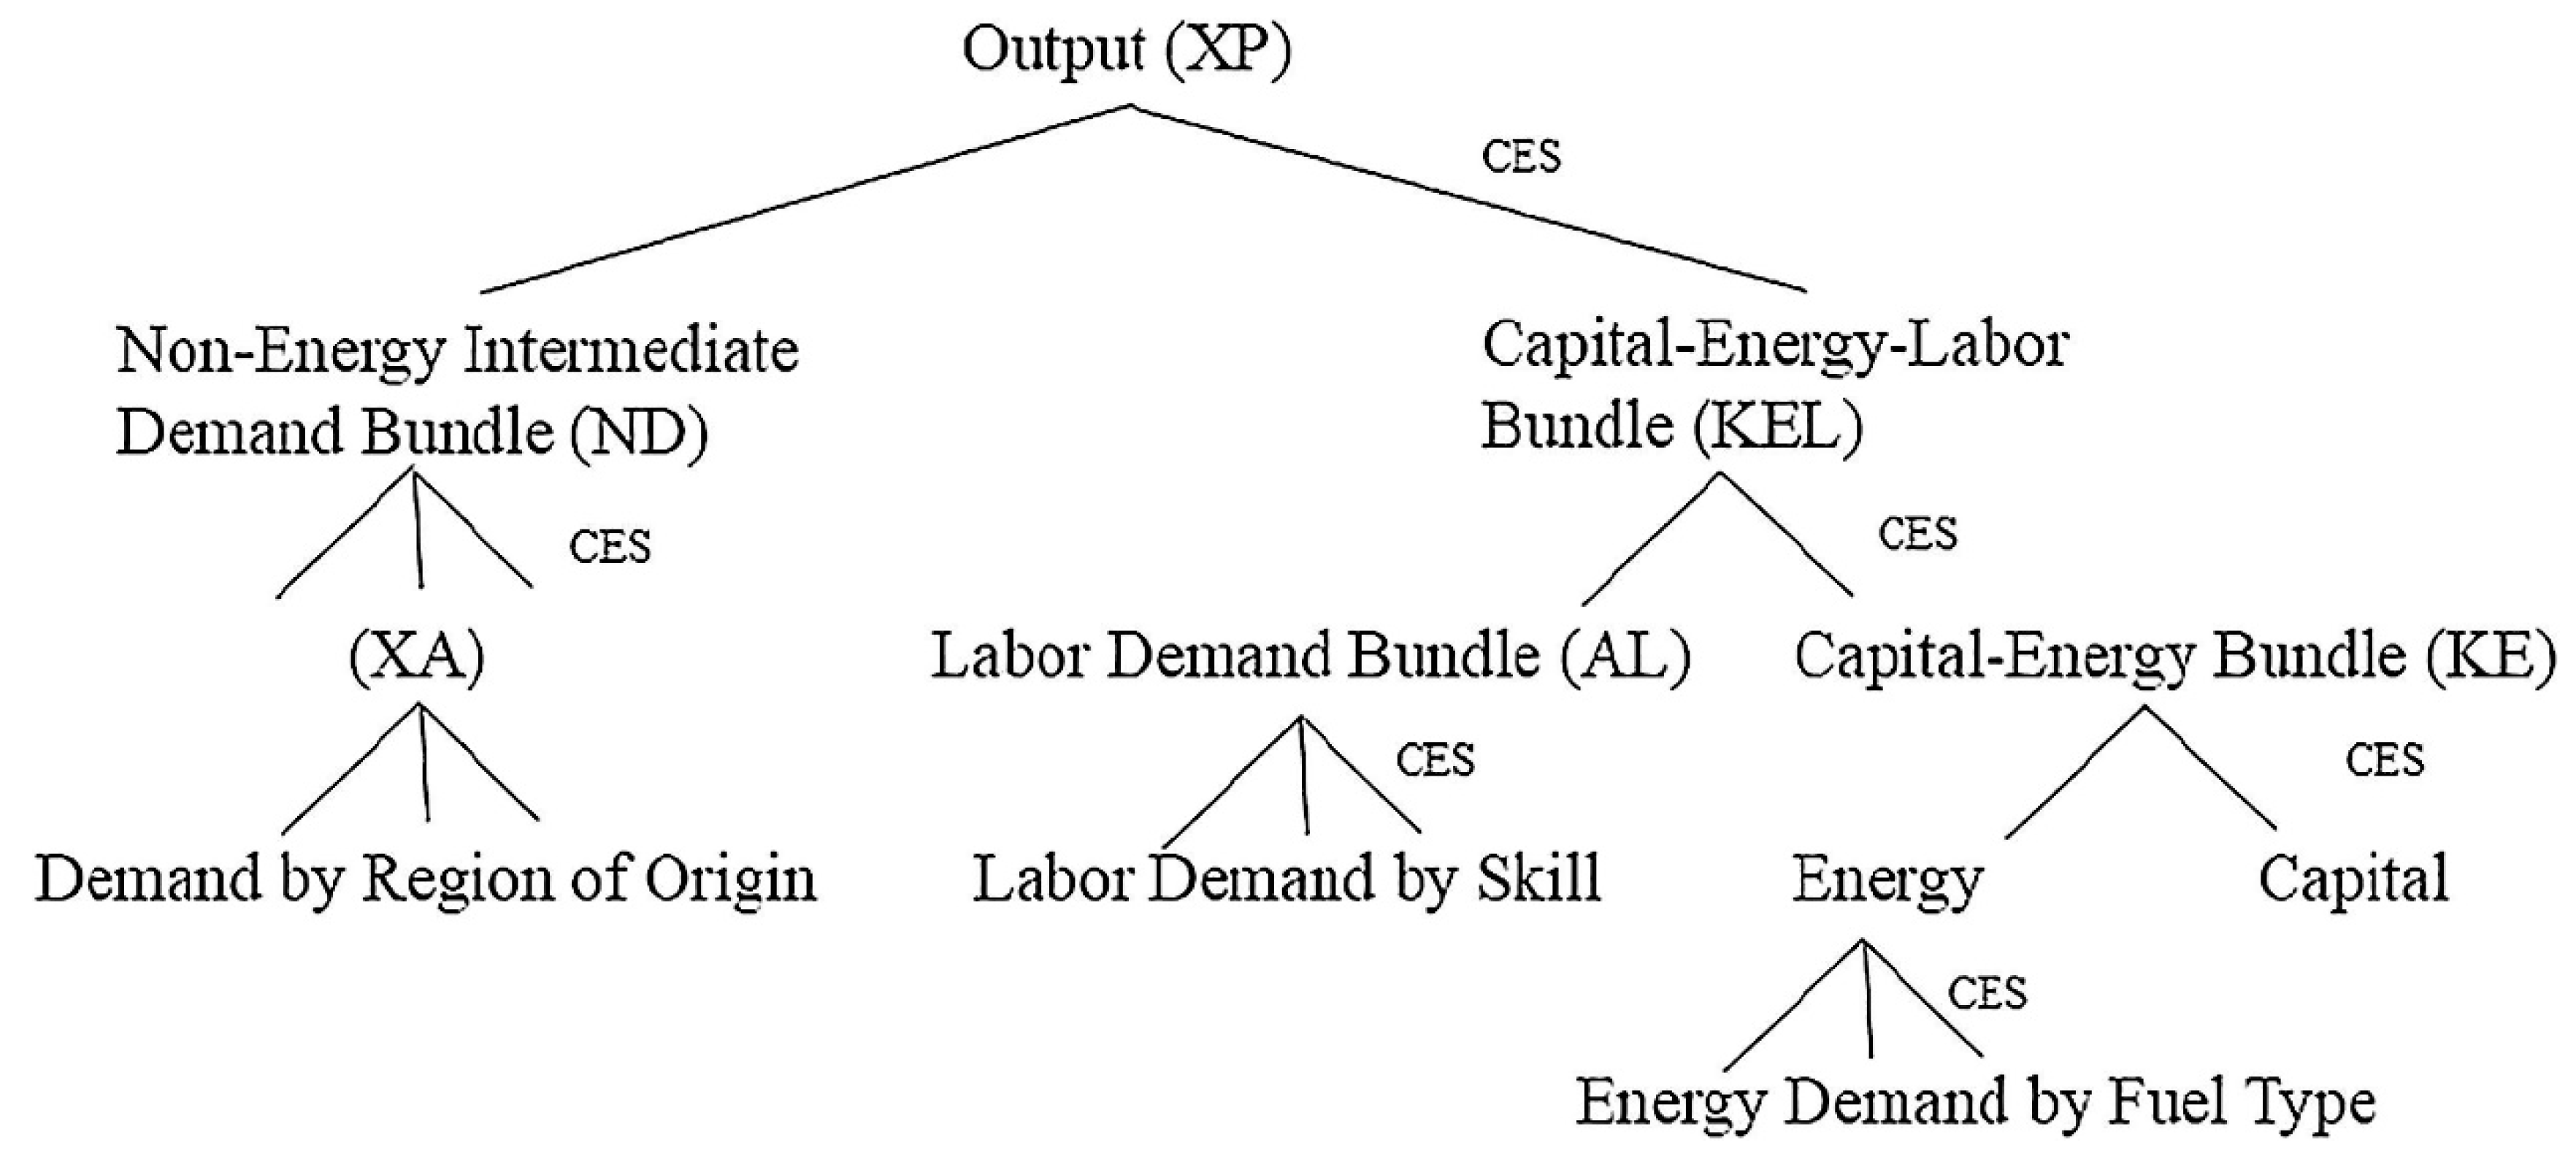
In the production block, the constant elasticity of substitution (CES) function, the most common non-linear function for CGE models, is used to represent the different substitution possibilities across different inputs in each sector (Figure 1). The non-energy intermediate demand (ND) bundle—where the intermediate demand follows the fixed proportion input–output relationship (the Leontief function, a special form of the CES function with zero substitution elasticity)—is combined with the capital-energy-labor (KEL) bundle to generate the final output. The KEL bundle consists of the labor demand (AL) bundle and capital-energy (KE) bundle. In the third level, the AL bundle is split into labor demand by skill, whereas the KE bundle is split into energy and capital. In the fourth level, the energy demands by fuel type are combined to generate energy output.
In the consumption block, the PANDA model includes households and government as the two representative consumers. Household income from labor wages, investment income, and transfer payments is allocated to expenditures on goods and saving by an exogenous rate calibrated to the social accounting matrix. Each representative household is assumed to maximize utility by consuming different goods and services, as modeled by the linear expenditure system specification. The government receives revenues from various tax instruments (income, indirect trade, and factor taxes), net of subsidies, and transfers. Government income is allocated to goods and services, and aggregate expenditures are fixed in real terms.
For international trade, the Armington assumption allows for differentiation between domestic products and imports and exports. In addition, the model simulates this differentiation as an aggregate (XA above), with one domestic Armington agent per product category, using constant elasticity of substitution (CES) and constant elasticity of transformation (CET) functions to represent the import and export sides, respectively.
3.2. Electricity Technology Improvement
In order to measure the different electricity technology improvement level, a new parameter is introduced in the first level of production block for electricity generation sectors (Equations (1)–(3)). For each sector , is the total output, is the non-energy intermediate demand bundle, and is the capital-energy-labor bundle. , , and stand for the price of output, ND bundle, and KEL bundle, respectively. is the elasticity parameter for CES functions, while and represent share parameter. For sectors other than the electricity generation, the value of keeps, as 1 indicates no exogenous technology improvement assumptions. For a certain power sector , the value of is greater than 1, meaning that the production efficiency of a certain power sector is improved, i.e., the same output could be obtained with less input.
The specific value of is calculated based on the research results of He et al. [7]. In the former study, SWITCH-China model, an optimization model with specific electricity technology details, is employed to analyze the future energy system under business as usual scenario (the cost of renewable technologies will decrease at a moderate speed) and R scenario (the rapid decrease in costs for renewables will continue). for each electricity generation technology is calibrated initially to meet the generation mix in 2030 projected by He et al. [7].
3.3. Carbon Emission Trading Block
A carbon emission trading block is applied to simulate the ETS in the PANDA model. The CO2 emissions of sector i () equal the inputs from energy sector e to sector i () multiplied by the emission factor () (Equation (4)). The CO2 emissions of household h () equal the inputs from energy sector e to final consumption of household h () multiplied by the emission factor () (Equation (5)). The total CO2 emissions () equal the sum of emissions from production and households (Equation (6)). The emission factors by energy types, sectors, and households are calculated by aggregating 20 fuel types into 4 energy sectors and disaggregating the consuming sectors to be more consistent with the production sectors, based on the China national CO2 emission inventory (sectoral approach) from Shan et al. [1]
In this study, the power industry is the only sector controlled by the national ETS. The total annual carbon emissions for the power sector () are set exogenously (Equation (7)); the level of emissions restrictions is described in the following subsection. To meet the CO2 emissions constraints, a shadow carbon price (μ) for each unit of CO2 is introduced into the model. Each unit of emissions in the power generation process requires an additional payment () to the production function (Equation (8)). When CO2 emissions constraints on the power sector are introduced into the economic system, in terms of affecting production costs and producers’ behavior, the system eventually reaches a new equilibrium.
3.4. Scenarios
We evaluate seven scenarios (Table 2). In the business as usual (BAU) scenario, the productivity of renewables is assumed to follow historical trends, with sustained, but moderate, cost reductions into the future. In the low-cost renewable scenario (R), more rapid productivity growth in renewables continues in alignment with recent indications, simulating how lower renewable energy costs provide direct stimulus to the economy. As demonstrated in Section 3.2, the productivity increases in renewables denoted by changes in are calibrated based on generation mix in the base year (2017) and He et al.’s projection in 2030 [7]. The subsequent two mitigation scenarios and three economic multiplier scenarios are based on the assumptions of the R scenario, showing more rapid cost reduction with the same investment and R&D.
Two carbon constraint scenarios are set to simulate the emission reduction of the power sector under the requirements of the climate policy. In the C50 scenario, total emissions from the power sector by 2030 are limited to 50% below the 2015 level by instituting an ETS for this sector, while those in C80 are limited to 80% below.
Our other three scenarios examine the multiplier economic impacts of renewable innovation and the ETS. The Keynes scenario builds on the C80 scenario to elucidate the effects of demand-side aggregate stimulus resulting from energy cost savings due to renewable technology innovation. Previous economic assessments of renewable energy have focused on three component impacts: investment in technology production, technology purchasing, and installation. Technology production (e.g., building and operating a solar panel factory) represents so-called “shovel ready” investment and is usually an unambiguous economic stimulus. Technology purchase and installation costs can have mixed economic effects, depending on the opportunity cost or alternative return to capital. In other words, technology adoption will stimulate the economy if it increases productivity, reduces resource costs, or both. If it reduces productivity or increases resource costs, it will be detrimental to growth.
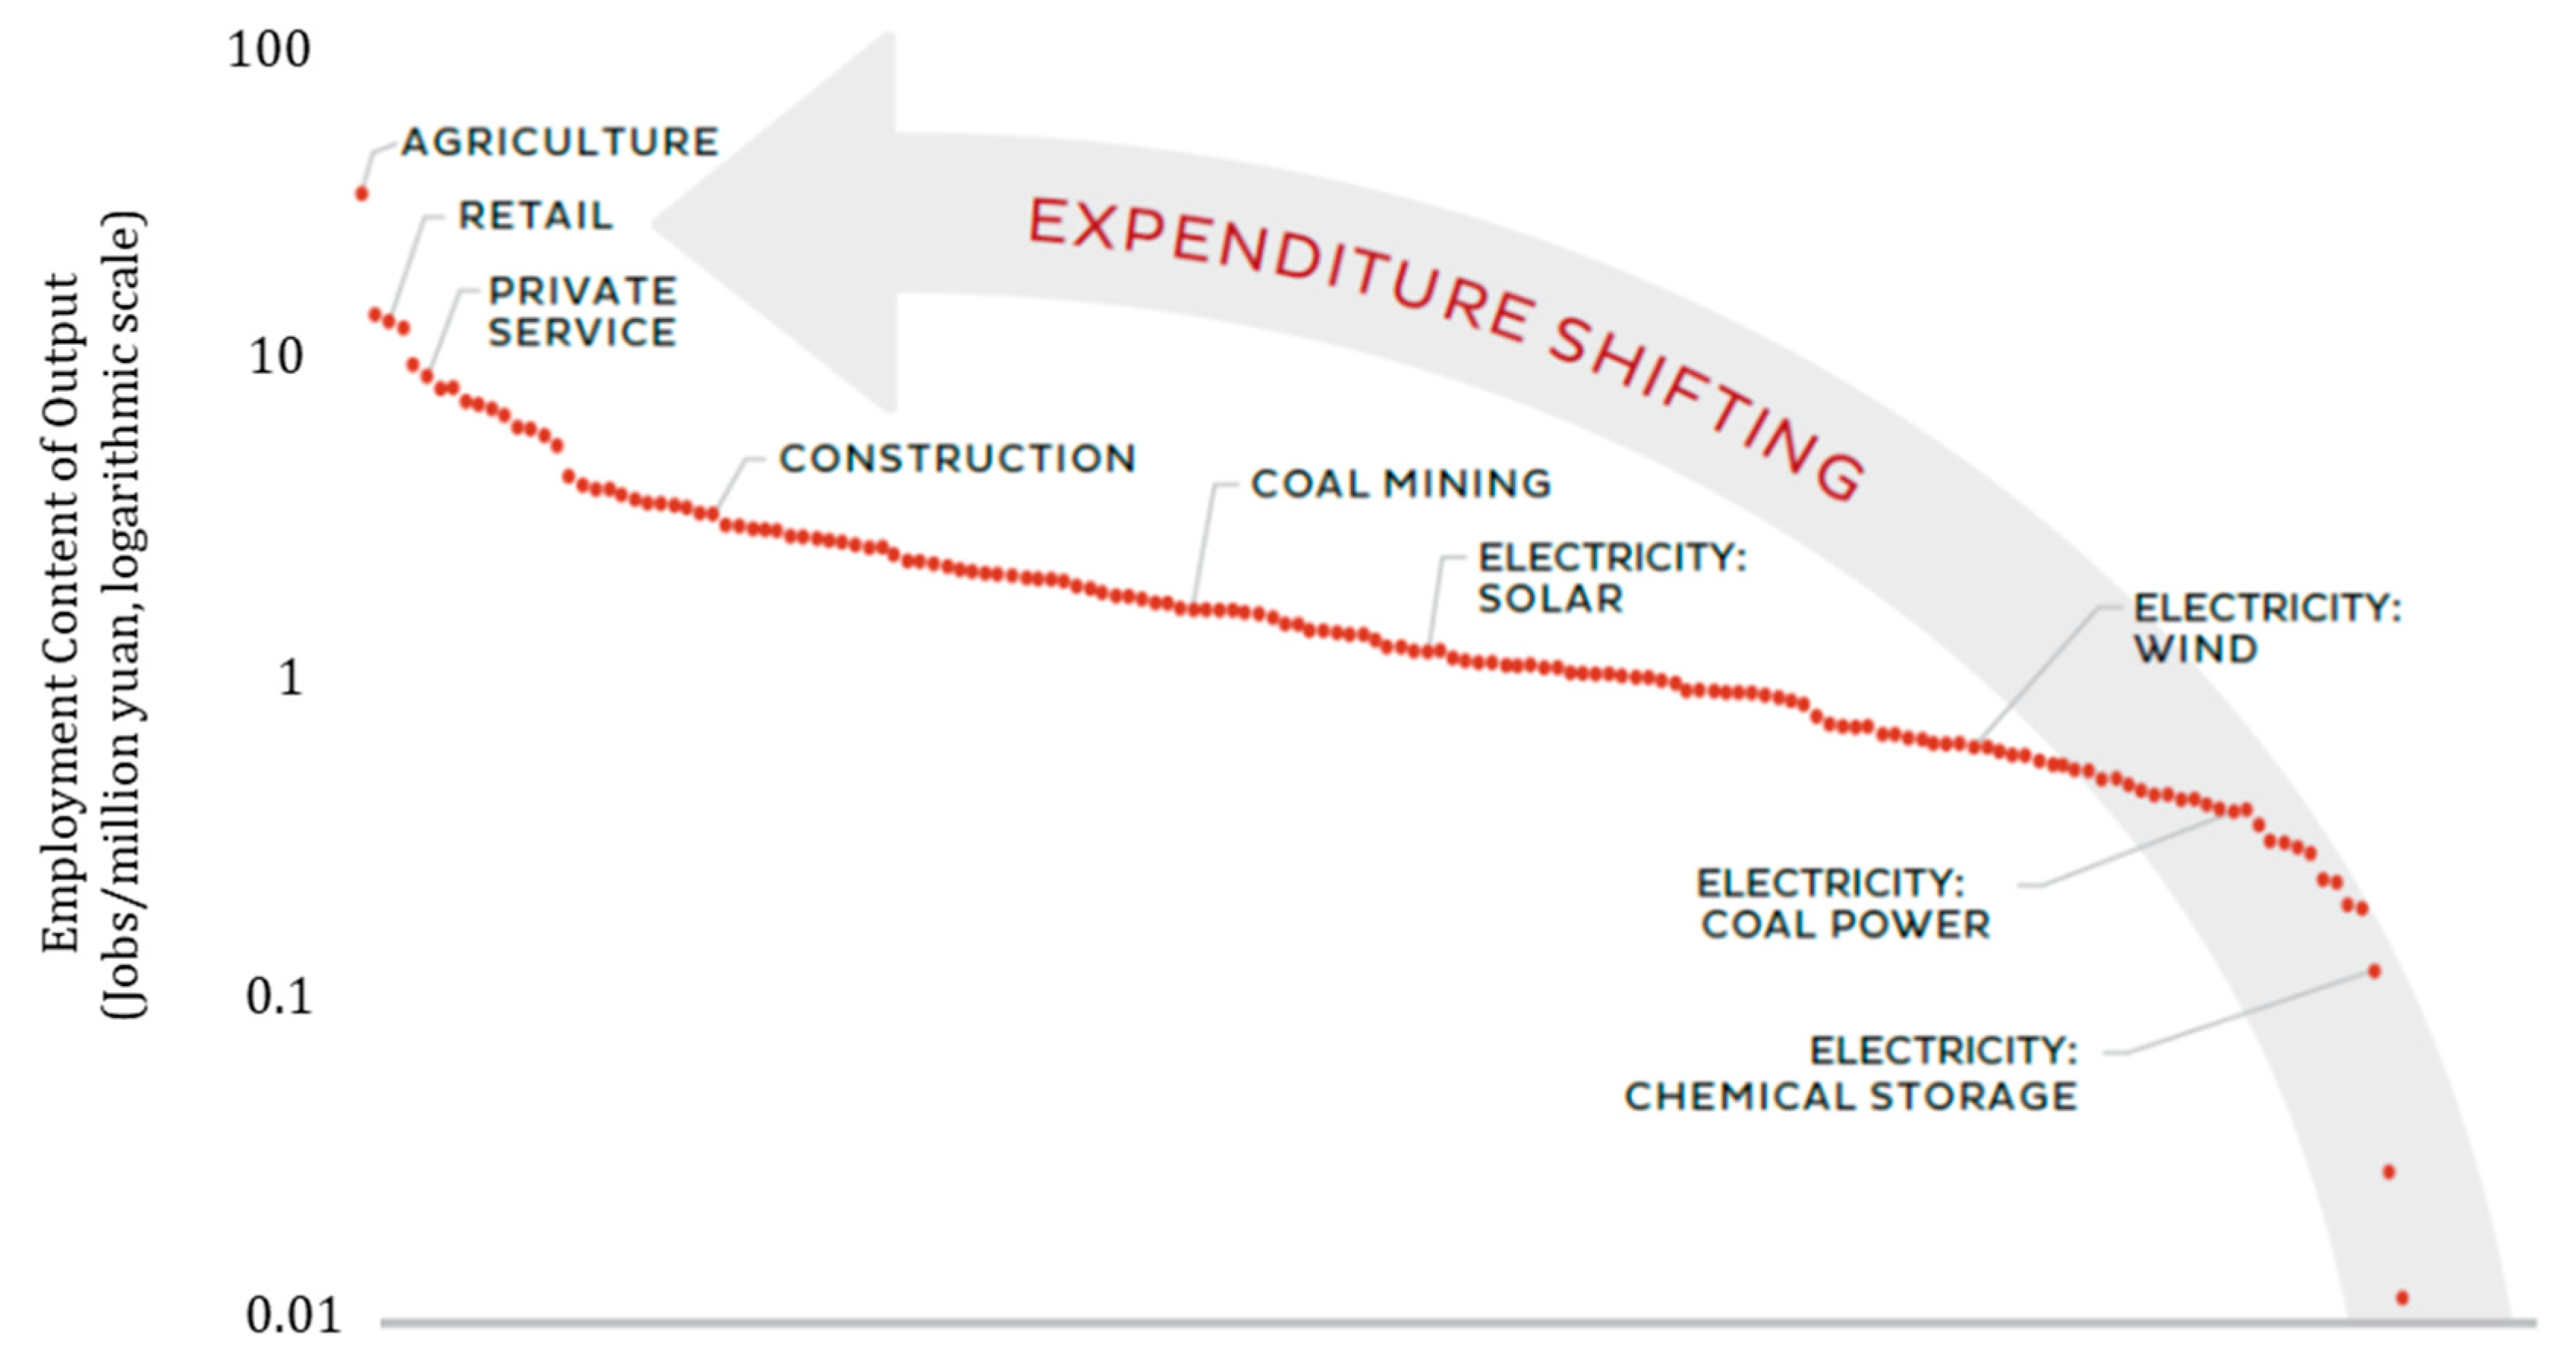
The shifting consumption patterns in the Keynes scenario begin with lower cost electricity, saving money for households and enterprises. These savings are diverted toward other expenditures, mostly domestic services that employ workers from all skill levels and demographics and that are non-tradable, meaning these new jobs cannot be outsourced. Because more than half of China’s aggregate domestic demand is from household consumption, and 70% of this goes to services, about half of energy cost savings diverted to other expenditures can be expected to go to this employment category—the most labor intensive and skill diverse in the economy. In contrast, the carbon fuel supply chain is among the least employment intensive; for example, the carbon fuel supply chain produces only 1–10% as many jobs per unit of revenue, compared with the service sector, differences far too large to be offset by wage inequality (Figure 2). Simply put, about two thirds of the money saved on cheaper electricity is spent on services, stimulating much stronger and more diverse domestic job growth.
The EMP scenario builds on the Keynes scenario to examine the role of labor supply in economic adjustment. Based on China’s dynamism over most of the last two decades, the BAU, R, C50, and Keynes scenarios assume relatively “full employment”, with labor supply elasticity as 0.125, which would limit the economy’s supply response to positive or negative stimulus. China’s reform period has seen dramatic economic growth and large-scale labor mobilization, but over the last decade, growth and rates of job creation have moderated (particularly in the post-COVID economy). While the nation’s vast reserve of rural migrants has been less responsive to urban wages than in the past, a combination of cyclical forces and investment reallocation to the interior continues to increase formal sector and urban employment. To reflect this, the EMP scenario assumes a low, but non-zero, elasticity of aggregate labor supply (0.25), describing a more accommodating labor market. Both the baseline and EMP scenario assumptions for this parameter are conservative, meaning our results understate the potential of this incremental growth stimulus. For reference, authoritative surveys of the large body of econometric research on this topic find that, at the macro level, short-term aggregate labor supply elasticities are in the range of 0.50–1.0 and long-term elasticities are in the range of 1–2 [47]. These studies are dominated by OECD economies with relatively high reservation wages and lower Gini coefficients, it is reasonable to expect that labor supply in emerging economies such as China is even more responsive [48].
Finally, the PROD scenario builds on the EMP scenario to exemplify renewable energy productivity spillovers (see the Literature Review section), assuming that accelerated renewable deployment confers an average of 0.1% higher TFP growth on the economy. This value is not a forecast; it merely illustrates the growth potential of induced innovation.
4. Results
4.1. Generation Mix
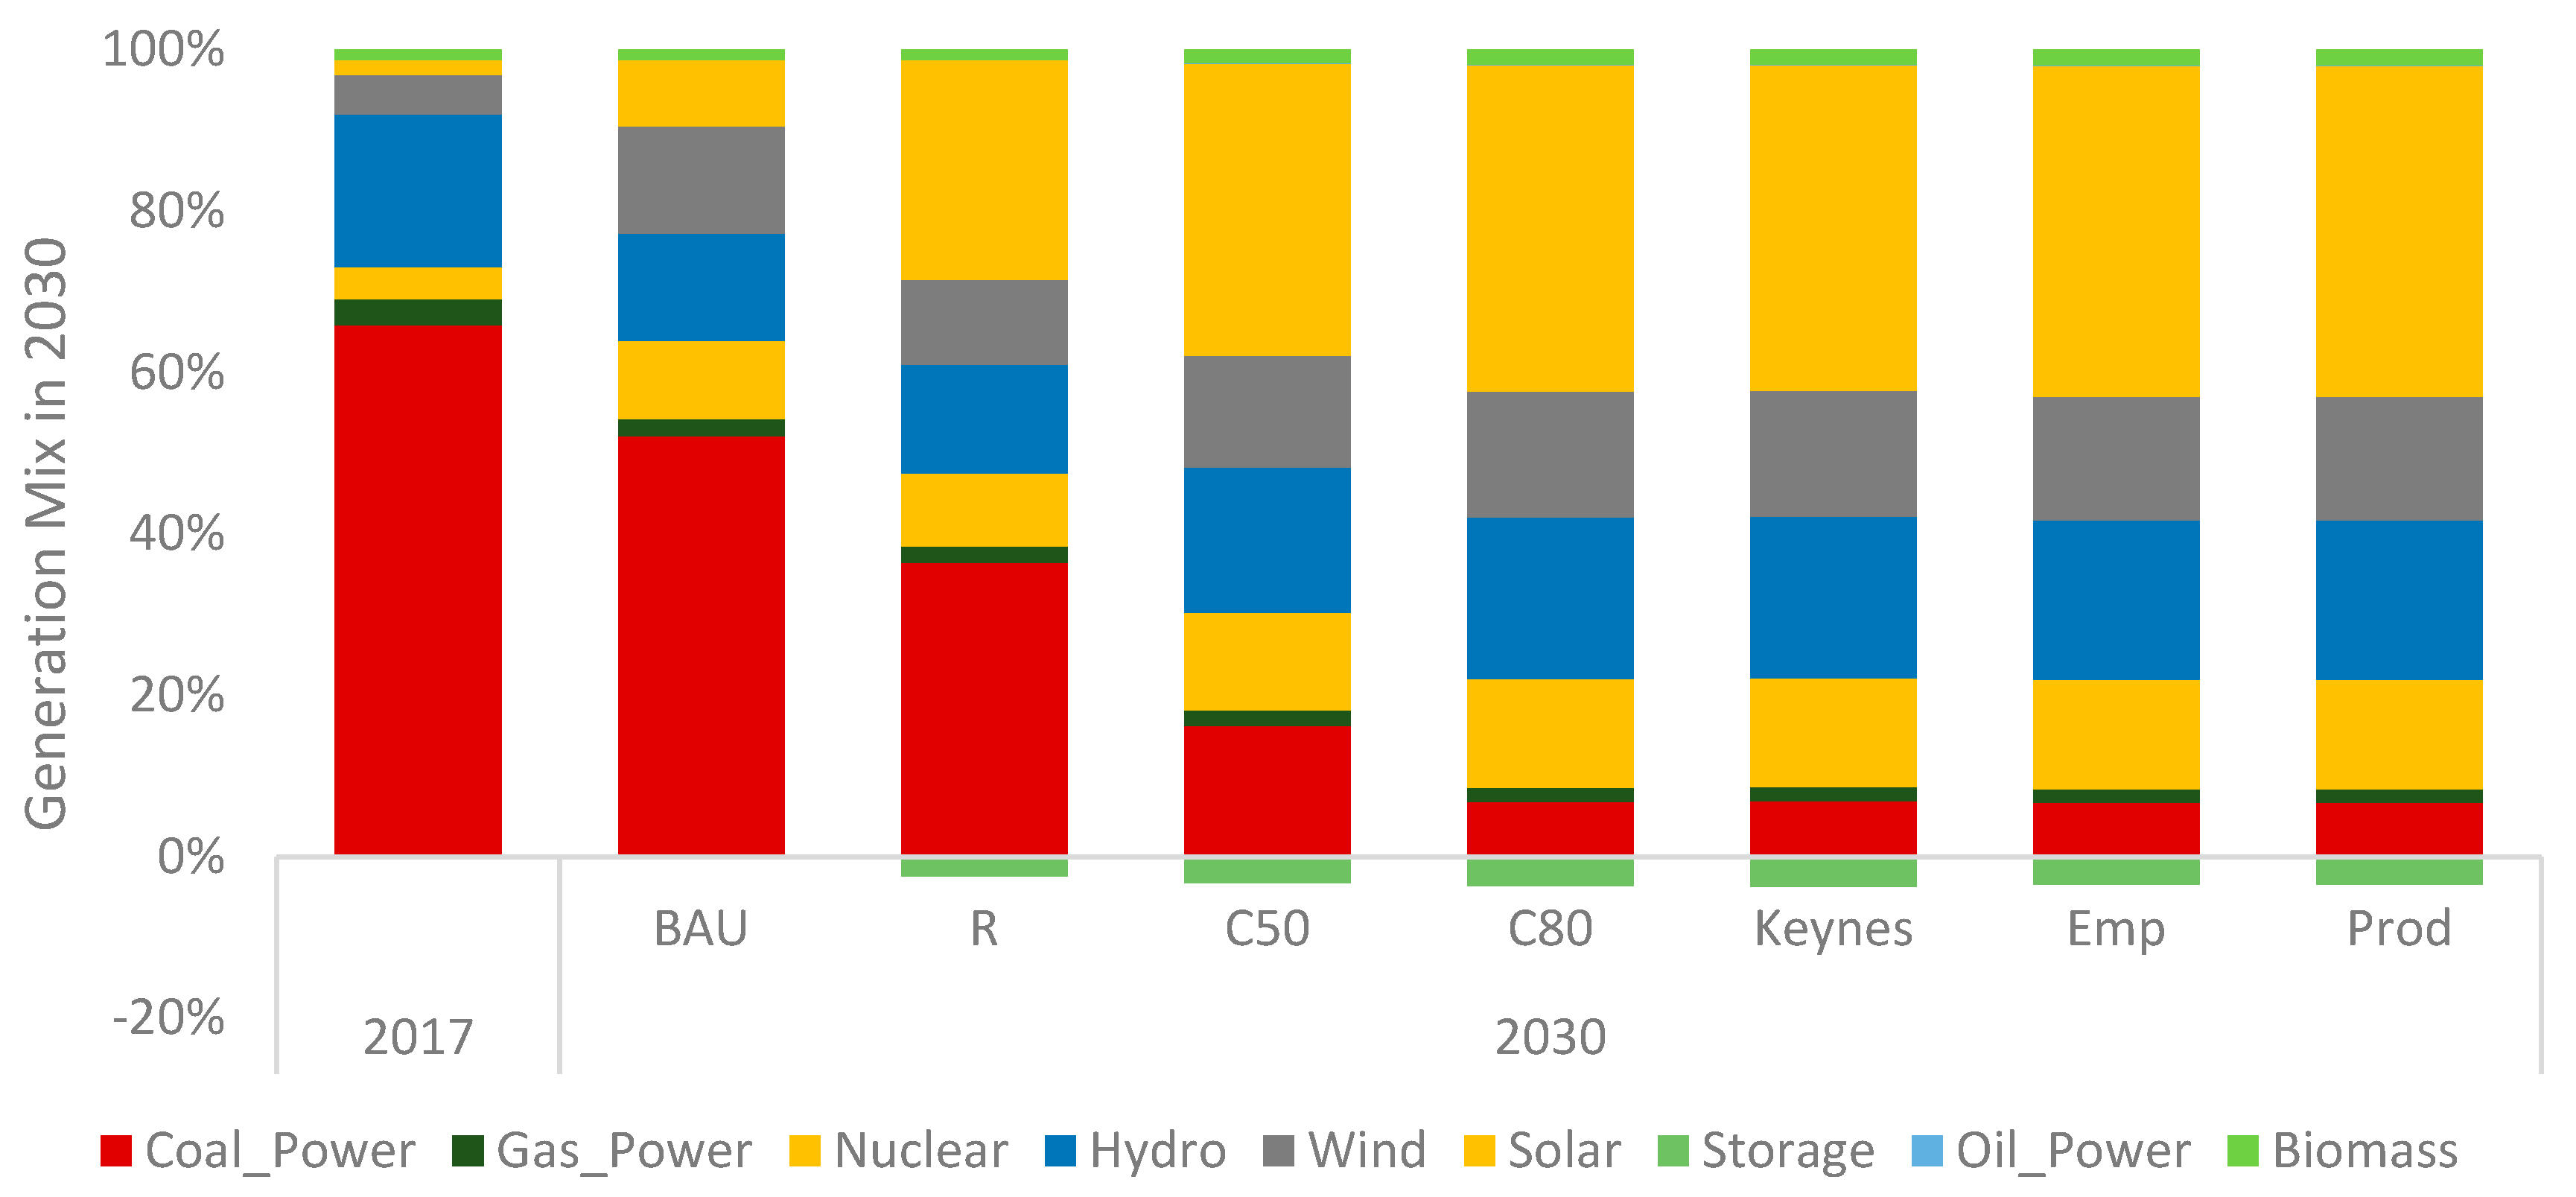
As expected, fossil fuel generation becomes increasingly small, and renewable generation increasingly large, as the renewable-promoting assumptions in our scenarios become increasingly aggressive (Figure 3). In the BAU scenario (moderate productivity improvement in renewables), coal’s share of generation declines from 65.9% in 2017 to 52.1% in 2030, while solar’s share increases by 6.4 percentage points, and wind’s share increases by 8.5 percentage points. In the R scenario (more rapid productivity growth and larger renewable cost reductions), solar’s share rises by 25.3 percentage points, compared with the BAU scenario in 2030, and wind’s share rises by 5.7 percentage points, with coal’s share dropping below half. The fast reduction of technology costs, especially the costs of solar, will directly drive the transformation of the power section from fossil-based energy to renewable-based energy.
In the C50 scenario (R scenario + ETS limiting power-sector CO2 emissions to 50% of 2015 levels), the substitution from fossil fuel to renewables in the power sector is further accelerated by the ETS policy. Solar and wind account for 50.1% of generation in 2030, and coal falls to only 16.2%. In the C80 scenario (R scenario + ETS limiting power-sector CO2 emissions to 80% of 2015 levels), the share of renewables continues increase, with solar and wind accounting for 56.0% and coal dropping to 6.8% in 2030. In the Keynes, EMP, and PROD scenarios, changes in consumption patterns, labor supply, and productivity spillovers have relatively smaller impacts on the generation mix than the rapid renewable cost reductions and implementation of ETS, with similar proportion of electricity generation technologies in the C80 scenarios.
4.2. CO2 Emissions
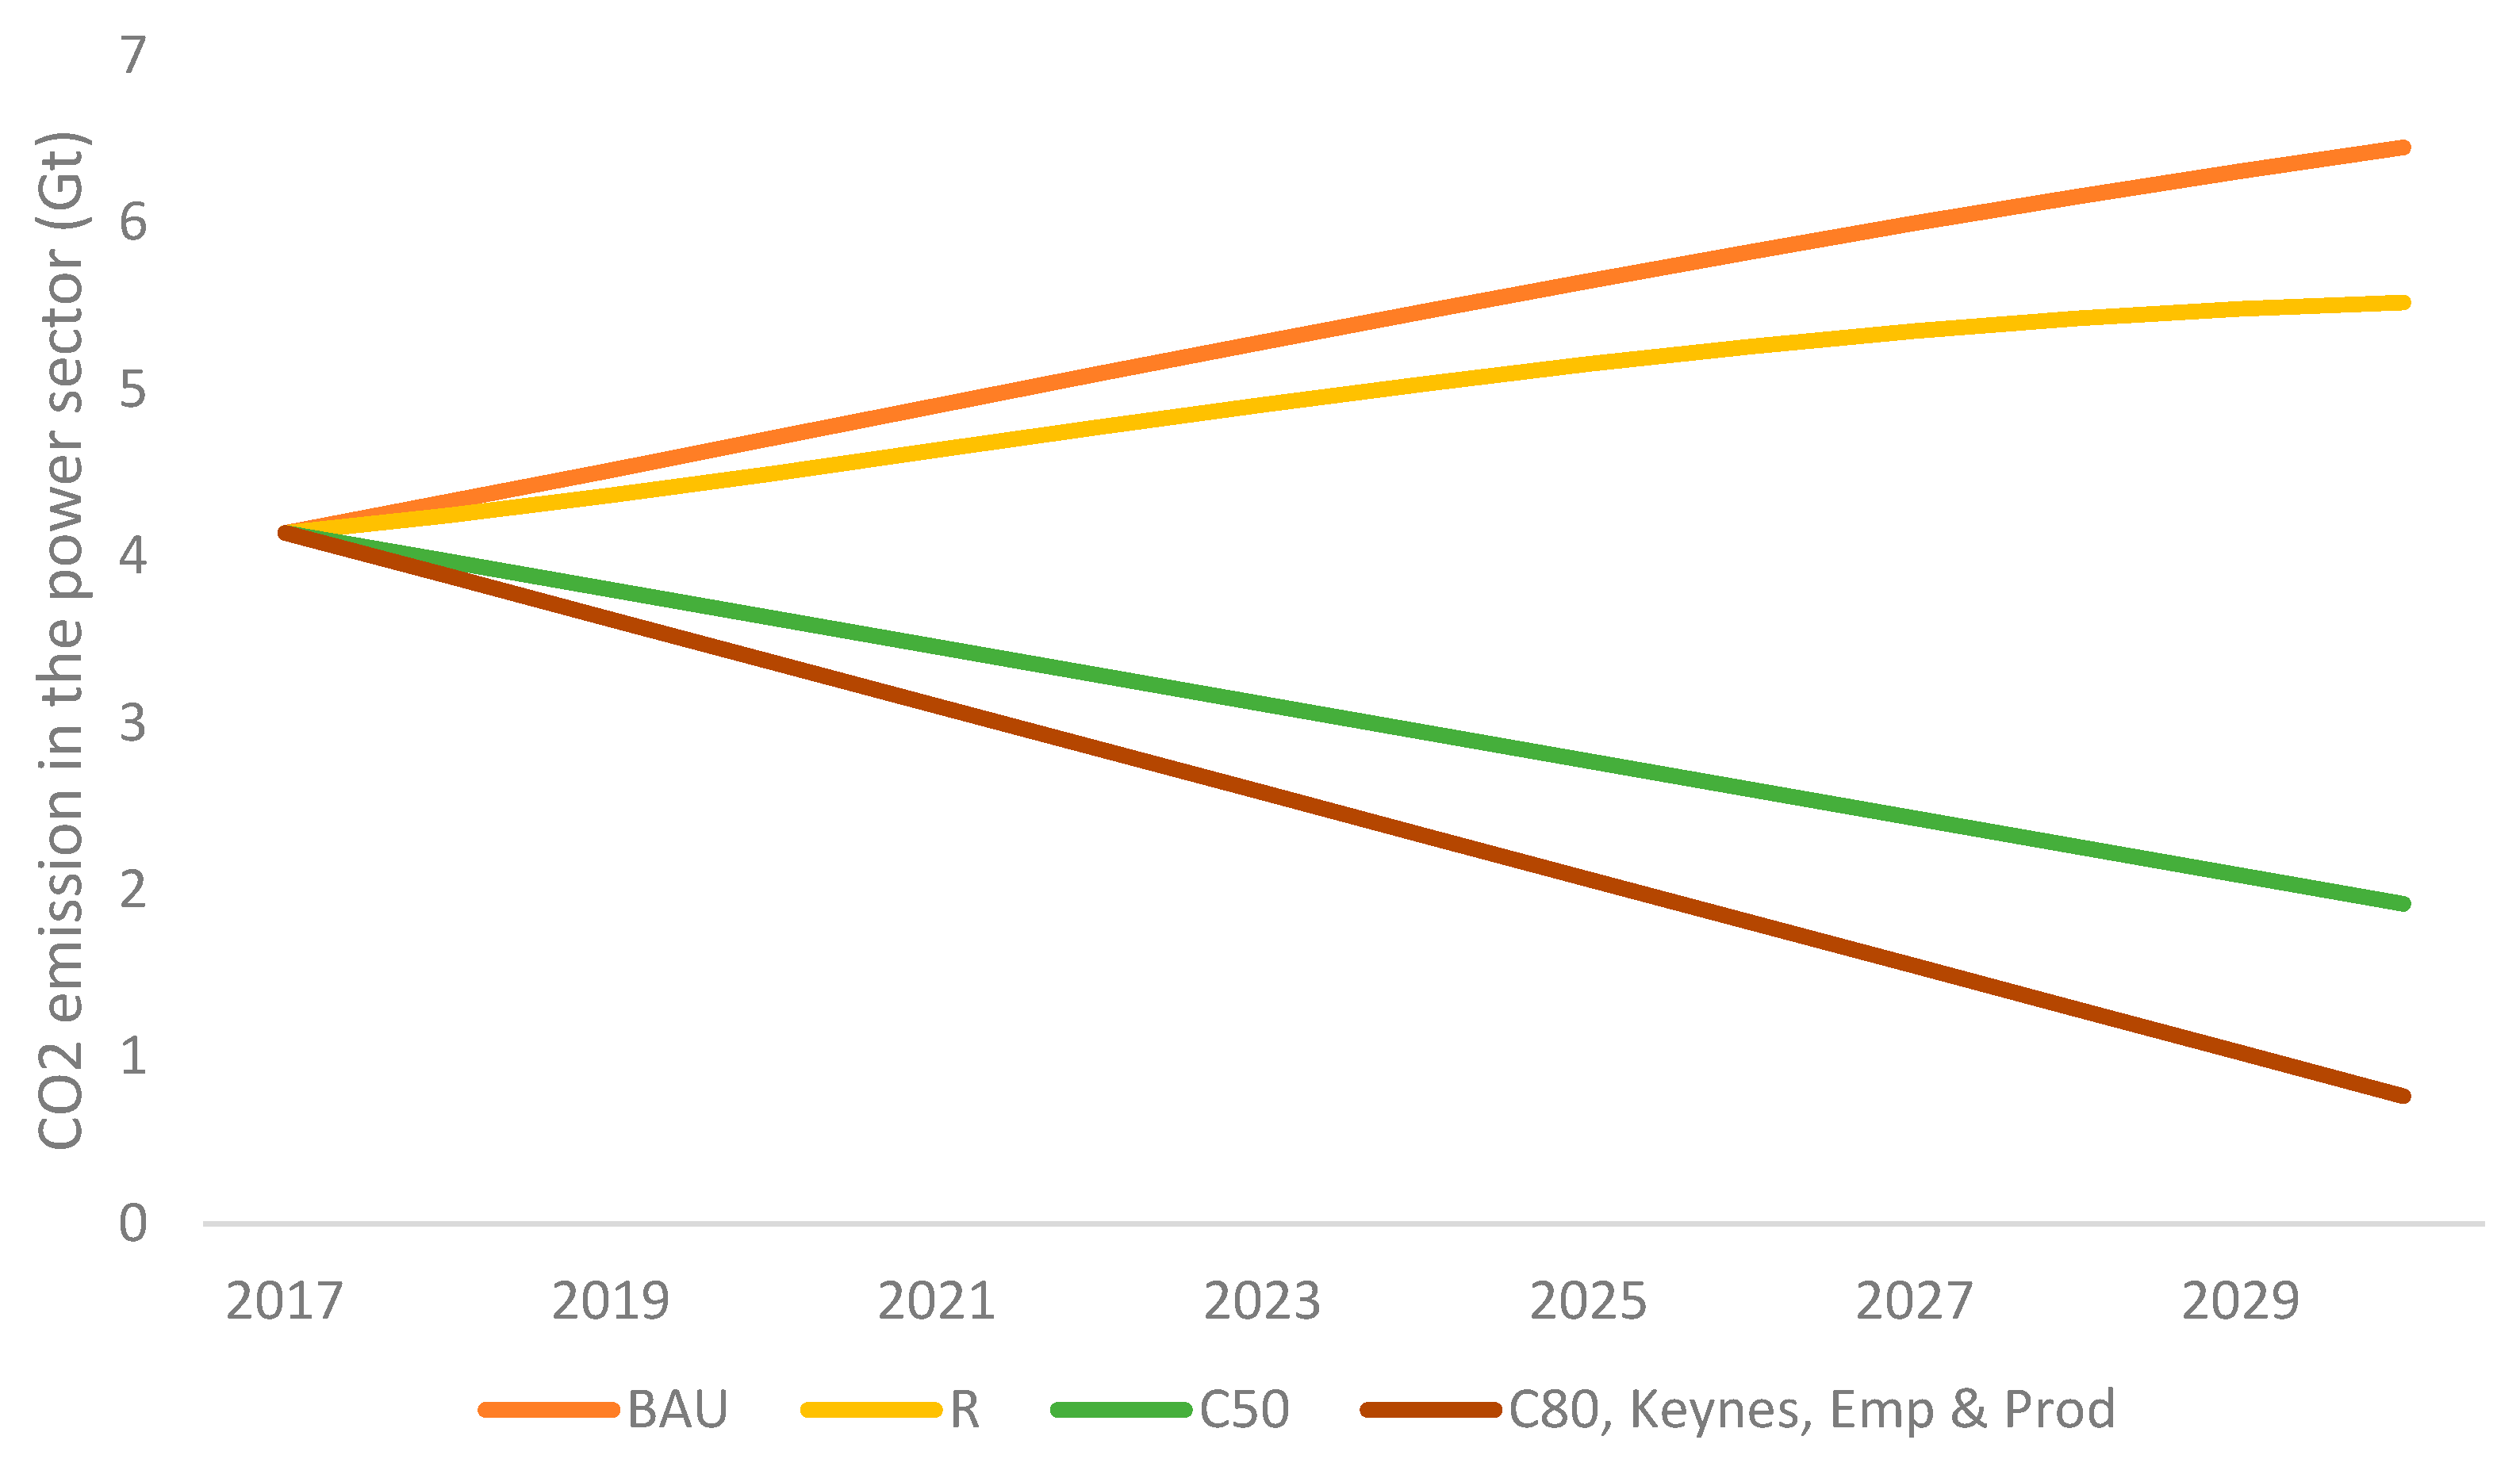
The power-sector CO2 emissions trends in each scenario correspond with the generation trends (Figure 4). In the BAU scenario, the moderate renewable productivity improvement decreases electricity prices, which increases electricity demand. Because coal generation remains the largest component, this rebound effect results in higher emissions. In the R scenario, higher renewable penetration offsets the higher electricity demand, owing to lower electricity prices, and total carbon emission in the power sector are 5.52 Gton CO2e in 2030, 14% lower than in the BAU scenario. Consistent with the recognition, the transformation in power sector brings about by the technology improvement in renewables can reduce CO2 emissions, while meeting the growth of the electricity demand. In the two mitigation scenarios, power-sector CO2 emissions are reduced by the cap of 50% below 2015 levels at 1.92 Gton CO2e in 2030 for C50 scenario, and 80% below at 0.77 Gt in 2030 for C80 scenario. The Keynes, Emp, and Prod scenarios are built on the C80 scenario, so they follow the same emission constraint in the power sector.
4.3. Economic Impacts
Compared with our BAU scenarios, all of our other scenarios grow China’s economy (Table 3). In the R scenario, sustained renewable cost improvements alone more than compensate for the cost of a significant renewable buildout, adding over 1358 billion RMB or 0.77% to China’s real GDP by 2030. Even the C50 and C80 scenario, with its aggressive CO2 mitigation strategies, results in positive growth, owing to low-cost renewables. In both these scenarios, aggregate investment grows more slowly than in the BAU scenario, but overall economic growth and real consumption are higher. Lower electricity costs also translate into greater Chinese competitiveness, with beneficial impacts on exports and (to a lesser extent) imports.
In economics, general equilibrium, indirect, and induced effects often outweigh the direct effects. This is apparent in the Keynes scenario, which accounts explicitly for expenditure diversion from electric power to other goods and services. This “multiplier” effect increases real GDP significantly. Compared with the C80 scenario on which it is based, the Keynes scenario adds 930.9 billion RMB to GDP in 2030. The Keynes scenario increases GDP by 0.62% over the BAU scenario, compared with the C80 scenario’s 0.09% increase over the BAU scenario.
Although the economic stimulus in the R, C50, C80, and Keynes scenarios is positive, the growth dividend from lower-cost energy will be less than 0.77% in 2030. To a significant extent, this is due to assumed resource constraints, particularly in labor markets. China can import natural resources without difficulty (but possibly with terms of trade effects), but we assume a very inelastic (0.125) aggregate labor supply in the R, C50, C80, and Keynes scenarios. When we relax this constraint modestly (to 0.25) in the EMP scenario, the benefits of renewable energy stimulus increase dramatically. Incremental GDP in 2030 rises from 0.62% in the Keynes scenario to 5.92% in the EMP scenario, adding 9.3 trillion RMB and 63.9 million full-time equivalent (FTE) jobs to the overall economy. In other words, renewable electricity can be growth positive, but also strongly counter-cyclical, contributing even more to growth in adverse labor markets, such as during the pandemic-induced economic downturn.
Finally, the PROD scenario demonstrates the substantial growth potential of productivity spillovers from an economy-wide renewable energy transition—for illustrative purposes only because evidence is insufficient to estimate such induced productivity effects econometrically for China. The 0.1% annual TFP increase in the PROD scenario adds 7.5% to real GDP in just over a decade, compared with the BAU scenario. This scenario is a reminder that China’s most dynamic growth experiences—extending from the 1990s to 2005—depended not only on massive infrastructure investments, but also on significant technological progress. In the case of electric power, infrastructure also grew very rapidly, but technological progress has still been limited. New, clean energy technology can be instrumental in helping the economy achieve its full potential, improving material living standards and quality of life across China.
5. Discussion and Conclusions
In the wake of two decades of renewable energy innovations, it has become increasingly clear that the perceived tradeoff between economic growth and climate risk reduction is based on a fallacy. Low- and zero-emission electricity generation costs are falling below costs of carbon-fueled generation, and renewable energy co-benefits, such as air-quality improvements, are becoming ever more apparent. Nowhere is the issue more compelling than in China, which, for several decades, has developed electric capacity faster than any other country and now has the world’s largest renewable energy sector. Recognizing the need for a low-carbon transition toward its goal of carbon neutrality by 2060, China is experimenting with a wide variety of mitigation policies, including technology standards, ETS, and carbon taxation.
Using a detailed forecasting model for China’s economy, we show how falling renewable energy technology costs can interact with market-based ETS mitigation schemes to deliver dramatic GHG reductions with net positive aggregate economic growth. This finding supports existing evidence. Sustained renewable cost improvements alone more than compensate for the cost of a significant renewable buildout. Lower electricity costs also translate into greater Chinese competitiveness, stimulating exports and (to a lesser extent) imports. In addition, we extend the economic analysis to identify other growth drivers. These include the as-yet unrecognized multiplier and productivity spillovers. First, energy cost savings for households and enterprises permit expenditure shifting toward more diverse, labor-intensive goods and services, compared with the carbon fuel supply chain. Because the new expenditure focuses on services, this process stimulates new broad-based domestic incomes and job creation. Second, economic benefits brought about by technological progress have been neglected or underestimated in previous studies, yet the modernization of the energy system can be expected to yield productivity benefits via technology spillovers. Although the exact magnitude of such impacts is an empirical question, the pervasiveness of energy services suggests it will be substantial.
These results have two important implications. First, the economic benefits of renewable energy now substantially exceed their direct costs, and the adoption of renewable technologies can proceed without the still-controversial interventions needed to recognize the social cost of carbon. Second, modernizing the electric power system can support a new generation of more diverse domestic job creation, facilitating an essential transition for millions of workers in the carbon fuel supply chain, one of the last great artifacts of the Industrial Age.
Overall, our results strongly support China’s new commitment to an accelerated transition to carbon neutrality, not only for the air-quality and climate benefits, but also for the broad and positive impact on innovation, employment, and economic growth. As China considers its post-COVID recovery measures, building green energy infrastructure offers a double dividend—supporting sustained economic growth and accelerated climate mitigation—which is consistent with its long-term target of carbon neutrality by 2060.
Author Contributions
Conceptualization, J.L., D.R.-H. and C.W.; Methodology, Y.C., J.L. and D.R.-H.; Formal analysis, Y.C.; Data curation, Y.C. and X.L.; Writing–original draft, Y.C., J.L. and D.R.-H.; Writing–review & editing, J.L., X.L. and C.W.; Project administration, X.L. All authors have read and agreed to the published version of the manuscript.
Funding
This research was funded by MJS and Hewlett Foundations.
Data Availability Statement
Data of this study are available from the corresponding author upon request.
Acknowledgments
Funders include MJS and Hewlett Foundations.
Conflicts of Interest
The authors declare no conflict of interest.
References
- Shan, Y.; Huang, Q.; Guan, D.; Hubacek, K. China CO2 emission accounts 2016–2017. Sci. Data 2020, 7, 54. [Google Scholar] [CrossRef] [Green Version]
- China Electricity Council. China Electricity Statistical Database. Available online: https://cec.org.cn/menu/index.html?715 (accessed on 1 December 2020).
- IRENA. Renewable Power Generation Costs in 2019; IRENA: Abu Dhabi, United Arab Emirates, 2020. [Google Scholar]
- LAZARD. LAZARD’s Levelized Cost of Storage Analysis—Version 5.0; LAZARD: Hamilton, UK, 2019. [Google Scholar]
- LAZARD. LAZARD’s Levelized Cost of Energy Analysis—Version 13.0; LAZARD: Hamilton, UK, 2019. [Google Scholar]
- U.S. Energy Information Administration. Effects of Renewable Technology Capital Costs on Electricity Capacity and Generation in Two Illustrative Regions; U.S. Energy Information Administration: Washington, DC, USA, 2020.
- He, G.; Lin, J.; Sifuentes, F.; Liu, X.; Abhyankar, N.; Phadke, A. Rapid cost decrease of renewables and storage accelerates the decarbonization of China’s power system. Nat. Commun. 2020, 11, 2486. [Google Scholar] [CrossRef] [PubMed]
- Dechezleprêtre, A.; Sato, M. The impacts of environmental regulations on compretitiveness. Rev. Environ. Econ. Policy 2017, 2, 183–206. [Google Scholar] [CrossRef] [Green Version]
- Ministry of Ecology and Environment of P.R. China (MEE). China’s Policies and Actions in Response to Climate Change: 2019 Annual Report; Ministry of Ecology and Environment of P.R. China (MEE): Beijing, China, 2019. (In Chinese)
- NDRC. National Carbon Emissions Trading Scheme Construction Program (Power Generation Industry); NDRC: Beijing, China, 2017.
- IEA. Net Zero by 2050 A Roadmap for the Global Energy Sector; IEA: Paris, France, 2021. [Google Scholar]
- Gielen, D.; Boshell, F.; Saygin, D.; Bazilian, M.D.; Wagner, N.; Gorini, R. The role of renewable energy in the global energy transformation. Energy Strategy Rev. 2019, 24, 38–50. [Google Scholar] [CrossRef]
- Bulavskaya, T.; Reynès, F. Job creation and economic impact of renewable energy in the Netherlands. Renew. Energy 2018, 119, 528–538. [Google Scholar] [CrossRef] [Green Version]
- Dai, H.; Xie, X.; Xie, Y.; Liu, J.; Masui, T. Green growth: The economic impacts of large-scale renewable energy development in China. Appl. Energy 2016, 162, 435–449. [Google Scholar] [CrossRef]
- Yeo, Y.; Lee, J.-D. Revitalizing the race between technology and education: Investigating the growth strategy for the knowledge-based economy based on a CGE analysis. Technol. Soc. 2020, 62, 101295. [Google Scholar] [CrossRef]
- Mu, Y.; Evans, S.; Wang, C.; Cai, W. How will sectoral coverage affect the efficiency of an emissions trading system? A CGE-based case study of China. Appl. Energy 2018, 227, 403–414. [Google Scholar] [CrossRef]
- Zhang, L.; Li, Y.; Jia, Z. Impact of carbon allowance allocation on power industry in China’s carbon trading market: Computable general equilibrium based analysis. Appl. Energy 2018, 229, 814–827. [Google Scholar] [CrossRef]
- Huang, H.; Roland-Holst, D.; Springer, C.; Lin, J.; Cai, W.; Wang, C. Emissions trading systems and social equity: A CGE assessment for China. Appl. Energy 2019, 235, 1254–1265. [Google Scholar] [CrossRef]
- Li, W.; Lu, C.; Zhang, Y.-W. Prospective exploration of future renewable portfolio standard schemes in China via a multi-sector CGE model. Energy Policy 2019, 128, 45–56. [Google Scholar] [CrossRef]
- Liu, Y.; Tan, X.-J.; Yu, Y.; Qi, S.-Z. Assessment of impacts of Hubei Pilot emission trading schemes in China—A CGE-analysis using TermCO2 model. Appl. Energy 2017, 189, 762–769. [Google Scholar] [CrossRef]
- Li, W.; Zhang, Y.-W.; Lu, C. The impact on electric power industry under the implementation of national carbon trading market in China: A dynamic CGE analysis. J. Clean. Prod. 2018, 200, 511–523. [Google Scholar] [CrossRef]
- Wu, R.; Dai, H.; Geng, Y.; Xie, Y.; Masui, T.; Tian, X. Achieving China’s INDC through carbon cap-and-trade: Insights from Shanghai. Appl. Energy 2016, 184, 1114–1122. [Google Scholar] [CrossRef]
- Li, W.; Jia, Z. The impact of emission trading scheme and the ratio of free quota: A dynamic recursive CGE model in China. Appl. Energy 2016, 174, 1–14. [Google Scholar] [CrossRef]
- Lin, B.; Jia, Z. The impact of Emission Trading Scheme (ETS) and the choice of coverage industry in ETS: A case study in China. Appl. Energy 2017, 205, 1512–1527. [Google Scholar] [CrossRef]
- Lin, B.; Jia, Z. Why do we suggest small sectoral coverage in China’s carbon trading market? J. Clean Prod. 2020, 257, 120557. [Google Scholar] [CrossRef]
- Lin, B.; Jia, Z. Is emission trading scheme an opportunity for renewable energy in China? A perspective of ETS revenue redistributions. Appl. Energy 2020, 263, 978–986. [Google Scholar] [CrossRef]
- Zhang, Y.-J.; Liang, T.; Jin, Y.-L.; Shen, B. The impact of carbon trading on economic output and carbon emissions reduction in China’s industrial sectors. Appl. Energy 2020, 260, 114290. [Google Scholar] [CrossRef]
- Zhang, C.; Wang, Q.; Shi, D.; Li, P.; Cai, W. Scenario-based potential effects of carbon trading in China: An integrated approach. Appl. Energy 2016, 182, 177–190. [Google Scholar] [CrossRef]
- Chen, Z.; Yuan, X.-C.; Zhang, X.; Cao, Y. How will the Chinese national carbon emissions trading scheme work? The assessment of regional potential gains. Energy Policy 2020, 137, 111095. [Google Scholar] [CrossRef]
- Liu, Z.; Geng, Y.; Dai, H.; Wilson, J.; Xie, Y.; Wu, R.; You, W.; Yu, Z. Regional impacts of launching national carbon emissions trading market: A case study of Shanghai. Appl. Energy 2018, 230, 232–240. [Google Scholar] [CrossRef]
- Wang, P.; Dai, H.-C.; Ren, S.-Y.; Zhao, D.-Q.; Masui, T. Achieving Copenhagen target through carbon emission trading: Economic impacts assessment in Guangdong Province of China. Energy 2015, 79, 212–227. [Google Scholar] [CrossRef]
- Li, G.; Yang, J.; Chen, D.; Hu, S. Impacts of the coming emission trading scheme on China’s coal-to-materials industry in 2020. Appl. Energy 2017, 195, 837–849. [Google Scholar] [CrossRef]
- Li, W.; Lu, C.; Ding, Y.; Zhang, Y.-W. The impacts of policy mix for resolving overcapacity in heavy chemical industry and operating national carbon emission trading market in China. Appl. Energy 2017, 204, 509–524. [Google Scholar] [CrossRef]
- Tang, L.; Wu, J.; Yu, L.; Bao, Q. Carbon allowance auction design of China’s emissions trading scheme: A multi-agent-based approach. Energy Policy 2017, 102, 30–40. [Google Scholar] [CrossRef]
- Lin, B.; Jia, Z. Impacts of carbon price level in carbon emission trading market. Appl. Energy 2019, 239, 157–170. [Google Scholar] [CrossRef]
- Lin, B.; Jia, Z. Energy, economic and environmental impact of government fines in China’s carbon trading scheme. Sci. Total Environ. 2019, 667, 658–670. [Google Scholar] [CrossRef]
- Chang, S.; Yang, X.; Zheng, H.; Wang, S.; Zhang, X. Air quality and health co-benefits of China’s national emission trading system. Appl Energ 2020, 261, 114226. [Google Scholar] [CrossRef]
- Ladu, M.G.; Meleddu, M. Is there any relationship between energy and TFP (total factor productivity)? A panel cointegration approach for Italian regions. Energy 2014, 75, 560–567. [Google Scholar] [CrossRef]
- Tugcu, C.T. Disaggregate Energy Consumption and Total Factor Productivity: A Cointegration and Causality Analysis for the Turkish Economy. Int. J. Energy Econ. Policy 2013, 3, 307–314. [Google Scholar]
- Tugcu, C.T.; Tiwari, A.K. Does renewable and/or non-renewable energy consumption matter for total factor productivity (TFP) growth? Evidence from the BRICS. Renew. Sustain. Energy Rev. 2016, 65, 610–616. [Google Scholar] [CrossRef]
- Rath, B.N.; Akram, V.; Bal, D.P.; Mahalik, M.K. Do fossil fuel and renewable energy consumption affect total factor productivity growth? Evidence from cross-country data with policy insights. Energy Policy 2019, 127, 186–199. [Google Scholar] [CrossRef]
- Yan, Z.; Zou, B.; Du, K.; Li, K. Do renewable energy technology innovations promote China’s green productivity growth? Fresh evidence from partially linear functional-coefficient models. Energy Econ. 2020, 90, 104842. [Google Scholar] [CrossRef]
- Springer, C.; Evans, S.; Lin, J.; Roland-Holst, D. Low carbon growth in China: The role of emissions trading in a transitioning economy. Appl. Energy 2019, 235, 1118–1125. [Google Scholar] [CrossRef]
- National Bureau of Statistics (NBS). China Input-Output Tables 2017; National Bureau of Statistics (NBS): Beijing, China, 2020.
- Wing, I.S. The synthesis of bottom-up and top-down approaches to climate policy modeling: Electric power technology detail in a social accounting framework. Energy Econ. 2008, 30, 547–573. [Google Scholar] [CrossRef]
- National Bureau of Statistics (NBS). China Labor Statistical Yearbook; National Bureau of Statistics (NBS): Beijing, China, 2018.
- Keane, M.; Rogerson, R. Reconciling Micro and Macro Labor Supply Elasticities: A Structural Perspective. Annu. Rev. Econ. 2015, 7, 89–117. [Google Scholar] [CrossRef] [Green Version]
- Chang, Y.; Kim, S.-B. From individual to aggregate labor supply: A quantitative analysis based on a heterogeneous agent macroeconomy. Int. Econ. Rev. 2006, 47, 1–27. [Google Scholar] [CrossRef]
Figure 1.
PANDA model production block.

Figure 2.
Employment Intensity by Sector, 2017. Source: Authors’ calculation from official data [44,46].

Figure 3.
Generation mix of the power sector in the base year (2017) and in 2030.

Figure 4.
CO2 emissions in the power sector from 2017 to 2030.

Table 2.
Scenarios Evaluated.
| Scenarios | Description |
|---|---|
| BAU | Moderate productivity improvements in renewables |
| R | Rapid productivity improvements in renewables |
| C50 | R + ETS limiting CO2 emissions from the power sector to 50% of 2015 emissions level |
| C80 | R + ETS limiting CO2 emissions from the power sector to 80% of 2015 emissions level |
| Keynes | C80 + shifting expenditure from energy savings |
| EMP | Keynes + more accommodating labor market |
| PROD | EMP + energy productivity spillovers (0.1% TFP growth) |
Table 3.
Macroeconomic Impacts in China (change from 2030 BAU in real billion RMB and percentage).
| R | C50 | C80 | Keynes | EMP | PROD | |
|---|---|---|---|---|---|---|
| GDP | 1358.2 | 683.0 | 154.2 | 1085.1 | 10,401.8 | 13,217.4 |
| 0.77% | 0.39% | 0.09% | 0.62% | 5.91% | 7.50% | |
| Consumption | 636.6 | 359.3 | 206.4 | 534.8 | 3124.3 | 3995.6 |
| 1.02% | 0.58% | 0.33% | 0.86% | 5.01% | 6.41% | |
| Investment | −633.7 | −909.9 | −1210.3 | 456.0 | 5407.1 | 6827.6 |
| −0.92% | −1.33% | −1.76% | 0.67% | 7.89% | 9.96% | |
| Exports | 195.0 | 54.3 | −36.9 | −583.2 | 1265.3 | 1968.0 |
| 0.51% | 0.14% | −0.10% | −1.54% | 3.34% | 5.19% | |
| Imports | −239.9 | −268.5 | −293.2 | 261.2 | 487.1 | 711.1 |
| −1.11% | −1.25% | −1.36% | 1.21% | 2.26% | 3.30% | |
| Employment (million FTE) | 1.9 | 1.1 | 0.4 | 0.9 | 64.8 | 67.2 |
| 0.23% | 0.13% | 0.05% | 0.11% | 7.70% | 7.98% |
Disclaimer/Publisher’s Note: The statements, opinions and data contained in all publications are solely those of the individual author(s) and contributor(s) and not of MDPI and/or the editor(s). MDPI and/or the editor(s) disclaim responsibility for any injury to people or property resulting from any ideas, methods, instructions or products referred to in the content. |
© 2023 by the authors. Licensee MDPI, Basel, Switzerland. This article is an open access article distributed under the terms and conditions of the Creative Commons Attribution (CC BY) license (https://creativecommons.org/licenses/by/4.0/).
Share and Cite
MDPI and ACS Style
Chen, Y.; Lin, J.; Roland-Holst, D.; Liu, X.; Wang, C. Declining Renewable Costs, Emissions Trading, and Economic Growth: China’s Power System at the Crossroads. Energies 2023, 16, 656. https://doi.org/10.3390/en16020656
AMA Style
Chen Y, Lin J, Roland-Holst D, Liu X, Wang C. Declining Renewable Costs, Emissions Trading, and Economic Growth: China’s Power System at the Crossroads. Energies. 2023; 16(2):656. https://doi.org/10.3390/en16020656
Chicago/Turabian StyleChen, Yidan, Jiang Lin, David Roland-Holst, Xu Liu, and Can Wang. 2023. "Declining Renewable Costs, Emissions Trading, and Economic Growth: China’s Power System at the Crossroads" Energies 16, no. 2: 656. https://doi.org/10.3390/en16020656
Note that from the first issue of 2016, this journal uses article numbers instead of page numbers. See further details here.