1. Introduction
Ideal user authentication techniques must be accurate, versatile, computationally quick, and operable in almost real time. While several authentication techniques have been put out, biometrics now seems to be the front-runner for user authentication strategies in the future. Physical and behavioral biometrics are the two categories into which biometric-based authentication is divided [
1]. Physical biometrics uses voice, iris, and fingerprint scanners to rely on the individuality of certain physical characteristics among people for authentication. Similar to fingerprinting, behavioral biometrics works under the premise that human behavior for particular tasks is generally distinct enough to be utilized for user authentication. Examples include touch dynamics, keystroke dynamics, and the subject of this study, mouse dynamics. Comparing behavioral biometrics to physical biometrics for authentication, behavioral biometrics has garnered more attention because of its broader, more widespread applicability, decreased intrusiveness, and lack of external sensors.
Furthermore, mouse dynamics has been demonstrated to be an ongoing, portable, and unobtrusive solution for dynamic user authentication [
2]. Furthermore, Machine Learning (ML) and Deep Learning (DL) techniques can benefit from the vast amounts of data that are available in the domain space of mouse dynamics. When ML and DL techniques are combined, fields with a lot of data have seen amazing outcomes.ML has proven to be strong enough to be applied to a variety of problem areas and utilizes implicit patterns in large amounts of data that are too complex for people to perceive; yet it requires the manual extraction of features from data. Finding the best mix of hyperparameters, extracted features, and data preparation techniques for a particular problem or dataset is so tricky [
3].
AI-assisted authentication can suit a range of objectives when combined with machine learning and deep neural networks [
4]. We look at the current state of AI-assisted authentication. Authentication is a critical tool for ensuring information system security. With time, authentication has steadily integrated a variety of AI technologies to achieve greater diversity and accuracy. Traditional passwords are no longer the only thing AI authentication can help with. Image recognition, such as fingerprint and face recognition, and human behavior, such as keystroke dynamics as well as mouse movement, are used in various authentication methods [
5]. With the popularity of social networks, multimedia material is growing at an unprecedented rate throughout the internet. With this rapid growth, hackers target the internet business with many tactics, including obfuscated harmful URLs, malware distribution, account hijacking, phishing assaults, and impersonation attacks. These assaults take advantage of the widespread use of social networking sites. Security and interoperability are two critical challenges for the research community regarding social media content. The necessity of the hour is to design and develop a scalable and widespread communication paradigm to address these difficulties [
6].
The contributions of this paper are as follows:
To propose a novel method for the secure data transmission and detection of intruders in a biometric authentication system by feature extraction with classification.
To collect a biometric database of the smart building based on the IoT.
To process data features that have been extracted using the kernel-based principal component analysis (KPCA).
To classify the processed features using a convolutional VGG−16 Net architecture.
To secure the network using a deterministic trust transfer protocol (DTTP).
This article is structured as follows: The related works are provided in part 2, the proposed technique is defined in
Section 3, the performance analysis is explained in
Section 4, and the conclusion is provided in
Section 5.
2. Literature Review
A crucial step is deciding which biometrics to combine and how to combine them. Researchers have proposed a large number of multi biometric combinations at this moment. The work in [
7] proposed a multimodal biometrics recognition method that uses two approaches at the feature level: the first is the firefly method, and the second is a combination of fractional theory and the firefly method. The authors used repeated line tracking, FFF, and Multi-Support Vector Machine algorithms to accomplish preprocessing (the SDUMLA-HMT [
8] and PolyU FKP [
9] databases), feature extraction, as well as classification in this study. The authors in [
10] created a multimodal biometric method based on the feature-level integration of FV as well as the dorsal texture of the fingers. The preprocessing was accomplished in this study by employing Gabor filters as well as winner-take-all algorithms. The work in [
11] developed a multimodal biometric system for merging the FV and finger dorsal texture using a score-level fusion approach based on cross-selection binary coding. They utilized the THV-FVFDT2 database in this study.
The obtained findings revealed that the system’s equal error rate (EER) is tolerable. The authors [
12] recommended using biometric identification to access a central health record database with privacy policies. A new Multi-Criteria Decision-Making (MCDM) paradigm was investigated by [
13]. The MCDM approach was utilized to rank each group of elements using an integrated strategy for the order of preference by similarity (TOPSIS) and the analytic hierarchy process (AHP). The essential factors in each group were also identified using K-means clustering. The work in [
14] developed a new hybrid approach that might be used with EMR (Electronic Medical Record) systems. The robustness, security, and integration of EMR systems will all benefit from this strategy.
Deep learning designs, such as recurrent neural networks (RNN), stacked autoencoders, RBM (Restricted Boltzmann Machine), DBN (Deep Belief Network), CNN (Convolutional Neural Network), and others, are commonly employed. For anomalous event identification in films, a three-dimensional CNN was employed to extract spatiotemporal data from the inputs [
15]. Intra-frame classification algorithms and sparse-layered coding for recognizing uncommon occurrences in multimedia such as films were determined by the SVM’s probabilistic outputs. Anomalies can be discovered with a CNN [
16] in crowded activities. Researchers examined the convolutional autoencoder (CAE) performance and the impact of anomaly detection techniques on high-level feature aggregation by analyzing input frames [
17]. The Motion and Appearance DeepNet method proposed a mix of multiple one-class SVM methods with a DNN for anomaly identification in video data. A deep Gaussian mixture method was utilized to examine patterns of video events, and feature learning was accomplished utilizing PCANet for anomalous event identification using DL approaches [
18,
19]. Long Short-Term Memory and CNN methods were combined in a proposed hybrid neural network model to detect aberrant emotions in social media. Pattern recognition applications use these methods more extensively than existing ML algorithms because of their representation learning and end-to-end training [
20]. The vulnerability of IoT systems has been the subject of numerous studies, and the work in [
21] outlined the unresolved issues with IoT devices and offered remedies. The authors in [
22] discussed numerous IoT framework intrusion detection methods. Weber looked into various legal methods for calculating an IoT architecture’s privacy and security requirements [
23]. A ball can be thrown in the virtual world to authenticate users, according to the work in [
24]. They attained a matching accuracy of 92.86 percent in their pilot investigation. Similar to this, the work in [
25] utilized head-movement patterns for VR authentication and attained an accuracy of 92%. Although pure behavioral biometrics may not be practical in a large-scale context, the authors in work [
26] advised using such capability as an additional layer of security in security-sensitive VR applications. This is consistent with research [
27] that shows accuracy declines logarithmically with group size, rendering behavioral biometrics in and of themselves unsuitable for VR authentication. Additionally, traditional approaches still face significant challenges due to high computational costs. However, this approach is parametrically complex because of the challenging Gabor filter setup. Therefore, there is still a need to create a quick, effective feature extraction technique that can improve the performance of the established finger-vein system. Due to its insufficient security, the old password-based authentication mechanism has gradually faded.AI-enriched authentication techniques have been driving the trend in recent years, with AI-assisted authentication methods leading the way in terms of security and compatibility with as numerous realistic circumstances as possible.
3. Proposed Secure Data Transmission and Intruder Detection in Biometric Authentication System
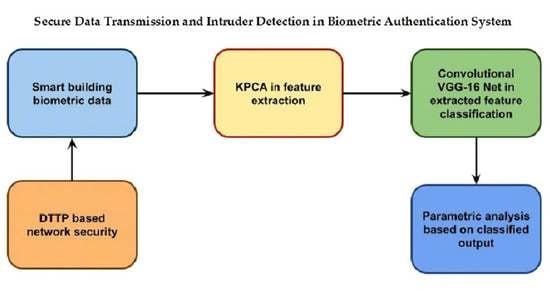
This section discusses a novel technique for secure data transmission and detecting intruders in biometric authentication by feature extraction with classification. Here, intruder is detected by collecting the biometric database of the smart building based on IoT. Processed data features are extracted using kernel-based principal component analysis (KPCA). Then, the processed features are classified using convolutional VGG−16 Net architecture. Then, the entire network is secured using a deterministic trust transfer protocol (DTTP). Overall proposed method is represented in
Figure 1.
To produce finer and better data, preprocessing can be utilized to solve several types of issues in large datasets. The intended data must be compatible with data preprocessing procedures to ensure that all data are preprocessed to be appropriate, usable, and clean. This will boost accuracy. Normalizing data for scaling characteristics to fit between a given maximum and minimum value, typically between one and zero, as illustrated in Equation (1), is one of the preprocessing approaches.
Equation (1) explains the normalization to one-zero. Unlabeled data are subjected to the normalizing parameter vectors as fit, in particular the vector carrying the maximum values x (max) and minimum values x (min). Data that have labels are not normalized.
4. Feature Extraction Based on Kernel-Based Principal Component Analysis (KPCA)
PCA is a frequently utilized method for describing data by extracting a small number of characteristics from input. In contrast to methods like parametric models and wavelet decomposition, where derived characteristics are heavily dependent on a method or wavelet type under consideration, this method is considered a global method. PCA obtains features by diagonalizing the data’s correlation matrix and retaining just the most relevant eigenvectors. Consider zero-mean data, provided column-wise in x1, x2,…, xn ∈ IR d without losing generality. PCA method seeks m features v1, v2,…, vm ∈ IR d, as eigenvectors in Eigen-issue λ v = C v, with correlation matrix. Eigenvalue λ of every eigenvector v, which indicates the amount of data recorded variance, determines its significance. The eigenvectors, which take the form , reside in the data span due to the operations’ linearity property.
Kernel-PCA is a common generalization for discovering nonlinearities, unlike traditional PCA, which is limited to learning only linear structures within data.
Φ: IR d 7→
H, and then evaluate PCA on mapped data,
. In the modified data, eigenvectors are linear. It turns out that using the kernel method can significantly compute such nonlinear PCA for a broad class of nonlinearities without explicitly assessing map. Specified by a kernel function for these proximity measures. On kernel-PCA [
9], this widely held principle is demonstrated.
First, we write the PCA method in terms of inner products in feature space,
The expression is satisfied by each extracted feature
by Equation (2).
all solutions
ϕ, like in the linear case, are contained inside the span of the data’s
Φ images. This means that there exists coefficients α
1, α
2,…, α
n such that by Equation (3)
Substituting
CΦ and expansion (2) into Eigen problem (1), and describing a
n ×
n matrix
K whose (
i,j)-th entry is
hΦ(
xi),
Φ(
xj)
iH, we obtain Eigen-issue in terms of inner product matrix by Equation (4)
where α = [α
1, α
2, …, α
n]
⊤. One performs normalization on resulting solution α, using
kαk 2 = 1/
λ, to obtain normalization as in PCA 1, i.e.,
hϕ,
ϕiH = 1.
Φ(
xj)
iH, corresponding to an implicit mapping. Polynomial kernel
κ(
xi,
xj) = (1 +
hxi,
xji)
p and Gaussian kernel
are examples of admissible kernels. The latter implicitly translates data into an infinite-dimensional space.
We will need to be able to optimize canonical correlation as well, but for now, we will only focus on evaluating canonical correlations in an RKHS. In reality, we have a statistical as well as a computational purpose. While describing F-correlation in terms of a population expectation thus far, we usually only have access to a small sample rather than the entire population. As a result, we will create a “kernelized” version of canonical correlation that combines two aspects: dealing with empirical data and working in a feature space. We begin with a rudimentary “kernelization” of the population F-correlation. This naive kernelization does not produce a generally usable estimator for reasons that we will describe, but it does serve as a roadmap for building a regularized kernelization that does.
5. Convolutional VGG-16 Net Architecture
VGG-16’s convolutional layers are all 3 × 3 convolutional layers with identical padding and stride size of 1, and pooling layers are all 2 × 2 pooling layers with a stride size of 2. VGG-16’s default input image size is 224 × 224 pixels. The high-level network features in convolutional neural networks have rich semantic data, which improves positioning accuracy of CNNs. However, essential details are lost, and features are rough in space due to multiple pooling of high-level features. Multiscale training on images is a natural solution to this challenge. Technique of transport is different for each location. The feature map is up-sampled utilizing bilinear interpolation to attain a uniform size because size of a feature graph varies.
We begin with the VGG-16 network, built for large-scale natural picture classification in the first place.VGG−16 comprises 13 convolutional layers and three FC layers. conv-f11, 12, 21, 22, 31, 32, 33, 41, 42, 43, 51, 52, 53 g are the convolutional layers. The target dataset in this paper is quite modest, and pretrained VGG-16 is effective in various segmentation tasks. As a result, transfer learning is applied in our paper’s training. We only learn conv-f11, 12, 21, 22, 31, 32, 33, 41, 42, 43 g, convolution kernel is 3 × 3, and max-pooling because VGG−16 network has been updated. The VGG16 network was fine-tuned in this network. Dilated convolution increases the convolution kernel’s sensation field while keeping number of specifications constant as well as ensuring that size of output feature map does not vary. Convolution of conv −f51, 52, and 53 g was modified to dilated convolution, with a 3 × 3 convolution kernel and a 2 dilated rate, pooling layer following cov-43 and cov-53 was canceled. The convolution kernel is 7 × 7, and the dilation rate is 4. Then, we construct a predictor using multiscale features derived from several layers. There is no need to consider all the layers because there is a significant association between adjacent layers. We extract Hypercolumn features from f12, 22, 33, 43, 53, and 7 g with on-demand interpolation using skip-connections.
Although output of original Inception−v3 and VGG−16 networks comprises 1000 classifications, our instance only needed two PTC and benign nodules. As a result, we changed the last layer’s output channel number from 1000 to 2. During the training procedure, we also utilized a 50% dropout rate to avoid overfitting, and dropout mechanism discards some layer inputs randomly. We employed TensorFlow’s pretrained models and fine-tuned them with cytological pictures. The models are included in the Tensor Flow-Slim image classification package and were pretrained on the ImageNet dataset. Because ImageNet had around 14,000,000 photos, but we only had 279, we used specifications from pretrained method to initialize the parameters. Because deep networks involve many specifications, it was challenging to train methods with such a limited number of photos. Pretraining can hasten network convergence. The VGG-16 method architecture consists of 13 convolutional layers, 2 fully connected layers, and 1 SoftMax classifier. Publication of Karen Simonyan and Andrew Zisserman’s paper, “Very Deep Convolutional Network for Large Scale Image Recognition” in 2014, introduced VGG-16 method. Karen and Andrew constructed a 16-layer convolutional network with complete connectivity. Only 3×3 convolutional layers were stacked on top of one another for simplicity.
64 × 3 × 3-sized feature kernel filters makeup first and second convolutional layers. Output is subsequently transmitted with a stride of 2 to max pooling layer. The 3rd and4thconvolutional layers’ 124 feature kernel filters have a 3 × 3 filter size. Output is minimized to 56 × 56 × 128 by the max pooling layer with stride 2 that comes after these first two layers.
The 5th, 6th, and 7thlevels all make use of 3 × 3 convolutional layers. All 3 make use of 256 feature maps. A stride 2 max pooling layer comes after these layers. Two sets of convolutional layers with 3 × 3 and thirteenth-order kernels are present. These convolutional layer sets each contain 512 kernel filters. Following a 1000-unit softmax output layer, the fourteenth and fifteenth levels are completely connected hidden layers with 4096 units each (sixteenth layer).
6. Deterministic Trust Transfer Protocol (DTTP)-Based Secure Data Transmission
DTTP favors packet forwarding for each node by using Combined Trust Values (CTVs). Each sensor node in our proposed method has a CTV based on the following trust evaluation factors:
Identification: This factor holds a node’s identification information. It contains a node’s location information as well as its ID.
Sensing Data: This element comprises data sensing and event time sense.
Consistency: A node’s level of consistency is represented by this factor. CTV reflects a node’s total trustworthiness, determined using the three parameters above. We can identify malicious or hacked nodes based on these features and filter their data from the network. By lowering or raising the CTV, a node is punished or rewarded. Every aggregator identifies a packet by appending its hash value to CTV and transmits it to the destination node. The destination node verifies the hash value, and the CTV of all nodes is checked. The CTV is incremented if the hash value is confirmed; otherwise, it is decremented. The corresponding node is deemed malicious if the CTV falls below a trust level.
Trust Evaluation Process. The following trust evaluation factors are assessed to determine the node’s trustworthiness:
Identification: This element consists of a node’s specific identification information. It includes the node’s deployment grid identity and position.
Sensing Result: This factor represents the sensing result data for detected events. This element is made up of data sensing and event time sense.
where
is sensing data of node
and
is sensing time of node
.
Consistency: This factor represents a node’s level of consistency. We can find malicious or hacked nodes based on this aspect and remove their data from the network. Consistency value (
) is represented by:
where
CCsi is the node
i’s consistent sensing count,
ICsi is node
i’s inconsistent sensing count, and
CVi is node
i’s consistency value
i (1
≤ i ≤ k).
Trust Estimation: In the trust quantification process, weights are assigned to trust factors, which are then reviewed and quantified.
Wi is a weight that represents the importance of a specific factor, ranging from 0 to +1. Weight varies according to the application. As a result, the CTV for node i is calculated using Equation (5):
.
The trust values for adjacent nodes vary dynamically and continuously as time passes. If a node makes some minor and recent errors in communicating or sensing events, it has little impact on the trust value that its neighbors evaluate. Because every sensor node (SN) employs histograms for accumulative trust evaluations, which are executed as many count factors in the trust evaluation matrix, this is the case. Otherwise, if a node consistently broadcasts inaccurate data or rarely contacts its adjacent nodes, its trust value drops and converges to –1. As a result, this phase can detect and classify some malicious or compromised nodes that broadcast inconsistent or deceptive data regularly.
Aggregator Selection: Aggregators can be changed dynamically and regularly, depending on application. An aggregator’s job is to combine sensing input. After being chosen as an aggregator, aggregator node a gives its identification IDa = GridID; Position > to sink node and its neighboring nodes.
Data Aggregation: Let the initial trust values of the nodes {n
1, n
2, …} along the path from a source S to a sink D be {
CTV1,
CTV2,…}. Nodes cannot be entirely trusted or thoroughly distrusted because they do not know from the outset if their neighbors can be relied upon. Each aggregator maintains a counter that counts the packets aggregated through a route (
Ct). The aggregator
Ak always verifies the trust value
CTVi when it receives data packets and
CTVi from a node
ni. The data packets from the node
ni will not be aggregated if
CTVi, CTVthr. The counter
Ctk increases as eq if
CTVi >
CTVthr(6):
where
α is the number of packets that
Ak successfully gathered. Then,
Ak computes the MAC over the combined data and
Ctk using a shared key between the aggregator and sink and sends the MAC to the sink via Equation (7):
Similar to this, every aggregator establishes its MAC value. Finally, all of the aggregated data are delivered to sink D. The aggregators’ counters are checked before their MACs are confirmed when the aggregated data from all the aggregators reach the sink. If the counters are higher than a credit threshold
Cthr, the aggregators are regarded as being in good behavior. On the other hand, if the counters are lower than
Cthr, the aggregators are thought to be acting improperly. To reduce control overhead, the MAC is only verified for the misbehaving aggregators rather than for all aggregators. Aggregators with counters lower than
Cthr are also barred from sending more data. Algorithm 1 shows DTTP-based secure data transmission.
| Algorithm 1: DTTP |
| For every sensor node, S, I = 1,2,…,n |
| Calculate identification factor Idi |
| Calculate sensing result SR |
| Calculate consistency value CVi |
| Evaluate CTVi |
| End for |
| Select aggregator node Aj with highest CTVi |
| For every aggregator Aj, j = 1,2,….n |
| When Ai receives data packet from node Si, it measures its trust value CTVi |
| If CTVi<CTVithen Ai will not aggregate packet |
| Else |
| Ajaggregates packet and increment its counter CTj as Ctj = Ctj +α |
| Where α is the number of packets successfully aggregated by Aj |
| End if |
| Ajproduces a random hash value [MAC (agg, Ctj] |
| Ajtransmits [MAC (agg, Ctj] to the sink |
| End for |
| When all aggregated data from Ai reaches sink, it checks the counter value Ctj |
| If Ctj>Ctj, then |
| Ajis well behaving |
| Else |
| Ajis misbehaving |
| End if |
| Ajis prohibited from further transmissions |
7. Performance Analysis
This project’s training and testing parts were carried out on a system with an Intel®CoreTM i7-64720 HQ CPU running at 2.60 GHz (4 cores) and an NVIDIA GeForce GTX 1650 graphics card. MATLAB® R2019a and Microsoft Windows 10 Pro 64-bit have been used to implement each approach.
8. Database
Two open databases were used to test the sturdiness of the proposed recognition algorithms. Shandong University obtained the FV database [
28]. Joint Lab created the camera for Intelligent Computing and Intelligent Systems. Each image is saved in the “BMP” format, which has a dimension of 320 × 240 pixels. Hong Kong Polytechnic University’s database is the FKP database (PolyU FKP database) [
29]. A total of 7920 photos are included in this database, consisting of 12 images taken of the index as well as middle fingers of both hands of 165 individuals. Because there are more participants in the PolyU FKP database than in the FV database (165 > 106), we only selected 106 of these individuals [
30]. This presumption is required to accomplish the FV and FKP modalities fusion for the training and testing stages. In our suggested unimodal as well as multimodal methods, each database’s classes were split into two separate sub-databases, with 60% used for training and 40% used for testing. After two cross-validations, the recognition accuracy was calculated by alternating the training and test images.
Table 1 and
Figure 2 show the comparative analysis for the accuracy between the proposed and existing techniques. Here, the comparative analysis has been carried out on various biometric datasets based on the number of images processed. The accuracy calculation is performed by the general prediction capability of the projected DL method. The true positive (TP) and true negative (TN) evaluate the capacity of a classifier to evaluate. The false positive (FP) and false negative (FN) recognize the number of false predictions produced by the methods. The proposed technique attained 96% accuracy for 500 images based on their iterations, while the existing RBM obtained 83% and the CNN attained 90% accuracy.
Table 2 and
Figure 3 show the various dataset-based biometric image comparisons in terms of the F-scores between the proposed and existing techniques. For calculating the F-score, the number of images processed was 500 images for both the existing and proposed technique. The F-score reveals each feature’s ability to discriminate independently from other features. For the first feature, a score is generated, and for the second feature, a different score is obtained. However, it says nothing about how the two elements work together. Here, calculating the F-score using exploitation has determined the prediction performance. It is created by looking at the harmonic component of the recall and precision. If the calculated score is 1, it is considered excellent, whereas a score of 0 indicates a poor performance. The actual negative rate is not taken into consideration by the F-measures. Here, the proposed technique attained 85% of the F-score for 500 images based on their iterations, while the existing RBM obtained 79% and the CNN attained 81% of the F-score.
Table 3 and
Figure 4 show the precision calculation-based comparison for the proposed and existing techniques based on 500 images processed from the input biometric dataset. The accuracy of a class is calculated by dividing the total items classified as belonging to the positive class by the number of true positives. The probability is that a classification function will produce a true-positive rate when present. It is also known by the acronym TP amount. The proposed technique attained 92% precision for 500 images based on their iterations, while the existing RBM obtained 85% and the CNN attained 89%.
Table 4 and
Figure 5 show a comparative recall analysis based on the number of images from the input dataset. In this context, recall is described as the ratio of the total number of components that genuinely fall into a positive class to several true positives. The percentage of positive samples that were correctly identified as positive out of all the positive samples is how recall is evaluated. How well a method can recognize positive samples are calculated by recall. The recall increases as more positive samples are determined. Here, the proposed technique attained 80% recall for 500 images based on their iterations, while the existing RBM obtained 65% and the CNN attained 72% recall.
Table 5 and
Figure 6 show a comparative analysis of the RMSE, which indicates that an error occurred while processing 500 images. When training regression or time-series models, RMSE is one of the most widely used metrics to gauge how accurately our forecasting model predicts values compared to real or observed values. The MSE’s squared root is used to calculate the RMSE. The RMSE calculates the change in each pixel as a result of processing. The proposed technique attained 46% RMSE for 500 images based on their iterations, while the existing RBM obtained 55% and the CNN attained 48% RMSE.
9. Discussion
We will not use all the input data we gathered during the training process because doing so could lead to an overfit NN model. This common problem may be easily fixed by dividing our data samples and using only a fraction of them for training. The model cannot memorize the provided examples if only a subset of the data is used. It is possible to assess whether overfitting is occurring using the remaining data inputs. The degree of overfitting is calculated using the accuracy and precision of the trained design. The training procedure takes up 80% of the split; 10% of samples are used to check the input data throughout the training phase, and the remaining 10% is utilized as the testing data input to assess the accuracy and performance of the now-trained method. By adding various transformations to the incoming data, the final results can be improved even more. These modifications will aid the classifier in adapting to real-world settings, allowing it to enhance the accuracy and performance even further. The experimental results attained parameters such as an accuracy of 96%, F-score of 85%, precision of 92%, recall of 80%, and RMSE of 46%.
10. Conclusions
This research proposed a novel technique for secure data transmission and detecting an intruder in a biometric authentication system by feature extraction with classification. Here, an intruder is detected by collecting the biometric database of the smart building based on the IoT. These biometric data are processed for noise removal, smoothening, and normalization. The processed data features are extracted using a kernel-based principal component analysis (KPCA). Then, the processed features have been classified using a convolutional VGG-16 Net architecture. Then, the entire network was secured using a deterministic trust transfer protocol (DTTP). The experimental results attained parameters such as an accuracyof96%, F-scoreof85%, precisionof92%, recall of 80%, and RMSE of 46%. The future scope of this research can be carried out based on the cloud cyber security system-based technique. The future scope of this research can be carried out based on a real-time dataset with an improved accuracy using a blockchain technique with machine learning techniques.
Author Contributions
Conceptualization, C.A., I.N., K.N.D., R.M., N.Z.J., M.M. and A.S.; methodology, C.A., I.N., K.N.D., R.M., N.Z.J., M.M. and A.S.; software, C.A., I.N., K.N.D., R.M., N.Z.J., M.M. and A.S.; validation, C.A., I.N., K.N.D., R.M., N.Z.J., M.M. and A.S.; formal analysis, C.A., I.N., K.N.D., R.M., N.Z.J., M.M. and A.S.; investigation, C.A., I.N., K.N.D., R.M., N.Z.J., M.M. and A.S.; resources, C.A., I.N., K.N.D., R.M., N.Z.J., M.M. and A.S.; data curation, C.A., I.N., K.N.D., R.M., N.Z.J., M.M. and A.S.; writing—original draft preparation, C.A., I.N., K.N.D., R.M., N.Z.J., M.M. and A.S.; writing—review and editing, C.A., I.N., K.N.D., R.M., N.Z.J., M.M. and A.S.; visualization, C.A., I.N., K.N.D., R.M., N.Z.J., M.M. and A.S.; supervision, N.Z.J.; funding acquisition, C.A., I.N., K.N.D., R.M., N.Z.J., M.M. and A.S. All authors have read and agreed to the published version of the manuscript.
Funding
Authors would like to thank for the support of Taif University Researchers Supporting Project number (TURSP-2020/10), Taif University, Taif, Saudi Arabia.
Data Availability Statement
Data will be shared for review based on the editorial reviewer’s request.
Acknowledgments
Authors would like to thank for the support of Taif University Researchers Supporting Project number (TURSP-2020/10), Taif University, Taif, Saudi Arabia.
Conflicts of Interest
The authors declare no conflict of interest.
References
- Gayathri, M.; Malathy, C. A Deep Learning Framework for Intrusion Detection and Multimodal Biometric Image Authentication. J. Mob. Multimed. 2021, 1, 393–420. [Google Scholar] [CrossRef]
- Strecker, S.; Dave, R.; Siddiqui, N.; Seliya, N. A modern analysis of aging machine learning based IOT cybersecurity methods. arXiv 2021, arXiv:2110.07832. [Google Scholar] [CrossRef]
- Kumar, K.S.; Nair, S.A.H.; Roy, D.G.; Rajalingam, B.; Kumar, R.S. Security and privacy-aware Artificial Intrusion Detection System using Federated Machine Learning. Comput. Electr. Eng. 2021, 96, 107440. [Google Scholar] [CrossRef]
- Ahmed, K.I.; Tahir, M.; Habaebi, M.H.; Lau, S.L.; Ahad, A. Machine Learning for Authentication and Authorization in IoT: Taxonomy, Challenges and Future Research Direction. Sensors 2021, 21, 5122. [Google Scholar] [CrossRef] [PubMed]
- Gupta, R.; Tanwar, S.; Tyagi, S.; Kumar, N. Machine Learning Models for Secure Data Analytics: A taxonomy and threat model. Comput. Commun. 2020, 153, 406–440. [Google Scholar] [CrossRef]
- Taiwo, O.; Ezugwu, A.E.; Oyelade, O.N.; Almutairi, M.S. Enhanced Intelligent Smart Home Control and Security System Based on Deep Learning Model. Wirel. Commun. Mob. Comput. 2022, 2022, 9307961. [Google Scholar] [CrossRef]
- Naser, S.M.; Ali, Y.H.; Obe, D.A.-J. Deep learning model for cyber-attacks detection method in wireless sensor networks. Period. Eng. Nat. Sci. (PEN) 2022, 10, 251–259. [Google Scholar] [CrossRef]
- Siddiqui, N.; Dave, R.; Seliya, N. Continuous Authentication Using Mouse Movements, Machine Learning, and Minecraft. arXiv 2021, arXiv:2110.11080. [Google Scholar]
- Shafiq, M.; Tian, Z.; Bashir, A.K.; Jolfaei, A.; Yu, X. Data mining and machine learning methods for sustainable smart cities traffic classification: A survey. Sustain. Cities Soc. 2020, 60, 102177. [Google Scholar] [CrossRef]
- Shafiq, M.; Tian, Z.; Sun, Y.; Du, X.; Guizani, M. Selection of effective machine learning algorithm and Bot-IoT attacks traffic identification for internet of things in smart city. FutureGener. Comput. Syst. 2020, 107, 433–442. [Google Scholar] [CrossRef]
- Strecker, S.; Haaften, W.V.; Dave, R. An analysis of IoT cyber security driven by machine learning. In Proceedings of the International Conference on Communication and Computational Technologies, Madison, WI, USA, 27–28 October 2021; 2021; pp. 725–753. [Google Scholar]
- Shafiq, M.; Tian, Z.; Bashir, A.K.; Du, X.; Guizani, M. CorrAUC: A malicious bot-IoT traffic detection method in IoT network using machine-learning techniques. IEEE Internet Things J. 2020, 8, 3242–3254. [Google Scholar] [CrossRef]
- Alsarhan, A.; Al-Ghuwairi, A.-R.; Almalkawi, I.T.; Alauthman, M.; Al-Dubai, A. Machine Learning-Driven Optimization for Intrusion Detection in Smart Vehicular Networks. Wirel. Pers. Commun. 2020, 117, 3129–3152. [Google Scholar] [CrossRef]
- Shafiq, M.; Tian, Z.; Bashir, A.K.; Du, X.; Guizani, M. IoT malicious traffic identification using wrapper-based feature selection mechanisms. Comput. Secur. 2020, 94, 101863. [Google Scholar] [CrossRef]
- Suresh, P.; Logeswaran, K.; Keerthika, P.; Devi, R.M.; Sentamilselvan, K.; Kamalam, G.K.; Muthukrishnan, H. Contemporary survey on effectiveness of machine and deep learning techniques for cyber security. In Machine Learning for Biometrics; Academic Press: Cambridge, MA, USA, 2022; pp. 177–200. [Google Scholar]
- Sedik, A.; Faragallah, O.S.; El-Sayed, H.S.; El-Banby, G.M.; El-Samie, F.E.A.; Khalaf, A.A.M.; El-Shafai, W. An efficient cybersecurity framework for facial video forensics detection based on multimodal deep learning. Neural Comput. Appl. 2021, 34, 1251–1268. [Google Scholar] [CrossRef]
- Arora, P.; Kaur, B.; Teixeira, M.A. Security in Industrial Control Systems Using Machine Learning Algorithms: An Overview. In ICT Analysis and Applications; Springer: Singapore, 2022; pp. 359–368. [Google Scholar] [CrossRef]
- Jain, A.; Tripathi, K.; Jatain, A.; Chaudhary, M. A Game Theory based Attacker Defender Model for IDS in Cloud Security. In Proceedings of the 2022 9th International Conference on Computing for Sustainable Global Development (INDIACom), New Delhi, India, 23–25 March 2022; pp. 190–194. [Google Scholar]
- Alkadi, R.; Al-Ameri, S.; Shoufan, A.; Damiani, E. Identifying drone operator by deep learning and ensemble learning of imu and control data. IEEETrans. Hum. Mach. Syst. 2021, 51, 451–462. [Google Scholar] [CrossRef]
- Balamurugan, E.; Mehbodniya, A.; Kariri, E.; Yadav, K.; Kumar, A.; Haq, M.A. Network optimization using defender system in cloud computing security based intrusion detection system withgame theory deep neural network (IDSGT-DNN). PatternRecognit. Lett. 2022, 156, 142–151. [Google Scholar] [CrossRef]
- Ahamed, F.; Farid, F.; Suleiman, B.; Jan, Z.; Wahsheh, L.A.; Shahrestani, S. An Intelligent Multimodal Biometric Authentication Model for Personalised Healthcare Services. Future Internet 2022, 14, 222. [Google Scholar] [CrossRef]
- Bhattacharya, M.; Pujari, S.; Anand, A.; Kumar, N.; Jha, S.K.; Raj, A.; Hossain, S.M. Intruder Detection System using Posture Recognition and Machine Learning. Int. J. Comput. Appl. 2021, 183, 17–23. [Google Scholar] [CrossRef]
- Meena, G.; Mohbey, K.K. Assessment of Network Intrusion Detection System Based on Shallow and Deep Learning Approaches. In International Conference on Emerging Technologies in Computer Engineering; Springer: Berlin, Germany, 2022; pp. 310–335. [Google Scholar]
- Chiroma, H. Deep Learning Algorithms based Fingerprint Authentication: Systematic Literature Review. J. Artif. Intell. Syst. 2021, 3, 157–197. [Google Scholar] [CrossRef]
- Mittal, M.; Iwendi, C.; Khan, S.; Javed, A.R. Analysis of security and energy efficiency for shortest route discovery in low-energy adaptive clustering hierarchy protocol using Levenberg-Marquardt neural network and gated recurrent unit for intrusion detection system. Trans. Emerg. Telecommun. Technol. 2020, 32, e3997. [Google Scholar] [CrossRef]
- Iwendi, C.; Anajemba, J.H.; Biamba, C.; Ngabo, D. Security of things intrusion detection system for smart healthcare. Electron. 2021, 10, 1375. [Google Scholar] [CrossRef]
- Latif, S.A.; Wen, F.B.X.; Iwendi, C.; Wang, L.-L.F.; Mohsin, S.M.; Han, Z.; Band, S.S. AI-empowered, blockchain and SDN integrated security architecture for IoT network of cyber physical systems. Comput. Commun. 2022, 181, 274–283. [Google Scholar] [CrossRef]
- Balyan, A.K.; Ahuja, S.; Sharma, S.K.; Lilhore, U.K. Machine Learning-Based Intrusion Detection System for Healthcare Data. In Proceedings of the 2022 IEEE VLSI Device Circuit and System (VLSI DCS), Kolkata, India, 26–27 February 2022; pp. 290–294. [Google Scholar]
- Brindha, N.V.; Meenakshi, V.S. A secured optimised AOMDV routing protocol in MANET using lightweight continuous multimodal biometric authentication. J. Ambient. Intell. Humaniz. Comput. 2022, 40, 1–17. [Google Scholar] [CrossRef]
- Ananthi, J.V.; Jose, P.S.H. A Perspective Review of Security Challenges in Body Area Networks for Healthcare Applications. Int. J. Wirel. Inf. Networks. 2021, 28, 451–466. [Google Scholar] [CrossRef]
| Publisher’s Note: MDPI stays neutral with regard to jurisdictional claims in published maps and institutional affiliations. |
© 2022 by the authors. Licensee MDPI, Basel, Switzerland. This article is an open access article distributed under the terms and conditions of the Creative Commons Attribution (CC BY) license (https://creativecommons.org/licenses/by/4.0/).

 ,
, 


