
Linking Indoor Thermal Comfort with Climate, Energy, Housing, and Living Conditions: Portuguese Case in European Context


CONSTRUCT, Faculty of Engineering, University of Porto, 4200-465 Porto, Portugal
*
Author to whom correspondence should be addressed.
Energies 2022, 15(16), 6028; https://doi.org/10.3390/en15166028
Submission received: 29 July 2022
/
Revised: 16 August 2022
/
Accepted: 17 August 2022
/
Published: 19 August 2022
(This article belongs to the Special Issue Integration of Energy, Health and Comfort: Towards a Sustainable Building Stock)
Abstract
:Even though the milder climate scenario and constant evolution of thermal building regulation are in light of European initiatives, in Portugal, there are few houses where occupants can remain all the time in perfectly comfortable temperature conditions without resorting to heating or cooling. According to the Long Term Strategy for the Renewal of Buildings (ELPRE), this results from the combination of several factors, namely, low energy use for air conditioning compared to energy needs and aged building stock with poor energy performance. In fact, around 70% of the dwellings currently certified have low energy efficiency (C or less). The purpose of this review article was to analyse and discuss the factors affecting indoor thermal comfort, the inability to keep the home adequately warm in winter and cool in summer, and the risk of poverty or social exclusion in the European context, namely in Portugal. It fills the gap in the literature researching and analysing the motivations for these lower consumptions in Southern Europe, being Portugal a paradigmatic case. The current work integrates the indoor thermal comfort evolution and the current situation in Portugal in the EU context through different thermal comfort indicators and linking with the other statistics data, which may impact the indoor thermal comfort.
1. Introduction
Buildings account for approximately 40% of global energy consumption, and it is predicted that the buildings’ energy demand will continue growing worldwide in the coming decades [1,2,3,4]. Compared to 50 years ago, the energy demand from buildings (residential and commercial) has grown 1.8% per year [5], and it is predicted to grow from 116.8 EJ in 2010 to over 184.2 EJ by 2050, with most of this increase being from developing countries [6]. Three-quarters of total energy consumption in the buildings sector is residential, where there is great potential to improve energy efficiency [7]. Although it is generally recognized that energy efficiency is the cheapest way of reducing carbon emissions, the last years showed that the construction sector was frequently a missing opportunity [8]. This happens due to the higher initial costs, but also because of the lack of know-how and awareness (from owners, tenants, and stakeholders) regarding cost-effectiveness of the energy retrofit measures [9], especially if a life cycle cost approach is considered and ancillary benefits of energy retrofit measures are taken into account [10,11,12,13,14].
In accordance with this, a significant number of studies are presented in literature in order to improve building energy efficiency, namely on thermal insulation (building envelope) [15,16,17], life cycle analysis and numerical optimization [18,19,20], technical and economic analysis of energy-efficient measures for buildings renovation [21,22], control of lighting systems and heating/cooling, ventilation, and HVAC installations [23,24].
In modern societies, most of the population spends the day inside buildings for work, leisure, or rest activities. This context explains the increase in the installation of air conditioning systems in both residential and service buildings in recent decades, with this investment being a dominant part of the energy bill.
As the years go by, society becomes more developed, requiring more energy and greater thermal comfort. With this, there is a concept called energy efficiency that allows responsible use in the services that are used on a daily basis [25]. As such, the rational use of air conditioning systems will make it possible to reduce energy consumption and, consequently, reduce costs without depriving the indoor thermal comfort of the occupants and ensuring an indoor air quality environment.
The internal human body temperature remains approximately constant around 37 °C. This feature obliges humankind to constantly seek a thermal balance between themselves and the surrounding environment, which influences internal temperature. A small deviation from this value may trigger various body reactions and, in extreme cases, lead to death. In the event of illness, for survival, the internal temperature of the organism has 32 °C as its lower limit and 42 °C as its upper limit [26].
Technological advances in various sectors began during the Industrial Revolution, and civil construction was not left out of this context. The constant development of new construction techniques and materials, as well as the increased speed in the circulation of goods and products, meant that the way of thinking about buildings underwent drastic changes. Additionally, due to technological development and increase in the standard of living of modern societies, the conception of buildings, whether for housing, work, or leisure, has come to be guided by a set of functional requirements in which comfort, being of direct and immediate perception of the user, gains particular prominence. When there is a psychological perception of this balance, we can speak of thermal comfort, which is defined by ISO 7730 [27] as a state of mind that expresses satisfaction with the environment surrounding a person (neither hot nor cold). It is therefore a subjective sensation that depends on the occupants’ biological, physical, and emotional aspects, thus not being able to satisfy all the individuals occupying an enclosure with a given thermal condition.
A neutral or comfortable environment is an environment that allows metabolic heat production to be balanced with heat exchange (loss and/or gain) from the air around the worker. Outside this situation of balance, there may be adverse situations in which the exchange of heat energy constitutes a risk to the person’s health, since even taking into account the body’s thermoregulation mechanisms, they cannot maintain a constant and adequate internal temperature. In these situations, we can speak of thermal stress due to heat or cold. As an example, field studies conducted by [28], which included on-site questionnaire surveys, environmental monitoring, and in-situ physical measurement on several buildings, located in regions with a subtropical and partly semi-arid climate, showed that the ‘neutral’ temperature was 28.5 °C, and the upper limit of the comfort range in warm indoor air temperature conditions was 31.5 °C.
The thermal environment can be defined as the set of thermal variables of the surrounding environment which influence the human organism. It is, therefore, an important factor that intervenes not only in the health and well-being of people but may also impact productivity and concentration. To evaluate the environmental conditions to which certain building occupants are exposed, objective methods or criteria are usually employed, namely: (a) air temperature; (b) air humidity; (c) mean radiant temperature; (d) air velocity; (e) metabolism; and (f) clothing.
In the study of the thermal environment, two situations must be considered: (i) Thermal overload or thermal “stress”, which relates to the exposure of the human body to environments of extreme temperatures; (ii) thermal comfort, which does not involve extreme temperatures, relates to the temperature, humidity, and air velocity existing in places that, as a whole, may cause discomfort. Any of these situations can be measured through special techniques, calculating indices that provide information on the environmental quality of the workplace.
Research Significance and Objectives
According to a study carried out by the Sustainable Construction Portal in partnership with Quercus, 74% of the Portuguese state they consider their homes cold in winter and only 1% see them as thermally comfortable. This data raise awareness among the Portuguese situation for a right and a priority for comfort at home [29].
Thus, some issues must be addressed: what factors behind typical assessment of air temperature, relative humidity, mean radiant temperature, air velocity, metabolism, and clothing may originate indoor thermal discomfort on residential buildings? The current work aims to add insight into a deep analysis of social and economic factors behind typical thermal comfort measures or indexes effectiveness and the effectiveness of the regulation and policies to reduce indoor thermal discomfort on residential buildings in Portugal as EU MS, translating the results into a source for a critical debate on the potential to lower the indoor thermal discomfort on Portuguese residential buildings. In particular, we analysed the factors affecting indoor thermal comfort in detail, the inability to keep the home adequately warm in winter and cool in summer, and the risk of poverty or social exclusion in Mediterranean countries, namely in Portugal.
2. Methodology
2.1. Literature Search Strategy
In a literature review paper, it is important to carry out a systematic analysis of published works. The Web of Science, Scopus, and Google Scholar databases, or in addition, the open-source software tool “VOSviewer” [30], must be used as primary tools for locating suitable studies. Moreover, another important source of information for analysing studies of thermal comforts was compiled in the ASHRAE Global Thermal Comfort Database II [31]. This project is an initiative of the University of California and Berkeley’s Centre for the Built Environment, in partnership with the Indoor Environmental Quality (IEQ) Laboratory at the University of Sydney. The database developed from the systematic collection and harmonization of raw data from the last two decades of field studies of thermal comfort around the world. The end result contains studies conducted between 1995 and 2015 around the world, with contributors sharing their raw data for the project and wide dissemination to the thermal comfort research community. There are 81,846 subjective comfort votes that include objective instrumental measurements of thermal comfort parameters, and the other 25,617 additional data from the database of the original ASHRAE RP-884, thus totalling 107,463 data.
In this work, the Web of Science and Scopus databases were reviewed until mid-2022 for English-language papers without any other restrictions. These search engines contain the most comprehensive abstract and citation database of peer-reviewed literature. In the literature analysis, a total number of approximately 1700 publications of papers in journals and conference proceedings were found to contain the words “indoor thermal comfort” and a similar number contained the words “energy poverty”. Moreover, if the origin of the publications is examined, about 50% of the total publications come from the USA, UK, China, Italy, and Spain. In this work, the most cited papers were analysed in detail in order to review the factors affecting indoor thermal comfort, the inability to keep the home adequately warm in winter and cool in summer, and the risk of poverty or social exclusion in European countries, for which Portugal is a paradigmatic case.
2.2. Structure of the Review
The Web of Science and Scopus were reviewed until mid-2022, and this review paper is structured as follows. Firstly, to discuss such issues, Section 3 presents a short context of thermal comfort in the light of building regulations, main standard methods to access, and respective thermal indexes. Section 4 presents an overview of the possible factors affecting indoor thermal comfort and their effects on society. Afterward, Section 5 explores general synergies and trade-offs between these fields of inquiry. Finally, Section 6 summarises the main conclusions of this review.
3. Thermal Comfort
Thermal comfort has always been a very vast subject due to its variables, the parameters, and factors that influence it in a given social and climate context. Because there has always been ambiguity and subjectivity around this subject, some thermal comfort measures have emerged to clarify and provide harmonised methodologies to access the feeling of thermal comfort.
Complementing the definition of generic comfort assessment models, where temperature ranges are defined with certain degrees of acceptability, for the indoor climate, depending on the type of buildings and occupants, many authors have worked on the form of indices, which summarises the degree of discomfort or “stress” into a single number felt by the human being in each environment. This “discomfort index” can be calculated in time and space, representing a unique indicator of the thermal performance of a building, referring to a given area and to a certain time (usually on an annual basis). These indices are essential for comparing measures and design strategies, from the point of view of the comfort of its occupants.
From the literature survey, several indices can be found. For instance, Epstein and Moran [32] found 46 thermal comfort indexes (between 1905 and 2005). Later, Carlucci and Pagliano [33,34] completed the aforementioned list and identified 78 indexes. Despite the enormous indices available, they can be grouped into different categories. One of the first classifications, proposed by Macpherson [35], distinguishes such indices based on the following criteria:
- Indices based on the calculation of the heat balance of the human body (rational indices);
- Indices based on physiological effort (empirical indexes);
- Indices based on the measurement of physical parameters (direct indexes).
More recently, new indexes have been proposed, with the objective of evaluating the long-term comfort conditions inside a building, either through experimental monitoring or through dynamic simulation [34]. However, there was a need to somehow standardise this kind of indicator, and ISO 7730 [27], proposed indexes based on the classic Fanger model, namely: (a) Percentage out of range (comfort); (b) PPD weighted; (c) Average PPD; (d) Accumulated PPD.
This standard is based on requirements for general thermal comfort (predicted mean vote (PMV), operative temperature) and local thermal discomfort (radiant temperature asymmetry, draught, vertical air temperature differences, floor surface temperatures).
International standards, such as ISO 7730 [27] and EN 16798 [36,37], present some methods to quantify discomfort indices [33]. Three of these indices were adapted in the European standard EN 16798 [36,37], extending its scope to the adaptive approach. In 2008, Nicol et al. [38] proposed the “Overheating risk” index based on the statistical data collected for the European project SCATS (senses thermal discomfort in temperature-free floating buildings for various climates in Europe). More recently, in 2010, the “Exceedance M” index, which quantifies hours of discomfort, weighted by the number of occupants on average per hour, was proposed by Borgeson and Brager [39]. This index can be applied based on the Fanger model or based on the adaptive model proposed in ASHRAE 55 [40]. For the indices of evaluation of the long-term discomfort, based on comfort evaluation models, the grouping of the indices in four families is proposed by [6] and summarised in Table 1:
- Indices-% (POR—percentage out of range): based on the number of hours of discomfort, in relation to the total hours occupied; it should be noted that this index does not value the severity of the conditions outside the comfort range;
- Indices-sum (or “accumulated”): sum of the busy hours of discomfort. They can be weighed by the severity of the discomfort or not.
- Risk indices: incorporate in the calculation the non-linear relationship between the perception of discomfort and the distance to the comfort interval;
- Average indices: as the name implies, the calculation is based on the average of the parameter evaluated.
For most of these indices, there is a greater prevalence of summer discomfort due to overheating [35], some of which are extensible in the winter (but never the opposite), and therefore the case studies are, in most cases, services. Another typical mention to “thermal stress indexes” in this context of thermal comfort is made in the health literature [38].
Several limitations are pointed out to each of the mentioned approaches. The most important limitations refer to the “boundary conditions” in the calculation process of indices, starting with the definition of the hot and cold seasons (start, end, and duration) [41]. Moreover, there is no harmonised criterion for calculating the different indices. For example, EN 16798 [36,37] suggests that the index shall be calculated for 95% of the building area, with the various compartments being weighted by the volume of each. In turn, the Exceedance M index weights discomfort by the number of occupants in each compartment. On the other hand, the POR (percentage out of range) indices do not incorporate the severity of the discomfort or the distance from the parameters to the desirable ones.
Finally, it should be noted that, in the case of single values, it is necessary to use this type of index with great care and discretion, always conducting a sensitivity analysis of the results. A study carried out by Carlucci and Pagliano [34] applied 16 indexes of long-term discomfort in offices located in Rome, which allowed them to conclude that the discomfort values had absolutely no relation, with variations of up to 70% among them, especially for the overheating risk. They also concluded that the strategy of optimising a building from the point of view of the project for thermal comfort is thus strongly conditioned by the index of discomfort used.
The evaluation and quantification of thermal comfort have been widely studied over time, however, constitutes itself a complex exercise, as it depends on a wide variety of factors, part of which is measurable (environmental and occupation) and part of which is not measurable (psychological and sociological individual factors). The condition of thermal comfort happens when the thermal exchanges that are established between the human body and the environment that surrounds it are in balance.
In the last twenty years, a new approach to the assessment of thermal comfort has gained strength, the adaptive model, proposed by Humphreys and Nicol [42] who considered that the conditions in climatic chambers were very far from the real environmental conditions (see Figure 1), i.e., did not consider the human ability to adapt to different environments through actions such as putting on more clothes, opening and closing windows, etc.
The analytical approach proposed by Fanger [43] is the basis of the international standard for comfort evaluation, ISO EN 7730 [27]. The sensation of thermal comfort is influenced by environmental factors, namely (ASHRAE 55 [40]): air temperature, mean radiant temperature, air velocity, and relative humidity, and individual factors: metabolic rate and basic clothing insulation.
Moreover, air movement may provide desirable cooling in warm conditions, but it may also increase the risk of unacceptably cool drafts [44]. As example, the experimental study developed by Gong et al. is presented [45], who analysed the perception of locally applied airflow, with 6 air velocities between 0.15 m/s and 0.9 m/s and different ambient temperatures and local temperatures, in 24 persons working in an office. The different combinations were maintained for 15 min, during which the subjects responded to questionnaires on their thermal and draft sensations. The results showed that the subjects preferred air movement was between “just right” and “slightly breezy” and they preferred their thermal sensation was between “neutral” and “slightly cool”, with an acceptable air velocity range between 0.3 m/s and 0.9 m/s.
In addition to the definition of comfort assessment models, where temperature ranges are defined with certain degrees of acceptability, depending on the type of buildings and occupants, many authors have worked in the form of indices, which translate into a single number, the degree of discomfort or stress experienced by humans in a given environment. This discomfort, in the form of an index, can be calculated in time and space, representing a unique indicator of the thermal performance of a building for a given area and for a certain period (usually on an annual basis), i.e., defining the variable “°C.hd” as a discomfort indicator (hourly degrees of discomfort).
3.1. Building Regulations and Recent Initiatives
Thermal comfort is related to the energy performance of buildings, ensuring that buildings have certain characteristics to provide a minimum comfort. Thermal adaptation in the built environment can be attributed to three different processes: behavioural adjustment, physiological acclimatization, and psychological habituation or expectation [38,46]. The thermal comfort temperature is not always constant, and the range of values in which it varies is from 18 °C to 25 °C. Maximum energy demand values and minimum air renewal rate values are other examples of important parameters to feel comfortable in a building.
The first regulation concerning indoor thermal comfort in Portugal was the Decree-Law no. 118/98, Regulation on conditioning systems in buildings (RSECE), in which the thermal comfort and indoor environmental quality needs of buildings involved using ventilation, heating, cooling, humidification, and dehumidification systems. The Decree-Law no. 79/2006 established the Buildings Energy Certification System based on Directive 2002/91/CE and renovated the previous Decree-Law no. 118/98.
Later, in 2020, Decree-Law no. 101-D/2020 established the requirements applicable to buildings for the improvement of energy performance and regulates the Energy Certification Scheme, transposing Directive (EU) 2018/844, and partially transposing Directive (EU) 2019/944. One of the most controversial changes of this new legal framework among construction stakeholders was the exclusion of the thermal comfort project, which was no longer mandatory as a specialty project in the scope of the minimum energy performance requirements for new buildings. Thus, Decree-Law 102/2021, of 19 November, introduced the first alteration to Decree-Law 101-D/2020, of 7 December, restoring the obligation to present the thermal comfort project as a specialty project. Decree-Law 101-D/2020, revised the normative and regulatory framework applicable to the energy performance of buildings. The law establishes requirements for new buildings and existing buildings undergoing renovation, with a view to achieve a building stock with almost zero energy needs. A detailed review of historic thermal building regulations can be found in previous research of the authors [47].
Considering the actual building stock situation, the unsatisfactory indoor thermal comfort of the population, as part of the Economic and Social Stabilisation Programme (PEES), the Portuguese Government launched the “More sustainable buildings” initiative in September 2020. At a value of 4.5 million euros, this programme was available until December 2021 and offered a maximum reimbursement of 70% of the investments made by the households, with a maximum limit of 15,000 euros per owner and 7500 euros per building or autonomous fraction. The beneficiaries are the owners of buildings located in mainland Portugal and built before the end of 2006. The “More sustainable buildings” programme covers six types of intervention:
- Efficient windows
- Thermal insulation
- Space heating/cooling and domestic hot water systems (e.g., heat pump)
- Renewable energy production equipment (e.g., photovoltaic panels)
- Optimisation of water management (e.g., pressure reducer)
- Incorporation of biomaterials, recycled materials, green roofs and façades, and bioclimatic architecture solutions.
More recently, the “Vale Efficiency” programme was set and aimed at combating energy poverty and reinforcing the renovation of buildings at the national level, enabling an increase in their energy and environmental performance, thermal comfort and living conditions, health and well-being of families, contributing to the reduction of energy bills and the ecological footprint. This programme is part of the Portuguese Recovery and Resilience Plan (PRR). Under this programme, 100,000 “efficiency vouchers” are to be handed out to economically vulnerable families by 2025, to the value of 1300 euros plus VAT (Value Added Tax) each, so that they can invest in improving the thermal comfort of their homes, either by intervening in their surroundings or by replacing or acquiring energy-efficient equipment and solutions. The present phase of the programme aims to deliver 20,000 vouchers. This programme covers mainland Portugal’s economically vulnerable families and those in a situation of potential energy poverty, who do not reside in social housing so that they can improve the energy performance of their permanent home and their living conditions.
3.2. Standard Methods for Indoor Thermal Comfort Evaluation
3.2.1. ISO 7730:2005
This standard [27] is applied to moderate thermal environments with the calculation of PMV and PPD indices and specifications to reach thermal comfort conditions.
In order to define the PMV thermal comfort index described above, it is necessary to have knowledge or measurements of the physical parameters of the environment (air temperature, radiant temperature, relative air velocity, and air humidity), as well as the personal parameters (activity and clothing). In this standard, it is also possible to find out the PPD index, which refers to the percentage of people dissatisfied with their surroundings.
Thermal discomfort results from an increase or decrease in temperature in various areas of the body. The factors that are related to this discomfort are draught, radiant temperature asymmetry, floor surface temperature, and vertical temperature difference. In another version of this standard, the only factor that was addressed was air currents, but with this updated version it is possible to see how each parameter works.
This new version also presents a method for evaluating thermal comfort for long time intervals, due to the thermal environment inside buildings not being always the same, and it is not possible to place this temperature within the recommended limits.
3.2.2. ISO 7726:1998
The subject addressed in this standard involves the analysis of physical parameters in moderate thermal environments, as in extreme environments and thermal stress analysis, and aims to define and present methods for measuring these parameters [48].
3.2.3. ISO 8996:2021
The standard [49] aims at determining the metabolic heat rate through different methods in the context of ergonomics of the climatic environment. The determination of this rate may also be used for other situations, such as the energy cost of jobs sports activities and the total cost of an activity.
3.2.4. ISO 10551:2019
This standard [50] has, as its objective, the verification of the influence of the thermal environment using scales of ergonomic judgment scales of thermal environments that enable the comparison of data on subjective aspects of thermal comfort and also provide data and basis for construction.
3.2.5. ISO 9920:2007
This standard describes some methods for estimating the dry heat loss resistance, thermal insulation, and evaporative heat loss in a permanent regime for different types of clothing [51].
3.2.6. ANSI/ASHRAE 55:2020
The purpose of the standard is to specify the combinations and conditions of thermal environmental factors admissible for a certain number of persons frequenting the same space. This standard was updated in 2020 and also contains a method for determining which thermal conditions are acceptable in ventilated spaces [40].
3.2.7. EN 16798:2019
The objective of the standard, which is practically identical to ISO 17772, is to specify the indoor environmental parameters that have an impact on the energy performance of buildings by addressing air quality, thermal environment lighting, acoustics, and the assessment of the same [36,37]. The criteria for the indoor environment are set by human occupancy and where the manufacturing or technological processes do not have a major impact on indoor environment. This standard supersedes EN 15251 [52], and the major change is that the standard is split into a normative part, EN 16798-1, and a technical report part, EN 16798-2.
4. Factors Affecting Indoor Thermal Comfort: Climate, Housing, and Living Conditions
Europe has a wide variety of climates. According to the classification originally developed by Koppen over a hundred years ago and adapted by Peel et al. [53], Europe has a predominantly “cold” climate—letter “D” (44.4%), followed by “arid”—letter “B” (36,3%), then “temperate”—letter “C” (17%), where Portugal is inserted and finally “polar”—letter “E” (2.3%).
Considering only winter severity, Figure 2 presents the heating degree days (HDD) special distribution for Europe (a) and for the five large regions of Portugal (b). Portugal has around 1166 HDD, a 62% lower value than the EU-28 average of 3076 [54]. It is important to point out that almost half of Portugal’s total area has less than 1000 HDD. All southern Europe countries are in a similar position, which means winters are much more moderate when compared with central European countries and Scandinavia.
Solar radiation is another important parameter regarding the thermal balance and comfort inside buildings, mainly because it defines solar gains through window elements. Figure 3a presents this parameter, considering total annual global horizontal solar radiation [55]. It can be perceived as a significant difference between southern and northern Europe. Figure 3b presents, on the other hand, the average annual temperature in the EU-28, reinforcing the higher temperatures in Southern Europe, especially in the Mediterranean area. The average temperature in Portugal is 15.7 °C (17.4 °C in Lisbon and 15.2 °C in Porto), and in Europe, the average is 9.5 °C [56].
The average temperatures in most of Europe are significantly lower than the comfort range defined in several regulations (18 °C in Portuguese regulation [57] or 20 °C in EN 16798 [36,37]. Therefore, it is expected that thermal regulations rely mostly on the minimisation of winter losses. The national methodologies for calculating energy needs, following the 2010 EPBD, assume permanent heating and cooling habits to enhance thermal conditions all year. Considering the higher weight of winter losses when compared with summer overheating, HDD parameter represents a crucial role in total energy needs.
4.1. The Special Case of the Dwellings Located in Southern Europe
Despite the low heating habits, Portugal, as other low-heating countries, presents discomfort conditions, especially in the winter season [58,59,60,61,62]. Fuel poverty is a very important problem all across of Europe, especially in southern countries, despite its better climates. New indices were created concerning climate, energy prices, and income for all European countries, and the results reinforce the low heating tendency, corroborated with the low energy bills for space heating (obtained from surveys [63]), for southern Europe and Portugal in particular. Hence, for those countries, if the actual heating patterns are mainly lower than the regulation assumptions (intermittent heating in space in time), this means they do not need to save so much energy as the regulation would recommend, as the energy consumptions are already low. It is not possible to save energy when it is not spent, but dwelling’s performance in these countries has a wide range of possibilities to improve winter comfort conditions without compromising summer comfort.
These findings merge into the idea that a new approach is required to evaluate the thermal performance of existent dwellings located in low-heating countries. These are mainly southern European countries but may be any other more vulnerable to fuel poverty conditions. This is particularly important for countries such as Portugal, where higher values of “Lack of motivation to heat” (LMH) and lower effective heating consumptions were presented.
Still, in the southern Europe countries, many of these existing buildings do not have insulation at all and were built in a period of completely different construction techniques, favouring natural ventilation, using high inertia stone walls (not insulated) and wooden floors and roofs (which need to be ventilated). These techniques do not have the same behaviour when insulation is introduced and may develop significant pathologies, which is a common perverse consequence of non-appropriated insulation measures, besides the air-quality prejudice [64,65]. Furthermore, many of these ancient and historical buildings have an additional architectural value, which is not always compatible with the insulation introduction. Still, regarding all measures suggested on Energy Certification Schemes (ECS), a careful evaluation should be made of when to introduce them, since they represent high investments to households (especially in these poorest countries). Since heating consumptions are already low, the effective payback times associated are much higher than the theoretical values referred to on certificates. Will the household effort needed to pay for them be worthwhile?
Tigchelaar et al. [66] described the actual payback time, considering the “Heating factor” (percentage of actual energy use in the theoretical/“nominal” value given by regulation) for installing low-E glazing in Dutch dwellings. The authors showed that many investments may not be worthwhile, considering actual energy consumption, marked as dots in the picture. Considering the Portuguese “Heating gap” presented by Magalhães and Leal [67], which by definition is the same as the “heating factor”, this gap was 95% in 2010 (considering the Portuguese regulation at the time [68]). This means that households in Portugal used only 5% of the energy that they would need to maintain the whole house at a minimum of 20 °C during the whole winter. Nevertheless, Magalhães and Leal [67] also showed that “nominal” conditions (e.g., 20 °C in the entire house during all winter) are likely an excessive standard in terms of comfort requirements and showed another theoretical gap of 55% that would be the “enough heating gap”. This means it would be “enough” to spend 45% of “nominal” heating needs to reach comfortable conditions inside dwellings [67]. Considering this, it is possible to conclude that Portuguese consumption would not theoretically justify the measure of installing low-E glazing (regarding the specific context of the example), as its payback time would be, in most cases, too high, even if people start heating to reach “enough” winter comfort conditions. Note that the definition of “enough consumption to reach comfortable conditions” was defined considering the “theoretical heating energy demand under relaxed thermal comfort conditions” estimated from the national regulation-specific model developed by [67].
Taking into account all the previous findings, it is very important, thereby, to consider widely if the low-heating countries or the ones most exposed to fuel poverty are on the correct path, when it comes to thermal performance evaluation or energy efficiency policies definition, once there is the risk of spending important investments on those driven policies, with results much lower than expected. Moreover, in the worst scenario, it is important to keep in mind that the thermal pathologies are associated with internal insulation and high investment efforts of households without real payback, among others.
4.2. Heating Patterns
There is a wide range of literature concerning heating patterns in the residential sector in Europe. Most of these studies identify that, in Europe, permanent heating in the entire dwelling area and all the time is very rare. Kane et al. [61] showed that the average duration of the daily heating period was 12.6 h for 300 Leicester (UK) dwellings (from 4 to 22 h, those being the shortest and longest heating periods, respectively). In Southern Europe, Terés-Zubiaga et al. [60] showed that in 4 of 10 social housing dwellings monitored, located in Bilbao, the indoor average temperature was lower than 16 °C during the coldest period in winter, and two of them presented an average temperature lower than 16 °C when the whole winter was analysed. The total energy consumption of these social dwellings is lower than expected.
Santamouris et al. [59] showed that, in Athens city and low-income dwellings, the absolute energy use for heating purposes in all groups analysed varied between 4 and 30 kWh/m2, with an average close to 18 kWh/m2, and the time of use of the heating systems varied between 0.75 and 3 h per day, even if the colder months call for much longer heating times. Magalhães and Leal [67] monitored the indoor temperature of some of the coldest cities in Portugal and showed that there is a pattern of heating only the occupied rooms, and with higher temperature values on living rooms and lower values in sleeping rooms. According to Alber [62], 20–55% of the low-income households in Southern and Eastern Europe live in housing with leaking windows. In addition, about 15–25% of the low-income population in Southern Europe and Ireland cannot afford the expenses for heating, while in Portugal this value rises up to 73%.
On the other hand, several authors [69,70] have shown significant differences between theoretical consumptions, calculated by the regulation methodologies, and the actual consumptions, obtained from surveys or real bills. These differences happen in both ways, being actual consumptions higher or lower, but mainly lower than predicted. These differences are not totally random. It showed a consistent pattern, related to that commonly referred to as “rebound effect”, which may be briefly described as the tendency to spend more energy on more efficient in dwelling and technical systems, and the opposite, i.e., as a less efficient dwelling, less energy to heat will be spent in it [69,71].
A Portuguese survey carried out in 2010 figures that space heating weighs only 21% of the total household consumption annual bill on average [63]. This weight rises to 67% in the European average [72]. It could be expected that, on the other hand, cooling could have a more significant impact on the Portuguese bill, at least compared with the other European countries. However, data collected from the same survey prove that this is only a wrong assumption, as cooling weight is negligible and represents only 0.5% of the total Portuguese average energy bill. The same happens in the majority of European countries, except for some specific Mediterranean areas, such as Malta, for instance, where cooling can reach near 10% of the total energy bill [72].
Concluding, in the vast majority of cases, heating patterns are not on a 24 h cycle and in 100% of the floor area, but rather intermittent and zonal, especially in the Mediterranean region.
4.3. Inability to Keep the Home Adequately Warm in Winter and Cool in Summer
Inability to maintain indoor thermal comfort in summer and winter is influenced by income and urbanization level, with households in cities and with lower incomes reporting most problems with keeping the home thermal comfortable. Generally, in Portugal, as in other EU countries, the total energy consumption of residential buildings depends on several variables, such as (a) Financial capacity of the occupants; (b) Energy cost and governmental subsidies; (c) Occupancy profile of the buildings during the day; (d) Energy sources used, namely renewal energy system; (e) Available energy sources, for example, in interior and rural zones the biomass is used in great scale; (f) Total floor area and possibility of partial space heating/cooling; (g) Energy performance of the system used; (h) Type of construction.
Portugal presents a very specific household energy consumption distribution by end-use, i.e., the space heating weight in the average energy bill is 21% of the total consumption and 11% of the total cost [63]. In contrast, this end-use weight rises considerably from the EU average being the main energy end-use, with 67% of total consumption [72]. Gaglia et al. [73] present an analysis of the Eurostat results for energy consumption in European residential buildings in 2014 and concluded that Portugal is the second country with the lowest recorded (66 kWh/m2year) average annual energy consumption in the EU-28 of 158.8 kWh/m2year. This result was not surprising if one considers that Portugal has 1155 °C day, 63% fewer “heating degrees days” (HDD) than the EU-28 average of 2817 °C day and only 19% of the Finland value [54]. Portugal and the other southern/Mediterranean countries (Greece, Spain, etc) used much less energy to heat than the EU-28 average, especially the northern countries.
Therefore, as heating consumption is already low (and cooling, negligible), discomfort minimization should target these countries more than energy efficiency for heating or cooling.
Several studies [69,74,75] rely on the differences between theoretical energy consumptions, given by national Energy Performance Certification Schemes, and actual consumptions, provided by energy suppliers databases and household surveys, in countries such as France, the Netherlands, Belgium, Germany, Spain, Portugal, and the United Kingdom. These differences are significantly higher in poor and older constructions, and with inefficient technical systems, which are assigned with worse energy labels. This difference can reach up to 50% in the most unfavourable classes.
Sunikka-Blank and Galvin [76] showed that the German occupants consume, on average, 30% less heating energy than the calculated rating, i.e., the use of the dwelling’s energy rating to predict fuel and CO2 savings through retrofits tends to overestimate savings. This phenomenon is identified as the “prebound” effect and increases with the calculated rating. The opposite phenomenon, the “rebound” effect, tends to occur for low-energy dwellings, where occupants consume more than the rating.
In the particular case of Portugal, since 2010 and until the present moment, more than 1.5 million Energy Performance Certificates (EPC) have been issued [25]. From these, around 80% regard existing buildings, and from those, 87% were rated with a C or worse label (see Figure 4). This means there is a huge improvement potential in existing dwellings, since approximately 40% of existing buildings need some type of intervention (maintenance or retrofitting) [25].
Residential buildings are rated from A+ to F, depending on the ratio RNT = Ntc/Nt, Ntc being the nominal primary energy needs of the building and Nt being the same needs for a reference building. Both Ntc and Nt are the result of the energy balance between gains and losses, considering heating and cooling needs, ventilation, and solar gains, among others. New buildings must be rated with B− or better, and major retrofitting (intervention costing more than 25% of the total building value) is allowed to reach band C.
The energy performance certificates that have been issued are approximately 12% for new buildings and 83% for buildings without major retrofitting (practically the totality associated to buy/sell or rent activity where the EPC is required).
A more extensive analysis showed that the new buildings present a Nic (annual heating needs) value lower than the limit suggested Nic (see Figure 5). This is an expected result, taking into account that the new buildings are designed to accomplish the Portuguese regulation (REH). However, it is possible to observe that only 30% of the existing buildings are in accordance with Ni (maximum limit of the heating energy needs) values suggested by REH, i.e., only the more efficient existing buildings present Nic values lower than the limit suggested. This result may explain that 87% of the existing Portuguese dwellings were rated with a C or worse label, as sketched in Figure 4.
Figure 6 shows the nominal primary energy needs for the three Portuguese different climatic zones in winter. It is possible to observe that the differences are more accentuated in the last quartile. It is interesting to notice that, in spite of the maximum values for Nic being much higher than Ni, when we look at the median values, the nominal values (Nic) respect the limits (Ni), considering both new and existing dwellings. For zone I1 (less severe winter) the limit is respected until the 3rd percentile, but for zone I3 (most severe winter), the limit is respected only for the 2nd quartile (median values). The height of the boxplot represents the standard deviation, much higher for nominal values, as we should expect.
Several studies developed in Portugal [67] and Europe [65,66,69,70] showed that the actual consumption for heating is, in most cases, lower than that calculated in the regulations. This difference is greater than 50% and is higher for the houses with a worse energy class (less efficient)—the rebound effect. There is a perception of thermal comfort by the occupants with consumptions lower than those foreseen in the regulation. This means that there is an underestimation of the payback time which possibly discourages cost-effective, incremental improvements.
4.4. Risk of Poverty or Social Exclusion
In the last years, several studies seem to conclude that actual household heating consumptions are much lower, especially in Southern Europe, and a particular reunion of factors seems to justify these higher differences: fuel poverty, a moderate climate, and higher tolerance to discomfort conditions [67,69,74,75,76,77,78]. The experimental results based on actual consumption, provided by energy suppliers databases [67,74,75] and household surveys [59,62], point to the fact that actual household heating consumption is significantly different, and most of the time, lower than theoretical assumptions from regulations, especially in the less efficient buildings. This is particularly common in countries with a better (mild) climate and more exposed to fuel poverty (high energy costs and low incomes), and is particularly evident in social housing [67,79]. Southern Europe and the Mediterranean area fit either condition, presenting the highest differences or “heating gap”, as proposed by Coimbra et al. [80]. It is, moreover, surprising that, despite southern Europe countries having warmer climates, it is in these countries that there are more winter deaths in part due to fuel poverty, as suggested by Fowler et al. [81].
On the other hand, in the most efficient buildings, due to improved technical systems, the actual consumptions are sometimes higher than expected by regulation. This is referred in the literature review as the “rebound effect” [59,75].
The differences between predicted and actual energy consumption have two relevant direct implications. First, considering an individual perspective, the payback periods for the retrofitting investment measures proposed on the EPC’s are unrealistic, misleading the owners. Secondly, the national and European policy targets for reducing energy consumption, based on theoretical consumption, are also unrealistic [74,80].
Considering that housing stock is mainly older, in Europe, the direct consequence of the “heating gaps” is that the total consumption is much lower than in EPC’s predictions. This way, the timeframes often announced to achieve specific energy efficiency goals such as the 20-20-20 strategy and NZEB’s new goals may be misleading. This inaccuracy happens all around Europe but will significantly impact the Mediterranean region because of its much lower heating habits.
On the other hand, the ever-increasing energy requirements of the European directives are accomplished, in national regulations, by ever-decreasing U-Values for the building envelope (besides tight ventilation requirements). This is only achievable with large thicknesses of insulation, which may have prejudiced consequences in terms of hygrothermal risks and air quality depending on the heating behaviour [64,65].
Furthermore, many existing and historical buildings have an additional architectural value, which is not always compatible with the insulation introduction, completely changing its operation principle.
Figure 7a shows a spatial distribution, for 2021, of the electricity prices (EP), and in Figure 7b the “median equivalised disposable income” (MDI) is presented, that is the total income of a household, after tax and other deductions, that is available for spending or saving, divided by the number of household members converted into equalized adults. These prices vary widely but are some of the highest for Spain and Portugal [82].
Observing the southern Europe countries, the uncomfortable position in both graphs is clear (poorest countries with highest energy prices). This combined effect can be, by itself, an important indicator of the heating pattern. Other Mediterranean countries have similar positions, although more favourable, considering the combined effect of both indicators (EP and MDI). Both conditions, low income and high energy costs, explain why these countries, especially Portugal and Spain, are often referred to in the literature as the most vulnerable to “fuel poverty” [83].
“Fuel poverty” is defined in the literature as the “lack of affordability of energy for heating” [84]. “Energy poverty” is another definition that is also very common, meaning the “situation where a household is unable to access a socially and materially necessitated level of energy services in the home” [85]. Both concepts are very common in the United Kingdom, where systematic research and policies to address them exist, but are still unfamiliar to most other countries. Two main aspects are considered the most conditioning to the fuel poverty phenomenon for each country: high energy prices and low income, as referred to in the last topic. In this paper, a third factor is introduced: climate severity in winter, considering that energy needs for heating are much higher than cooling needs. This means fuel poverty will be as relevant as cold in the winter is for each country (or the higher HDD parameter).
Considering this, it is surprising that, despite southern Europe countries having warmer climates, it is in these countries that there are more winter deaths. Fowler et al. [81] calculated the EWDI (Excess Winter Deaths Index), which is the ratio of winter deaths to total deaths, for 31 European countries, from 2005 to 2014. Malta presented the highest value (28.3%), followed by Portugal (25.9%), Spain, and Cyprus, all Mediterranean countries. Previously, Healy [86] had already noticed this same winter death paradox, placing Portugal as the worst case in a group of 14 European countries (28% rate of excess winter mortality). Santamouris et al. [59] concluded the same for low-income dwellings in Athens, with indoor temperatures much below the accepted standards. Terés-Zubiaga et al. [60] also showed that a cold home is a real problem in northern Spain, at least in the social housing sector. On the other hand, despite Scandinavian countries experiencing the coldest winters, they have the lowest EWDI, even if they have similar economic conditions to other countries, like UK or France, where EWDI is higher [81].
More recently, Magalhães and Leal [67] developed new indexes from statistical data collected from Eurostat databases, concerning climate (HDD), median disposable income (MDI), and energy prices (EP). The equations proposed are simple, mainly regarding the establishment of rankings between different countries across Europe, with the goal of identifying patterns that may help understand heating energy’s actual consumptions. The first index proposed was the “Heating Relevance” (HR), relating climate with energy costs, meaning the HDD parameter with EP parameter, and defined by:
where HDD is the Heating Degree Days (°C.d), considering Eurostat data 2009 [69], EP is the Energy price (€/kWh), that is, the simple electricity and natural gas prices average, considering Eurostat data from 2015 [69]. “Heating Relevance” concerns the importance of heating consumption for the definition of national policies. This index increases with winter severity, which determines the actual national needs, and with heating energy costs, which determine the economic context to afford those consumptions.
Secondly, the authors evaluated the “Heating Effort Rate” (HER), which normalizes HR by income, and the index was defined by:
where MDI is the “Median disposable income”, (€/year). “Heating Effort Rate” measures the effort to heat, which is higher as the household average income decreases.
Finally, the “Lack of motivation to heat” (LMH) index was proposed, i.e., the increases with energy prices and decreases with both income and climate severity. This index is given by:
The results for the new indexes are shown, in a ranking distribution, in Figure 8. Not surprisingly, Portugal presents the highest value of LMH, followed by Romania and Greece. As it was mentioned in previous topics, Portugal has some of the lowest HDD, high EP, and low MDI. This way, conditions are met to justify Portuguese low energy consumption for heating, not only because of its poor economic context but also because it has a more moderate climate. Other added factors help reinforce this conclusion, such as the cultural background and habits in southern Europe, and Portugal in particular, assuming adaptive strategies, such as opening the windows, using blankets, clothing adjustment, and hot drinks [67,87]; a traditional use of poorer construction techniques and backward thermal regulations with mandatory insulation measures, among others [58].
5. Discussion
The improvement of buildings’ energy efficiency is empirically connected to indoor thermal comfort, however, such a relationship is complex and involves social and economic factors, not only at the household level, but at the national or even international context, as recently shown by the pandemic situation and, more recently, the war situation. Portugal and other European countries are increasingly dependent on electric power, which raises concerns about the energy price increase pattern due to its impact on the economy. Achieving the environmental commitment between energy needs, energy consumption, and indoor thermal comfort, in Portugal and other Member states, is the regulator’s responsibility and of each one of us, in our own homes.
EU citizens’ energy consumption at home remained stable, with households accounting for about a quarter of final energy consumption. People use energy at home for heating, cooling, cooking, lighting, sanitary purposes, and appliances. The level of household energy consumption mainly depends on outdoor temperatures, energy performance of buildings, use and efficiency of electrical appliances, and the behaviour and economic status of inhabitants (for example, their desired or affordable level of thermal comfort, frequency of clothes washing, use of TV-sets, games, and lighting preferences).
Household energy consumption appears to have stagnated over the past five years. In 2020, the average household energy consumption was 555 kg of oil equivalent (kgoe) per EU inhabitant, which is just about 0.5% more than in 2015. When viewed over the longer term, efficiency improvements, in particular in space heating, seem to have balanced the effect of population growth and increases in the number and size of dwellings. Since 2005, energy consumption per EU inhabitant has fallen by 9.3%, with a slight downward trend in total household energy consumption offsetting a 2.8% or 12.0 million increase in the population over the same period [88].
A building designed for residential purposes is a place for rest and family interaction, being of great importance for its users, both socially and affectively, such as: sleeping/resting; preparing, serving, and consuming food, taking care of personal hygiene; cleaning and tidying; managing family or group budgets; handling clothes and crockery; raising and educating children; caring for the sick; exchange of affection; socialising and meeting; being/retrieving; playing and working.
Therefore, given the variety of activities that can be developed in buildings for housing, aiming at the well-being of their users for the fulfilment of their daily tasks and, considering, for the full daily work, the high degree of importance of moments of rest in suitable for resting in suitable environments, the search for good levels of environmental comfort inside homes should become an essential item to be considered in the design solutions adopted for such buildings, either new or renovated.
New or refurbished buildings have completely different needs, and the problem may persist if the respective installed equipment is not appropriate. It is fundamental that the owner understands that they should resort to specialized entities, which can firstly audit the building or dwelling, identifying pathologies and proposing solutions that suit the needs, protecting it in a certain way.
Furthermore, it should be possible to evaluate each process concerning each family and have a set of measures, in which the right entities would do the survey, analysis, implementation, supervision, and follow-up, according to the type/need of each household, in order to protect the project.
6. Conclusions
Thermal comfort has been identified since the dawn of humanity, when man, still without recognized industrial or intellectual resources, through his intuition and practical experience, used caves to protect himself from bad weather and to have the sensations of discomfort caused by the climate.
This work analyses and discusses the factors affecting indoor thermal comfort, the inability to keep the home adequately warm in winter and cool in summer, and the risk of poverty or social exclusion in the European context, namely in Portugal. Moreover, the current work integrates the indoor thermal comfort evolution and the current situation in Portugal in the EU context through different thermal comfort indicators being linked with the other statistics data, which may impact the indoor thermal comfort.
This literature review showed that there are significant differences between regulation assumptions for energy (and especially heating) consumption and the actual heating patterns inside dwellings in several European countries. These differences occur with a higher expression in the Mediterranean and other countries vulnerable to energy poverty, with Portugal being a paradigmatic case study. This means that many energy-related policies may be inaccurate when placing theoretical consumption as the starting point. First, the payback periods for the retrofitting investment measures proposed on the EPCs are unrealistic, misleading the owners. On the other hand, the national and European policy targets for reducing energy consumption, based on theoretical consumption, are also unrealistic for these countries. Furthermore, the analysis of different works presented in the literature suggests that there is not any obvious relation between the energy label and the total annual discomfort; this means the energy label approach is not enough to quantify the real thermal performance, for mild climates, with low heating practices. It is very important to keep in mind that, for these climates, intermittent heating is the most common practice.
The concept of energy poverty among the EU-28 has been explored and analysed by presenting and proposing new indexes based on different statistical types of data, such as income, energy prices, and climate (Heating Degree Days). The establishment of European rankings for these indexes confirms the vulnerability of the Mediterranean region, especially Portugal, with the highest value for the “Lack of motivation to heat”. Actual energy heating household consumptions attest to these conclusions.
Author Contributions
All the authors contributed to the development, analysis, writing, and revision of the paper: conceptualisation, J.D. and A.M.M.; methodology, J.D. and A.M.M.; formal analysis, J.D. and A.M.M.; investigation, J.D. and A.M.M.; writing—original draft preparation, A.S.G., A.M.M. and J.D.; writing—review and editing, A.M.M. and J.D.; visualisation A.S.G., A.M.M. and J.D.; supervision, A.M.M. and J.D. All authors have read and agreed to the published version of the manuscript.
Funding
This work is a result of the project “BlueWoodenHouse”, with the reference POCI-01-0247-FEDER-047157, co-funded by the European Regional Development Fund (ERDF) through the Operational Programme for Competitiveness and Internationalization (COMPETE 2020), under the Portugal 2020 Partnership Agreement. In addition, this work was financially supported by: Base Funding—UIDB/04708/2020 and Programmatic Funding—UIDP/04708/2020 of the CONSTRUCT—Instituto de I&D em Estruturas e Construções—funded by national funds through the FCT/MCTES (PIDDAC); and by FCT—Fundação para a Ciência e a Tecnologia through the individual Scientific Employment Stimulus 2020.00828.CEECIND and 2021.01765.CEECIND.
Institutional Review Board Statement
Not applicable.
Informed Consent Statement
Not applicable.
Data Availability Statement
Not applicable.
Conflicts of Interest
The authors declare no conflict of interest.
References
- Xing, Y.; Hewitt, N.; Griffiths, P. Zero carbon buildings refurbishment—A hierarchical pathway. Renew. Sustain. Energy Rev. 2011, 15, 3229–3236. [Google Scholar] [CrossRef]
- Ibn-Mohammed, T.; Greenough, R.; Taylor, S.; Ozawa-Meida, L.; Acquaye, A. Operational vs. embodied emissions in buildings—A review of current trends. Energy Build. 2013, 66, 232–245. [Google Scholar] [CrossRef]
- Lechtenböhmer, S.; Schüring, A. The potential for large-scale savings from insulating residential buildings in the EU. Energy Effic. 2010, 4, 257–270. [Google Scholar] [CrossRef]
- Cabeza, L.F.; Rincón, L.; Vilariño, V.; Pérez, C.; Castell, A. Life cycle assessment (LCA) and life cycle energy analysis (LCEA) of buildings and the building sector: A review. Renew. Sustain. Energy Rev. 2014, 20, 394–416. [Google Scholar] [CrossRef]
- International Energy Agency. Transition to Sustainable Buildings—Strategies and Opportunities to 2050; International Energy Agency: Paris, France, 2013. Available online: https://www.iea.org/reports/transition-to-sustainable-buildings (accessed on 15 January 2022).
- International Energy Agency. Clean Energy Progress Report; International Energy Agency: Paris, France, 2011. Available online: https://www.iea.org/news/iea-releases-first-clean-energy-progress-report (accessed on 15 January 2022).
- International Energy Agency. World Energy Outlook; International Energy Agency: Paris, France, 2013. Available online: https://webstore.iea.org/world-energy-outlook-2013 (accessed on 15 January 2022).
- BPIE. Europe’s Buildings Under the Microscope—A Country-by-Country Review of the Energy Performance of Buildings; BPIE-Buildings Performance Institute Europe: Brussels, Belgium, 2015; Available online: http://bpie.eu/wp-content/uploads/2015/10/HR_EU_B_under_microscope_study.pdf (accessed on 15 January 2022).
- IRENA. Global Energy Transformation: A Roadmap to 2050. 2018. Available online: https://www.irena.org/-/ (accessed on 15 January 2022).
- Yau, Y.H.; Hasbi, S. A review of climate change impacts on commercial buildings and their technical services in the tropics. Renew. Sustain. Energy Rev. 2013, 18, 430–441. [Google Scholar] [CrossRef]
- Kelly, G. Sustainability at home: Policy measures for energy-efficient appliances. Renew. Sustain. Energy Rev. 2012, 68, 6851–6860. [Google Scholar] [CrossRef]
- Robert, A.; Kummert, M. Designing net-zero energy buildings for the future climate, not for the past. Build. Environ. 2012, 55, 150–158. [Google Scholar] [CrossRef]
- Huaman, R.N.E.; Jun, T.X. Energy related CO2 emissions and the progress on CCS projects: A review. Renew. Sustain. Energy Rev. 2014, 31, 368–385. [Google Scholar] [CrossRef]
- Kesicki, F. Costs and potentials of reducing CO2 emissions in the UK domestic stock from a systems perspective. Energy Build. 2012, 51, 203–211. [Google Scholar] [CrossRef]
- Matos, A.M.; Delgado, J.M.P.Q.; Guimarães, A.S. Energy-Efficiency Passive Strategies for Mediterranean Climate: An Overview. Energies 2022, 15, 2572. [Google Scholar] [CrossRef]
- Joudi, A.; Svedung, H.; Cehlin, M.; Ronnelid, M. Reflective coatings for interior and exterior of buildings and improving thermal performance. Appl. Energy 2013, 103, 562–570. [Google Scholar] [CrossRef]
- Ascione, F.; Bianco, N.; de’ Rossi, F.; Turni, G.; Vanoli, G.P. Green roofs in European climates. Are effective solutions for the energy savings in air-conditioning. Appl. Energy 2013, 104, 845–859. [Google Scholar] [CrossRef]
- Ochoa, C.E.; Aries, M.B.C.; van Loenen, E.J.; Hensen, J.L.M. Considerations on design optimization criteria for windows providing low energy consumption and high visual comfort. Appl. Energy 2012, 95, 238–245. [Google Scholar] [CrossRef]
- Manfren, M.; Aste, N.; Moshksar, R. Calibration and uncertainty analysis for computer models—A meta-model based approach for integrated building energy simulation. Appl. Energy 2013, 103, 627–641. [Google Scholar] [CrossRef]
- Asif, M.; Muneer, T.; Kelley, R. Life cycle assessment: A case study of a dwelling home in Scotland. Build. Environ. 2007, 42, 1391–1394. [Google Scholar] [CrossRef]
- Popescu, D.; Nienert, S.; Schutzenhofer, C.; Boazu, R. Impact of energy efficiency on the economic value of buildings. Appl. Energy 2012, 89, 454–463. [Google Scholar] [CrossRef]
- Huang, Y.; Niu, J.L.; Chung, T.M. Study on the performance of energy-efficient retrofitting measures on commercial building external walls in cooling-dominated cities. Appl. Energy 2013, 103, 97–108. [Google Scholar] [CrossRef]
- Oldewurtel, F.; Sturzengger, D.; Morari, M. Importance of occupancy information for building climate control. Appl. Energy 2013, 101, 521–532. [Google Scholar] [CrossRef]
- Goyal, S.; Ingley, H.A.; Barooah, P. Occupancy-based zone-climate control for energy-efficient buildings: Complexity vs. performance. Appl. Energy 2013, 106, 209–221. [Google Scholar] [CrossRef]
- ADENE Portuguese Energy Agency. Available online: https://www.adene.pt (accessed on 15 January 2022).
- Wright, K.P., Jr.; Hull, J.T.; Czeisler, C.A. Relationship between alertness, performance, and body temperature in humans. Am. J. Physiol. Regul. Integr. Comp. Physiol. 2002, 283, R1370–R1377. [Google Scholar] [CrossRef]
- ISO 7730; Ergonomics of the Thermal Environment—Analytical Determination and Interpretation of Thermal Comfort Using Calculation of the PMV and PPD Indices and Local Thermal Comfort Criteria. ISO: London, UK, 2005.
- Ozarisoy, B.; Altan, H. Regression forecasting of ‘neutral’ adaptive thermal comfort: A field study investigation in the south-eastern Mediterranean climate of Cyprus. Build. Environ. 2021, 202, 108013. [Google Scholar] [CrossRef]
- Quercus. Os Portugueses Vivem com Frio Dentro de Suas Casas. Available online: https://quercus.pt/2021/03/03/os-portugueses-vivem-com-frio-dentro-de-suas-casas/ (accessed on 12 August 2022). (In Portuguese).
- Vosviewer. Available online: https://www.vosviewer.com (accessed on 12 August 2022).
- ASHRAE Global Comfort Database, II. Available online: https://www.comfortdatabase.com (accessed on 5 June 2022).
- Epstein, Y.; Moran, D.S. Thermal comfort and the heat stress indices. Ind. Health 2006, 44, 388–398. [Google Scholar] [CrossRef]
- Carlucci, S.; Pagliano, L.; Sangalli, A. Statistical analysis of the ranking capability of long-term thermal discomfort indices and their adoption in optimisation processes to support building design. Build. Environ. 2014, 75, 114–131. [Google Scholar] [CrossRef]
- Carlucci, S.; Pagliano, L. A review of indices for the long-term evaluation of the general thermal comfort conditions in buildings. Energy Build. 2012, 53, 194–205. [Google Scholar] [CrossRef]
- Macpherson, R.K. The Assessment of the Thermal Environment. A Review. Br. J. Ind. Med. 1962, 19, 151–164. [Google Scholar] [CrossRef] [PubMed]
- EN 16798-1; Energy Performance of Buildings—Ventilation for Buildings—Part 1: Indoor Environmental Input Parameters for Design and Assessment of Energy Performance of Buildings. European Committee for Standardization: Brussel, Belgium, 2019.
- EN 16798-2; Guideline for Using Indoor Environmental Input Parameters for the Design and Assessment of Energy Performance of Buildings. European Committee for Standardization: Brussel, Belgium, 2019.
- Nicol, F.; Humphreys, M.; Roaf, S. Adaptive Thermal Comfort: Principles and Practice; Routledge: London, UK, 2012; pp. 1–175. [Google Scholar]
- Borgeson, S.; Brager, G. Comfort standards and variations in exceedance for mixed-mode buildings. Build. Res. Inf. 2011, 39, 118–133. [Google Scholar] [CrossRef]
- ASHRAE 55; Thermal Environmental Conditions for Human Occupancy. American Society of Heating Refrigeration and Air Conditioning Engineers Inc.: Atlanta, GA, USA, 2020.
- Carlucci, S. Gap Analysis of the Long-Term Discomfort Indices and a Harmonized Calculation Framework. In Thermal Comfort Assessment of Buildings; Springer: Berlin/Heidelberg, Germany, 2013; pp. 57–79. [Google Scholar]
- Humphreys, M.A.; Nicol, J.F. Understanding the adaptive approach to thermal comfort. ASHRAE Trans. 1998, 104, 991–1004. [Google Scholar]
- Fanger, P.O. Thermal Comfort. Analysis and Applications in Environmental Engineering; MacGrw-Hill: Copenhagen, Denmark; New York, NY, USA, 1970. [Google Scholar]
- Fountain, M.E.; Arens, E. Air movement and thermal comfort. ASHRAE J. 1993, 35, 26–29. [Google Scholar]
- Gong, N.; Tham, K.W.; Melikov, A.; Wyon, D. The Acceptable Air Velocity Range for Local Air Movement in The Tropics. Hvac&r Res. 2006, 12, 1065–1076. [Google Scholar]
- de Dear, R.J.; Brager, G.S. Developing an Adaptive Model of Thermal Comfort and Preference. ASHRAE Trans. 1998, 104, 145–167. [Google Scholar]
- Matos, A.M.; Delgado, J.M.P.Q.; Guimarães, A.S. Linking Energy Poverty with Thermal Building Regulations and Energy Efficiency Policies in Portugal. Energies 2022, 15, 329. [Google Scholar] [CrossRef]
- ISO 7726; Ergonomics of the Thermal Environment—Instruments for Measuring Physical Quantities. ISO: London, UK, 1998.
- ISO 8996; Ergonomics of the Thermal Environment—Determination of Metabolic Rate. ISO: London, UK, 2021.
- ISO 10551; Ergonomics of the Physical Environment—Subjective Judgement Scales for Assessing Physical Environments. ISO: London, UK, 2019.
- ISO 9920; Ergonomics of the Thermal Environment—Estimation of Thermal Insulation and Water Vapour Resistance of a Clothing Ensemble. ISO: London, UK, 2007.
- EN 15251; Indoor environmental input parameters for design and assessment of energy performance of buildings addressing indoor air quality, thermal environment, lighting and acoustics. European Committee for Standardization: Brussel, Belgium, 2007.
- Peel, M.C.; Finlayson, B.L.; McMahon, T.A. Updated world map of the Koppen-Geiger climate classification. Hydrol. Earth Syst. Sci. 2007, 11, 1633–1644. [Google Scholar] [CrossRef]
- Eurostat. Heating Degree Days in Europe Countries. 2018. Available online: http://appsso.eurostat.ec.europa.eu/nui/setupDownloads.do (accessed on 15 January 2022).
- EC-JRC. Global Radiation—Horizontal. Photovoltaic Geographical Information System—Interactive Maps 2017; Europena Comission (Joint Research Centre): Ispra, Italy, 2017. [Google Scholar]
- IPMA. Climatological Normais (1981–2000). 2016. Available online: https://www.ipma.pt/pt/oclima/normais.clima/1981-2010/014/ (accessed on 15 January 2022).
- DL 251-2015; Sistema de Certificação Energética dos Edifícios—Regulamento de Desempenho Energético dos Edifícios de Habitação. Regulamento de Desempenho Energético dos Edifícios de Comércio e Serviços. Diário da República: Porto, Porugal, 2015. (In Portuguese)
- Silva, P.C.P.; Silva, S.M.; Almeida, M.G.; Mesquita, V.; Bragança, L. Portuguese building stock indoor environmental quality “In-Situ” assessment. In Proceedings of the 3rd International Conference Palenc 2010, Passive and Low Energy Cooling for the Built Environment, Rhodes Island, Greece, 29 September–1 October 2010. [Google Scholar]
- Santamouris, M.; Alevizos, S.M.; Aslanoglou, L.; Mantzios, D.; Milonas, P.; Sarelli, I.; Karatasou, S.; Cartalis, K.; Paravantis, J.A. Freezing the poor—Indoor environmental quality in low and very low income households during the winter period in Athens. Energy Build. 2014, 70, 61–70. [Google Scholar] [CrossRef]
- Terés-Zubiaga, J.; Martín, K.; Erkoreka, A.; Sala, J.M. Field assessment of thermal behaviour of social housing apartments in Bilbao, Northern Spain. Energy Build. 2013, 67, 118–135. [Google Scholar] [CrossRef]
- Kane, T.; Firth, S.K.; Lomas, K.J. How are UK homes heated? A city-wide, socio-technical survey and implications for energy modelling. Energy Build. 2015, 86, 817–832. [Google Scholar] [CrossRef]
- Alber, J. Quality of Life in Europe: First European Quality of Life Survey—2003; Office for Official Publications in the European Communities: Luxembourg, 2004. [Google Scholar]
- INE/DGEG. Household Energy Consumption National Survey 2010; Instituto Nacional de Estatística, I.P. Direção Geral de Energia e Geologia: Lisboa, Portugal, 2010. [Google Scholar]
- Chvatal, K.M.S.; Corvacho, H. The impact of increasing the building envelope insulation upon the risk of overheating in summer and an increased energy consumption. J. Build. Perform. Simul. 2009, 2, 267–282. [Google Scholar] [CrossRef]
- Hens, H. Thermal Insulation, a Blessing Yes, But…; ISBP: Porto, Portugal, 2015. [Google Scholar]
- Tigchelaar, C.; Daniëls, B.; Menkveld, M. Obligations in the Existing Housing Stock: Who Pays the Bill? ECN: Petten, The Netherlands, 2011. [Google Scholar]
- Magalhães, S.M.C.; Leal, V.M.S. Characterisation of thermal performance and nominal heating gap of the residential building stock using the EPBD-derived databases: The case of Portugal mainland. Energy Build. 2014, 70, 167–179. [Google Scholar] [CrossRef]
- DL 80/2006; Regulamento das Características de Comportamento Térmico dos Edifícios (RCCTE). Diário da República: Porto, Portugal, 2006. (In Portuguese)
- Hens, H.; Parijs, W.; Deurinck, M. Energy consumption for heating and rebound effects. Energy Build. 2010, 42, 105–110. [Google Scholar] [CrossRef]
- Santin, O.G. Actual energy consumption in dwellings: The effect of energy performance regulations and occupant behaviour. In Housing-2010; OTB Research Institute, IOS Press: Amsterdam, The Netherlands, 2010. [Google Scholar]
- Sorrell, S. The Rebound Effect: An Assessment of the Evidence for Economy-Wide Energy Savings from Improved Energy Efficiency; UK Energy Research Centre: London, UK, 2007. [Google Scholar]
- Lapillonne, B.; Pollier, K.; Samci, N. Energy Efficiency Trends for Households in the EU, Odyssee Project; Enerdata, Ed.; Intelligent Energy Europe: Loughborough, UK, 2014. [Google Scholar]
- Gaglia, A.G.; Dialynas, E.N.; Argiriou, A.A.; Kostopoulou, E.; Tsiamitros, D.; Stimoniaris, D.; Laskos, K.M. Energy performance of European residential buildings: Energy use, technical and environmental characteristics of the Greek residential sector—Energy conservation and CO2 reduction. Energy Build. 2019, 183, 86–104. [Google Scholar] [CrossRef]
- Majcen, D.; Itard, L.C.M.; Visscher, H. Theoretical vs. actual energy consumption of labelled dwellings in the Netherlands: Discrepancies and policy implications. Energy Policy 2013, 54, 125–136. [Google Scholar] [CrossRef]
- Galvin, R. Estimating broad-brush rebound effects for household energy consumption in the EU 28 countries and Norway: Some policy implications of Odyssee data. Energy Policy 2014, 73, 323–332. [Google Scholar] [CrossRef]
- Sunikka-Blank, M.; Galvin, R. Introducing the prebound effect: The gap between performance and actual energy consumption. Build. Res. Inf. 2012, 40, 260–273. [Google Scholar] [CrossRef]
- Greening, L.A.; Greene, D.L.; Difiglio, C. Energy efficiency and consumption—The rebound effect—A survey. Energy Policy 2000, 28, 389–401. [Google Scholar] [CrossRef]
- Curtis, J.; Pentecost, A. Household fuel expenditure and residential building energy efficiency ratings in Ireland. Energy Policy 2015, 76, 57–65. [Google Scholar] [CrossRef]
- Escandón, R.; Suárez, R.; Sendra, J.J. On the assessment of the energy performance and environmental behaviour of social housing stock for the adjustment between simulated and measured data: The case of mild winters in the Mediterranean climate of southern Europe. Energy Build. 2017, 152, 418–433. [Google Scholar] [CrossRef]
- Coimbra, J.; Almeida, M. Challenges and benefits of building sustainable cooperative housing. Build. Environ. 2013, 62, 9–17. [Google Scholar] [CrossRef]
- Fowler, T.; Southgate, R.J.; Waite, T.; Harrell, R.; Kovats, S.; Bone, A.; Doyle, Y.; Murray, V. Excess winter deaths in Europe: A multi-country descriptive analysis. Eur. J. Public Health 2014, 25, 339–345. [Google Scholar] [CrossRef]
- Eurostat. Energy Price Statistics EU-28. 2022. Available online: http://ec.europa.eu/eurostat/statistics-explained/index.php/Energy_price_statistics (accessed on 5 June 2022).
- Eurostat. Living Conditions in Europe—Housing. 2012. Available online: https://ec.europa.eu/eurostat/statistics-explained/index.php?title=Living_conditions_in_Europe_-_housing (accessed on 5 June 2022).
- Boardman, B. Fuel Poverty: From Cold Homes to Affordable Warmth; Pinter Pub Limited: London, UK, 1991. [Google Scholar]
- Bouzarovski, S. Energy Poverty in the EU: A Review of the Evidence. 2011. Available online: http://citeseerx.ist.psu.edu/viewdoc/download?doi=10.1.1.593.7020&rep=rep1&type=pdf (accessed on 5 June 2022).
- Healy, J.D. Excess winter mortality in Europe: A cross country analysis identifying key risk factors. J. Epidemiol. Community Health 2003, 57, 784–789. [Google Scholar] [CrossRef]
- Flores, J.A.D.M. The Investigation of Energy Efficiency Measures in the Traditional Buildings in Oporto World Heritage Site. Ph.D. Thesis, Oxford Brookes University—Faculty of Technology, Design and Environment School of Architecture, Oxford, UK, 2013. [Google Scholar]
- Eurostat. Sustainable Development in the European Union—Monitoring Report on Progress Towards the SDGs in an EU Context—2021 Edition. Available online: https://ec.europa.eu/eurostat/web/products-statistical-books/-/ks-03-21-096 (accessed on 5 June 2022).
Figure 1.
Example of climate chamber used in the University of Porto.

Figure 2.
(a) Heating Degree Days in Europe (2021) and (b) in Portugal regions (2021) (adapted from [54]).
Figure 2.
(a) Heating Degree Days in Europe (2021) and (b) in Portugal regions (2021) (adapted from [54]).

Figure 3.
(a) Global horizontal solar radiation annual sum (adapted from [55]), (b) average temperature across Europe (data source [56]).

Figure 4.
Number of EPC issued since 2010 distinguishing new, renovated, and existing dwellings [25].
Figure 4.
Number of EPC issued since 2010 distinguishing new, renovated, and existing dwellings [25].

Figure 5.
Cumulative frequency of nominal primary energy needs for new buildings (a) and existing buildings (b) buildings in Portugal [25].
Figure 5.
Cumulative frequency of nominal primary energy needs for new buildings (a) and existing buildings (b) buildings in Portugal [25].

Figure 6.
Nominal primary energy needs for the three Portuguese climatic zones in winter.

Figure 7.
(a) Electricity prices for household consumers (2021) and (b) Median Disposable Income, across Europe (adapted from [82,83]).

Figure 8.
“Lack of motivation to heat” (LMH) across Europe (data source [69]).
Figure 8.
“Lack of motivation to heat” (LMH) across Europe (data source [69]).


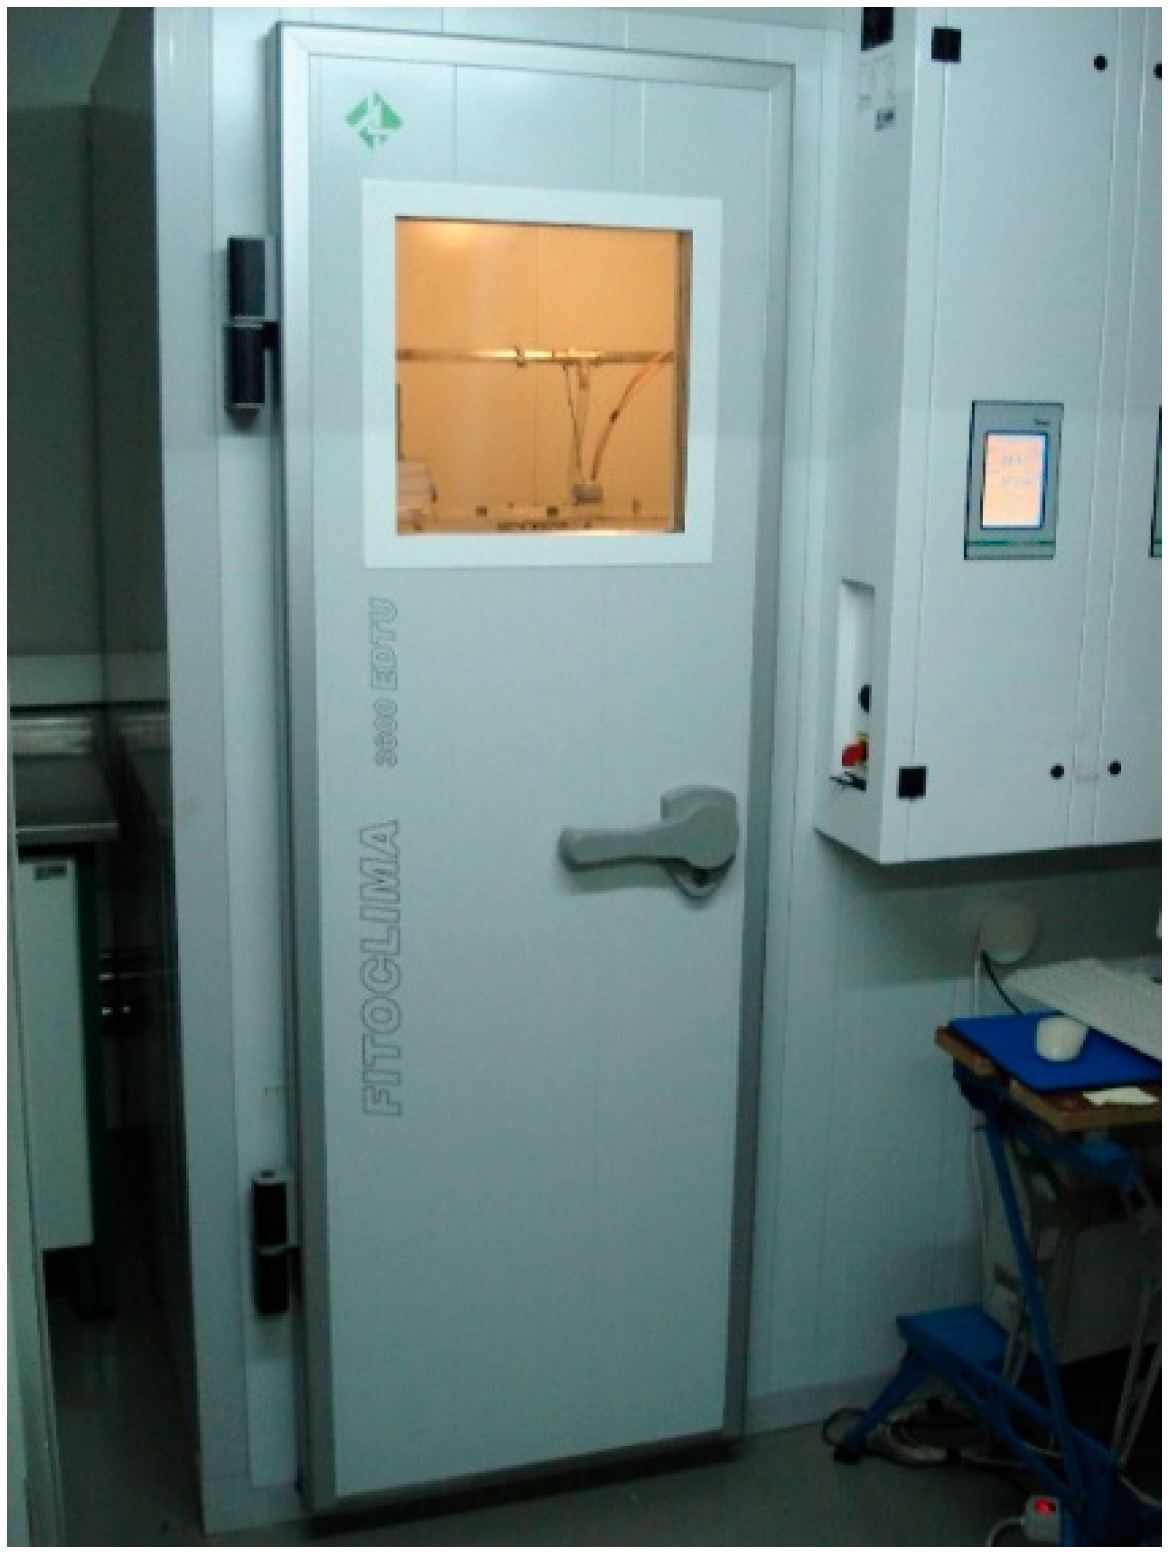
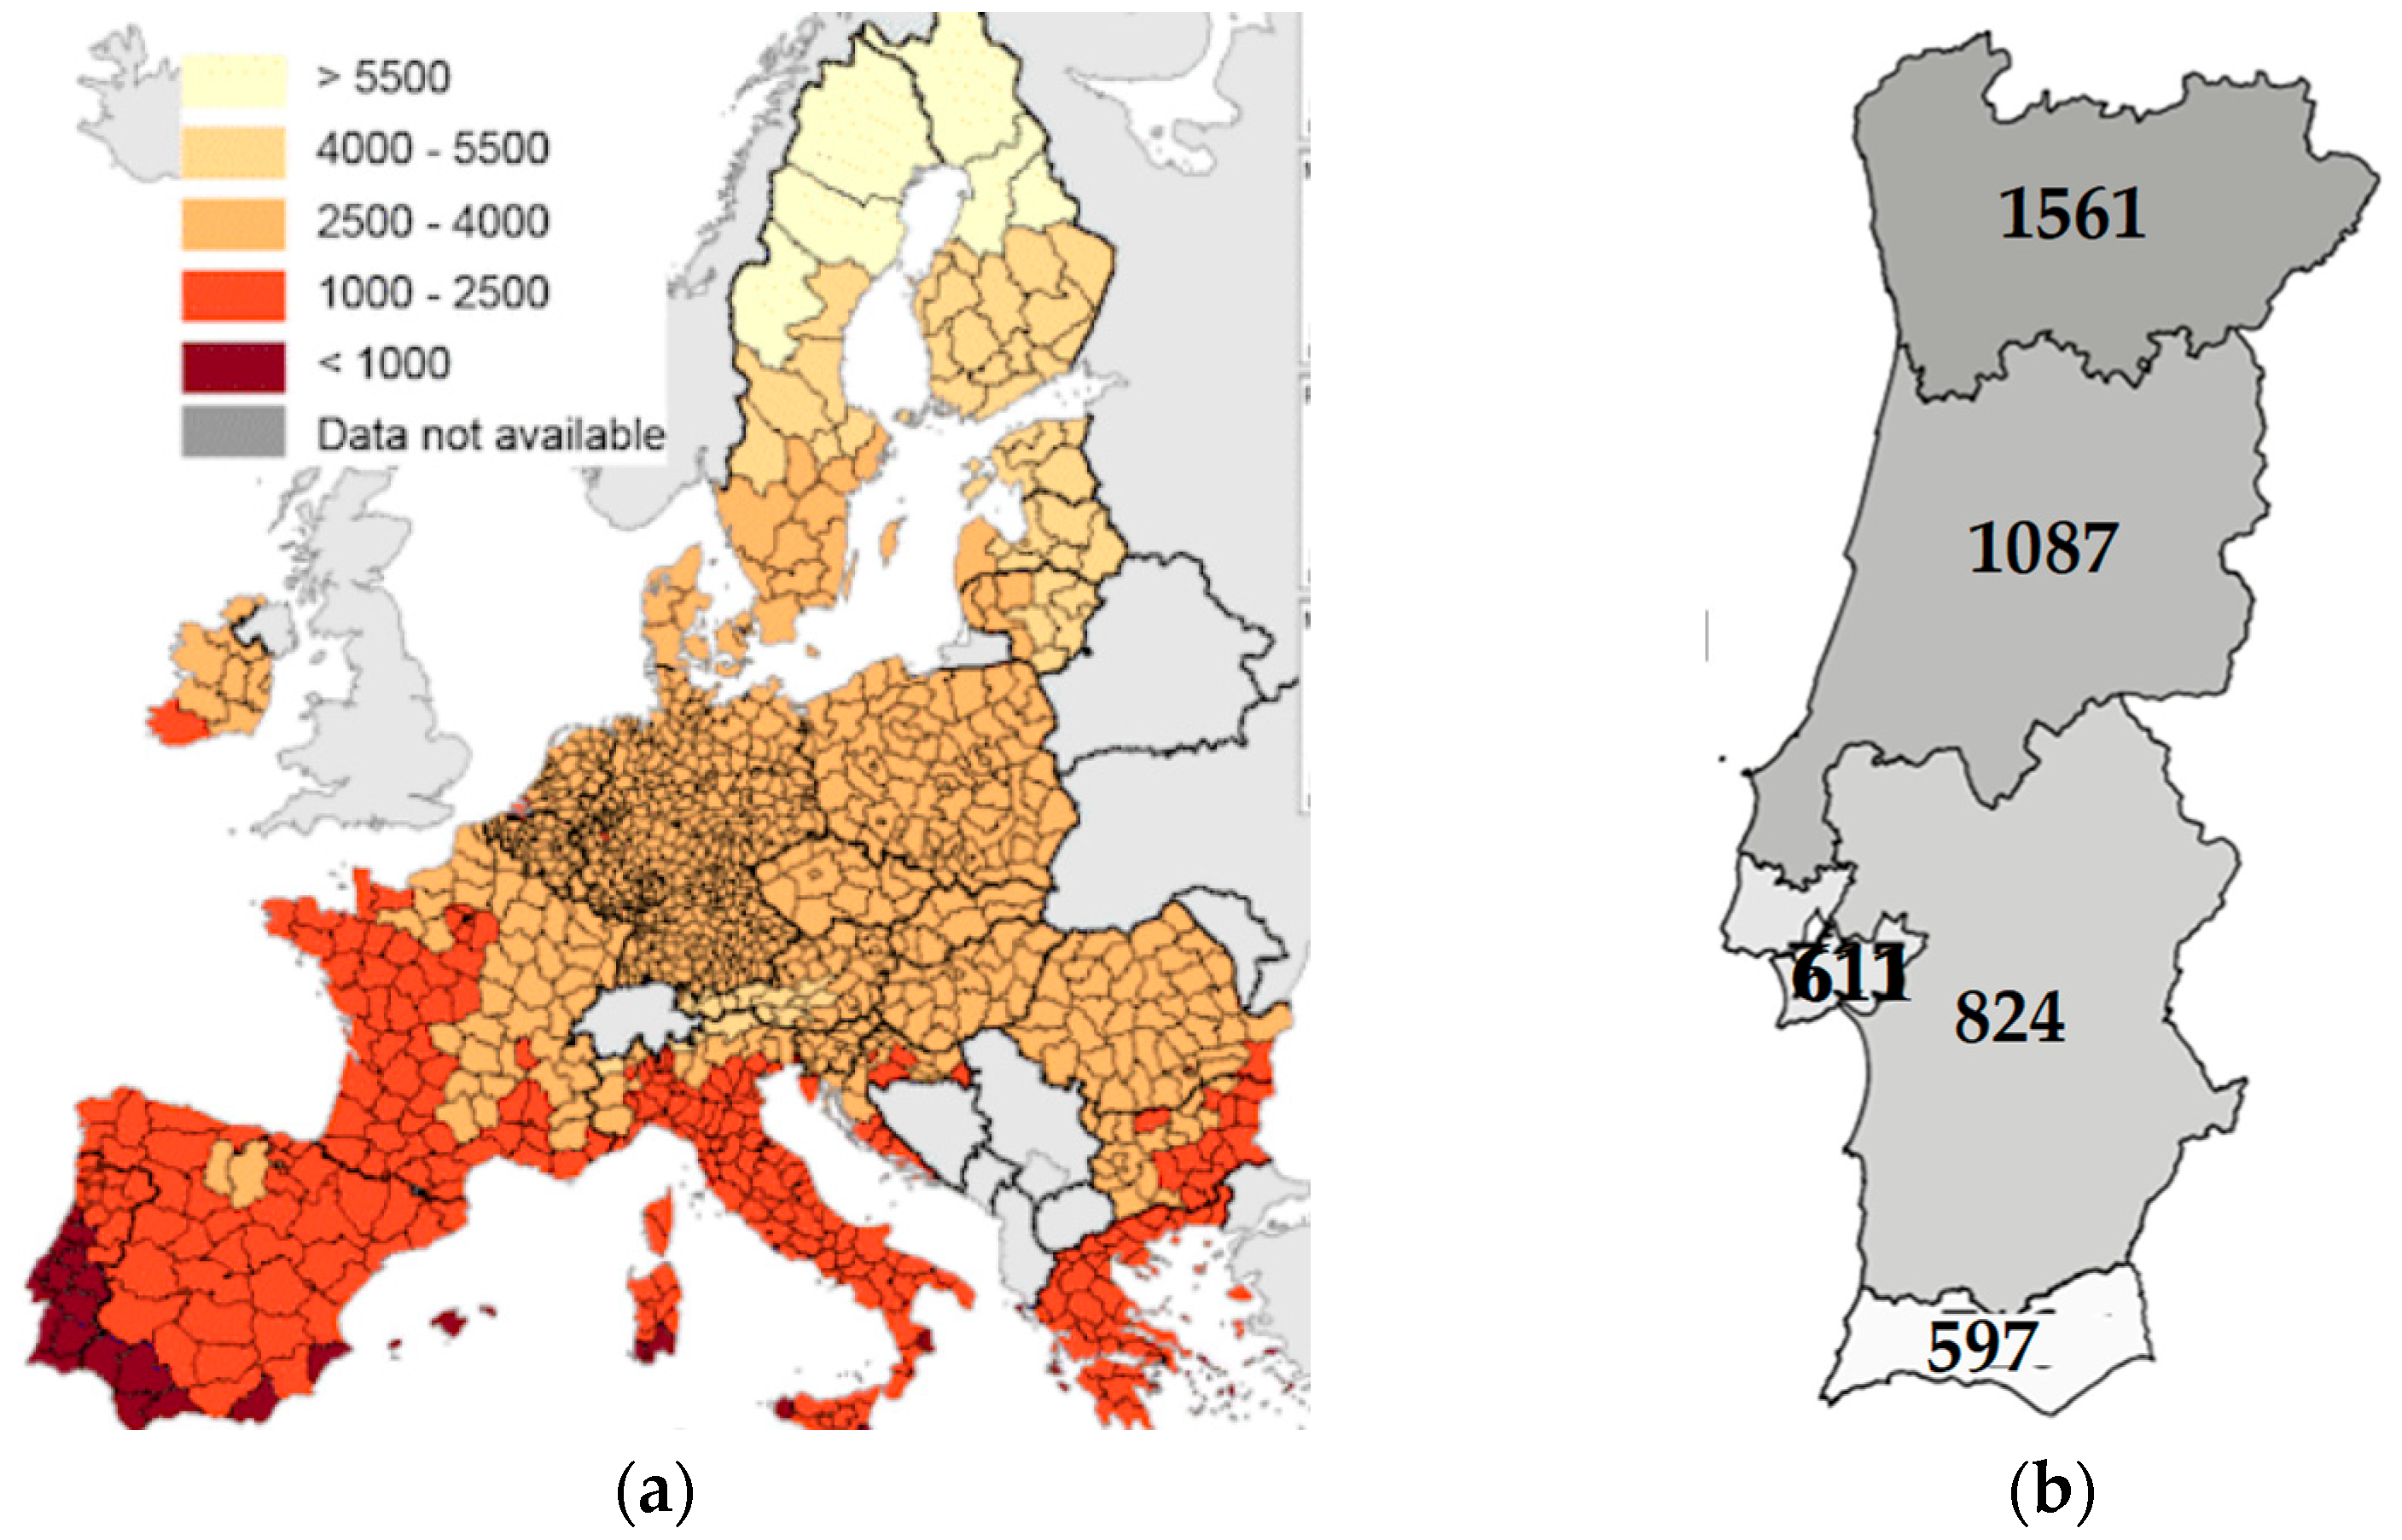
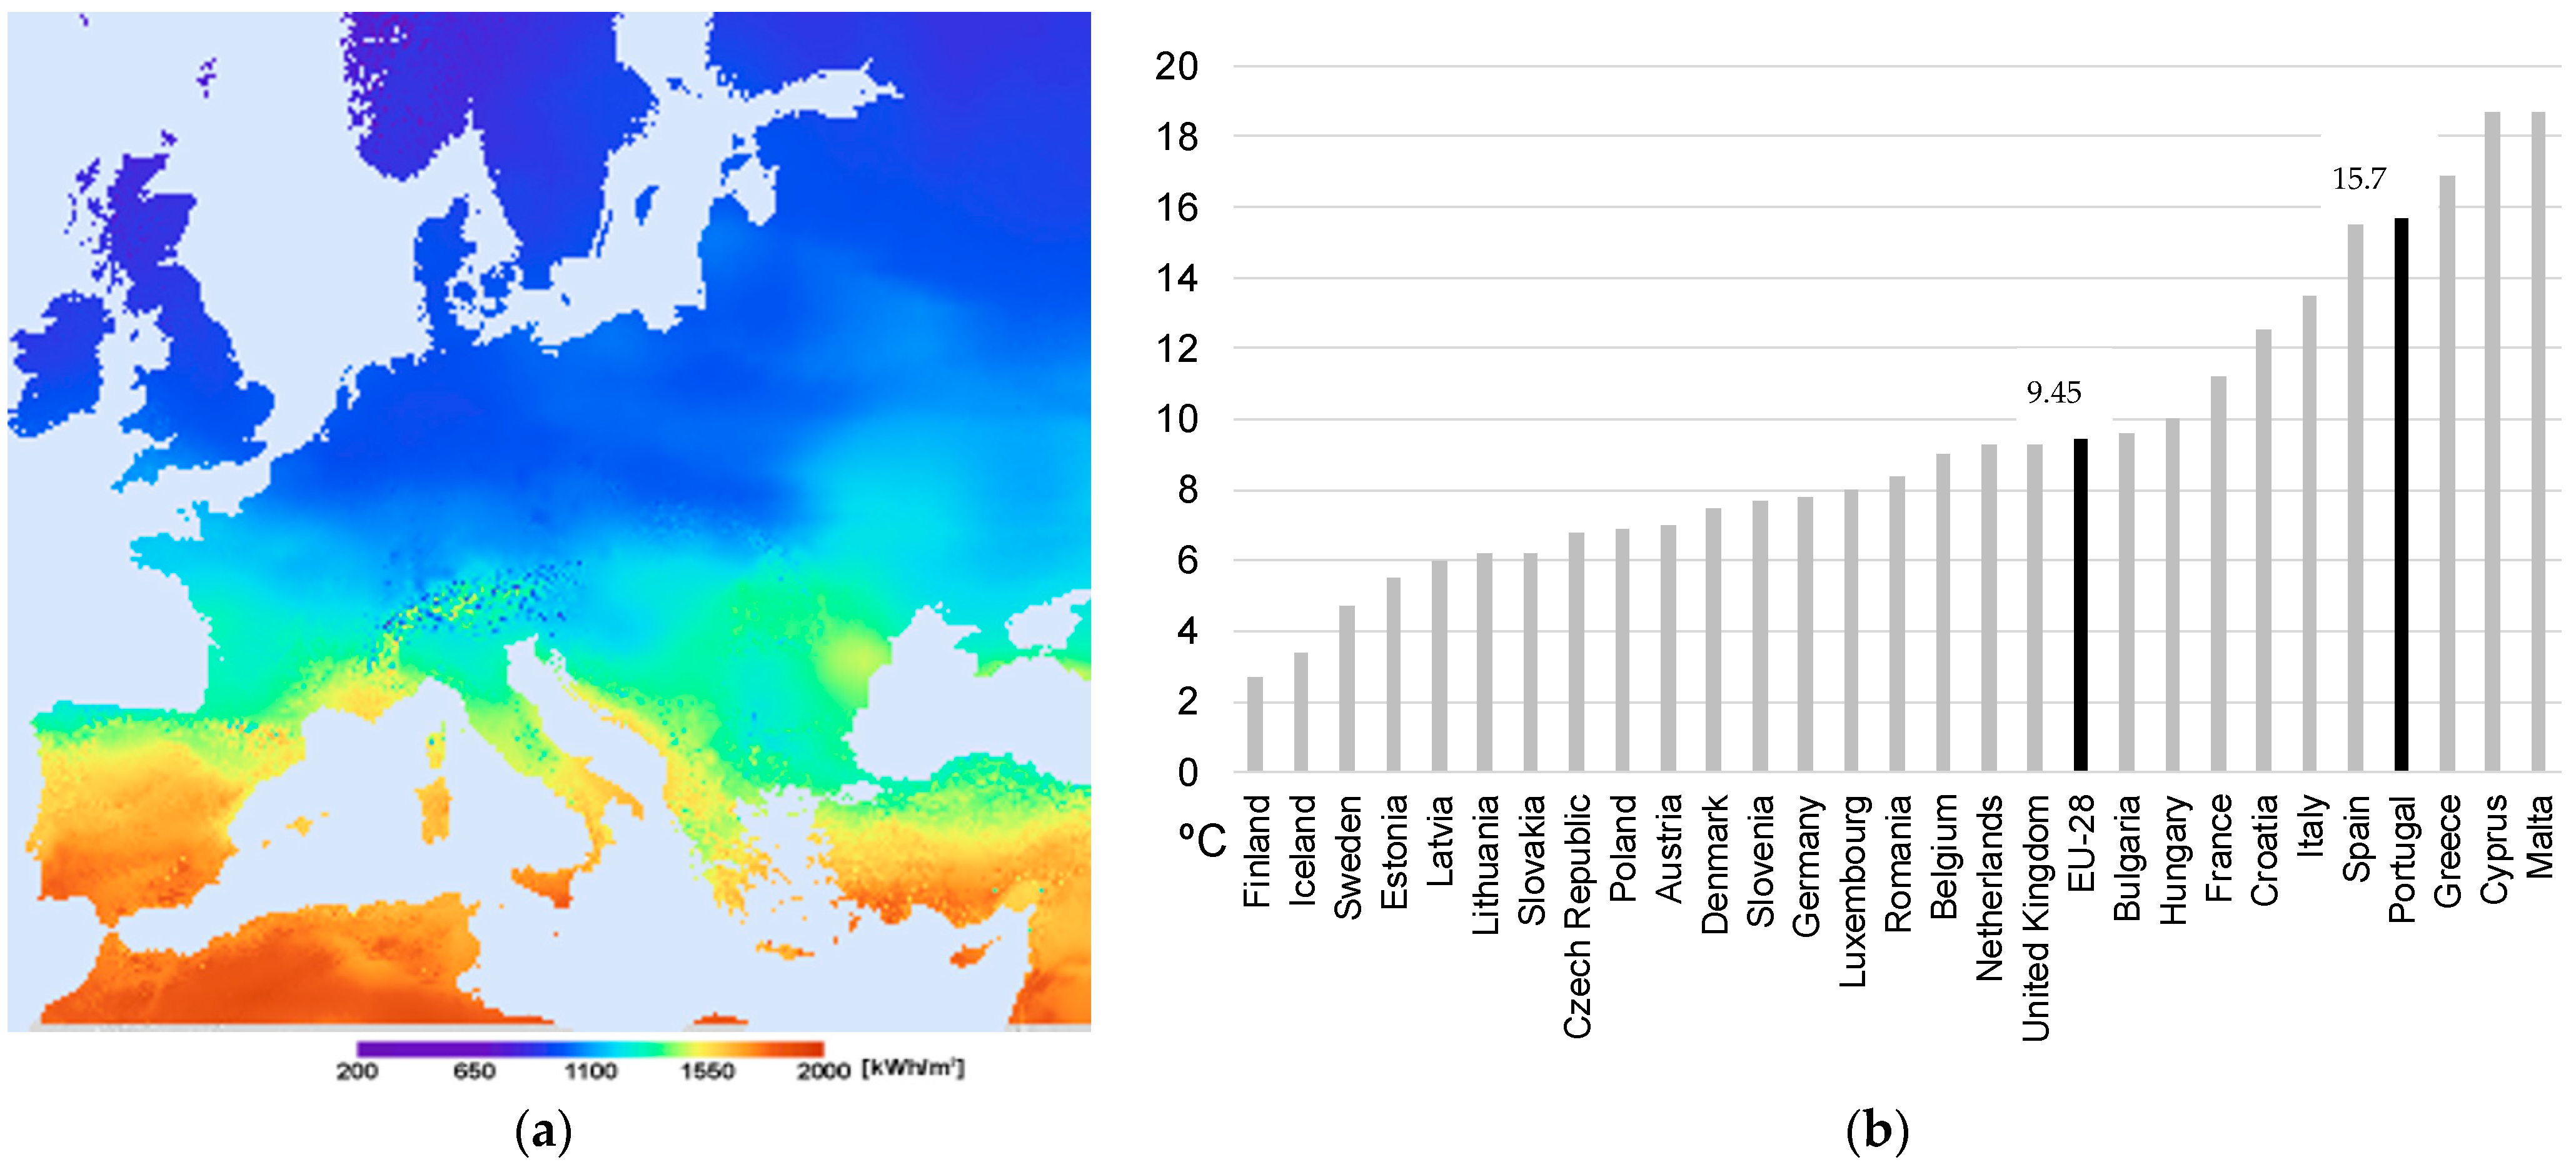
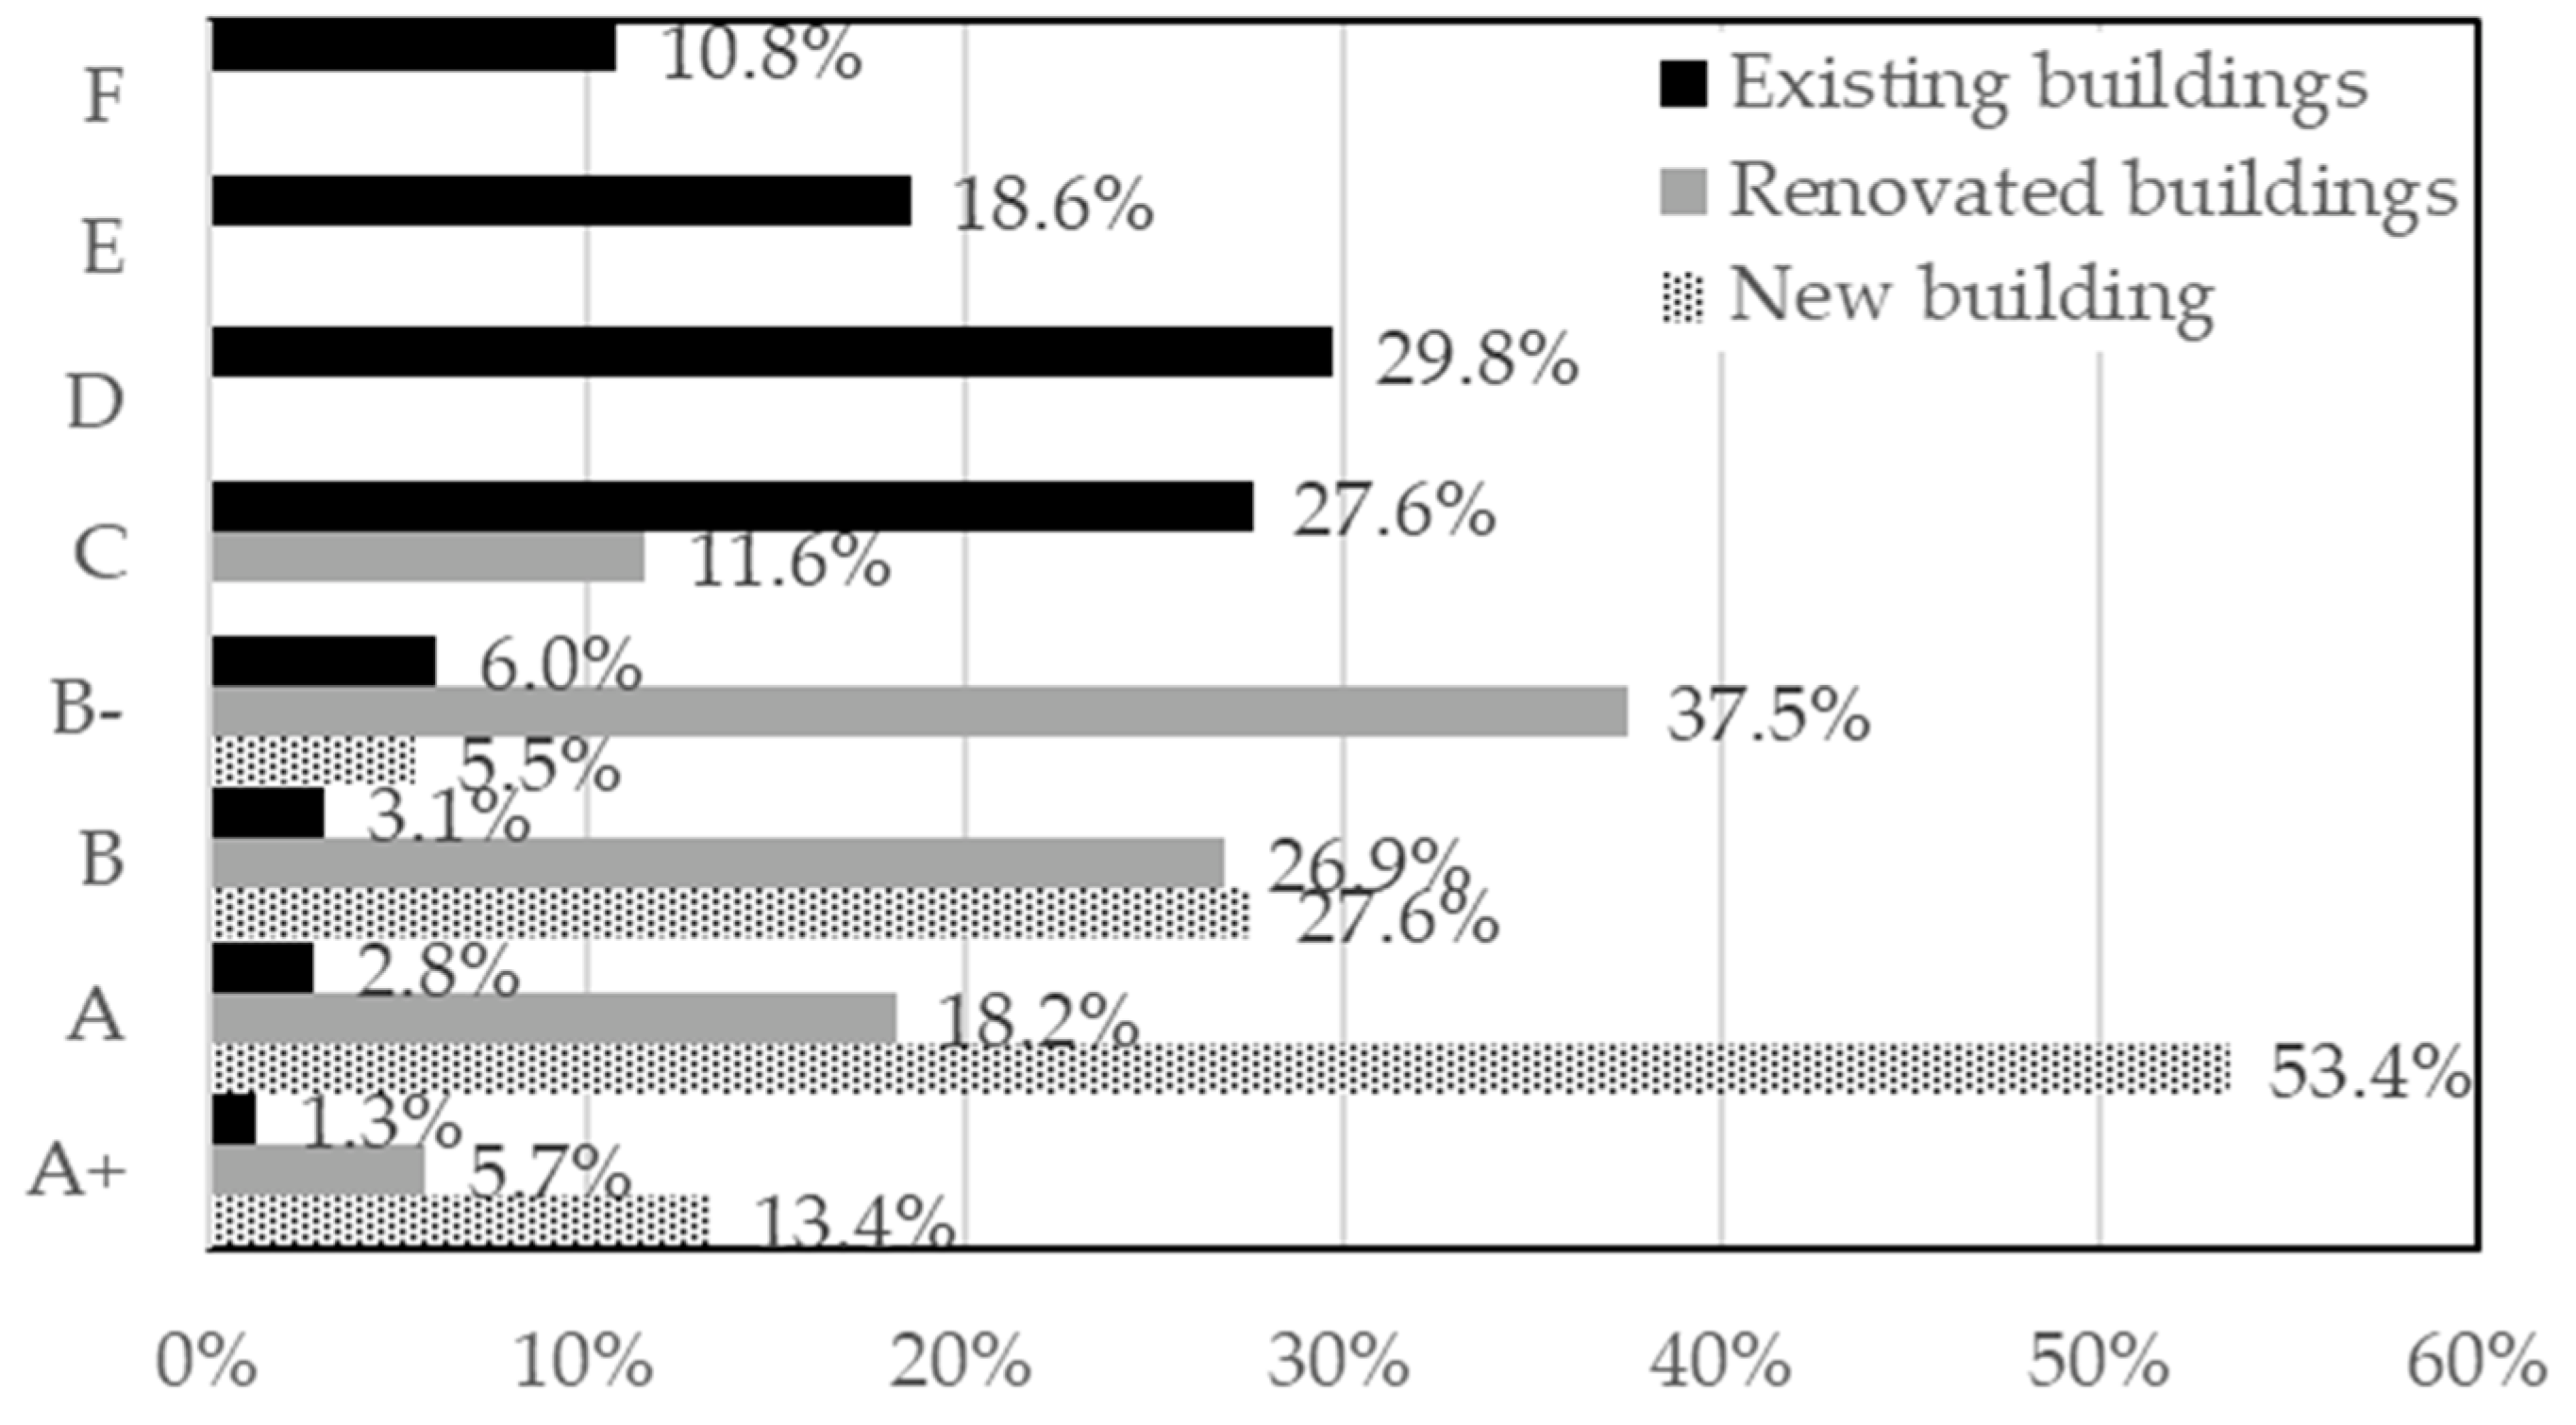
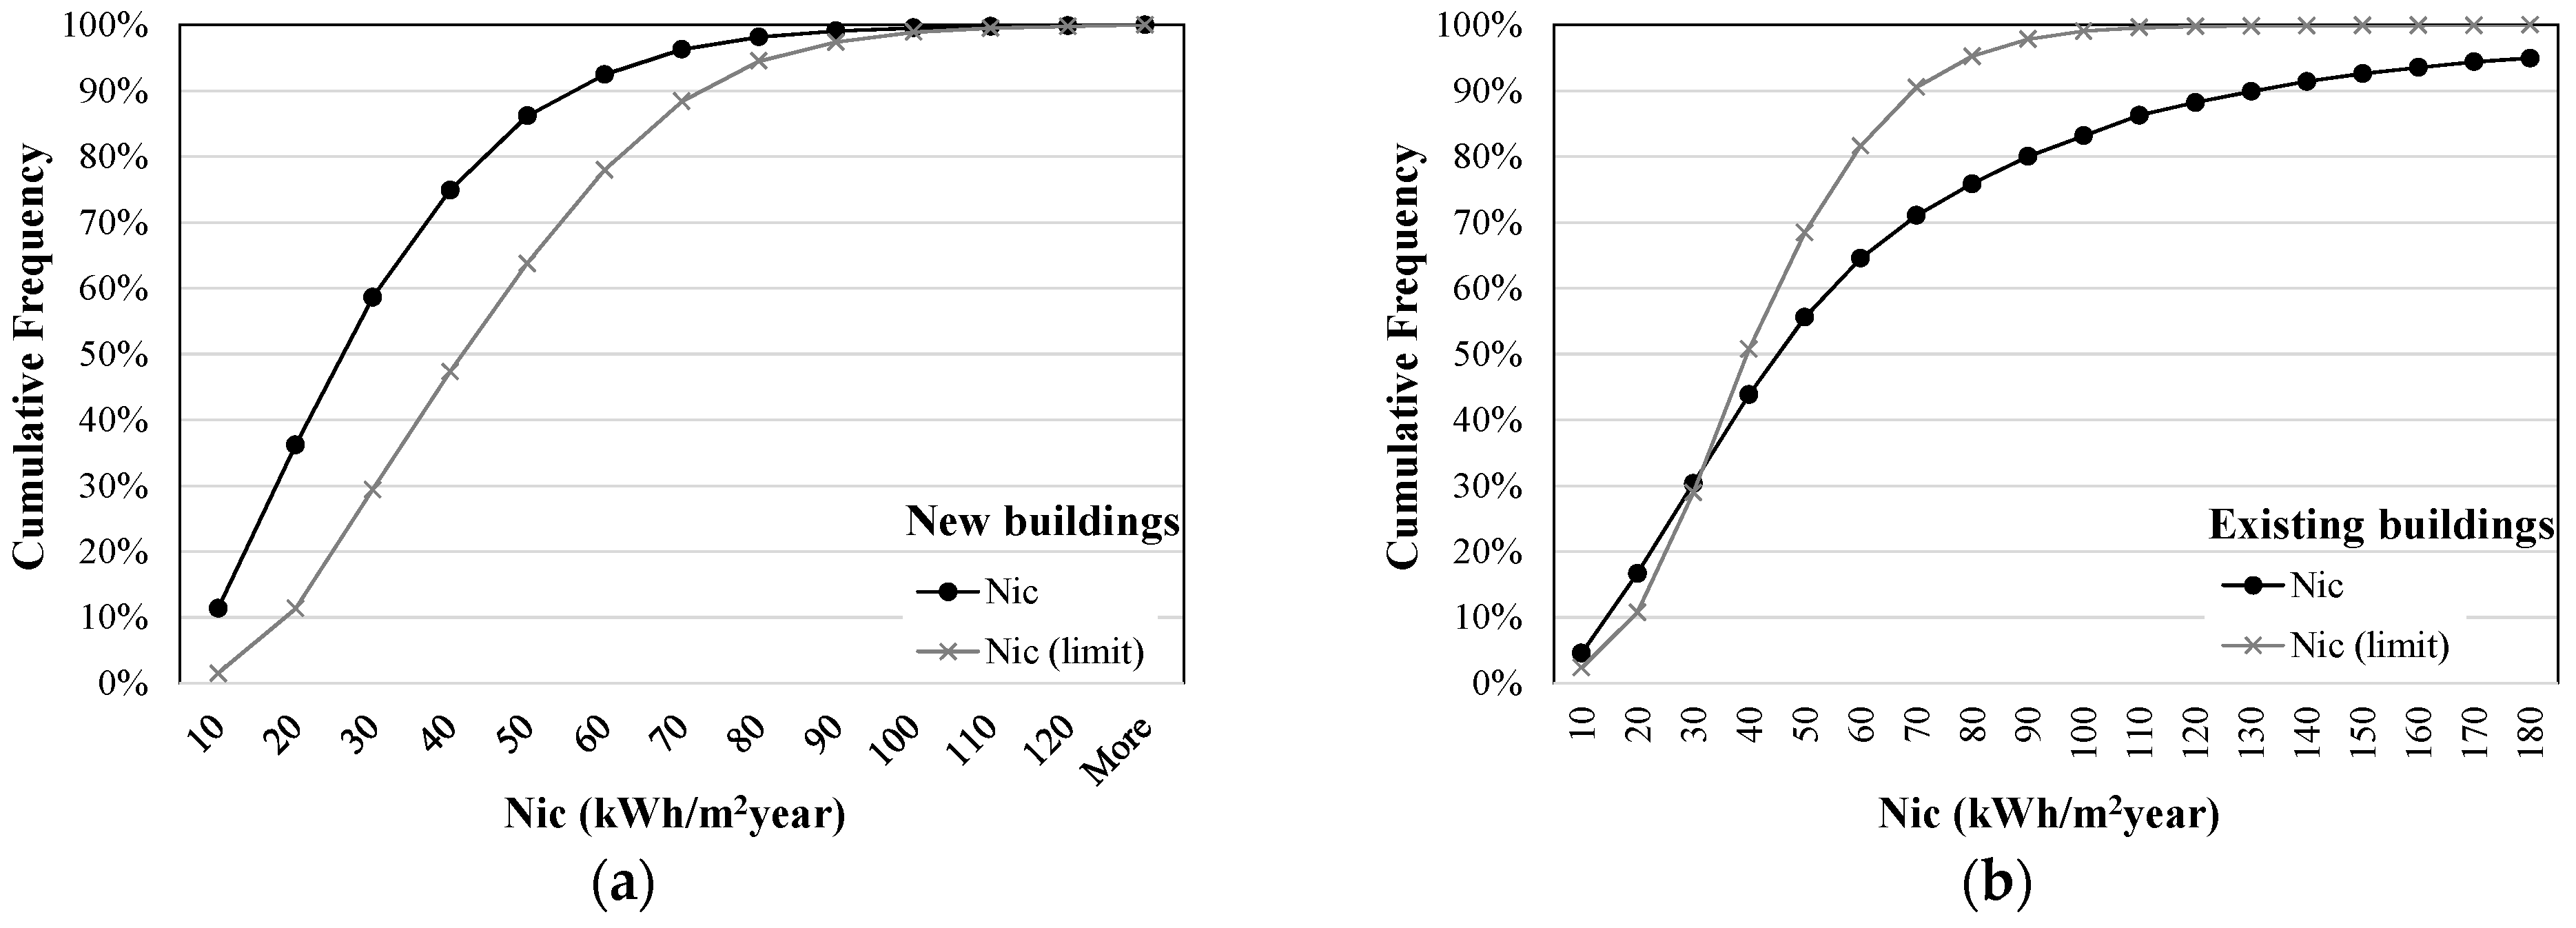
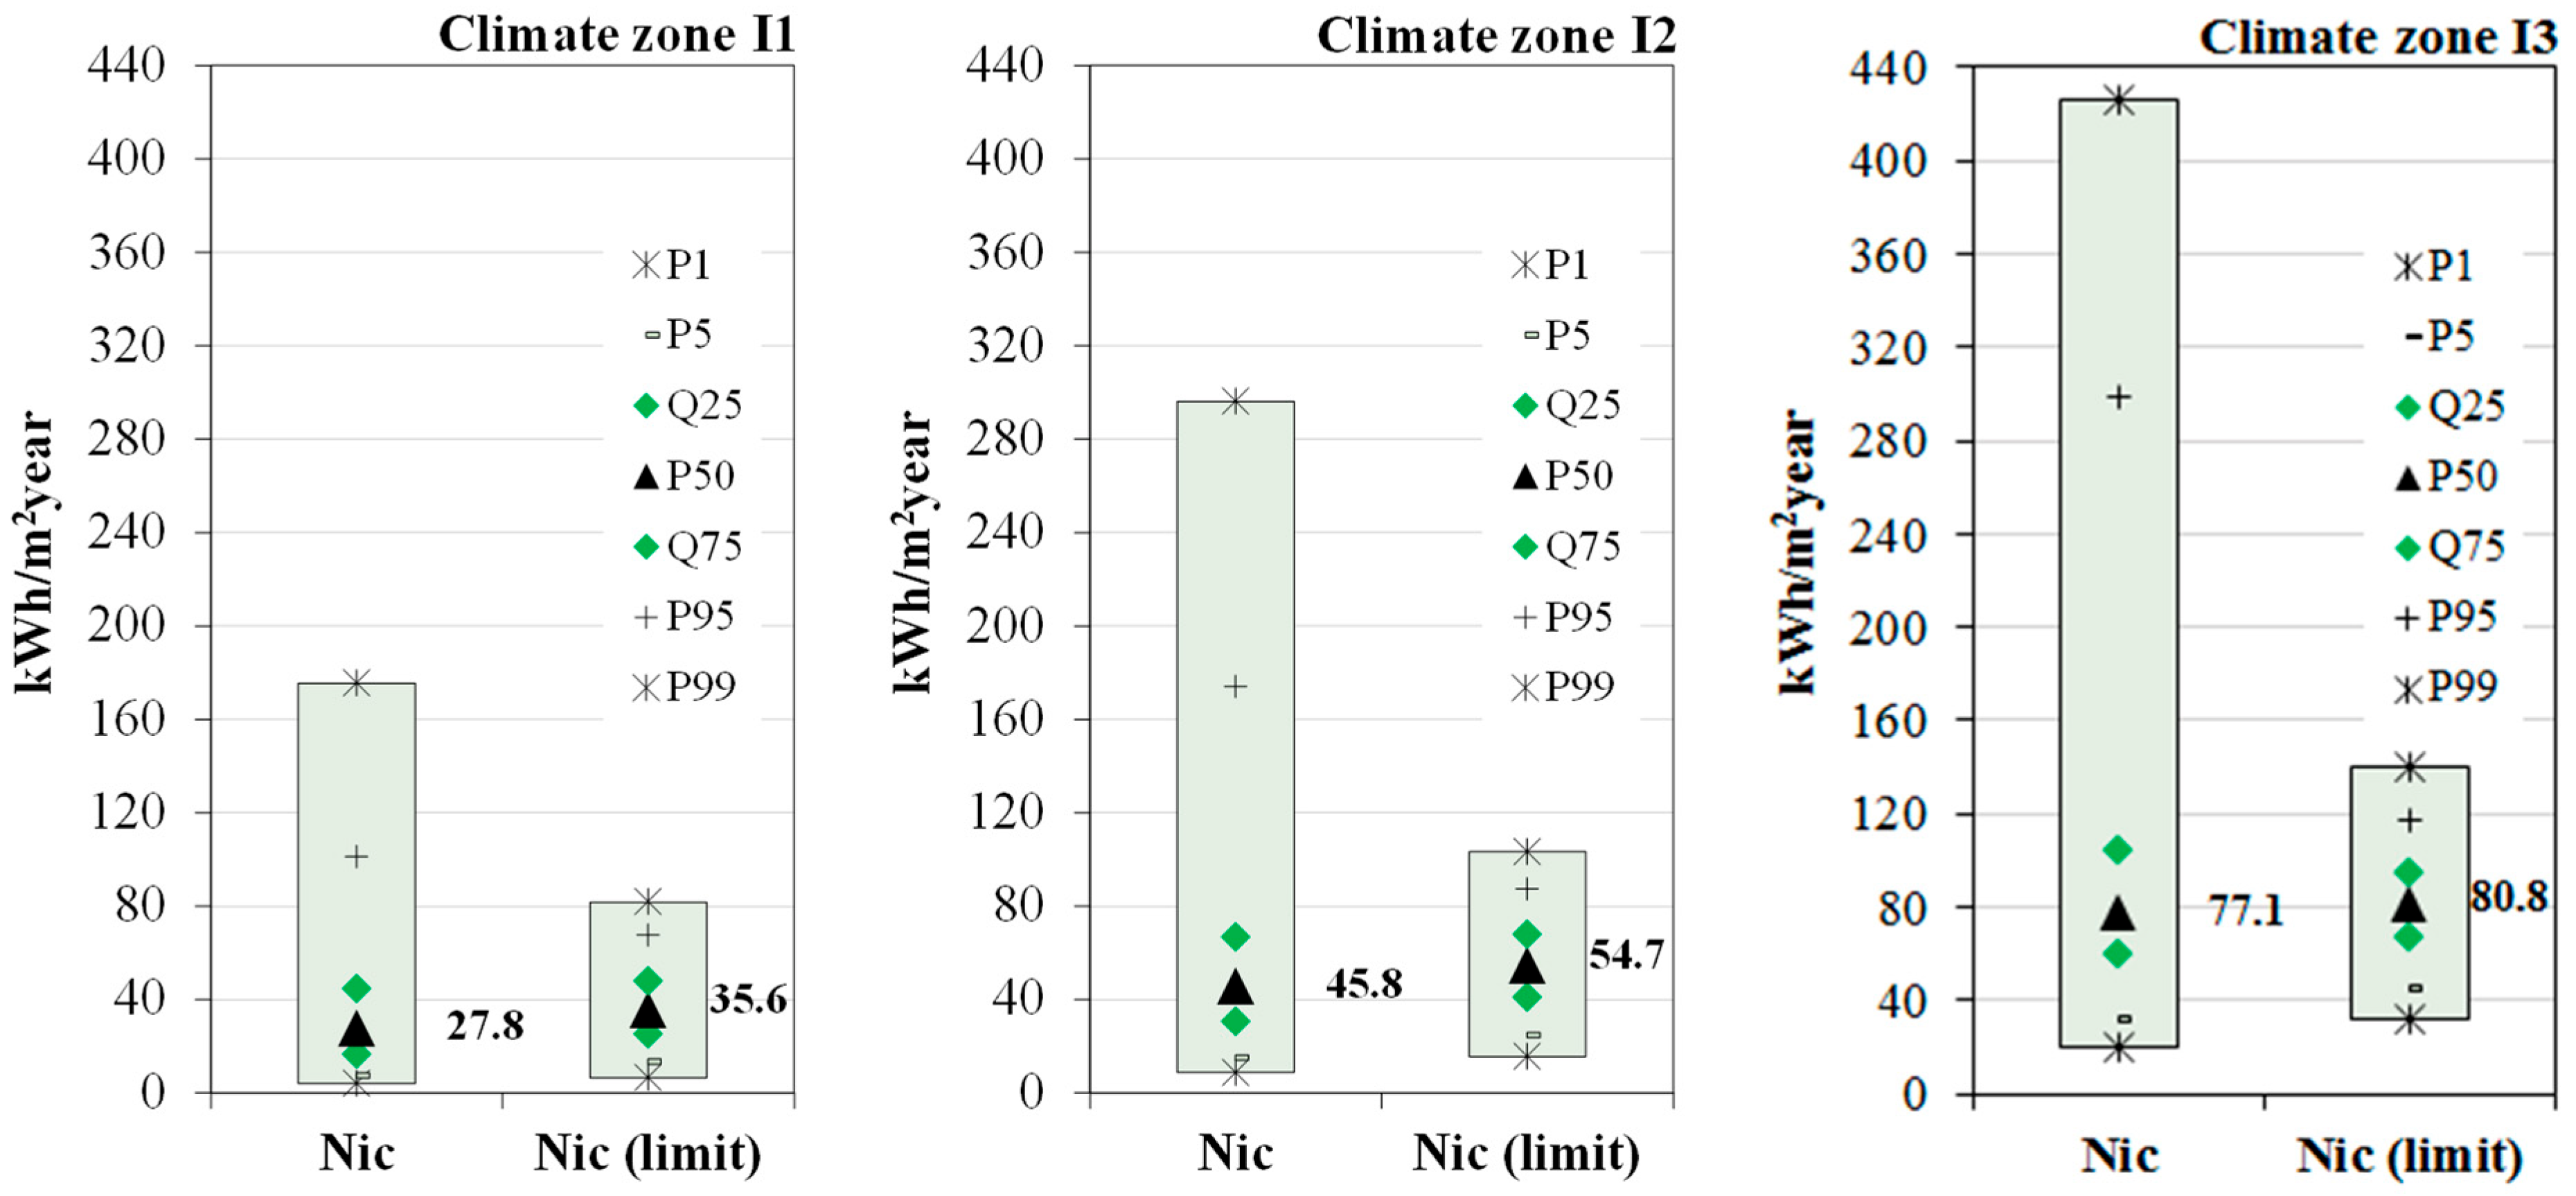
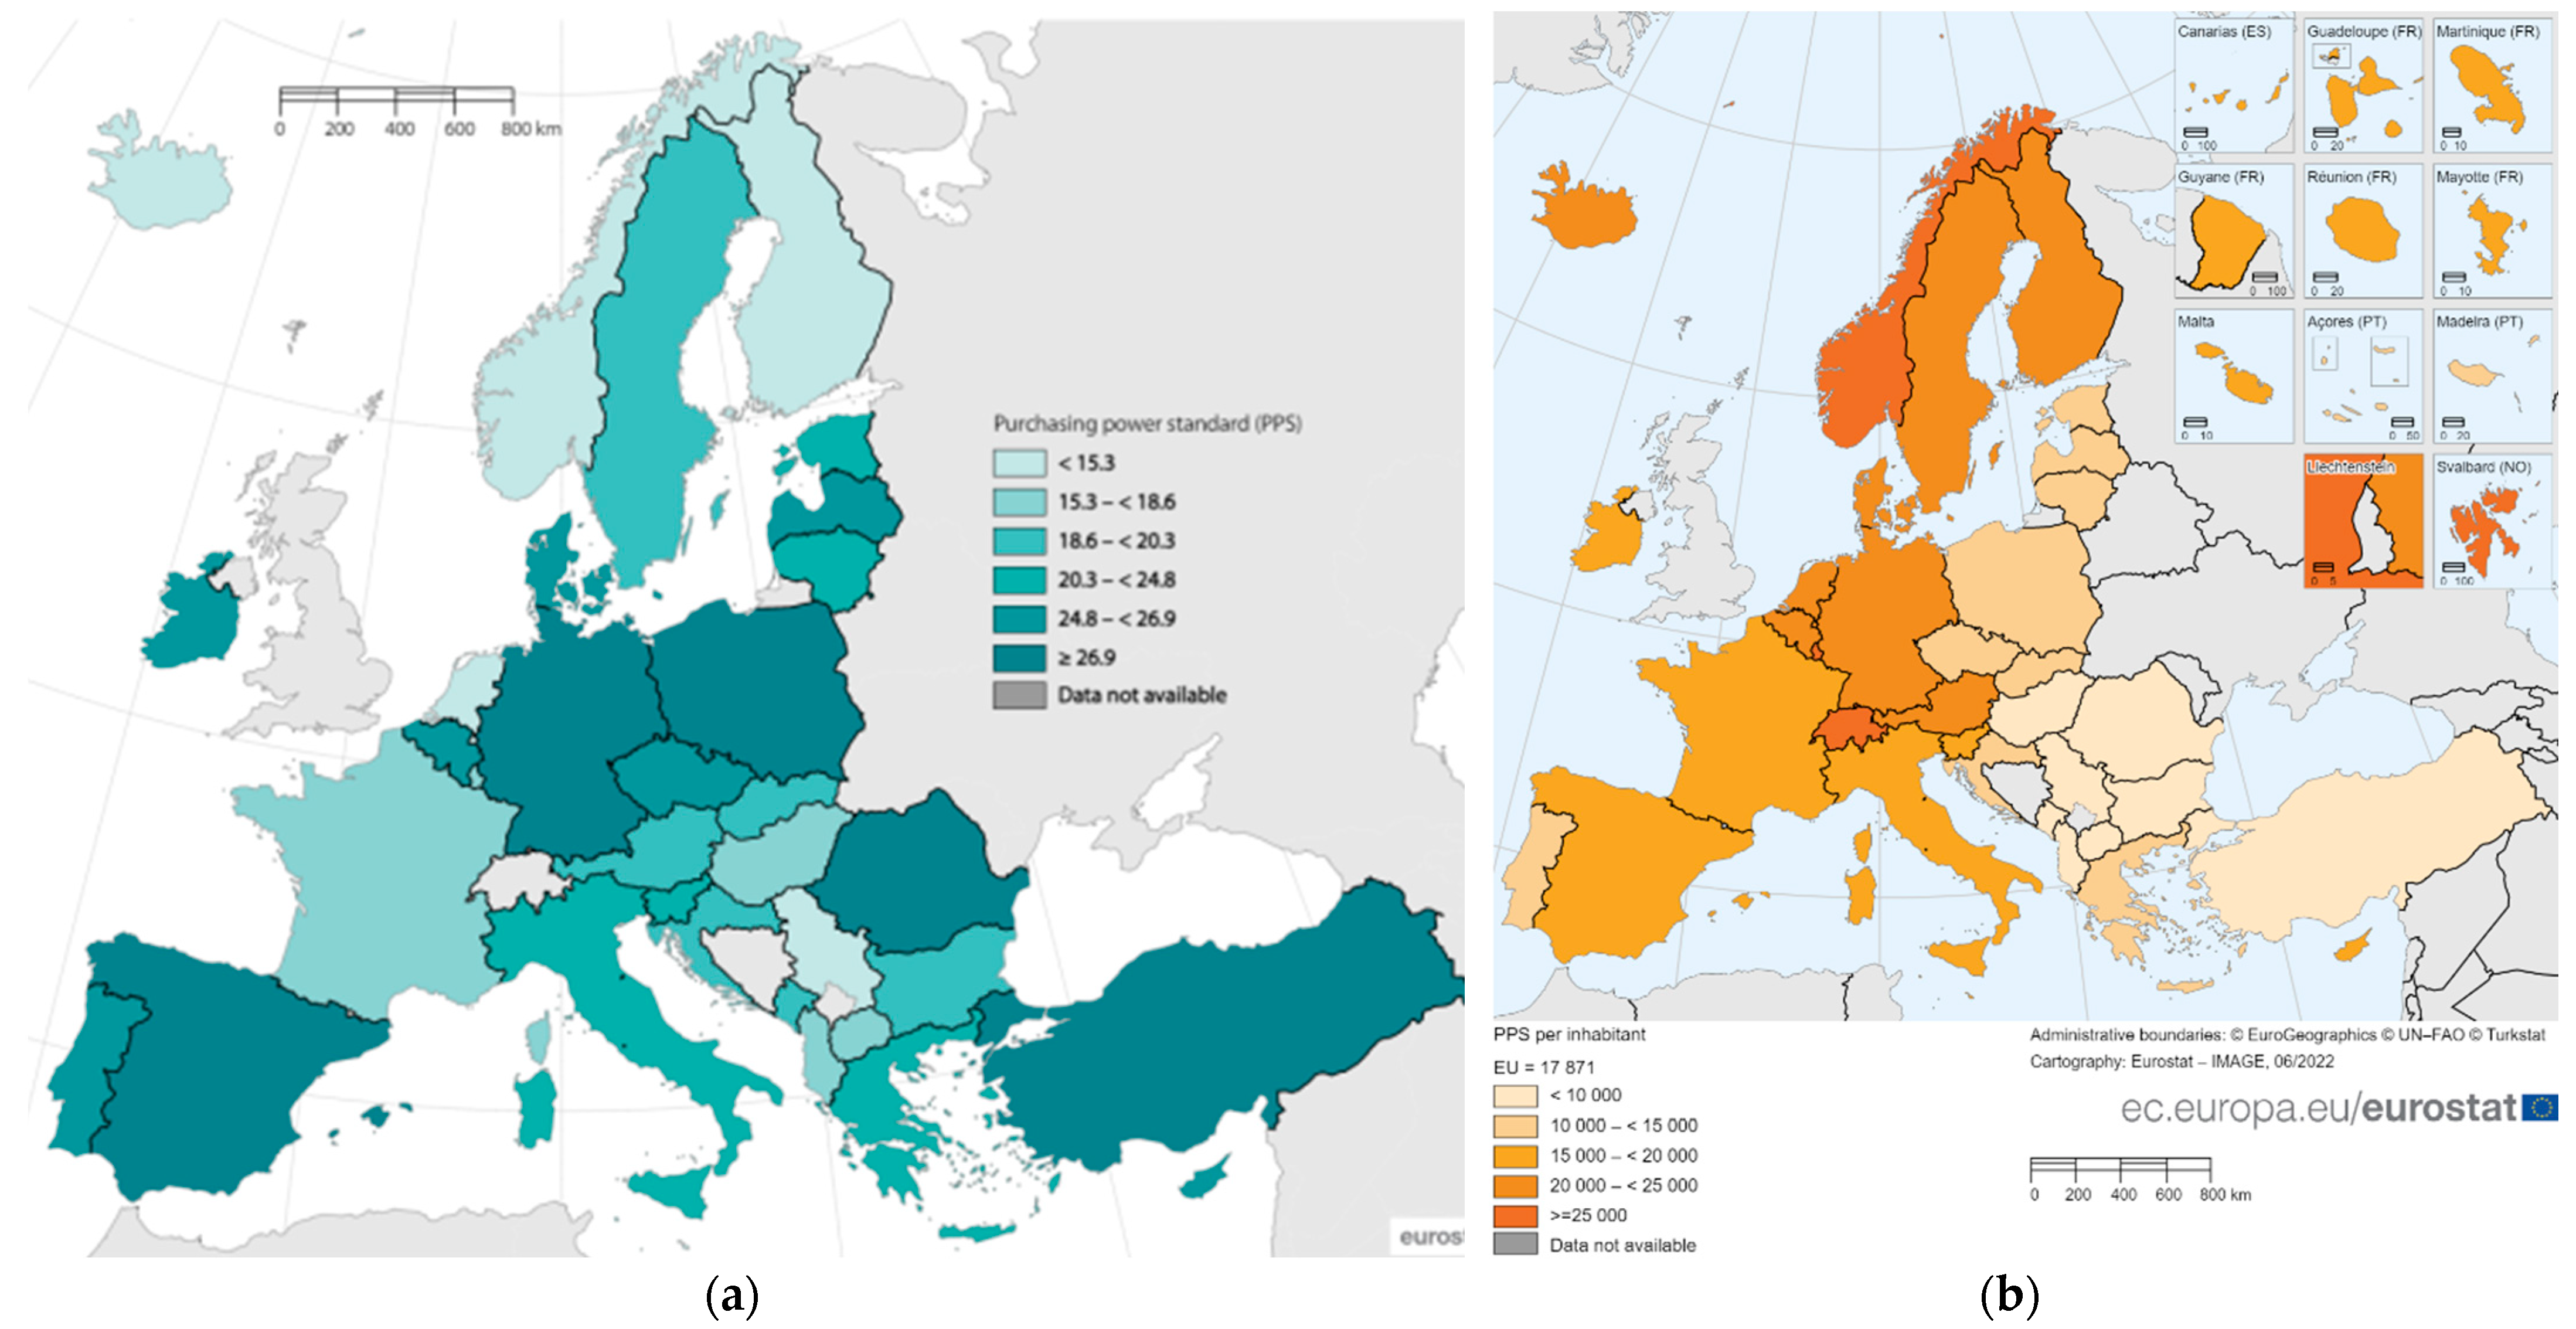
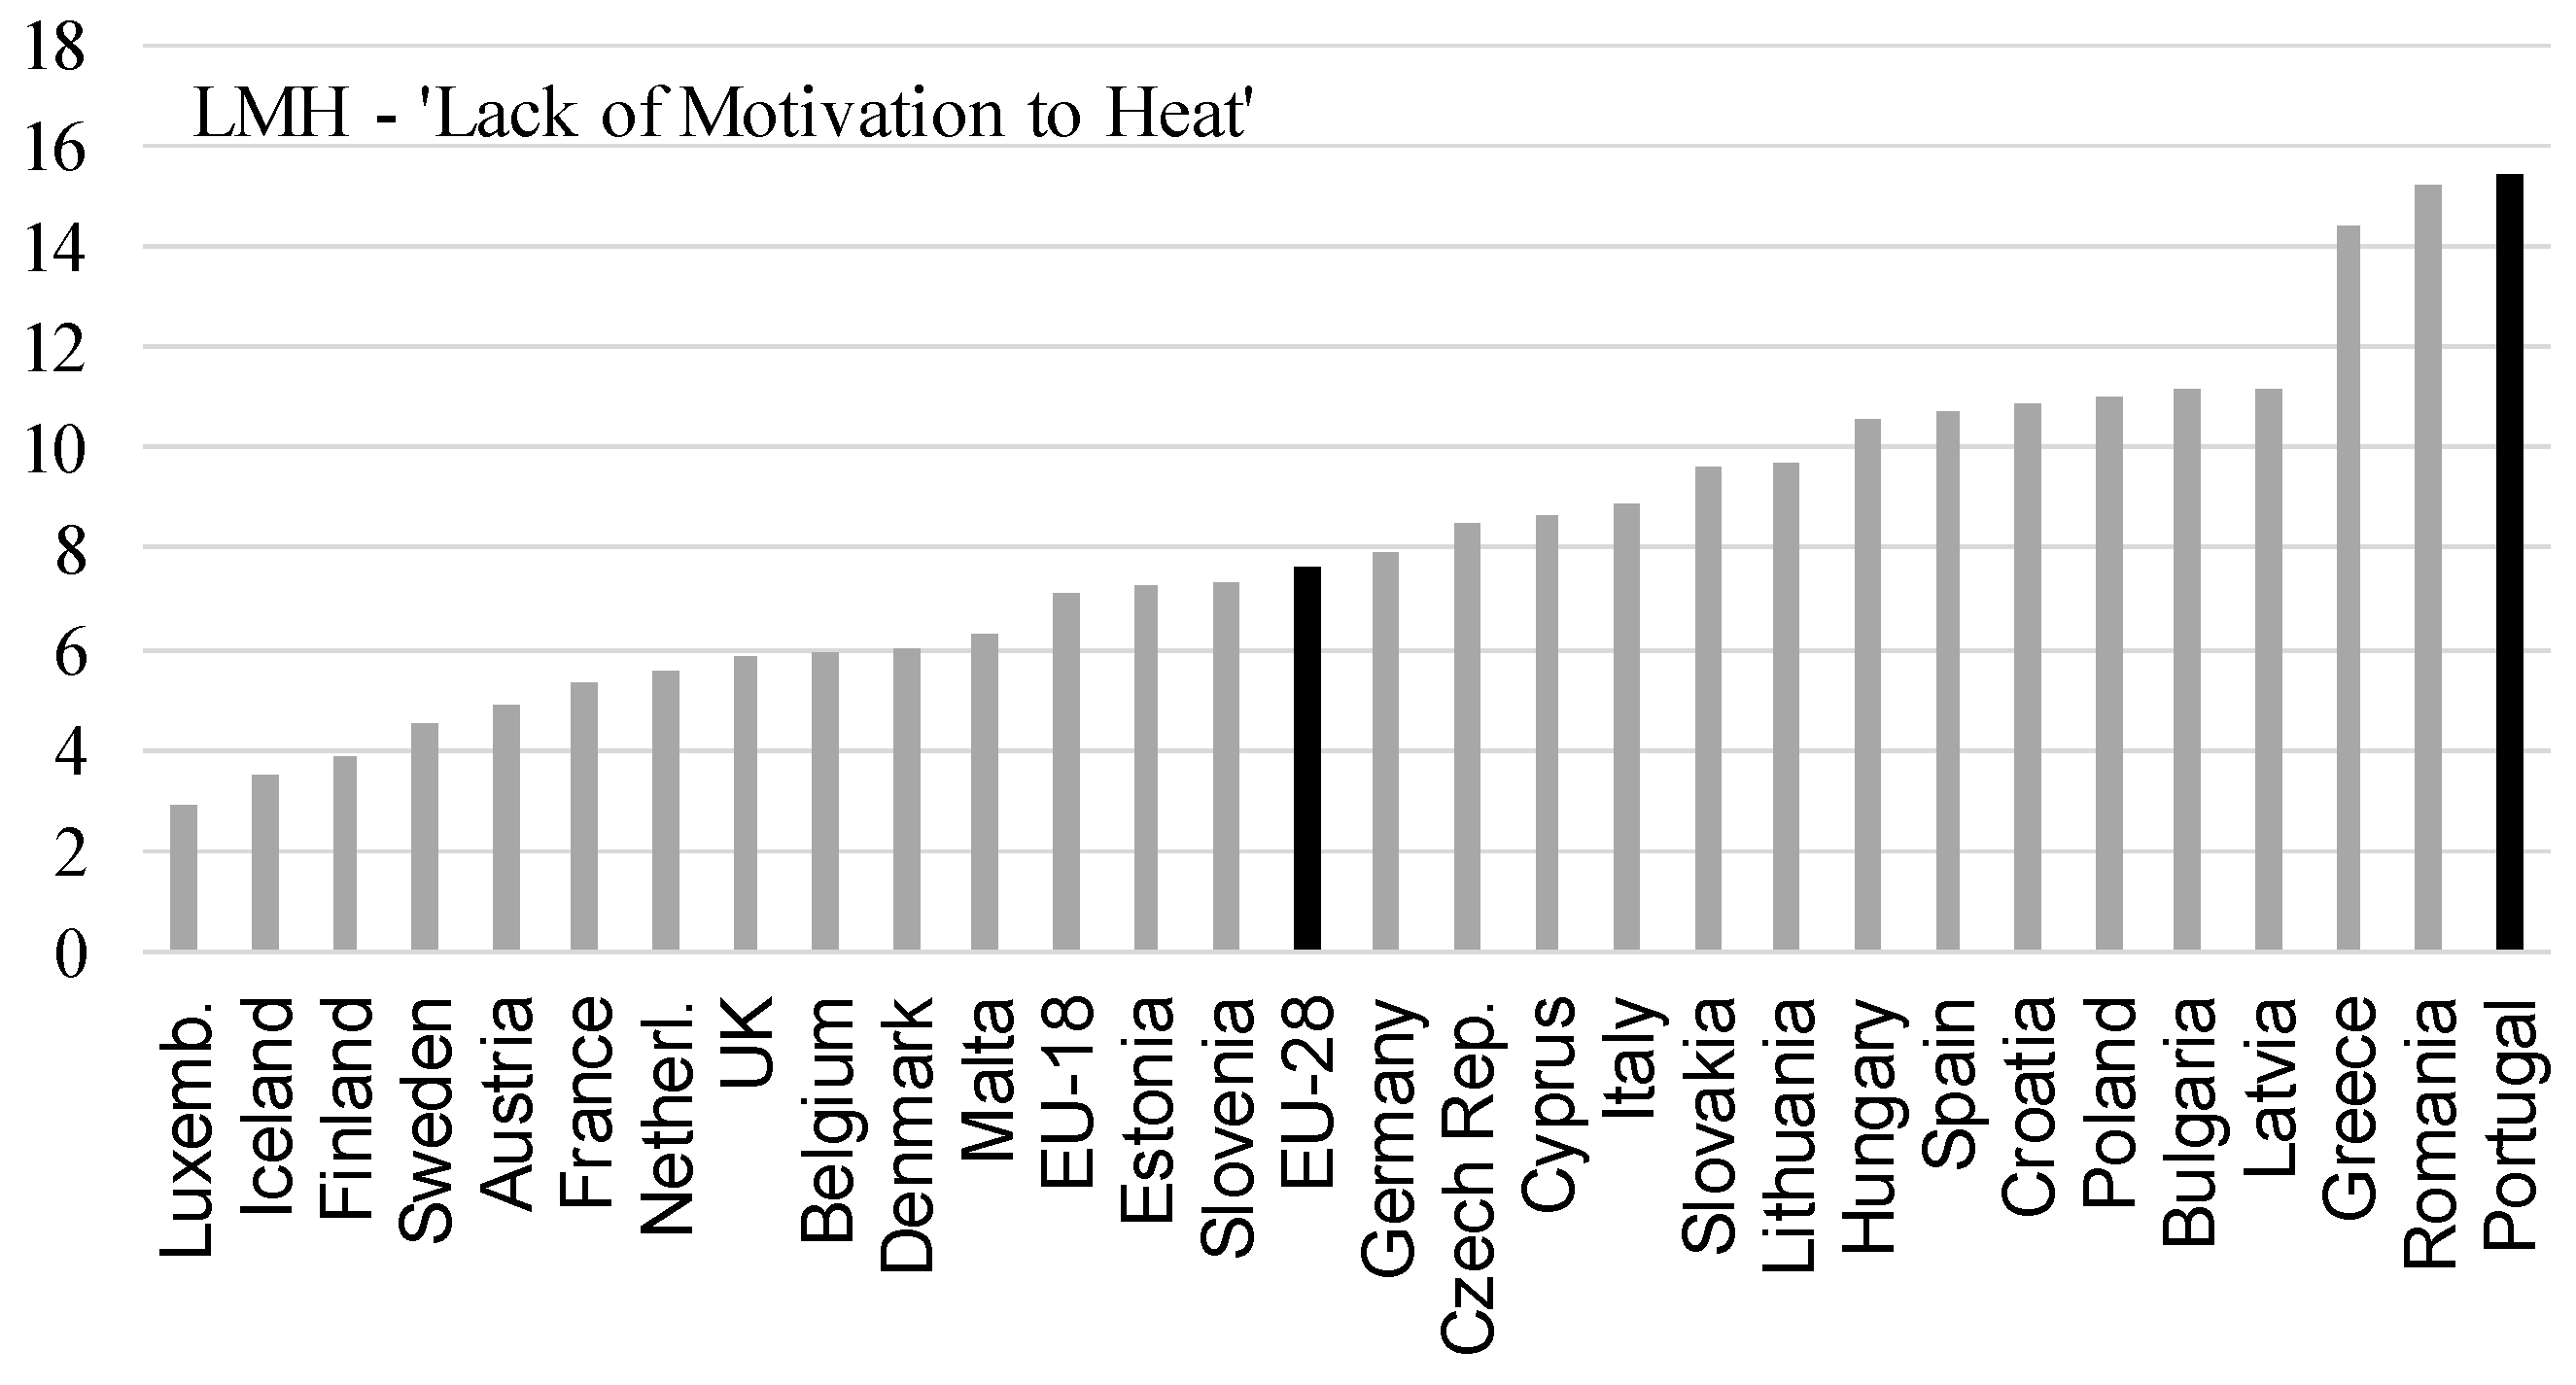
Table 1.
Indoor thermal comfort indices summary for the long-term evaluation (adapted from [34]).
Table 1.
Indoor thermal comfort indices summary for the long-term evaluation (adapted from [34]).
| Index Family | Index Name | Comfort Model | Standard/Author |
|---|---|---|---|
| Percentage | % of time outside the (PMV) range | Fanger | ISO 7730 [27] |
| % of time outside the range | Fanger | ISO 7730 [27] | |
| % of time outside the range | Adaptive EU | EN 16798 [36,37] | |
| Cumulative | PPD weighted criterion | Fanger | ISO 7730 [27] |
| accumulated PPD | Fanger | ISO 7730 [27] | |
| degree-hour criterion | Fanger | ISO 7730 [27] | |
| degree-hour criterion | Adaptive EU | EN 16798 [36,37] | |
| exceedance PPD | Fanger | Borgeson and Brager [39] | |
| exceedance adaptive | Adaptive USA | Borgeson and Brager [39] | |
| Risk | overheating risk | Adaptive USA | Nicol et al. [38] |
| Averaging | Average PPD | Fanger | ISO 7730 [27] |
Publisher’s Note: MDPI stays neutral with regard to jurisdictional claims in published maps and institutional affiliations. |
© 2022 by the authors. Licensee MDPI, Basel, Switzerland. This article is an open access article distributed under the terms and conditions of the Creative Commons Attribution (CC BY) license (https://creativecommons.org/licenses/by/4.0/).
Share and Cite
MDPI and ACS Style
Delgado, J.; Matos, A.M.; Guimarães, A.S. Linking Indoor Thermal Comfort with Climate, Energy, Housing, and Living Conditions: Portuguese Case in European Context. Energies 2022, 15, 6028. https://doi.org/10.3390/en15166028
AMA Style
Delgado J, Matos AM, Guimarães AS. Linking Indoor Thermal Comfort with Climate, Energy, Housing, and Living Conditions: Portuguese Case in European Context. Energies. 2022; 15(16):6028. https://doi.org/10.3390/en15166028
Chicago/Turabian StyleDelgado, João, Ana Mafalda Matos, and Ana Sofia Guimarães. 2022. "Linking Indoor Thermal Comfort with Climate, Energy, Housing, and Living Conditions: Portuguese Case in European Context" Energies 15, no. 16: 6028. https://doi.org/10.3390/en15166028
Note that from the first issue of 2016, this journal uses article numbers instead of page numbers. See further details here.