
Enhanced Fermentative Hydrogen Production from Food Waste in Continuous Reactor after Butyric Acid Treatment
by
 , , and
Marie Céline Noguer
1,* ,
,
Jose Antonio Magdalena
1,2,
Nicolas Bernet
1,
Renaud Escudié
1 and
Eric Trably
1 1
INRAE, University of Montpellier, LBE, 102 Avenue des Etangs, 11100 Narbonne, France
2
Vicerrectorado de Investigacion y Transferencia de la Universidad Complutense de Madrid, 28040 Madrid, Spain
*
Author to whom correspondence should be addressed.
Energies 2022, 15(11), 4048; https://doi.org/10.3390/en15114048
Submission received: 11 May 2022
/
Revised: 25 May 2022
/
Accepted: 27 May 2022
/
Published: 31 May 2022
(This article belongs to the Special Issue Biological Processes in the Green Hydrogen Value Chain)
Abstract
:End-product accumulation during dark fermentation leads to process instability and hydrogen production inhibition. To overcome this constraint, microbial community adaptation to butyric acid can induce acid tolerance and thus enhance the hydrogen yields; however, adaptation and selection of appropriate microbial communities remains uncertain when dealing with complex substrates in a continuous fermentation mode. To address this question, a reactor fed in continuous mode with food waste (organic loading rate of 60 gVS·L·d−1; 12 h hydraulic retention time) was first stressed for 48 h with increasing concentrations of butyric acid (up to 8.7 g·L−1). Performances were compared with a control reactor (unstressed) for 13 days. During 6 days in a steady-state, the pre-stressed reactor produced 2.2 ± 0.2 LH2·L·d−1, which was 48% higher than in the control reactor (1.5 ± 0.2 LH2·L·d−1). The pretreatment also affected the metabolites’ distribution. The pre-stressed reactor presented a higher production of butyric acid (+44%) achieving up to 3.8 ± 0.3 g·L−1, a lower production of lactic acid (−56%), and an enhancement of substrate conversion (+9%). The performance improvement was attributed to the promotion of Clostridium guangxiense, a hydrogen -producer, with a relative abundance increasing from 22% in the unstressed reactor to 52% in the stressed reactor.
1. Introduction
Hydrogen (H2) has garnered considerable interest in recent years in the biofuel field due to its high energy content and clean combustion [1]; however, current H2 production from natural gas through steam reforming and partial oxidation is associated with high CO2 emissions [2]. Development of innovative H2 production from renewable resources with low greenhouse gas footprint is therefore mandatory. On the one hand, water splitting is carried by an endothermic process via thermolysis, electrolysis, or photo-electrolysis [2,3]. On the other hand, biomass such as forestry, industrial, agricultural or municipal residues can also be breakdown to produce H2, via thermochemical and biological processes [4]. Of all the processes developed to produce green H2, dark fermentation (DF) has the potential to be one of the lowest global warming contributors [5], and has been identified as a promising biological process for industrial development [6]. DF is based on the degradation of organic matter into H2, CO2, and organic acids by anaerobic microorganisms. It is a very flexible process as it has the ability to degrade multiple waste products such as agricultural residues, waste water, or food waste (FW) [7]; however, stoichiometric constraints imply that a maximum of 33% of the converted substrate (in the form of chemical oxygen demand, COD) can theoretically be converted into H2. To optimize waste carbon recovery, effluents from DF might be subsequently used to produce other value-added molecules in a second-step process such as anaerobic digestion, for instance, to produce methane (CH4) [8].
Valorization of FW into H2 is attracting an increasing level of interest [9]. Many authors studied the impact of various DF parameters such as pH [10], substrate pretreatment [11], or temperature [12] to enhance H2 production from FW. Most of the studies have often been conducted in batch conditions, although continuous fermentation is important for scaling-up the process as it reduces the initial investment in bioreactors, limits the operating costs, and increases the overall economic productivity [9]. One of the main drawbacks of continuous experiments is the instability of the H2 production, which has often been reported upon and reviewed [13]. This instability is mainly due to the growth of undesirable microorganisms that either compete for the substrate, consume H2, or end-products accumulate [14]. Oftentimes, end-product inhibitions are induced by H2 accumulation and the two main co-produced organic acids: acetic and butyric acids [6,15]. Multiple mechanisms are involved in the inhibition by organic acids. Indeed, at a cellular level, their accumulation can affect the microorganism physiology through (i) the disruption of the proton gradient of the membrane (∆pH), (ii) ribosomal RNA and DNA damages due to free protons presence, and (iii) an alteration of the enzymatic activities [16]. At a population level, organic acids can also induce a microbial community shift in favor of acid-resistant species that could favor or disfavor H2 production [17].
Butyric acid is often the most abundant organic acid produced during high H2-producing DF [15]. It has been identified as the most toxic metabolic product among the main metabolic products in DF [15,18]. Its higher toxicity in comparison with acetic acid has been attributed, with respect to H2 production, to a higher restriction in NAD+ regeneration pathways during its accumulation [15]; therefore, there is a need to develop strategies to alleviate organic acids and especially butyric acid inhibition. The extraction of organic acids through the use of a membrane has been conclusive in reaching high H2 production [19,20], although membrane clogging remains an unresolved issue [20].
Alternatively, strategies were developed to increase the tolerance of microbial communities to high butyric acid concentrations in order to enhance H2 production. Zhao et al. [21] intended to enhance butyric acid tolerance of microbial community from urban sludge through a 7 day incubation with butyric acid. After this period of adaptation in terms of butyric acid stress, H2 production from kitchen waste in a batch significantly increased (64 mL·gVS−1, a 114% increase) using the stressed sludge. This improvement was associated with an increase in the hydrolysis of enzymatic activities. Alternatively, Huang et al. [22] stimulated acid tolerance of a sludge through its exposure to increasing butyric acid concentration in a continuous reactor fed with glucose. H2 production was not monitored during the continuous experiment, but the stressed sludge was sampled and used as an inoculum for H2 production in batch conditions, with 30 g·L−1 of glucose. As a result, H2 production of the stressed sludge was enhanced by 56% (2.25 molH2·molglucose) in comparison with the unstressed sludge (1.43 molH2·molglucose). The authors suggested that this improvement was due to an enrichment of the microbial community in acid tolerant bacteria via adaptative evolution, but no microbial analysis was carried out.
In this sense, it has been shown that pre-stressing an inoculum with butyric acid constitutes a possible strategy to improve the performance of H2 production. Previous investigations were carried out under batch conditions, and partly with model substrates (i.e., glucose); therefore, the behavior of a microbial community pre-adapted to high organic acid concentrations, and then operated in a continuous mode on a complex substrate (FW), is uncertain. Such information is essential for developing an adaptive method at larger scale.
The aim of this study was to investigate the effect of initial butyric acid stress on the microbial community and investigate the H2 production performances in a bioreactor continuously fed with FW. The butyric acid stress applied resulted in an increase in H2 yield, which is linked to an increase in the abundance of H2 producers.
2. Materials and Methods
2.1. Microbial Inoculum Preparation
The seed inoculum corresponded to an activated aerobic sludge collected from the waste water treatment plant in Narbonne (France). The sludge was centrifuged, and the biomass freeze-dried and stored at −80 °C in aliquots. Measurements of total solids (TS) and VS were performed according to the APHA standard methods [23]. The inoculum was composed of 750 ± 1 mgVS·g−1 (VS = volatile solids). Before inoculation, the freeze-dried powder was rehydrated in 200 mL of water and thermally pre-treated to remove methanogenic archaea and non-sporulating microbes that could potentially hamper the H2 production. Heat-shock pretreatment was carried out at 90 °C for 15 min [24] with a hot plate (CMAG H57, IKA, Germany, Staufen) and a temperature probe (ETS D5, IKA, Staufen, Germany) at constant stirring rate.
2.2. Feedstock Composition
The substrate consisted of a reconstituted depackaging food waste soup prepared from frozen food (Table 1). The composition was inspired from an average biowaste composition of major food retailers in France. This substrate was composed of 348 ± 1 mgTS·g−1 and 337 ± 1 mgVS·g−1. The biochemical methane potential of the feedstock was determined through direct measurement and near infrared spectroscopy [25]. The resulting BMP amounted to 451 ± 6 mLCH4·gVS−1. From this value, and considering that 350 mL of CH4 can be theoretically recovered from one gram of biodegradable COD (chemical oxygen demand), the amount of biodegradable COD per gram of VS was estimated at 1.28 ± 0.02 gbiodegradableCOD·gVS−1. The total COD of the substrate was measured directly using a COD measuring kit (COD Reagent Vario MR, Tintometer, Germany, Dortmund). The resulting value was 1.26 gCOD·gVS−1, thus showing that the entire COD of the substrate was accessible for microorganisms. Before its use, the substrate was grinded and diluted with tap water to reach 100 mgTS·g−1. Subsequently, thermal hygienisation took place for 1 h at 70 °C by means of a water bath. Both the dilution and hygienisation processes were carried out to fulfil European law requirements for biowaste [26], and to mimic industrial procedures to eliminate pathogens that might exist in food waste. The resulting mixture was sieved through a 2 mm mesh sieve and diluted again with tap water, reaching 26 ± 4 gVS·L−1 (Table 1) prior to fermentation. The feedstock solution was stored in a fridge at 4 °C and prepared every four days.
2.3. Experimental Setup
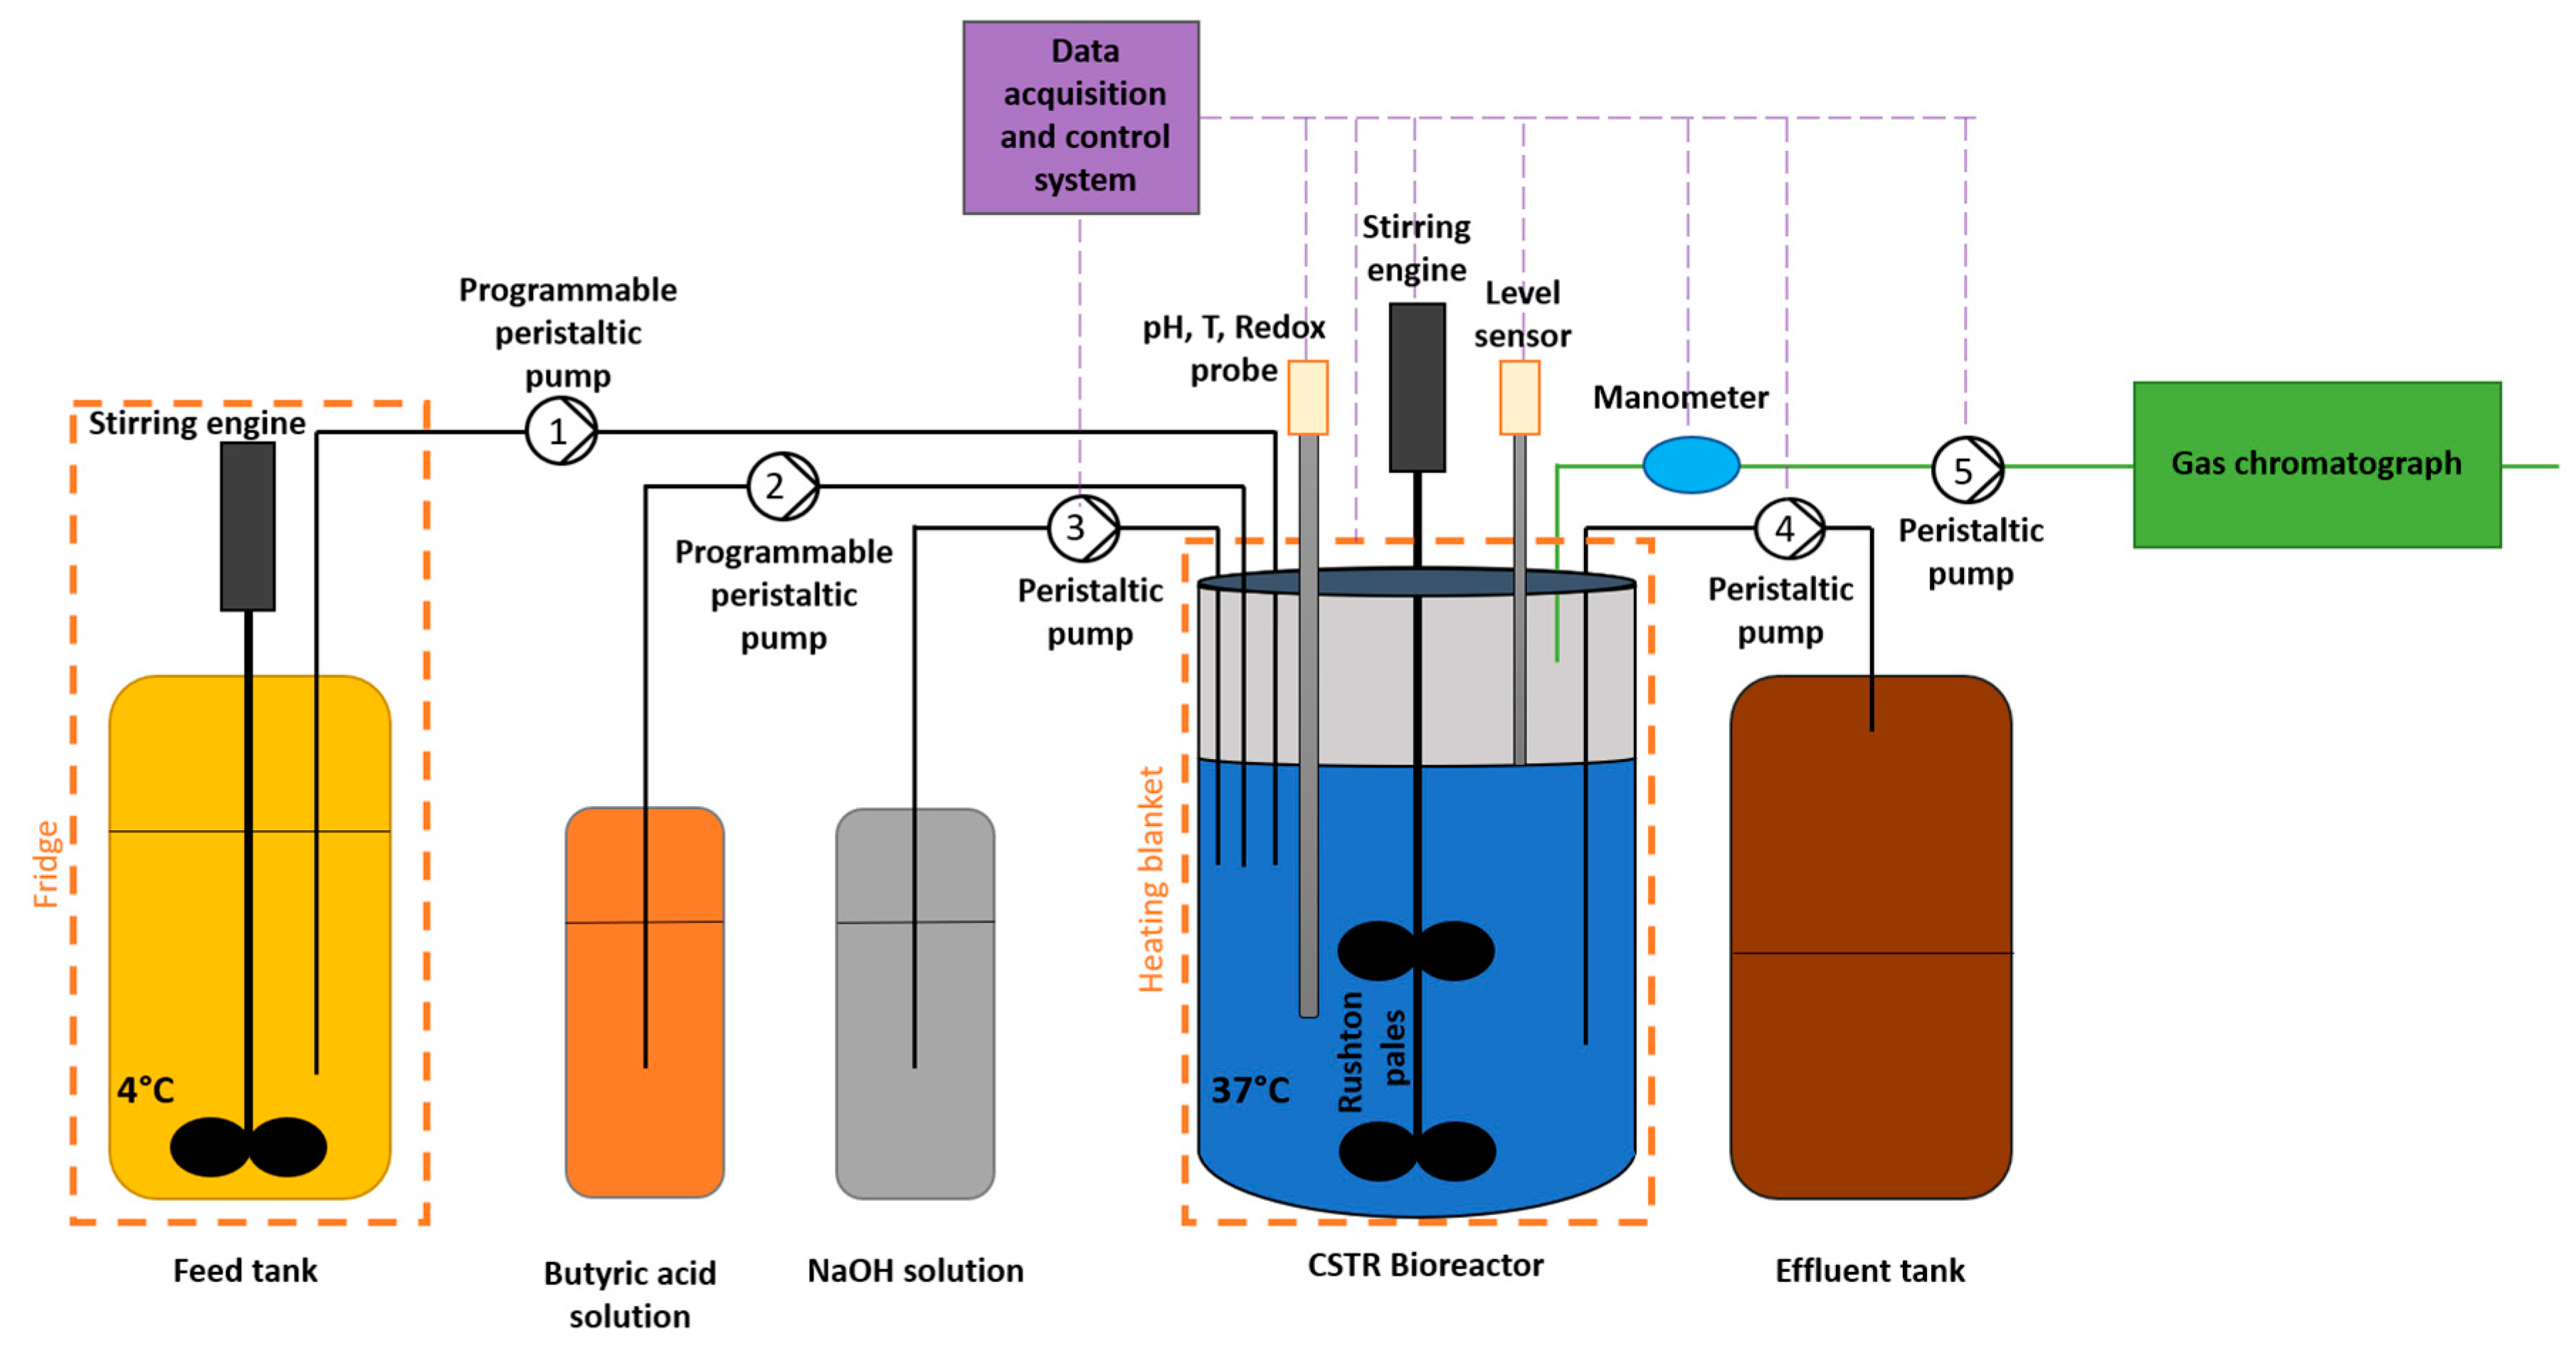
Experiments were set up in a 3 L glass fermenter (Applikon Bio 3 L, Getinge, Göteborg, Sweden) with a 2 L working volume and 1 L headspace (Figure 1). Temperature and pH were controlled and monitored by means of an automatic system (M300, Mettler Toledo, Greifensee, Switzerland). The temperature was measured with an immersed probe and regulated by a heating blanket. pH was measured by an in situ probe and was regulated with 3 M NaOH. Mixing was ensured by mechanical stirring. Pressure was regulated with a control device combining a pressure sensor (LEO3, Keller, Winterthour, Switzerland) and a peristaltic pump (Masterflex L/S 7554-85, Cole Parmer, Vernon Hills, IL, USA) following a two-band control law between 1030 and 1070 mbar. Gas production was measured through the pressure variations inside the fermenter and by using the operating time of the calibrated peristaltic pump. Produced gas volumes were normalized (T = 0 °C and p = 1 atm).
2.4. Operating Conditions
The reactors were first operated in batch mode for 9 h. Inoculum, substrate, and tap water were added to reach the working volume of 2 L. Initial batch operation was started with a substrate to biomass ratio of 9 (VS·VS−1) and a substrate concentration of 7.8 gVS·L−1 (10 gCOD·L−1). Fermenters were flushed with nitrogen for 15 min to remove oxygen and ensure anaerobic conditions, which were confirmed by oxidation reduction potential (ORP) values lower than −400 mV during the entire continuous process. pH and temperature were regulated and monitored at 5.51 ± 0.02 and 36.9 ± 0.3 °C, respectively, and stirring was set at 180 rpm.
After this batch mode phase, continuous operation was initiated by starting a programmable peristaltic pump (Masterflex L/S model 07522-30, Cole Parmer, Vernon Hills, IL, USA and head pump Masterflex L/S ® FV-07018-20, Cole Parmer, Vernon Hills, IL, USA) configurated to deliver 100 mL of feed solution (26 gVS·L−1) every 36 min. The organic loading rate (OLR) and hydraulic retention time (HRT) during continuous operation were 60 gVS·L·d−1 (77 gCOD·L·d−1) and 12 h, respectively. This high OLR, in comparison with other studies concerning FW [27,28], was set to induce stress using endogenous organic acids.
The influence of a pre-stress stage using butyric acid was evaluated by comparing two scenarios: (1) condition A, serving as a control and carried out in the conditions described above, and (2) condition B, in which butyric acid (butyric acid ≥ 99% CAS 107-92-6, Sigma Aldrich, St. Louis, MO, USA) was continuously added into the reactor from the end of the 9 h batch period and during 48 h (i.e., 4 HRT) of continuous operation. Butyric acid addition was performed using a programmable peristaltic pump (Masterflex L/S model 07522-30, Cole Parmer, Vernon Hills, IL, USA and head pump Masterflex L/S ® FV-07014-20, Cole Parmer, Vernon Hills, IL, USA) configurated to deliver the butyric acid solution of 176 g·L−1 at 8.3 mL·h−1. A concentration of 8.7 g·L−1 of butyric acid was reached in the fermentation medium within 48 h (Figure 2). After this 48 h stress period, the exogenous butyric acid in the reactor was gradually washed out in the course of the feedings.
The total experimental period of 13 days in which reactors were monitored was divided into 3 different stages. The first period, named “period I” corresponded to the period from the beginning of the experiments to the end of the butyric acid addition (i.e., after 2.4 days of fermentation). The transitionary phase from 2.4 days to 7 days, during which, exogenous butyric acid was progressively washed out, was named “period II”. Finally, the steady-state from 7 to 13 days was named as “period III”. The differences in H2 production, liquid metabolic products, and microbial communities will be discussed sequentially for these three periods. One 13 days experimentation was conducted for conditions A and B, respectively.
2.5. Gas and Metabolite Analysis
The outlet of the gas pressure regulation pump was connected to a micro gas chromatograph (GC R3000, SRA Instrument, France, Marcy-l’Étoile) for online biogas composition monitoring. The chromatograph was equipped with two columns: one column dedicated to CO2 analysis (Molesieve 5A 10 m column, temperature of 80 °C, 30 psi with argon as carrier gas) and a second column devoted to N2, CH4, H2, and O2 analysis (PoraPlot U (PPU) 8 m column, temperature at 70 °C, 20 psi with helium as carrier gas). Two micro-thermal conductivity detectors (TCD) set at 90 °C completed the two analytical chains. Two mL of liquid samples in duplicate were taken from the fermenters every two days and were centrifuged for 15 min at 13,400 rpm in a centrifuge (Minispin, Eppendorf, Hamburg, Germany). Supernatants and pellets were stored at −20 °C for further use. Supernatants were filtered through 0.2 μm (nylon filter 15121499, Fisher Scientific, Waltham, MA, USA) before metabolite analysis. Volatile fatty acid (VFA) concentrations of each sample (acetate, propionate, butyrate, iso-butyrate, valerate, iso-valerate, and caproate) were measured by gas chromatography (GC). The device was a Clarus 580 gas chromatograph (Perkin Elmer, Waltham, MA, USA) equipped with an AlltechFFAP EC™ 1000 column coupled to a flame ionization detector (FID) at 280 °C. The carrier gas was N2 circulating at a flow rate of 6 mL·min−1. High Performance Liquid Chromatography (HPLC) was employed to analyze other metabolites’ concentrations (ethanol, organic acids such as lactate or succinate, and residual sugars). The device was composed of a protective precolumn (Microguard cation H refill catbridges, Biorad, Hercules, CA, USA) and an HPX-87H column (300 × 7.8 mm, Biorad, Hercules, CA, USA) running at 35 °C coupled to a refractive index detector (R410, Waters, Milford, MA, USA) at 45 °C. A solution of 4 mM H2SO4 at 0.3 mL·min−1 was used as eluent. The experiments and related analyses were performed using the Bio2E platform [29].
2.6. Process Performance Evaluation
The efficiency of substrate degradation into metabolites was assessed by calculating the ratio of the sum of the COD of each metabolite produced to the COD of the substrate and introduced into the fermenter, as follows [30] (Equation (1)):
with , , , and corresponding to the COD of produced acetate, butyrate, lactate, H2, and introduced substrate, respectively.
2.7. Sequencing and Microbial Community Analyses
The sample pellet obtained after centrifugation was used for microbiological analyses. DNA extraction was performed by means of the FastDNA SPIN kit for soil, following the manufacturer’s instructions (MP biomedicals, LCC, California, CA, USA). DNA amount and purity in extracts was confirmed by spectrophotometry (Infinite NanoQuant M200, Tecan, Männedorf, Switzerland). Extracted DNA was then stored at −20 °C. The V3-V4 region of the 16S rRNA was amplified by PCR using universal primers as reported elsewhere [31]. The PCR mix was composed of MTP Taq DNA Polymerase (Sigma-Aldrich, Hamburg, Germany) (0.05 u·μL−1) with enzyme buffer, forward, and reverse primers (0.5 mM), dNTP (0.2 mM), sample DNA (5–10 ng·μL−1), and water until a final volume of 60 μL was obtained. 35 cycles of denaturation (95 °C, 1 min), annealing (65 °C, 1 min), and elongation (72 °C, 1 min) were carried out in a Mastercycler thermal cycler (Eppendorf, Hamburg, Germany). A final extension step was added for 10 min at 72 °C at the end of the 35-amplification cycle. PCR amplifications were verified by 2100 Bioanalyzer (Agilent, Santa Clara, CA, USA). The GenoToul platform (Toulouse, France http://www.genotoul.fr, accessed on 6 July 2021) used an Illumina Miseq sequencer (2 × 300 pb paired-end run) for the sequencing reaction. The raw sequences obtained were analyzed using bioinfomatic tools. Mothur version 1.39.5 was used for reads cleaning, assembly and quality checking. Alignment was performed with SILVA release 128. The latter was also used as taxonomic outline. A visual representation of the bacterial relative abundances was performed with a phyloseq package in R software [32].
2.8. Statistical Analyses
A principal component analysis was performed in R software with the package Factoshiny, using the PCA function [33]. The dimdesc function from this package was used to obtain correlation scores between variables, principal components, and the associated p-values. Correlation tests were performed using the cor.test function from the package stats in R software.
3. Results and Discussion
3.1. Dark Fermentation for H2 Production
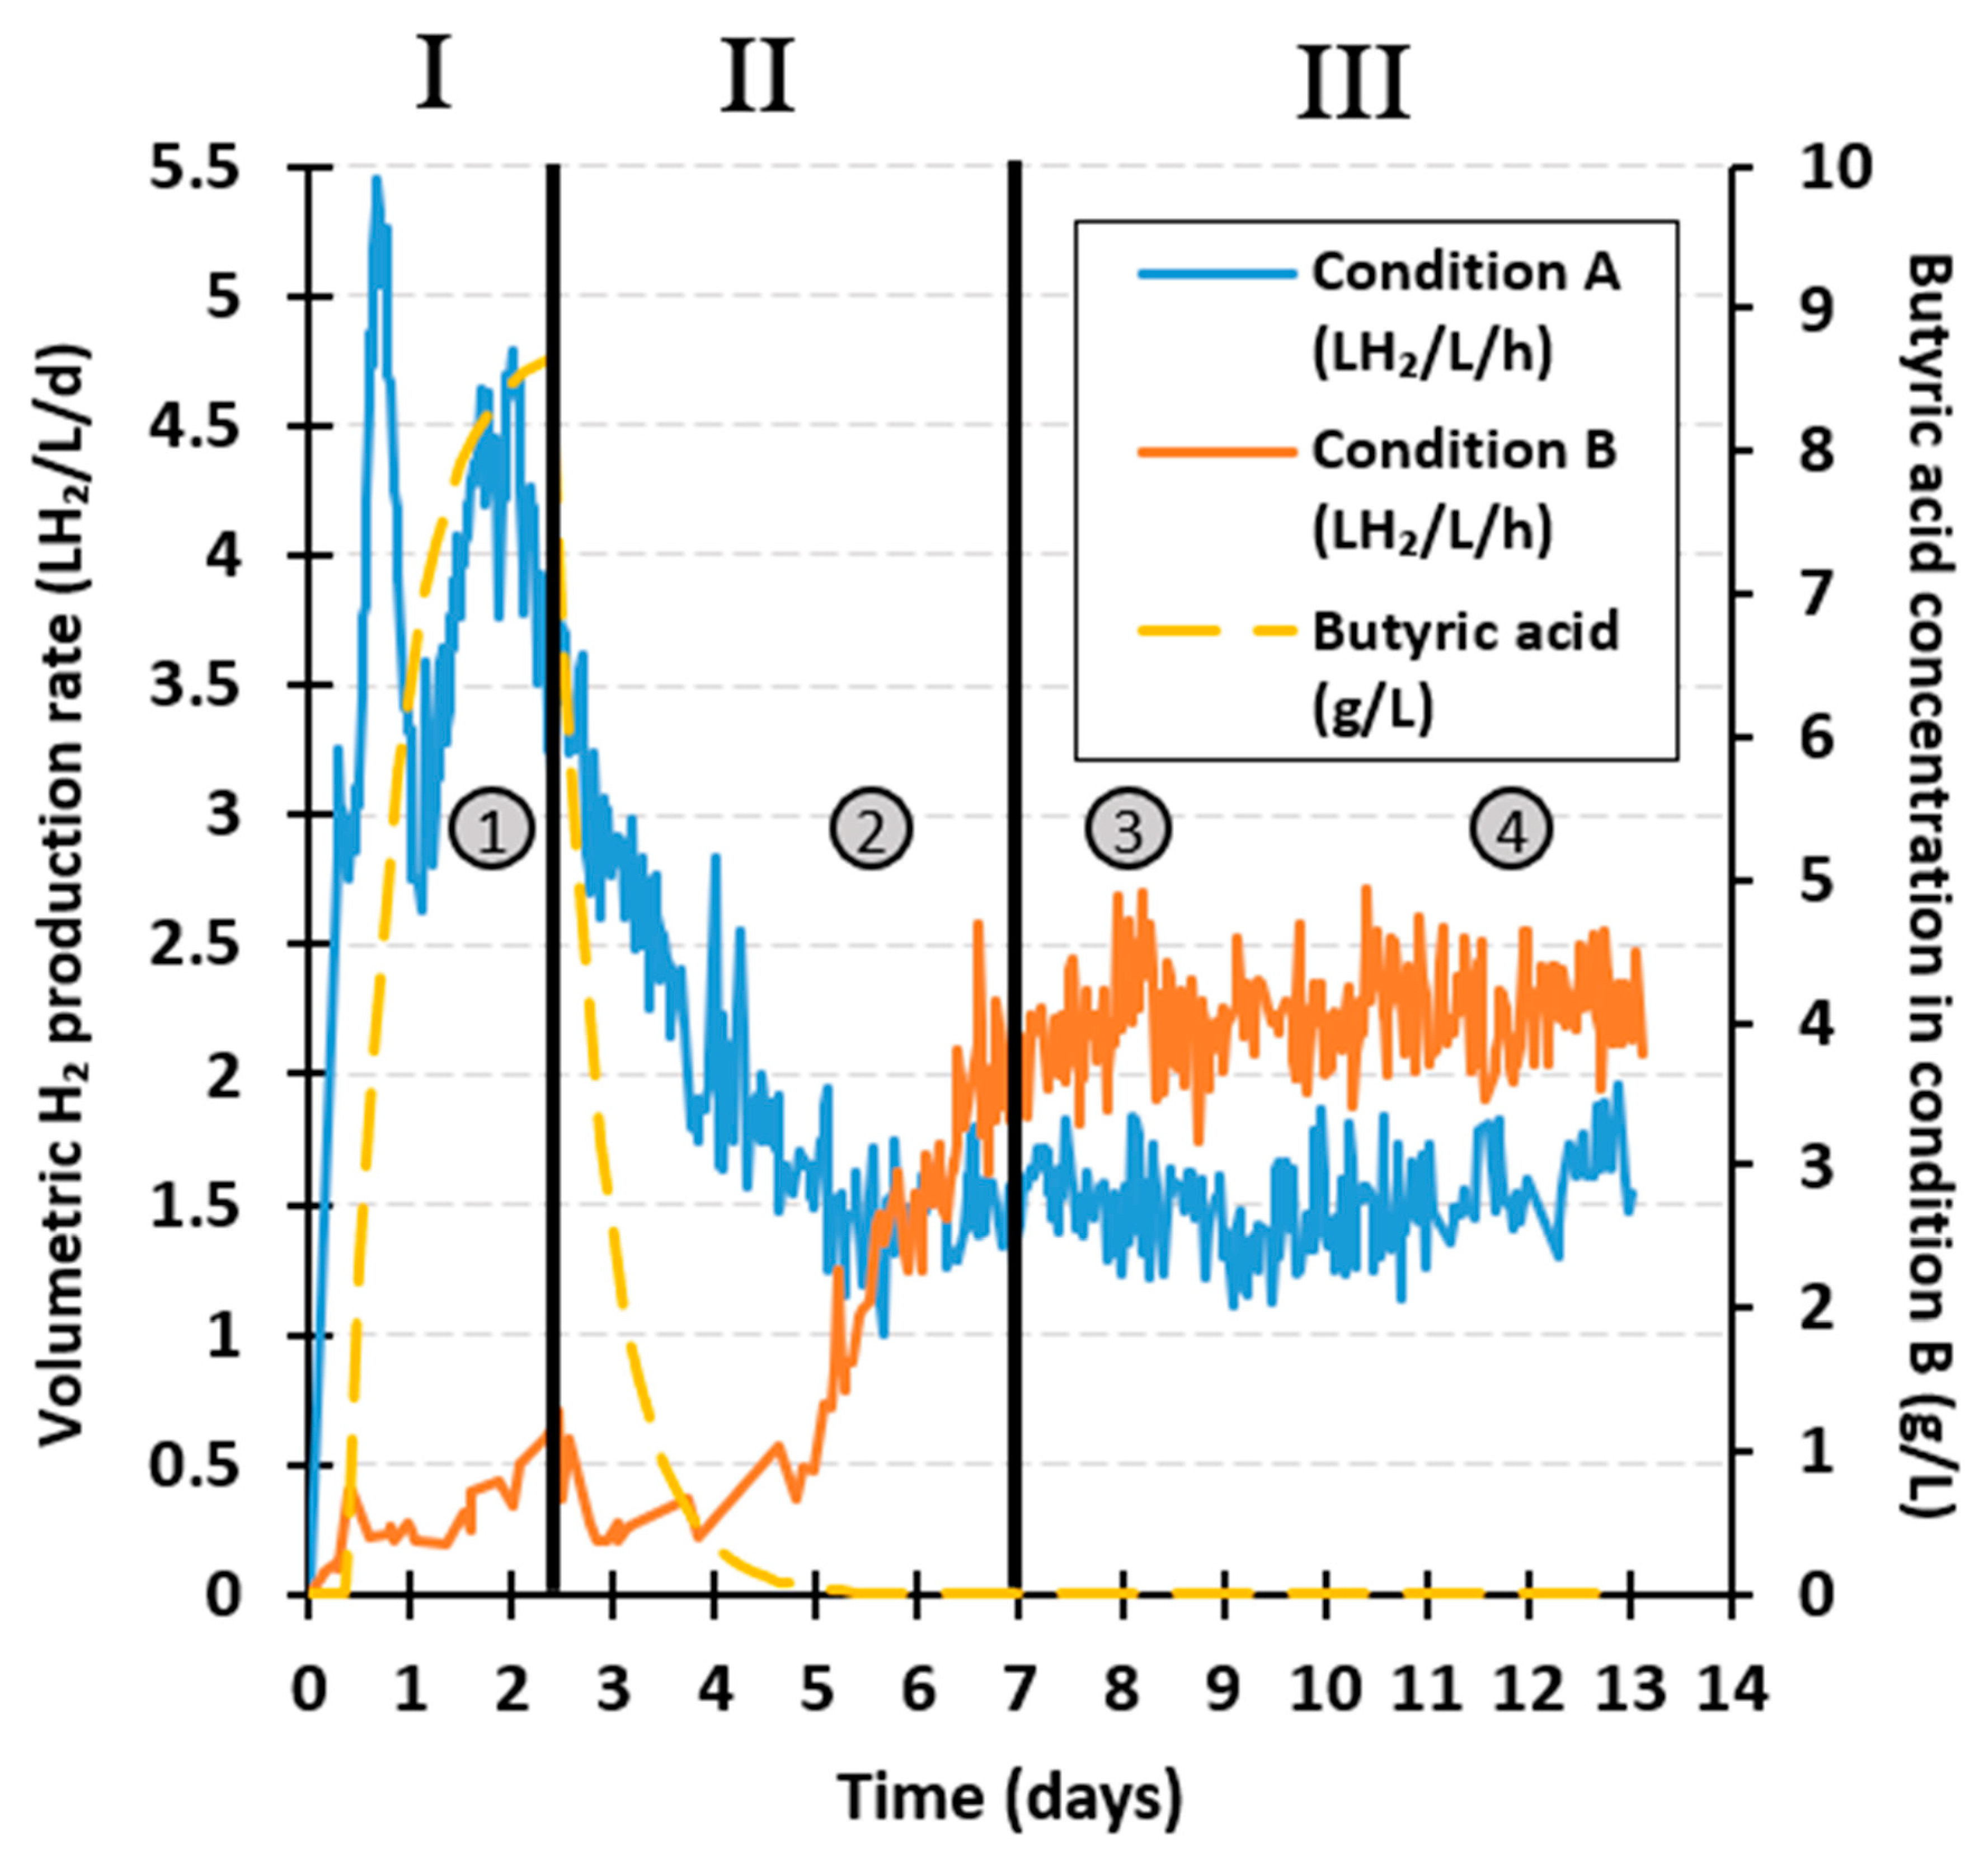
Figure 2 presents the volumetric H2 production rate (HPR, LH2·L·d−1) of the unstressed and stressed conditions (conditions A and B, respectively), as well as the theoretical evolution of exogenous butyric acid concentration (g·L−1, yellow dashes) added in condition B along the different periods of fermentation I, II, and III.
The highest HPR was reached during period I in the control condition A, with a maximum of 5.4 LH2·L·d−1. This production peak was substantially higher than previously reported maximum rates of 0.6 LH2·L·d−1 on FW in a CSTR operated at 35 °C, pH 5.5, 12 h HRT, and OLR of 37 gVS·L·d−1 [27], or 0.38 LH2·L·d−1 on FW under similar CSTR conditions of temperature and pH (35 °C, pH 5), but 60 h HRT and OLR of 46 gCOD·L·d−1 [28]. This improvement cannot be attributed to variations in the initial amount of inoculum, as in the present study, reactors were inoculated with 0.9 gVS·L−1 and started after a short 9 h batch mode, whereas the reactors were seeded with a higher amount in other studies (2.3 gVSS·L−1 and 8.04 gVS·L−1 [27,28]), and a longer start-up of 96 h in the experiments of Castillo-Hernández et al. [27]. Most likely, the treatments applied to the seed inoculum (i.e., freeze drying and thermal pretreatment) resulted in an enrichment of H2 producers, and thus, high H2 productivities. Similarly, the use of a high OLR of 60 gVS·L·d−1 certainly contributed to improve the HPR.
In comparison, the addition of butyric acid in condition B impacted the HPR, with a maximum of 0.61 LH2·L·d−1, corresponding to a 89% reduction of HPR with regard to the control. Such a reduction of H2 production, likely due to an inhibition of H2-producing bacteria, was stronger than other values reported in the literature. For instance, a continuous fermentation of glucose at pH 5.5 and 10 h HRT, in which 12.7 g·L−1 exogenous butyric acid was added, only reduced the HPR by 21%, from 0.29 to 0.23 L·h−1, and the H2 yield by 20%, from 2.5 ± 0.1 to 2.0 ± 0.1 molH2·molglucose−1 [15]. Likewise, exogenous butyric acid at concentrations similar to those employed in the present investigation (8.36 g·L−1) reduced the specific HPR only by 13%, from 61.8 ± 0.6 to 53.6 ± 0.5 mLH2·gVSS·h−1, and the H2 yield by 7%, from 1.75 ± 0.06 to 1.63 ± 0.04 molH2·molglucose−1, in a batch fermentation with glucose as substrate at pH 6 [34]. Nonetheless, the inhibitory effect of butyric acid on H2 production from glucose might be weaker than from more complex substrates, since, in this case, H2 production relies not only on fermentative bacteria but also on hydrolytic bacteria.
The second phase (period II) was associated with a progressive reduction of HPR, from 3.7 to 1.4 LH2·L·d−1 in condition A, and an increase in HPR from 0.6 to 2.0 LH2·L·d−1 in condition B (Figure 2, II). Six days were required to reach a steady-state in condition A. In comparison, Bakonyi et al. [13] estimated through a literature review, that the time to reach the steady-state, was from 10 to more than 30 days in a continuous fermentation reactor for bioH2 production; therefore, this 6 day period attained herein was fairly quick. In condition B, HPR exceeded the maximum value of 0.61 LH2·L·d−1 obtained in Period I, but only when exogenous butyric acid was totally washed out (i.e., after 5 days of fermentation). The duration required to reach steady-state conditions after the butyric acid stress was only 2 days (i.e., 4 HRTs). In comparison, six and seven days were necessary to recover a stable HPR of 7.48 ± 0.2 and 7.58 ± 0.23 LH2·L·d−1 in a continuous reactor fed with galactose (pH 5.5, HRT 12 h, OLR of 45 gCOD·L·d−1) after a transitory load shock and an acidification shock at pH 3.5, respectively [35]. Moreover, feeding a continuous reactor with tequila vinasse (pH 5.5, 4 h HRT) showed a recovery of the HPR in about 4 days, after 3 days of acidification at pH 3.8 [36]. In conclusion, the butyric acid stress mode applied here was less detrimental than the disturbances applied in the other studies.
Steady-states observed in Period III were associated with HPR of 1.5 ± 0.2 and 2.2 ± 0.2 LH2·L·d−1, in conditions A and B, respectively. By pre-stressing the reactor with butyric acid, HPR was substantially improved by 48% over the 6 day steady-state period. Again, HPR in these two conditions are higher than the previously reported HPR from other studies carried in similar operating conditions, but with lower OLR (0.6 LH2·L·d−1 with OLR of 37gVS·L·d−1 [27] and 0.38 LH2·L·d−1 with 46 gCOD·L·d−1 [28]).
3.2. Organic Acids: Focus on Butyric Acid
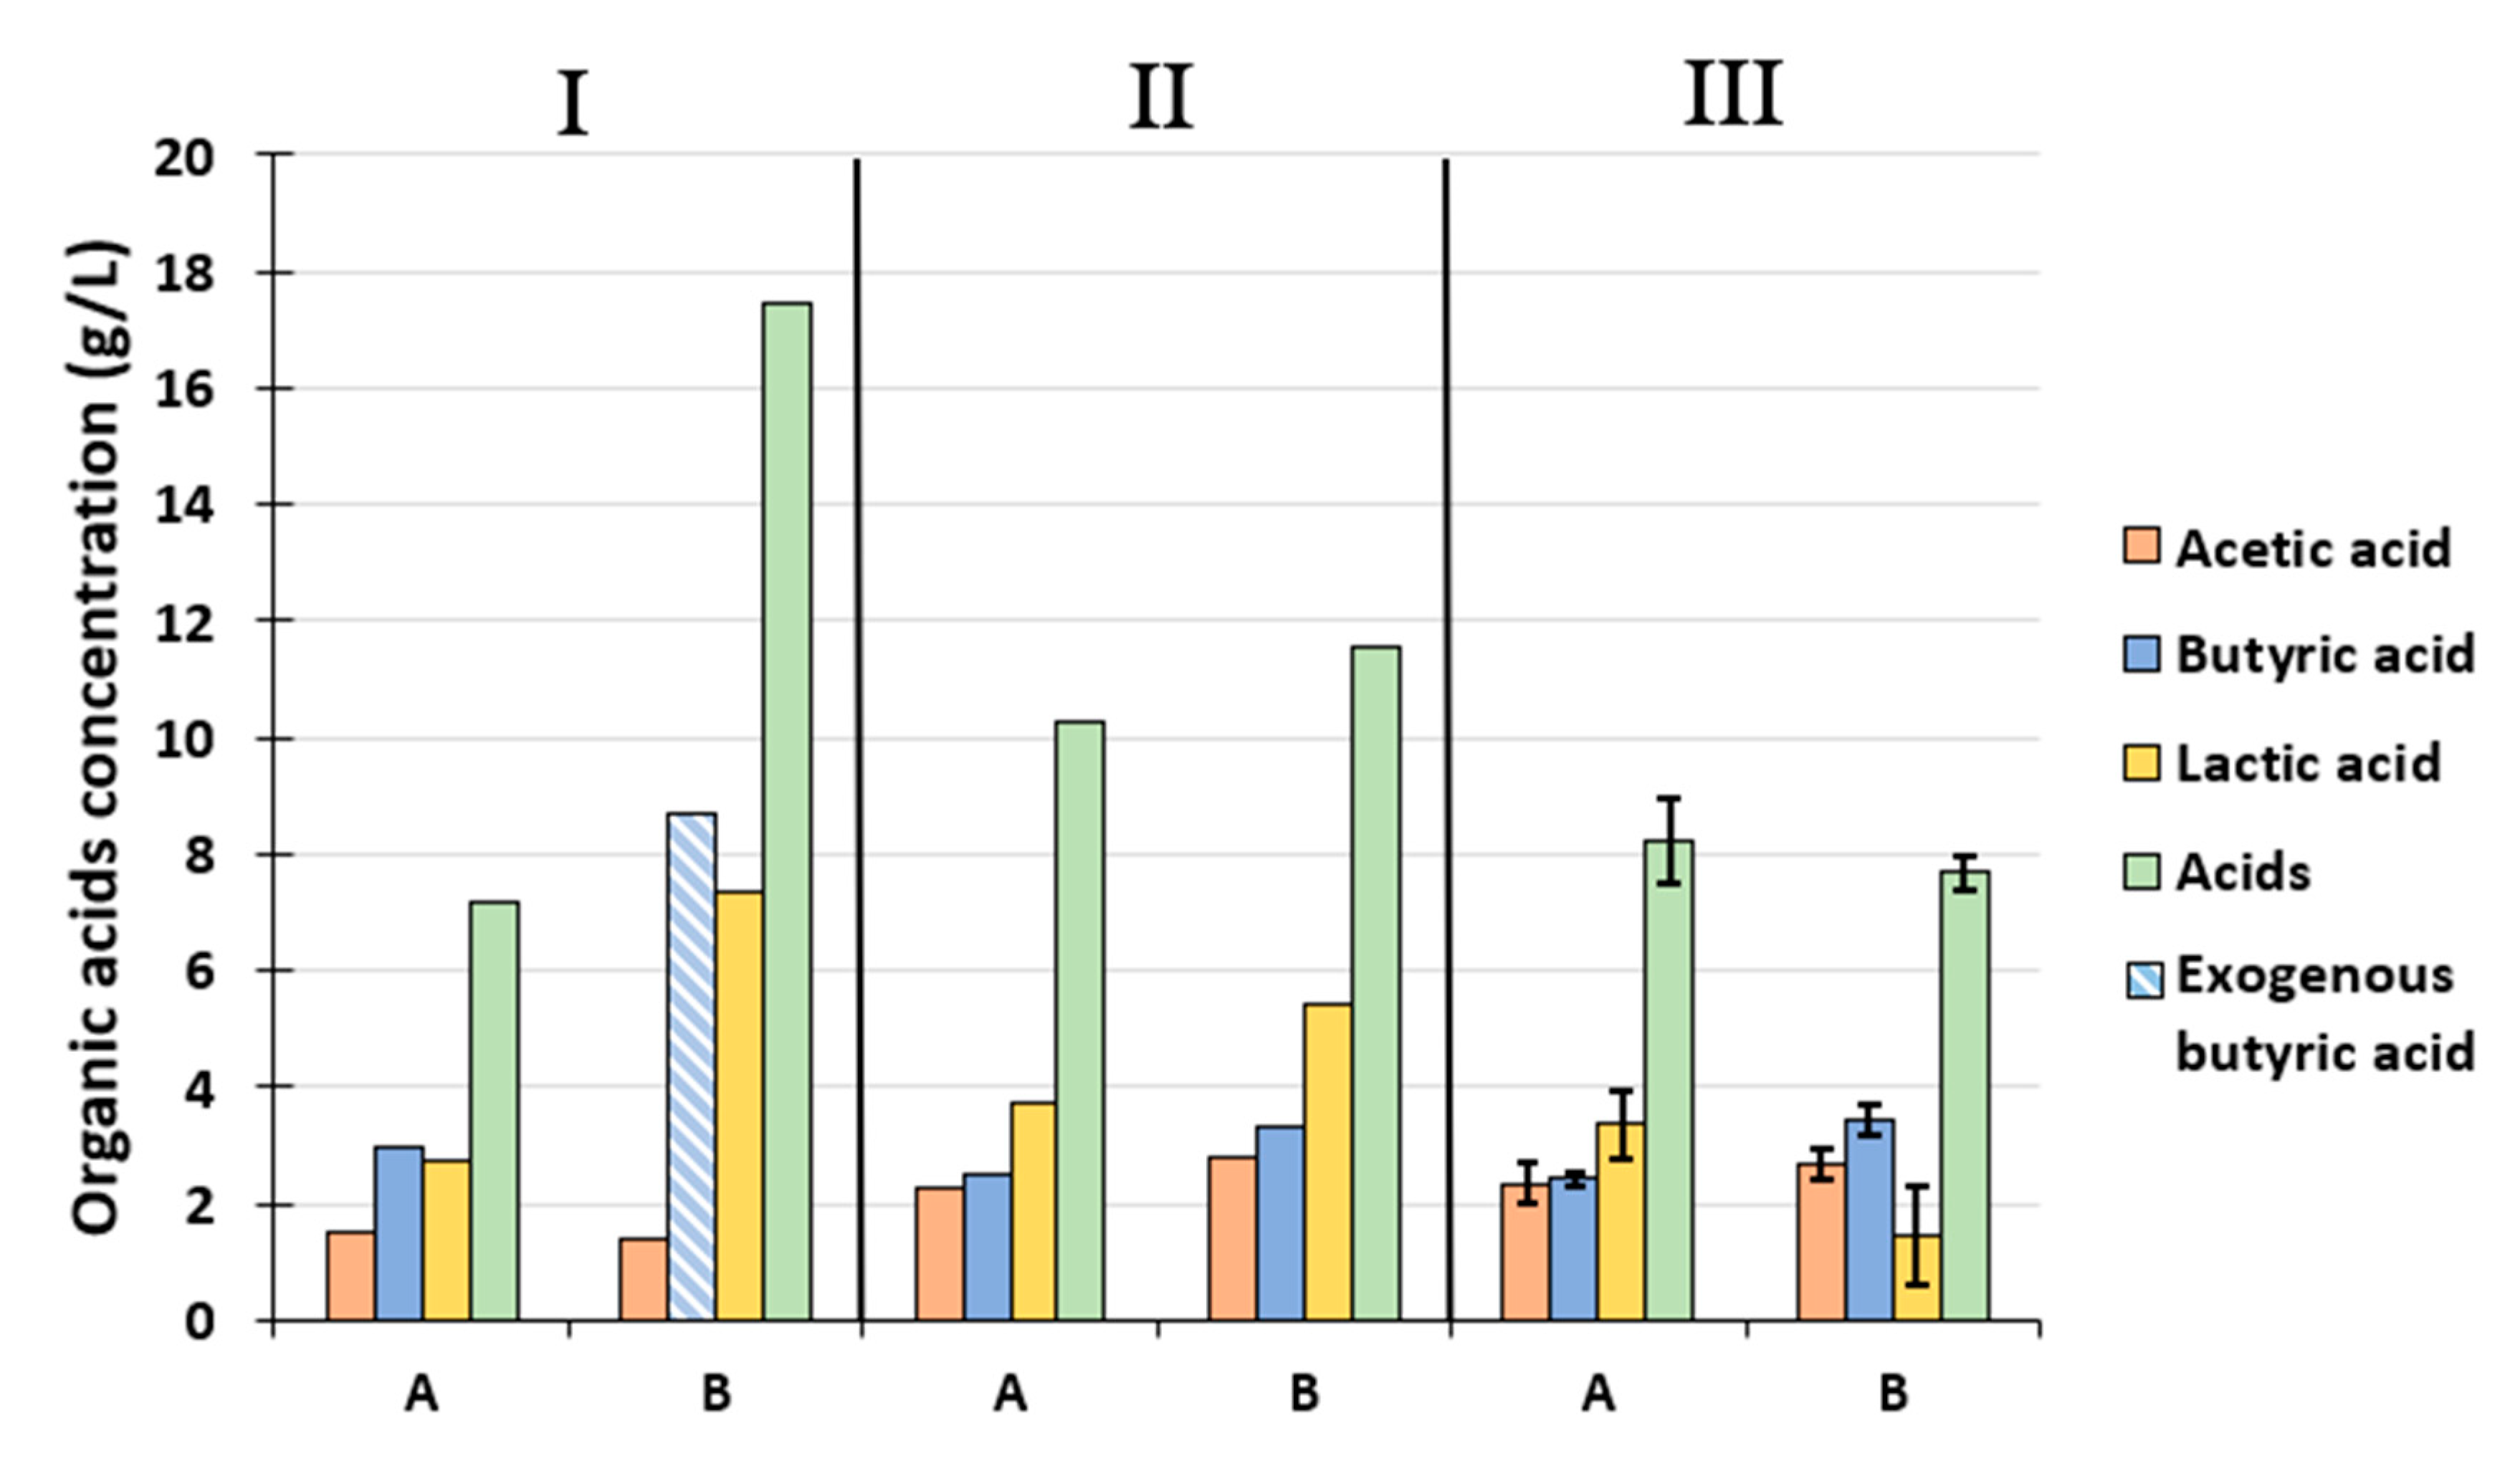
Figure 3 presents the concentrations of endogenous organic acids in periods I, II, and III, as well as in the concentration of exogenous butyric acid. In periods I, II, and III, the concentrations presented are those from samples taken at days 2 (when maximum exogenous butyric acid concentration was reached), 5.5 (when exogenous butyric acid was totally washed out), and an average of the concentrations of three samples taken during the steady-state, respectively. Organic acid concentrations at additional sampling points are presented in Supplementary Figure S1.
During period I, in the control condition A -, acetic acid, butyric acid, lactic acid, and total acid concentrations reached 1.5, 3.0, 2.7, and 7.2 g·L−1, respectively. These concentrations corresponded to a butyric/acetic acid (B/A) molar ratio of 1.4. This ratio is consistent with the high H2 production observed, as a B/A ratio of 1.5 was previously associated with efficient H2 production performances [37]. In condition B and period I, the measured butyric acid concentration corresponded exactly to the exogenous butyric acid added (8.7 g·L−1). This suggests that the butyric acid addition not only inhibited H2 production as presented in the previous section, but also the production of endogenous butyric acid. Similarly to condition A, the acetic acid concentration reached 1.4 g·L−1 and was not affected by the butyric acid addition. The fact that the addition of exogenous butyric acid inhibited its own production without affecting or even enhancing acetic acid production was already observed by Zheng et al. [34] and Huang et al. [22] with butyric acid concentrations up to 16.72 g·L−1 and 25 g·L−1, respectively. Enhancement of COD conversion into acetic acid during butyric acid stress conditions could be related to a higher ATP yield through an acetic acid pathway, rather than butyric acid, which may be necessary to cope with the acid stress and associated energy requirements, as suggested elsewhere [22]. Finally, the lactic acid concentration in condition B was 2.7 fold higher than in condition A, reaching 7.4 g·L−1. This high lactic acid production was attributed to changes in microbial community and / or at a cellular level, to a regulatory response to butyric acid stress to maintain the NADH/NAD+ balance [38].
Period II was associated, in condition A, with a decrease in butyric acid production and an increase in the production of acetic and lactic acids, which reached 2.5, 2.3, and 3.7 g·L−1, respectively. This result is consistent with the decrease in HPR, as B/A dropped to 0.74. In condition B, the increase in H2 production was associated with a high increase in the production of acetic and endogenous butyric acids, reaching 2.8 and 3.3 g·L−1, respectively, and a decrease in lactic acid production down to 5.4 g·L−1. B/A was then 0.8, which is similar to B/A in condition A and consistent with the similar HPR in the two conditions at the sampling time (5.5 days). It can be inferred from these data that the inhibitory threshold for HPR by organic acids is between organic acid concentrations measured in period II and I (i.e., 2.8 g·L−1 acetic acid with 3.3 g·L−1 butyric acid and 1.4 g·L−1 acetic acid with 8.7 g.L−1 butyric acid). In comparison, in a batch reactor fed with glucose and operated at pH 6, 12.5 g·L−1 of acid composed of 10.2 g·L−1 butyric acid and 2.3 g·L−1 acetic acid was shown to strongly inhibit the HPR [20].The lower threshold value in this study could be related to the use of a lower pH (5.5), which increases the undissociated acid concentration, or the high amount of lactic acid could have exerted an additional inhibitory effect [39].
During period III (i.e., steady-state), total organic acid production was slightly higher in condition A (8.2 ± 0.7 g·L−1) than in condition B (7.7 ± 0.3 g·L−1). This was explained by a higher lactic acid concentration of 3.3 ± 0.6 g·L−1 in condition A than 1.5 ± 0.8 g.L−1 in condition B. In addition, the butyric acid concentration increased in condition B, reaching 3.8 ± 0.3 g·L−1, whereas the acetic acid concentration remained stable at 2.7 ± 0.3 g·L−1. A significant correlation was found between butyric acid production and H2 yield after considering all periods and conditions A and B (Pearson correlation, correlation score: 0.72, p-value: 0.045); however, no correlation could be established between endogenous acid production and H2 yield (Pearson correlation, correlation score: −0.43, p-value: 0.29). To conclude, the initial butyric acid stress was associated with a metabolic pattern that had a 44% increase in butyric acid production, 56% decrease in lactic acid production, and a slight 14% increase in acetic acid production during the 6 day steady state.
Similarly, Huang et al. [22] induced butyric acid tolerance and improved H2 yield by 56%, from 1.43 to 2.25 molH2·molglucose−1, and HPR by 69%, from 0.26 to 0.44 LH2·L·h−1, by progressively increasing butyric acid concentration, up to 25 g.L−1, with glucose as substrate and in batch mode. This improvement was associated with a reduction of solvents (i.e., ethanol, butanol, and acetone) in favor of acetic and butyric acids, along with an increase in H+ ATPase activity from 72 to 128 U·gVSS−1 for the original and evolved cultures, respectively. The authors suggested that an enrichment in acid tolerant bacteria in the mixed culture permitted the improvement in H2 production performances, but the analysis of the microbial communities was missing to confirm the hypothesis. Using a different strategy based on a 7 day incubation, in a batch with no feeding in the presence of 4 g·L−1 butyric acid, Zhao et al. [21] improved the H2 yield by 214%, from 30 to 64 mLH2·gVS−1, using kitchen waste as substrate. These authors reported higher hydrolytic enzyme activities (β-glucosidase, BAA-hydrolyzing protease and dehydrogenase enzyme) in the reactor subjected to butyric acid stress. Here, the mechanisms underlying this improved H2 production performance will be discussed in the next sections.
3.3. Process Performance Indicators
Process performances in conditions A and B were assessed by several indicators which are presented in Table 2 for the periods I, II, and III. First, H2 yields decreased for condition A from 65 ± 12 mLH2·gVSadded−1 in period I to 25 ± 3 mLH2·gVSadded−1 in period III. Conversely, it increased for condition B from 4 ± 2 mLH2·gVSadded−1 in period I to 37 ± 3 mLH2·gVSadded−1 in period III. Yields observed at the steady-state in this study were higher than the yield of 11 mLH2·gVSadded−1 obtained by Castillo et al. [27] in very similar operating conditions (pH 5.5, 35 °C, 37.1 gVS·L·d−1, 12 h HRT, restaurant FW). The fact that the substrate used in this study corresponded to a reconstituted FW might explain its higher biodegradability with regard to other complex substrates coming from a real waste source. Nevertheless, the H2 yield was lower than other values reported in the literature in continuous reactors operated with real FW, which indicates the multiparametric influence on the process’ efficiency [28]. Indeed, a review made on FW conversion to H2 highlighted that many parameters can affect the H2 production, such as the carbohydrate content in the substrate, the applied pretreatments (either to the inoculum or to the substrate), the pH, temperature, OLR, and the HRT [9]. The operating conditions of the present study followed the guidelines provided in this latter review (i.e., heat treatment applied to the substrate and the inoculum together with an HRT lower than 72 h); however, the chosen low pH value of 5.5 may have limited the H2 yield, as pH 6–8 seems to be associated with higher process yields [9]. In addition, the same reconstituted food waste was fermented in batch conditions in the study conducted by Dauptain et al. [40] in flasks of 0.2 L working volume, at pH 6, and with an inoculum sampled in the same waste water treatment plant as the one used herein. The fermentation resulted in a H2 yield of 125 ± 7 mLH2·gVSadded−1, which is 3.4-fold higher than the one obtained in the present investigation (37 ± 3 mLH2·gVSadded−1). This fact confirms that the operating conditions (e.g., high OLR, low HRT) and the continuous feeding mode had a drastic effect on the process efficiency.
Additionally, the H2 proportion in the bioreactor headspace composition was greatly impacted by butyric acid addition in period I, as it was 5 ± 4 v/v% in condition B, in comparison with 54 ± 2 v/v% in condition A. Apart from this distinction in period I, no differences in H2 proportions in the headspace could be observed within the two conditions, with 48 ± 1 and 49 ± 4% in period II, and 48 ± 2 and 50 ± 1% in period III in condition A and B, respectively. In comparison, a lower H2 proportion of 35 ± 5% was found in the two studies conducted by Castillo Hernandez et al. [27] at an OLR of 57 gVS·L−1·d−1 and by Li et al. (OLR 50 ± 16 gCOD·L−1·d−1, pH 5.3–5.5, 35 °C, kitchen waste as substrate, 48 h HRT, intermittent CSTR) [41]. In their study, a comparison of the B/A molar ratio does not permit the conclusion of higher homoacetogenic activity as it reaches 0.93, which is equivalent to the ratio observed here in condition B, period III (0.96). Most likely, these lower proportions of H2 could be related to a higher consumption of lactate, as this pathway is known to be associated with higher CO2 production [42].
Globally, in condition A, COD conversion varied over time, with values of 34–37%, 36–41%, and 34 ± 2% in periods I, II, and III, respectively. COD conversion was reduced during butyric stress (Period I, condition B), with 26 and 27% of FW converted to metabolic products at days 1 and 2; therefore, the butyric acid stress impacted the global microbial activity. COD conversion peaked in period II, day 5.5, for conditions A and B at 36–41% and 40 ± 8%, respectively, but this level of degradation was not maintained. COD conversion was improved in the steady-state of condition B compared with that of condition A, reaching 37 ± 2% versus 34 ± 2%; therefore, the butyric pre-stressed condition slightly improved the substrate degradation during the period III by 9%. Castillo Hernandez et al. [27] (pH 5.5, 35 °C, 37.1 gVS·L·d−1, 12-h HRT, restaurant FW) reported COD removal that is comparable with the COD conversion observed in condition B, period I, with 23 ± 7%. Moreover, a higher COD removal of 33 ± 3% was found by Li et al. (OLR 50 ± 16 gCOD·L−1·d−1, pH 5.3–5.5, 35 °C, kitchen waste as substrate, 48 h HRT) [41], but with a lower HPR of 1.34 LH2·L−1·d−1, which is probably related to a greater production of H2 from lactate in their study, as previously suggested.
Improvement of the COD conversion observed in condition B could be explained by a higher amount of active biomass in the stressed reactor than in condition A. Additionally, an enrichment of the microbial community with hydrolytic and acidogenic functions due to microbial adaptation to high butyric acid concentrations might have occurred. Microbial community analysis was then carried out to validate this assumption.
3.4. Microbial Communities
3.4.1. Analysis of Microbial Communities at Genus Level
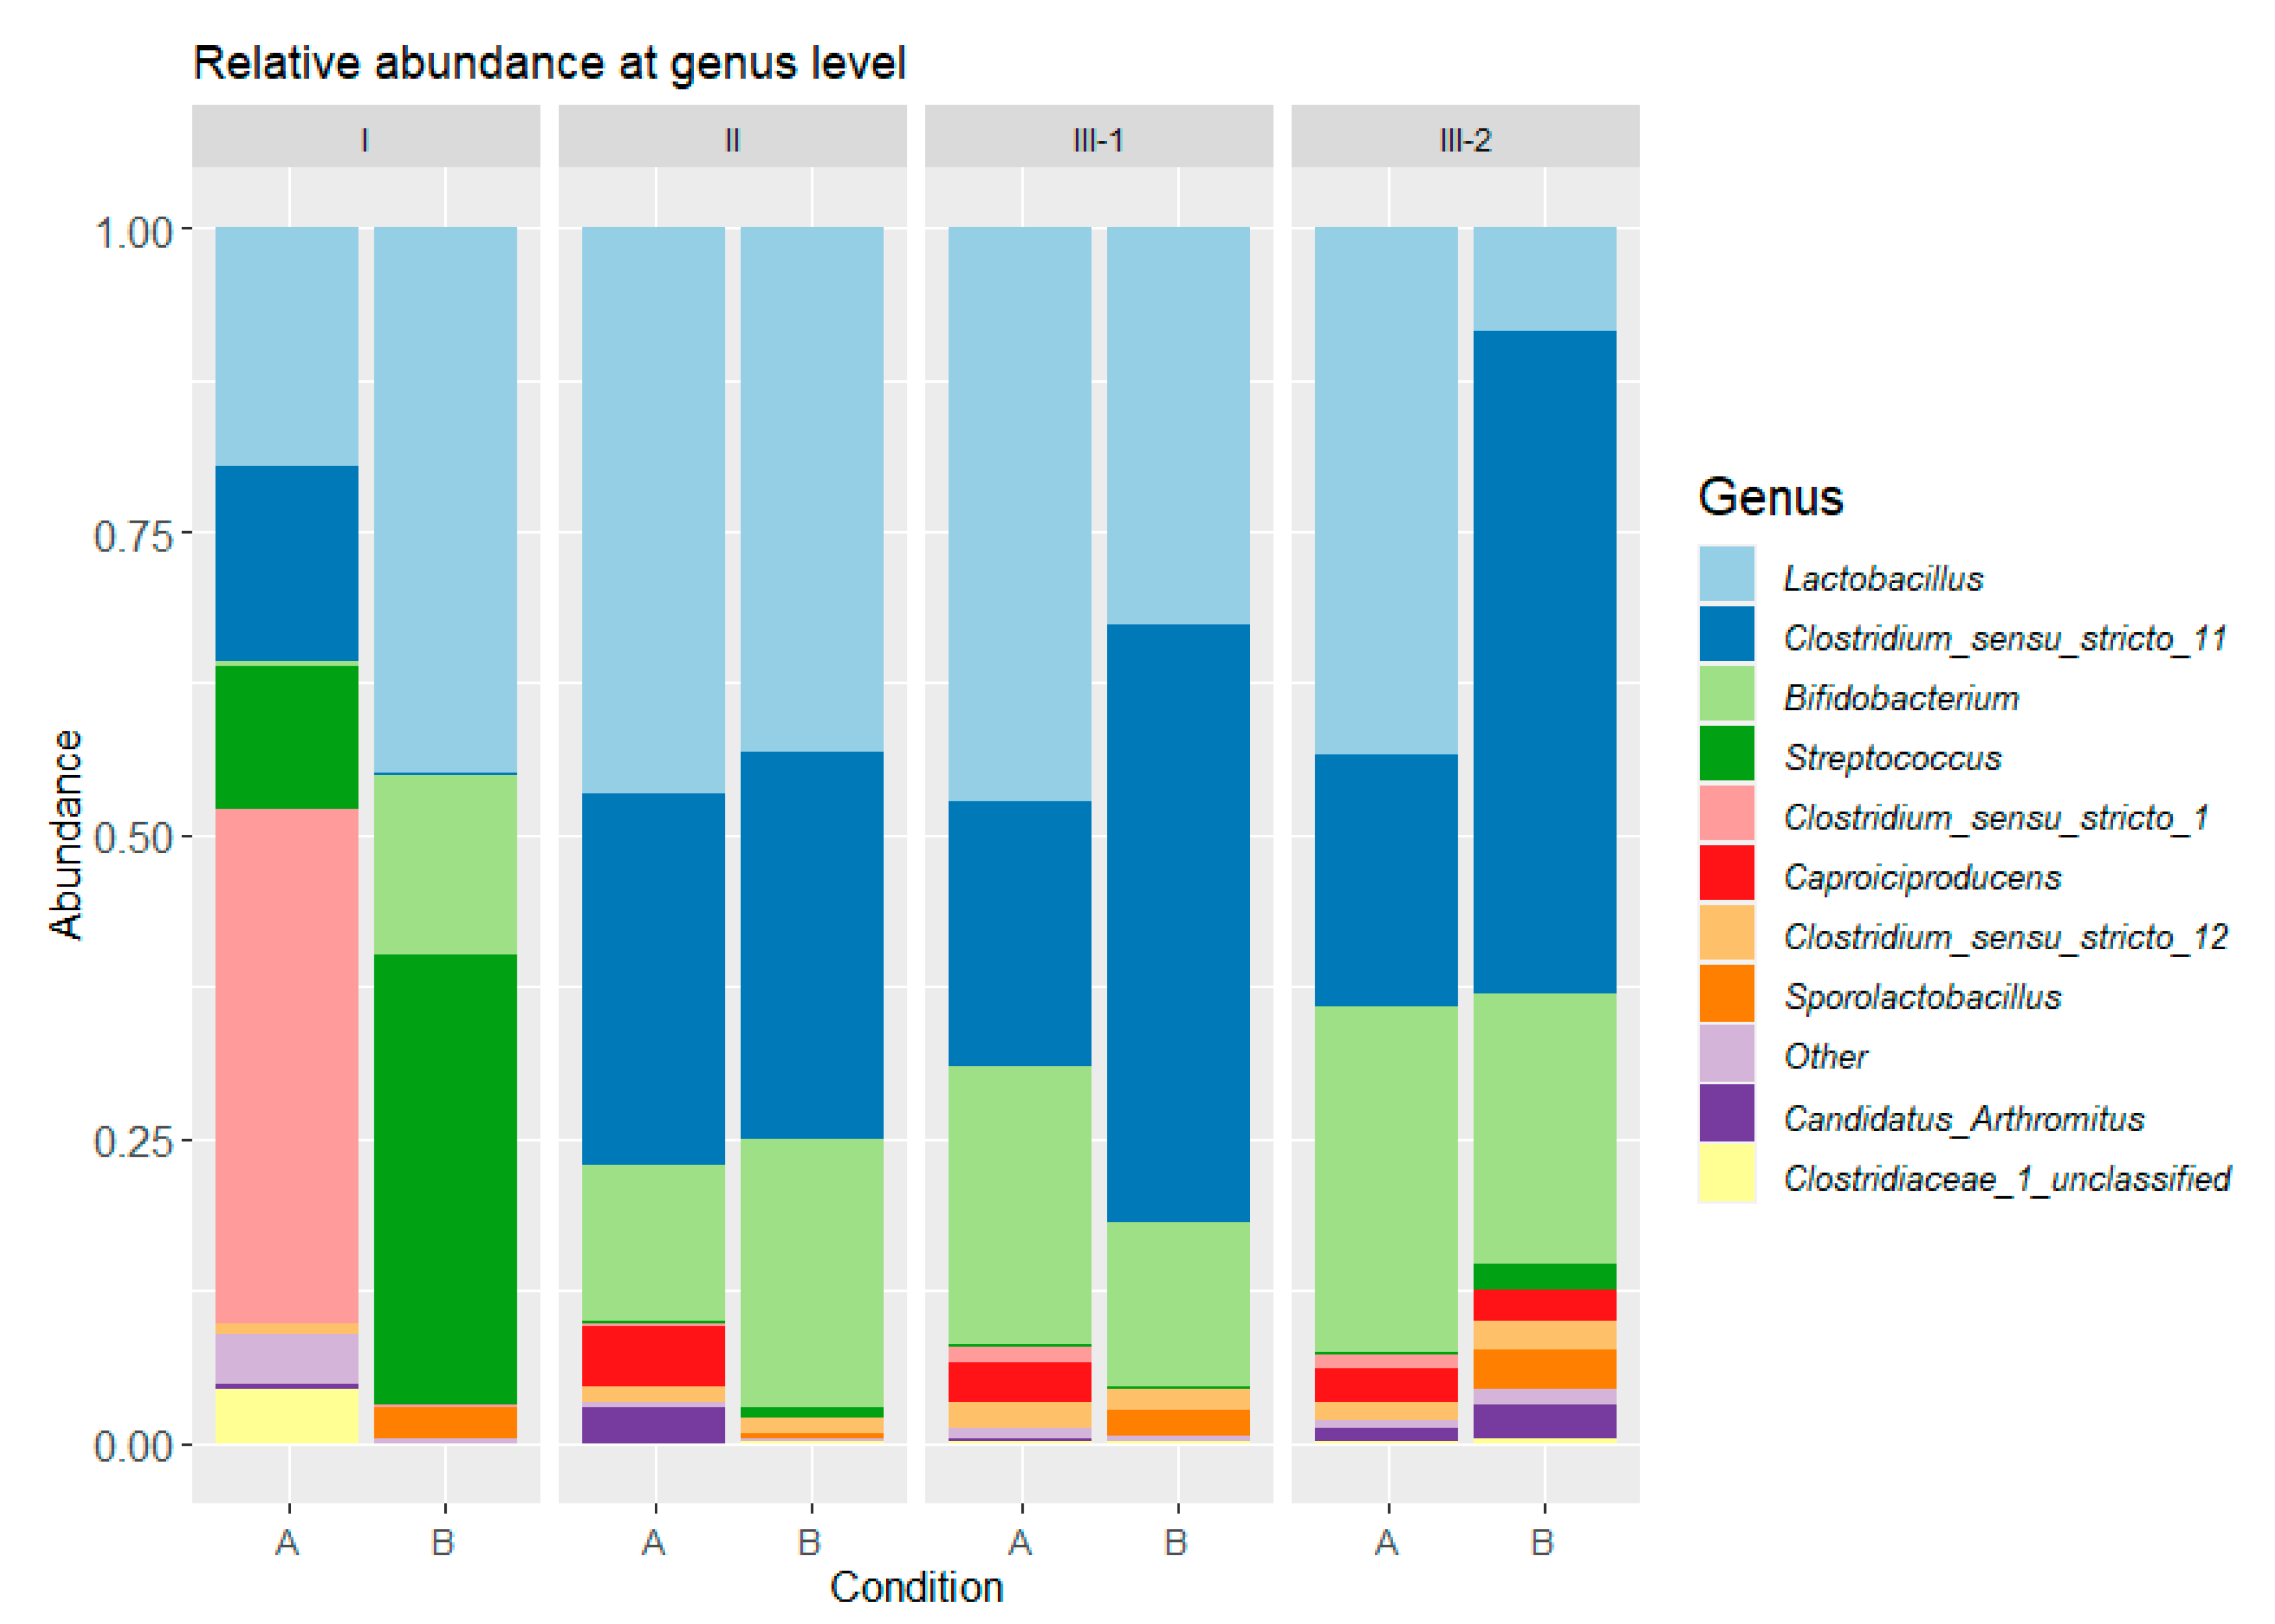
To decipher the mechanisms involved behind the improvement of H2 production in the pre-stressed reactor, microbial communities were analyzed. Figure 4 presents the relative abundance of bacterial communities at genus level in periods I, II, III-1, and III-2 at days 2, 5, 8, and 12, respectively, for conditions A and B. The bacterial community was composed of 1520 operational taxonomic units (OTUs). All OTUs with an abundance greater than 1% belonged to Firmicutes and Actinobacteria phyla and to only six families: Clostridiaceae, Streptococcaceae, Lactobacillaceae, Bifidobacteriaceae, Ruminococcaceae and Sporolactobacillaceae.
During period I, microbial community in condition A was dominated by 42% Clostridium_sensu_stricto_1 followed by 19% Lactobacillus sp. and 16% Clostridium_sensu_stricto_11. In total, Clostridium sp. represented 59% of the community, which is consistent with the high H2 production observed. In comparison, during the stress period (I), in condition B, the microbial community was only composed of 0.3% Clostridium sp. and was dominated by 44% Lactobacillus sp., 37% Streptococcus sp., and 15% Bifidobacterium sp. These genera are mostly associated with lactic and acetic acid production activities [28], which is consistent with the low H2 production (4 ± 2 mLH2·gVSadded−1) and the production of lactic and acetic acids observed during this period.
During period II, microbial communities in conditions A and B evolved towards a higher and similar proportion of Clostridium_sensu_stricto_11, at 31 and 32%, respectively. Clostridium_sensu_stricto_1, highly abundant in condition A, was totally washed-out during the fermentation process. It can be hypothesized that this genus was able to grow in the 9 h batch mode but failed to maintain when 12 h HRT was applied. As H2 production highly decreased in condition A from period I to period II, Clostridium_sensu_stricto_1 was related to higher H2 yields than Clostridium_sensu_stricto_11. Moreover, in conditions A and B, the Bifidobacterium sp. abundance increased up to 12 and 24%, respectively. As Bifidobacterium sp. can degrade carbohydrates into acetic acid [43], their increase in abundance was likely linked to the increase in acetic acid production from period I to period II in condition A. Lactobacillus sp. abundance increased in condition A up to 45%, which could be related to the reduction of H2 production performance and to the increase in lactic acid production. In comparison, Lactobacillus sp. abundance remained stable in condition B with 42%. Similarly, the undesirable growth of Lactobacillus sp. and Bifidobacterium sp. during the continuous fermentation of FW for H2 production was also reported by Canto-Robertos et al. (Anaerobic sequencing batch reactor, HRT = 48 h, 37 °C, pH 5–5.5) [44] and Villanueva-Galindo and Moreno-Andrade (Anaerobic sequencing batch reactor, HRT = 48 h, 37 °C, pH 5.5) [45]. Most likely, these bacteria were imported through the substrate [44]; therefore, the similar H2 production at day 5, in period II, in conditions A and B, was associated with similar metabolite production, functional redundancy of the microbial communities in the two conditions assessed, and the butyric stress did not prevent the growth of the substrate endogenous flora. Interestingly, and although the FW used in the present study was reconstituted, its fermentation was associated with the same emergence of substrate endogenous flora; however, the control of the bacterial growth in the substrate before fermentation through this reconstitution may also explain the stability of the process. Indeed, higher growth of endogenous flora and higher organic acids concentrations are expected in real FW [39], and the extent of this growth certainly affects the stability of the process.
Even though similar microbial communities were obtained in period II, they evolved differently in period III. Indeed, at the beginning of period III (III-1), in condition A, Clostridium_sensu_stricto_11 was outcompeted (22%) by Lactobacillus sp. (46%) and Bifidobacterium sp. (23%). Conversely, in condition B, Clostridium_sensu_stricto_11 outcompeted the other bacteria as its abundance increased up to 49%, whereas Lactobacillus sp. and Bifidobacterium sp. abundances decreased to 31 and 13%, respectively. At the end of period III (III-2), Clostridium_sensu_stricto_11 abundance remained stable in A and B conditions, at 21 and 54%, respectively. It could therefore be interpreted that this genus was the main bacteria ensuring stable H2 production in both stressed and control reactors. Moreover, in conditions A and B, Bifidobacterium abundance increased up to 28 and 22%, respectively. Lactobacillus highly decreased in condition B, reaching 6%, whereas its abundance remained stable in condition A at 43%. Likewise, in condition B, minor OTUs progressively increased with fermentation time, from 4% to 15%. It is interesting to note that although metabolic production was stable in terms of concentration from day 7 to day 14, during period III of conditions A and B, part of the bacterial community showed some versatility.
3.4.2. Principal Component Analysis
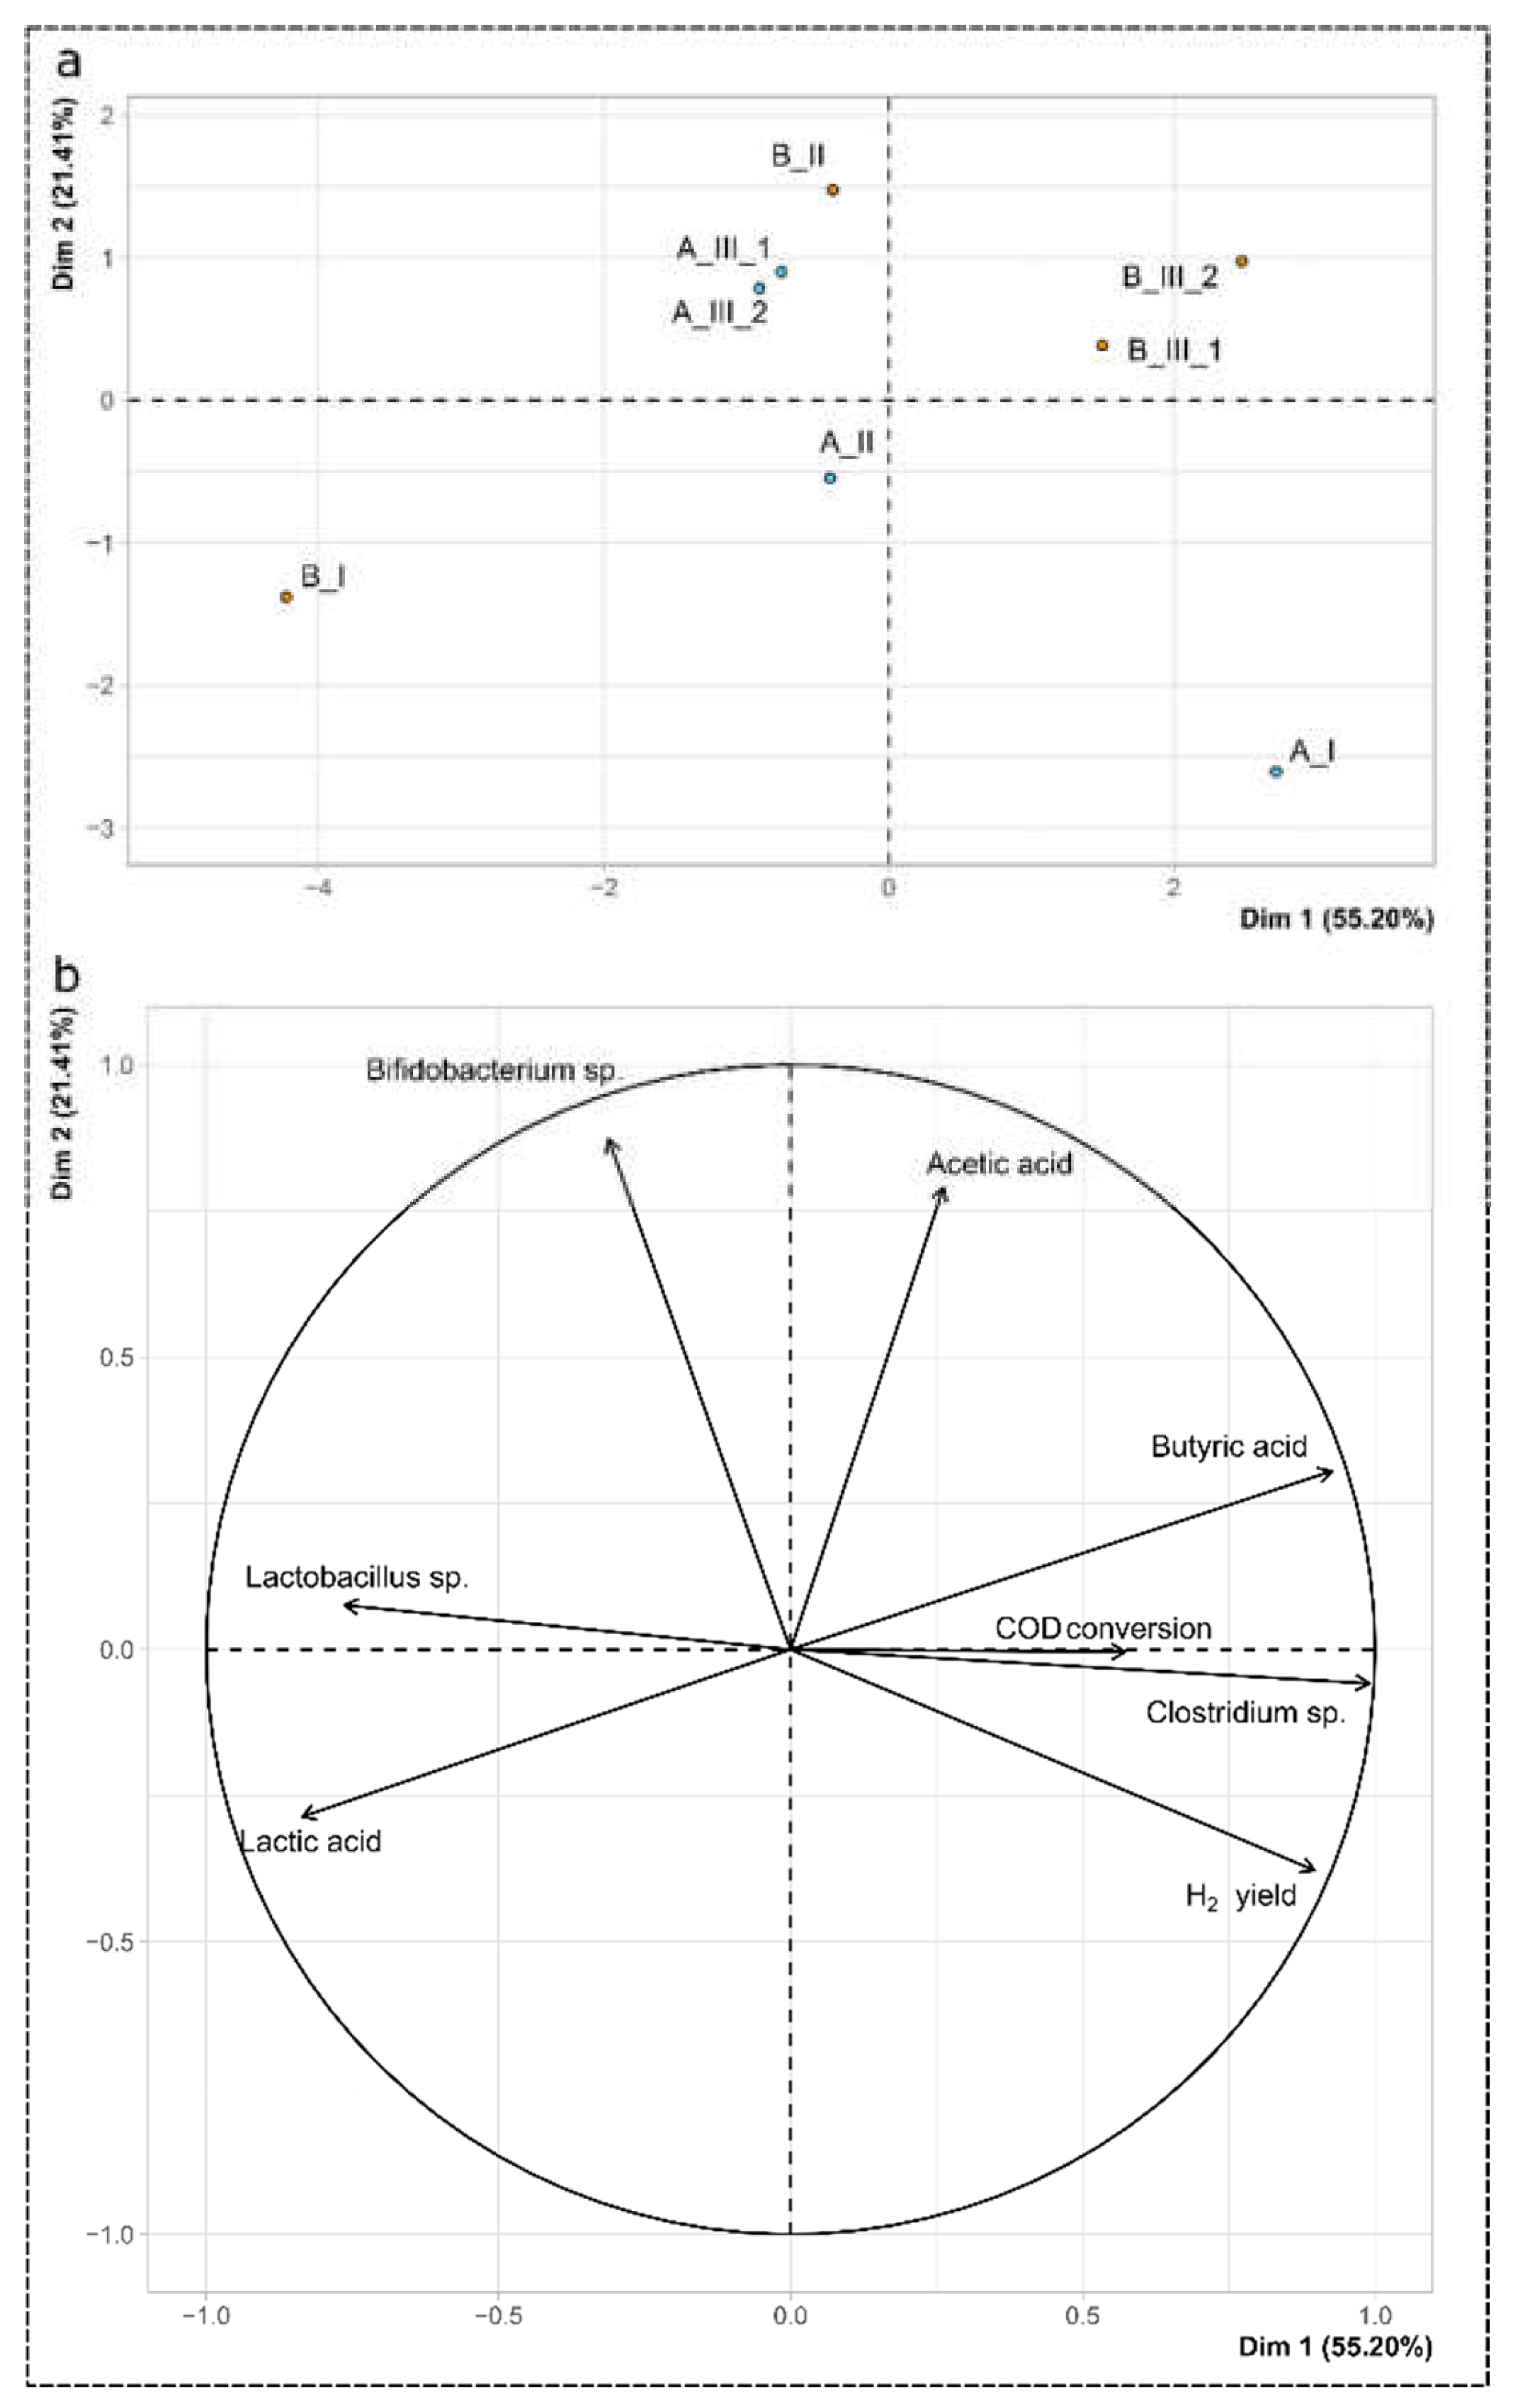
To better understand the interaction among the microbial communities, the performance indicators and the butyric stress applied, a principal component analysis (PCA) was performed (Figure 5). The variables considered in the analysis were: H2 yield, acetic, endogenous butyric, and lactic acid concentrations, Clostridium sp. relative abundance, Lactobacillus sp. relative abundance, Bifidobacterium sp. relative abundance, and COD conversion. The principal components 1 and 2 accounted for 55.2% and 21.4% of the dataset variance, respectively, for a total of 76.6% of the variance explained in the analysis. The first principal component (Dim 1 on Figure 5) correlated highly positively with Clostridium sp. abundance, endogenous butyric acid concentration, and H2 yields with correlation scores of 0.99, 0.93 and 0.90, respectively, and p-values of 2.3 × 10⁻⁶, 9.6 × 10⁻⁴ and 2.6 × 10⁻³, respectively. In addition, this component negatively correlated with Lactobacillus sp. abundance and lactic acid concentrations, with correlations scores of −0.76 and −0.84, respectively, and p-values of 2.8 × 10⁻² and 9.8 × 10⁻³, respectively. This result supports the observation that Clostridium sp. was primarily responsible for the production of H2 and butyric acid, whereas Lactobacillus sp. exerted an inhibitory activity associated with the production of lactic acid. The second principal component (Dim 2 on Figure 5), positively correlated with Bidifobacterium sp. abundance and with acetic acid concentration, with correlation scores of 0.87 and 0.79, respectively, and p-values of 4.7 × 10⁻³ and 2.0 × 10⁻², respectively. The individual plot (Figure 5a) highlights and summarizes the differences in performances in period I between conditions A and B (individual B_I and A_I) during the butyric acid stress, as well as in period III (individuals A_III_1, A_III_2, B_III_1 and B_III_2). In addition, the close coordinates of A_III_1 and A_III_2 on one hand, and of B_III_1 and B_III_2 on the other hand, strengthen the previous description of a steady-state.
3.4.3. Diversity and Abundances at Species Level
A deeper analysis at species level was performed in order to improve the understanding of the dynamics of microbial communities during the fermentation process. Table 3 presents the identification at the species level (where possible) for OTUs with an abundance higher than 5% in at least one sample.
First, the diversity of the bacterial community was evaluated for the two conditions A and B and during the three periods. The Shannon index ranged between 1.3 and 1.9 in all samples and period I was associated with a slightly lower Shannon index of 1.3 in condition B, compared with 1.9 in condition A. In period III-2, no more differences in the Shannon index appeared between condition A and B (1.6), suggesting that microbial diversity was more constrained at the steady-state with the operating conditions, rather than the initial butyric stress. These values are very similar to those obtained during the batch fermentation of real FW, without inoculum addition, at pH 6 (1.1–1.9) [46]; however, this diversity index was really low in comparison with the Shannon index, ranging between 4.9 and 5.4, and calculated during the fermentation of FW in an anaerobic sequencing batch reactor (48 h HRT, 37 °C, pH 5–5.5, heat treated anaerobic granular sludge used as inoculum) [44]. Again, the low diversity in the present study could be explained by the harsh treatment applied to the inoculum (freeze-drying, heat shock) or to the low HRT of 12 h. The evenness of the microbial communities was estimated with the Pielou index, which did not vary between the conditions and ranged between 0.4 and 0.6.
The Clostridium genus was only represented by three major species: Clostridium guangxiense, Clostridium perfringens, and Clostridium butyricum. More precisely, only C. guangxiense remained at a high abundance in conditions A and B, during periods II and III, with values ranging between 21 and 54%. The decrease in HPR from period I to period II in condition A could be explained by a lower H2 yield exhibited by C. guangxiense in comparison with C. perfringens. Indeed, Wang et al. [47] reviewed H2 production with various Clostridium species and highlighted that, with glucose as substrate, H2 yield ranged between 1.4–3.9 molH2·molglucose−1 with C. perfringens, and between 0.6–3.0 molH2·molglucose−1 with C. acetobutylicum [47] (the closest species to C. guangxiense [48]).
In conditions A and B, Streptococcus sp., which was initially present at a significant abundance in period I (12 and 37% in conditions A and B, respectively), was identified with the same similarity score of 100% as Streptococcus parasuis, Streptococcus suis, and Streptococcus equinus. As for C. perfringens and C. butyricum, this OTU was not found in periods II and III anymore. This suggests that continuous flow induced a wash-out of all these species that succeeded in growing in the 9 h batch mode. No identification at the species level could be done for Bifidobacterium sp. Concerning Lactobacillus sp., some differences were observed between conditions A and B at the species level. Indeed, Lactobacillus delbrueckii was identified in condition A in significant abundances from 19 to 42%, whereas it reached a maximum of 3% in condition B. In contrast, the abundance of Lactobacillus johnsonii was high in condition B, from 30 to 41%, in periods I to III-1, whereas it was totally absent in condition A. Interestingly, L. johnsonii almost totally disappeared between periods III-1 and III-2 (abundance from 30% to 1%), although H2 and organic acid production was stable. Jo et al. [49] showed that instability in continuous H2 producing reactors was associated with a bloom of Lactobacillus sp. in conjunction with Clostridium sp. inhibition. Here, the instability in Lactobacillus sp. abundance at species level did not affect C. guangxiense abundance in both conditions during the 6 day steady-state period studied. This interesting result may be due to a resistance of C. guangxiense, or a selection of Lactobacillus sp., which did not perform an inhibitory activity towards Clostridium sp. For example, an interaction between Clostridium sp. and Lactobacillus sp. during the fermentation of wheat straw was associated with the highest H2 production, without inhibitory interaction between the strains, but a potential cross-feeding relation [50]; however, as L. delbrueckii and L. johnsonii are both used as probiotics to inhibit C. perfringens [51,52], and considering the PCA results, we favor the hypothesis that these strains exerted an inhibitory activity against C. guangxiense, but with unidentified mechanisms; the latter succeeded in maintaining its abundance in the process.
Finally, several hypotheses can be formulated to explain the higher abundance of C. guangxiense after butyic acid stress. A better resistance of C. guangxiense to butyric acid in condition B does not seem convincing, as its abundance was 0% in the stress period. Alternatively, if cross-feeding was established between Lactobacillus sp./Bifidobacterium sp. and C. guangxiense, with H2 production from lactic acid achieved by C. guangxiense (as observed and reviewed in several DF on complex substrates by García-Depraect et al. [42]), then, the higher lactic acid concentration in condition B (7.4 g.L−1), during the stress period, may have stimulated a C. guangxiense abundance increase. Otherwise, the suppression of L. delbrueckii abundance in condition B, mainly replaced by Bifidobacterium sp. and L. johnsonii, may have resulted in a higher activity of C. guangxiense, in conjunction with a relief in terms of inhibition.
4. Conclusions
The interest of applying a pre-stress exogenous butyric acid addition, for 48 h prior to continuous DF of FW to increase the H2 production yield and HPR, was investigated. The stress applied enhanced H2 production by 48% during a 6 day steady-state period when compared with the control reactor. This improvement was associated with an increase in butyric acid production by 44%, an increase in COD conversion from 26 ± 2% to 32 ± 5%, and a decrease in lactic acid production by 56%, which was confirmed by a PCA. Microbial analysis revealed that butyric acid pre-stress altered the microbial structure. In fact, the higher H2 production was associated with an increase in the abundance of the H2-producer C. guangxiense, from 22% to 52%. Microbial diversity was lowered from 1.9 to 1.3 (Shannon index) during the butyric acid stress, but during the steady-state, no differences in diversity were detected. In addition, the instability of the Lactobacillus species during the steady-state period was not associated with an inhibition of C. guangxiense abundance; therefore, the adaptation of inocula with acid stress may be an interesting strategy to be implemented in order to improve FW degradation into H2 and enhance the process stability in a continuous fermentation.
Supplementary Materials
The following supporting information can be downloaded at: https://www.mdpi.com/article/10.3390/en15114048/s1, Figure S1: Acetic acid (a), butyric acid (b) and lactic acid (c) concentrations in conditions A and B. The four samples used for microbial community characterization in conditions A and B are represented in black circle filled in grey to indicate their time of collection.
Author Contributions
Conceptualization, M.C.N., R.E. and E.T.; data curation, M.C.N.; formal analysis, M.C.N.; funding acquisition, E.T.; investigation, M.C.N.; methodology, M.C.N.; project administration, E.T.; resources, N.B., R.E. and E.T.; supervision, N.B., R.E. and E.T.; visualization, M.C.N. and J.A.M.; writing—original draft, M.C.N.; writing—review and editing, M.C.N., J.A.M., N.B., R.E. and E.T. All authors have read and agreed to the published version of the manuscript.
Funding
The research was supported by the ProBHyM project financed by National Research Agency (n° ANR-18-CE43-0012-01) in France.
Institutional Review Board Statement
Not applicable.
Informed Consent Statement
Not applicable.
Data Availability Statement
Sequences were submitted to GenBank, under the accession number PRJNA785481.
Acknowledgments
The authors are grateful for Gaëlle Santa-Catalina’s work concerning biomolecular tasks and 16S sequencing. The authors would like to express their acknowledgments to INRAE Bio2E Facility (Bio2E, INRAE,2018. Environmental Biotechnology and Biorefinery Facility (https://doi.org/10.15454/1.557234103446854E12, accessed on 30 May 2022), where the experiments were conducted. Jose Antonio Magdalena would like to thank the Complutense University of Madrid for the financing of his contract at LBE-INRAE (France), with funds of the Ministry of Universities for the requalification of the Spanish University System for 2021–2023 (Modality 1. Margarita Salas), coming from the European Union-Next generation EU funding. This study was carried out in the framework of the HyDS Project (part of the ERDF-REACT-EU- H2VERT project).
Conflicts of Interest
The authors declare no conflict of interest. The funders had no role in the design of the study; in the collection, analyses, or interpretation of data; in the writing of the manuscript, or in the decision to publish the results.
Abbreviations
| COD | Chemical oxygen demand |
| DF | Dark Fermentation |
| FW | Food Waste |
| HPR | Hydrogen production rate |
| HRT | Hydraulic retention time |
| OLR | Organic loading rate |
| ORP | Oxidation reduction potential |
| TS | Total solids content |
| VS | Volatile solids content |
References
- Singh, S.; Jain, S.; Ps, V.; Tiwari, A.K.; Nouni, M.R.; Pandey, J.K.; Goel, S. Hydrogen: A Sustainable Fuel for Future of the Transport Sector. Renew. Sustain. Energy Rev. 2015, 51, 623–633. [Google Scholar] [CrossRef]
- Nikolaidis, P.; Poullikkas, A. A Comparative Overview of Hydrogen Production Processes. Renew. Sustain. Energy Rev. 2017, 67, 597–611. [Google Scholar] [CrossRef]
- Karatza, D.; Konstantopoulos, C.; Chianese, S.; Diplas, S.; Svec, P.; Hristoforou, E.; Musmarra, D. Hydrogen Production through Water Splitting at Low Temperature over Fe3O4 Pellet: Effects of Electric Power, Magnetic Field, and Temperature. Fuel Process. Technol. 2021, 211, 106606. [Google Scholar] [CrossRef]
- Singh, T.; Alhazmi, A.; Mohammad, A.; Srivastava, N.; Haque, S.; Sharma, S.; Singh, R.; Yoon, T.; Gupta, V.K. Integrated Biohydrogen Production via Lignocellulosic Waste: Opportunity, Challenges & Future Prospects. Bioresour. Technol. 2021, 338, 125511. [Google Scholar] [CrossRef]
- Dincer, I.; Acar, C. Review and Evaluation of Hydrogen Production Methods for Better Sustainability. Int. J. Hydrogen Energy 2014, 40, 11094–11111. [Google Scholar] [CrossRef]
- Chen, Y.; Yin, Y.; Wang, J. Recent Advance in Inhibition of Dark Fermentative Hydrogen Production. Int. J. Hydrogen Energy 2021, 46, 5053–5073. [Google Scholar] [CrossRef]
- Ghimire, A.; Frunzo, L.; Pirozzi, F.; Trably, E.; Escudie, R.; Lens, P.N.L.; Esposito, G. A Review on Dark Fermentative Biohydrogen Production from Organic Biomass: Process Parameters and Use of by-Products. Appl. Energy 2015, 144, 73–95. [Google Scholar] [CrossRef]
- Liu, Z.; Zhang, C.; Lu, Y.; Wu, X.; Wang, L.; Wang, L.; Han, B.; Xing, X.H. States and Challenges for High-Value Biohythane Production from Waste Biomass by Dark Fermentation Technology. Bioresour. Technol. 2013, 135, 292–303. [Google Scholar] [CrossRef]
- Jarunglumlert, T.; Prommuak, C.; Putmai, N.; Pavasant, P. Scaling-up Bio-Hydrogen Production from Food Waste: Feasibilities and Challenges. Int. J. Hydrogen Energy 2018, 43, 634–648. [Google Scholar] [CrossRef]
- Kim, D.H.; Kim, S.H.; Jung, K.W.; Kim, M.S.; Shin, H.S. Effect of Initial pH Independent of Operational pH on Hydrogen Fermentation of Food Waste. Bioresour. Technol. 2011, 102, 8646–8652. [Google Scholar] [CrossRef]
- Kim, D.H.; Jang, S.; Yun, Y.M.; Lee, M.K.; Moon, C.; Kang, W.S.; Kwak, S.S.; Kim, M.S. Effect of Acid-Pretreatment on Hydrogen Fermentation of Food Waste: Microbial Community Analysis by next Generation Sequencing. Int. J. Hydrogen Energy 2014, 39, 16302–16309. [Google Scholar] [CrossRef]
- Kim, D.H.; Wu, J.; Jeong, K.W.; Kim, M.S.; Shin, H.S. Natural Inducement of Hydrogen from Food Waste by Temperature Control. Int. J. Hydrogen Energy 2011, 36, 10666–10673. [Google Scholar] [CrossRef]
- Bakonyi, P.; Nemestóthy, N.; Simon, V.; Bélafi-Bakó, K. Review on the Start-up Experiences of Continuous Fermentative Hydrogen Producing Bioreactors. Renew. Sustain. Energy Rev. 2014, 40, 806–813. [Google Scholar] [CrossRef] [Green Version]
- Castelló, E.; Nunes Ferraz-Junior, A.D.; Andreani, C.; del PilarAnzola-Rojas, M.; Borzacconi, L.; Buitrón, G.; Carrillo-Reyes, J.; Gomes, S.D.; Maintinguer, S.I.; Moreno-Andrade, I.; et al. Stability Problems in the Hydrogen Production by Dark Fermentation: Possible Causes and Solutions. Renew. Sustain. Energy Rev. 2020, 119, 109602. [Google Scholar] [CrossRef]
- Van Ginkel, S.; Logan, B.E. Inhibition of Biohydrogen Production by Undissociated Acetic and Butyric Acids. Environ. Sci. Technol. 2005, 39, 9351–9356. [Google Scholar] [CrossRef]
- Nicolaou, S.A.; Gaida, S.M.; Papoutsakis, E.T. A Comparative View of Metabolite and Substrate Stress and Tolerance in Microbial Bioprocessing: From Biofuels and Chemicals, to Biocatalysis and Bioremediation. Metab. Eng. 2010, 12, 307–331. [Google Scholar] [CrossRef]
- Chen, Y.; Yin, Y.; Wang, J. Influence of Butyrate on Fermentative Hydrogen Production and Microbial Community Analysis. Int. J. Hydrogen Energy 2021, 46, 26825–26833. [Google Scholar] [CrossRef]
- Hüsemann, M.H.W.; Papoutsakis, E.T. Solventogenesis in Clostridium Acetobutylicum Fermentations Related to Carboxylic Acid and Proton Concentrations. Biotechnol. Bioeng. 1988, 32, 843–852. [Google Scholar] [CrossRef]
- Akca, M.S.; Bostancı, O.; Aydin, A.K.; Koyuncu, I.; Altinbas, M. BioH2 Production from Food Waste by Anaerobic Membrane Bioreactor. Int. J. Hydrogen Energy 2021, 46, 27941–27955. [Google Scholar] [CrossRef]
- Noblecourt, A.; Christophe, G.; Larroche, C.; Santa-Catalina, G.; Trably, E.; Fontanille, P. High Hydrogen Production Rate in a Submerged Membrane Anaerobic Bioreactor. Int. J. Hydrogen Energy 2017, 42, 24656–24666. [Google Scholar] [CrossRef]
- Zhao, M.; Yan, Q.; Ruan, W.; Miao, H.; Ren, H.; Xu, Y. Effects of Butyric Acid Stress on Anaerobic Sludge for Hydrogen Production from Kitchen Wastes. J. Chem. Technol. Biotechnol. 2010, 85, 866–871. [Google Scholar] [CrossRef]
- Huang, Z.; Yu, X.; Miao, H.; Ren, H.; Zhao, M.; Ruan, W. Enzymatic Dynamics of Microbial Acid Tolerance Response (ATR) during the Enhanced Biohydrogen Production Process via Anaerobic Digestion. Int. J. Hydrogen Energy 2012, 37, 10655–10662. [Google Scholar] [CrossRef]
- APHA. Standard Methods for the Examination of Water and Wastewater, 23rd ed.; American Public Health Association: Washington, DC, USA, 2017; Volume 20, ISBN 9780875532875. [Google Scholar]
- Parthiba Karthikeyan, O.; Trably, E.; Mehariya, S.; Bernet, N.; Wong, J.W.C.; Carrere, H. Pretreatment of Food Waste for Methane and Hydrogen Recovery: A Review. Bioresour. Technol. 2018, 249, 1025–1039. [Google Scholar] [CrossRef] [Green Version]
- Lesteur, M.; Latrille, E.; Maurel, V.B.; Roger, J.M.; Gonzalez, C.; Junqua, G.; Steyer, J.P. First Step towards a Fast Analytical Method for the Determination of Biochemical Methane Potential of Solid Wastes by near Infrared Spectroscopy. Bioresour. Technol. 2011, 102, 2280–2288. [Google Scholar] [CrossRef] [PubMed] [Green Version]
- The European Commission. Commission Regulation (EU) No 142/2011; The European Commission: Brussels, Belgium, 2011. [Google Scholar]
- Castillo-Hernández, A.; Mar-Alvarez, I.; Moreno-Andrade, I. Start-up and Operation of Continuous Stirred-Tank Reactor for Biohydrogen Production from Restaurant Organic Solid Waste. Int. J. Hydrogen Energy 2015, 40, 17239–17245. [Google Scholar] [CrossRef]
- Reungsang, A.; Sreela-Or, C.; Plangklang, P. Non-Sterile Bio-Hydrogen Fermentation from Food Waste in a Continuous Stirred Tank Reactor (CSTR): Performance and Population Analysis. Int. J. Hydrogen Energy 2013, 38, 15630–15637. [Google Scholar] [CrossRef]
- INRA; LBE. Bio2E Environmental Biotechnology and Biorefinery Platform; LBE: Narbonne, France, 2018. [Google Scholar] [CrossRef]
- Magdalena, J.A.; Greses, S.; González-Fernández, C. Anaerobic Degradation of Protein-Rich Biomass in an UASB Reactor: Organic Loading Rate Effect on Product Output and Microbial Communities Dynamics. J. Environ. Manag. 2020, 274, 111201. [Google Scholar] [CrossRef]
- Carmona, A.; Trably, E.; Milferstedt, K.; Lacroix, R.; Etcheverry, L.; Bernet, N. Long-Term Continuous Production of H2 in a Microbial Electrolysis Cell (MEC) Treating Saline Wastewater. Water Res. 2015, 81, 149–156. [Google Scholar] [CrossRef] [Green Version]
- McMurdie, P.J.; Holmes, S. Phyloseq: An R Package for Reproducible Interactive Analysis and Graphics of Microbiome Census Data. PLoS ONE 2013, 8, e61217. [Google Scholar] [CrossRef] [Green Version]
- Lê, S.; Josse, J.; Husson, F. FactoMineR: An R Package for Multivariate Analysis. J. Stat. Softw. 2008, 25, 1–18. [Google Scholar] [CrossRef] [Green Version]
- Zheng, X.J.; Yu, H.Q. Inhibitory Effects of Butyrate on Biological Hydrogen Production with Mixed Anaerobic Cultures. J. Environ. Manag. 2005, 74, 65–70. [Google Scholar] [CrossRef]
- Kumar, G.; Park, J.; Sivagurunathan, P.; Lee, S.; Park, H.; Kim, S. Microbial Responses to Various Process Disturbances in a Continuous Hydrogen Reactor Fed with Galactose. J. Biosci. Bioeng. 2017, 123, 216–222. [Google Scholar] [CrossRef]
- García-depraect, O.; Diaz-cruces, V.F.; Rene, E.R.; León-becerril, E. Changes in Performance and Bacterial Communities in a Continuous Biohydrogen-Producing Reactor Subjected to Substrate- and pH-Induced Perturbations. Bioresour. Technol. 2020, 295, 122182. [Google Scholar] [CrossRef]
- Kim, S.H.; Han, S.K.; Shin, H.S. Effect of Substrate Concentration on Hydrogen Production and 16S RDNA-Based Analysis of the Microbial Community in a Continuous Fermenter. Process Biochem. 2006, 41, 199–207. [Google Scholar] [CrossRef]
- Payot, S.; Guedon, E.; Gelhaye, E.; Petitdemange, H. Induction of Lactate Production Associated with a Decrease in NADH Cell Content Enables Growth Resumption of Clostridium Cellulolyticum in Batch Cultures on Cellobiose. Res. Microbiol. 1999, 150, 465–473. [Google Scholar] [CrossRef]
- Noblecourt, A.; Christophe, G.; Larroche, C.; Fontanille, P. Hydrogen Production by Dark Fermentation from Pre-Fermented Depackaging Food Wastes. Bioresour. Technol. 2018, 247, 864–870. [Google Scholar] [CrossRef]
- Dauptain, K.; Schneider, A.; Noguer, M.; Fontanille, P.; Escudie, R.; Carrere, H.; Trably, E. Impact of Microbial Inoculum Storage on Dark Fermentative H2 Production. Bioresour. Technol. 2021, 319, 124234. [Google Scholar] [CrossRef]
- Li, S.L.; Kuo, S.C.; Lin, J.S.; Lee, Z.K.; Wang, Y.H.; Cheng, S.S. Process Performance Evaluation of Intermittent-Continuous Stirred Tank Reactor for Anaerobic Hydrogen Fermentation with Kitchen Waste. Int. J. Hydrogen Energy 2008, 33, 1522–1531. [Google Scholar] [CrossRef]
- García-depraect, O.; Castro-mu, R.; Valdez-vazquez, I.; Kumar, G.; Le, E.; Reyes-alvarado, L.C.; Martínez-mendoza, L.J. A Review on the Factors Influencing Biohydrogen Production from Lactate: The Key to Unlocking Enhanced Dark Fermentative Processes. Bioresour. Technol. 2021, 324, 124595. [Google Scholar] [CrossRef]
- Pokusaeva, K.; Fitzgerald, G.F. Carbohydrate Metabolism in Bifidobacteria. Genes Nutr. 2011, 6, 285–306. [Google Scholar] [CrossRef] [Green Version]
- Canto-Robertos, M.; Quintal-Franco, C.; Ponce-Caballero, C.; Vega-De Lille, M.; Moreno-Andrade, I. Inhibition of Hydrogen Production by Endogenous Microorganisms from Food Waste. Brazilian J. Chem. Eng. 2022, 1–14. [Google Scholar] [CrossRef]
- Villanueva-Galindo, E.; Moreno-Andrade, I. Bioaugmentation on Hydrogen Production from Food Waste. Int. J. Hydrogen Energy 2020, 46, 25985–25994. [Google Scholar] [CrossRef]
- Moon, C.; Jang, S.; Yun, Y.M.; Lee, M.K.; Kim, D.H.; Kang, W.S.; Kwak, S.S.; Kim, M.S. Effect of the Accuracy of pH Control on Hydrogen Fermentation. Bioresour. Technol. 2015, 179, 595–601. [Google Scholar] [CrossRef]
- Wang, J.; Yin, Y. Clostridium Species for Fermentative Hydrogen Production: An Overview. Int. J. Hydrogen Energy 2021, 46, 34599–34625. [Google Scholar] [CrossRef]
- Zhao, X.; Li, D.; Xu, S.; Guo, Z.; Zhang, Y.; Man, L.; Jiang, B.; Hu, X. Clostridium Guangxiense Sp. Nov. and Clostridium Neuense Sp. Nov., Two Phylogenetically Closely Related Hydrogen-Producing Species Isolated from Lake Sediment. Int. J. Syst. Evol. Microbiol. 2017, 67, 710–715. [Google Scholar] [CrossRef]
- Jo, J.H.; Jeon, C.O.; Lee, D.S.; Park, J.M. Process Stability and Microbial Community Structure in Anaerobic Hydrogen-Producing Microflora from Food Waste Containing Kimchi. J. Biotechnol. 2007, 131, 300–308. [Google Scholar] [CrossRef]
- Pérez-rangel, M.; Barboza-corona, J.E.; Navarro-díaz, M.; Escalante, A.E.; Valdez-vazquez, I. The Duo Clostridium and Lactobacillus Linked to Hydrogen Production from a Lignocellulosic Substrate. Water Sci. Technol. 2021, 83, 3033–3040. [Google Scholar] [CrossRef]
- Heo, S.; Kim, M.G.; Kwon, M.; Lee, H.S.; Kim, G.B. Inhibition of Clostridium Perfringens Using Bacteriophages and Bacteriocin Producing Strains. Korean J. Food Sci. Anim. Resour. 2018, 38, 88–98. [Google Scholar] [CrossRef] [PubMed]
- Gervasi, T.; Lo Curto, R.; Minniti, E.; Narbad, A.; Mayer, M.J. Application of Lactobacillus Johnsonii Expressing Phage Endolysin for Control of Clostridium Perfringens. Lett. Appl. Microbiol. 2014, 59, 355–361. [Google Scholar] [CrossRef] [PubMed]
Figure 1.
Schematic representation of the experimental setup used. 1, 2, 3, 4, 5: pumps for feed addition, butyric acid addition, pH regulation, effluent withdrawal, and pressure regulation.
Figure 1.
Schematic representation of the experimental setup used. 1, 2, 3, 4, 5: pumps for feed addition, butyric acid addition, pH regulation, effluent withdrawal, and pressure regulation.

Figure 2.
Volumetric H2 production rate and exogenous butyric acid concentration in condition B (yellow dashes) during the stress period (I), the transitionary period (II), and the steady-state (III), respectively. The four samples used for microbial community characterization in conditions A and B are represented in black circle filled in grey to indicate their time of collection.

Figure 3.
Endogenous organic acids concentrations in A and B conditions and exogenous butyric acid concentration in condition B, during the periods I at day 2, II at day 5, and III (average of three samples taken during the steady-date period) of the fermentation.
Figure 3.
Endogenous organic acids concentrations in A and B conditions and exogenous butyric acid concentration in condition B, during the periods I at day 2, II at day 5, and III (average of three samples taken during the steady-date period) of the fermentation.

Figure 4.
Relative bacterial community abundance (%) in A and B conditions during the periods I (day 2), II (day 5), III-1 (day 8), and III-2 (day 12).
Figure 4.
Relative bacterial community abundance (%) in A and B conditions during the periods I (day 2), II (day 5), III-1 (day 8), and III-2 (day 12).

Figure 5.
Principal component analysis: (a) individual plot, (b) variables plot.


Table 1.
Feedstock Characterization.
| Composition | Concentration (g·L−1) |
|---|---|
| Minced beef | 13 ± 0 |
| Yogurt | 9 ± 0 |
| Red berries | 13 ± 0 |
| Breaded fish | 9 ± 0 |
| French fries | 17 ± 0 |
| Mix of vegetables | 13 ± 0 |
| Bread | 13 ± 0 |
| Total solids (gTS·L−1) | 27 ± 3 |
| Volatile solids (gVS·L−1) | 26 ± 4 |
| COD (g·L−1) | 33 ± 4 |
Table 2.
Performances of the continuous fermentation in the periods I, II and III in conditions A and B.
Table 2.
Performances of the continuous fermentation in the periods I, II and III in conditions A and B.
| Performance Indicator | I | II | III | |||
|---|---|---|---|---|---|---|
| A | B | A | B | A | B | |
| Average HPR (LH2·L−1·d−1) | 3.9 ± 0.7 | 0.3 ± 0.1 | 1.6 ± 0.3 | 1.3 ± 0.4 | 1.5 ± 0.2 | 2.2 ± 0.2 |
| Average yield (mLH2·gVSadded−1) | 65 ± 12 | 4 ± 2 | 27 ± 4 | 22 ± 7 | 25 ± 3 | 37 ± 3 |
| H2 % (v/v) | 54 ± 2 | 5 ± 4 | 48 ± 1 | 49 ± 4 | 48 ± 2 | 50 ± 1 |
| COD Conversion (%) | 34|37 | 26|27 | 36|41 | 40 ± 8 | 34 ± 2 | 37 ± 2 |
Table 3.
Species abundances in periods I, II, III-1, and III-2, in conditions A and B, and diversity indexes.
Table 3.
Species abundances in periods I, II, III-1, and III-2, in conditions A and B, and diversity indexes.
| OTU | Species | Identity (%) | Relative Abundance (%) | |||||||
| I | II | III-1 | III-2 | |||||||
| A | B | A | B | A | B | A | B | |||
| 1 | Clostridium guangxiense | 98.25 | 16 | 0 | 31 | 32 | 22 | 49 | 21 | 54 |
| 2 | Streptococcus parasuis/suis/equinus | 100.00 | 12 | 37 | 0 | 1 | 0 | 0 | 0 | 2 |
| 3 | Lactobacillus delbrueckii | 96.00 | 19 | 0 | 42 | 0 | 42 | 0 | 37 | 3 |
| 4 | Bifidobacterium sp. | 96.83 | 0 | 15 | 12 | 22 | 23 | 13 | 28 | 22 |
| 5 | Lactobacillus johnsonii | 98.59 | 0 | 41 | 0 | 39 | 0 | 30 | 0 | 1 |
| 6 | Clostridium perfringens | 98.75 | 36 | 0 | 0 | 0 | 0 | 0 | 0 | 0 |
| 7 | Clostridium butyricum | 99.75 | 6 | 0 | 0 | 0 | 1 | 0 | 1 | 0 |
| Others (%) | 10 | 7 | 14 | 6 | 12 | 8 | 13 | 17 | ||
| Diversity Indexes | ||||||||||
| Shannon index | 1.9 | 1.3 | 1.6 | 1.4 | 1.6 | 1.3 | 1.6 | 1.6 | ||
| Pielou index | 0.6 | 0.6 | 0.6 | 0.6 | 0.4 | 0.5 | 0.4 | 0.5 | ||
Publisher’s Note: MDPI stays neutral with regard to jurisdictional claims in published maps and institutional affiliations. |
© 2022 by the authors. Licensee MDPI, Basel, Switzerland. This article is an open access article distributed under the terms and conditions of the Creative Commons Attribution (CC BY) license (https://creativecommons.org/licenses/by/4.0/).
Share and Cite
MDPI and ACS Style
Noguer, M.C.; Magdalena, J.A.; Bernet, N.; Escudié, R.; Trably, E. Enhanced Fermentative Hydrogen Production from Food Waste in Continuous Reactor after Butyric Acid Treatment. Energies 2022, 15, 4048. https://doi.org/10.3390/en15114048
AMA Style
Noguer MC, Magdalena JA, Bernet N, Escudié R, Trably E. Enhanced Fermentative Hydrogen Production from Food Waste in Continuous Reactor after Butyric Acid Treatment. Energies. 2022; 15(11):4048. https://doi.org/10.3390/en15114048
Chicago/Turabian StyleNoguer, Marie Céline, Jose Antonio Magdalena, Nicolas Bernet, Renaud Escudié, and Eric Trably. 2022. "Enhanced Fermentative Hydrogen Production from Food Waste in Continuous Reactor after Butyric Acid Treatment" Energies 15, no. 11: 4048. https://doi.org/10.3390/en15114048
Note that from the first issue of 2016, this journal uses article numbers instead of page numbers. See further details here.