
Analysis of Smart Meter Electricity Consumption Data for PV Storage in the UK


1
Centre for Renewable Energy Systems Technology, Loughborough University, Loughborough LE11 3TU, UK
2
Center PERSEE, MINES Paris, PSL University, Rue Claude Daunesse, 06904 Sophia Antipolis, France
*
Author to whom correspondence should be addressed.
Energies 2022, 15(10), 3732; https://doi.org/10.3390/en15103732
Submission received: 22 March 2022
/
Revised: 6 May 2022
/
Accepted: 9 May 2022
/
Published: 19 May 2022
Abstract
:Solar PV and battery energy storage (BES) costs for domestic consumers are constantly diminishing. On top of this, the end of the Feed-in-Tariff programme has significantly increased interest in combined PV + BES systems. In this paper, we explore the economics of domestic PV + BES systems, extending the current literature on the topic via the use of a large smart meter dataset and a demographic comparison. Predictably, time-varying tariffs and higher electricity prices generally strengthen the economic arguments for PV + BES systems, however our consumption data yields a wide range of Net Present Values for different consumers. In terms of demographics, we find that batteries are more favourable for more affluent households due to their larger consumption levels, though profitability becomes more uniform if the batteries are tailored to individual households. This is an important point for policy, since it indicates that if PV + BES systems become widely profitable this is unlikely to help the financial situation of lower-income households.
1. Introduction
To avoid the worst effects of climate change on our societies, our greenhouse gas emissions must be reduced within the context of economic growth. To facilitate this, European governments have bet on a mix of energy efficiency and electrification of end use energy demands. Part of this includes the use of rooftop PV systems [1]. In the UK, solar PV capacity has substantially risen since 2011, although the installation rate has dropped since 2016. At the present time, the UK has a total of 13.5 GW of PV capacity, of which 21% are installations of less than 4 kW (mainly residential). By number, however, these represent 92% of all installations [2]. With the end of the Feed-in-Tariff (FiT) scheme for small PV systems in 2019 (remunerating domestic producers for the electricity they inject into the grid), solar momentum is expected to slow [3]. However, some commentators suggest that this is very likely to further drive the uptake of coupled PV battery systems to maximise self-consumption [4]. Furthermore, within the government’s “Transitioning to a net zero energy system: Smart Systems and Flexibility Plan 2021” [5], domestic PV generation is expected to have a significant role going forward [6].
Within the same plan, battery storage systems are also expected to contribute substantially to the future flexibility of the electricity grid [5]. Of the various battery chemistries in development, lithium-ion dominates, representing 93% of total annual installed stationary storage capacity worldwide in the year 2018 (excluding pumped hydro storage) [7]. Furthermore, in the period 2012–2019, the percentage of energy storage technologies dedicated to behind-the-meter (residential, commercial and industrial) use went from 27 to 48% [7]. Overall, it seems likely that residential PV and batteries will have a significant role to play in decarbonising and increasing the electricity system flexibility.
Considering this, an important question for policy makers is: Are PV plus battery systems (referred to herein as PV + BES systems) profitable for consumers? In general, the financial benefit to the owners of such a system is not straightforward, and often involves a significant capital cost [8]. The answer to this question is highly dependent on the policy and regulatory environment in which the system is operating; the UK provides an interesting case study. As previously mentioned, the UK first saw a boom in rooftop solar deployment in the period 2011–2016, followed by a reduction in deployment which is now rebounding due to increases in domestic energy costs. This recent increase in PV deployment into a grid now containing significant renewable penetration parallels the situations of other northern European nations with similar irradiation levels and highlights the need for increased storage deployment. Furthermore, as a result of the level of renewable deployment, new innovative electricity tariffs are being rolled out. However, so far, centralised subsidies specifically for household batteries have not yet materialised. It has been previously observed that some households may find PV systems profitable, but are unable to cover the large capital costs [9]. This is also a major barrier to household adoption of batteries, coupled alongside low levels of awareness regarding energy storage. Thus, at present, as is the case in other European nations, few people are willing to pay for the installation of battery systems [10].
Therefore, the aim of this work is to explore the aforementioned question in the context of the UK. In particular, we are interested in how profitability depends on consumer demand patterns, and whether there may be differences between socio-economic groups. Using large consumption datasets, we aim to draw conclusions valid across a range of consumers.
Previous studies have also looked at this question to some degree in both the UK and international contexts. For example, studies conducted in Switzerland [11], Finland [12] and Australia [13] show that under the current cost scenarios, adding a battery to a residential PV system is typically not profitable. Barbour and Gonzalez [14] examined the price point at which coupled PV battery systems become more attractive than PV-only systems, finding at 2015 price levels that PV-only systems are generally much more attractive. However, this study highlights the fact that there is a large range of economic returns due to different consumer load profiles and that as the FIT rate reduces, coupled PV + BES systems will become significantly better investments. For the UK, Gardiner et al. [15] developed a techno-economic model of a 4 kWh battery paired with a 4 kW PV. The model was run for a household consuming 4074 kWh/year with a standard load profile from Elexon (A wholesale electricity market manager in the UK). Their results show that an investment under the base case scenario of the study in 2020 is not profitable. Zakeri et al. [16] performed a similar analysis again with a 4 kW PV, a 6.4 kWh battery and a 3750 kWh/year domestic class 1 household load profile from Elexon. The study pointed out that electricity storage can provide significant electricity bill savings, and these savings would be maximized with time-of-use (ToU) and real-time tariffs. However, without policy intervention, it was found that the system is not profitable. Dong et al. [17] compared Household Energy Storage (HES) and Community Energy Storage (CES) in the UK, including load profiles for five households with different consumptions and Ofgem (The Office of Gas and Electricity Markets is the UK energy regulator) TDCV (Typical Domestic Consumption Values) Classifications. The energy model contained a 3 kWp PV and 2.5 kWh battery units (that could be added together to increase storage capacity). They found that while PV paired with battery energy storage (BES) tends to yield higher energy savings as well as a larger Self-Sufficiency Ratio (SSR) and Self-Consumption Ratio (SCR), under the current tariffs and subsidies, the profitability for PV + BES, for both HES and CES, are not yet established [17].
Profitability was established by Gil et al. [18] under specific conditions. Their study optimized the size of PV and BES systems for five different household types (all with an electric vehicle and different annual electricity demands) under standard and economy 7 tariffs, with both FITs and smart export guarantees. Their economic analysis found that with optimized systems, in a post-FiT situation in the UK, the PV + BES systems can be profitable if battery costs are subsidized by 50%.
While these studies all shed some light on the aforementioned question regarding PV + BES profitability in the UK, they use a limited number of simulated or typical load profiles. Therefore, this study aims to expand the research in this area by using a comparatively large real electricity consumption dataset and performing a demographic comparison. Hence, we use electricity consumption data from the Low Carbon London (LCL) smart meter project [19]. Notably, this dataset includes ACORN (A Classification Of Residential Neighbourhoods) [20] demographic classifications, which we also explore to determine if PV + BES systems are more profitable to specific demographic groups.
2. Methodology
2.1. Overview
To assess the profitability of PV + BES in the UK, a PV + BES techno-economic model was developed. Its inputs were weather data (for the PV generation model), smart meter consumption data (the LCL data), system costs, electricity prices and battery and PV ageing properties. The ageing of the PV and the BES were simulated over 20 years and the BES was replaced each time it achieved its maximum number of cycles. For each consumer in the LCL database, the NPV was calculated for a fixed PV + BES configuration (12 PV modules, totalling 3.3 kW, and a 5 kWh BES). Additionally, the optimum PV + BES configuration for each consumer was assessed by varying the PV and BES sizes (PV going from 6 to 36 modules and BES from 0 to 13 kWh) under all the simulated tariffs. The sensitivity to the system capital costs were also explored through the development of a baseline cost scenario and a future cost scenario with reduced PV and BES costs and higher electricity prices. This is in line with the current trends of increasing electricity prices [21] and reducing PV and BES costs [22,23].
2.2. Data
The LCL data (https://data.london.gov.uk/dataset/smartmeter-energy-use-data-in-london-households, accessed on 21 March 2022) included half-hourly consumption, the ACORN type, ACORN group, the electricity tariff type and a randomised ID. Consumption data were collected from 2011 to 2014 for approximately 5567 London households. The data were cleaned using Python3 to keep data for 2013, filtering for a complete year of data for the most consumers. Consumers with more than 50 h of missing data were removed. This left 4169 households. Within the LCL project, households were billed under two tariff types: a standard flat tariff (3302 consumers), denoted as Std, and a Time-of-Use tariff (867 consumers), denoted as ToU. The ACORN classification is a geo-demographic classification of the UK’s population that segments households into three groups and 17 types. The demographic classification ACORN types go from ACORN-A to ACORN-Q (there was also an unclassified marker in the LCL data for some IDs), and are split into three ACORN groups (Adversity, Comfortable, and Affluent).
2.3. Consumer Response to Different Tariffs
In this study, our main goal is to investigate the profitability of PV + BES systems under different tariffs. However, different tariffs may significantly change the consumption patterns we observe, for example, if consumers opt to significantly reduce their consumption at times with high prices. Since there are two different schemes already within the data, we study if the ToU tariff leads to significant consumption behaviour changes from the Std tariff. We also do this by ACORN group (Adversity, Comfortable and Affluent) in case there is a tendency for one group to show a significant difference, while this is not the case for others. While we would have preferred to do this for ACORN types, for several types there were insufficient consumers to make a proper comparison. In our analysis, we looked at two aspects. Firstly, differences in the overall consumption, and secondly, differences in consumption at high tariff times.
In relation to the overall consumption, under the null hypothesis that the median of annual consumption distributions are similar between Std and ToU consumers, we found that the differences are not significant (all have p-values which do not preclude the null hypothesis, i.e., for all groups) (see Figure 1). Interestingly, we found that consumers in the Affluent and Comfortable groups tend to consume more electricity than those in the Adversity group under all tariffs.
Figure 2 compares the typical consumption at high tariff times with those at non-high tariff times (the LCL data contain high tariffs with no set schedule and which may occur at all times during the day). We observed that high tariffs did not create a large consumption shift from peak to off-peak demand times. Surprisingly, we actually observed a tendency for ToU consumers to consume more during peak times when tariffs are high; however, the magnitude of this difference is relatively small, as shown in Figure 2.
In the literature, there is no clear consensus as to whether tariff structure has a large impact on consumption patterns. Bartusch et al. [24] found that real-time tariffs can induce behaviour changes (consumption shifts from peak to off-peak periods). However, these real time tariffs are less popular than static ToU tariffs (with a repetitive weekly or daily schedule with two or three types of prices—typically high, normal and low) [25]. For the latter ToU tariffs, some studies found small shifts in the consumption pattern with very little effect on the overall consumption level [26], while other studies found little response to time-varying prices [27]. The study [27] also finds that the ratio of peak to off-peak prices has little influence on the ratio of peak to off-peak electricity consumption.
Given that there is no clear consensus as to whether ToU tariffs do induce significant long-term behaviour changes, and in our data we observed little difference between the ToU and Std consumers, it seems reasonable to simulate different tariffs using the LCL consumption data for both ToU and Std consumers. Other studies have made similar assumptions [28].
2.4. Techno-Economic Model
2.4.1. PV Model
The PV model was adapted from Paulescu et al. [29] and Schopfer et al. [11]. The PV module characteristics were taken from [11], as shown in Table 1. The PV array is connected to an inverter with 95% efficiency. As the LCL consumption data are from London in 2013, hourly weather data were collected for London using the PVGIS tool [30] for 2013. Indeed, weather can have a significant impact on electricity consumption and therefore weather data concurrent with the consumption time range was used. Irradiance and temperature were then used as inputs for the PV generation model. The power output of the PV module at the instant t is given by:
G is the incident irradiance and and are empirical coefficients, and , respectively, for a monocrystalline silicon module [29]. STC denotes Standard Test Conditions, yielding Wm, C and W. is the lower module temperature (depending on the irradiance and the ambient temperature ) and is given by:
With
NOCT is the nominal cell temperature in Celsius when irradiance is 800 Wm, ambient temperature is 20 C and wind speed is 1 ms at a module tilt angle of . The ageing was simulated assuming, as stated in Table 1, a % yield loss each year. Therefore, the output power at the instant t of the year y is:
2.4.2. Battery Model
The battery follows a load following schedule. The energy in the battery at a time t is given by:
Here, is the energy load of the battery at t and . and , respectively, are the PV energy output and household demand at time t. is the minimum energy stored in the battery, which in our case is equal to a fraction of of the initial capacity of the battery. To simulate the ageing of the battery, is the battery capacity at time t and is given by:
With the initial battery capacity, the number of cycles made at time t and the capacity loss per cycle of the battery. is given by:
is the energy delivered by the battery to meet the demand at time t. Figure 3 illustrates how the main components of the system fit together. The battery efficiency as shown in Table 2 is the product of the inverter efficiency and the battery efficiency, each of which is assumed to be 95%. Hence the charging efficiency is and the roundtrip battery efficiency is .
2.4.3. Applied Tariffs
Three tariff types were applied in this study. For proper comparison, these tariffs were scaled to be neutral (having the same average price over the year). The first applied tariff is an Agile tariff based on the Octopus Agile tariff scheme (a dynamic pricing tariff following wholesale market rate trends in which prices change every half-hour; historical data for the Octopus Agile tariff were taken for 2019 [31]). The average price of this tariff is 10.64 p/kWh, almost twice as low as the current electricity price in the UK [21,32]. Therefore, the prices at all times were scaled up by a factor of two to achieve an average price of 21.28 p/kWh. This is broadly similar to the average November 2021 UK electricity price of 20 p/kWh as stated by the Energy Saving Trust (https://energysavingtrust.org.uk/about-us/our-data/, accessed 21 March 2022). A second flat tariff with a price of 21.28 p/kWh at all times was created. Finally, a third ToU tariff was adapted from (Yunusov and Torriti, 2021) [28], again scaled to be neutral with the other tariffs. For this tariff, high tariffs occur between 17:00 and 21:00, low tariffs between 00:00 to 13:00 and normal tariffs the rest of the time. While the ToU and agile prices were scaled up, reaching these price levels is anticipated in the short term. A summary of the tariffs is shown in Table 3.
Although the Feed-in-Tariff (FiT) program is closed for new applications in the UK, Octopus is introducing the beta of Outgoing Octopus (a dynamic electricity export tariff) [33], a potential successor to the FiT. The export tariff can either be fixed (to 5.5 p/kWh) or based on day-ahead wholesale rates. For this study, the export tariff was either fixed to GBP 0.05/kWh (Baseline scenario) or GBP 0/kWh (Future scenario) comparison.
2.4.4. Cost Scenarios
The various cost assumptions for the baseline and future scenarios are given in Table 4. PV costs were taken from [34], battery costs from [35,36] and inverter costs from [37]. For the Operation and Maintenance (O&M) costs in both scenarios, the PV was set to GBP 20/kW/year [38,39] and the BES to GBP 10/kW/year [40]. For both baseline and future scenarios, we used a discount rate of 3%, based on UK public sector social discount rates. In the future scenario, all tariffs are scaled up so that the average electricity cost reaches GBP 0.3192/kWh (which corresponds to three times the average historical Octopus Agile tariff or a 50% price rise from the baseline cost scenario). The export tariff is set to zero in the future scenario. While the exact price increase that we assume for the future scenario is arbitrary, we have opted for a 50% price increase since we believe this price increase level to be possible in the medium term. Indeed, as of April 2022, energy suppliers in the UK have been able to increase bills by 54% following the introduction of the new price cap set by Ofgem.
2.4.5. NPV Calculation
The PV system is expected to last 20 years and hence the NPV is evaluated over this period. The inverters have a lifetime of 10 years and are replaced at their end of life. The battery lifetime is 4000 cycles, after which point it has lost 20% of its capacity and is replaced. The NPV is calculated using the following formula:
Here, and are arrays of the electricity directly consumed from the PV and the BES in year i at all times. is the applied import electricity tariff over the year and is the export tariff. is the PV electricity injected into the grid for year i.
3. Results
3.1. Application to One Consumer
To illustrate the PV and battery models, we first applied these to one randomly selected consumer. The selected consumer happens to be in the Affluent ACORN group and has an annual electricity consumption of 3092 kWh/year. First, for this consumer, we show the results for the fixed size PV + BES system (3.3 kW PV + 5 kWh BES) and then we show how the optimum PV + BES system is found under both the baseline and future cost scenarios.
3.1.1. Fixed Configuration
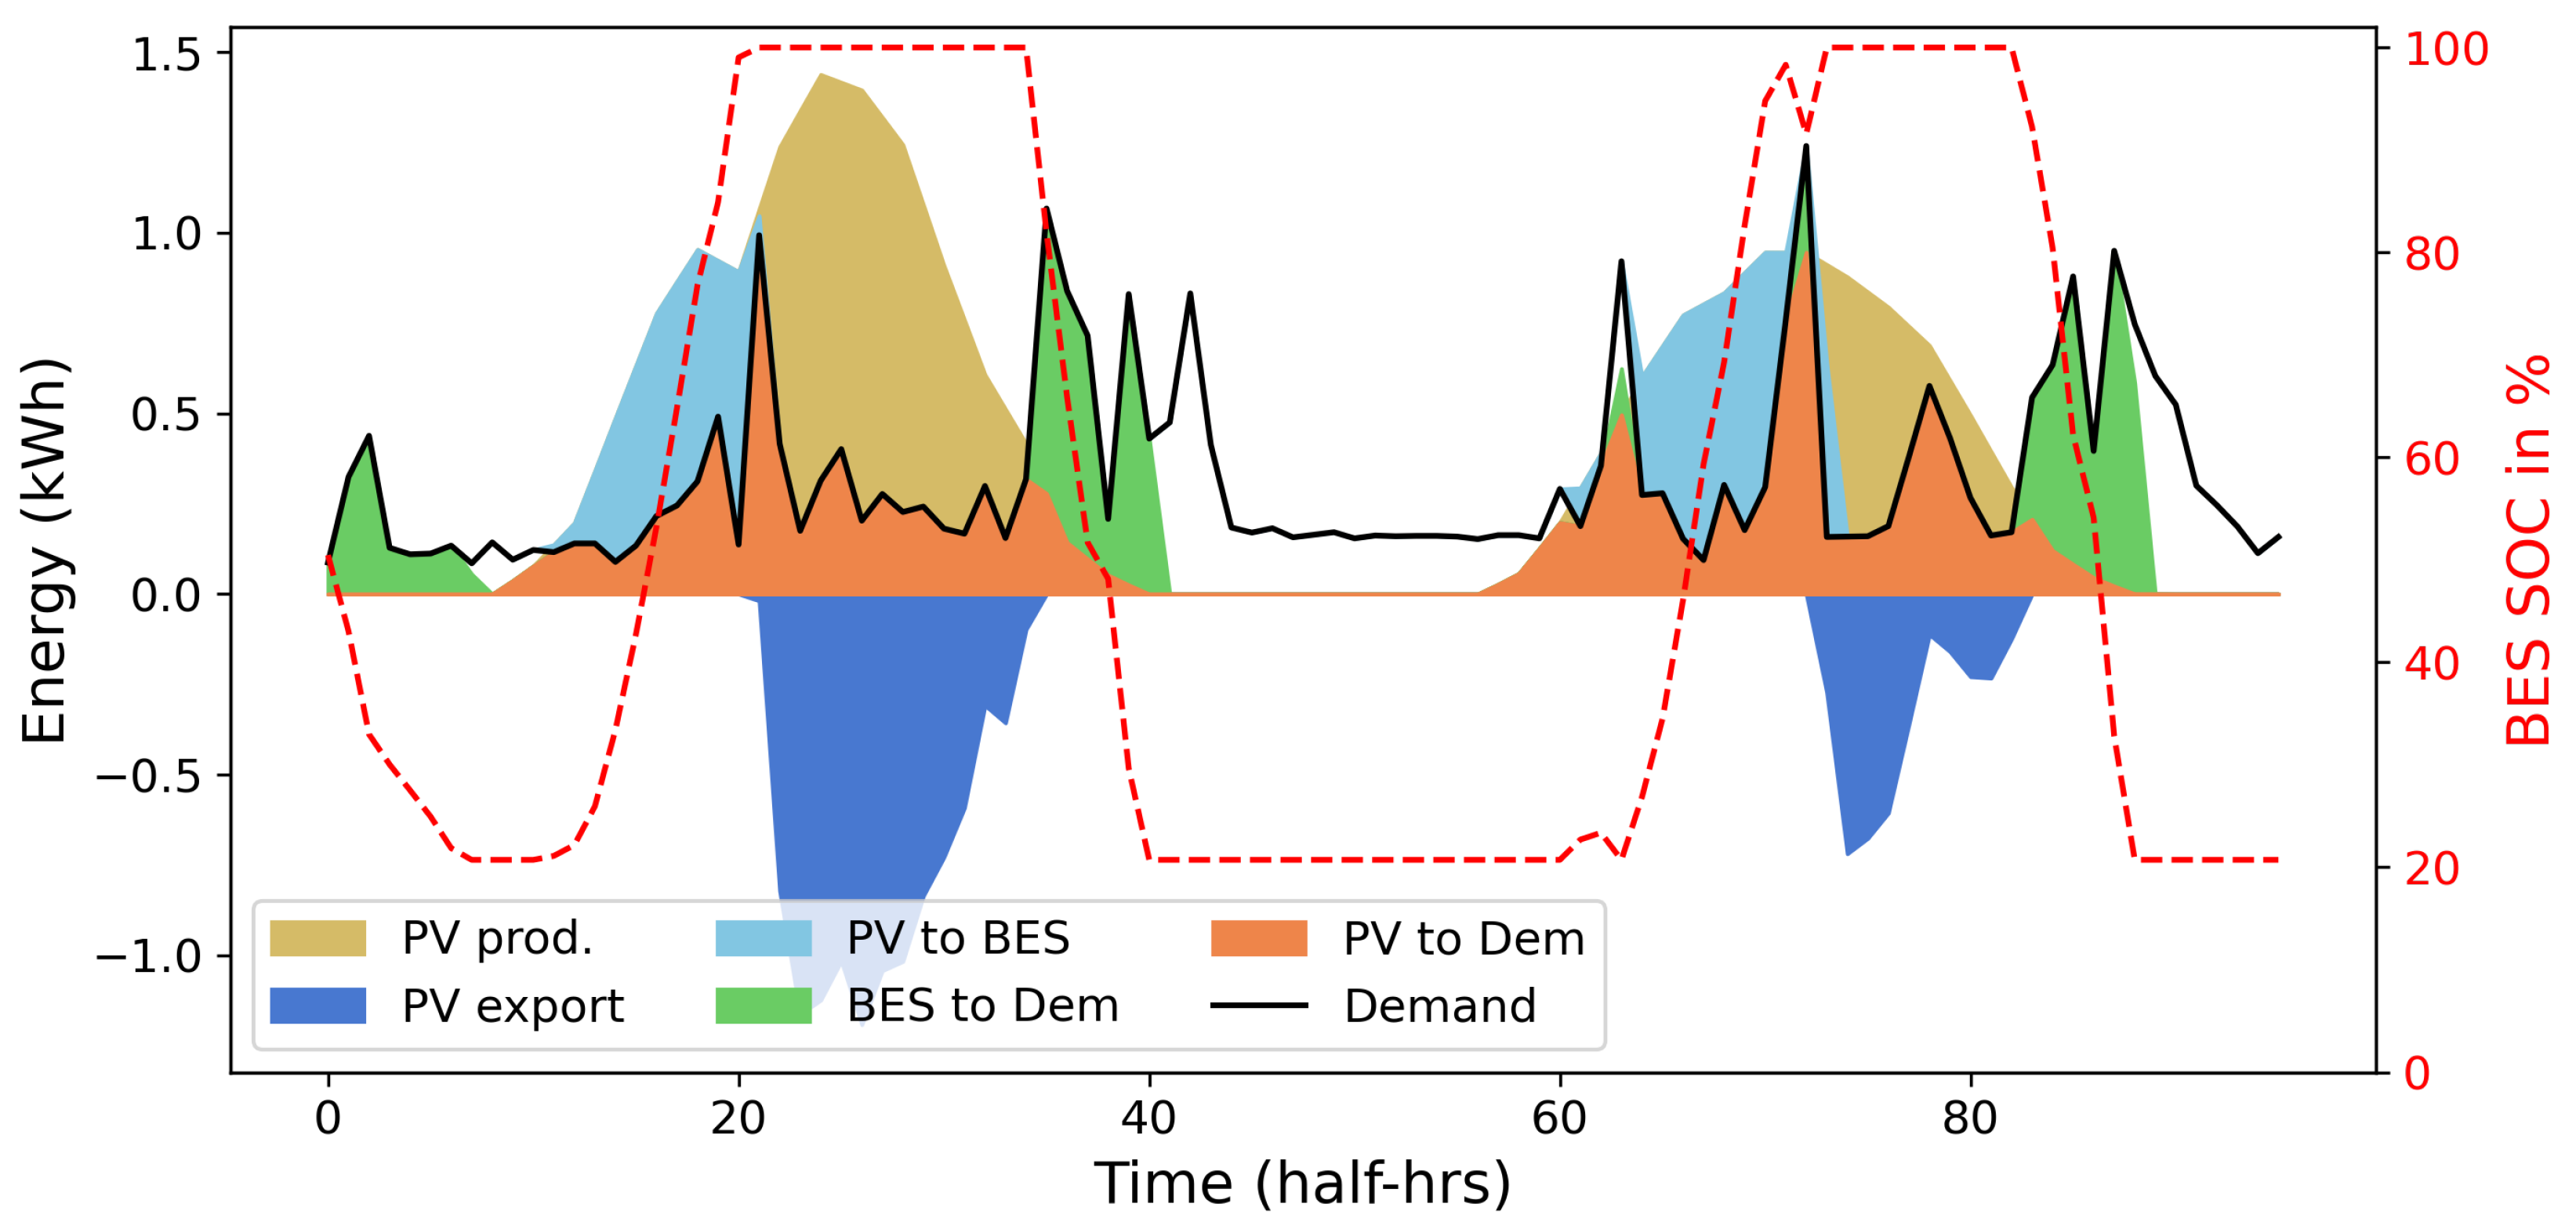
Over the course of the year, the 3.3 kWp PV system produces 3246 kWh, of which the consumer self-consumes 844 kWh and exports 1403 kWh. The battery meets 812 kWh of the consumers demand. The remainder is lost in the BES round-trip storage process. Figure 4 illustrates the demand profile for this consumer over two days and how the demand is met by generation from the PV, grid and battery.
We found that the NPV of the fixed configuration is –GBP 9679 under the standard tariff, with the agile tariff and –GBP 9393 under the TOU tariff, illustrating that in the baseline cost scenario no system is profitable for the fixed size PV + BES system. This changes in the future scenario where the NPV rises to under the Agile tariff and under the ToU tariff, showing that the system is profitable under these tariffs. However, under the flat tariff, the NPV drops to .
3.1.2. Optimum PV + BES + Tariff Configuration
We now discuss the optimum PV + BES configuration for this consumer. In the baseline cost scenario, we do not find any system to be profitable, with the best NPV (–GBP 482) occurring for the smallest PV system simulated and no battery under the agile tariff. However, under the future cost scenario, storage becomes more attractive. As shown by Figure 5, we found that maximum NPV generally occurs for small PV and battery systems. Interestingly, although optimum profitability is reached for the smallest PV sizes, under all tariffs a positive NPV can be achieved by adding a battery to some larger PV systems. It is also noticeable that while the ToU tariff is the best option here for the fixed configuration, the profitability is maximised with the optimal system under the Agile tariff (see Figure 5).
3.2. Fixed PV + BES Configuration for All Consumers
We now show the results for all consumers. NPV distributions are presented for the fixed PV + BES configuration (3.3 kW PV and 5 kWh BES), segmented by applied electricity tariff, ACORN group and household annual consumption.
3.2.1. Tariff Comparison
Figure 6 shows that with the fixed PV + BES system, the ToU tariff generally yields the largest NPV for consumers. In fact, the bigger NPVs we observed for ToU and Agile tariffs are due to the fact that self-consumption is more valuable under these tariffs due to higer evening prices (while the Std tariff has a constant price). The results also show that under the baseline cost scenario (Figure 6a), the fixed system is profitable for none of the consumers. However, profitability is reached for a majority of the consumers with Agile and ToU tariffs (with 54.62% and 57.78% of positive NPVs, respectively, versus 40.58% for the Std tariff) under the future cost scenario (Figure 6b). Thus, reduced PV, BES and associated equipment installation and replacement costs, as well as a rise in electricity prices, significantly increases financial benefits from PV + BES systems.
3.2.2. ACORN Group Comparison
We also found that profitability varies depending on the ACORN group. While the percentage of positive NPV is largest for the Comfortable group, we observed very little difference (using Mood’s median test comparing NPV distributions of consumers between groups) in NPV between the Comfortable and Affluent ACORN groups. Thus, we conclude that there is no significant difference between Comfortable and Affluent NPVs. However, Figure 7 highlights that the Adversity NPV distribution is lower than for the other ACORN groups. The fact that Comfortable and Affluent consumers in the LCL database have similar NPVs is explained by the fact that they have similar annual consumption values (see Figure 1).
Figure 8 shows that annual consumption has a substantial impact on the NPV, which supports the interpretations made in the previous section explaining the NPV similarities between Comfortable and Affluent consumers. Thus, for the fixed PV + BES system, the bigger the annual consumption is, the bigger the NPV will tend to be. Interestingly, the fixed PV + BES configuration is not profitable for consumers with less than 2000 kWh annual consumption even for the future cost scenario. There is a transitionary range (2000–4000 kWh annual consumption) for profitability above which almost all consumers find positive NPV for the future cost scenario. Within this range, a vertical comparison between the right-hand plots in Figure 8 shows that the percentage of consumers for which the fixed system is profitable is highly dependent on tariff, with around 34% of households in the 2000–3000 kWh bracket achieving profitability for the Agile tariff, compared to ∼4% and 46% for the Std and ToU tariffs, respectively.
3.3. Optimum NPV PV + BES Configuration
Under the baseline cost scenario, no profitability is found with a battery under any tariff scheme for the optmised systems. Only the smallest PV-alone system (1.66 kWp PV) is found to be profitable for the largest consumers (>5000 kWh per year), but only for Agile and Std tariffs. Conversely, under the future cost scenario, Figure 9 shows that the time-varying tariffs (Agile and ToU) tend to favour the use of a battery in the optimum PV + BES system. Indeed, while with the Std tariff only 23.8% of consumers have an optimum PV + BES system with a battery, this figure rises to 92.8% and 98.8% respectively with the Agile and ToU tariffs. Thus, reduced installation and replacement costs, as well as electricity price rises and a time-varying tariff highly contribute to making batteries more profitable. Furthermore, it must be highlighted that the future cost scenario is without any electricity export tariff which diminishes profitability for PV-only and increases the value of self-consumption. It is interesting to note that when the optimal PV + BES system for each consumer is selected, the profitability dramatically increases for small consumers. While with the fixed configuration very few consumers with a consumption less than 2000 kWh/year found a battery to be profitable, when the optimum system size is selected more than 68% of consumers under all tariffs in the 1000–2000 kWh/year bracket find a profitable system.
4. Discussion
4.1. Interpretation
PV and battery costs are likely to decrease further in the future while electricity prices are currently experiencing a significant rise. This electricity price rise is expected to continue particularly steeply in the medium term set in the context of recent geopolitical events. Furthermore, as more renewable electricity generation is installed in the electricity system, the price of the actual units of electrical is likely to fall while the need for flexibility will increase substantially [41]. The effect of this is already being felt as a push towards more time-variable electricity prices, and hence it is likely that the prevalence of real time and ToU tariffs will increase for all consumers. Our results show that, under current conditions, the economic case for PV is unfavourable for all but the largest consumers without subsidies and there is no economic sense in battery systems (although some consumers may still want to install these to increase their reliability and self-sufficiency). However, our future scenario suggests that a threshold will eventually be reached wherein a majority of households will find PV + BES systems profitable—notwithstanding other constraints on installations—such as unsuitable roofing for PV installations. In general, larger consumers are more likely to find PV + BES systems profitable, particularly when only limited battery sizes are available. As battery options which are tailored to specific consumers become more widely available the economic case for PV + BES will improve.
Our results are broadly consistent with previous studies, so far as they indicate a lack of profitability for PV + BES systems under current electricity tariffs, i.e., [15,16,17]. They also show a range of profitability as a result of differing consumer load profiles which has previously been observed [14]. While we are not aware of studies which have explained this observed range of profitability for PV + BES systems, a notable previous study [42] did find a strong positive correlation between annual consumption and PV self-consumption for PV-only systems for households in Australia, Belgium, Germany, Netherlands, UK and the USA. Our work extends this body of literature by exploring household classifications to try and explain the observed range of profitability for PV + BES systems. In terms of finding differences between the ACORN household classification groups, our results indicate that consumers in the Affluent and Comfortable groups find PV + BES systems more profitable. This difference primarily owes to the smaller annual consumption of the households in the adversity group, and these households generally find PV + BES systems less profitable under all the simulated tariffs. This is an important observation for policymakers, and they must be aware that if PV + BES systems become widely profitable, this is unlikely to help the economics of lower-income households. Thus, it risks further exacerbating problems related to energy poverty.
4.2. Limitations and Barriers
While we believe that the general results from our analysis are important going forward, the analysis also makes a number of simplifications. The time resolution of the data is 30 min, and therefore we do not observe misalignment between generation and demand on shorter timescales than this. Importantly, the LCL smart meter consumption data do not contain any information on dwelling type. Thus, we do not know how many households are likely able to install PV. Furthermore, it is unlikely that the consumers in this dataset are representative of the UK. London dwellings are much more likely to be smaller and more expensive compared to the rest of the UK, with a higher proportion of rented homes. Therefore, while our work represents an improvement over previous studies in terms of load profile diversity, this can certainly be improved going forward. Another limitation is the implicit assumption that weather data would be similar over the 20 years simulated, since we use concurrent demand and weather data. This is a limitation of this study as weather greatly varies from a year to another and that it highly influences consumption and PV output. Additionally, over 20 years, there is a high chance that the households will change their consumption patterns, for example, possibly due to new people in the household or adoption of new technologies such as EVs or heat pumps. Finally, it should be noted out that climate change is likely to drive significant long-term differences in both weather and consumption patterns.
5. Conclusions
In this study, we use LCL smart meter consumption data and weather data to simulate the operation of PV and battery systems. We find that under a baseline cost scenario, PV and battery systems are not profitable, while PV only systems are only profitable for the largest consuming households. However, we find that in a representative future cost scenario (which sees significant rises in electricity prices and reductions in the capital costs of PV, batteries and inverters), PV and battery systems do become widely profitable, especially under variable electricity price tariffs. The largest consumers (also typically those who are better off financially) find PV and battery systems the most profitable, while less wealthy consumers with lower consumption may not achieve profitability. This situation is improved when systems can be tailored carefully to individual consumers.
Author Contributions
Q.R.-C. and E.B. contributed to the major aspects of the paper, including study conceptualisation, methodology, validation, analysis, and writing. All authors have read and agreed to the published version of the manuscript.
Funding
This research received no external funding.
Institutional Review Board Statement
Not applicable.
Informed Consent Statement
Not applicable.
Data Availability Statement
All of the data used in this study is publicly available from the London Datastore. For further information and data download see: https://data.london.gov.uk/dataset/smartmeter-energy-use-data-in-london-households, last accessed 17 May 2022.
Acknowledgments
The authors would like Tom Betts for useful discussions.
Conflicts of Interest
The authors declare no conflict of interest.
References
- European Commission. 2050 Long-Term Strategy|Climate Action. Available online: https://ec.europa.eu/clima/policies/strategies/2050_en (accessed on 31 July 2021).
- Department for Business, Energy & Industrial Strategy. Monthly Deployment of All Solar Photovoltaic Capacity in the United Kingdom. Available online: https://www.gov.uk/government/statistics/solar-photovoltaics-deployment (accessed on 12 March 2022).
- Energy Saving Trust. The Present and Future of UK Solar Power. 2019. Available online: https://energysavingtrust.org.uk/present-and-future-uk-solar-power/ (accessed on 12 March 2022).
- Castaneda, M.; Zapata, S.; Cherni, J.; Aristizabal, A.J.; Dyner, I. The long-term effects of cautious feed-in tariff reductions on photovoltaic generation in the UK residential sector. Renew. Energy 2020, 155, 1432–1443. [Google Scholar] [CrossRef]
- Department for Business, Energy & Industrial Strategy. Policy Paper. Transitioning to a Net Zero Energy System: Smart Systems and Flexibility Plan 2021. 2021. Available online: https://www.gov.uk/government/publications/transitioning-to-a-net-zero-energy-system-smart-systems-and-flexibility-plan-2021 (accessed on 12 March 2022).
- International Energy Agency. Renewables 2020 Data Explorer. 2020. Available online: https://www.iea.org/articles/renewables-2020-data-explorer?mode=market®ion=United+Kingdom&product=PV+residential+systems (accessed on 12 March 2022).
- International Energy Agency. Innovation in Batteries and Electricity Storage. Available online: https://www.iea.org/reports/innovation-in-batteries-and-electricity-storage (accessed on 12 March 2022).
- Karakaya, E.; Sriwannawit, P. Barriers to the adoption of photovoltaic systems: The state of the art. Renew. Sustain. Energy Rev. 2015, 49, 60–66. [Google Scholar] [CrossRef] [Green Version]
- Gooding, J.; Edwards, H.; Giesekam, J.; Crook, R. Solar City Indicator: A methodology to predict city level PV installed capacity by combining physical capacity and socio-economic factors. Sol. Energy 2013, 95, 325–335. [Google Scholar] [CrossRef]
- Ambrosio-Albala, P.; Upham, P.; Bale, C.; Taylor, P. Exploring acceptance of decentralised energy storage at household and neighbourhood scales: A UK survey. Energy Policy 2020, 138, 111194. [Google Scholar] [CrossRef]
- Schopfer, S.; Tiefenbeck, V.; Staake, T. Economic assessment of photovoltaic battery systems based on household load profiles. Appl. Energy 2018, 223, 229–248. [Google Scholar] [CrossRef]
- Kuleshov, D.; Peltoniemi, P.; Kosonen, A.; Nuutinen, P.; Huoman, K.; Lana, A.; Paakkonen, M.; Malinen, E. Assessment of economic benefits of battery energy storage application for the PV-equipped households in Finland. J. Eng. 2019, 2019, 4927–4931. [Google Scholar] [CrossRef]
- Li, H.X.; Horan, P.; Luther, M.B.; Ahmed, T.M. Informed decision making of battery storage for solar-PV homes using smart meter data. Energy Build. 2019, 198, 491–502. [Google Scholar] [CrossRef]
- Barbour, E.; González, M.C. Projecting battery adoption in the prosumer era. Appl. Energy 2018, 215, 356–370. [Google Scholar] [CrossRef] [Green Version]
- Gardiner, D.; Schmidt, O.; Heptonstall, P.; Gross, R.; Staffell, I. Quantifying the impact of policy on the investment case for residential electricity storage in the UK. J. Energy Storage 2020, 27, 101140. [Google Scholar] [CrossRef]
- Zakeri, B.; Cross, S.; Dodds, P.E.; Gissey, G.C. Policy options for enhancing economic profitability of residential solar photovoltaic with battery energy storage. Appl. Energy 2021, 290, 116697. [Google Scholar] [CrossRef]
- Dong, S.; Kremers, E.; Brucoli, M.; Rothman, R.; Brown, S. Techno-enviro-economic assessment of household and community energy storage in the UK. Energy Convers. Manag. 2020, 205, 112330. [Google Scholar] [CrossRef]
- Gil, G.O.; Chowdhury, J.I.; Balta-Ozkan, N.; Hu, Y.; Varga, L.; Hart, P. Optimising renewable energy integration in new housing developments with low carbon technologies. Renew. Energy 2021, 169, 527–540. [Google Scholar] [CrossRef]
- Low Carbon London. SmartMeter Energy Consumption Data in London Households. Available online: https://data.london.gov.uk/dataset/smartmeter-energy-use-data-in-london-households (accessed on 12 March 2022).
- Low Carbon London. The ACORN User Guide. Available online: https://acorn.caci.co.uk/downloads/Acorn-User-guide.pdf (accessed on 12 March 2022).
- Statista. UK: Household Electricity Prices 2020. Available online: https://www.statista.com/statistics/418126/electricity-prices-for-households-in-the-uk/ (accessed on 12 March 2022).
- O’Shaughnessy, E.; Cutler, D.; Ardani, K.; Margolis, R. Solar plus: A review of the end-user economics of solar PV integration with storage and load control in residential buildings. Appl. Energy 2018, 228, 2165–2175. [Google Scholar] [CrossRef]
- Asmelash, E.; Prakash, G. Future of Solar Photovoltaic—A Global Energy Transformation Paper; Technical Report; International Renewable Energy Agency: Abu Dhabi, United Arab Emirates, 2019. [Google Scholar]
- Bartusch, C.; Wallin, F.; Odlare, M.; Vassileva, I.; Wester, L. Introducing a demand-based electricity distribution tariff in the residential sector: Demand response and customer perception. Energy Policy 2011, 39, 5008–5025. [Google Scholar] [CrossRef]
- Nicolson, M.L.; Fell, M.J.; Huebner, G.M. Consumer demand for time of use electricity tariffs: A systematized review of the empirical evidence. Renew. Sustain. Energy Rev. 2018, 97, 276–289. [Google Scholar] [CrossRef]
- Dong, C.; Ng, C.T.; Cheng, T. Electricity time-of-use tariff with stochastic demand. Prod. Oper. Manag. 2017, 26, 64–79. [Google Scholar] [CrossRef] [Green Version]
- Burns, K.; Mountain, B. Do households respond to Time-Of-Use tariffs? Evidence from Australia. Energy Econ. 2021, 95, 105070. [Google Scholar] [CrossRef]
- Yunusov, T.; Torriti, J. Distributional effects of Time of Use tariffs based on electricity demand and time use. Energy Policy 2021, 156, 112412. [Google Scholar] [CrossRef]
- Paulescu, M.; Paulescu, E.; Gravila, P.; Badescu, V. Weather Modeling and Forecasting of PV Systems Operation; Springer: Berlin/Heidelberg, Germany, 2013; Volume 358. [Google Scholar]
- EU Science Hub. PVGIS Photovoltaic Geographical Information System. Available online: https://joint-research-centre.ec.europa.eu/pvgis-photovoltaic-geographical-information-system_en (accessed on 12 March 2022).
- Download Historical Pricing Data. Available online: https://www.energy-stats.uk/download-historical-pricing-data/ (accessed on 12 March 2022).
- Energy Saving Trust. Our Data. Available online: https://energysavingtrust.org.uk/about-us/our-data/ (accessed on 12 March 2022).
- Octopus Energy. Introducing Outgoing Octopus. Available online: https://octopus.energy/outgoing/ (accessed on 12 March 2022).
- Department for Business, Energy & Industrial Strategy. Solar Photovoltaic (PV) Cost Data. Available online: https://www.gov.uk/government/statistics/solar-pv-cost-data (accessed on 12 March 2022).
- Solar Guide. Solar Battery Storage: The Best Solar Batteries [2021]. 2021. Available online: https://www.solarguide.co.uk/solar-batteries (accessed on 12 March 2022).
- GreenMatch. Solar Battery Storage System Cost in the UK (Updated 2021). 2018. Available online: https://www.greenmatch.co.uk/blog/2018/07/solar-battery-storage-system-cost (accessed on 12 March 2022).
- Eco7. Solar Inverter Replacement From £630 Fully Installed & 10 Year Warranty. Available online: https://eco7energy.co.uk/solar-inverter-replacement/ (accessed on 12 March 2022).
- Feldman, D.; Ramasamy, V.; Fu, R.; Ramdas, A.; Desai, J.; Margolis, R. US Solar Photovoltaic System and Energy Storage Cost Benchmark: Q1 2020; Technical Report; National Renewable Energy Lab. (NREL): Golden, CO, USA, 2021. [Google Scholar]
- SGS Energy Saving Solutions. Solar PV London. Available online: https://sgs-energy.co.uk/solar-pv-london/ (accessed on 12 March 2022).
- Mongird, K.; Viswanathan, V.V.; Balducci, P.J.; Alam, M.J.E.; Fotedar, V.; Koritarov, V.S.; Hadjerioua, B. Energy Storage Technology and Cost Characterization Report; Technical Report; Pacific Northwest National Lab. (PNNL): Richland, WA, USA, 2019. [Google Scholar]
- Strbac, G.; Pudjianto, D.; Aunedi, M.; Djapic, P.; Teng, F.; Zhang, X.; Ameli, H.; Moreira, R.; Brandon, N. Role and value of flexibility in facilitating cost-effective energy system decarbonisation. Prog. Energy 2020, 2, 042001. [Google Scholar] [CrossRef]
- McKenna, E.; Webborn, E.; Leicester, P.; Elam, S. Analysis of international residential solar PV self-consumption. In ECEEE 2019 Summer Study Proceedings; ECEEE: Stockholm, Sweden, 2019. [Google Scholar]
Figure 1.
Annual consumption distribution per ACORN group.

Figure 2.
LCL ToU consumer median load profile when tariffs are high and when they are not.

Figure 3.
Major components of the model.

Figure 4.
Operation of the PV and BES for the randomly selected consumer for two example days.

Figure 5.
Heatmaps of NPVs (×£1000) for different PV power and BES sizes for the example consumer in the future cost scenario for all tariffs. (a) NPVs for the Agile tariff in the future scenario. (b) NPVs for the ToU tariff in the future scenario. (c) NPVs for the Std tariff in the future scenario.

Figure 6.
Boxplots of the distribution of NPVs for the fixed PV + BES configuration for all consumers under all tariffs. (a) The NPV distributions under the baseline cost scenario. (b) The NPV distributions under the future cost scenario. The median of the distribution is shown by the horizontal line.

Figure 7.
Boxplots of NPV distributions for the fixed PV + BES system segmented by ACORN consumer groups under all of the applied tariffs. (a) Fixed configuration NPVs for baseline cost scenario. (b) Fixed configuration NPVs for future cost scenario. The red line illustrates the percentage of consumers in the group for whom the PV + BES system has NPV .

Figure 8.
NPV distributions segregated into different annual consumption brackets for the fixed PV + BES system. (a) Agile tariff in the baseline costs scenario. (b) Agile tariff in the future costs scenario. (c) Std tariff in the baseline costs scenario. (d) Std tariff in the future costs scenario. (e) ToU tariff in the baseline costs scenario. (f) ToU tariff in the future costs scenario. The red line illustrates the percentage of consumers within the consumption bracket with NPV .

Figure 9.
Future costs scenario results. (a) Optimum PV and battery sizes for the future Agile tariff. (b) NPV of optimum PV + BES system by consumption for future Agile tariff. (c) Optimum PV and battery sizes for the future Std tariff. (d) NPV of optimum PV + BES system by consumption for future Std tariff. (e) Optimum PV and battery sizes for the future ToU tariff. (f) NPV of optimum PV + BES system by consumption for future ToU tariff.


Table 1.
PV module characteristics.
| PV Module Characteristics | |
|---|---|
| Open circuit voltage | 37.9 V |
| Short Circuit Current | 8.73 A |
| Max. power point voltage | 31.6 V |
| Max. power point current | 8.73 A |
| Module Area | 1.63 m |
| Tilt angle | 36° |
| Asimuth angle | 0° |
| Yield loss | 0.5%/year |
Table 2.
Battery characteristics.
| Battery Characteristics | |
|---|---|
| Initial State-Of-Charge | 60% |
| Depth of discharge DoD | 80% |
| Lifetime cycles | 4000 |
| Capacity loss | 0.005%/cycle |
| Charging efficiency | 90.25% |
| Discharging efficiency | 90.25% |
| C-rate | 100% |
Table 3.
Applied tariffs comparison. The percentiles refer to the prices in the RT tariff.
| Tariff | High/90th | Normal/50th | Low/10th |
|---|---|---|---|
| Agile | 42.84 p/kWh | 17.81 p/kWh | 12.81 p/kWh |
| ToU | 43.69 p/kWh | 21.85 p/kWh | 13.07 p/kWh |
| Std | - | 21.28 p/kWh | - |
Table 4.
Capital costs in the baseline and future scenarios.
| PV | BES | Inverter Replacement | |
|---|---|---|---|
| Baseline scenario | £1500/kWp | £1000/kWh | £800/kW |
| Future scenario | £750/kWp | £600/kWh | £250/kW |
Publisher’s Note: MDPI stays neutral with regard to jurisdictional claims in published maps and institutional affiliations. |
© 2022 by the authors. Licensee MDPI, Basel, Switzerland. This article is an open access article distributed under the terms and conditions of the Creative Commons Attribution (CC BY) license (https://creativecommons.org/licenses/by/4.0/).
Share and Cite
MDPI and ACS Style
Raillard-Cazanove, Q.; Barbour, E. Analysis of Smart Meter Electricity Consumption Data for PV Storage in the UK. Energies 2022, 15, 3732. https://doi.org/10.3390/en15103732
AMA Style
Raillard-Cazanove Q, Barbour E. Analysis of Smart Meter Electricity Consumption Data for PV Storage in the UK. Energies. 2022; 15(10):3732. https://doi.org/10.3390/en15103732
Chicago/Turabian StyleRaillard-Cazanove, Quentin, and Edward Barbour. 2022. "Analysis of Smart Meter Electricity Consumption Data for PV Storage in the UK" Energies 15, no. 10: 3732. https://doi.org/10.3390/en15103732
Note that from the first issue of 2016, this journal uses article numbers instead of page numbers. See further details here.