
Instrumental Methods for Cage Occupancy Estimation of Gas Hydrate

1
College of Engineering, Peking University, Beijing 100871, China
2
Beijing International Center for Gas Hydrate, School of Earth and Space Sciences, Peking University, Beijing 100871, China
3
SINOPEC Petroleum Exploration and Production Research Institute, Beijing 100083, China
*
Author to whom correspondence should be addressed.
Energies 2022, 15(2), 485; https://doi.org/10.3390/en15020485
Submission received: 7 December 2021
/
Revised: 4 January 2022
/
Accepted: 7 January 2022
/
Published: 11 January 2022
(This article belongs to the Section H: Geo-Energy)
Abstract
:Studies revealed that gas hydrate cages, especially small cages, are incompletely filled with guest gas molecules, primarily associated with pressure and gas composition. The ratio of hydrate cages occupied by guest molecules, defined as cage occupancy, is a critical parameter to estimate the resource amount of a natural gas hydrate reservoir and evaluate the storage capacity of methane or hydrogen hydrate as an energy storage medium and carbon dioxide hydrate as a carbon sequestration matrix. As the result, methods have been developed to investigate the cage occupancy of gas hydrate. In this review, several instrument methods widely applied for gas hydrate analysis are introduced, including Raman, NMR, XRD, neutron diffraction, and the approaches to estimate cage occupancy are summarized.
1. Introduction
Clathrate hydrates are crystalline solid inclusion compounds, which are formed when water and gas molecules react at relatively high pressure and low temperature. Gas molecules are trapped in the cages formed with hydrogen-bonded water molecules. At conventional high pressure (<200 bar), hydrates have three main crystallographic structures (Figure 1), which are known as structure I (sI), structure II (sII), and structure H (sH) [1,2,3]. sI comprises two different type cages, a small pentagonal dodecahedral cage with 12 pentagonal faces (512) and a large tetrakaidecahedral cage with 12 pentagonal and 2 hexagonal faces (51262). sII also contains the small 512 cage in addition to large hexacaidecahedral cage with 12 pentagonal and 4 hexagonal faces (51264). sH is composed of the small 512 cages, middle 435663 cages (with 3 square, 6 pentagonal, and 3 hexagonal faces), and large icosahedral cages, 51268 (containing 12 pentagonal and 8 hexagonal faces) [4,5,6,7]. The type of hydrate structure is primarily determined by the size of the guest molecule, i.e., most small molecule gases (methane, ethane, carbon dioxide, hydrogen sulfide, etc.) forming sI hydrate, while larger molecule gases (propane, butane, etc.) and several small molecule (nitrogen, oxygen, hydrogen, etc.) forming sII hydrate. For mixed gas hydrates, the composition of mixed gas affects the hydrate structure, e.g., mixed methane-carbon dioxide gas forming sI hydrate, while mixed methane-propane gas forming sII hydrate. A certain guest molecule will preferentially capture the cages of suitable size. In addition, the crystal structure of hydrate is also affected by pressure and gas concentration. Prior study has confirmed that methane hydrate can transform from sI to sH as the pressure increases [8,9]. In a methane–ethane binary hydrate system, structure type will vary with the change of gas composition [10,11]. The hydrate of sH is always composed of multiple components. Large molecules (neohexane [12], methylcyclohexane [13], etc.) occupy the large cages, while the middle and small cages are occupied by small molecules, such as hydrogen, methane, ethane, xenon, and krypton.
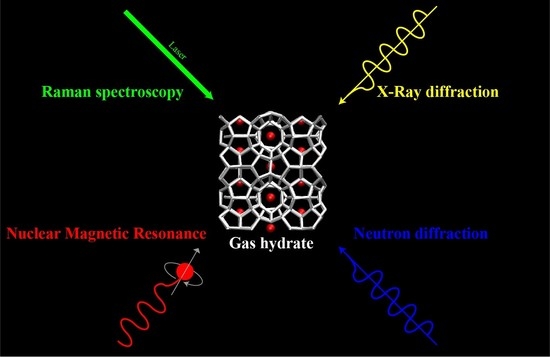
Clathrate hydrate is a non-stoichiometric compound, which means that some water molecule cages can be vacant in its structure; however, a sufficient number of cages must be occupied by guest molecules for hydrate to be stable [14,15]. Existing studies showed that large cages are completely filled or nearly so, while small cages are not completely filled, which is controlled by formation conditions, especially for pressure [16]. The ratio of the cage occupied by guest molecules to the total number of cages in the lattice is called cage occupancy, which is a necessary parameter to estimate the amount of natural gas hydrate resource and describe the gas storage efficiency of clathrate hydrate for energy storage (e.g., methane or hydrogen hydrate) and carbon sequestration (carbon dioxide hydrate). Therefore, the research on calculating the occupancy rate of clathrate hydrate is of great significance. At present, there are four commonly used instrument methods for calculating the cage occupancy of cage hydrates, namely Raman spectroscopy, nuclear magnetic resonance spectroscopy (NMR), X-ray diffraction (XRD), and Neutron diffraction. The spectroscopic methods (including Raman and NMR) work better in detecting the guest molecules, while the crystallographic methods (including XRD and neutron diffraction) can do better in characterizing the host lattice of water molecules. The spectroscopic methods can identify the guest molecules of different species directly, but the crystallographic methods cannot. Single crystal X-ray diffraction (SCXRD) was used to estimate cage occupancy of mixed THF and H2S hydrate in 1965 [2], and single crystal neutron diffraction was applied for ethylene oxide hydrate in 1977 [17]. NMR was applied for estimation of cage occupancy of methane hydrate in 1988 [18]. Raman was applied for investigating hydrate cage occupancy in 1997 and obtained similar information to NMR [19]. In addition, powder neutron diffraction also obtained cage occupancy in 1997 [20]. SCXRD was applied and successfully obtained cage occupancy of mixed naturally occurring gas hydrate in 2007 [21]. In 2010, PXRD was applied to obtain cage occupancy of several hydrates, which is in good agreement to NMR and SCXRD [16].
Among these technologies, single crystal diffraction can provide accurate cage occupancy and lattice parameters but require high quality single crystal, which is not easily available. NMR (13C-NMR) and Raman are both considered as reliable method to analyze cage occupancy study, and each has advantages and disadvantages. NMR is more accurate on quantitative analysis, while Raman always needs calibration with other techniques, such as NMR or XRD. Raman can focus on a micro area at the surface and require small amount of sample, while NMR gives average information of the bulk, usually from tens to a few hundred mg [22]. Powder diffraction can calculate cage occupancy with the help of Rietveld refinement. Neutron diffraction can detect hydrogen atoms better than XRD. In this review, we will introduce the basic mechanism of the four instrument methods and application in cage occupancy studies to help readers deal with related research.
2. Instrumental Methods for Clathrate Hydrate Analysis
2.1. Raman Spectroscopy
2.1.1. Theoretical Basis of Raman Spectroscopy for Gas Hydrate Analysis
Raman spectroscopy is a type of scattering spectroscopy, which is concerned with the changed frequency when light is scattered by molecules. The incident light is considered to consist of photons of energy . When irradiated on the substance, the photons collide with the molecules. The collision may be inelastic, which is called Raman scattering, with a series of frequency of .
The frequency difference between scattered light and incident light, i.e., , is called Raman shift. Each Raman shift is related to its own characteristic molecular vibration or rotation energy level, which is independent of the frequency and intensity of the incident light. In addition to the molecular structure, the Raman shift can be affected by temperature, pressure, and the chemical environment of the molecule. This can be used for qualitative identification.
Based on classical electromagnetic theory, Raman scattering intensity for species i can be expressed as
where is the integrated area of Raman active peak, is the laser intensity, is Raman scattering cross section, is number of scattered molecules i, and is instrumental efficiency of the optical and electronic response.
When factors such as irradiance and temperature are constant, the Raman intensity is proportional to the total number of scattering molecules in the sample. This provides a basis for quantitative analysis [23,24].
In the analysis of hydrates by Raman spectroscopy, the obtained Raman spectrum can provide structural information of gas hydrate. For example, Raman characteristic peak positions can be used to identify gas species and chemical environment (i.e., in which kind of cage). This information will reveal the hydrate structure. Moreover, by calculating the peak area, the relative number of guest molecules in cages of different sizes can be analyzed to obtain key parameters such as cage occupancy.
There are many types of Raman spectroscopy, for example, Fourier transform Raman spectroscopy, resonance Raman spectroscopy, surface-enhanced Raman spectroscopy, Femtosecond time-resolved Raman spectroscopy, Tip-enhanced Raman spectroscopy, and confocal laser Raman microscopy. Among them, the most widely used in hydrate research is confocal laser Raman microscopy [25]. Confocal laser Raman microscopy can focus on a local area of the sample, which usually has great spatial resolution, even better than 1 μm. Therefore, through the multi-point analysis of the sample, the heterogeneity of the sample can be obtained [26]. As a laser has the characteristics of good monochromaticity, strong directivity, high brightness, and good coherence, it will greatly improve the detection sensitivity.
For gas hydrate analysis, confocal laser Raman microscopy can focus the incident laser onto the hydrate sample through the microscope, so as to accurately obtain the relevant chemical composition, crystal structure, molecular interaction, and molecular orientation of the sampled micro-area without being disturbed by surrounding materials.
2.1.2. Factors Affecting the Raman Shift of Guest Molecules in Hydrate Cages
- Cage type
Due to the interaction between guest molecules and host water lattice, the vibration of guest molecules will be affected, guest molecules in cages of different sizes have different Raman shifts. For example, the symmetric C−H stretching of CH4 in large cages and small cages are 2902 and 2912 cm−1, respectively. The peak area (integral intensity) of different Raman characteristic peaks reflects the amount of guest molecules in each cage, whereby the relative cage occupancy of hydrates can be obtained. With other techniques or classical theories, we can obtain the absolute cage occupancy of hydrates. The detailed calculation method will be introduced later.
By summarizing previous Raman studies on artificial synthetic hydrate containing methane with a temperature at 250–300 K, the relationship between the radius of hydrate cage and the Raman shift of methane molecule is plotted, as shown in Figure 2. It can help us better understand how cage size affects the Raman shift of the methane C−H bond. The goodness (R2) of exponential fit is about 0.91. The hydrate cage radius refers to the data given by Sloan et al. [5], as shown in Table 1, in which the representative guest molecules trapped in the cages of different sizes are also listed. According to Figure 2, the larger the cage diameter, the smaller the Raman shift. For the same kind of molecule, in general, its Raman shift in a large cage is always smaller than that in a small cage, except for the sII hydrogen hydrate [27], whose Raman shift in a large cage will be larger.
- Condition
Gas hydrate is always synthesized or preserved at different pressures and temperatures. These conditions may affect the Raman shift of guest molecules in hydrate cages.
Tulk, et al. [59] synthesized and analyzed methane hydrate at 12 K, 60 K, 120 K, and 170 K, and their Raman spectra had no significant difference. Murshed, et al. [60] measured the Raman shift of hydrogenated and deuterated CH4-sI hydrates at 113 K, 133 K, 153 K, and 173 K. However, in their results, as the temperature increased about 60 K, the Raman shift of C−H in large and small cages separately increased about 0.7 cm−1 and 0.4 cm−1. This means temperature had little effect on the Raman shift of guest molecules. When the temperature difference is not large enough, the Raman shift difference can be neglected.
Nakano, et al. [61] synthesized and analyzed methane hydrate at different pressures, the C−H vibration Raman shift of methane in a large cage increased with pressure, while in a small cage, it was constant. According to studies on sI ethane hydrate formed at different pressures by Kurnosov et al. [62] and Hirai H et al. [11], the relationship between C−C vibration Raman shift and pressure is shown in Figure 3. The blue points represent ethane molecules in small cages, while red and black points are ethane molecules in large cages. It can be seen that the Raman shift in large and small cages linearly increased with the pressure. The Raman shift difference between the gas phase and hydrate was caused by the interaction between guest molecules and host cages. As the pressure increased, the hydrate crystal lattice and cages were compressed, which increased the vibration energy of the guest molecules. The exception for methane in a large cage is because the space around it was enough even if the host cage was pressurized.
2.1.3. Application of Raman Spectroscopy to Clathrate Hydrate Study
The Raman spectra of the C−H vibration of several common hydrocarbon hydrates are summarized in Figure 4, where the corresponding composition and structure type are marked on the left side of each spectrum. To show the Raman peaks of methane in different structures, Ohno et al. [63] synthesized methane, methane-ethane, and methane-deuterated MCH hydrates from ice powder. Their Raman spectra in Figure 4 only contains methane signals, and their peak positions can be found in Table 1. Moreover, as ethane and propane molecules are both difficult to fit in the small cage in the hydrate structure, the spectra of ethane sI hydrate and propane sII hydrate shows mainly characteristic peaks of guest molecules in large cages. For neo-pentane and iso-pentane with the same atomic composition, due to the difference in molecular size, the structure of the mixed binary hydrate formed with methane is also different. Neo-pentane is relatively small and forms an sII hydrate with methane, while iso-pentane forms an sH hydrate. In the hydrate structure, both the neo-pentane and iso-pentane can only occupy the large cages, with methane molecules filling the remaining cages. Their Raman shift is summarized in Table 2.
Apart from hydrocarbons, natural gas hydrates also contain inorganic molecules, such as N2, CO2, and H2S [58,66,67,68]. Their Raman shift is out of the region of hydrocarbons. Chazallon et al. [69] analyzed gas components in natural gas hydrates collected at different sites with micro-Raman spectroscopy and provided the Raman spectra of H2S hydrate and CO2 hydrate. Ota et al. [70] investigated the CO2-CH4 replacement in CH4 hydrate with in situ Raman spectroscopy and provided their cage occupancy change during the replacement process. Lee et al. [71] measured the Raman spectrum of CH4-CO2-N2 mixed gas hydrate, which is the sI hydrate identified by XRD. They calculated the cage occupancy of the gas hydrate synthesized at different initial gas compositions and discussed its application on landfill gas treating. Similarly, Liu, et al. [72] estimated the cage occupancy of mixed CH4-CO2-N2 gas hydrate via in situ Raman spectroscopy. Chazallon, et al. [58] analyzed the natural gas hydrate sample from the Western Black Sea and obtained the spatial variability of the methane cage occupancy via Raman imaging.
Compared with the hydrates mentioned above, H2 hydrate is special. The H2 molecule is small enough to occupy a single hydrate cage with multiple molecules. The Raman spectra associated with H2 hydrate is collated in Figure 5. Lines A and B are the Raman signals of H2 molecules in gas phase and in TBAF aqueous solution. Interstitial molecular H2 in ice is shown as line C. This is not a hydrate structure but H2 filled in ice, which can be easily distinguished from hydrate. Hydrate formed by pure H2 is sII (line E). The multiple occupancy of H2 in clathrate caused multiple peaks in the Raman spectra [73]. A single H2 in a small cage is at 4120 and 4125 cm−1, while a double H2 is at 4153 and 4159 cm−1. Multiple H2 in a large cage between the single and double region peaks at 4129, 4136, 4143, and 4150 cm−1 are up to four H2 in a large cage [74]. Another two common structures of H2 characteristic peaks are shown in lines D and F. Line G is a special structure called sVI, containing 12 small cages of 4454 and 16 large cages of 43596273. It is formed when the guest molecule is tBuNH2, and tBuNH2 only occupied large cages, while H2 filled in the 4454 cages. Line H is also a special structure, called a semi-hydrate, synthesized with TBAF.
The Raman shift of the guest molecule in various hydrates with different structures is summarized in Table 2. The C−H vibration peaks of hydrocarbon molecules are mainly concentrated in the range of 2800~3000 cm−1, while the C−C vibration peaks are distributed in the range of 800~1000 cm−1. The Raman shift of guest molecules in small cages are always larger than that in large cages, except for the hydrogen molecules because multiple hydrogen molecules can occupy the same cage.

Table 2.
Raman shift of guest molecules of several clathrate hydrates.
| Guest Molecule | Structure | Cage | Vibrational Mode | Raman Shift/cm−1 | Ref. |
|---|---|---|---|---|---|
| CH4 | I | Small | C−H | 2914.4 | [41] |
| Large | C−H | 2903.8 | |||
| II | Small | C−H | 2913.3 | ||
| Large | C−H | 2903.6 | |||
| H | Small | C−H | 2911.1 | [76] | |
| Middle | C−H | 2909.1 | |||
| C2H6 | I | Large | C−C | 999 | [77] |
| C−H(ν1) | 2889 | ||||
| C−H(2ν11) | 2945 | ||||
| Small | C−C | 1020 | |||
| C−H(ν1) | 2903 | ||||
| C−H(2ν11) | 2966 | ||||
| II | Large | C−H | 2886.2, 2941.3 | [41] | |
| C−C | 991.6 | ||||
| C3H8 | II | Large | C−H | 2871, 2880, 2902, 2920, 2944, 2988 | [78] |
| C−C | 879 | ||||
| n-C4H10 | II | Large | C−C | 800,839 | [26] |
| i-C4H10 | II | Large | C−H | 2874, 2910, 2938, 2967 | [26] |
| C−C | 811 | ||||
| neo-C5H12 | II | Large | C−H | 2877, 2924, 2956, 2976 | [46] |
| CO2 | I | Large | C−O(ν1) | 1273 | [46] |
| O−C−O(2ν2) | 1377 | ||||
| gas | – | C−O(ν1) | 1285 | ||
| O−C−O(2ν2) | 1388 | ||||
| H2S | I | Small | S−H | 2602 | [46] |
| Large | S−H | 2592 | |||
| N2 | II | – | N−N | 2324 | [71] |
| liquid | – | N−N | 2330 | ||
| H2 | II | 1H2 in Small | H−H | 4120, 4125 | [79] |
| 2H2 in Small | H−H | 4153, 4159 | |||
| Large | H−H | 4129, 4136, 4143, 4150 |
Raman spectroscopy is a very good instrument method for hydrate qualitative study (including composition [26], structure type identification [57,76]) and quantitative study [19,80,81,82] (including cage occupancy and hydration number). This information will be applied to the hydrate kinetics process study (including formation [46,51,60,65,83,84,85], dissociation [33,36,64,86], gas replacement [50,60,87,88], and inhibitors [47,89]), structure changes [8,11,31,34,35,41,45,49,90], hydrate distribution [26,38,43], and structural characterization [91,92,93].
2.2. Nuclear Magnetic Resonance (NMR)
2.2.1. Theoretical Basis of NMR for Gas Hydrate Analysis
Nuclear Magnetic Resonance (NMR) is a noninvasive technique to study the properties of matters at the molecular level [94,95]. Spin nuclei, such as 1H and 13C, will create a small magnetic field. Under a uniform strong magnetic field (), the nuclei split into separate energy levels. The spin nuclei will absorb energy when irradiated with electromagnetic waves at an appropriate frequency and generate NMR signals. The frequency matches the energy level difference between two states, which concerns the chemical environment of nuclei. By maintaining the imposed magnetic field constant and increasing the oscillator frequency gradually, resonance of different nuclei will occur, and NMR signals will be observed, i.e., energy will be absorbed by the nucleus at a unique frequency, known as “chemical shift”.
In 13C-NMR measurement, the chemical shift refers to relative change in resonance frequency of a sample compared to a reference compound, such as tetramethylsilane (TMS). Chemical shift is a dimensionless number calculated by,
where is chemical shift, is the resonance frequency of sample, is the resonance frequency of standard reference compound, and is the operating frequency of the instrument. As the magnitude of the chemical shift is small, it is expressed in units of parts per million (ppm). The chemical shift is determined by factors such as molecular structure, electronegativity, and chemical environment.
Common NMR spectroscopy includes 1H-NMR and 13C-NMR. In natural gas hydrates, hydrocarbons are the major component. Since hydrates are solid crystalline substances, solid state 13C-NMR is most widely used. Unlike solution NMR, due to dipole–dipole interaction and chemical shift anisotropy of solid samples, peaks in solid-state NMR spectrum are broad with low resolution [96]. However, high-resolution spectra with a sharp NMR peak can be achieved through special techniques, such as magic angle rotation (MAS) [96,97] or cross-polarization (CP) [98,99,100].
Different guest molecules have different chemical shifts because of their different atomic connections. The same guest molecules in different hydrate cages are also under different chemical environments compared to the common vapor state, which causes their different chemical shifts. This is the basis of qualitative analysis of NMR, which can provide hydrate information such as composition and structure. The NMR signal intensity is proportional to the total number of corresponding guest molecules. This is the basis of the quantitative analysis of NMR, which can help estimate the cage occupancies of gas hydrate.
2.2.2. Factors Affecting the Chemical Shift of Guest Molecules in Hydrate Cages
In the research on clathrate hydrate, the chemical shift of guest molecules is cage-dependent, which can be used to identify the hydrate structure and calculate the cage occupancy [101]. For example, the chemical shift of methane in large cages in sI hydrate is about −6.6 ppm and −4.2 ppm in small cages. In the sII hydrate, the chemical shift of methane in large cages and small cages are −8.2 ppm and −4.3 ppm, respectively. The relationship between the radius of the hydrate cage and the chemical shift of methane molecule is plotted in Figure 6. It can be seen that the chemical shift of methane is approximately linear with the cage radius, and the goodness (R2) of linear fit is about 0.98.
Pressure and temperature also affect the chemical shift of guest molecules in gas hydrate. Liu, et al. [102] calculated the 13C-NMR chemical shift of hydrocarbon guests in gas hydrate, and found it monotonically increased as pressure increased in most cases. Kida, et al. [103] studied how temperature affects the chemical shift of various hydrocarbons. For guest normal alkanes in a looser cage environment, the chemical shift tends to decrease with temperature. For those in a tighter cage environment, the chemical shift tends to increase with temperature.

2.2.3. Application of NMR to Clathrate Hydrate Study
As most of the guest molecules of hydrate are hydrocarbons, 13C-NMR is commonly used. The 13C-NMR spectra of hydrates formed with methane, ethane, and propane, which are collected in the literature [104,106,107,108,109], are plotted in Figure 7. In addition, chemical shifts of hydrocarbon guest molecules for common hydrates with different structures are listed in Table 3. As the peak areas (integral intensity) in 13C-NMR spectra are proportional to the amount of corresponding matters, the obtained peak areas can be combined with the van der Waals-Platteeuw model to calculate the cage occupancy of clathrate hydrate [18,104,110]. The calculation method will be introduced in detail in subsequent sections.
13C-NMR is widely used in hydrate structure determination and composition analysis [12,18,111,112,113,114,115,116]. Ripmeester et al. [18] confirmed that NMR can be used to distinguish sI and sII hydrates due to the chemical shift pattern of methane encaged in large and small cages. Seo et al. [112] combined X-ray diffraction and 13C-NMR to investigate the mixed N2 + CO2 hydrates. By analyzing the relationship between the vapor-phase components and cage occupancy of the guest molecules, it was found that CO2 molecules would be enriched in the hydrate phase to stabilize the structure into sI. Dec [114] studied the formation of methane-ethane hydrate with 13C-NMR, in which both structure I and structure II clathrate hydrates were observed, and a growth kinetic model controlled by the most water-soluble clathrate hydrate former was developed. Lee et al. [115] used 13C-NMR to study the phase behavior and quantitative determination of hydrate composition and cage occupancy for the mixed CH4 + C2H6 + C3H8 hydrates, which confirmed that the mixed hydrate was sII, and that small cages were occupied only by CH4 molecules, whereas large cages were shared by CH4, C2H6, and C3H8 molecules. Lee et al. [111] measured the chemical shifts for pure liquids and synthetic binary sH hydrate samples (with the help of CH4 gas) for 2-methylbutane, 2,2-dimethylbutane, 2,3-dimethylbutane, 2-methylpentane, 3-methylpentane, methylcyclopentane, and methylcyclohexane and ternary sH hydrates of n-pentane and n-hexane with methane and 2,2-dimethylbutane, which can help in assigning spectra for complex hydrates recovered from natural sites. Kida et al. [116] combined 13C-NMR and powder X-ray diffraction measurements on the mixed gas hydrates of methane and butane (including i-butane and n-butane) to investigate the effect of guest molecules in cages on the lattice parameters and density of hydrate. It was found that the lattice constant would increase with increasing butane composition causing the lattice to expand and lowering the hydrate density.
Many prior studies reported the characterization of natural gas hydrate samples by 13C-NMR [105,117,118,119] Takeya et al. [117] analyzed natural gas hydrate recovered by gravity coring at gas-vent fields in Lake Baikal in June 2002, with 13C-NMR spectroscopy, the composition of the encaged gas molecules was determined. It was found that the large-cage occupancy of CH4 encaged in the gas hydrate is 0.94 and small-cage occupancy is 0.99, while CO2, C2H6, and C3H8 were not detected by 13C-NMR spectroscopy. Kim et al. [118] used 13C-MAS-NMR to analyze the natural gas hydrate collected during Ocean Drilling Program (ODP) Leg 204 at the Hydrate Ridge offshore Oregon, founding the occupancy rate of methane molecules in large cages and small cages were about 0.99 and 0.80, respectively. Lu et al. [105], with powder X-ray diffraction and 13C-NMR, characterized the structure, gas content, composition, and distribution of guest molecules in a complex natural hydrate sample recovered from the Barkley canyon on the northern Cascadia margin, providing direct evidence for the natural occurrence of structure H hydrate. Kida et al. [119] investigated the sediment samples recovered from three different areas in the eastern Nankai Trough area, in which the 13C- NMR chemical shifts of encaged CH4 molecules showed that the crystallographic structure of the nature gas hydrate is sI, corroborating the PXRD data.
In addition, 13C-NMR can be used to study the thermodynamics of clathrate hydrate [120,121,122]. Fleyfel et al. [120,121] investigated the hydrate formation and decomposition process in the metastable region with 13C-NMR, and obtained the equilibrium pressure-temperature curve for CH4-C3H8 hydrate. Seo et al. [122] used 13C-NMR to study the effect of structure H-forming hydrocarbon, including 2,2-dimethylbutane and methylcyclohexane, on the equilibrium condition of CH4-C3H8 hydrate.
Moreover, several researchers used 13C-NMR to study the kinetics of hydrate formation, dissociation and inhibition of clathrate hydrates [79,104,123,124,125]. Kini et al. [123] measured the growth rates of CH4 + C3H8 structure II hydrates in a custom-built nonspinning probe via 13C-NMR, and developed a simple surface reaction model, which related growth rate to pressure and particle size. Dec [124] studied the thermally activated decomposition of CH4 + C2H6 structure I hydrate with 13C-MAS-NMR, where large cages encaging C2H6 were found to decompose more rapidly than small cages encaging CH4. Similarly, Kida et al. [125] investigated the dissociation behavior of methane–ethane mixed gas hydrate coexisting structures I and II with powder X-ray diffraction and 13C-NMR, and revealed an anomalous behavior that sI hydrate increased at the initial step of dissociation and then disappeared, which was associated with the dissociation rate of the initial methane–ethane mixed gas hydrate. Lee et al. [104] synthesized sII gas hydrate with a mixture of methane, ethane, propane, n-butane, and isobutene, and studied the effects of ethylene glycol as inhibitor on pure methane hydrate and synthetic mixed gas hydrate. Lee et al. [79] confirmed the inhibitory effect of 1-propanol on methane hydrate and carbon dioxide hydrate with 13C-NMR spectroscopy, and quantitatively analyzed the influence of 1-propanol concentration on the hydrate cage occupancy.
2.3. X-ray Diffraction (XRD)
2.3.1. Theoretical Basis of XRD for Gas Hydrate Analysis
Diffraction describes the scattering of waves by a matter, including electromagnetic radiation or radiation such as neutrons with wave-like characteristics. The diffraction degree of the wave is related to the characteristic size of the matter. When the characteristic size of the matter is on the order of the radiation wavelength, the degree of diffraction reaches a maximum. If radiation interacts with a regular array of obstacles, interference patterns can be observed. Since a single crystal has a three-dimensional ordered lattice, when exposed to radiation, diffraction patterns of distinct Laue spots can be obtained. The relative location of these spots predicts the crystal symmetry and size parameters of the unit cell according to Bragg’s law,
where d is the characteristic spacing distance of the lattice, θ is the angle between the incident radiation and the crystal plane, n is an integer, and λ is the wavelength of the radiation. As powder samples are composed of many microcrystals with random or statistical directions, the same principle holds. Unlike testing single crystals, what is obtained on the two-dimensional detector when testing powder samples is not distinct Laue spots, but Debye-Scherrer rings, which can provide information about the symmetry and content of the unit cell [126,127].
X-ray is an electromagnetic wave with a typical wavelength in the region of 10−10 m of the same order as the crystal lattice. X-ray was discovered by a German physicist, Laue, in 1912 by using a crystal as a grating. When the X-ray enters the crystal, the outer electrons in the crystal atom will be excited and transition to a higher energy state. Photons with a wavelength of about 0.1 nm will be emitted as excited electron transitions back to the ground state. Thus, each atom acts as a new X-ray source, irradiating X-ray scattered waves. Due to the periodic arrangement of atoms in the crystal, there will be spatial interference. The overlapping of the scattered waves can enhance the intensity in some scattering directions and neutralizes each other in others, resulting in diffraction. The direction in which the scattered wave mutually enhanced is the diffraction direction, which is determined by the symmetry, the lattice parameters, and atomic position of the unit cell.
As clathrate hydrates are crystalline solid compounds, XRD can be used to determine hydrate structure types, measure the particle size and lattice parameters of the hydrate crystal, identify various guest molecules, and calculate cage occupancy, etc. The peak positions of hydrate XRD pattern represent different crystal faces (the hkl coefficient), respectively. This information will show the structure of hydrate and lattice parameters. The intensity of these peaks affords more detail information, such as atom occupancy, which will help calculate cage occupancy of guest molecules.
In XRD analysis of gas hydrate, a low temperature condition is required to keep clathrate hydrate stable during detection. The XRD technique can be divided into single-crystal X-ray diffraction and powder X-ray diffraction (PXRD). Single-crystal XRD with high precision can directly obtain the periodic atomic arrangement inside the crystal; thereby, the lattice parameters, structure type, and occupancy rate can be easily obtained. Udachin et al. [21] once carried out structural analysis of hydrate samples recovered from Cascadia margin based on single-crystal XRD diffraction. However, high-quality single crystal hydrates are difficult to synthesize, so the application of single crystal XRD in hydrates is limited. Therefore, powder X-ray diffraction is more commonly used in the qualitative and quantitative analysis of hydrates. PXRD technique only gives the macroscopic average information of the crystal, so only by means of Rietveld structural refinement, quantitative information such as cage occupancy can be obtained. Specific refinement methods will be introduced in detail in subsequent sections.
2.3.2. Application of XRD to Clathrate Hydrate Characterization
As mentioned above, there are three main types of gas hydrate structures, corresponding to different lattice parameters and space groups. XRD is one of the most accurate techniques for hydrate structure identification. The positions of Raman characteristic peaks of different hydrate structures are too close to be clearly separated each other for some guest molecules (e.g., CH4), and the application of NMR spectrum for hydrate structure identification is indirectly through the chemical shift of certain molecule, sometimes overlapped each other. The crystallographic methods, for example XRD, the diffraction pattern is directly related to the lattice structure of a crystal, yielding information on regular array of atoms, especially for host water lattice of gas hydrate. The hydrate of different structure type is with different space group and different XRD pattern, which can be used to identify hydrate structure type directly. We summarized representative XRD patterns of ice and different type of hydrates in Figure 8.
XRD is always used in examining hydrate structural changes with temperature, pressure, and composition. Udachin, et al. [130] measured the lattice parameters of single crystal CO2 hydrate at different temperatures and found thermal expansion of hydrate lattice. Machida, et al. [131] studied structural changes of H2 hydrate under high pressure up to 80GPa, and found a denser structure than filled ice Ic structure above 55–60 GPa exists. Hirai et al. [132] used time-resolved XRD and Raman to study the structure transition of CH4 hydrate at high pressure. They found sI hydrate transformed to sH, and then sH hydrate suddenly collapsed to a methane filled ice Ih structure. Takeya, et al. [10] found in mixed CH4-C2H6 hydrate, as the initial fractions of C2H6 increased from 0 to 100, the structure of sI, sI + sII, sII, sI + sII, and sI were observed successively. Hirai, et al. [11] summarized the structural changes of CH4-C2H6 mixed hydrate at different concentration and pressure, which contain sI, sII, sH, and their coexistence. Similarly, Lee, et al. [133] studied structure transition of mixed CH4 + N2 hydrate, and found this mixed hydrate changed structure from sI to sII at 25.24–28.51 mol% (CH4 concentration in gas).
XRD is also applied to estimate cage occupancy of gas hydrates. Takeya et al. [16] adopted PXRD combined with the ab initio methodology (direct-space technique and Rietveld refinement). By analyzing the C−H bond, they determined the position of the guest molecule in the crystal and calculated the cage occupancy. Cai, et al. [134] studied sH hydrate of 2,2-dimethylbutane-methane hydrate with PXRD and calculated the cage occupancy. Takeya, et al. [135] analyzed the sI C2H4 hydrate with PXRD and calculated the cage occupancy, which is consistent with the Raman results.
2.4. Neutron Diffraction
2.4.1. Theoretical Basis of Neutron Diffraction for Gas Hydrate Analysis
Neutron diffraction is the Brag diffraction that occurs when neutrons with a De Broglie wavelength of about 1 Å pass through a crystalline material. Its basic principle, experimental method and data processing method are similar with XRD, and the XRD method for cage occupancy estimation of gas hydrate can be extended to neutron diffraction.
The difference between neutron diffraction and XRD is mainly reflected in the following aspects. Neutrons generate nuclear scattering by the action of matter and nucleus, while incident X-rays interact with electrons outside the nucleus to produce scattered waves. The scattering factor of neutron diffraction varies with the atomic number and can only be determined experimentally, and its scattering factor does not decrease with the hkl coefficient, so more unit cell information can be obtained. The scattering factor of XRD increases with the atomic number and decreases with the hkl coefficient. Neutron diffraction can be used for isotope discrimination because different isotopic has different amplitude, while there is no difference between isotopes in XRD. Neutron diffraction produces magnetic scattering of atoms which have magnetic moments, while XRD has extremely weak magnetic scattering. In terms of absolute intensity measurement, neutron diffraction can be directly measured, especially for powder, while XRD is difficult.
From the above differences, we can see the advantages of neutron diffraction in hydrate research:
- (1)
- Light elements can be clearly detected, nearly 2/3 of the atoms in hydrate are hydrogen atoms, and the hydrate structure is determined by hydrogen bonding interactions [136]. However, a large proportion of hydrogen will cause high backgrounds. Thus, hydrate samples are always deuterated [20,137,138].
- (2)
- It can identify the isotopes and elements with similar atomic number and can distinguish the crystallographic positions of different isotope, while XRD cannot. So, isotope can be used in neutron diffraction to trace in hydrate formation.
- (3)
- For high pressure gas experiments, high resolution neutron diffraction is more suitable than conventional XRD. High pressure gas will show a great absorption in XRD, while neutron diffraction does not absorb much through the reactor material. The gas pressure of neutron diffraction can even reach 600 MPa [20].
- (4)
- Neutron diffraction frequency coverage is larger than X-ray diffraction, allowing for more detailed analysis of hydrate information [139].
The interpretation of the neutron diffraction data is similar to that of X-ray diffraction data. Rietveld refinement and MEM (Maximum Entropy Method) are commonly used to obtain the structure type of gas hydrate and further solve the structural parameters such as unit cell constant and cage occupancy. The Rietveld structural refinement is, by computer processing, based on the known main information of crystal structure. Using the least square method to calculate the intensity of thousands of measurement points under the overlap of multiple parameters, so as to best match the measured values. The MEM is to determine the maximum information entropy under some constraints and obtain the density distribution under condition of maximum information entropy and then calculate the crystal structural parameters based on its density distribution [138].
2.4.2. Application of Neutron Diffraction to Clathrate Hydrate Study
Neutron diffraction can be applied to identify the hydrate structure. As is shown in Figure 9, tee main structure of the gas hydrate is summarized. Halpern, et al. [140] inject CO2 to Ar hydrate and observed the structure transformation from sII to sI. Murshed, et al. [60] studied in situ formation of CH4-C2H6 mixed gas hydrate via neutron diffraction and obtained phase fraction changes of sI/sII/Ice during the whole process.
Similar to XRD, neutron diffraction is also applied to estimate cage occupancy of gas hydrate. W.F.Kuhs, et al. [20] used high-resolution neutron diffraction to study the nitrogen hydrate from the polar ice cap. For the first time, the compressibility of the hydrate and position and angle of the guest molecules in the cages were obtained, and the cage occupancy was measured. Igawa, et al. [143] used the RIETAN-EP program for Rietveld analysis. After refinement, the PRIMA program was used for MEM analysis, and the nuclear density distribution was calculated. The nuclear density distribution of Xe’s deuterated hydrate was obtained by using the VESTA program. Hoshikawa, et al. [137] combined the method of Rietveld and MEM, and studied the deuterated methane deuterated hydrate (CD4·xD2O, sI). They obtained its atomic site information and atomic occupancy rate, and according to these, cage occupancy of deuterated methane in large and small cages was calculated. Tulk, et al. [144] used the Rietveld method to measure the cage occupancy of CD4 deuterated hydrate (sH). The average occupancy of CD4 in large, medium, and small cages was 3.1, 0.90, and 0.89, respectively. This result provided necessary information for the refinement of the intermolecular potential energy parameters of water–methane hydrophobic interaction in hydrates. Igawa, et al. [138] studied the deuterated hydrate of carbon dioxide with MEM method. Assuming that large cage occupancy is 1, they obtain the small cage occupancy. Hoshikawa, et al. [145] evaluated cage occupancy of the mixed CH4-C3H8 gas hydrate.
3. Methods for Cage Occupancy Estimation of Gas Hydrate
3.1. Method Based on vdWP Theory
The vdWP theory was first proposed by van der Waals and Platteeuw at 1959 [146]. In 1963, McKoy and Sinanoglu [147] improved this theory with Kihara potential. In 1966, Nagata and Kobayashi [148] applied vdWP theory into calculation of mixed gas hydrate. In 1972, Parrish and Prausnitz [149] applied vdWP theory on gas hydrate of more species. The theory has the following assumptions: (1) hydrate free energy and cage occupancy are independent; (2) a cavity can only contain one guest molecule, which cannot diffuse between cages; (3) no gas molecule interaction and host lattice deformation; (4) theoretical data are identical; and (5) not affected by quantum effects. The model is expressed as
where is the chemical potential difference between the empty gas hydrate lattice and the stable ice lattice, commonly using 1297 J∙mol−1 in sI hydrate [19,150] and 883.8 J∙mol−1 in sII hydrate [104]. The above values are for reference only, because the value of given by different literatures are different [151,152]. and represent the ratio of large cage and small cage to the number of water molecules in the hydrate lattice, respectively. In sI hydrate, there are six large cages, two small cages, and 46 water molecules in a structure cell, so , . While in sII hydrate, there are eight large cages, 16 small cages, and 136 water molecules in a structure cell; thus, , .
Using Raman spectroscopy or 13C-NMR, we can scan and quantitatively analyze the hydrate sample. As mentioned above, the area of the Raman characteristic peak is related to the number of guest molecules and its Raman scattering cross-section; peak areas of the 13C-NMR spectra are directly related to relative amount of carbon atoms; thus, the hydrate can be quantitatively analyzed. These relative intensities can be used as the basis for relative cage occupancy.
Based on Equation (1), we can obtain the relative cage occupancy via Raman spectroscopy
where the subscripts l and s represent the large cage and the small cage, respectively, i and j represent the different molecules, θ means cage occupancy, A is the peak area (integral intensity) of a Raman characteristic peak for guest molecules in cages, σ is the Raman scattering cross section, and η is instrumental efficiency of the optical and electronic response.
The difference of η can be neglected. For the same kind of molecule, assuming σs and σl to be identical, νs/νl can be obtained according to the hydrate structure (which is the ratio of the small cage number to the large cage number, the sI hydrate is 1/3, and the sII hydrate is 2). The Raman peak area of the guest molecule in the large and small cages can be calculated by the Raman spectra, and using Equation (5), we obtain θl/θs. NMR is similar to Raman spectroscopy, and the relative cage occupancy θl/θs can also be determined by the ratio of the peak areas in the spectra.
The cage occupancy of a single component hydrate can be obtained by the combination of Equations (4) and (5).
For multiple component hydrates, we take the C3H8 + CH4 mixed hydrate as an example. In this hydrate, C3H8 is not encased in a small cage. According to Raman spectra and Equation (5), we obtain θl,CH4/θl,C3H8 and θs,CH4/θl,C3H8. We should note that, for different kind of molecules, their σ ratio is not 1. It can be measured by scanning their mixed gases of different known compositions. Similar to Equation (4), we obtain:
where , , and . Combining Equations (5) and (6), we obtain their cage occupancies.
3.2. Calibrated Quantitative Analysis of Raman Spectroscopy
Qin and Kuhs [153] propose a calibration protocol to quantify the cage occupancy of gas hydrates via Raman spectroscopy. This method corrects the common Raman method using synchrotron powder diffraction and Raman peaks of water molecules in hydrate. This can make the result more accurate, especially for calculating occupancy of different cages and in mixed hydrate. Different from the method in Section 3.1, this method used water molecules as reference substance. Firstly, they deal with the single component of methane hydrate, ethane hydrate, carbon dioxide hydrate, and their cage occupancy. Using Raman spectra, the peak area of guest in large and small cages, and the peak area of O−H stretching vibrational bands in the 2830–3600 cm−1 region (which means peak area of water molecules in hydrate) can be obtained. Using synchrotron powder diffraction, they obtained large and small cage occupancy of the three single hydrate. Using these data, they obtain the quantification factor of quantitative calculation of different guest molecules in different cages and framework water molecules. Through these factors, the corrected cage occupancy can be calculated according to the Raman spectrum.
They synthesized pure hydrate of CO2, CH4, and C2H6. Assuming that the Raman spectra of host molecules in pure sI CO2, CH4, and C2H6 hydrates are independent of the guest species, two scaling factors are introduced
where and refer to the scaling factor of CO2 to CH4 and C2H6 to CH4, , , and represent the integration area of O−H bands of pure hydrate spectra in 2830–3600 cm−1, respectively. These scaling factors can normalize these spectra. As these hydrates are also measured by XRD and NMR, their absolute cage occupancy and relative Raman cross section in different cages are accurately measured. On the basis of Equation (1), the relative Raman quantification factor (F-factor, ) of CH4 or C2H6 in large and small cages to water can be obtained
As Raman bands of CO2 in different cages cannot be resolved, Raman cross-sections of CO2 are assumed to be identical. The relative F-factor ratio of CO2 can be obtained by
where L and S means large cage and small cage, A is integration area of corresponding peaks, and N is molecular number.
As uncertainty of these relative F-factors between guest and host molecules is within ±6%, they can be used to determine cage occupancy combined with Raman spectroscopy.
For CH4 or C2H6, absolute cage occupancy in large and small cages can be expressed as
For CO2, total cage occupancy is obtained by
3.3. Refinement Method of Powder Diffraction of Gas Hydrate
Rietveld structural refinement is widely used in the processing of powder diffraction data. It is based on the known main crystal structure. The crystal atomic structure model is established by a computer program, and the calculated value of its diffraction pattern is obtained. By adjusting the peak shape, peak position, lattice constant, atomic parameters, atomic occupancy, temperature factor, and other parameters, the calculated values of the pattern are continuously adjusted. The least square method is used to minimize the sum of the squares of the difference between the calculated value and the sample measured value. In this way, we can achieve the best match between the corrected pattern and the actual measured pattern, and we can regard the structure of calculated corrected pattern as the structure of actual measured sample. This method not only gives the structural characteristics of the crystal but also the position and occupancy of each atom in the unit cell. Therefore, it can be used to estimate the cage occupancy of gas hydrate [134,154].
Takeya et al. [16] combined the direct space method with Rietveld analysis and applied them to clathrate hydrates. With the direct-space technique program, the space group was fixed according to the known structures I, II, and H. For simplification, the virtual chemical species, Wa and M, whose atomic scattering factors are equal to the sum of those for H2O and CH4, −CH3, or −CH2, were used instead of these atomic groups. Cage occupancies were used as free parameters in the refinement.
The cage occupancies determined by this method are shown in Table 4. The results of single crystal XRD and 13C-NMR spectroscopy are also in this table. These results are in good agreement.
4. Conclusions
Among the four instrument methods mentioned in this review, Raman spectroscopy is most widely used for determining hydrate cage occupancy. Its confocal technology can focus on a small area with the size of few microns, which means a small amount of sample and the detailed distribution of the cage occupancy. 13C-NMR is a reliable quantitative method for hydrates of carbon-containing guests, such as hydrocarbons and carbon dioxide. Diffraction techniques give more detailed structural information. The XRD is cheap and can accurately determine the unit cell parameters. Neutron diffraction is better for detecting light elements than XRD but not convenient to use. The crystallographic methods (including XRD and neutron diffraction) require the information of guest species before cage occupancy calculation, while the spectroscopic methods (including Raman and NMR) can identify the guest molecules directly and estimate the cage occupancy. This review can help estimate the amount of natural gas hydrate resource and evaluate the energy storage efficiency in form of clathrate hydrate (methane, hydrogen, carbon dioxide, etc.).
Author Contributions
Conceptualization, W.C.; writing—original draft preparation, W.C.; writing—review and editing, X.H. and H.L.; supervision, H.L.; project administration H.L.; funding acquisition, H.L. All authors have read and agreed to the published version of the manuscript.
Funding
This research was funded by the China Geological Survey, grant number DD20190234 and Sinopec Ministry of Science and Technology, grant number P20040-4.
Institutional Review Board Statement
Not applicable.
Informed Consent Statement
Not applicable.
Data Availability Statement
Not applicable.
Conflicts of Interest
The authors declare no conflict of interest.
References
- McMullan, R.K.; Jeffrey, G. Polyhedral clathrate hydrates. IX. Structure of ethylene oxide hydrate. J. Chem. Phys. 1965, 42, 2725–2732. [Google Scholar] [CrossRef]
- Mak, T.C.; McMullan, R.K. Polyhedral clathrate hydrates. X. Structure of the double hydrate of tetrahydrofuran and hydrogen sulfide. J. Chem. Phys. 1965, 42, 2732–2737. [Google Scholar] [CrossRef]
- Ripmeester, J.A.; Tse, J.S.; Ratcliffe, C.I.; Powell, B.M. A new clathrate hydrate structure. Nature 1987, 325, 135–136. [Google Scholar] [CrossRef]
- Koh, C.A.; Sloan, E.D.; Sum, A.K.; Wu, D.T. Fundamentals and Applications of Gas Hydrates. Annu. Rev. Chem. Biomol. Eng. 2011, 2, 237–257. [Google Scholar] [CrossRef] [PubMed]
- Sloan, E.D., Jr.; Koh, C.A. Clathrate Hydrates of Natural Gases; CRC Press: Boca Raton, FL, USA, 2007. [Google Scholar]
- Sloan, E.D. Fundamental principles and applications of natural gas hydrates. Nature 2003, 426, 353–359. [Google Scholar] [CrossRef]
- Altamash, T.; Esperança, J.M.S.S.; Tariq, M. Surface Coatings and Treatments for Controlled Hydrate Formation: A Mini Review. Physchem 2021, 1, 272–287. [Google Scholar] [CrossRef]
- Hirai, H.; Uchihara, Y.; Fujihisa, H.; Sakashita, M.; Katoh, E.; Aoki, K.; Nagashima, K.; Yamamoto, Y.; Yagi, T. High-pressure structures of methane hydrate observed up to 8 GPa at room temperature. J. Chem. Phys. 2001, 115, 7066–7070. [Google Scholar] [CrossRef] [Green Version]
- Takehiko, T.; Hisako, H.; Takahiro, M.; Yasuo, O.; Takehiko, Y.; Michika, O.; Yoshitaka, Y.; Satoshi, N.; Tetsuo, I. Phase changes of filled ice Ih methane hydrate under low temperature and high pressure. J. Chem. Phys. 2013, 139, 45–257. [Google Scholar]
- Takeya, S.; Kamata, Y.; Uchida, T.; Nagao, J.; Ebinuma, T.; Narita, H.; Hori, A.; Hondoh, T. Coexistence of structure I and II hydrates formed from a mixture of methane and ethane gases. Can. J. Phys. 2003, 81, 479–484. [Google Scholar] [CrossRef]
- Hirai, H.; Takahara, N.; Kawamura, T.; Yamamoto, Y.; Yagi, T. Changes in structure and preferential cage occupancy of ethane hydrate and ethane-methane mixed gas hydrate under high pressure. J. Phys. Conf. Ser. 2010, 215, 012059. [Google Scholar] [CrossRef] [Green Version]
- Seo, Y.; Kang, S.-P.; Jang, W.; Kim, S. Inhibition of Natural Gas Hydrates in the Presence of Liquid Hydrocarbons Forming Structure H. Phys. Chem. B 2010, 114, 6084–6088. [Google Scholar] [CrossRef]
- Nakamura, T.; Makino, T.; Sugahara, T.; Ohgaki, K. Stability boundaries of gas hydrates helped by methane—structure-H hydrates of methylcyclohexane and cis-1,2-dimethylcyclohexane. Chem. Eng. Sci. 2003, 58, 269–273. [Google Scholar] [CrossRef]
- Glew, D.N. Some Stoicheiometric Gas Hydrates. Nature 1959, 184, 545–546. [Google Scholar] [CrossRef]
- Davidson, D.W. The Motion of Guest Molecules in Clathrate Hydrates. Can. J. Chem. 1971, 49, 1224–1242. [Google Scholar] [CrossRef]
- Takeya, S.; Udachin, K.A.; Moudrakovski, I.; Susilo, R.; Ripmeester, J.A. Direct Space Methods for Powder X-ray Diffraction for Guest−Host Materials: Applications to Cage Occupancies and Guest Distributions in Clathrate Hydrates. J. Am. Chem. Soc. 2010, 132, 524–531. [Google Scholar] [CrossRef] [PubMed] [Green Version]
- Hollander, F.; Jeffrey, G.A. Neutron diffraction study of the crystal structure of ethylene oxide deuterohydrate at 80 °K. J. Chem. Phys. 1977, 66, 4699–4705. [Google Scholar] [CrossRef]
- Ripmeester, J.A.; Ratcliffe, C.I. Low-temperature cross-polarization/magic angle spinning carbon-13 NMR of solid methane hydrates: Structure, cage occupancy, and hydration number. J. Phys. Chem. 1988, 92, 337–339. [Google Scholar] [CrossRef]
- Sum, A.K.; Burruss, R.C.; Sloan, E.D. Measurement of Clathrate Hydrates via Raman Spectroscopy. J. Phys. Chem. B 1997, 101, 7371–7377. [Google Scholar] [CrossRef]
- Kuhs, W.; Chazallon, B.; Radaelli, P.; Pauer, F. Cage Occupancy and Compressibility of Deuterated N2-Clathrate Hydrate by Neutron Diffraction. J. Incl. Phenom. Macrocycl. Chem. 1997, 29, 65–77. [Google Scholar] [CrossRef]
- Udachin, K.A.; Lu, H.; Enright, G.D.; Ratcliffe, C.I.; Ripmeester, J.A.; Chapman, N.R.; Riedel, M.; Spence, G. Single Crystals of Naturally Occurring Gas Hydrates: The Structures of Methane and Mixed Hydrocarbon Hydrates. Angew. Chem. Int. Ed. 2007, 46, 8220–8222. [Google Scholar] [CrossRef]
- Lu, H.; Ripmeester, J.A. A laboratory protocol for the analysis of natural gas hydrates. In Proceedings of the 6th International Conference on Gas Hydrates, Vancouver, BC, Canada, 6–10 July 2008. [Google Scholar] [CrossRef]
- Szymanski, H. Raman Spectroscopy; Springer: New York, NY, USA, 1967. [Google Scholar]
- Li, J. Mathematical Representation of Raman Spectra and Applications in Quantitative Analysis. Ph.D. Thesis, Zhejiang University, Hangzhou, China, 2013. [Google Scholar]
- Toporski, J.; Dieing, T.; Hollricher, O. Confocal Raman Microscopy Volume 66||High Resolution Optical and Confocal Microscopy; Springer Series in Surface Sciences; Springer: Berlin/Heidelberg, Germany, 2018. [Google Scholar]
- Klapp, S.A.; Murshed, M.M.; Pape, T.; Klein, H.; Bohrmann, G.; Brewer, P.; Kuhs, W.F. Mixed gas hydrate structures at the Chapopote Knoll, southern Gulf of Mexico. Earth Planet. Sci. Lett. 2010, 299, 207–217. [Google Scholar] [CrossRef]
- Strobel, T.A.; Koh, C.A.; Sloan, E.D. Hydrogen storage properties of clathrate hydrate materials. Fluid Phase Equilibria 2007, 261, 382–389. [Google Scholar] [CrossRef]
- Kortus, J.; Irmer, G.; Monecke, J.; Pederson, M.R. Influence of cage structures on the vibrational modes and Raman activity of methane. Model. Simul. Mater. Sci. Eng. 2000, 8, 403–411. [Google Scholar] [CrossRef]
- Seo, Y.; Lee, H. Phase Behavior and Structure Identification of the Mixed Chlorinated Hydrocarbon Clathrate Hydrates. J. Phys. Chem. B 2002, 106, 9668–9673. [Google Scholar] [CrossRef]
- Uchida, T.; Takeya, S.; Wilson, L.D.; Tulk, C.A.; Ripmeester, J.A.; Nagao, J.; Ebinuma, T.; Narita, H. Measurements of physical properties of gas hydrates and in situ observations of formation and decomposition processes via Raman spectroscopy and X-ray diffraction. Can. J. Phys. 2003, 81, 351–357. [Google Scholar] [CrossRef]
- Sugahara, T.; Makino, T.; Ohgaki, K. Isothermal phase equilibria for the methane + ethylene mixed gas hydrate system. Fluid Phase Equilibria 2003, 206, 117–126. [Google Scholar] [CrossRef]
- Huo, Z.; Hester, K.; Sloan, E.D., Jr.; Miller, K.T. Methane hydrate nonstoichiometry and phase diagram. AIChE J. 2003, 49, 1300–1306. [Google Scholar] [CrossRef]
- Komai, T.; Kang, S.-P.; Yoon, J.-H.; Yamamoto, Y.; Kawamura, T.; Ohtake, M. In Situ Raman Spectroscopy Investigation of the Dissociation of Methane Hydrate at Temperatures just below the Ice Point. J. Phys. Chem. B 2004, 108, 8062–8068. [Google Scholar] [CrossRef]
- Shimizu, H.; Tada, N.; Ikawa, R.; Kume, T.; Sasaki, S. Optical Microscopy and in Situ Raman Scattering of Single Crystalline Ethylene Hydrate and Binary Methane−Ethylene Hydrate at High Pressures. J. Phys. Chem. B 2005, 109, 22285–22289. [Google Scholar] [CrossRef]
- Kunita, Y.; Makino, T.; Sugahara, T.; Ohgaki, K. Raman spectroscopic studies on methane + tetrafluoromethane mixed-gas hydrate system. Fluid Phase Equilibria 2007, 251, 145–148. [Google Scholar] [CrossRef]
- Taylor, C.E.; Link, D.D.; English, N. Methane hydrate research at NETL—Research to make methane production from hydrates a reality. J. Pet. Sci. Eng. 2007, 56, 186–191. [Google Scholar] [CrossRef]
- Choukroun, M.; Morizet, Y.; Grasset, O. Raman study of methane clathrate hydrates under pressure: New evidence for the metastability of structure II. J. Raman Spectrosc. 2007, 38, 440–451. [Google Scholar] [CrossRef]
- Hester, K.; Dunk, R.; Walz, P.; Peltzer, E.; Sloan, E.; Brewer, P. Direct measurements of multi-component hydrates on the seafloor: Pathways to growth. Fluid Phase Equilibria 2007, 261, 396–406. [Google Scholar] [CrossRef]
- Hansen, S.B.; Berg, R.W. Raman Spectroscopic Studies of Methane Gas Hydrates. Appl. Spectrosc. Rev. 2009, 44, 168–179. [Google Scholar] [CrossRef]
- Makino, T.; Mori, M.; Mutou, Y.; Sugahara, T.; Ohgaki, K. Four-Phase Equilibrium Relations of Methane + Methylcyclohexanol Stereoisomer + Water Systems Containing Gas Hydrate. J. Chem. Eng. Data 2009, 54, 996–999. [Google Scholar] [CrossRef]
- Ohno, H.; Strobel, T.A.; Dec, S.F.; Sloan, J.E.D.; Koh, C.A. Raman Studies of Methane−Ethane Hydrate Metastability. J. Phys. Chem. A 2009, 113, 1711–1716. [Google Scholar] [CrossRef] [PubMed]
- Linga, P.; Haligva, C.; Nam, S.C.; Ripmeester, J.A.; Englezos, P. Gas Hydrate Formation in a Variable Volume Bed of Silica Sand Particles. Energy Fuels 2009, 23, 5496–5507. [Google Scholar] [CrossRef]
- Davies, S.R.; Sloan, E.D.; Sum, A.; Koh, C.A. In Situ Studies of the Mass Transfer Mechanism across a Methane Hydrate Film Using High-Resolution Confocal Raman Spectroscopy. J. Phys. Chem. C 2010, 114, 1173–1180. [Google Scholar] [CrossRef]
- Sun, C.-Y.; Chen, G.-J.; Zhang, L.-W. Hydrate phase equilibrium and structure for (methane + ethane + tetrahydrofuran + water) system. J. Chem. Thermodyn. 2010, 42, 1173–1179. [Google Scholar] [CrossRef]
- Matsumoto, Y.; Miyauchi, H.; Makino, T.; Sugahara, T.; Ohgaki, K. Structural phase transitions of methane + ethane mixed-gas hydrate induced by 1,1-dimethylcyclohexane. Chem. Eng. Sci. 2011, 66, 2672–2676. [Google Scholar] [CrossRef]
- Schicks, J.M.; Luzi-Helbing, M. Cage occupancy and structural changes during hydrate formation from initial stages to resulting hydrate phase. Spectrochim. Acta Part A Mol. Biomol. Spectrosc. 2013, 115, 528–536. [Google Scholar] [CrossRef]
- Kim, J.; Shin, K.; Seo, Y.; Cho, S.J.; Lee, J.D. Synergistic Hydrate Inhibition of Monoethylene Glycol with Poly(vinylcaprolactam) in Thermodynamically Underinhibited System. J. Phys. Chem. B 2014, 118, 9065–9075. [Google Scholar] [CrossRef]
- McLaurin, G.; Shin, K.; Alavi, S.; Ripmeester, J.A. Antifreezes Act as Catalysts for Methane Hydrate Formation from Ice. Angew. Chem. Int. Ed. 2014, 53, 10429–10433. [Google Scholar] [CrossRef]
- Kwon, M.; Lee, J.-W.; Lee, H. Temperature-Dependent Structural Transitions in Methane–Ethane Mixed Gas Hydrates. J. Phys. Chem. C 2014, 118, 28906–28913. [Google Scholar] [CrossRef]
- Xu, C.-G.; Cai, J.; Lin, F.-H.; Chen, Z.-Y.; Li, X. Raman analysis on methane production from natural gas hydrate by carbon dioxide–methane replacement. Energy 2015, 79, 111–116. [Google Scholar] [CrossRef]
- Park, J.; Shin, K.; Lee, J.-W.; Lee, H.; Seo, Y. In situ Raman and 13C NMR spectroscopic analysis of gas hydrates formed in confined water: Application to natural gas capture. Can. J. Chem. 2015, 93, 1035–1042. [Google Scholar] [CrossRef]
- Zhong, J.-R.; Zeng, X.-Y.; Zhou, F.-H.; Ran, Q.-D.; Sun, C.-Y.; Zhong, R.-Q.; Yang, L.-Y.; Chen, G.-J.; Koh, C.A. Self-preservation and structural transition of gas hydrates during dissociation below the ice point: An In Situ study using Raman spectroscopy. Sci. Rep. 2016, 6, 38855. [Google Scholar] [CrossRef] [PubMed] [Green Version]
- Huang, X.; Cai, W.; Zhan, L.; Lu, H. Study on the reaction of methane hydrate with gaseous CO2 by Raman imaging microscopy. Chem. Eng. Sci. 2020, 222, 115720. [Google Scholar] [CrossRef]
- Krishnan, Y.; Ghaani, M.R.; Desmedt, A.; English, N.J. Hydrogen Inter-Cage Hopping and Cage Occupancies inside Hydrogen Hydrate: Molecular-Dynamics Analysis. Appl. Sci. 2020, 11, 282. [Google Scholar] [CrossRef]
- Russina, M.; Kemner, E.; Mezei, F. Intra-cage dynamics of molecular hydrogen confined in cages of two different dimensions of clathrate hydrates. Sci. Rep. 2016, 6, 27417. [Google Scholar] [CrossRef] [Green Version]
- Uchida, T.; Ohmura, R.; Ikeda, I.Y.; Nagao, J.; Takeya, S.; Hori, A. Phase Equilibrium Measurements and Crystallographic Analyses on Structure-H Type Gas Hydrate Formed from the CH4−CO2−Neohexane−Water System. J. Phys. Chem. B 2006, 110, 4583–4588. [Google Scholar] [CrossRef] [PubMed]
- Luzi, M.; Schicks, J.M.; Naumann, R.; Erzinger, J. Systematic kinetic studies on mixed gas hydrates by Raman spectroscopy and powder X-ray diffraction. J. Chem. Thermodyn. 2012, 48, 28–35. [Google Scholar] [CrossRef] [Green Version]
- Chazallon, B.; Rodriguez, C.T.; Ruffine, L.; Carpentier, Y.; Donval, J.P.; Ker, S.; Riboulot, V. Characterizing the variability of natural gas hydrate composition from a selected site of the Western Black Sea, off Romania. Mar. Pet. Geol. 2021, 124, 104785. [Google Scholar] [CrossRef]
- Tulk, C.A.; Ripmeester, J.A.; Klug, D.D. The Application of Raman Spectroscopy to the Study of Gas Hydrates. Ann. N. Y. Acad. Sci. 2006, 912, 859–872. [Google Scholar] [CrossRef]
- Murshed, M.M.; Kuhs, W.F. Kinetic Studies of Methane–Ethane Mixed Gas Hydrates by Neutron Diffraction and Raman Spectroscopy. J. Phys. Chem. B 2009, 113, 5172–5180. [Google Scholar] [CrossRef] [PubMed]
- Nakano, S.; Moritoki, M.; Ohgaki, K. High-Pressure Phase Equilibrium and Raman Microprobe Spectroscopic Studies on the Methane Hydrate System. J. Chem. Eng. Data 1999, 44, 254–257. [Google Scholar] [CrossRef]
- Kurnosov, A.V.; Ogienko, A.G.; Goryainov, S.V.; Larionov, E.G.; Manakov, A.Y.; Lihacheva, A.Y.; Aladko, E.Y.; Zhurko, F.V.; Voronin, V.I.; Berger, I.F.; et al. Phase diagram and high-pressure boundary of hydrate formation in the ethane—Water system. J. Phys. Chem. B 2006, 110, 21788–21792. [Google Scholar] [CrossRef]
- Ohno, H.; Kida, M.; Sakurai, T.; Iizuka, Y.; Hondoh, T.; Narita, H.; Nagao, J. Symmetric Stretching Vibration of CH4 in Clathrate Hydrate Structures. ChemPhysChem 2010, 11, 3070–3073. [Google Scholar] [CrossRef]
- Ohno, H.; Oyabu, I.; Iizuka, Y.; Hondoh, T.; Narita, H.; Nagao, J. Dissociation Behavior of C2H6 Hydrate at Temperatures below the Ice Point: Melting to Liquid Water Followed by Ice Nucleation. J. Phys. Chem. A 2011, 115, 8889–8894. [Google Scholar] [CrossRef]
- Uchida, T.; Moriwaki, M.; Takeya, S.; Ikeda, I.Y.; Ohmura, R.; Nagao, J.; Minagawa, H.; Ebinuma, T.; Narita, H.; Gohara, K.; et al. Two-step formation of methane-propane mixed gas hydrates in a batch-type reactor. AIChE J. 2004, 50, 518–523. [Google Scholar] [CrossRef]
- Ye, J.; Wei, J.; Liang, J.; Lu, J.; Lu, H.; Zhang, W. Complex gas hydrate system in a gas chimney, South China Sea. Mar. Pet. Geol. 2019, 104, 29–39. [Google Scholar] [CrossRef]
- Schicks, J.; Ziemann, M.; Lu, H.; Ripmeester, J. Raman spectroscopic investigations on natural samples from the Integrated Ocean Drilling Program (IODP) Expedition 311: Indications for heterogeneous compositions in hydrate crystals. Spectrochim. Acta Part A Mol. Biomol. Spectrosc. 2010, 77, 973–977. [Google Scholar] [CrossRef]
- Jin, Y.; Kida, M.; Yoneda, J.; Konno, Y.; Oshima, M.; Tenma, N.; Nagao, J. Natural Gas Hydrates Recovered from the Umitaka Spur in the Joetsu Basin, Japan: Coexistence of Two Structure-I Hydrates with Distinctly Different Textures and Gas Compositions within a Massive Structure. ACS Earth Space Chem. 2020, 4, 77–85. [Google Scholar] [CrossRef] [Green Version]
- Chazallon, B.; Focsa, C.; Charlou, J.-L.; Bourry, C.; Donval, J.-P. A comparative Raman spectroscopic study of natural gas hydrates collected at different geological sites. Chem. Geol. 2007, 244, 175–185. [Google Scholar] [CrossRef] [Green Version]
- Ota, M.; Saito, T.; Aida, T.; Watanabe, M.; Sato, Y.; Smith, R.L., Jr.; Inomata, H. Macro and microscopic CH4–CO2 replacement in CH4 hydrate under pressurized CO2. AIChE J. 2007, 53, 2715–2721. [Google Scholar] [CrossRef]
- Lee, H.-H.; Ahn, S.-H.; Nam, B.-U.; Kim, B.-S.; Lee, G.-W.; Moon, D.; Shin, H.J.; Han, K.W.; Yoon, J.-H. Thermodynamic Stability, Spectroscopic Identification, and Gas Storage Capacity of CO2–CH4–N2 Mixture Gas Hydrates: Implications for Landfill Gas Hydrates. Environ. Sci. Technol. 2012, 46, 4184–4190. [Google Scholar] [CrossRef] [PubMed]
- Chuanhai, L.; Ran, C.; Baoyong, Z.; Qiang, W.; Qiang, Z.; Xia, G.; Qiong, W. Raman Spectroscopic Study on a CO2-CH4-N2 Mixed-Gas Hydrate System. Front. Energy Res. 2021, 9, 251. [Google Scholar] [CrossRef]
- Strobel, T.A.; Sloan, E.D.; Koh, C.A. Raman spectroscopic studies of hydrogen clathrate hydrates. J. Chem. Phys. 2009, 130, 014506. [Google Scholar] [CrossRef]
- Grim, R.G.; Barnes, B.C.; Lafond, P.G.; Kockelmann, W.A.; Keen, D.A.; Soper, A.K.; Hiratsuka, M.; Yasuoka, K.; Koh, C.A.; Sum, A.K. Observation of Interstitial Molecular Hydrogen in Clathrate Hydrates. Angew. Chem. Int. Ed. 2014, 53, 10710–10713. [Google Scholar] [CrossRef] [PubMed]
- Trueba, A.T.; Radovic, I.; Zevenbergen, J.F.; Peters, C.J.; Kroon, M.C. Kinetic measurements and in situ Raman spectroscopy study of the formation of TBAF semi-hydrates with hydrogen and carbon dioxide. Int. J. Hydrogen Energy 2013, 38, 7326–7334. [Google Scholar] [CrossRef]
- Jin, Y.; Kida, M.; Nagao, J. Structure H (sH) Clathrate Hydrate with New Large Molecule Guest Substances. J. Phys. Chem. C 2013, 117, 23469–23475. [Google Scholar] [CrossRef]
- Hirai, H.; Takahara, N.; Kawamura, T.; Yamamoto, Y.; Yagi, T. Structural changes and preferential cage occupancy of ethane hydrate and methane-ethane mixed gas hydrate under very high pressure. J. Chem. Phys. 2008, 129, 224503. [Google Scholar] [CrossRef] [PubMed]
- Prasad, P.S.R.; Prasad, K.S.; Sowjanya, Y.; Sain, K. Laser micro Raman investigations on gas hydrates. Curr. Sci. 2008, 94, 1495–1499. [Google Scholar]
- Park, S.; Koh, D.-Y.; Kang, H.; Lee, J.W.; Lee, H. Effect of Molecular Nitrogen on Multiple Hydrogen Occupancy in Clathrate Hydrates. J. Phys. Chem. C 2014, 118, 20203–20208. [Google Scholar] [CrossRef]
- Uchida, T.; Takeya, S.; Kamata, Y.; Ohmura, R.; Narita, H. Spectroscopic Measurements on Binary, Ternary, and Quaternary Mixed-Gas Molecules in Clathrate Structures. Ind. Eng. Chem. Res. 2007, 46, 5080–5087. [Google Scholar] [CrossRef]
- Prasad, P.; Sowjanya, Y.; Prasad, K.S. Micro-Raman investigations of mixed gas hydrates. Vib. Spectrosc. 2009, 50, 319–323. [Google Scholar] [CrossRef]
- Eswari, C.V.; Raju, B.; Chari, V.D.; Prasad, P.; Sain, K. Laboratory study of methane hydrate formation kinetics and structural stability in sediments. Mar. Pet. Geol. 2014, 58, 199–205. [Google Scholar] [CrossRef]
- Sloan, E.D.; Subramanian, S.; Matthews, P.N.; Lederhos, J.P.; Khokhar, A.A. Quantifying Hydrate Formation and Kinetic Inhibition. Ind. Eng. Chem. Res. 1998, 37, 3124–3132. [Google Scholar] [CrossRef]
- Kumar, R.; Linga, P.; Moudrakovski, I.; Ripmeester, J.A.; Englezos, P. Structure and kinetics of gas hydrates from methane/ethane/propane mixtures relevant to the design of natural gas hydrate storage and transport facilities. AIChE J. 2008, 54, 2132–2144. [Google Scholar] [CrossRef]
- Zeng, X.-Y.; Zhong, J.-R.; Sun, Y.-F.; Li, S.-L.; Chen, G.-J.; Sun, C.-Y. Investigating the partial structure of the hydrate film formed at the gas/water interface by Raman spectra. Chem. Eng. Sci. 2017, 160, 183–190. [Google Scholar] [CrossRef]
- Liu, C.; Lu, H.; Ye, Y.; Ripmeester, J.A.; Zhang, X. Raman Spectroscopic Observations on the Structural Characteristics and Dissociation Behavior of Methane Hydrate Synthesized in Silica Sands with Various Sizes. Energy Fuels 2008, 22, 3986–3988. [Google Scholar] [CrossRef] [Green Version]
- Zhou, X.; Liang, D.; Liang, S.; Yi, L.; Lin, F. Recovering CH4 from Natural Gas Hydrates with the Injection of CO2–N2 Gas Mixtures. Energy Fuels 2015, 29, 1099–1106. [Google Scholar] [CrossRef]
- Seo, Y.-J.; Park, S.; Kang, H.; Ahn, Y.-H.; Lim, D.; Kim, S.-J.; Lee, J.; Lee, J.Y.; Ahn, T.; Seo, Y.; et al. Isostructural and cage-specific replacement occurring in sII hydrate with external CO2/N2 gas and its implications for natural gas production and CO2 storage. Appl. Energy 2016, 178, 579–586. [Google Scholar] [CrossRef]
- Daraboina, N.; Ripmeester, J.; Walker, V.K.; Englezos, P. Natural Gas Hydrate Formation and Decomposition in the Presence of Kinetic Inhibitors. 3. Structural and Compositional Changes. Energy Fuels 2011, 25, 4398–4404. [Google Scholar] [CrossRef]
- Shin, K.; Park, Y.; Cha, M.; Park, K.-P.; Huh, D.-G.; Lee, J.; Kim, S.-J.; Lee, H. Swapping Phenomena Occurring in Deep-Sea Gas Hydrates. Energy Fuels 2008, 22, 3160–3163. [Google Scholar] [CrossRef]
- Lu, H.; Wang, J.; Liu, C.; Ratcliffe, C.I.; Becker, U.; Kumar, R.; Ripmeester, J. Multiple H2 Occupancy of Cages of Clathrate Hydrate under Mild Conditions. J. Am. Chem. Soc. 2012, 134, 9160–9162. [Google Scholar] [CrossRef] [PubMed]
- Bourry, C.; Chazallon, B.; Charlou, J.L.; Donval, J.P.; Ruffine, L.; Henry, P.; Géli, L.; Çagatay, M.N.; Inan, S.; Moreau, M. Free gas and gas hydrates from the Sea of Marmara, Turkey: Chemical and structural characterization. Chem. Geol. 2009, 264, 197–206. [Google Scholar] [CrossRef] [Green Version]
- Wei, J.; Fang, Y.; Lu, H.; Lu, H.; Lu, J.; Liang, J.; Yang, S. Distribution and characteristics of natural gas hydrates in the Shenhu Sea Area, South China Sea. Mar. Pet. Geol. 2018, 98, 622–628. [Google Scholar] [CrossRef]
- Callaghan, P.T. Principles of Nuclear Magnetic Resonance Microscopy; Oxford University Press on Demand: Oxford, UK, 1993. [Google Scholar]
- Bovey, F.A.; Mirau, P.A.; Gutowsky, H. Nuclear Magnetic Resonance Spectroscopy; Elsevier: Amsterdam, The Netherlands, 1988. [Google Scholar]
- Andrew, E.R.; Bradbury, A.W.; Eades, R.G. Nuclear Magnetic Resonance Spectra from a Crystal rotated at High Speed. Nature 1958, 182, 1659. [Google Scholar] [CrossRef]
- Schaefer, J.; Stejskal, E.O. Carbon-13 nuclear magnetic resonance of polymers spinning at the magic angle. J. Am. Chem. Soc. 1976, 98, 1031–1032. [Google Scholar] [CrossRef]
- Hartmann, S.R.; Hahn, E.L. Nuclear Double Resonance in the Rotating Frame. Phys. Rev. 1962, 128, 2042–2053. [Google Scholar] [CrossRef]
- Metz, G.; Ziliox, M.; Smith, S.O. Towards quantitative CP-MAS NMR. Solid state nuclear magnetic resonance. Solid State Nucl. Magn. Reson. 1996, 7, 155–160. [Google Scholar] [CrossRef]
- Johnson, R.L.; Schmidt-Rohr, K. Quantitative solid-state 13C NMR with signal enhancement by multiple cross polarization. J. Magn. Reson. 2014, 239, 44–49. [Google Scholar] [CrossRef] [PubMed]
- Ripmeester, J.A.; Ratcliffe, C.I. On the contributions of NMR spectroscopy to clathrate science. J. Struct. Chem. 1999, 40, 654–662. [Google Scholar] [CrossRef]
- Liu, Y.; Ojamäe, L. 13C Chemical Shift in Natural Gas Hydrates from First-Principles Solid-State NMR Calculations. J. Phys. Chem. C 2016, 120, 1130–1136. [Google Scholar] [CrossRef] [Green Version]
- Kida, M.; Sakagami, H.; Takahashi, N.; Nagao, J. Chemical Shift Changes and Line Narrowing in 13C NMR Spectra of Hydrocarbon Clathrate Hydrates. J. Phys. Chem. A 2013, 117, 4108–4114. [Google Scholar] [CrossRef]
- Lee, J.-W.; Lee, J.; Kang, S.-P. 13C NMR spectroscopies and formation kinetics of gas hydrates in the presence of monoethylene glycol as an inhibitor. Chem. Eng. Sci. 2013, 104, 755–759. [Google Scholar] [CrossRef]
- Lu, H.; Seo, Y.-T.; Lee, J.-W.; Moudrakovski, I.; Ripmeester, J.A.; Chapman, N.R.; Coffin, R.B.; Gardner, G.; Pohlman, J. Complex gas hydrate from the Cascadia margin. Nature 2007, 445, 303–306. [Google Scholar] [CrossRef]
- Kida, M.; Hori, A.; Sakagami, H.; Takeya, S.; Kamata, Y.; Takahashi, N.; Ebinuma, T.; Narita, H. 13C Chemical Shifts of Propane Molecules Encaged in Structure II Clathrate Hydrate. J. Phys. Chem. A 2011, 115, 643–647. [Google Scholar] [CrossRef]
- Subramanian, S.; Kini, R.; Dec, S.; Sloan, E. Evidence of structure II hydrate formation from methane+ethane mixtures. Chem. Eng. Sci. 2000, 55, 1981–1999. [Google Scholar] [CrossRef]
- Lee, S.; Seo, Y. Experimental Measurement and Thermodynamic Modeling of the Mixed CH4 + C3H8 Clathrate Hydrate Equilibria in Silica Gel Pores: Effects of Pore Size and Salinity. Langmuir 2010, 26, 9742–9748. [Google Scholar] [CrossRef]
- Ohno, H.; Moudrakovski, I.; Gordienko, R.; Ripmeester, J.; Walker, V.K. Structures of Hydrocarbon Hydrates during Formation with and without Inhibitors. J. Phys. Chem. A 2012, 116, 1337–1343. [Google Scholar] [CrossRef] [PubMed]
- Siuda, P.; Sadlej, J. Nuclear Magnetic Resonance Parameters for Methane Molecule Trapped in Clathrate Hydrates. J. Phys. Chem. A 2011, 115, 612–619. [Google Scholar] [CrossRef]
- Lee, J.-W.; Lu, H.; Moudrakovski, I.; Ratcliffe, C.I.; Ohmura, R.; Alavi, S.; Ripmeester, J.A. 13C NMR Studies of Hydrocarbon Guests in Synthetic Structure H Gas Hydrates: Experiment and Computation. J. Phys. Chem. A 2011, 115, 1650–1657. [Google Scholar] [CrossRef] [Green Version]
- Seo, Y.-T.; Lee, H. Structure and guest distribution of the mixed carbon dioxide and nitrogen hydrates as revealed by x-ray diffraction and 13C NMR spectroscopy. J. Phys. Chem. B 2004, 108, 530–534. [Google Scholar] [CrossRef]
- Seo, Y.; Kang, S.-P.; Jang, W. Structure and Composition Analysis of Natural Gas Hydrates: 13C NMR Spectroscopic and Gas Uptake Measurements of Mixed Gas Hydrates. J. Phys. Chem. A 2009, 113, 9641–9649. [Google Scholar] [CrossRef] [PubMed]
- Dec, S.F. Clathrate Hydrate Formation: Dependence on Aqueous Hydration Number. J. Phys. Chem. C 2009, 113, 12355–12361. [Google Scholar] [CrossRef]
- Lee, S.; Cha, I.; Seo, Y. Phase Behavior and13C NMR Spectroscopic Analysis of the Mixed Methane + Ethane + Propane Hydrates in Mesoporous Silica Gels. J. Phys. Chem. B 2010, 114, 15079–15084. [Google Scholar] [CrossRef]
- Kida, M.; Sakagami, H.; Watanabe, M.; Jin, Y.; Takahashi, N.; Nagao, J. Structural properties of methane and butane mixed-gas hydrates. Chem. Eng. Sci. 2016, 140, 10–15. [Google Scholar] [CrossRef]
- Takeya, S.; Uchida, T.; Kamata, Y.; Nagao, J.; Kida, M.; Minami, H.; Sakagami, H.; Hachikubo, A.; Takahashi, N.; Shoji, H.; et al. Lattice Expansion of Clathrate Hydrates of Methane Mixtures and Natural Gas. Angew. Chem. Int. Ed. 2005, 44, 6928–6931. [Google Scholar] [CrossRef]
- Kim, D.-Y.; Uhm, T.-W.; Lee, H.; Lee, Y.-J.; Ryu, B.-J.; Kim, J.-H. Compositional and structural identification of natural gas hydrates collected at site 1249 on ocean drilling program leg 204. Korean J. Chem. Eng. 2005, 22, 569–572. [Google Scholar] [CrossRef]
- Kida, M.; Suzuki, K.; Kawamura, T.; Oyama, H.; Nagao, J.; Ebinuma, T.; Narita, H.; Suzuki, H.; Sakagami, H.; Takahashi, N. Characteristics of Natural Gas Hydrates Occurring in Pore-Spaces of Marine Sediments Collected from the Eastern Nankai Trough, off Japan. Energy Fuels 2009, 23, 5580–5586. [Google Scholar] [CrossRef]
- Fleyfel, F.; Song, K.Y.; Kook, A.; Martin, R.; Kobayashi, R. Interpretation of carbon-13 NMR of methane/propane hydrates in the metastable/nonequilibrium region. J. Phys. Chem. 1993, 97, 6722–6725. [Google Scholar] [CrossRef]
- Fleyfel, F.; Song, K.Y.; Kook, A.; Martin, R.; Kobayashi, R. 13C NMR of Hydrate Precursors in Metastable Regions. Ann. N. Y. Acad. Sci. 1994, 715, 212–224. [Google Scholar] [CrossRef]
- Seo, Y.; Kang, S.-P.; Lee, J.; Seol, J.; Lee, H. Hydrate equilibrium data of the CH4+ C3H8 gas mixture and simulated natural gas in the presence of 2, 2-Dimethylbutane and methylcyclohexane. J. Chem. Eng. Data 2011, 56, 2316–2321. [Google Scholar] [CrossRef]
- Kini, R.A.; Dec, S.F.; Sloan, E.D. Methane + Propane Structure II Hydrate Formation Kinetics. J. Phys. Chem. A 2004, 108, 9550–9556. [Google Scholar] [CrossRef]
- Dec, S.F.; Bowler, K.E.; Stadterman, L.L.; Koh, C.A.; Sloan, E.D. NMR study of methane+ ethane structure I hydrate de-composition. J. Phys. Chem. A 2007, 111, 4297–4303. [Google Scholar] [CrossRef] [PubMed]
- Kida, M.; Jin, Y.; Takahashi, N.; Nagao, J.; Narita, H. Dissociation behavior of methane− ethane mixed gas hydrate coex-isting structures I and II. J. Phys. Chem. A 2010, 114, 9456–9461. [Google Scholar] [CrossRef]
- Fucke, K.; Steed, J.W. X-ray and neutron diffraction in the study of organic crystalline hydrates. Water 2010, 2, 333–350. [Google Scholar] [CrossRef] [Green Version]
- Evans, J.S.O.; Evans, I.R. Beyond classical applications of powder diffraction. Chem. Soc. Rev. 2004, 33, 539–547. [Google Scholar] [CrossRef]
- Bernal, J.D.; Fowler, R.H. A Theory of water and ionic solution, with particular reference to hydrogen and hydroxyl ions. J. Chem. Phys. 1933, 1, 515–548. [Google Scholar] [CrossRef]
- Kirchner, M.T.; Boese, R.; Billups, W.E.; Norman, L.R. Gas hydrate single-crystal structure analyses. J. Am. Chem. Soc. 2004, 126, 9407–9412. [Google Scholar] [CrossRef]
- Udachin, K.A.; Ratcliffe, C.I.; Ripmeester, J.A. Structure, Composition, and Thermal Expansion of CO2 Hydrate from Single Crystal X-ray Diffraction Measurements. J. Phys. Chem. B 2001, 105, 4200–4204. [Google Scholar] [CrossRef]
- Machida, S.-I.; Hirai, H.; Kawamura, T.; Yamamoto, Y.; Yagi, T. Structural changes of filled ice Ic structure for hydrogen hydrate under high pressure. J. Chem. Phys. 2008, 129, 224505. [Google Scholar] [CrossRef]
- Hirai, H.; Kadobayashi, H.; Hirao, N.; Ohishi, Y.; Ohtake, M.; Yamamoto, Y.; Nakano, S. Time-resolved x-ray diffraction and Raman studies of the phase transition mechanisms of methane hydrate. J. Chem. Phys. 2015, 142, 024707. [Google Scholar] [CrossRef]
- Lee, J.-W.; Kim, D.-Y.; Lee, H. Phase behavior and structure transition of the mixed methane and nitrogen hydrates. Korean J. Chem. Eng. 2006, 23, 299–302. [Google Scholar] [CrossRef] [Green Version]
- Cai, Z.; Lu, H.; Zou, R.; Han, S.; Wang, Z. Structural and thermodynamic characteristics of sH 2,2-dimethylbutane-methane deuterohydrate. J. Chem. Thermodyn. 2014, 77, 82–86. [Google Scholar] [CrossRef]
- Takeya, S.; Hachikubo, A. Distortion of the Host Water Cages of Structure I Gas Hydrates: Structural Analysis of C2H4 Hydrate by Powder X-ray Diffraction. J. Phys. Chem. C 2021, 125, 28150–28156. [Google Scholar] [CrossRef]
- Koh, C.A.; Wisbey, R.P.; Wu, X.; Westacott, R.; Soper, A. Water ordering around methane during hydrate formation. J. Chem. Phys. 2000, 113, 6390–6397. [Google Scholar] [CrossRef]
- Hoshikawa, A.; Igawa, N.; Yamauchi, H.; Ishii, Y. Observation of hydrogen in deuterated methane hydrate by maximum entropy method with neutron powder diffraction. J. Chem. Phys. 2006, 125, 034505. [Google Scholar] [CrossRef]
- Igawa, N.; Taguchi, T.; Hoshikawa, A.; Fukazawa, H.; Yamauchi, H.; Utsumi, W.; Ishii, Y. CO2 motion in carbon dioxide deuterohydrate determined by applying maximum entropy method to neutron powder diffraction data. J. Phys. Chem. Solids 2010, 71, 899–905. [Google Scholar] [CrossRef]
- Zhao, Y.; Zhang, J.; Xu, H.; Lokshin, K.A.; He, D.; Qian, J.; Pantea, C.; Daemen, L.L.; Vogel, S.C.; Ding, Y.; et al. High-pressure neutron diffraction studies at LANSCE. Appl. Phys. A 2010, 99, 585–599. [Google Scholar] [CrossRef]
- Halpern, Y.; Thieu, V.; Henning, R.W.; Wang, X.; Schultz, A.J. Time-Resolved in Situ Neutron Diffraction Studies of Gas Hydrate: Transformation of Structure II (sII) to Structure I (sI). J. Am. Chem. Soc. 2001, 123, 12826–12831. [Google Scholar] [CrossRef]
- Manakov, A.; Voronin, V.; Kurnosov, A.; Teplykh, A.; Komarov, V.; Dyadin, Y. Structural Investigations of Argon Hydrates at Pressures up to 10 kbar. J. Incl. Phenom. Macrocycl. Chem. 2004, 48, 11–18. [Google Scholar] [CrossRef]
- Cha, M.; Shin, K.; Lee, H. Structure identification of binary 1-propanol+methane hydrate using neutron powder diffraction. Korean J. Chem. Eng. 2017, 34, 2514–2518. [Google Scholar] [CrossRef]
- Igawa, N.; Taguchi, T.; Hoshikawa, A.; Yamauchi, H.; Birumachi, A.; Ishii, Y. Neutron diffraction study on the Xe behavior in clathrate hydrate analyzed by Rietveld/maximum entropy method. IOP Conf. Ser. Mater. Sci. Eng. 2011, 18, 022021. [Google Scholar] [CrossRef]
- Tulk, C.A.; Klug, D.D.; Dos Santos, A.; Karotis, G.; Guthrie, M.; Molaison, J.J.; Pradhan, N. Cage occupancies in the high pressure structure H methane hydrate: A neutron diffraction study. J. Chem. Phys. 2012, 136, 54502. [Google Scholar] [CrossRef] [PubMed]
- Hoshikawa, A.; Matsukawa, T.; Ishigaki, T. Evaluation of filling rate of methane in methane-propane hydrate by neutron powder diffraction. Phys. B Condens. Matter 2018, 551, 274–277. [Google Scholar] [CrossRef]
- Platteeuw, J.; Van Der Waals, J. Thermodynamic properties of gas hydrates. Mol. Phys. 1958, 1, 91–96. [Google Scholar] [CrossRef]
- McKoy, V.; Sinanoglu, O. Theory of Dissociation Pressures of Some Gas Hydrates. J. Chem. Phys. 1963, 38, 2946–2956. [Google Scholar] [CrossRef] [Green Version]
- Nagata, I.; Kobayashi, R. Calculation of Dissociation Pressures of Gas Hydrates Using Kihara Model. Ind. Eng. Chem. Fundam. 1966, 5, 344–348. [Google Scholar] [CrossRef]
- Parrish, W.R.; Prausnitz, J.M. Dissociation Pressures of Gas Hydrates Formed by Gas Mixtures. Ind. Eng. Chem. Process Des. Dev. 1972, 11, 26–35. [Google Scholar] [CrossRef]
- Holder, G.; Malekar, S.T.; Sloan, E.D. Determination of hydrate thermodynamic reference properties from experimental hydrate composition data. Ind. Eng. Chem. Fundam. 1984, 23, 123–126. [Google Scholar] [CrossRef]
- Sun, R.; Duan, Z. Prediction of CH4 and CO2 hydrate phase equilibrium and cage occupancy from ab initio intermolecular potentials. Geochim. Cosmochim. Acta 2005, 69, 4411–4424. [Google Scholar] [CrossRef]
- Velaga, S.; Anderson, B.J. Phase Equilibrium and Cage Occupancy Calculations of CO2 Hydrates Using an ab Initio Inter-Molecular Potential; West Virginia University: Morgantown, WV, USA, 2009. [Google Scholar]
- Qin, J.; Kuhs, W.F. Quantitative analysis of gas hydrates using Raman spectroscopy. AIChE J. 2013, 59, 2155–2167. [Google Scholar] [CrossRef]
- Tulk, C.; Machida, S.; Klug, D.D.; Lu, H.; Guthrie, M.; Molaison, J.J. The structure of CO2 hydrate between 0.7 and 1.0 GPa. J. Chem. Phys. 2014, 141, 174503. [Google Scholar] [CrossRef] [PubMed]

Figure 2.
Cage-size effect on Raman shift of C−H stretching vibration of methane [28,29,30,31,32,33,34,35,36,37,38,39,40,41,42,43,44,45,46,47,48,49,50,51,52].


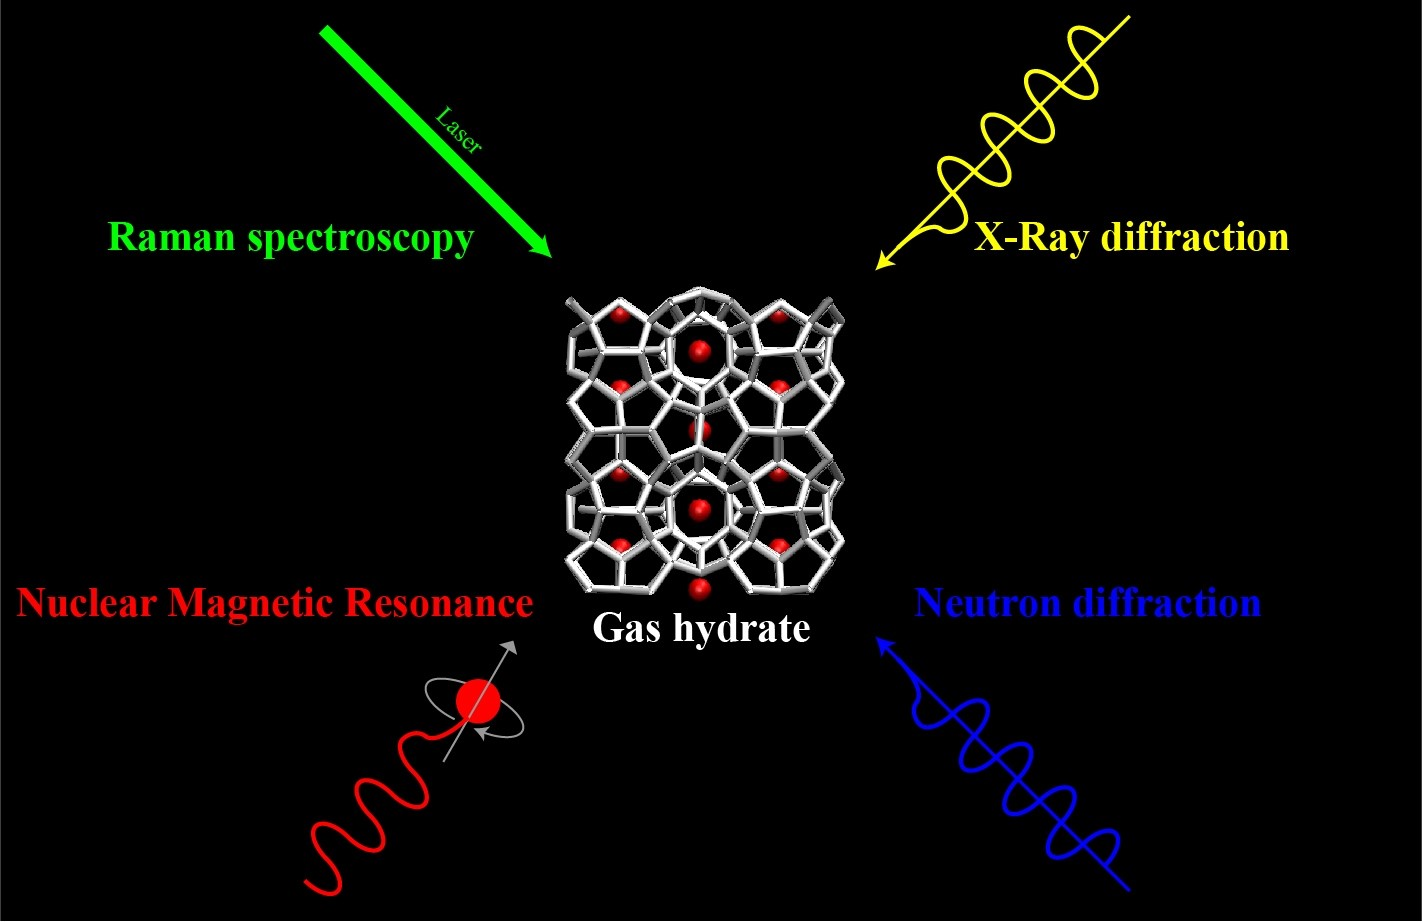
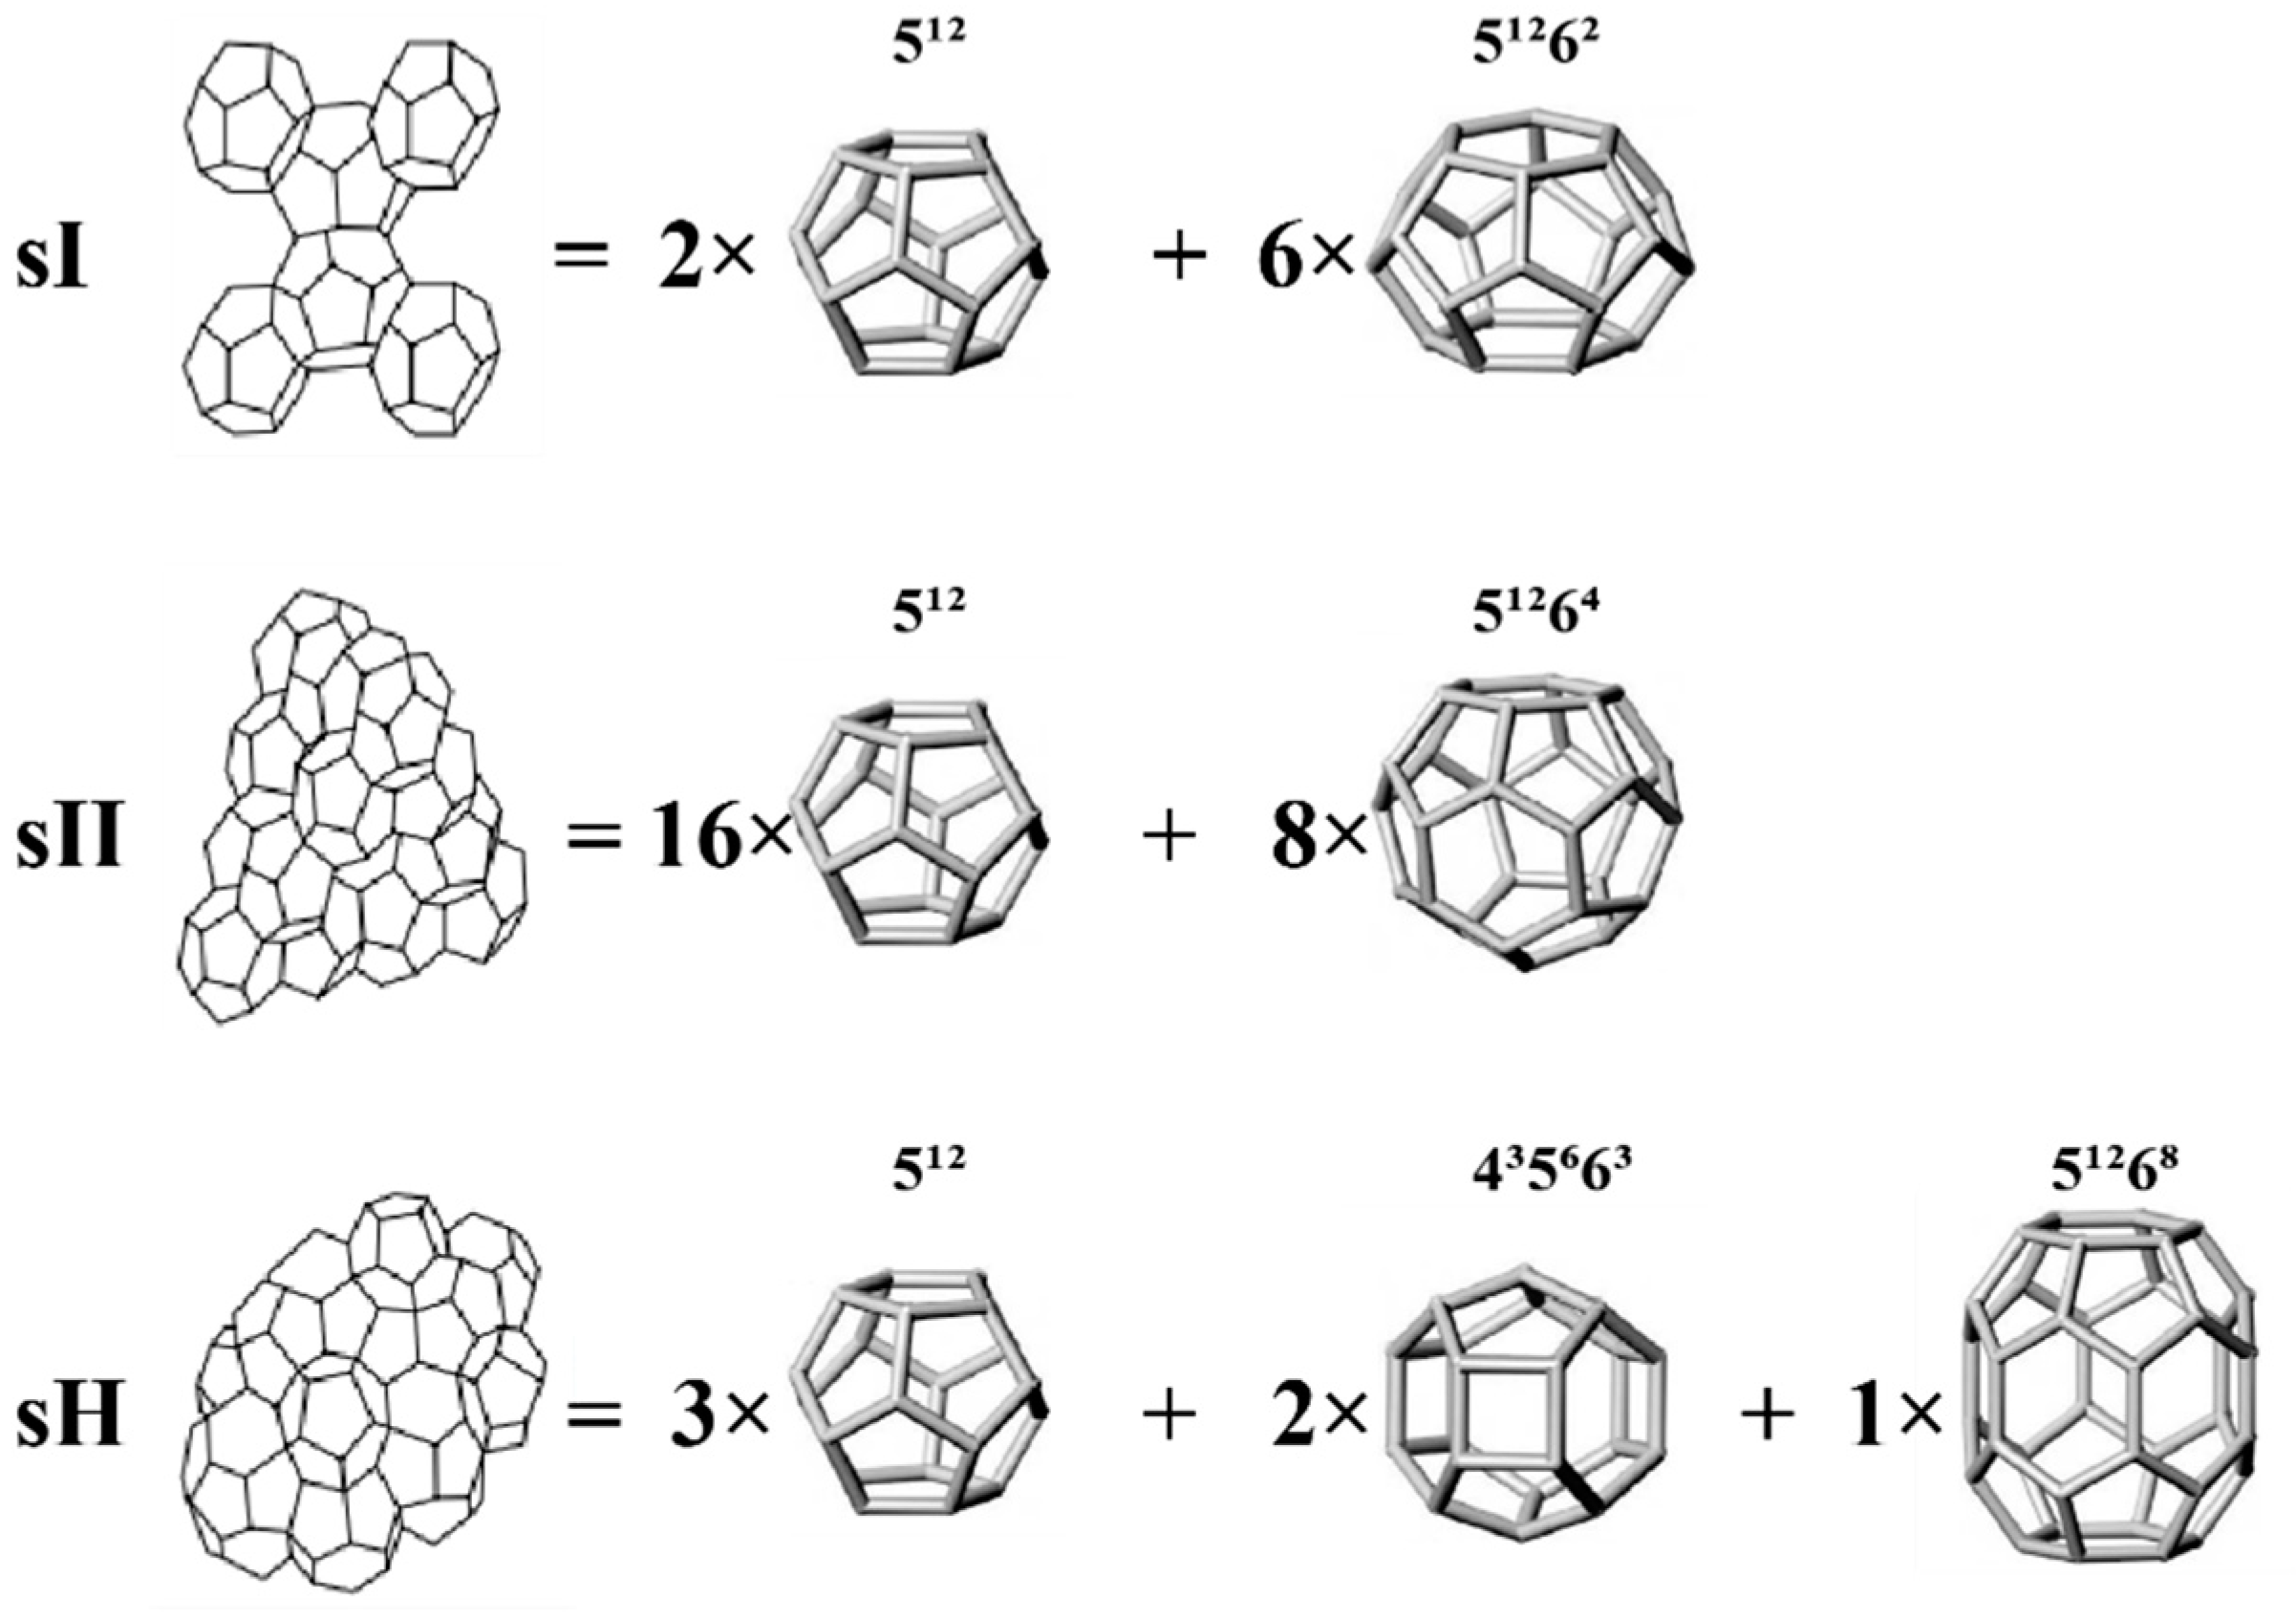
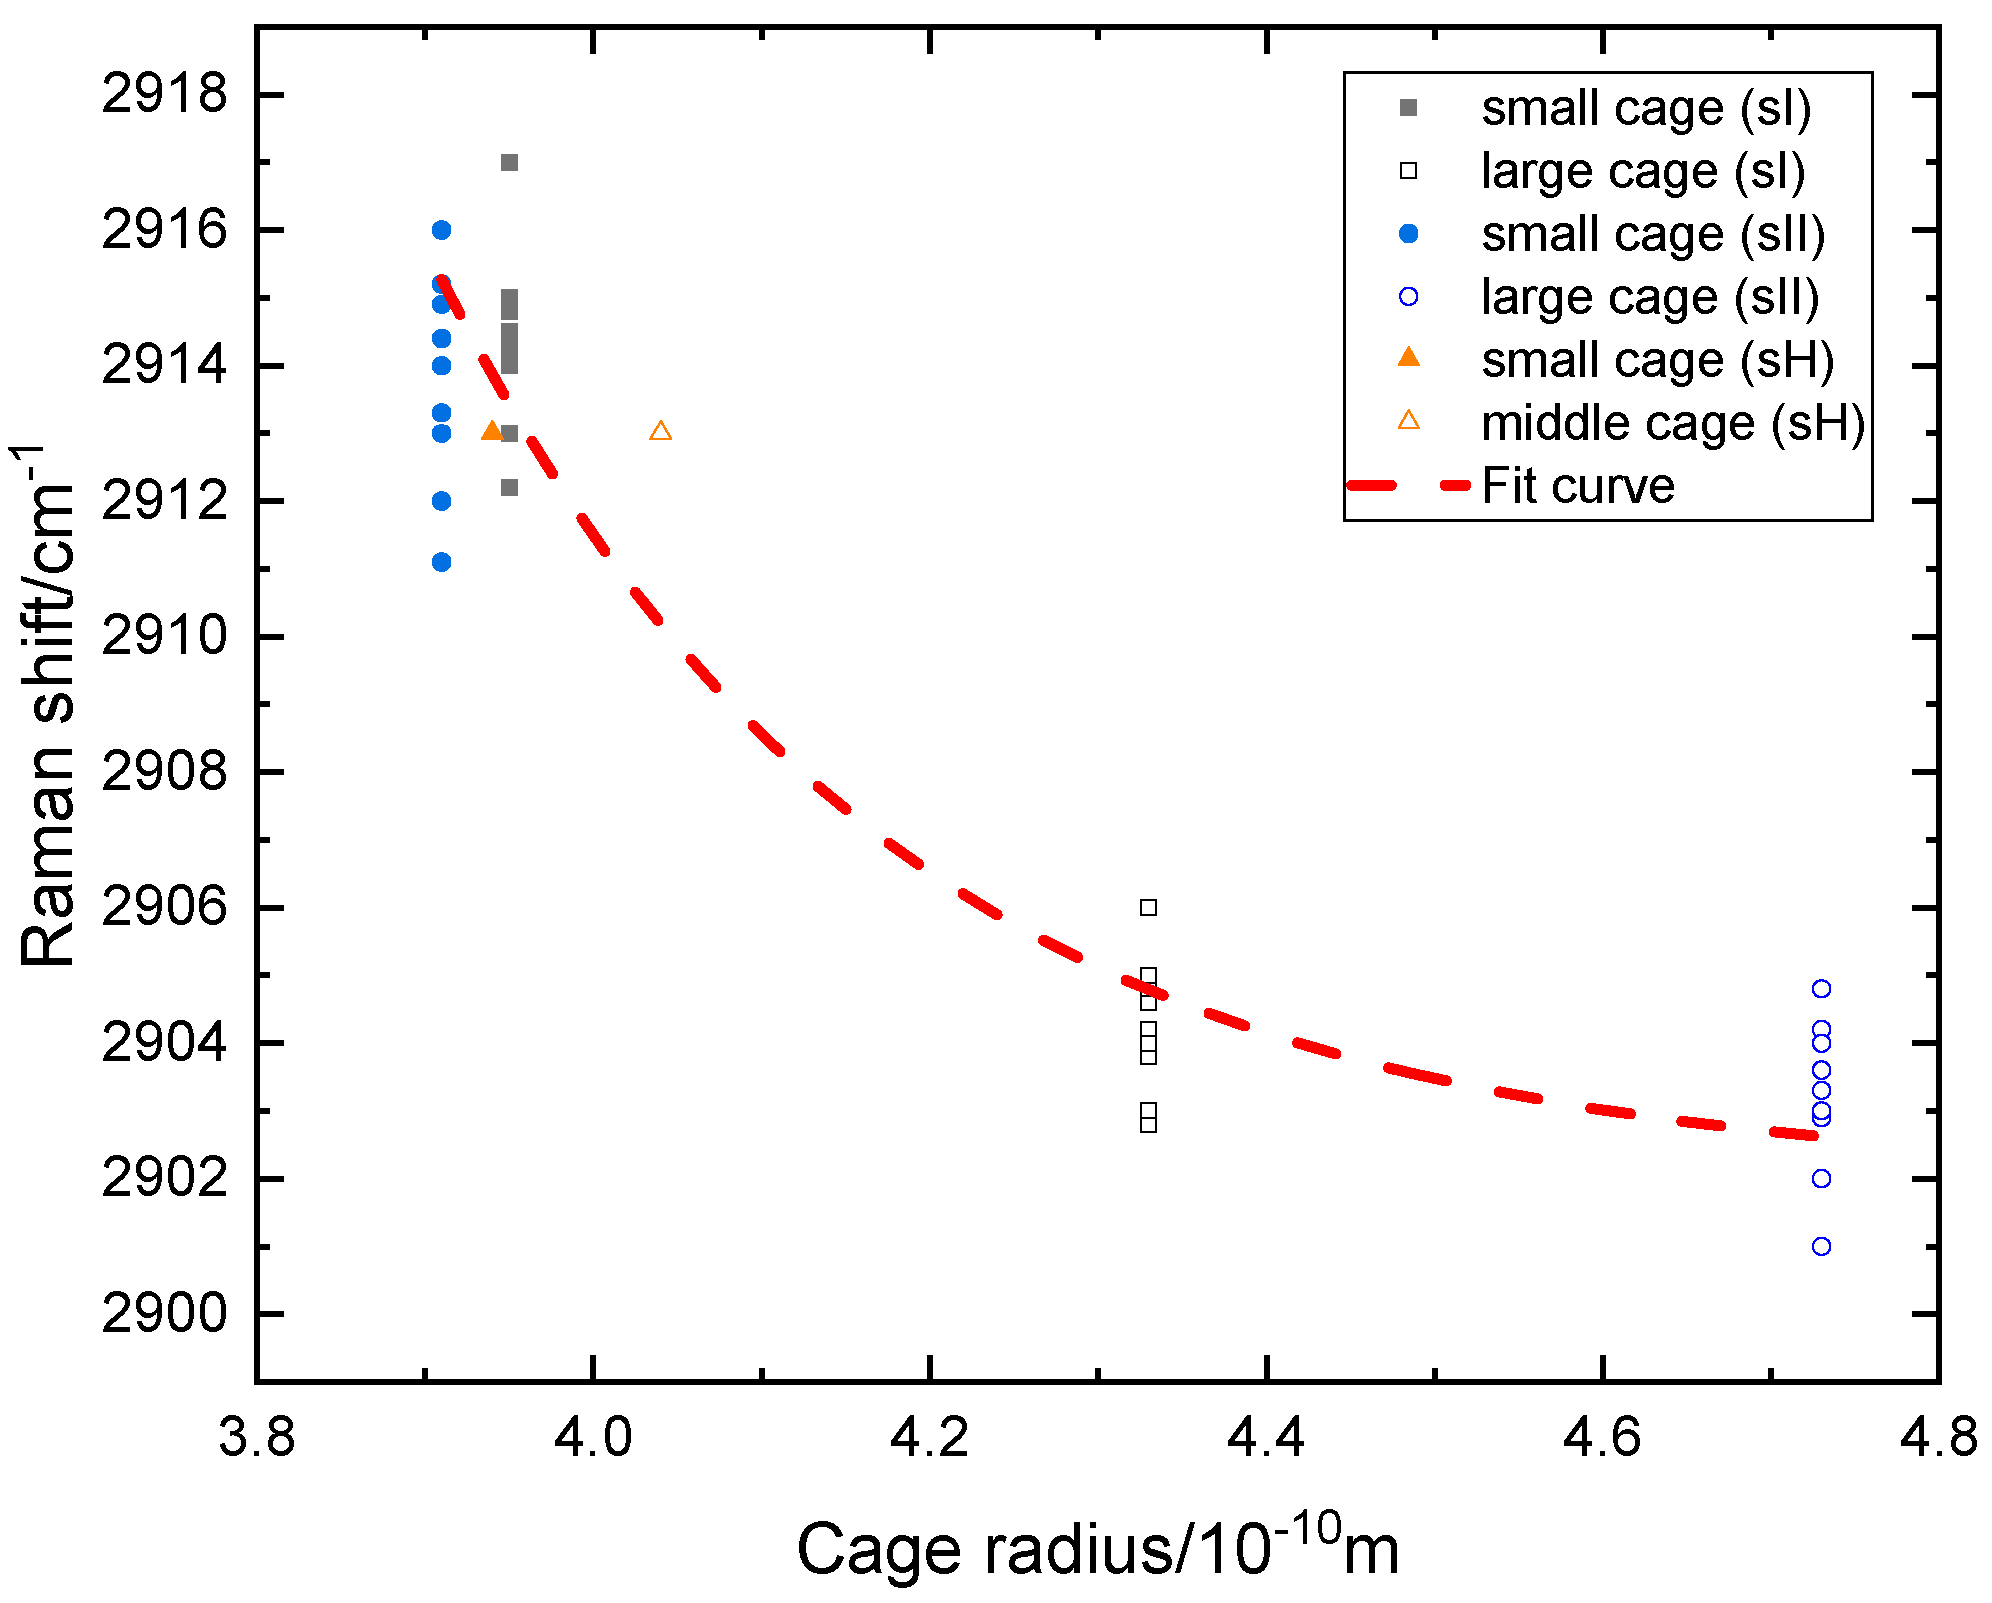
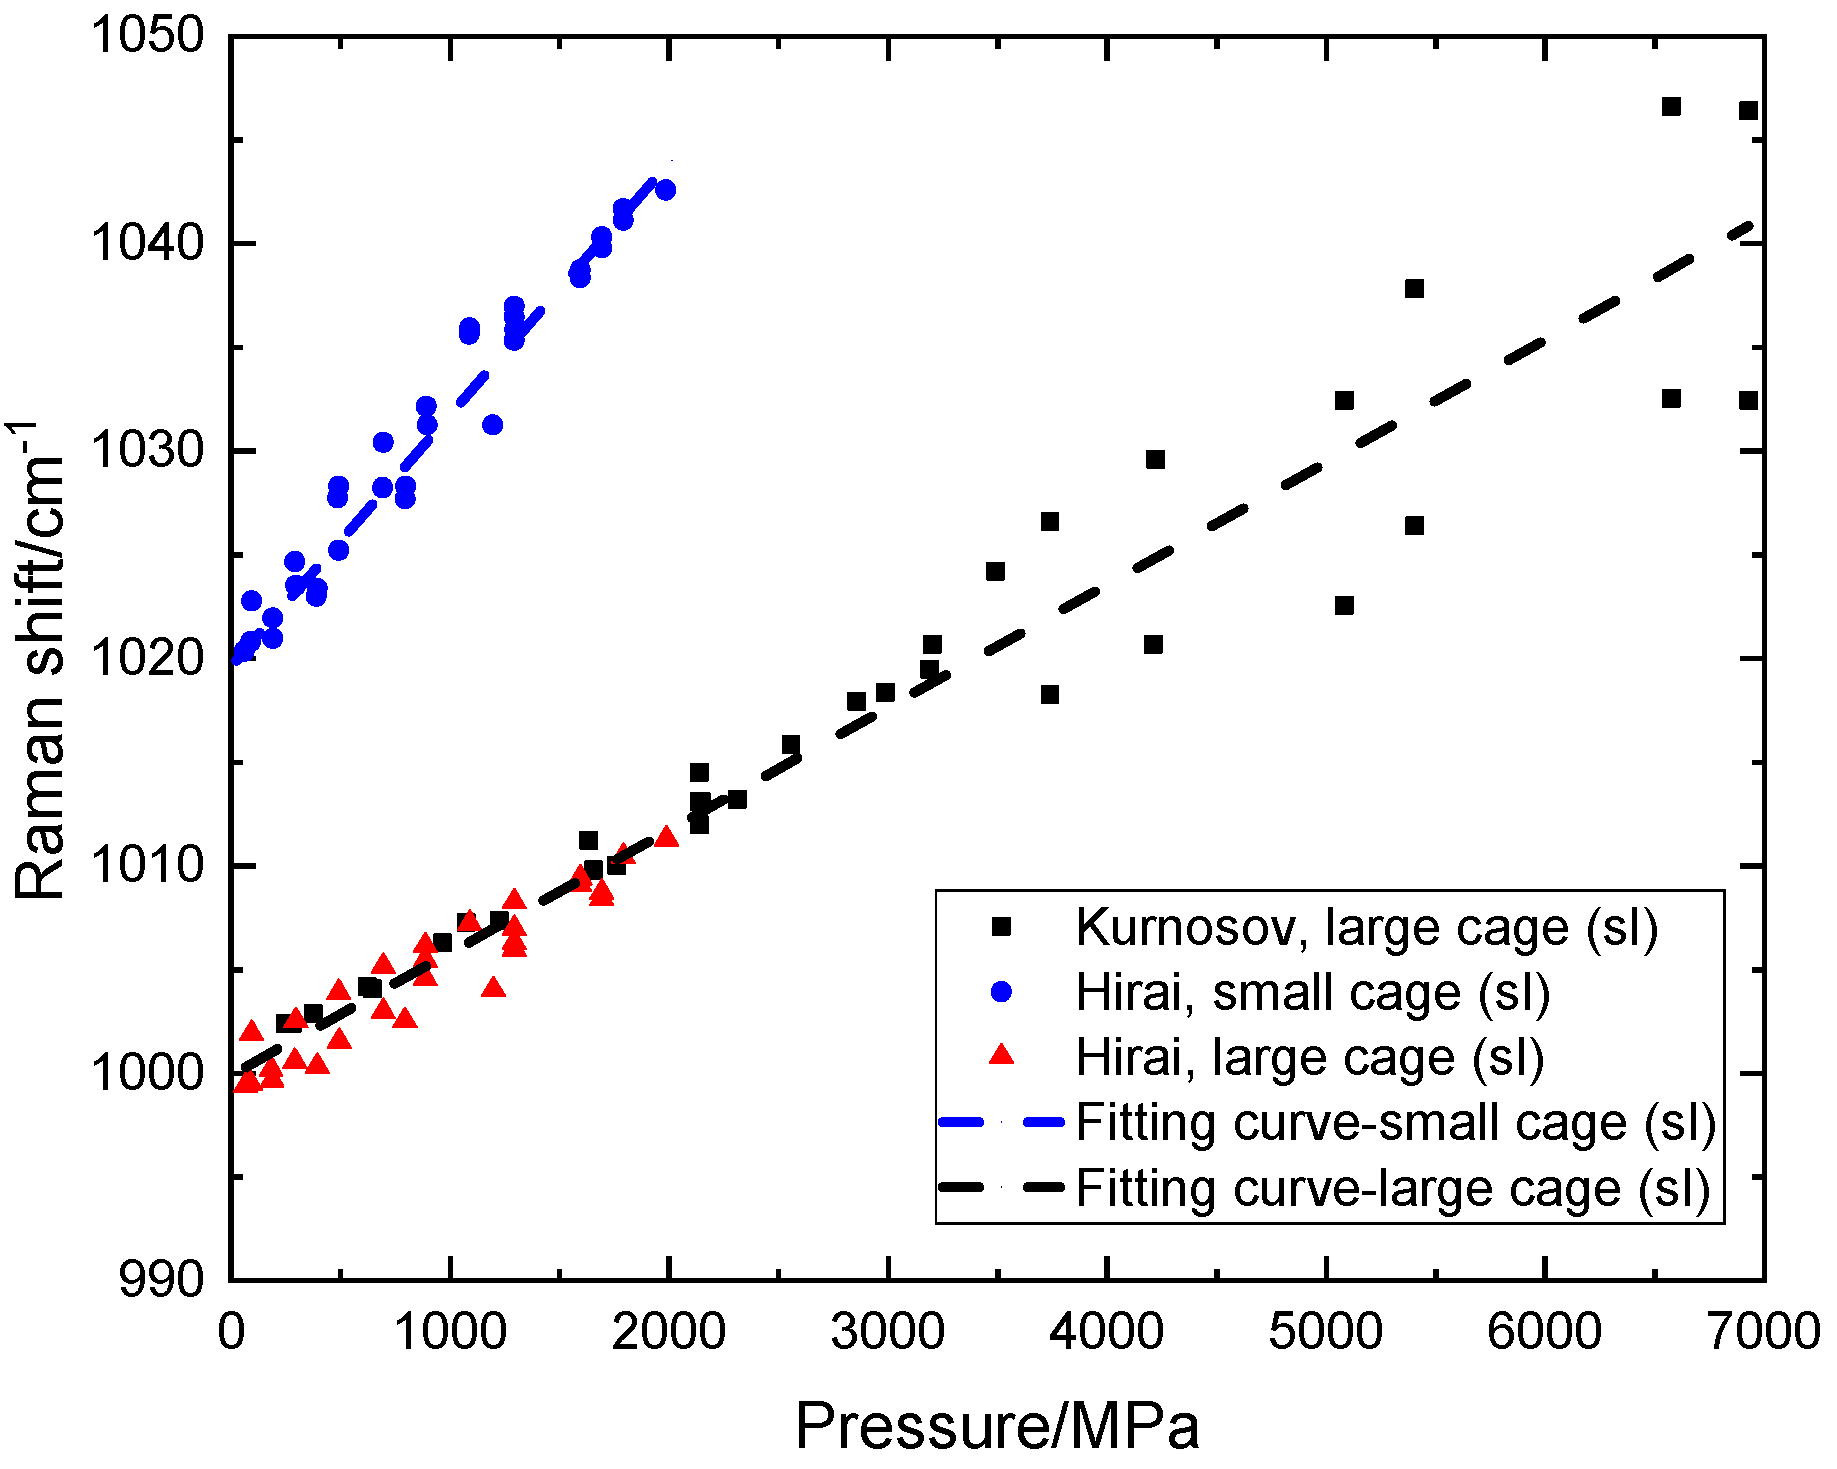
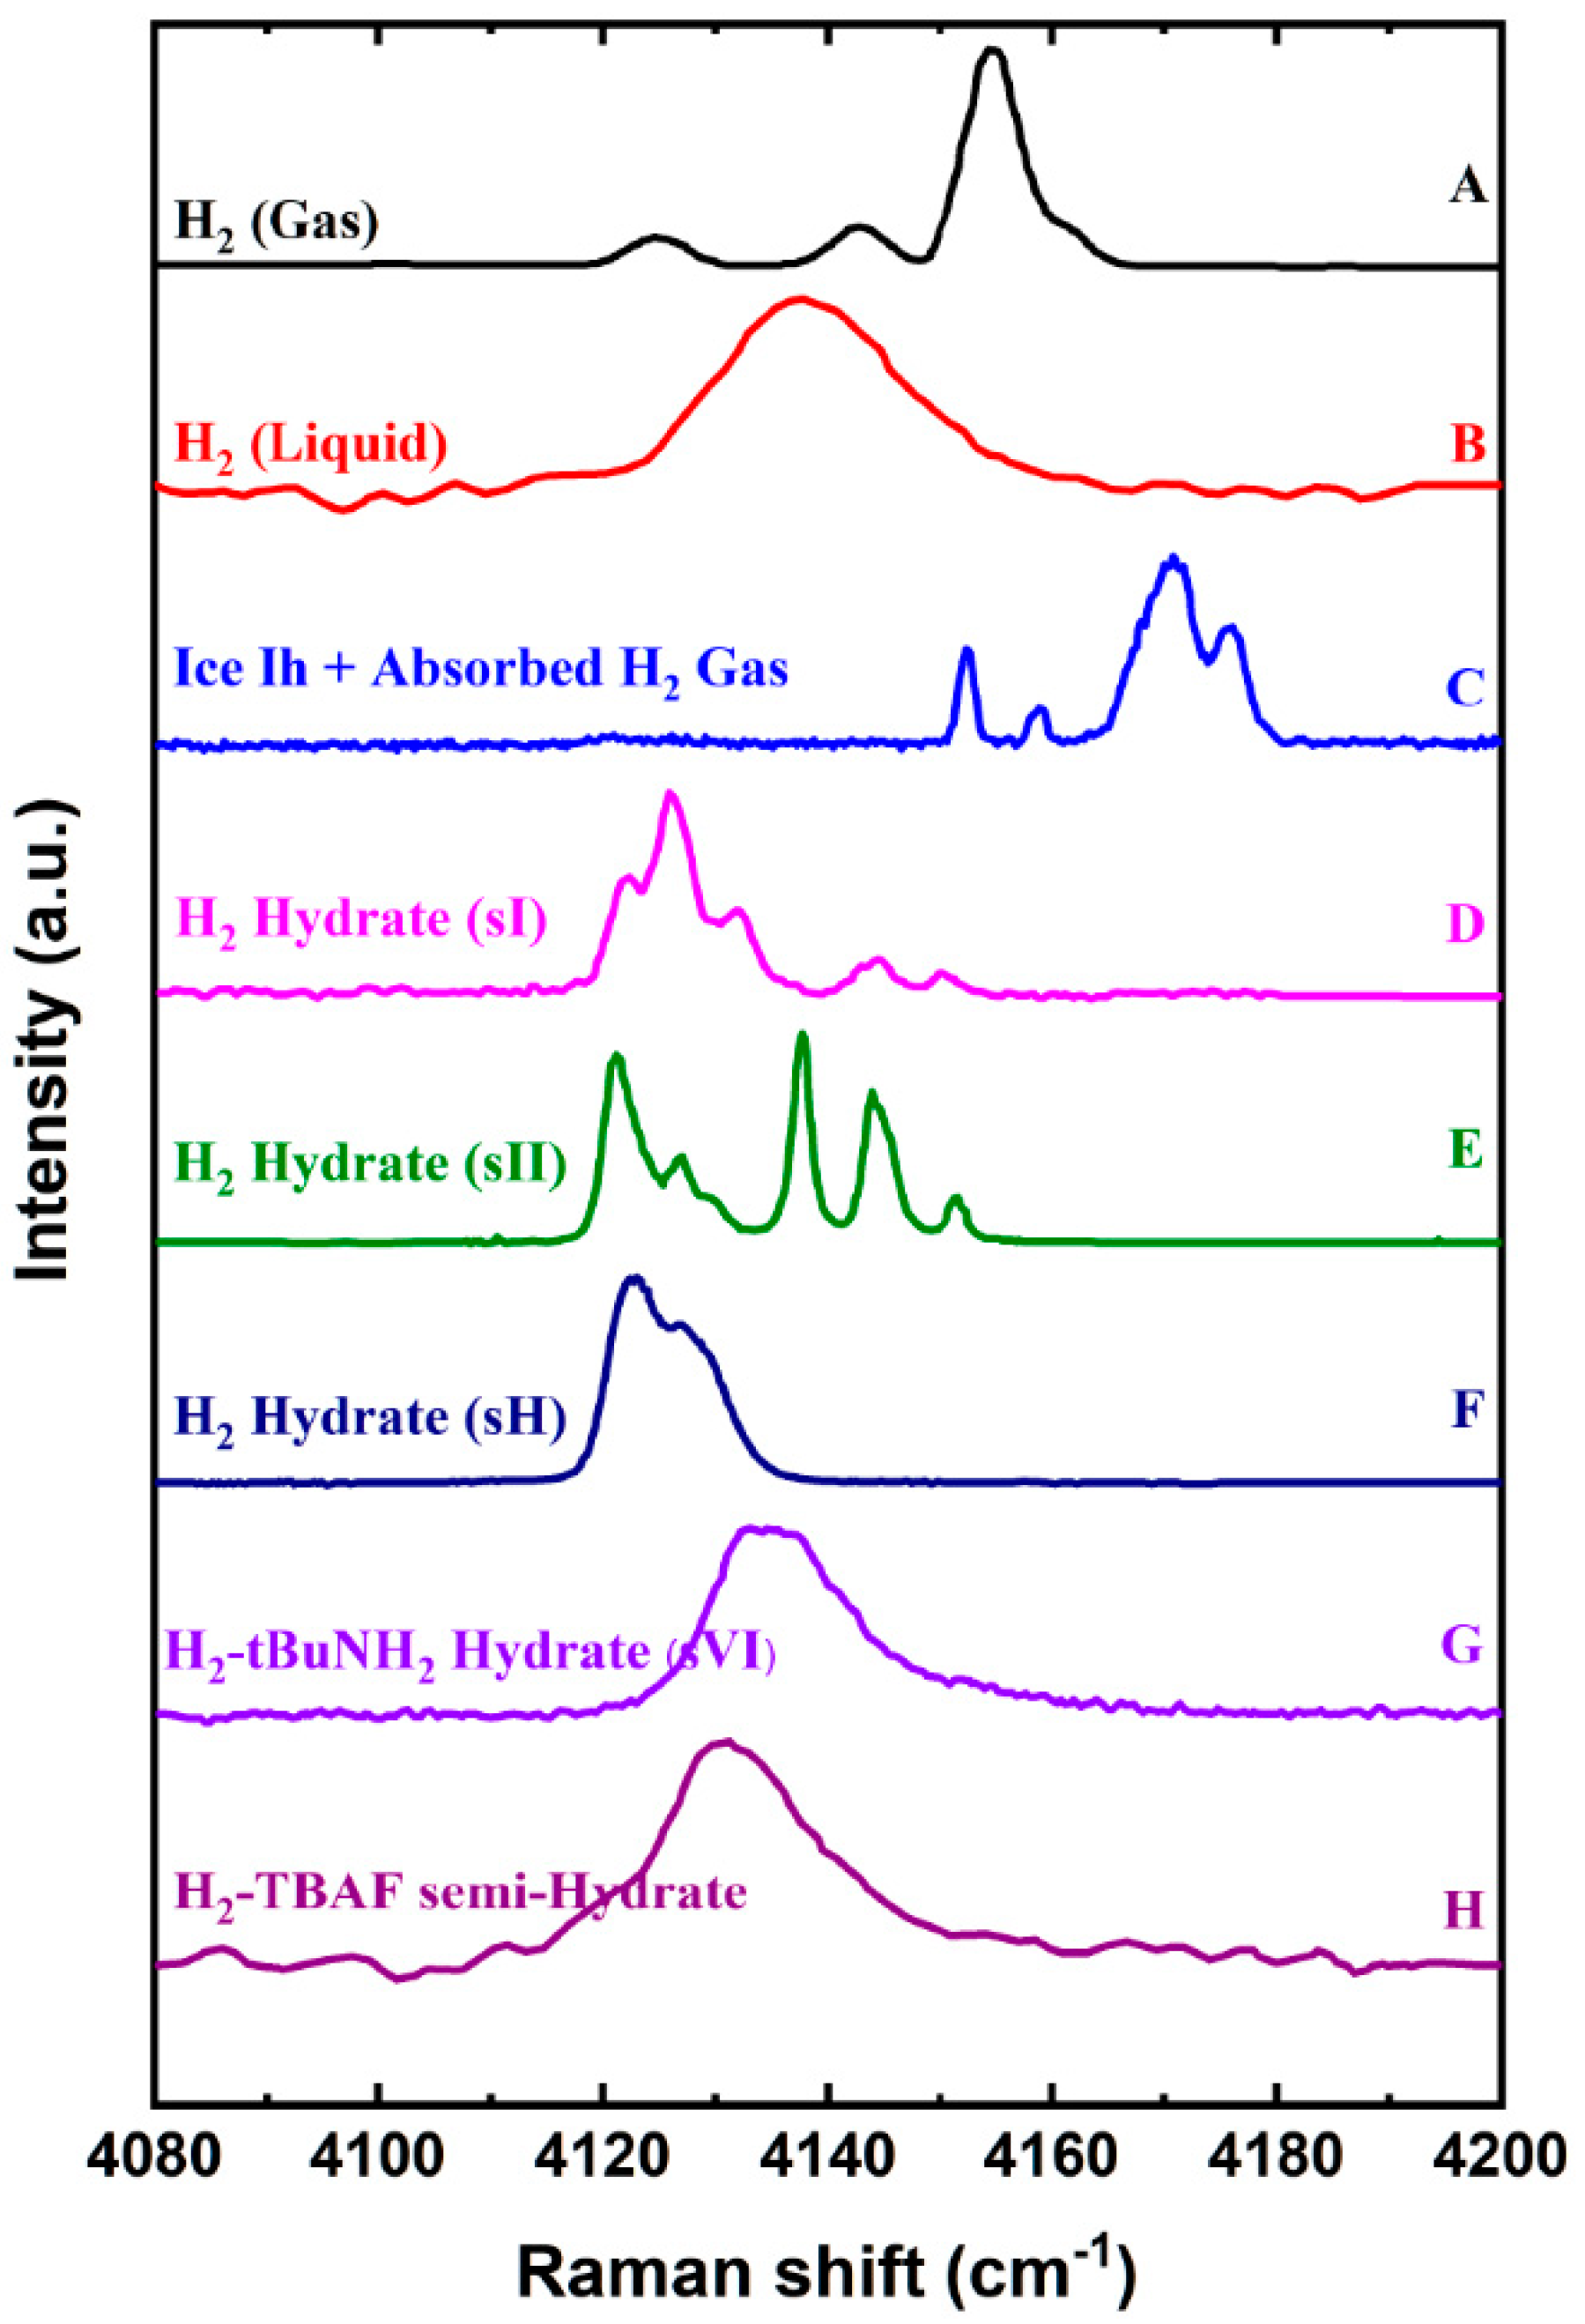
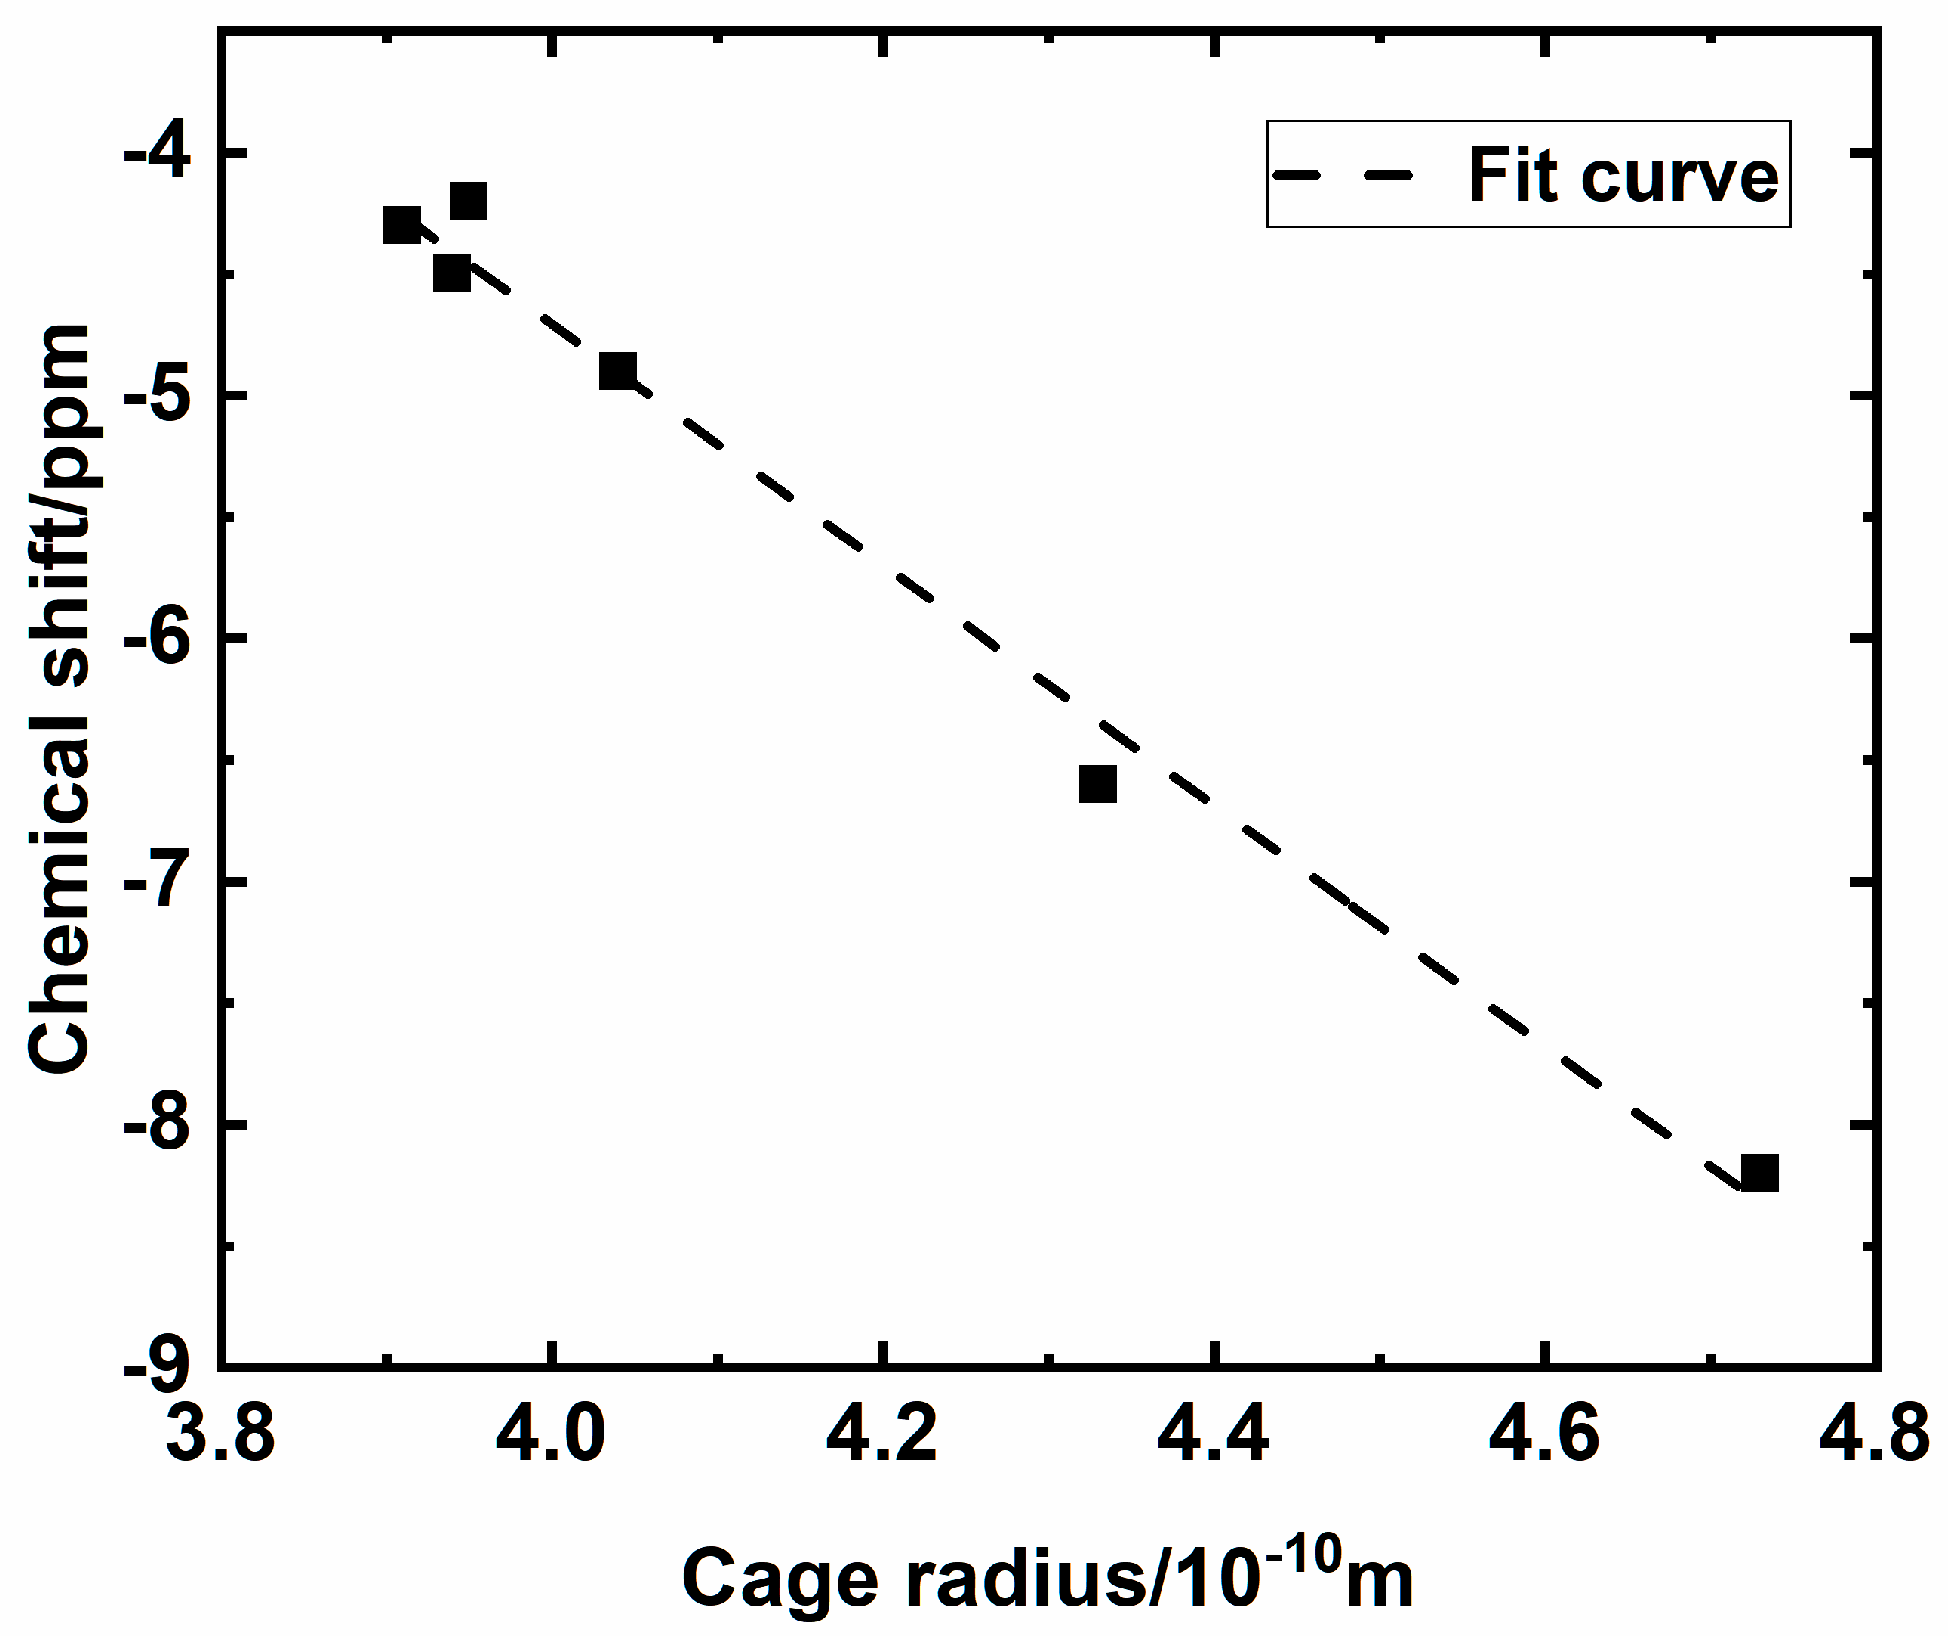
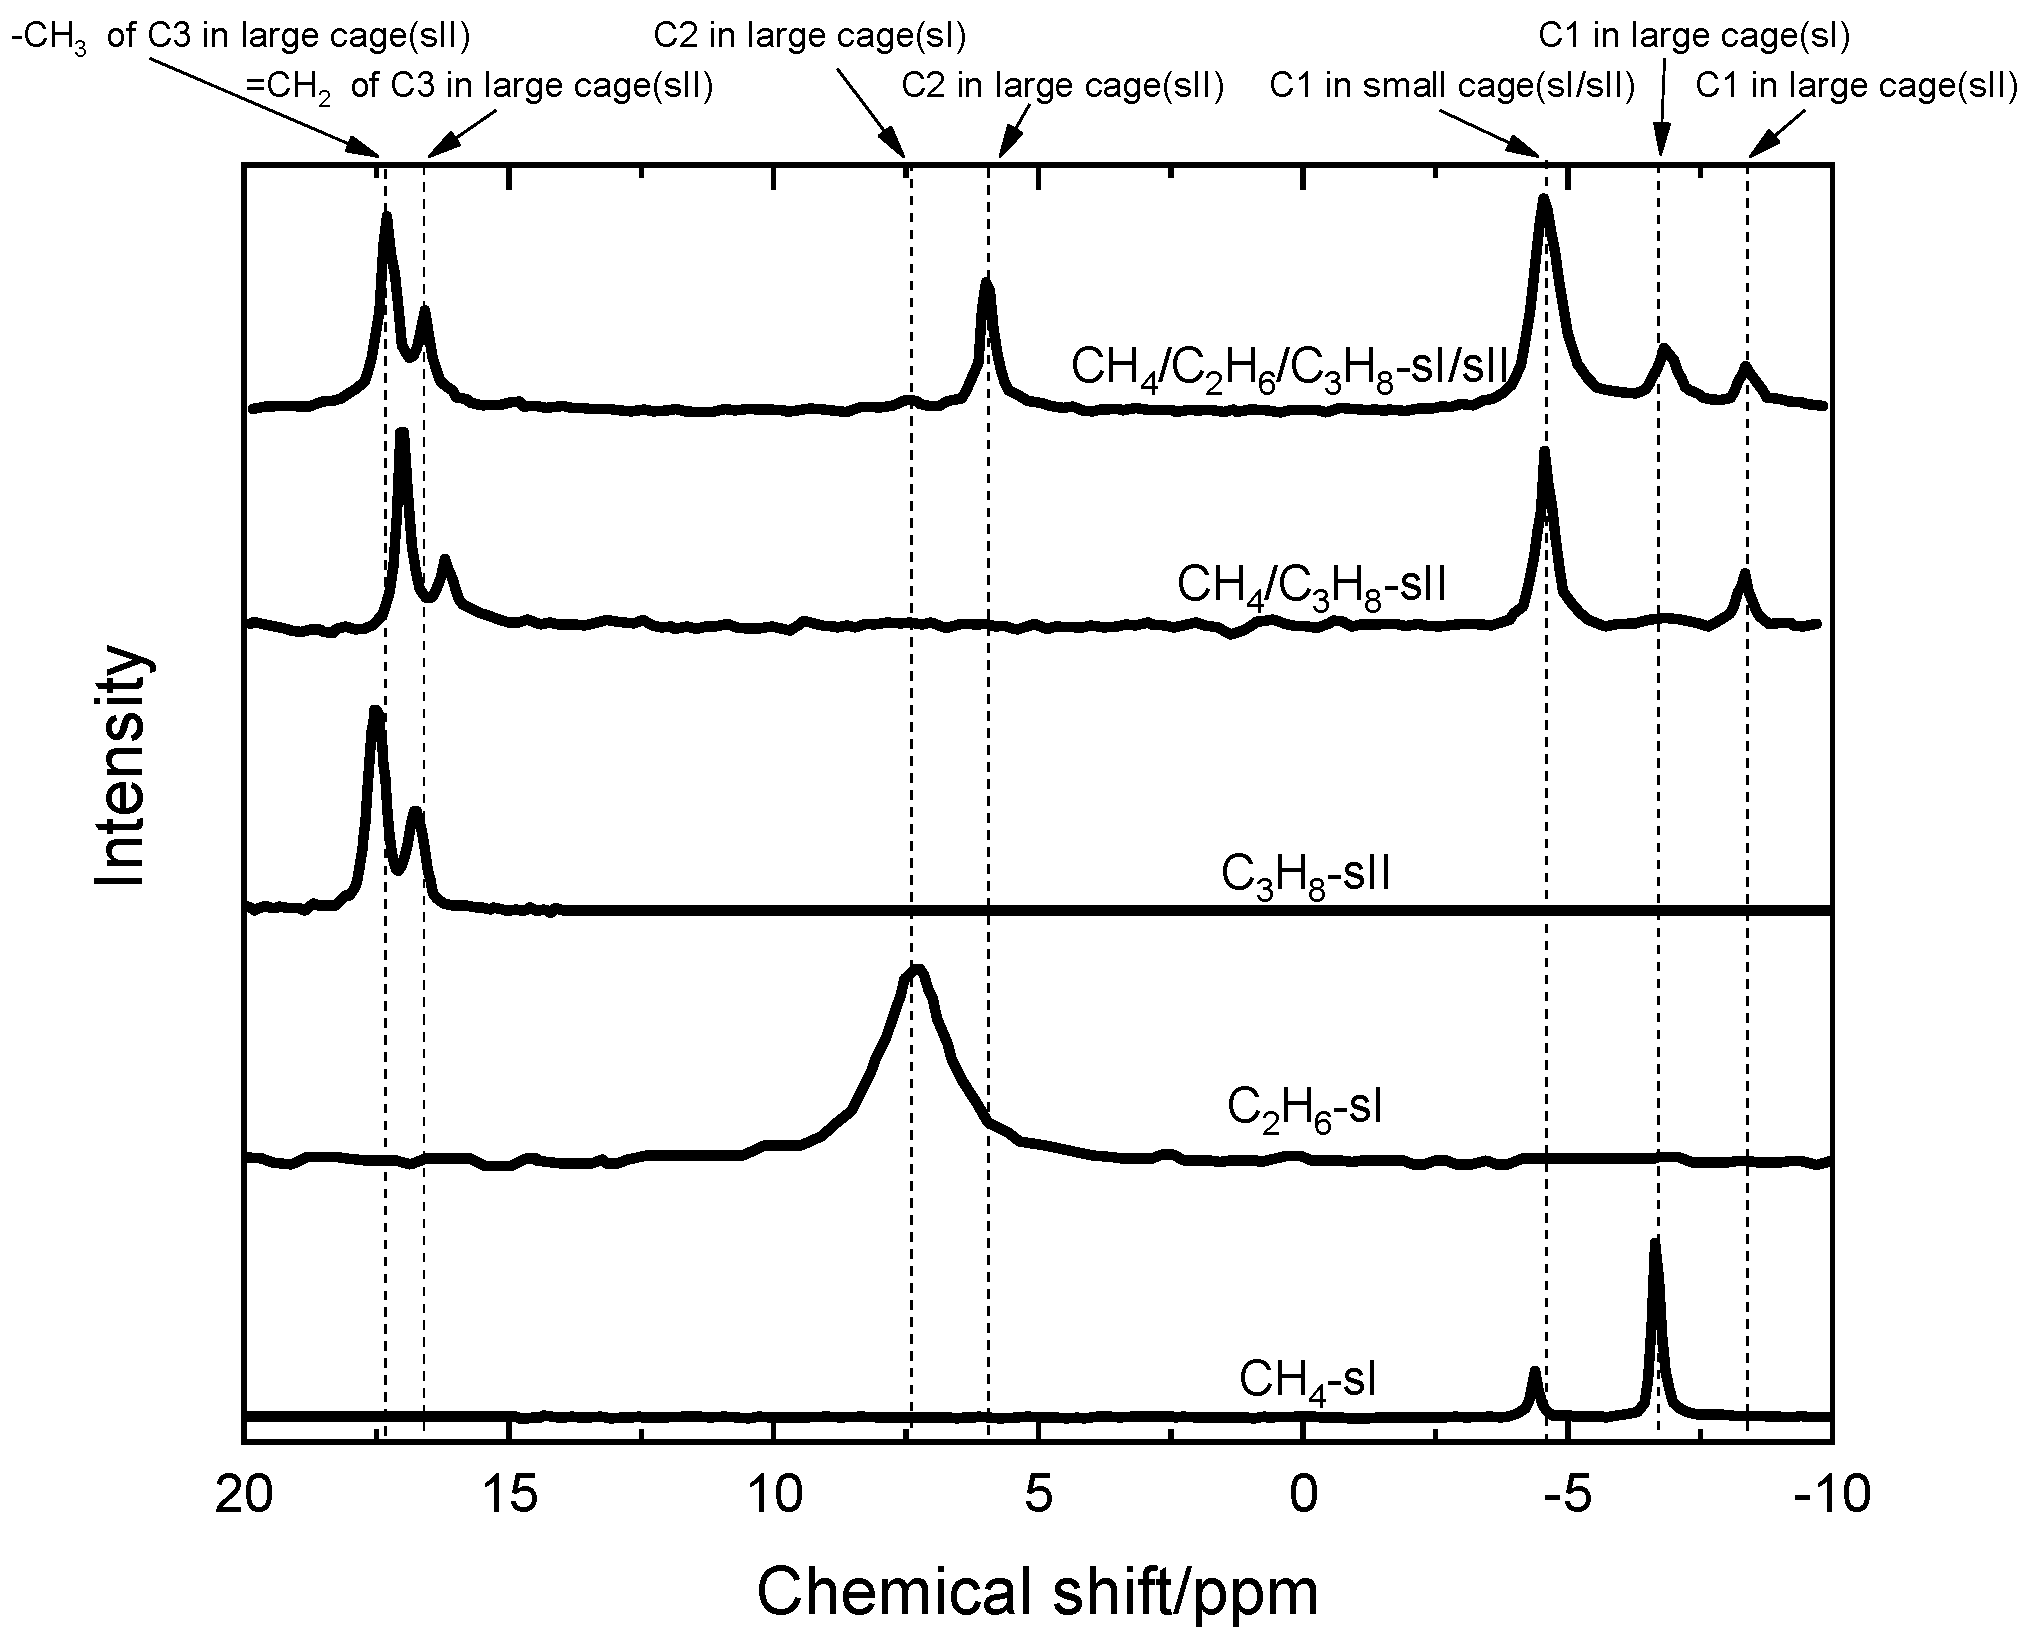
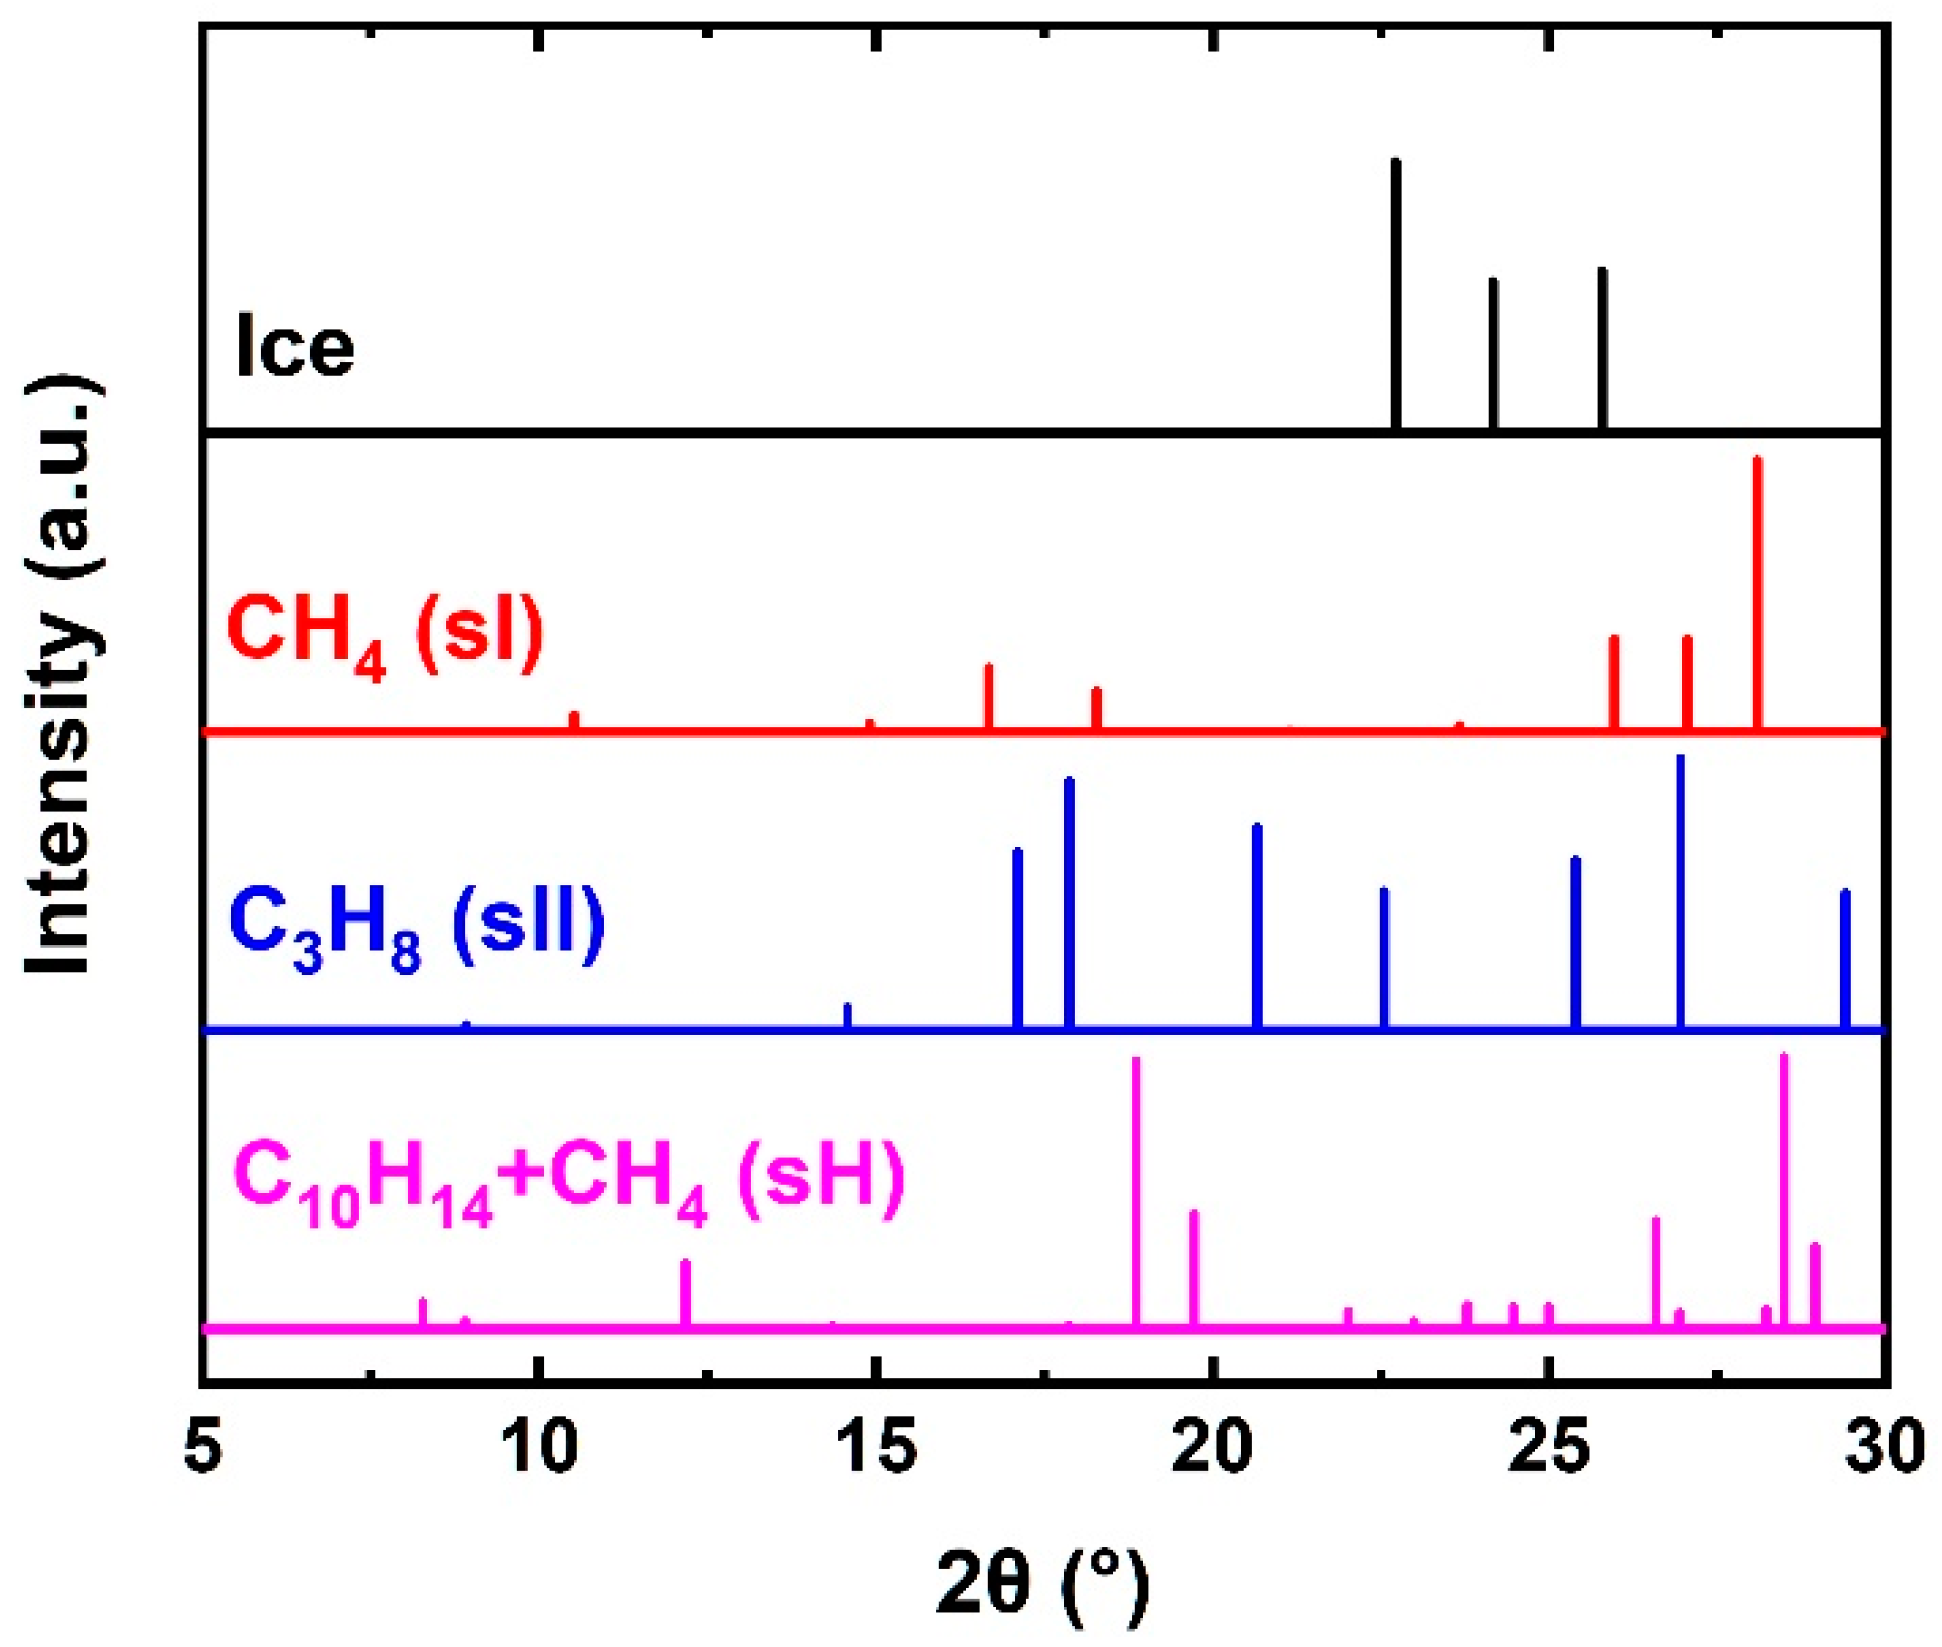
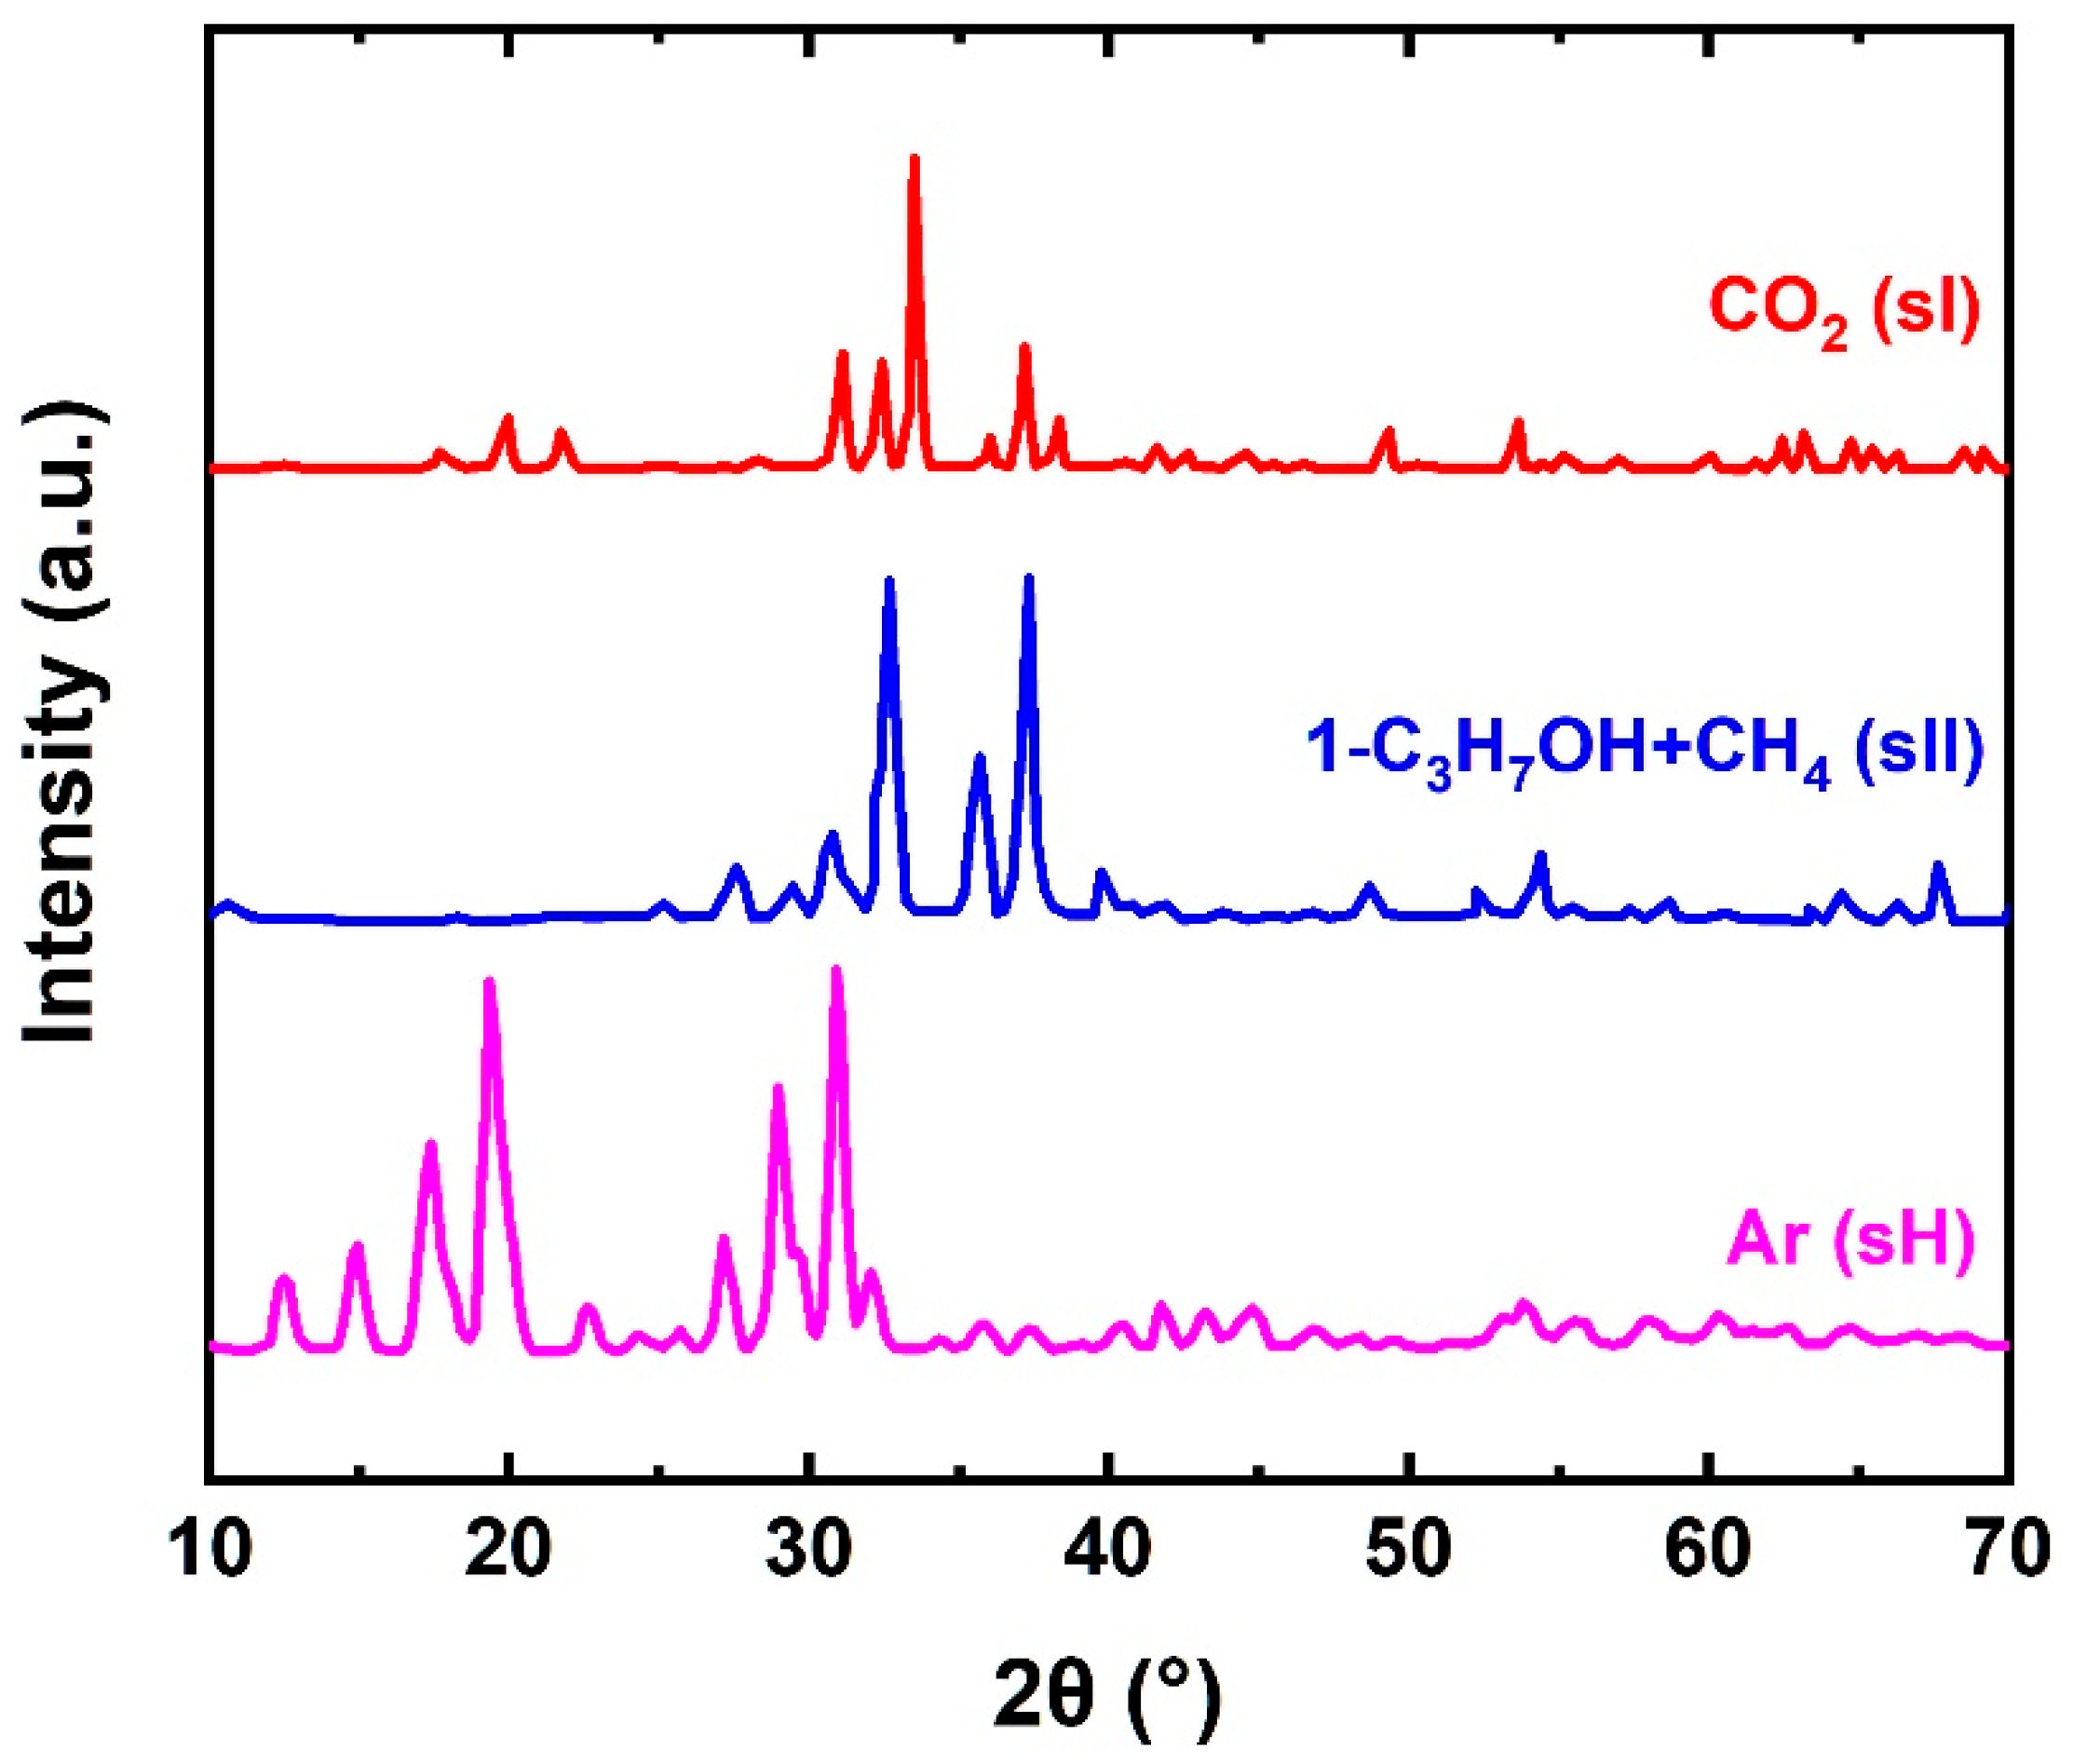
Table 1.
Average cage radius of gas hydrates.
| Hydrate Structure | Cage | Average Radius/Å [5] | Guest Molecules [19,53,54,55,56,57,58] |
|---|---|---|---|
| sI | small cage (512) | 3.95 | CH4, CO2, H2S |
| large cage (51262) | 4.33 | CH4, CO2, H2S, C2H6 | |
| sII | small cage (512) | 3.91 | CH4, H2 |
| large cage (51264) | 4.73 | CH4, C3H8, THF, H2 | |
| sH | small cage (512) | 3.94 | CH4, CO2 |
| middle cage (435663) | 4.04 | CH4, CO2 | |
| large cage (51268) | 5.79 | iso-C5H12, neo-C6H14 |
Table 3.
13C-NMR chemical shifts of hydrocarbon molecules for common hydrates (Unit: ppm) [104,105,107,111].
| Guest Molecule | sI | sII | sH | ||||
|---|---|---|---|---|---|---|---|
| Small Cage | Large Cage | Small Cage | Large Cage | Small Cage | Middle Cage | Large Cage | |
| methane | −4.2 | −6.6 | −4.3 | −8.2 | −4.5 | −4.9 | – |
| ethane | – | 7.7 | – | 6.0 | – | – | – |
| propane | – | – | – | 16.7, 17.5 | – | – | – |
| iso-butane | – | – | – | 26.3, 23.5 | – | – | – |
| n-butane | – | – | – | 13.7, 25.8 | – | – | – |
| iso-pentane | – | – | – | – | – | – | 11.6, 22.4, 30.7, 32.4 |
| n-pentane | – | – | – | – | – | – | 13.7, 21.6, 34.5 |
| 2-methylpentane | – | – | – | – | – | – | 12.9, 19.4, 22.9, 25.1 |
| 3-methylpentane | – | – | – | – | – | – | 11.8, 17.6, 30.2, 36.9 |
| 2,2-dimethylbutane | – | – | – | – | – | – | 8.5, 29.2, 30.2, 36.9 |
| 2,3-dimethylbutane | – | – | – | – | – | – | 19.1, 34.0 |
| n-hexane | – | – | – | – | – | – | 13.2, 20.8, 28.1 |
| methylcyclopentane | – | – | – | – | – | – | 20.3, 25.6, 35.4, 35.9 |
| cyclohexane | – | – | – | 27.7 | – | – | – |
| methylcyclohexane | – | – | – | 0.53 | – | – | 23.6, 27.3, 33.7, 36.1 |
Table 4.
Comparison on cage occupancies obtained with PXRD refinement and other methods [16].
Table 4.
Comparison on cage occupancies obtained with PXRD refinement and other methods [16].
| Hydrate | Structure | Cage | Guest Molecule | Cage Occupancy from PXRD Refinement/% | Cage Occupancy from Single Crystal XRD/% | Cage Occupancy from 13C-NMR/% |
|---|---|---|---|---|---|---|
| CO2 | sI | small cage | CO2 | 69 | 71 | – |
| large cage | CO2 | 99 | 100 | – | ||
| C2H6 | sI | small cage | C2H6 | 12 | 5.8 | – |
| large cage | C2H6 | 98 | 100 | – | ||
| C3H8 | sII | small cage | C3H8 | 0 | 0 | – |
| large cage | C3H8 | 92 | 100 | – | ||
| MCH+CH4 | sH | small cage | CH4 | 100 | 82 | – |
| middle cage | CH4 | 91 | 81 | – | ||
| large cage | MCH | 100 | 100 | – | ||
| NH+CH4 | sH | small cage | CH4 | 79 | – | 86 |
| middle cage | CH4 | 88 | – | 87 | ||
| large cage | NH | 100 | – | 100 | ||
| TBME+CH4 | sH | small cage | CH4 | 77 | – | 75 |
| middle cage | CH4 | 85 | – | 89 | ||
| large cage | TBME | 98 | – | 100 |
Publisher’s Note: MDPI stays neutral with regard to jurisdictional claims in published maps and institutional affiliations. |
© 2022 by the authors. Licensee MDPI, Basel, Switzerland. This article is an open access article distributed under the terms and conditions of the Creative Commons Attribution (CC BY) license (https://creativecommons.org/licenses/by/4.0/).
Share and Cite
MDPI and ACS Style
Cai, W.; Huang, X.; Lu, H. Instrumental Methods for Cage Occupancy Estimation of Gas Hydrate. Energies 2022, 15, 485. https://doi.org/10.3390/en15020485
AMA Style
Cai W, Huang X, Lu H. Instrumental Methods for Cage Occupancy Estimation of Gas Hydrate. Energies. 2022; 15(2):485. https://doi.org/10.3390/en15020485
Chicago/Turabian StyleCai, Wenjiu, Xin Huang, and Hailong Lu. 2022. "Instrumental Methods for Cage Occupancy Estimation of Gas Hydrate" Energies 15, no. 2: 485. https://doi.org/10.3390/en15020485
Note that from the first issue of 2016, this journal uses article numbers instead of page numbers. See further details here.