
Modeling and Sizing of a Fuel Cell—Lithium-Ion Battery Direct Hybridization System for Aeronautical Application
by
 , , ,
, , ,
Thomas Jarry
1,* ,
,
Fabien Lacressonnière
1,
Amine Jaafar
1,
Christophe Turpin
1 and
Marion Scohy
2 1
LAPLACE—Laboratoire Plasma et Conversion d’énergie Université de Toulouse, CNRS—Centre National de la Recherche Scientifique, INPT—Institut National Polytechnique de Toulouse, UPS—Université Paul Sabatier, F-31077 Toulouse, France
2
Safran Power Units, F-31019 Toulouse, France
*
Author to whom correspondence should be addressed.
Energies 2021, 14(22), 7655; https://doi.org/10.3390/en14227655
Submission received: 16 October 2021
/
Revised: 9 November 2021
/
Accepted: 11 November 2021
/
Published: 16 November 2021
(This article belongs to the Special Issue Design, Modeling, and Optimization of Novel Fuel Cell Systems)
Abstract
:Nowadays, many aircraft manufacturers are working on new airplanes to reduce the environmental footprint and therefore meet greenhouse gas reduction targets. The concept of more electric aircraft is one of the solutions to achieve this goal. For this aircraft architecture, several electrical devices are used in order to supply propulsive and non-propulsive functions. This paper focuses on the sizing of a direct hybridization system to supply a non-propulsive function in an aircraft. It is composed of a High-Temperature Proton Exchange Membrane Fuel Cell (HT-PEMFC) and a lithium-ion (Li-ion) battery. This sizing is based on a static model of each storage device. The accuracy of these models is compared with dynamic models during a simulation for an aeronautical mission. Static models are implemented in a genetic algorithm to achieve two goals: on the one hand, satisfy the mission profile, and on the other hand, minimize the mass of the system. Other criteria, such as battery and fuel cell aging estimation, are considered. The obtained results show that the direct hybridization system allows protecting the fuel cell against an accelerated aging.
1. Introduction
In order to greatly reduce greenhouse gas emissions to minimize the global warming on the one hand, and to reduce the dependence on limited fossil fuel reserves on the other hand, the development of carbon-free energy systems is required. This is notably the case in the aeronautical sector, which has historically been growing strongly and is considered to be responsible for about 2.5% of the global anthropogenic carbon dioxide emissions in 2018, along with other greenhouse gases such as water vapor, particles, and nitrogen oxides (NOx) [1].
The fuel cell technology appears to be a promising solution to develop carbon-free energy systems. Quiet, non-polluting, and capable of using hydrogen or other fuels produced from renewable sources, it produces electricity, heat, and water from hydrogen and oxygen. Among the fuel cell technologies, the High-Temperature Proton Exchange Membrane Fuel Cell (HT-PEMFC) technology, operating at around 160 °C, has great advantages: the heat produced is more easily recoverable, and the cooling system is more compact compared to the Low-Temperature Proton Exchange Membrane Fuel Cell (LT-PEMFC). This high temperature also allows a good tolerance to impurities, in particular those present in the hydrogen obtained by reforming, such as carbon monoxide [2]. The use of a polymer membrane soaked in phosphoric acid eliminates the need for a gas humidification system. The advantages of an energy system using an HT-PEMFC are particularly interesting for an on-board application in an aircraft by reducing the size of the fuel cell balance of a plant (FCBOP), by facilitating the use of reformed hydrogen, and finally by allowing multi-generation on-board: electricity, heat, water, and inert gas [3]. However, this technology presents a low specific power and still exhibits too rapid aging, especially in embedded applications [2], which are two crippling obstacles in the context of aeronautical applications.
One possible solution for these two major problems consists in hybridizing the HT-PEMFC with a battery to take advantage of the high specific power of the latter. Indeed, the lithium-ion battery seems particularly suited to improve the performance of the hybrid system as it presents a high specific power, good specific energy, and can withstand a lot of discharge cycles [4]. Among the kinds of anode and cathode materials used for Li-ion batteries, the LiFePO4/graphite lithium-ion (LFP) battery is a suitable storage device for the transport. Indeed, thanks to the cathode material, the LFP battery is the most stable during the thermal runaway process [5]. Moreover, the LFP battery presents good performance and lifespan [6]. The presence of the battery provides a degree of freedom in the system sizing, allowing the size of the fuel cell to be reduced. It also provides a degree of freedom in operation, allowing the sharing of the power needed between the two sources. In addition, in an on-board system, the energy required for the fuel cell start and shut-down phases can be supplied by the battery. If the battery is used only as a power source component and not as an energy source, its final state of charge (SoC) must be equal to the initial one. However, in some cases, it may be used as an energy source, particularly in the case of a fuel cell temporary or permanent failure, adding a level of redundancy in the system.
Such hybridization is most often done with power converters providing a direct current bus (Figure 1a). It makes it possible to regulate the operating point of each component independently and therefore to improve the operating conditions for the fuel cell, for example long operation at high cell voltage or at high currents. The battery is also capable of protecting the fuel cell by providing rapid power variations required by the load, which may damage the fuel cell if the FCBOP is too slow to provide the power. It is especially the case with a H2/air fuel cell for which the inertia of the air compressor must be considered. In some cases, a third power converter is added before the load depending on the required level of direct voltage or if the load consumes alternative current. However, the power converters cause energy losses and require the implementation of complex control strategies. In addition, the operation of power converters results in current ripples, which are suspected of accelerating the fuel cell aging [7]. Finally, it is an additional component of significant mass, volume, and cost that may fail.
The direct electrical connection of the fuel cell and the battery in parallel, called direct or passive hybridization (Figure 1b), eliminates at least one power converter. Depending on the required DC bus voltage stability needed, the other power converters may also be removed. Therefore, direct hybridization potentially reduces the energy losses, mass, volume, cost, and more generally the complexity of the system. No control strategies are needed, as the system is self-managed. In addition, the current ripples created by the remaining power converters are supplied by the fuel cell–battery assembly and no longer by the fuel cell alone. As a result, the filter needed to protect the fuel cell in an indirect hybridization may be reduced.
Other types of hybridization, which may be called semi-direct hybridizations, use only one power converter between the fuel cell and the battery (Figure 1c) to regain some control over the power sharing between the two components. However, as in the case of the indirect hybridization, these architectures require the implementation of a converter control strategy to ensure that the components provide the power needed while staying into their operating limits. They must also include a regulation of the battery’s SoC to compensate for its losses [8].
The feasibility and the interest of a fuel cell–battery direct hybridization have been studied for HT-PEMFC [9,10,11,12] and LT-PEMFC [13,14,15,16,17,18,19,20,21,22,23], both in automotive [11,12,13,14,15] and aeronautical contexts [9,10,16,17,18,19].
Direct hybridizations of PEMFC with supercapacitors have also been reported in the literature [24]. Other examples of the direct hybridization of electrochemical components include a battery with supercapacitor [25] and electrolyzer with photovoltaic generators [26].
The coupling of the fuel cell and the battery can be done with relays [9,10,11,12,20] and/or diodes [9,10,15,20]. A diode is often connected in series with the fuel cell to protect it from reverse currents [10,20]. In order to prevent the battery to be passively charged, two diodes can be used [9,10,15].
Then, the battery is used as a power boost, for example for take-off and ascension in aeronautical applications [9]. However, it may be charged through other relays [10] or a dedicated power converter [15] which gives an additional degree of freedom for the system operation and sizing. The main drawback associated with the use of diodes is their forward voltages, which lead to power losses as high as 1.5% of the power absorbed by the load [10]. The current peak observed at the closing of a relay may be greatly decreased for example by a temporary connection with a resistor placed in series with an additional switch [11,12].
The main drawback of direct hybridization is the loss of control over the system in operation. Indeed, the absence of a power converter between the fuel cell and the battery removes the possibility of controlling the operating point of the components by this means. Moreover, in this case, the DC bus voltage is governed directly by the fuel cell and battery voltages. Therefore, the DC bus voltage cannot be monitored. However, Bernard et al. [13] and Michelin [23] proposed regulating the fuel cell operating conditions such as its pressure or oxidant flow. The resulting evolution of the performance of the fuel cell would make it possible to regain active but limited control over the operating points of the components.
In direct hybridization, the fuel cell and the battery reach operating points depending on their impedances and on the power demand of the load. As a result of this strong coupling, the modeling of the hybrid system appears as an essential step for the design phase and for studying its performance. Indeed, the system sizing is crucial to ensure that the system can safely satisfy the mission without entering hazardous operating zones of the components.
Another consequence of the control loss of the sources’ operating points is that the maximum power of the system may be lower than the sum of the maximum powers of the components. Blackwelder et al. [22] underlined the challenges in the sizing of a fuel cell–battery direct hybrid system. Particularly, if the sources are sized to approach the maximum global power, the shapes of their polarization curves must be close to each other to maintain voltage compatibility. This leads to difficulties for battery charging, and thus SoC maintaining, because of the fuel cell activation overvoltage: the charge of the battery will only take place in the case of low power absorbed by the load and with low currents from the fuel cell.
Keränen et al. [20] studied in simulation and experimentation a 50 kW hybridization system consisting of a LT-PEMFC directly connected to a lead-acid battery and supercapacitors. The fuel cell is modeled by its polarization curve, thus without considering dynamic phenomena, while battery and supercapacitor models integrate some level of dynamic. The authors size the system with the model without giving more details about the followed method. The lack of accuracy between experiment and simulation voltages is observed and attributed to the simplicity of the fuel cell model.
Lee et al. [23] proposed an analysis methodology of a LT-PEMFC–battery direct hybrid system based on the linearization of the polarization curves to gain a better understanding of the strong couplings between the sources. The fuel cell polarization curve is piecewise linearized within three sections to partly account for the strong non-linearity of activation and diffusion overvoltages.
Samsun et al. [12] studied the influence of battery capacity on the performance of an auxiliary power unit (APU) for a heavy truck composed of a HT-PEMFC directly connected to a Li-ion battery. A quasi-static model is used for the fuel cell, while the battery model integrates some level of dynamic [14]. The sizing of the fuel cell is based on the mean power of the mission at a voltage equal to the battery open circuit voltage with a SoC of 60%. The authors underline that a direct hybrid system sizing is very sensitive to the used mission.
Nishizawa et al. [10] presented a simplified sizing method for a direct hybrid system composed of an LT-PEMFC and an LFP battery. The method uses static characteristics of both sources to determine the number of cells in series needed for each component in order to maximize the system power while having the battery open circuit voltage lower than the fuel cell voltage. However, the effects of the battery capacity and the SoC variation are not considered in the sizing process. However, the SoC has an impact on the system autonomy, but also on the power distribution between the fuel cell and the battery (the battery voltage depends on the SoC). An application is done to size a HT-PEMFC–Li-ion battery 55 kW direct hybrid system for integration inside the Antares DLR-H2 glider, which flew in 2016 [16].
The objective of this paper is to present a sizing method in order to optimize the performance (mass, hydrogen consumption, lifespan) of a direct hybridization system composed of a HT-PEM fuel cell and a Li-ion battery for an aeronautical application. The paper is organized as follows: the direct hybridization system and the aeronautical application are presented in Section 2. Section 3 describes the dynamic and static models of the hybridization system. Simulation results are shown in order to compare the accuracy of these models. Section 4 shows the methodology based on a genetic algorithm to optimize the sizing. Finally, Section 5 summarizes the main conclusions and perspectives.
2. System Description
2.1. Direct Hybridization System
The system studied is composed of an HT-PEMFC H2/air directly connected to an LFP battery through two relays, and (Figure 2). These relays allow the direct connection of the two sources, the charge of the battery, and avoid the power losses of diodes.
Each component is connected to the load through a power cable. The cable characteristics have an important impact on the current sharing between the components in direct hybridization mode [17]. However, to simplify the analytical analysis for the sizing of the hybridized system, the cable is modeled by a constant resistance . The contact resistance of the relay is considered to be included in . Considering a cable section of 25 mm2 and a total length of 1 m and 2 m for respectively the battery and the fuel cell resistances, and are fixed at respectively 0.7 mΩ and 1.4 mΩ.
2.2. Mission
The system has to supply an electrical load without regenerative phases, in an aircraft, for about 5 h. The power profile of the electrical load is given in Figure 2. The average and maximum power are respectively 0.8 kW and 1.9 kW (without considering the consumption of fuel cell BOP). The maximum power variation ramp is 1.5 kW/s.
The battery is alone when starting up the fuel cell preheating phase, which represents a significant amount of energy, as well as during the fuel cell shutdown at the end of the mission. The relays are not used at any other time during the mission.
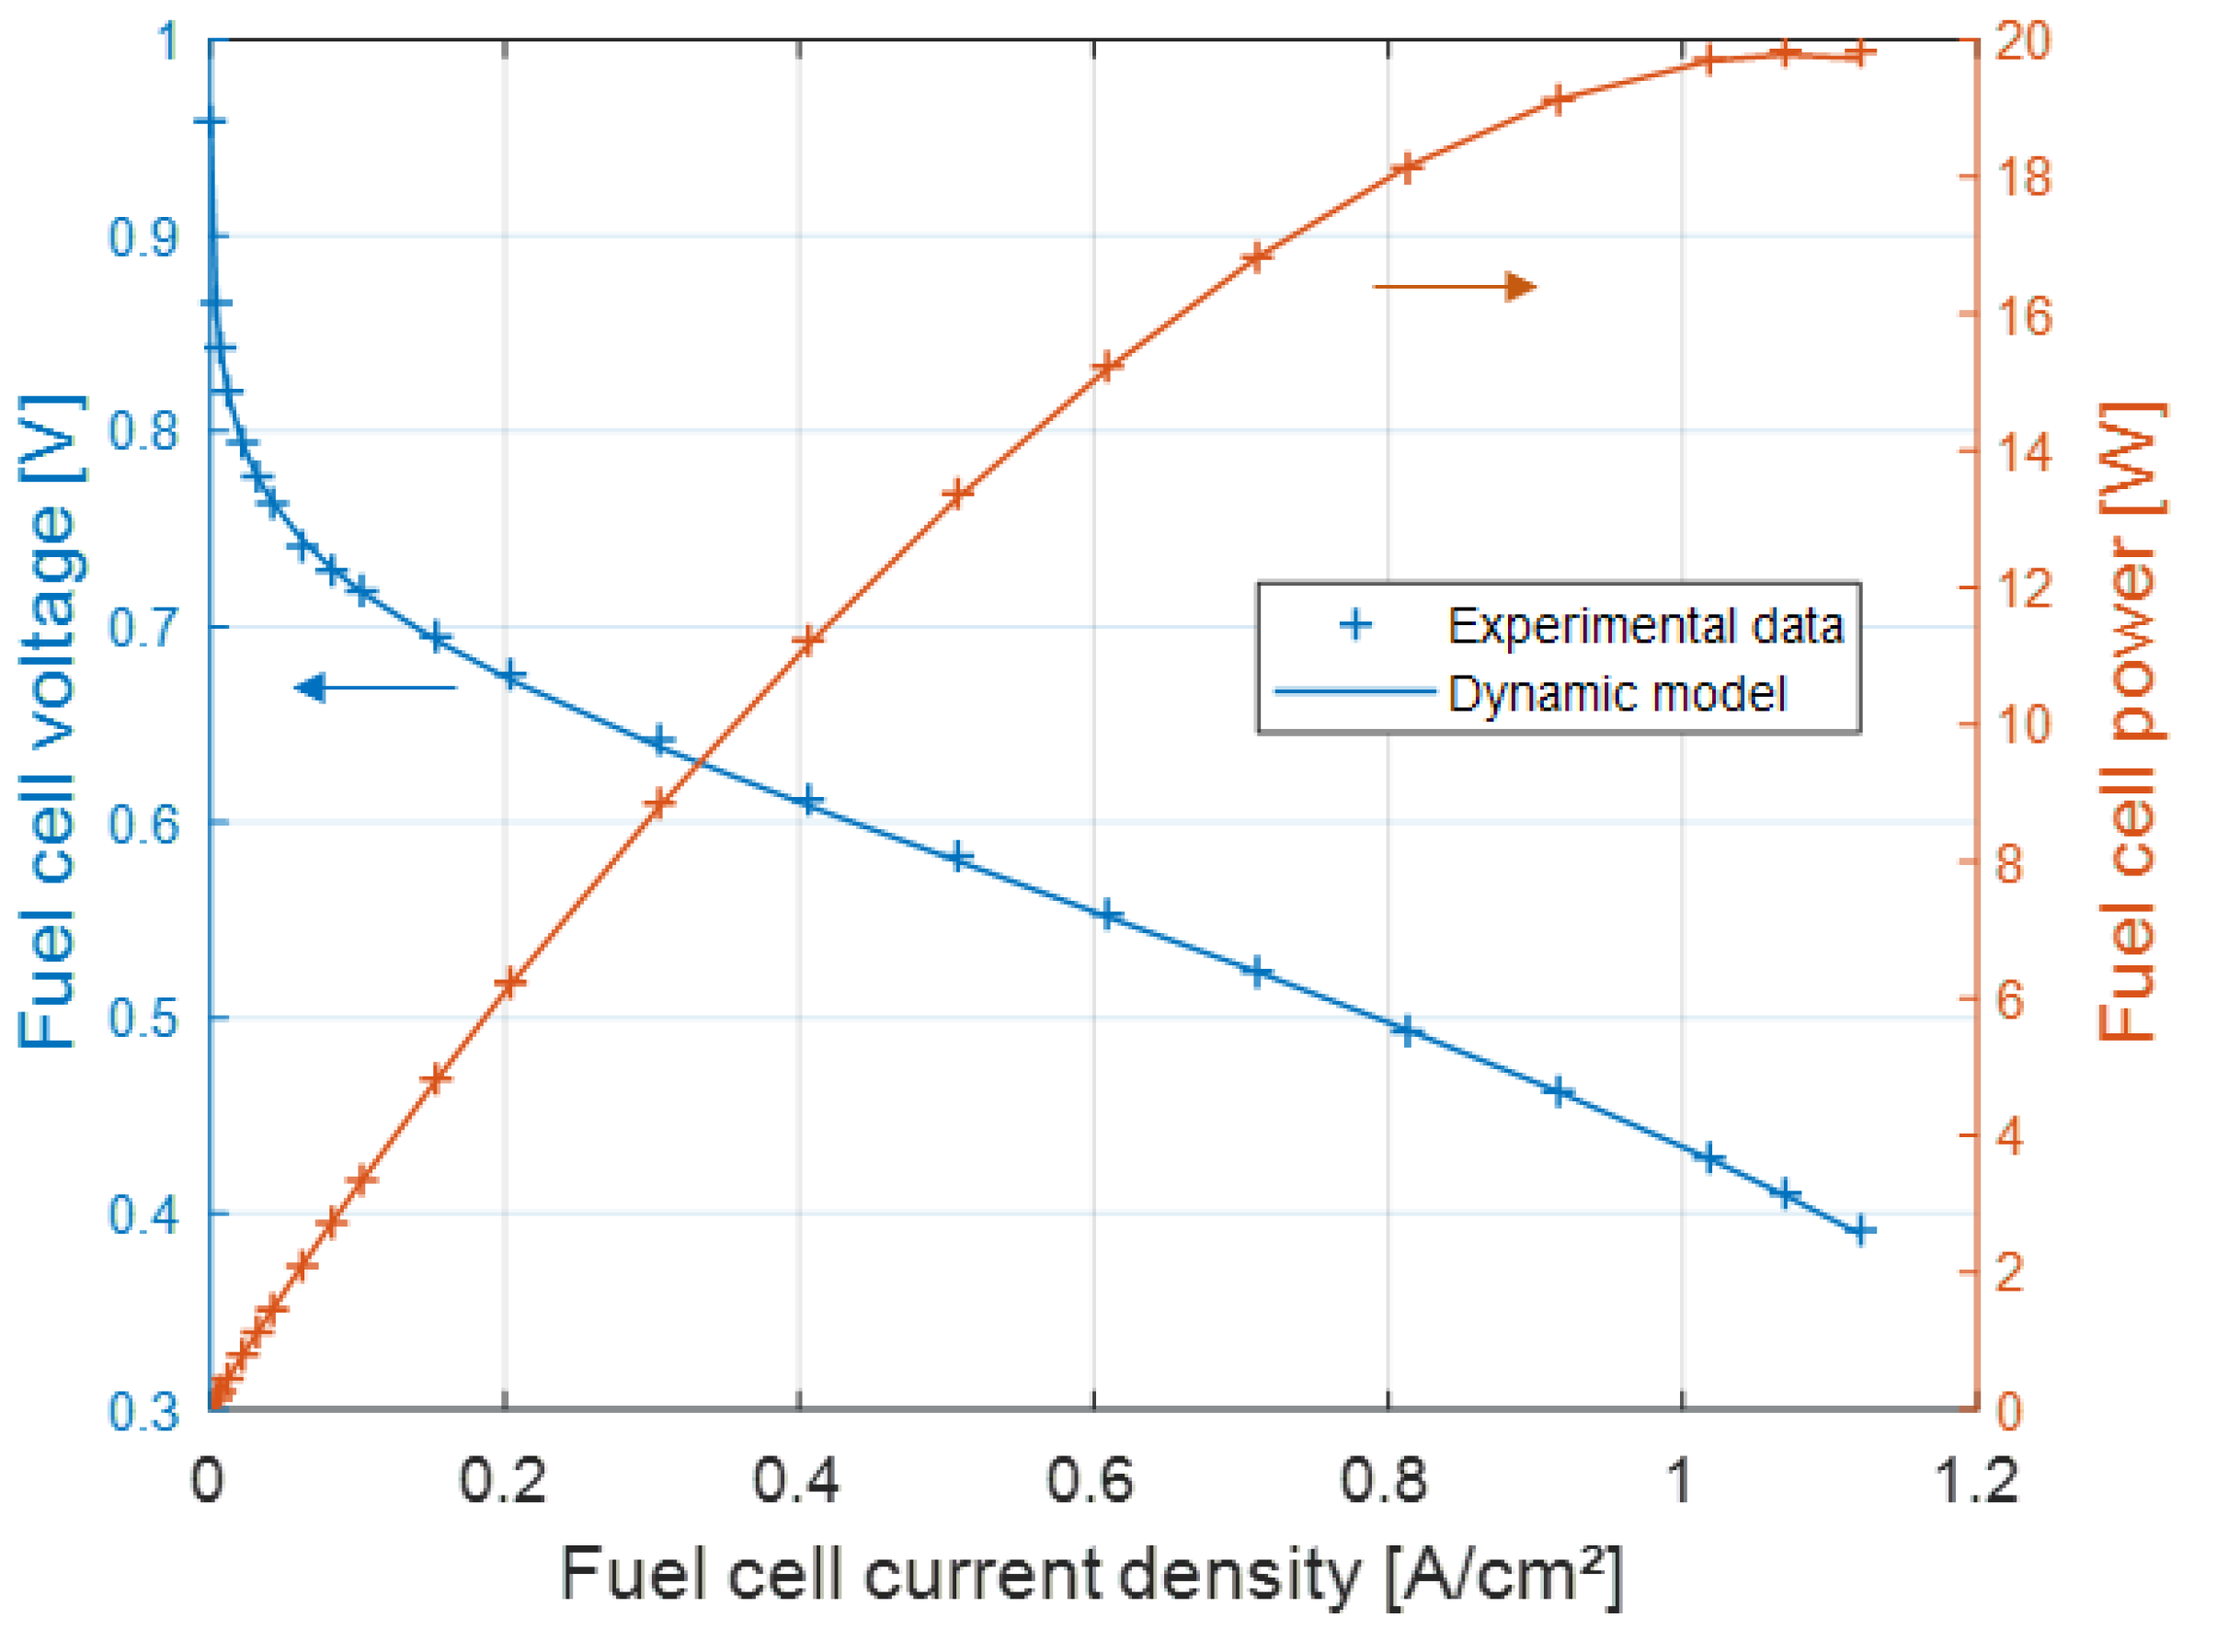
The required power for the fuel cell BOP is considered as a linear function of the fuel cell power , as mentioned by Equation (1), where refers to the maximum power of the fuel cell stack. Note that the maximum cell power density considered in this study is equal to 0.45 W/cm2 (value extracted from the fuel cell polarization curve visible on Figure 3).
3. System Modeling
3.1. Dynamic Model
A dynamic model of an HT-PEM fuel cell–Li-ion battery direct hybridization (Figure 4) has been developed, using close equivalent electrical models for the fuel cell [27,28] and the battery [29]. Such dynamic models are widely used in the literature, for example for the battery to describe its behavior during the charging phase [30].
The fuel cell dynamic model is constituted by a voltage source representing the reversible Nernst voltage in series with variable current sources representing activation and diffusion overvoltages, respectively and . The current source represents the effect of the parasitic reactions and of the crossover of active gases through the membrane on the fuel cell voltage. The battery dynamic model is constituted by two voltage sources: is the open circuit voltage of the battery for an SoC value of 50%, and is a variable voltage source that represents the evolution of the battery OCV with its SoC. Activation and diffusion losses are represented by variable resistors and , depending on the battery SoC. For the fuel cell and the battery, the ohmic losses are represented by resistors, respectively and . This model allows studying the dynamic current sharing between the fuel cell and the battery during a rapid power variation of the load or when these two components are connected by the closing of the two relays. As explained in Section 2.1, each cable is modeled by a resistor , but it would be possible to add an equivalent inductance in series as done in [24] in order to be able to model the cable inductive effect on the current dynamic sharing between the fuel cell and the battery. An equivalent cabling capacitor is added for numerical resolution with MATLAB/Simulink. The equivalent circuit dynamic model presented in Figure 4 allows simulating the dynamic behavior of the hybridized system. For each component, the faradic current is calculated, which leads the main reaction (redox) in the electrochemical component. This model also allows observing the filtering effect of the electrochemical double-layer phenomena, which is represented here by equivalent capacitors for the fuel cell and for the battery . The battery SoC is calculated by integrating the faradic current of the battery over time.
A rapid variation of the fuel cell faradic current can damage the fuel cell due to starvation phenomena especially happening when the air compressor is not responsive enough and does not provide the necessary amount of oxygen. For the fuel cell, the dynamic of the diffusion phenomena is represented by an equivalent capacitor , which is placed in parallel with a variable current source representing the diffusion overvoltage . For the battery, the dynamic of the diffusion phenomena is represented by an equivalent capacitor placed in parallel with and a variable resistor .
The parameters identification of the fuel cell dynamic model was carried out from experimental test data on a HT-PEM single cell from Advent with a surface of 45 cm2. First of all, the quasi-static parameters are extracted from the quasi-static polarization curve (Figure 3). Secondly, the values of and are extracted from dynamic solicitations such as large current sweepings of the operating range made at different frequencies.
The parameterization of the battery model was also carried out in two steps. An LFP battery composed of eight modules connected in series [31] was used. Each module is composed of eight LFP cells from TYVA ENERGIE with a capacity of 1.6 Ah [31] connected in parallel. The parameters allowing the OCV from the battery SoC to be computed are first extracted from an experimental curve (Figure 5), with thermodynamic constant values taken from the literature [32]. In Figure 4, the OCV corresponds to the sum of two voltage sources and . Then, the other parameters are extracted from a Hybrid Pulse Power Characteristics (HPPC) profile [33].
Due to lack of test data, we do not know the dynamic model accuracy related to the direct hybridization.
3.2. Simplified Model
In order to solve the system analytically, the dynamic model was simplified. Moreover, this simplification allows having a fast numerical resolution easily integrated into an optimization sizing process. Each component is represented as a voltage source connected in series with a resistor. A similar approach is proposed in [23]. The authors have made the same modeling simplifications, although they piecewise linearized the fuel cell polarization curve with three sections only.
The equivalent electrical diagram is shown in Figure 6. The resolution time of the simplified model is 40% lower than the dynamic model detailed in Section 3.1.
3.2.1. Simplified Fuel Cell Model
The voltage of the HT-PEMFC H2/air is governed by its polarization curve (Figure 3). In the simplified model, it depends on two parameters as stated in Equation (2): simplified fuel cell stack open circuit voltage () and internal resistance ().
The values of these parameters depend on the number of cells in series () as mentioned in Equations (3) and (4).
They also vary with the fuel cell current () to obtain a good representation of the quasi-static polarization curve. Indeed, the latter shows a strong non-linear behavior in low-current and high-current operation zones.
The parameters and are obtained for different fuel cell currents by discretizing the polarization curve with steps of 0.01 A/cm2. For each step, the parameters are calculated using a non-linear least-squares solver with the modeled quasi-static polarization curve, which was obtained from the dynamic model. This allows having a good accuracy of the polarization curve for every current value.
It is possible to use the measured polarization curve, which presents the advantages of removing the need to perform the parameterization of the dynamic model. However, even if they are small, the differences between the measured and modeled polarization curves reduce the precision of the simplified model relatively to the dynamic one.
3.2.2. Simplified Battery Model
The simplified battery model is composed of a voltage source modeling the open circuit voltage () connected in series with the battery internal resistance (). The battery voltage () is calculated thanks to Equation (5).
The battery is composed of several cells connected in series () and in parallel () in order to obtain the desired voltage and capacity. Equations (6) and (7) give the relation between the cell and battery parameters:
The amplitude of the OCV depends on the SoC of the battery. The SoC reflects the residual capacity in the battery, and it is calculated by using the common Coulomb counting. The relationship between the OCV and the SoC may be approximated by a linear equation when the SoC remains within a 20–80% variation range, as given in Equation (8) and presented in Figure 5. Outside this range, the and evolution is strongly non-linear, particularly for low SoC. Thus, the simplified model of the battery is only valid within a 20–80% SoC window.
For this SoC variation and in the case of Li-ion battery, the internal resistance can be considered constant [34]. Its value is extracted from the battery dynamic model by calculating the low-frequency resistance for an SoC value of 50%. The value obtained for a single battery cell of 1.6 Ah is 83 mΩ. This value could also be estimated directly from measurement data such as the response of the battery to a 10 s or 30 s step at an intermediate SoC.
Note that the structure of the battery dynamic model presented in Section 2.1 is close to the simplified model structure. It could easily be simplified into a voltage source in series with a resistance only by removing the two capacitors, thus obtaining a battery quasi-static model. Hence, the equations used in the dynamic model to express the relationship between the OCV, the activation resistance, the diffusion resistance, and the SoC could be used in the simplified model. However, it adds some calculation steps and would make the parameterization of the battery dynamic model mandatory. In addition, and contrary to the simplified fuel cell model, improving the simplified battery model has been found to only slightly improve the precision of the simplified model relative to the dynamic one.
In this study, the nominal voltage of the LFP cell is equal to 3.2 V, and the specific energy is equal to 127 Wh/kg. The maximum charge and discharge currents are imposed by the manufacturer at respectively 1 C and 3 C. A derating factor is applied to the cell specific energy to estimate the battery specific energy. Indeed, in addition to the cells, in a battery, there are several protection devices such as the battery management system and the outer packaging that increase the total mass of the battery. This coefficient is found to be around 0.53 for a Li-ion battery used in an aeronautical application [35]. Thus, the specific energy of the studied LFP battery is estimated at 67 Wh/kg. Nevertheless, this value is around 2.5 times higher than the specific energy value of the nickel cadmium battery [36], which is widely used in the aeronautical sector for its reliability.
3.3. Simplified Model Validity
In the previous sections, the fuel cell and battery simplified models have been introduced to accelerate the numerical resolution for the optimization sizing process. The simplifying assumptions cause differences in the current sharing between the battery and the fuel cell. These differences for the battery current induce a divergence for the SoC calculation between the dynamic and simplified models. However, a good modeling of the fuel cell polarization curve is sufficient to mitigate the differences in steady state between the two models. For all the sizing of the direct hybrid system presented in Section 4, the calculation of relative and absolute errors between the two models has been done. The mean relative errors for the fuel cell and battery voltages are respectively inferior to 0.4% and 0.3% whatever the sizing. The mean absolute errors of the fuel cell and battery currents are respectively less than 260 mA and 220 mA whatever the sizing. It represents about 0.4% of the fuel cell maximum current and 0.6% of the battery maximum charge current. Finally, the mean relative error for battery SoC is inferior to 2% whatever the sizing.
As explained in Section 3.2.1, the fuel cell simplified model may be parameterized with the measured polarization curve or with the modeled one. The latter possibility was chosen to increase the precision of the simplified model relative to the dynamic one. The gap between the two curves varies depending on the fuel cell current and presents a maximum magnitude of 5 mV. Using the measured polarization curve leads to important differences in the simulation of certain sizings, depending on the involved fuel cell operating zone. The calculation of relative and absolute errors between the simplified and the dynamic model was done for all the sizing presented in Section 4, in the case of the use of the measured fuel cell polarization curve. The mean absolute errors for the fuel cell and battery currents respectively go up to 500 mA and 560 mA depending on the sizing. The mean relative error for the battery SoC goes from 0.3% to 13% depending on the sizing. It is remarkable that such a difference in the static behavior modeling of the fuel cell has such a great impact on the simulation of the fuel cell–battery direct hybrid system.
An example of simulation is given in Figure 7 for a system with a fuel cell of 121 cells in series and a battery with a capacity of 10 Ah and 23 cells in series. This sizing is one of the lightest found with the sizing method described in Section 4.
The simulation results show that once connected to the battery, the fuel cell operating point stays within a current density window of 0.25–0.45 A/cm2. The battery operating point fluctuates around 0 A with maximum charge and discharge currents of 1 C. As a result, the voltage of this direct hybrid system stays within a 72–80 V variation window. The fuel cell is fed with active gases about 10 s before relay closing. Its voltage reaches its open circuit value before decreasing when it is directly connected to the battery. The fuel cell current peak visible at a time of about 50 min is due to the closing of the fuel cell relay. As a result of the absence of representation of cable and fuel cell inductances in the dynamic model, the magnitude of the fuel cell current peak is of 200 A. The battery charge current presents a peak with a magnitude of 100 A, while the cable capacitor absorbs the difference. Similarly, the fuel cell is purged of active gases about 10 s after relay opening at a time of about 5 h.
The accuracy of the simplified model is found to be good. Thus, this model is used in a sizing process to gain calculation speed.
4. System Sizing
4.1. Sizing Methodology
The fuel cell sizing (number of cells placed in series ) and the battery sizing (number of accumulators in series , number of branches in parallel , and initial state of charge ) are carried out by a genetic algorithm. The sizing is made with MATLAB and uses the “genetic algorithm” function [37]. The population size is set at 200 and the number of generations is set at 10. The algorithm is started 400 times to obtain various solutions. In order to simplify the sizing process and analysis, the capacity of one accumulator is set at a value of 5 Ah, and the cell resistance is modified proportionately to the cell capacity, as mentioned in Equation (7). Thus, the total battery capacity is a discrete multiple of this value. The only continuous optimization variable is the initial SoC.
The bounds used for the four optimization variables are presented in Table 1.
The lowest bounds are set according to sizing criteria, while the upper bounds are chosen high enough to find solutions with the lowest battery capacity. For the fuel cell, the minimum number of cells in series is set to have a maximum fuel cell power equal to the average power of the mission, to which we add 15% to take into account the power demanded by the BOP, as explained in Section 2.2. Thus, the minimum number of cells connected in series in the fuel cell is 45. For the battery, the minimum number of cells connected in series is chosen to set the OCV at SoC = 80% greater than 18 V. This level corresponds to the minimum allowed fuel cell voltage, 0.4 V/cell (Figure 3), for the minimum number of cells in series, which is 45. This ensures that the battery can operate in discharge when it is coupled to the fuel cell, without the latter operating at too low a voltage. Since the simplified model resolution is not rapid enough for the studied mission, these sizing criteria are not used as optimization constraints but only as a means to fix the optimization variables bounds. However, they could be used in a more elaborated sizing method as optimization constraints, allowing the optimizer not to simulate certain inappropriate sizings. Other sizing optimization constraints may be proposed, for instance to maximize the system maximum power with the use of the method described in [10].
The minimum number of battery branches in parallel, each branch having a unit capacity of 5 Ah, is set to 1. Finally, in order to respect the model assumptions, the initial SoC is limited to between 20 and 80%.
For each sizing variables combination made by the genetic algorithm, the system configuration is tested. A combination is retained among the possible solutions only if, during the mission, the SoC of the battery remains between 20 and 80% to respect the validity range of the battery models. In addition, the fuel cell current density must remain between 0 and 1.2 A/cm2, which allows safe operation. Finally, the battery operating limits must be respected, in particular the maximum charge and discharge currents.
Then, the mass of the system is calculated by adding the following:
- The mass of the fuel cell and its BOP as a function of its maximum power, with a specific power value of 2 kW/kg for the stack [38];
- The battery mass given by Equation (9);
- The mass of the corresponding tank, as a function of the mass of hydrogen consumed. Note that the stored hydrogen density is set to 5.5%: a 94.5 kg tank is needed to store 5.5 kg of H2 [38].
, , and are respectively the capacity, the specific energy, and the nominal voltage of the battery.
In some cases, the final battery state of charge () may be lower than the initial one (). This could mean that the system cannot satisfy a second mission, and a battery recharge phase is necessary. From a practical point of view, charging the battery by the fuel cell at the end of the mission (before shutting-down the fuel cell) is possible with a direct hybrid system. It would be done by leaving the two components connected, as proposed in the literature [10,18]. Since the fuel cell OCV is, for the studied architecture, always higher than the battery OCV, a charge current would be established from the fuel cell to the battery. Its magnitude, and thus the speed of the battery recharging, depends on the sizing of the two components. If the initial SoC is high, the charge current may become very low (if the battery and fuel cell OCV are close), and the fuel cell may then operate in a degrading zone. The impact of this recharge phase on the total hydrogen consumption is found to be relatively negligible, but it can be significant if the aging of the fuel cell is considered.
In other cases, it is the contrary that happens, and the final battery SoC is greater than the initial one. This leads to an important difference between direct and indirect hybridization systems: for the first one, the battery may need to be slightly discharged so that the system can satisfy a second mission. This is due to the strong coupling between the components directly connected, which are influenced by the battery SoC.
In addition to the total mass of the system, some performance indicators are calculated for each source.
For the fuel cell, the total time spent in a degrading zone is calculated. The degrading zone is arbitrarily defined as the operating zone where the fuel cell presents a voltage superior to 0.8 V/cell. Indeed, the high voltages trigger some parasitic reactions such as carbon corrosion [2].
Concerning the battery, the number of full discharge equivalent cycles () is calculated thanks to an adapted rainflow counting method [8]. It consists of calculating the number of discharge cycles () in the battery SoC profile as a function of the depth of discharge (DoD) of each cycle. Then, thanks to a cycle to failure diagram giving the maximum number of cycles before failure () as a function of the depth of the discharge cycle, can be calculated with Equation (10).
Equation (11), as proposed in [39], was selected for an LFP battery for an operating temperature of 25 °C. Thus, the battery lifetime is estimated to be around 6700 full discharge cycles before a 20% loss of capacity, which is the end of the lifetime criteria.
The number of equivalent cycles at full discharge undergone by the battery allows considering its aging in the comparison between the different sizings obtained.
4.2. Results
Many sizings are possible for the direct hybrid system with a variation of the capacity battery from 5 to 50 Ah. The lightest systems have a total mass of 23 kg. The sizing results with the lowest total masses are those that tend to minimize the mass of the battery. It is the decrease in the battery capacity that minimizes its mass, although it is accompanied by an increased number of cells connected in series.
Indeed, systems with a small battery capacity need a high number of cells in series to increase the battery power. It also results in an increase in the fuel cell number of cells connected in series to keep compatible voltage levels. Operating with a high-power fuel cell relieves the battery, and subsequently, it becomes possible to reduce its capacity. For instance, it is possible to size a system with a battery capacity of 5 Ah with 191 cells connected in series for the fuel cell and 39 for the battery. To compare, a system with a 50 Ah battery capacity is composed of 58 cells for the fuel cell and seven for the battery. Note that this diversity of cell numbers also changes the voltage level of the system.
The minimization of the battery size also facilitates a strong “damping effect” on the evolution of its SoC. Indeed, as you can see in Figure 5, the OCV of the LFP battery varies slightly with the SoC. This is a particularly interesting feature in a direct hybrid system, because it allows the battery voltage to present a certain variation depending on its SoC. As the battery is directly connected to the fuel cell, the fuel cell voltage and therefore the fuel cell power are depending on the battery SoC.
This might reduce the cases of uncontrolled drift of the battery SoC toward overcharge or deep discharge. Indeed, when the battery is charged by the fuel cell, the battery voltage grows up even more as its OCV varies strongly with the SoC. Thus, the increase in the voltage level causes a decrease in the power produced by the fuel cell. As a result, for a constant power absorbed by the load, the charging current to the battery will be reduced. Conversely, when the battery operates in discharge mode, the voltage level tends to decrease, which causes an increase in the power produced by the fuel cell. As a result, for a constant power absorbed by the load, the current delivered by the battery will be reduced. A small battery capacity means that the battery SoC will vary strongly during the mission, thus exploiting this “damping effect” more than for higher battery capacities. The drawback of this effect is that the fuel cell power varies more during the mission. It may reduce the fuel cell efficiency, and it also degrades it. However, this power variation accompanies the variation of the battery SoC. Thus, it is quite slow.
The systems with the lowest total masses tend to consume more hydrogen. This can be seen on a Pareto chart of the H2 consumption versus the total system mass (Figure 8) of all the sizings obtained with the method described in Section 4.1. This is due to the fact that low system masses are obtained for a high number of cells in series on the fuel cell and low battery capacity. The fuel cell operating point varies more with the load variation and with the battery SoC, and so the fuel cell efficiency is reduced. As can be seen in Figure 8, the most efficient system consumes 335 g of H2 during a mission, while the lightest system consumes 357 g. Thus, to give elements of comparison, the lightest sizing consumes 6.6% more hydrogen than the most efficient one while being 38.8% lighter.
Most sizings allow more than one initial battery SoC, which is important for system robustness. However, those with the lowest total system masses only work with high initial SoCs. Indeed, the low battery capacity of the lighter systems is nearly exhausted during the fuel cell preheating phase. Another explanation is that no simulation of the battery recharge is carried out at the end of the mission: in some sizings, particularly for the lightest ones, the battery finishes the mission with an SoC lower than the initial one. In this case, the battery serves as a power and energy source.
An interesting result is that for the same sizing, it is advantageous in terms of hydrogen consumption to have the highest possible initial SoC. Indeed, this allows a higher operating voltage and therefore better efficiency for the fuel cell. Therefore, the consumption of H2 is reduced.
No sizing is valid for an initial battery SoC lower than 35%, because of the energy needed for the preheating phase of the fuel cell. This phase greatly constrains the energy sizing of the battery.
Whatever the sizing, the fuel cell, once connected to the battery, is never working in a degrading zone with a cell voltage higher than 0.8 V. This may be explained by the rapid decrease in the fuel cell voltage with its current due to the non-linear activation overvoltage (Figure 3). Due to its much flatter polarization curve, a battery operating at such high voltages could not also operate with the fuel cell working at higher currents, thus greatly reducing the fuel cell operation zone and oversizing the battery.
The minimization of the total mass of the system is done by minimizing the mass of the battery but also by optimizing its use. This leads to a higher number of full discharge equivalent cycles for the batteries in the lightest systems. This can be seen on the second Pareto chart given in Figure 8.
In order to compare the performance of the direct hybridization system with a reference, a simulation of a fuel cell providing current alone during the mission (pre-heating and inerting being done with an exterior source of energy) was carried out using the fuel cell dynamic model. With 97 cells in series, the system would have a total mass of 10.8 kg (H2 reservoir included) and consume 0.36 kg of H2 during the mission with minimum, mean, and maximum current densities of respectively 0.03 A/cm2, 0.54 A/cm2, and 1.18 A/cm2. The performance of such a system would be suitable. However, it would need an external source of energy for the pre-heating and inerting phases. In addition, it would spend 4.2% of the time in the degrading operating zone, which is a non-negligible amount of time.
5. Conclusions
An optimal sizing of a HT-PEM fuel cell–Li-ion battery direct hybridization has been implemented in order to minimize the total mass of the system. Analytical relationships have been used for the optimization, which has been obtained from a simplified model of the hybridization. A dynamic model of the direct hybrid system was also proposed and used to validate the utilization of the simplified model for the sizing. Hence, with simplified models, the numerical resolution time for the sizing has been reduced (40% faster). The impact of the fuel cell modeling on the direct hybrid system simulation has been presented. The results show that several sizings are possible, with different performances in terms of mass, hydrogen consumption, and component aging. A compromise has to be found between minimizing the mass and the aging of the fuel cell, which is accelerated by its variable operation or at low current densities. Moreover, a battery that manages more transients will reduce its lifespan due to a stronger cycling.
Several areas for improvement of the sizing method are possible: simulation of the battery recharge phase at the end of the mission, and implementation of aging laws in the models to analyze the impact of sizing on the fuel cell and battery aging. A comparison with an indirect hybridization system should also be carried out to study the impact on the sizing and the performance.
The sizing of a direct hybridization system is complex because the parallel fuel cell–battery association is a new physical object whose electrical behavior and operating limits depend on the electrical characteristics of the components. The variation of these electrical characteristics with the component aging and with their operating conditions, and the inevitable uncertainties about the real mission, should be considered during the design phase to ensure the system robustness. This topic is also to be developed in future work.
Finally, it has been shown that the fuel cell preheating phase, carried out by the battery, strongly constrains the size of the latter: using hydrogen to preheat the fuel cell could be one way to reduce the battery mass.
Author Contributions
Conceptualization, T.J., F.L., A.J. and C.T.; methodology, T.J., F.L. and A.J.; software, T.J.; validation, C.T. and M.S.; writing—original draft preparation, T.J. and F.L.; writing—review and editing, A.J. and C.T.; supervision, C.T. All authors have read and agreed to the published version of the manuscript.
Funding
The authors would like to thank Safran Power Units and the Banque Publique d’Investissement (BPI) for the financing of this work.
Institutional Review Board Statement
Not applicable.
Informed Consent Statement
Not applicable.
Data Availability Statement
The data that support the findings of this study are available on request from the corresponding author T.J.
Conflicts of Interest
The authors declare no conflict of interest. The funders had no role in the design of the study; in the collection, analyses, or interpretation of data; in the writing of the manuscript, or in the decision to publish the results.
References and Notes
- Lee, D.S.; Fahey, D.W.; Skowron, A.; Allen, M.R.; Burkhardt, U.; Chen, Q.; Doherty, S.J.; Freeman, S.; Forster, P.M.; Fuglestvedt, J.; et al. The Contribution of Global Aviation to Anthropogenic Climate Forcing for 2000 to 2018. Atmos. Environ. 2020, 244, 117834. [Google Scholar] [CrossRef] [PubMed]
- Araya, S.S.; Zhou, F.; Liso, V.; Sahlin, S.L.; Vang, J.R.; Thomas, S.; Gao, X.; Jeppesen, C.; Kær, S.K. A Comprehensive Review of PBI-Based High Temperature PEM Fuel Cells. Int. J. Hydrogen Energy 2016, 41, 21310–21344. [Google Scholar] [CrossRef]
- Pratt, J.W.; Klebanoff, L.E.; Munoz-Ramos, K.; Akhil, A.A.; Curgus, D.B.; Schenkman, B.L. Proton Exchange Membrane Fuel Cells for Electrical Power Generation On-Board Commercial Airplanes. Appl. Energy 2013, 101, 776–796. [Google Scholar] [CrossRef] [Green Version]
- Hannan, M.A.; Hoque, M.M.; Mohamed, A.; Ayob, A. Review of Energy Storage Systems for Electric Vehicle Applications: Issues and Challenges. Renew. Sustain. Energy Rev. 2017, 69, 771–789. [Google Scholar] [CrossRef]
- Feng, X.; Ouyang, M.; Liu, X.; Lu, L.; Xia, Y.; He, X. Thermal Runaway Mechanism of Lithium Ion Battery for Electric Vehicles: A Review. Energy Storage Mater. 2018, 10, 246–267. [Google Scholar] [CrossRef]
- Batterie Lithium Ferro Phosphate—PowerTech Systems. Available online: https://www.powertechsystems.eu/fr/home/technique/la-technologie-lithium-fer-phosphate/ (accessed on 15 November 2021).
- Wahdame, B.; Girardot, L.; Hissel, D.; Harel, F.; Francois, X.; Candusso, D.; Pera, M.C.; Dumercy, L. Impact of Power Converter Current Ripple on the Durability of a Fuel Cell Stack. In Proceedings of the 2008 IEEE International Symposium on Industrial Electronics, Cambridge, UK, 30 June–2 July 2008; pp. 1495–1500. [Google Scholar]
- Jaafar, A.; Sareni, B.; Roboam, X.; Thiounn-Guermeur, M. Sizing of a Hybrid Locomotive Based on Accumulators and Ultracapacitors. In Proceedings of the 2010 IEEE Vehicle Power and Propulsion Conference, Lille, France, 1–3 September 2010; pp. 1–6. [Google Scholar]
- Renau, J.; Sánchez, F.; Lozano, A.; Barroso, J.; Barreras, F. Analysis of the Performance of a Passive Hybrid Powerplant to Power a Lightweight Unmanned Aerial Vehicle for a High Altitude Mission. J. Power Sources 2017, 356, 124–132. [Google Scholar] [CrossRef] [Green Version]
- Nishizawa, A.; Kallo, J.; Garrot, O.; Weiss-Ungethüm, J. Fuel Cell and Li-Ion Battery Direct Hybridization System for Aircraft Applications. J. Power Sources 2013, 222, 294–300. [Google Scholar] [CrossRef]
- Andreasen, S.; Ashworth, L.; Menjonremon, I.; Kar, S. Directly Connected Series Coupled HTPEM Fuel Cell Stacks to a Li-Ion Battery DC Bus for a Fuel Cell Electrical Vehicle. Int. J. Hydrogen Energy 2008, 33, 7137–7145. [Google Scholar] [CrossRef]
- Samsun, R.C.; Krupp, C.; Baltzer, S.; Gnörich, B.; Peters, R.; Stolten, D. A Battery-Fuel Cell Hybrid Auxiliary Power Unit for Trucks: Analysis of Direct and Indirect Hybrid Configurations. Energy Convers. Manag. 2016, 127, 312–323. [Google Scholar] [CrossRef]
- Bernard, J.; Hofer, M.; Hannesen, U.; Toth, A.; Tsukada, A.; Büchi, F.N.; Dietrich, P. Fuel Cell/Battery Passive Hybrid Power Source for Electric Powertrains. J. Power Sources 2011, 196, 5867–5872. [Google Scholar] [CrossRef]
- Di Trolio, P.; Di Giorgio, P.; Genovese, M.; Frasci, E.; Minutillo, M. A Hybrid Power-Unit Based on a Passive Fuel Cell/Battery System for Lightweight Vehicles. Appl. Energy 2020, 279, 115734. [Google Scholar] [CrossRef]
- Chen, Y.-S.; Lin, S.-M.; Hong, B.-S. Experimental Study on a Passive Fuel Cell/Battery Hybrid Power System. Energies 2013, 6, 6413–6422. [Google Scholar] [CrossRef]
- Kallo, J.; Schirmer, J.; Flade, S.; Poggel, S.; Stephan, T.; Willich, C. High Efficient Energy System for Electric Passenger Aircraft Propulsion. In Proceedings of the AIAA Scitech 2019 Forum, San Diego, CA, USA, 7–11 January 2019; American Institute of Aeronautics and Astronautics: San Diego, CA, USA, 2019. [Google Scholar]
- Hordé, T. Étude de Systèmes Pile à Combustible Hybridés Embarqués Pour L’aéronautique. Ph.D. Thesis, Ecole Nationale Supérieure des Mines de Paris, Paris, France, 2012. [Google Scholar]
- Jones, T.D.; Kim, S. Passive Power Management and Battery Charging for Hybrid Fuel Cell/Battery System. U.S. Patent US20160351983A1, 1 December 2016. [Google Scholar]
- Kim, K.; Kim, T.; Lee, K.; Kwon, S. Fuel Cell System with Sodium Borohydride as Hydrogen Source for Unmanned Aerial Vehicles. J. Power Sources 2011, 196, 9069–9075. [Google Scholar] [CrossRef]
- Keränen, T.M.; Karimäki, H.; Viitakangas, J.; Vallet, J.; Ihonen, J.; Hyötylä, P.; Uusalo, H.; Tingelöf, T. Development of Integrated Fuel Cell Hybrid Power Source for Electric Forklift. J. Power Sources 2011, 196, 9058–9068. [Google Scholar] [CrossRef]
- Lee, S.C.; Kwon, O.; Thomas, S.; Park, S.; Choi, G.-H. Graphical and Mathematical Analysis of Fuel Cell/Battery Passive Hybridization with K Factors. Appl. Energy 2014, 114, 135–145. [Google Scholar] [CrossRef]
- Blackwelder, M.J.; Dougal, R.A. Power Coordination in a Fuel Cell–Battery Hybrid Power Source Using Commercial Power Controller Circuits. J. Power Sources 2004, 134, 139–147. [Google Scholar] [CrossRef]
- Braillard, V.; Paganelli, G. Method for Controlling a Fuel Cell. U.S. Patent US20180366750A1, 20 December 2018. [Google Scholar]
- Morin, B.; Van Laethem, D.; Turpin, C.; Rallières, O.; Astier, S.; Jaafar, A.; Verdu, O.; Plantevin, M.; Chaudron, V. Direct Hybridization Fuel Cell—Ultracapacitors. Fuel Cells 2014, 14, 500–507. [Google Scholar] [CrossRef]
- Chen, H.; Zhang, Z.; Guan, C.; Gao, H. Optimization of Sizing and Frequency Control in Battery/Supercapacitor Hybrid Energy Storage System for Fuel Cell Ship. Energy 2020, 197, 117285. [Google Scholar] [CrossRef]
- Clarke, R.E.; Giddey, S.; Ciacchi, F.T.; Badwal, S.P.S.; Paul, B.; Andrews, J. Direct Coupling of an Electrolyser to a Solar PV System for Generating Hydrogen. Int. J. Hydrogen Energy 2009, 34, 2531–2542. [Google Scholar] [CrossRef]
- Fontes, G.; Turpin, C.; Astier, S. A Large-Signal and Dynamic Circuit Model of a H2/O2 PEM Fuel Cell: Description, Parameter Identification, and Exploitation. IEEE Trans. Ind. Electron. 2010, 57, 1874–1881. [Google Scholar] [CrossRef]
- Saisset, R.; Fontes, G.; Turpin, C.; Astier, S. Bond Graph Model of a PEM Fuel Cell. J. Power Sources 2006, 156, 100–107. [Google Scholar] [CrossRef]
- Ménard, L.; Fontès, G.; Astier, S. Dynamic Energy Model of a Lithium-Ion Battery. Math. Comput. Simul. 2010, 81, 327–339. [Google Scholar] [CrossRef]
- Ruan, H.; He, H.; Wei, Z.; Quan, Z.; Li, Y. State of Health Estimation of Lithium-Ion Battery Based on Constant-Voltage Charging Reconstruction. IEEE J. Emerg. Sel. Top. Power Electron 2021. early access. [Google Scholar] [CrossRef]
- TYVA ENERGIE, France, Annonay, FE18650-HE1 LFP 1,6Ah—Datasheet. Available online: https://tyva-energie.com/images/FE18650-HE1-1600-3.2_V_LI-FEPO4.pdf (accessed on 15 November 2021).
- Jalkanen, K.; Aho, T.; Vuorilehto, K. Entropy Change Effects on the Thermal Behavior of a LiFePO4/Graphite Lithium-Ion Cell at Different States of Charge. J. Power Sources 2013, 243, 354–360. [Google Scholar] [CrossRef]
- Lacressonnière, F.; Varais, A.; Roboam, X.; Bru, E.; Mullins, T. Scale Electro-Thermal Model of a Lithium-Ion Battery for Time-Accelerated Experiments in a Hardware in the Loop Process. J. Energy Storage 2021, 39, 102576. [Google Scholar] [CrossRef]
- Andre, D.; Meiler, M.; Steiner, K.; Wimmer, C.; Soczka-Guth, T.; Sauer, D.U. Characterization of High-Power Lithium-Ion Batteries by Electrochemical Impedance Spectroscopy. I. Experimental Investigation. J. Power Sources 2011, 196, 5334–5341. [Google Scholar] [CrossRef]
- SAFT VL6P NCA 6,5Ah—Confidential Data from SAFT.
- SAFT 505CH NiCd 20 Cells 50Ah—Datasheet and Confidential Data from SAFT: SAFT 505CH NiCd 20 Cells 50Ah—Datasheet.
- Chipperfield, A.J.; Fleming, P.J. The MATLAB Genetic Algorithm Toolbox. In Proceedings of the IEE Colloquium on Applied Control Techniques Using MATLAB, London, UK, 26 January 1995. [Google Scholar]
- Fuel Cells and Hydrogen 2 Joint Undertaking (FCH 2 JU), Addendum to the Multi-Annual Work Plan 2014–2020, June 2018.
- Swierczynski, M.; Stroe, D.-I.; Stan, A.-I.; Teodorescu, R. Lifetime and Economic Analyses of Lithium-Ion Batteries for Balancing Wind Power Forecast Error. Int. J. Energy Res. 2015, 39, 760–770. [Google Scholar] [CrossRef]
Figure 1.
Types of connection of a fuel cell–battery hybridization.

Figure 2.
Simplified diagram of the direct hybrid system.

Figure 3.
Quasi-static HTPEM fuel cell measured polarization curve.

Figure 4.
Equivalent circuit dynamic model of a fuel cell–Li-ion battery direct hybridization.

Figure 5.
Relationship between battery OCV and SoC.

Figure 6.
Equivalent electrical diagram of the simplified model of a fuel cell–Li-ion battery direct hybridization.
Figure 6.
Equivalent electrical diagram of the simplified model of a fuel cell–Li-ion battery direct hybridization.

Figure 7.
Simulation of a HT-PEM fuel cell–battery LFP direct hybridization on an aeronautical mission with simplified and dynamic models.
Figure 7.
Simulation of a HT-PEM fuel cell–battery LFP direct hybridization on an aeronautical mission with simplified and dynamic models.

Figure 8.
Pareto charts of H2 consumption and number of battery full discharge equivalent cycles as a function of total system mass.
Figure 8.
Pareto charts of H2 consumption and number of battery full discharge equivalent cycles as a function of total system mass.


Table 1.
Genetic algorithm search space.
| Fuel Cell | Battery | ||
|---|---|---|---|
| 45–250 | 6–50 | 45–250 | 20–80% |
Publisher’s Note: MDPI stays neutral with regard to jurisdictional claims in published maps and institutional affiliations. |
© 2021 by the authors. Licensee MDPI, Basel, Switzerland. This article is an open access article distributed under the terms and conditions of the Creative Commons Attribution (CC BY) license (https://creativecommons.org/licenses/by/4.0/).
Share and Cite
MDPI and ACS Style
Jarry, T.; Lacressonnière, F.; Jaafar, A.; Turpin, C.; Scohy, M. Modeling and Sizing of a Fuel Cell—Lithium-Ion Battery Direct Hybridization System for Aeronautical Application. Energies 2021, 14, 7655. https://doi.org/10.3390/en14227655
AMA Style
Jarry T, Lacressonnière F, Jaafar A, Turpin C, Scohy M. Modeling and Sizing of a Fuel Cell—Lithium-Ion Battery Direct Hybridization System for Aeronautical Application. Energies. 2021; 14(22):7655. https://doi.org/10.3390/en14227655
Chicago/Turabian StyleJarry, Thomas, Fabien Lacressonnière, Amine Jaafar, Christophe Turpin, and Marion Scohy. 2021. "Modeling and Sizing of a Fuel Cell—Lithium-Ion Battery Direct Hybridization System for Aeronautical Application" Energies 14, no. 22: 7655. https://doi.org/10.3390/en14227655
Note that from the first issue of 2016, this journal uses article numbers instead of page numbers. See further details here.