
Spraying and Mixing Characteristics of Urea in a Static Mixer Applied Marine SCR System


1
School of Mechanical Engineering, Pusan National University, Busandaehak-ro 63beon-gil 2, Geumjeong-gu, Busan 46241, Korea
2
STX Engine Co., Ltd., Gongdan-ro 474 36 beon-gil, Seongsan-gu Changwon, Gyengsangnamdo 51574, Korea
3
Consortium for Research Engineer Education for Next Generation Smart Appliance, Pusan National University, Busandaehak-ro 63beon-gil 2, Geumjeong-gu, Busan 46241, Korea
*
Authors to whom correspondence should be addressed.
Energies 2021, 14(18), 5788; https://doi.org/10.3390/en14185788
Submission received: 15 July 2021
/
Revised: 28 August 2021
/
Accepted: 3 September 2021
/
Published: 14 September 2021
(This article belongs to the Special Issue Advances in Reduction Technologies of Gas Emissions (CO2, NOx, and SO2) in Combustion-Related Applications)
Abstract
:The most effective de-NOx technology in marine diesel applications is the urea-based selective catalytic reduction (SCR) system. The urea-SCR system works by injecting a urea solution into exhaust gas and converting this to NH3 and CO2. The injection, mixing, and NH3 conversion reaction behavior of the urea-water solution all have a decisive effect on the performance of the system. To improve de-NOx efficiency, it is important to provide enough time and distance for NH3 conversion and uniform distribution prior to the solution entering the catalyst. In this study, therefore, the characteristics of gas flow, NH3 conversion, and its distribution are investigated with a static mixer by means of numerical methods, providing a special advantage to ship manufacturing companies through the optimization of the urea-SCR system. The results show that the inclusion of the mixer induces strong turbulence and promotes the NH3 conversion reaction across a wider region compared to the case without the mixer. The mean temperature is 10 °C lower due to the activated endothermic urea-NH3 conversion reaction and the NH3 concentration is 80 PPM higher at 1D than those without the mixer. Moreover, the uniformity of NH3 distribution improved by 25% with the mixer, meaning that the de-NOx reaction can take place across all aspects of the catalyst thus maximizing performance. In other words, ship manufacturing companies have degrees of freedom in designing post-processing solutions for emissions by minimizing the use of the reduction agent or the size of the SCR system.
1. Introduction
Environmental pollution caused by marine ships has recently emerged as an international issue and as a result since 1 January 2016 the International Maritime Organization (IMO) has applied Tier 3 regulations for diesel engines keel laying at the NOx emission control area (NECA) [1]. The regulations introduce stringent NOx emission and reduction targets for most marine ships employing diesel engines vulnerable to emission problems due to the high temperature of combustion in engines. Thus, companies and research centers related to marine ships have developed several techniques to reduce NOx emissions and have applied these technologies on ships. The best option is controlling combustion directly, which is economically advantageous but requires high and sensitive levels of technologies. Selective catalytic reduction (SCR) and lean NOx traps (LNTs) are the most popular post-processing methods in reducing NOx emissions. LNT is economical and easy to apply because it can control NOx emissions only by process control without a separate reductant supply, but there are some problems related with the method such as durability and worsening fuel efficiency [2]. The urea-based SCR system is an effective and reliable technology for controlling NOx emissions from heavy-duty engines [3,4]. Urea has an advantage as a reducing agent because it is carried as a liquid and is safe. For marine systems, generally a 40% aqueous solution is used, and the urea solution is injected into the reaction area. The issued urea solution is converted into water and nitrogen with NOx gases that are harmless to the human body through catalysts. Since the urea-SCR system shows high de-NOx efficiency and durability, various research has been performed on this method over the last decades.
Johnson et al. studied de-NOx characteristics in marine diesel systems [5]. They investigated correlations between system parameters and NOx rates, as well as NH3 slip. They revealed that higher reductions were achieved during transient cycles and were attributed to the lack of idle time and NH3 storage capacity of the catalyst. Zheng et al. emphasized the necessity of adding a mixer to the urea-SCR system [6]. They summarized the development status of multiple mixers that have demonstrated excellent overall performance with experiments and CFD techniques. They proved that mixers distribute quantifiably performance benefits to the system. Prabhu et al. experimentally investigated deposit formation and its rate through the use of stainless-steel foils, considering temperature and flow rate as variables [7]. Meanwhile, the evaporation characteristics of urea droplets have been analyzed by means of numeral calculation.
Recently, many numerical approaches have been employed for urea-SCR systems due to experimental difficulties. Zhu et al. investigated major design properties of pressure loss and uniformity characteristics in flow velocity and species concentration with a vaporizer and a mixer in a high-pressure marine SCR system using numerical modellings [8]. Strom et al. tested various urea-spay models in a CFD simulation of urea-SCR systems in marine ships [9]. They found that the forces created by drag and buoyancy are necessary to correctly describe droplet motion within this system. Sung et al. analyzed the effect of swirl-type mixers and mixing chambers on NOx conversion efficiency in a marine system for an optimized compact design [10]. They evaluated flow characteristics and parameters of de-NOx conversion for each case. This group analyzed the synergistic effects of mixers and a mixing chamber on flow mixing and NOx reduction for a marine urea-SCR system [11]. They showed NH3 conversion characteristics and de-NOx rate with flow characteristics in varying mixing conditions. Lee and Park investigated the internal flow characteristics of injectors in a urea-SCR system [12]. They analyzed the discharge characteristics of two different injectors and revealed that the stability of the injection quantity can be described by discharge coefficients.
Many studies have been performed to clarify the operating characteristics of urea-SCR systems, but thus far they have been insufficient in allowing an understanding of the complete physics of the systems, especially for marine diesel engine systems. To improve de-NOx efficiency in these systems, understanding both slip and NH3 conversion rates before substances enter catalysts is important. Therefore, in this work, the improvement of a 2MW class urea-SCR system with a static mixer is analyzed by means of computational analysis techniques. The present study employs the uniformity index (UI) to analyze the spatial uniformity of the ammonia concentration flowing into the catalyst layer, and the flow velocity. From the results, we can distribute the design data for the optimization of the urea-SCR system to researchers working in related industrial fields.
2. Numerical Simulation
2.1. Models and Boundary Conditions
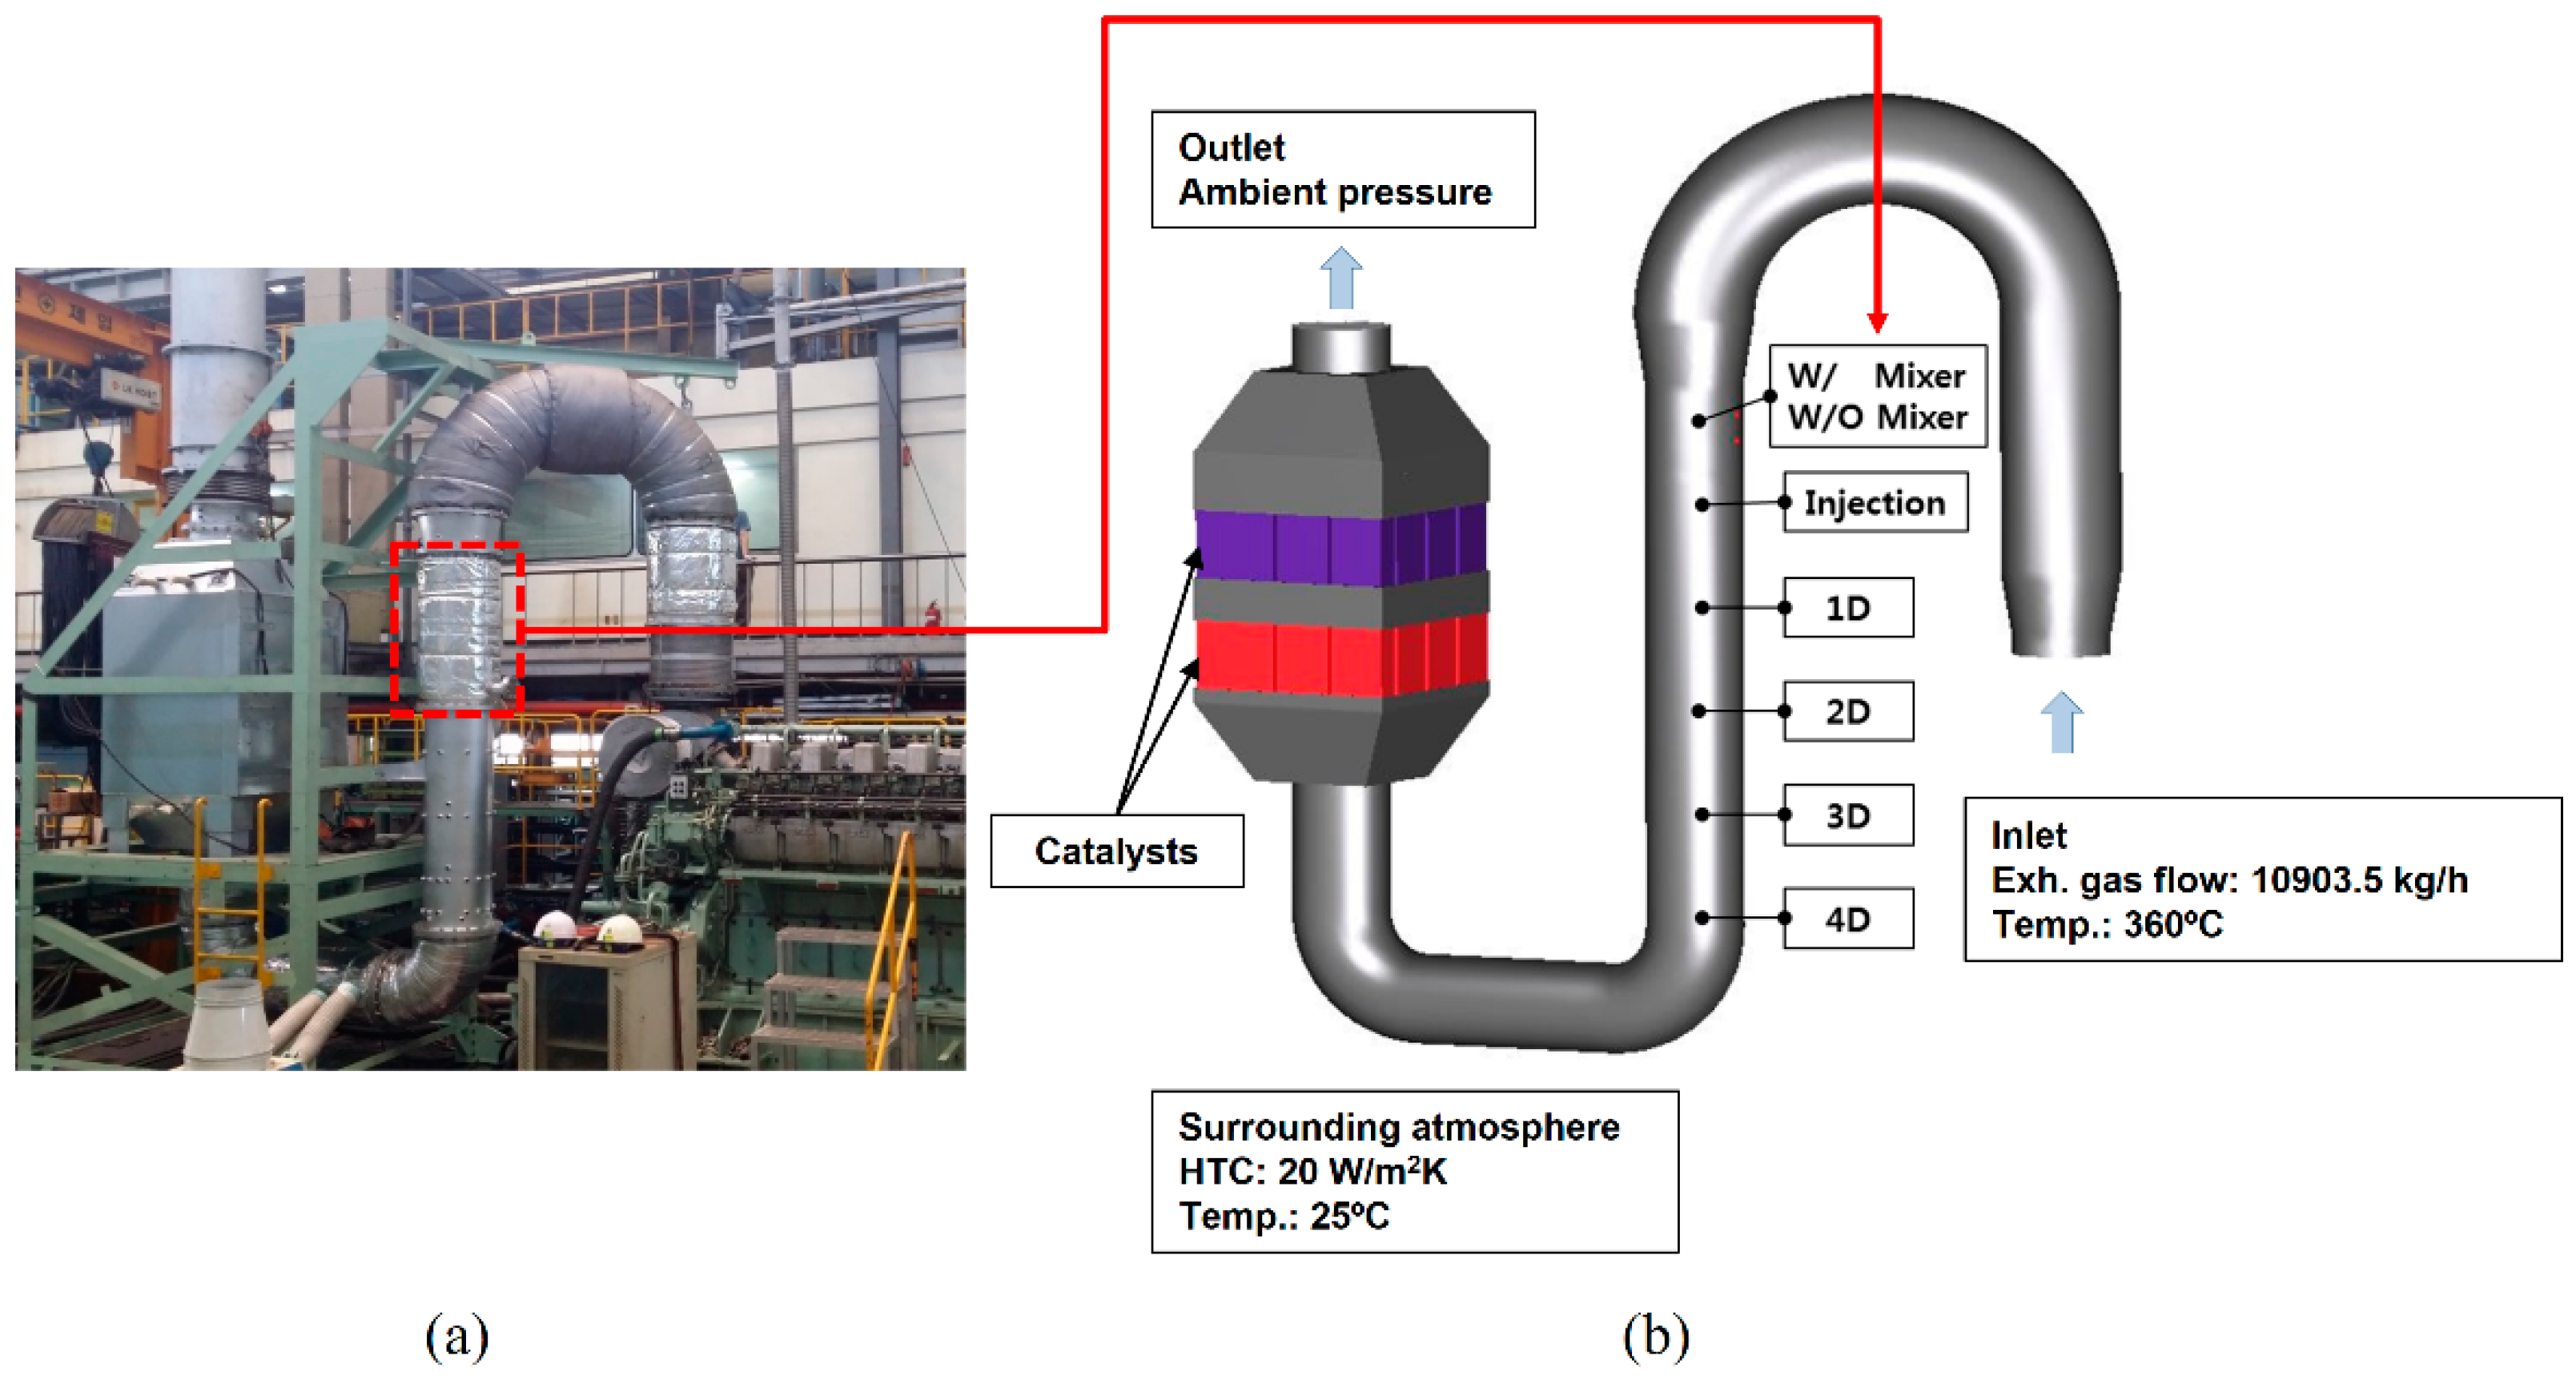
The spraying and mixing characteristics of urea droplets with a static mixer are investigated in a marine engine system by means of a numerical approach, AVL FIRE ver. 2014 (AVL List GmbH, Graz, Austria) which is a CFD code developed based on the finite element method. The actual 2MW class of marine urea-SCR system modeled has been developed by the STX company and used in their marine ships. The modeling is performed by the Pro/E program. The numerical grid is generated using the FAME Hybrid Assistant technique in the AVL FIRE program [13]. The generated mesh is comprised of 90% hexahedron cells and 10% tetrahedron cells, consisting of 1.7 and 0.9 million cells with and without the mixer, respectively. To simulate turbulence, the k-zeta-f model is applied by taking into account the complexity of U-shaped tubes and the mixer. The SCR catalyst is treated as a porous media. The permeability and inertial resistance characteristics of the device are described by the porous model, while the pressure drop through the part is calculated by the Forchheimer model. The boundary conditions are set to the consistent values provided from the experiment in terms of temperature, pressure, and flow rate, as presented in Figure 1 and Table 1.
2.2. Urea-SCR Reaction Mechanism
In the urea-SCR system, issued droplets are first evaporated, and then converted to NH3 and iso-cyanic acid (HNCO) via thermolysis in the front of the catalyst layer. The produced HNCO is then changed to NH3 and CO2 through an exhaust gas pipe by hydrolysis reaction. The generated NH3 is adsorbed by the substrate of the catalyst and can decrease NOx in exhaust gases [14].
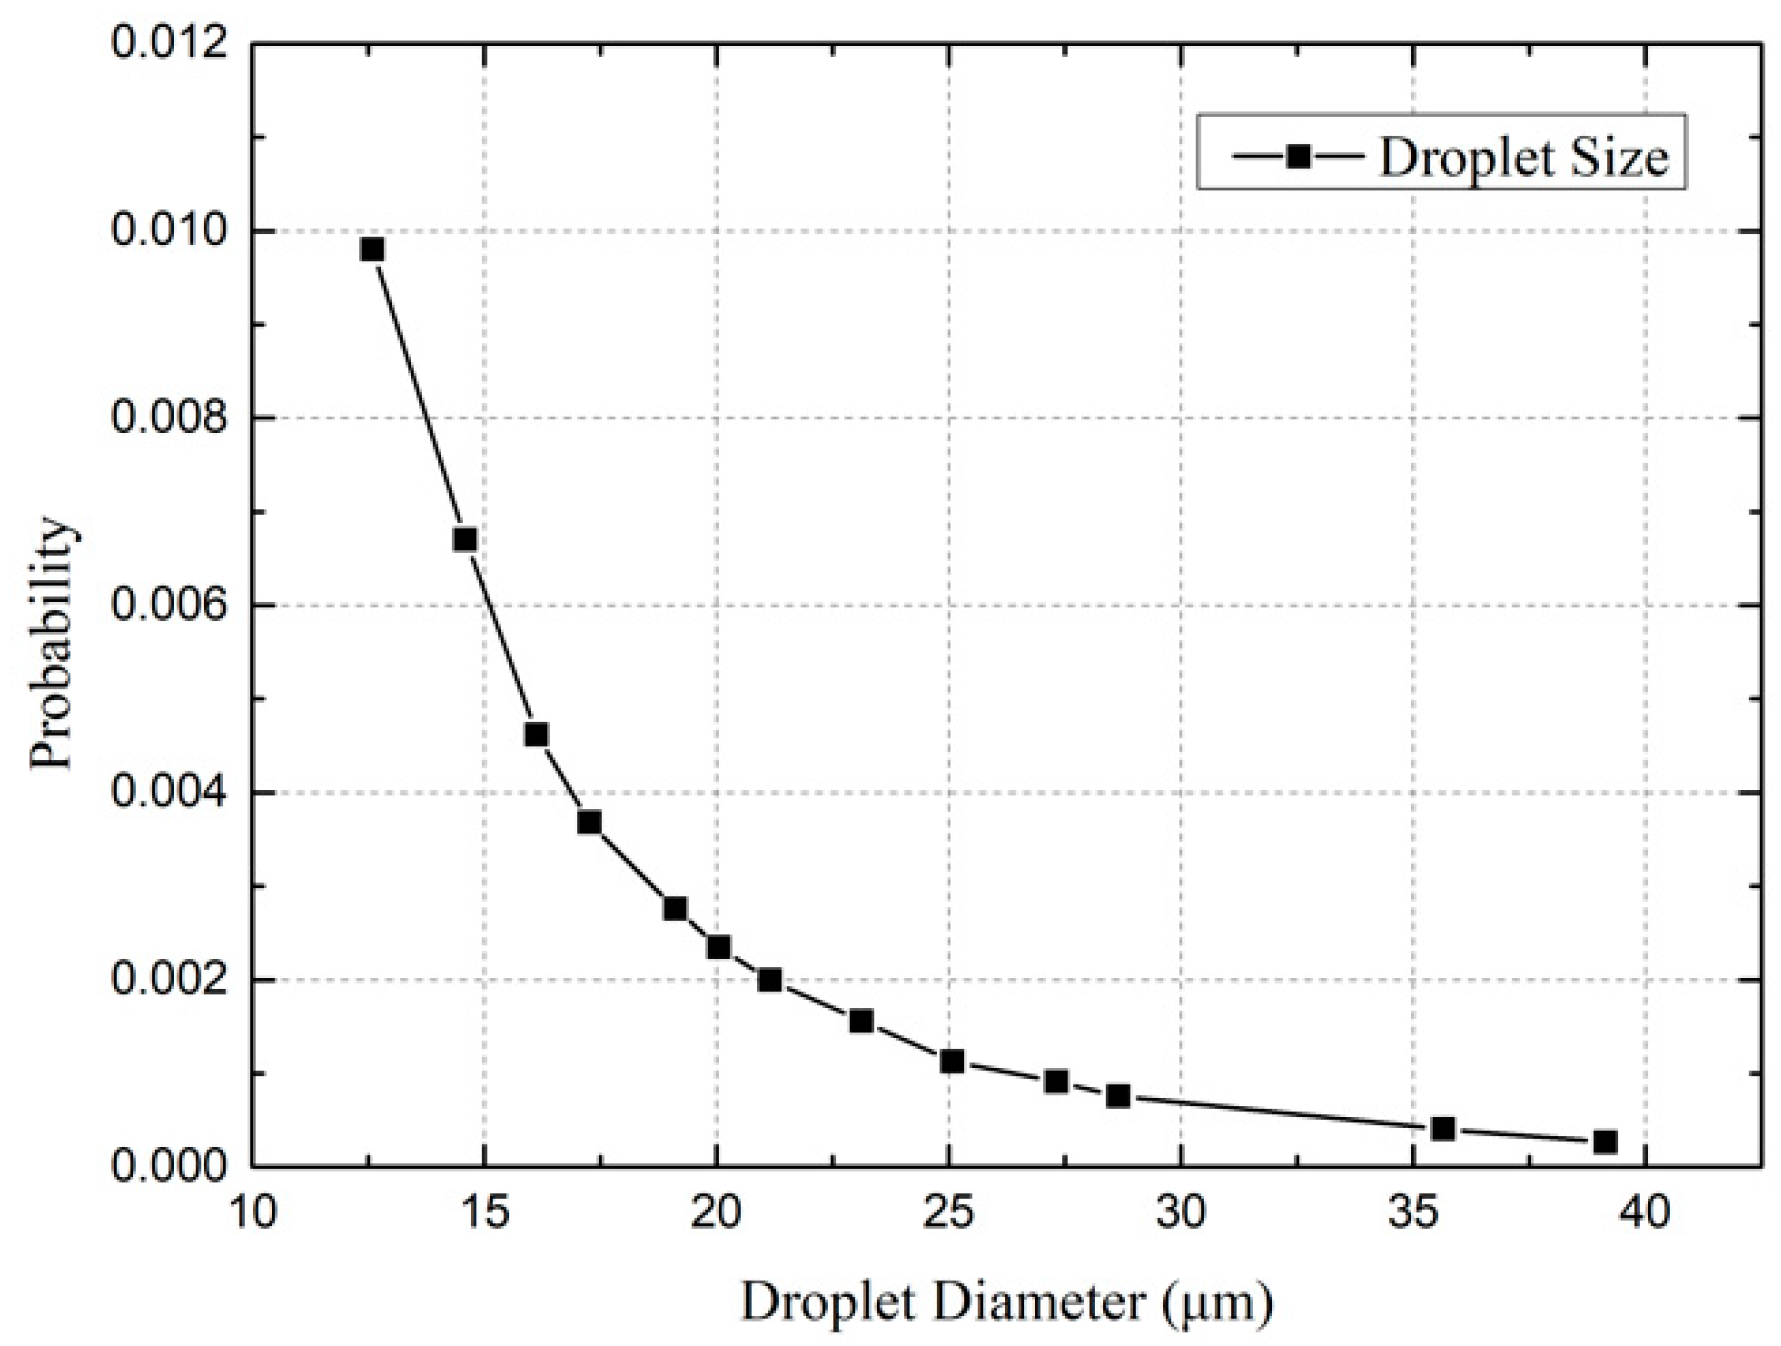
To describe the injection and atomization of the urea aqueous solution, the Spay model in the AVL FIRE program is introduced. Since this model calculates continuous materials using the Eulerian method and droplets are solved by Lagrangian manner, it is suitable for this two-phase calculation [13]. To solve the movement of droplets in the urea-SCR system, major parameters provided from the manufacturer are applied on the program such as a single-phase type of injector, droplet distributions, evaporation distance, and Sauter mean diameter (SMD). The operation details of the injector used in this study are presented in Table 2. The droplet size distribution issued by the injector is investigated using a test facility (Spraytec, Malvern Panalytical) in the Korea Institute of Machinery & Materials (KIMM). The test was performed for 10 times, and the averaged values are presented in Figure 2.
The evaporation and thermolysis of the droplets are simulated using the SCR-thermolysis model defined by Brikhold et al. [15]. Since the evaporation is affected by the size of droplets and ambient temperature, information regarding the injector is important. Thus, we refer all details of the injector used in the experiment in Table 2. The thermolysis can be presented as a single step reaction, as presented in Equation (1). This equation is temperature dependent, and generally works in the temperature range of 200–300 °C. The hydrolysis reaction, presented in Equation (2), is calculated as a general gas phase reaction using CHEMKIN chemistry [16]. The thin wall model is applied to describe wall film, convection, and radiation at the wall by taking into account the stacked urea droplets [17].
Thermolysis: (NH2)2CO → NH3 + HNCO
Hydrolysis: HNCO + H2O → NH3 + CO2
2.3. Uniformity Index
The urea-SCR system is estimated using UI developed and presented by Welterns [17], as shown in Equation (3).
where n is total number of cells, and Agas and Ai denote a cross sectional area and a cell area, respectively. Φ signifies a considered values such as velocity, NH3, mass flow rate, and so on. Thus, the uniformity index approaches unity meaning that the Φ is close to uniform, which is an important design factor for determining the purification efficiency in mixed properties and catalysts.
2.4. Validation
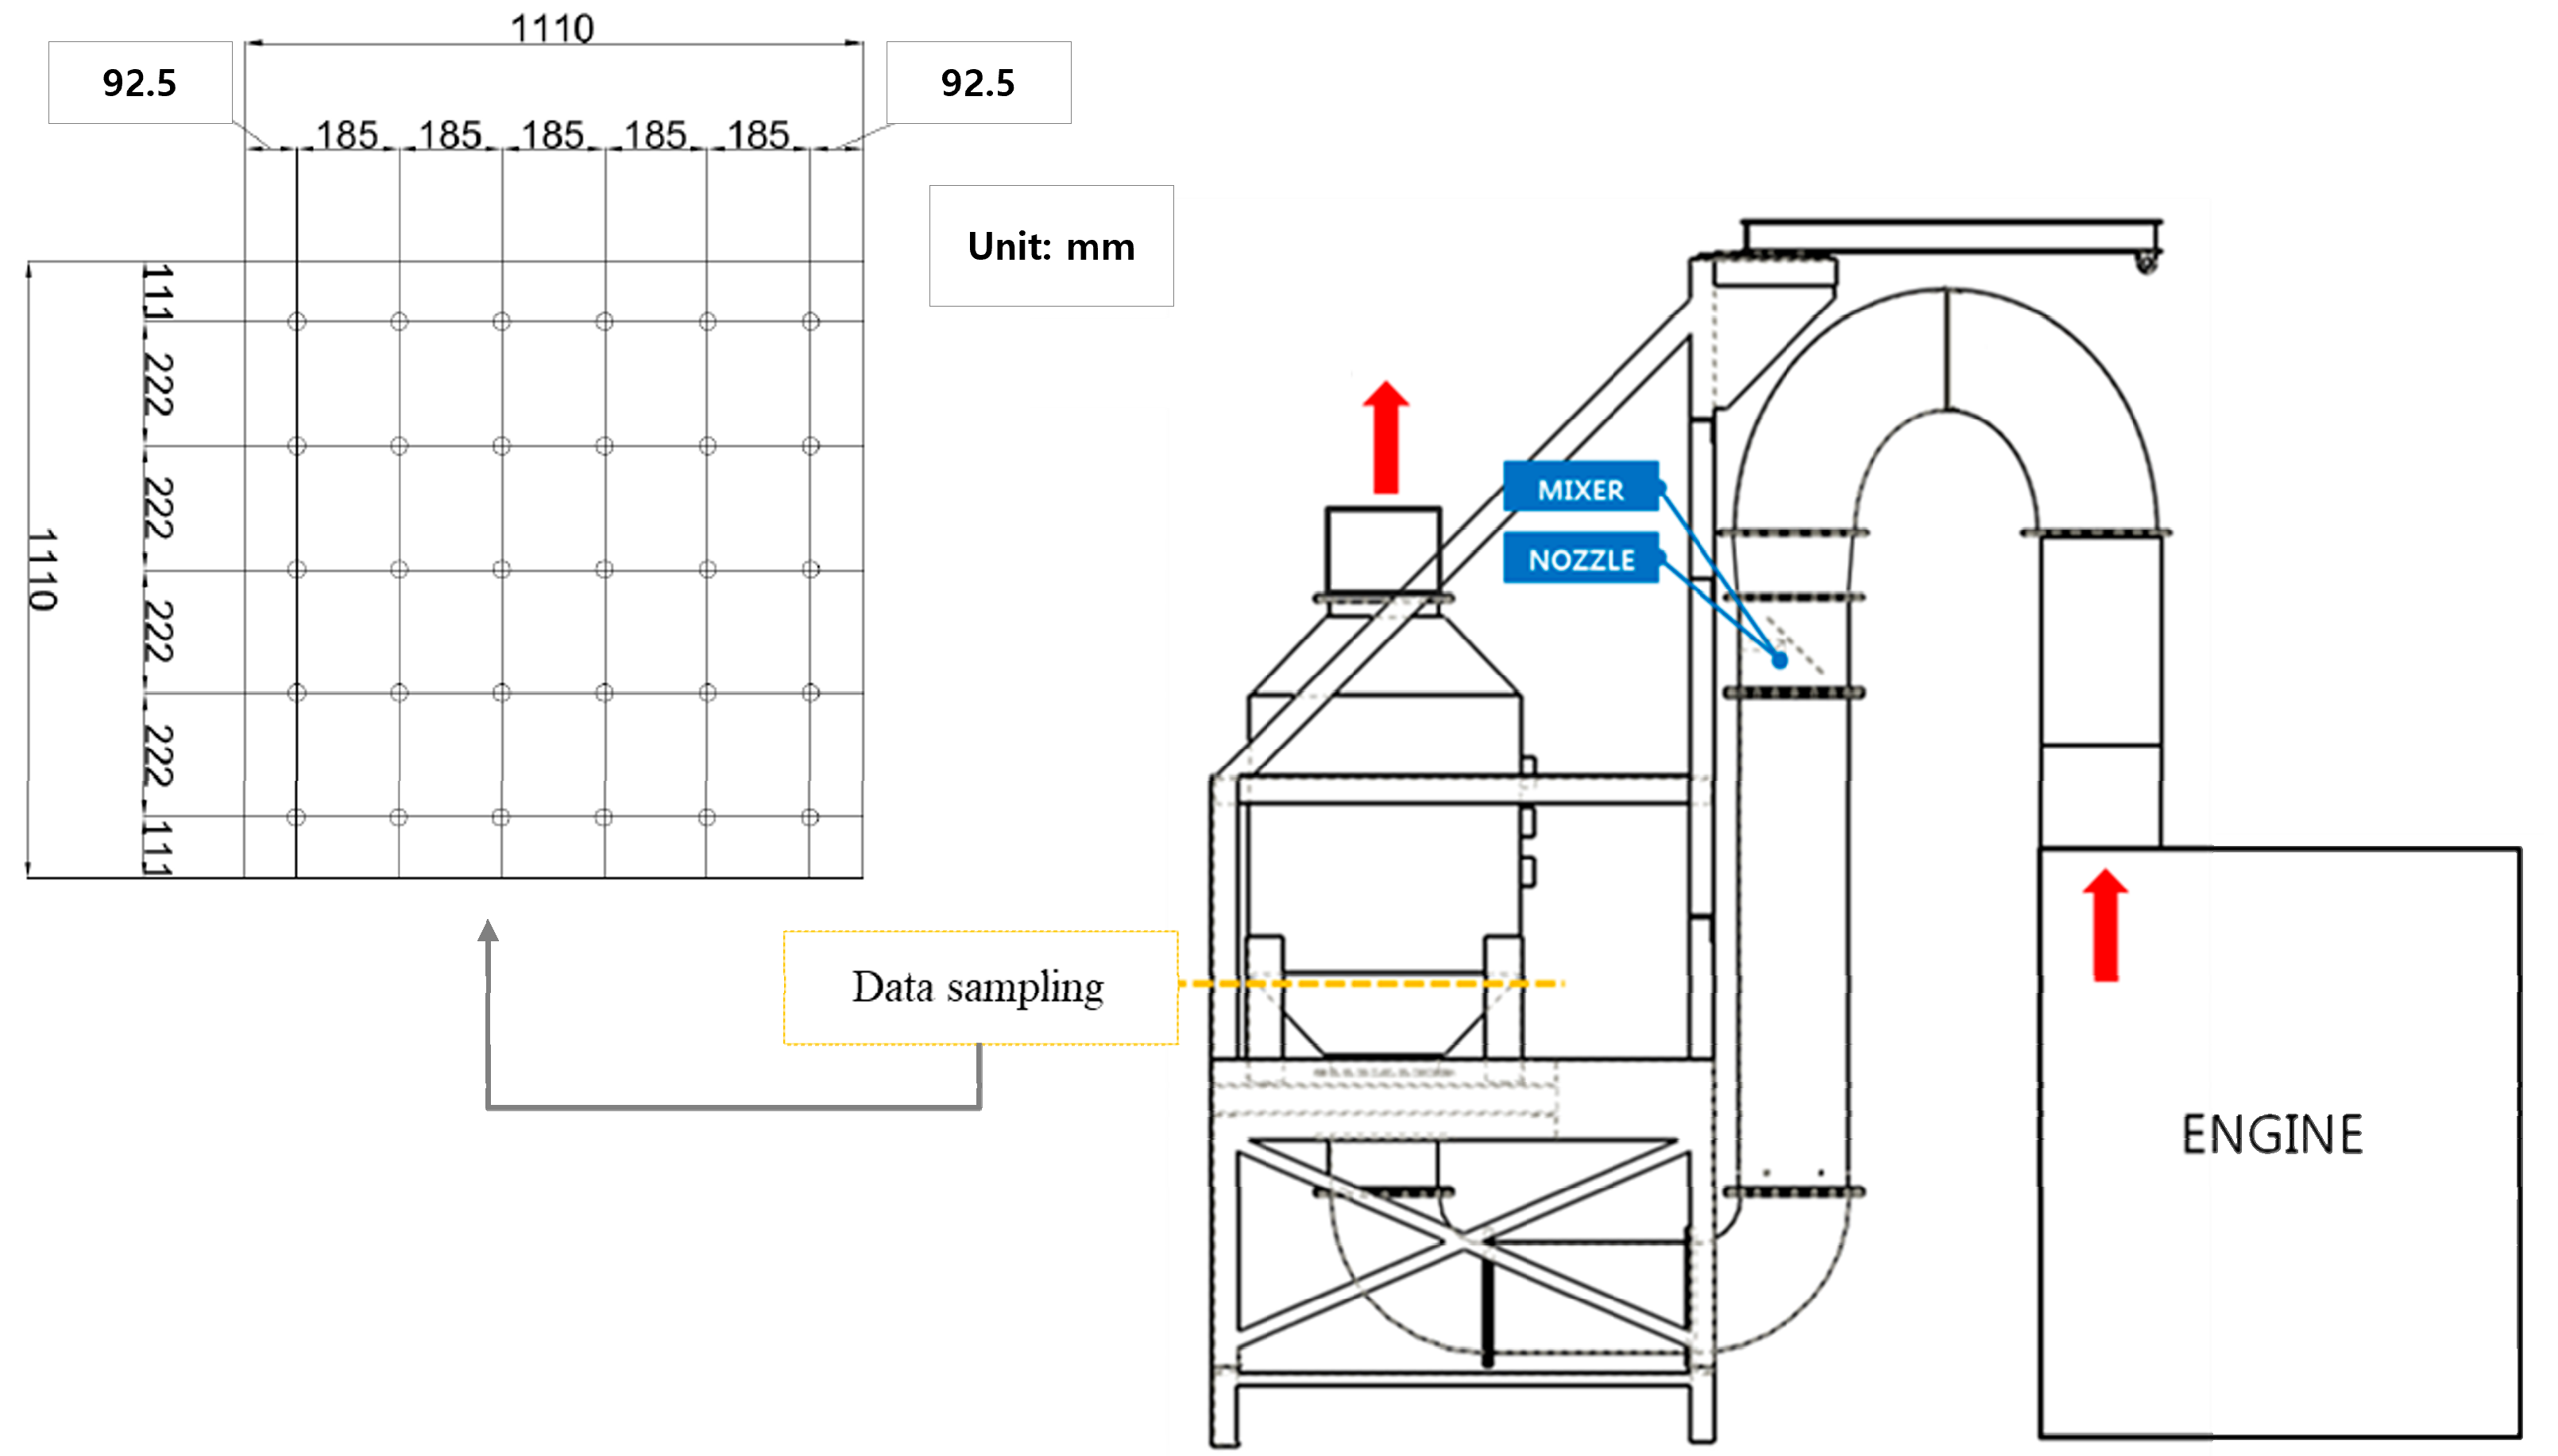
The simulation is validated with the comparison of UI distributions of NH3 + HNCO at the system, as presented in Figure 3. The NH3 + HNCO concentration is measured at the horizontal cross-section at the inlet of the first catalyst, and the simulation results are acquired at consistent positions. The measurement is optimized by avoiding gases interacting with each other. The result is arranged in Table 3. The UI of the gas concentration is changed with number of sampling points, but all cases show good agreement of over 90%. Thus, we believe that the simulation can describe the flow characteristics of the system properly.
3. Results and Discussion
3.1. Flow Characteristics of SCR System
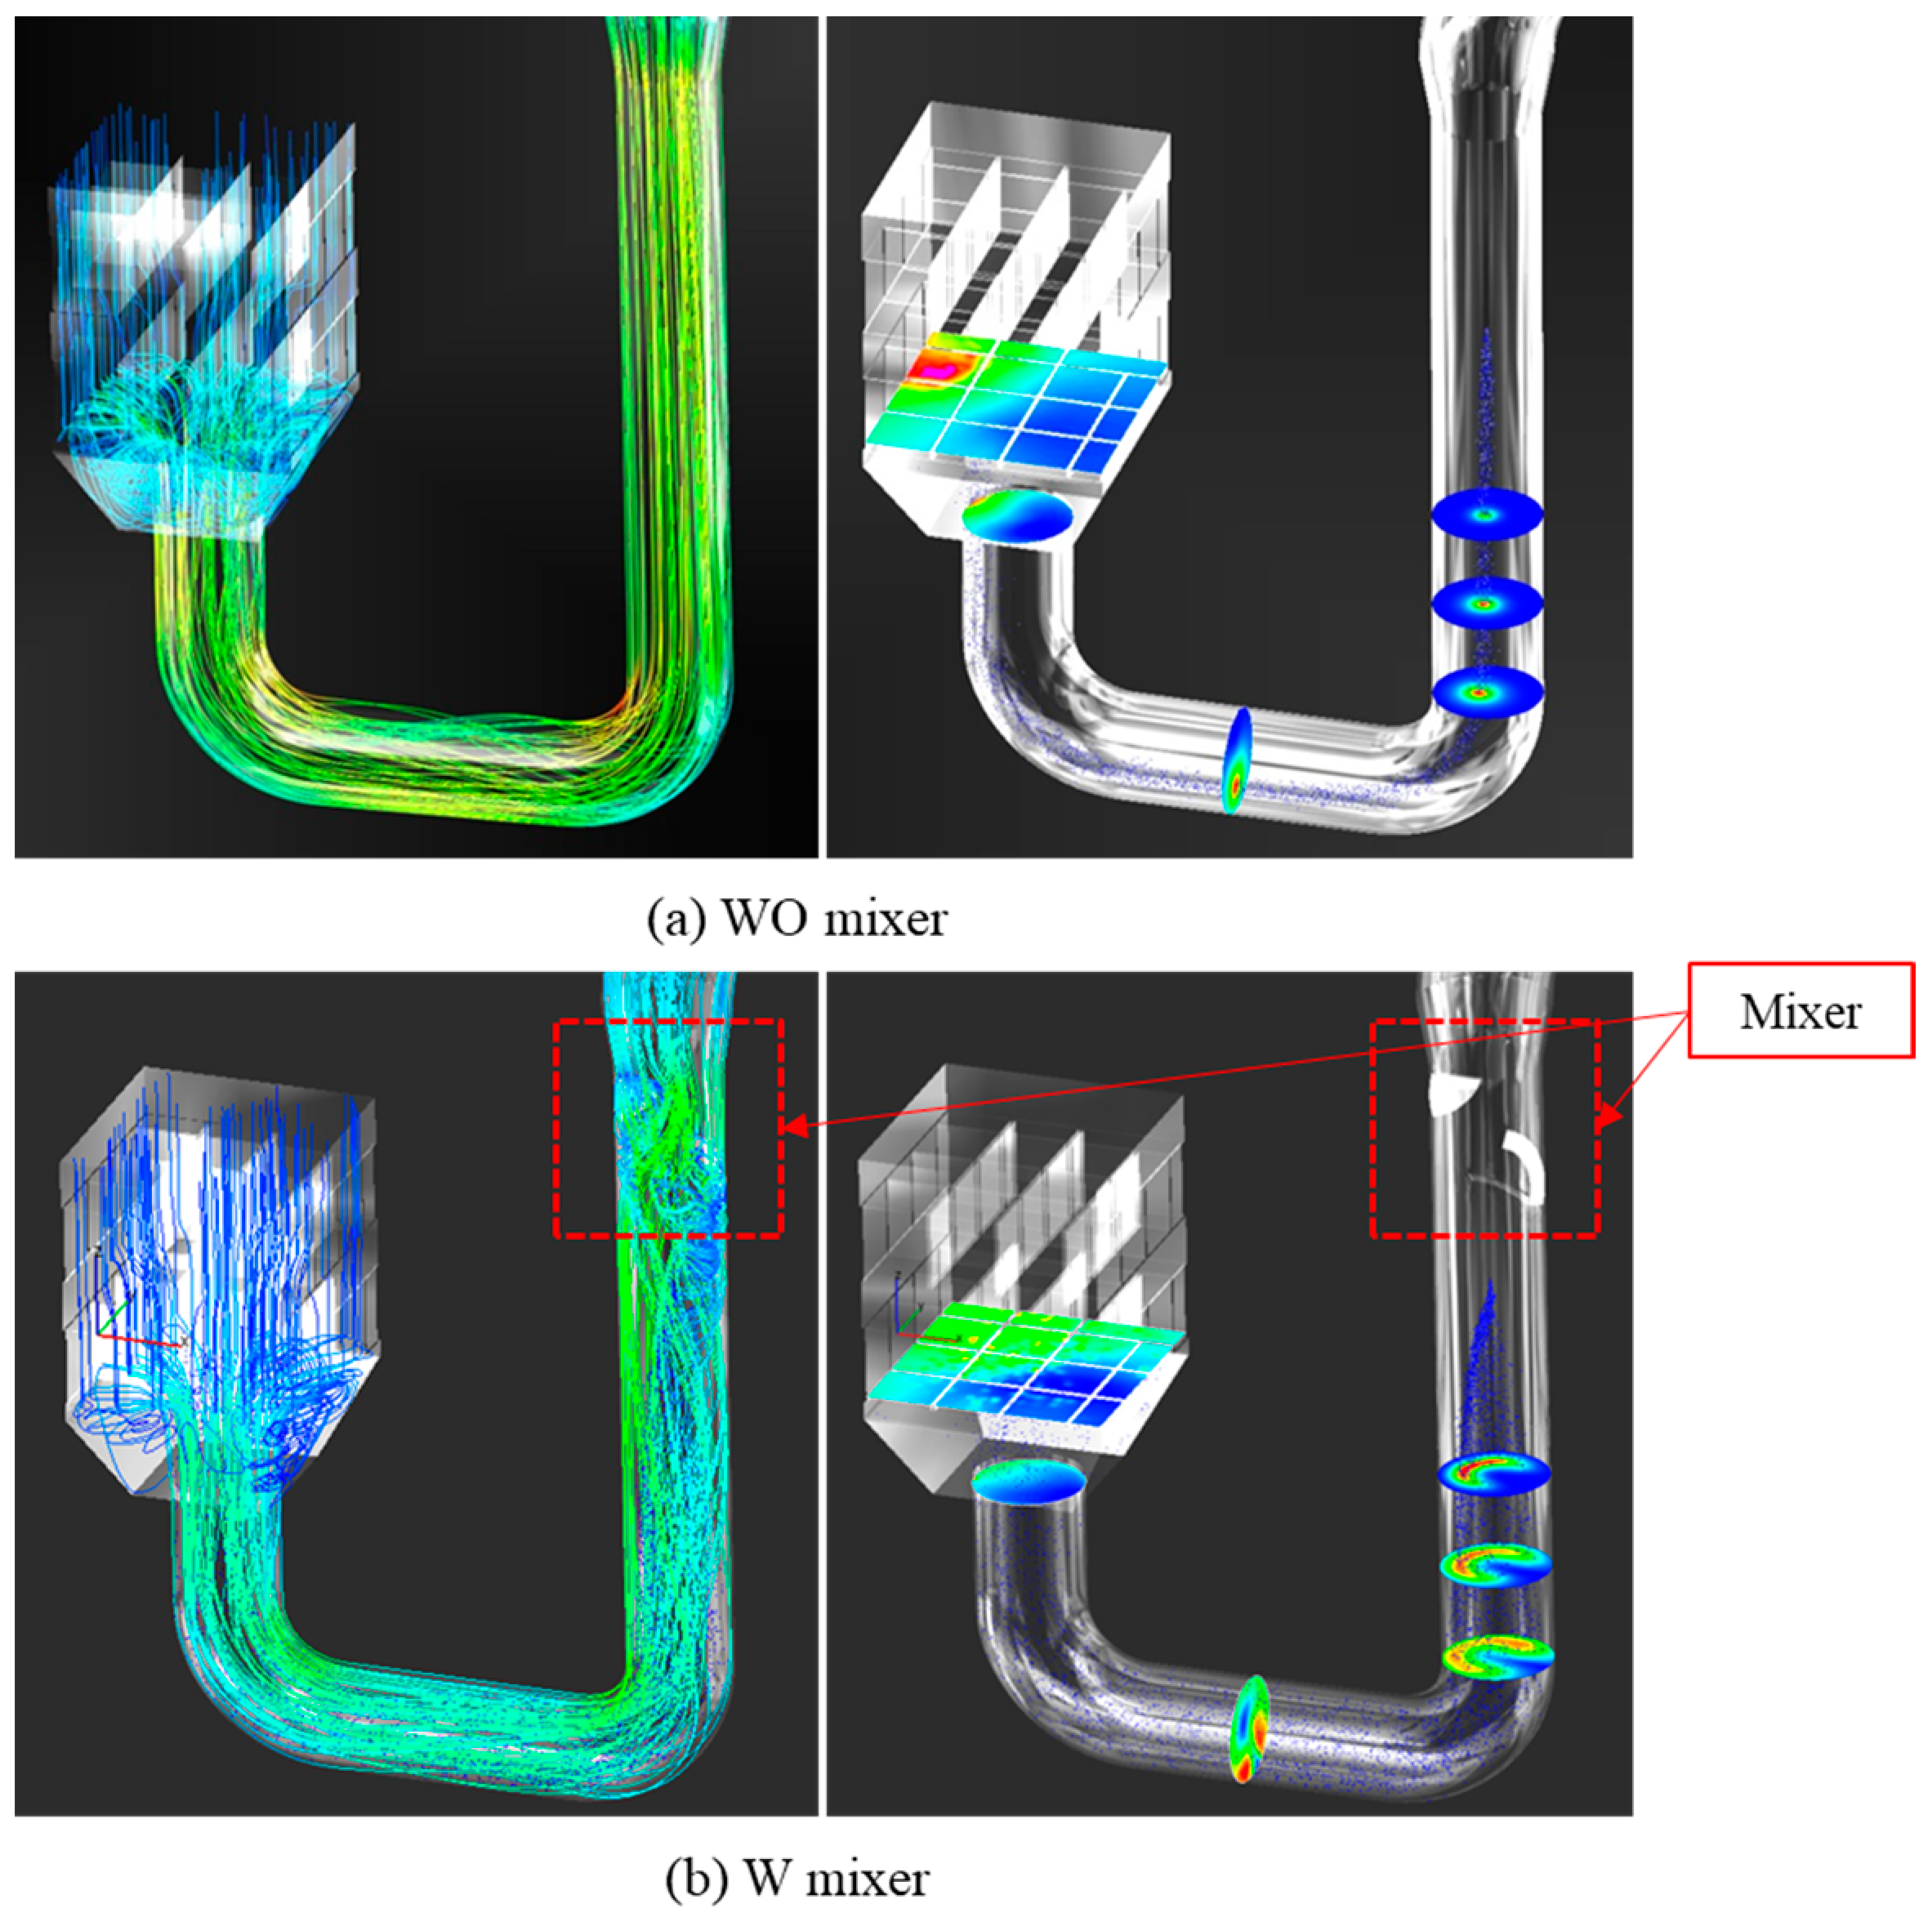
Figure 4 shows the characteristics of inner flow and droplet distribution in the whole SCR system in terms of the existence of the mixer. The results show that the mixer generates strong turbulence at the mixing area and reduces the axial velocity of the fluid, whereas the flow is almost laminar without the mixer. The increased tangential and swirl movement due to the mixer improve the mixing ratio between urea droplets and exhaust gas. Thus, the increased residence time of the flow and mixing effect provide more time for evaporation and the conversion rate of urea and the uniformity of NH3 increases by passing through the exhaust gas pipe. However, since strong turbulence increases droplet deposition on walls and leads to performance loss in the system, it is important to design an appropriate mixer by considering these points [18]. Without the mixer, laminar flow tends to concentrate urea droplets to the central flow of the pipe, as shown in Figure 4a. The mixing effect between urea droplets and exhaust gases decreases, and hence the biased reductant lowers de-NOx efficiency by restricting evaporation and the thermolysis reaction.
A recirculating flow pattern is observed at the SCR system in both cases, with and without the mixer, attributable to the shape-characteristic at the diffuser and the surface resistance of the catalyst, as presented in Figure 4, however it is weakened with the mixer. Since the recirculating flow has a significant impact on the velocity UI and the disruption of the steady and stable supply of NH3 to the catalyst, it is important to minimize the recirculating or backflow.
3.2. NH3 Conversion Characteristics
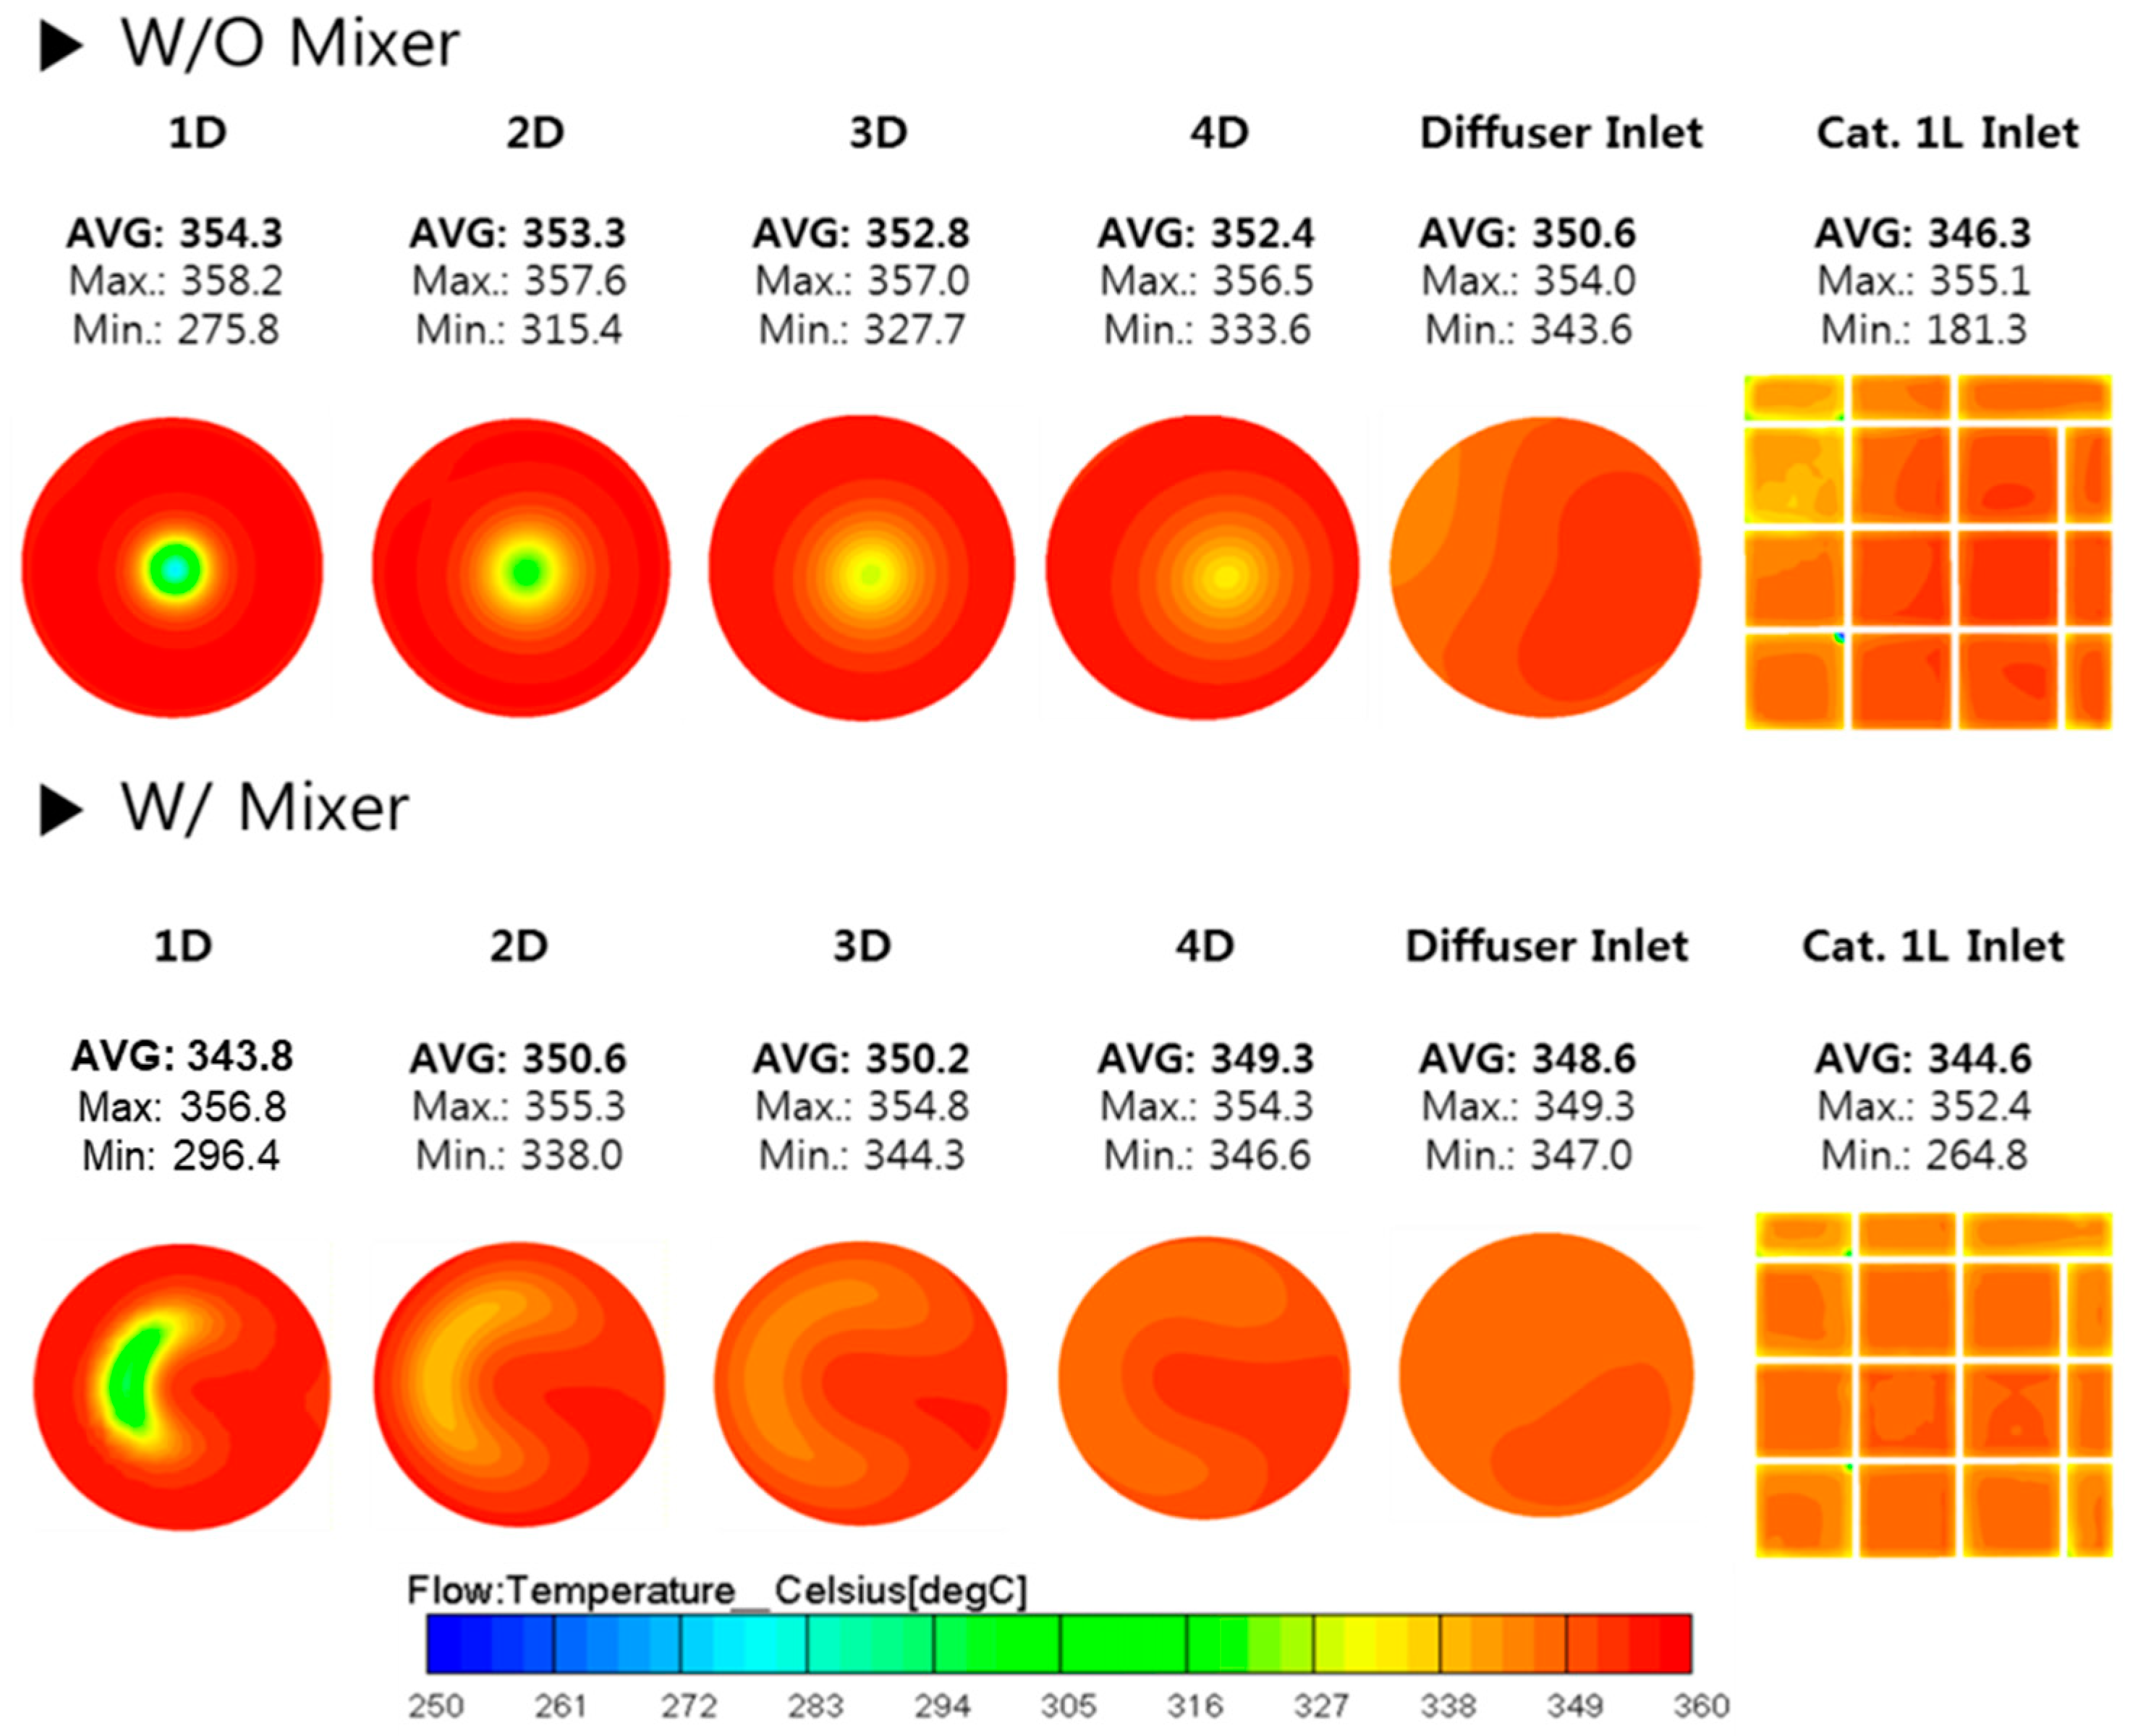
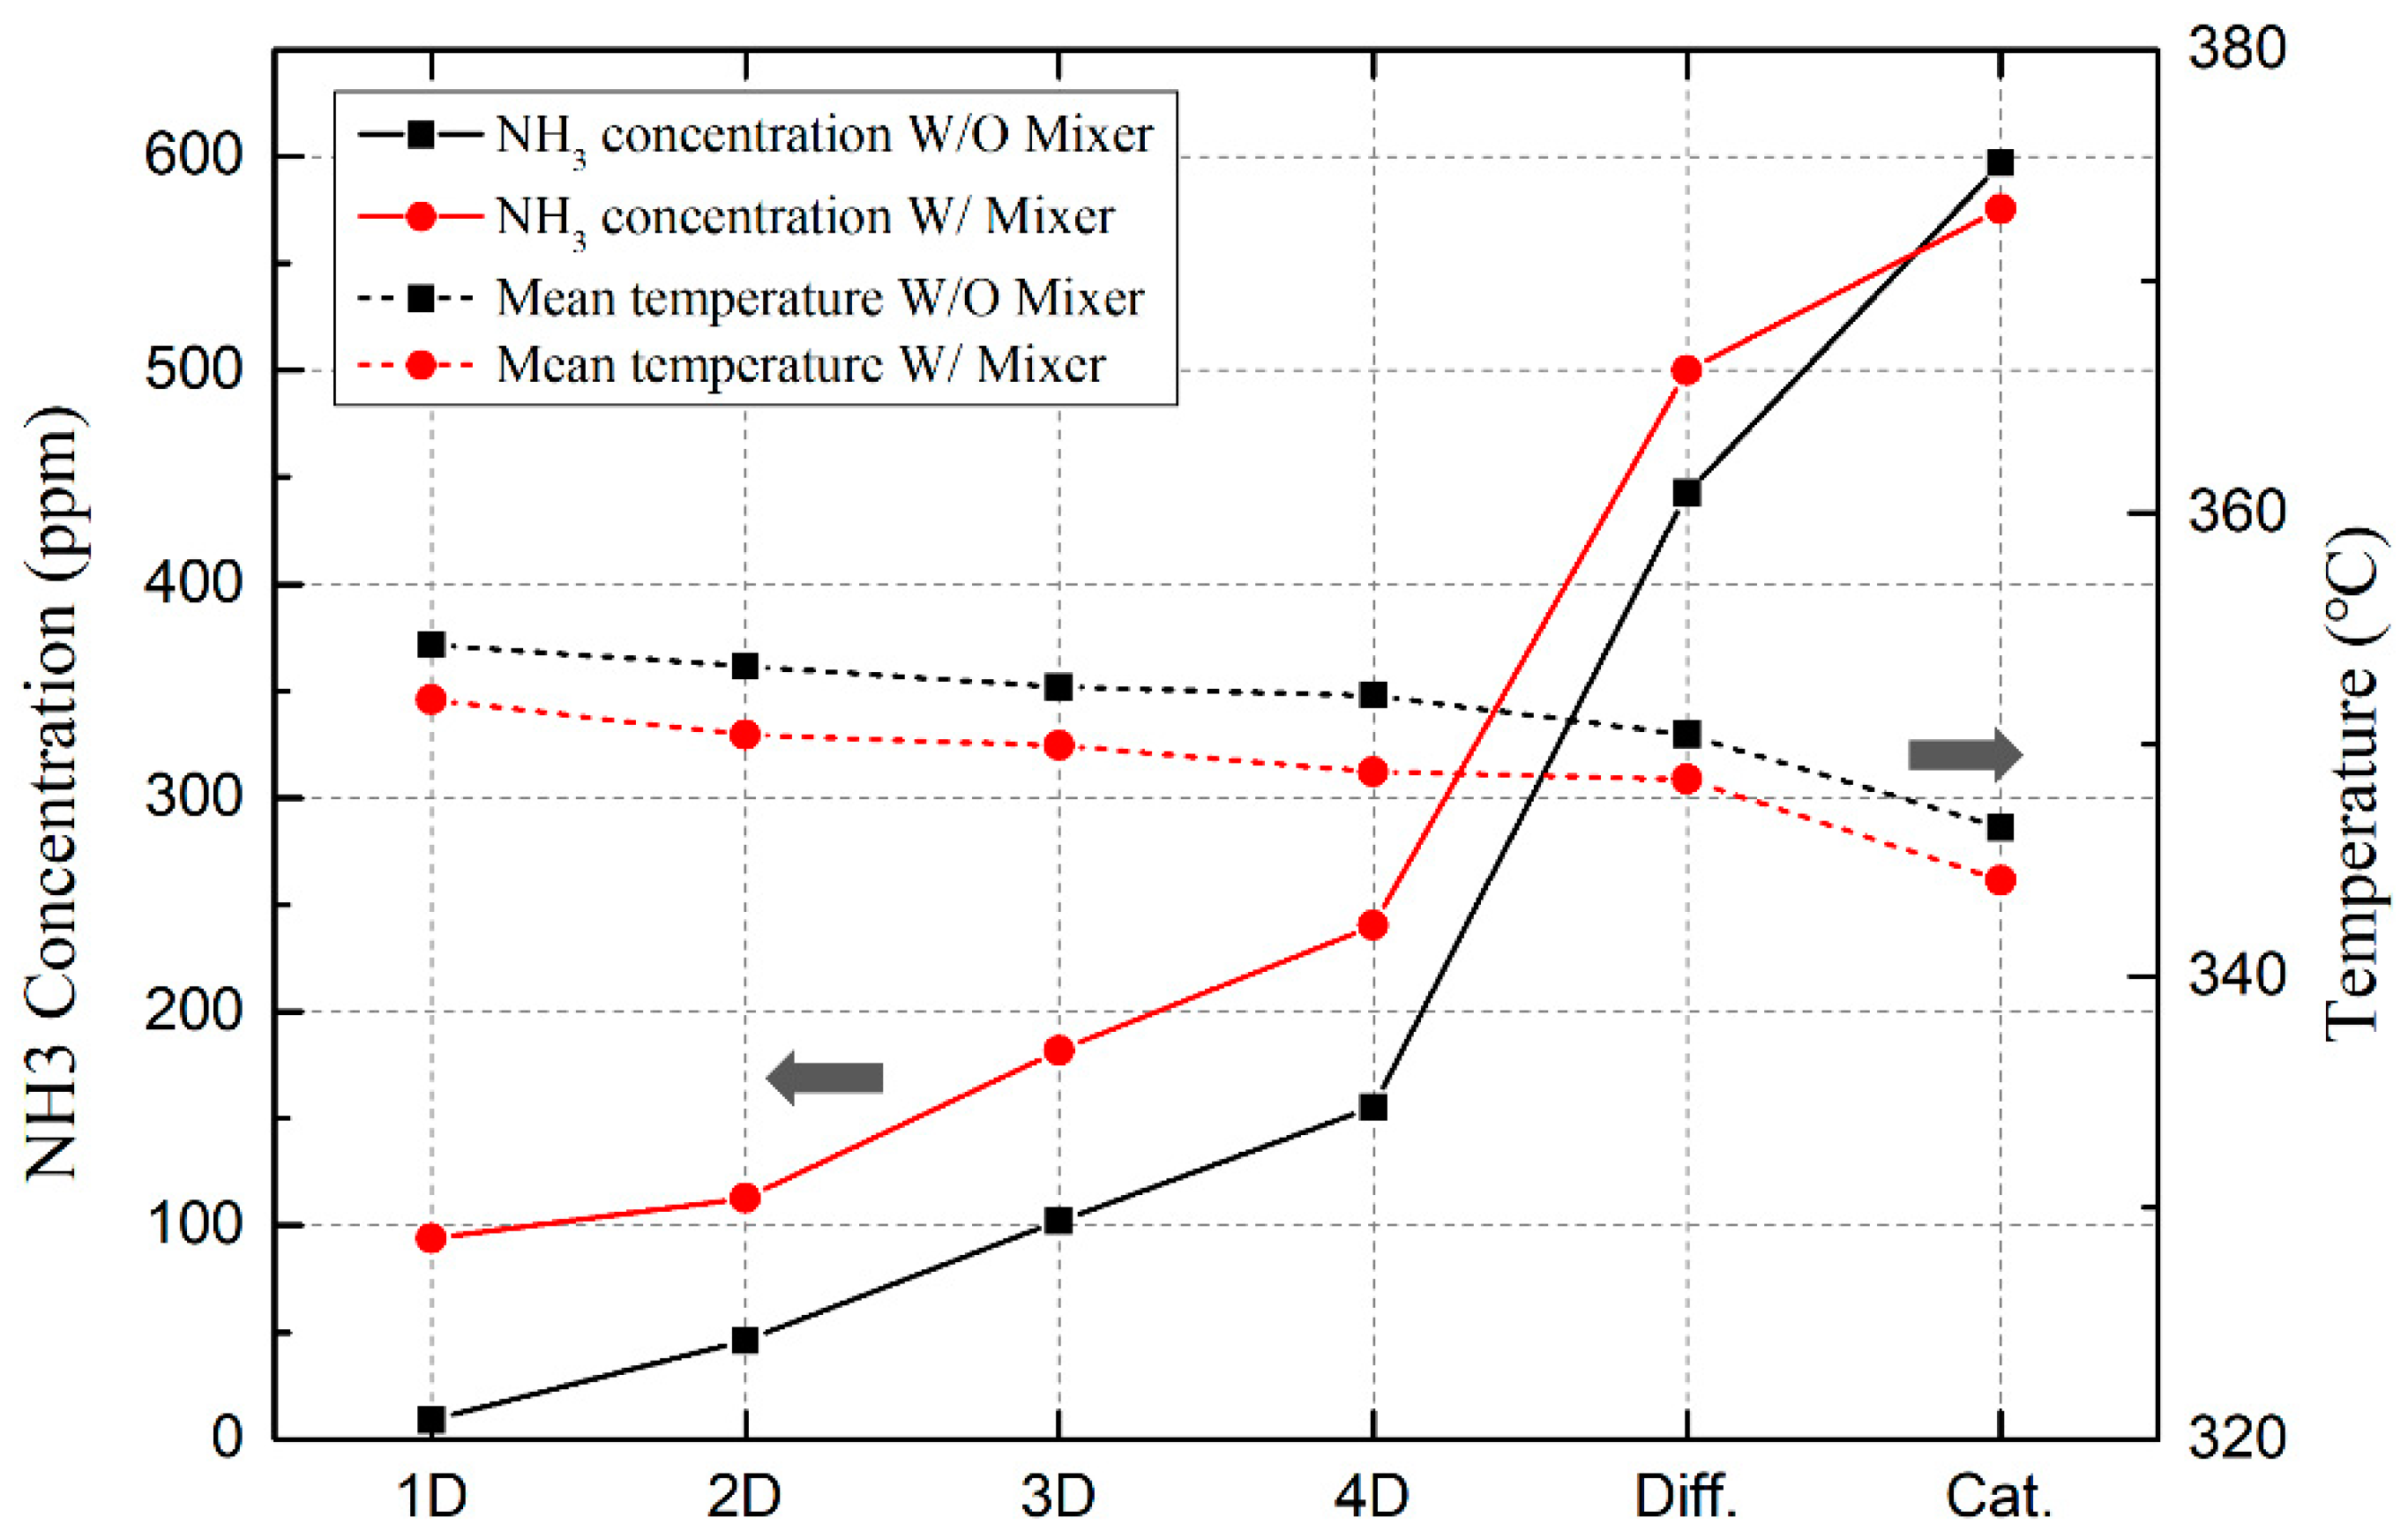
The NH3 conversion characteristics of urea droplets are investigated. Figure 5 presents the mean temperature distribution in the reaction region of the SCR system with the injection of urea droplets. As shown in the figure, the temperature drops with the injection of the urea, and the mean temperature is 343.8 °C and 354.3 °C with and without the mixer at location 1D, respectively. This is about 16 °C and 6 °C lower than the inlet temperature (Tinlet: 360 °C) with/without the mixer, due to evaporation and endothermic thermolysis. The temperature decreases further by 10 °C with the mixer compared to without, demonstrating that the mixer induces strong turbulence and hence the evaporation and endothermic thermolysis are promoted. The mean temperature distribution shape becomes wider at an earlier location with the mixer, signifying that the evaporation and thermolysis take place at wider regions with the mixer. Thus, as is shown in Figure 6, the NH3 concentration is about 80 PPM higher at 1D with the mixer than when the mixer is not present. However, the NH3 concentration becomes similar at locations close to the catalyst with enough time and distance in both cases. That means the mixer can provide a special advantage to manufacturing companies through the optimization of the length of the mixing tube.
3.3. Uniformity of NH3
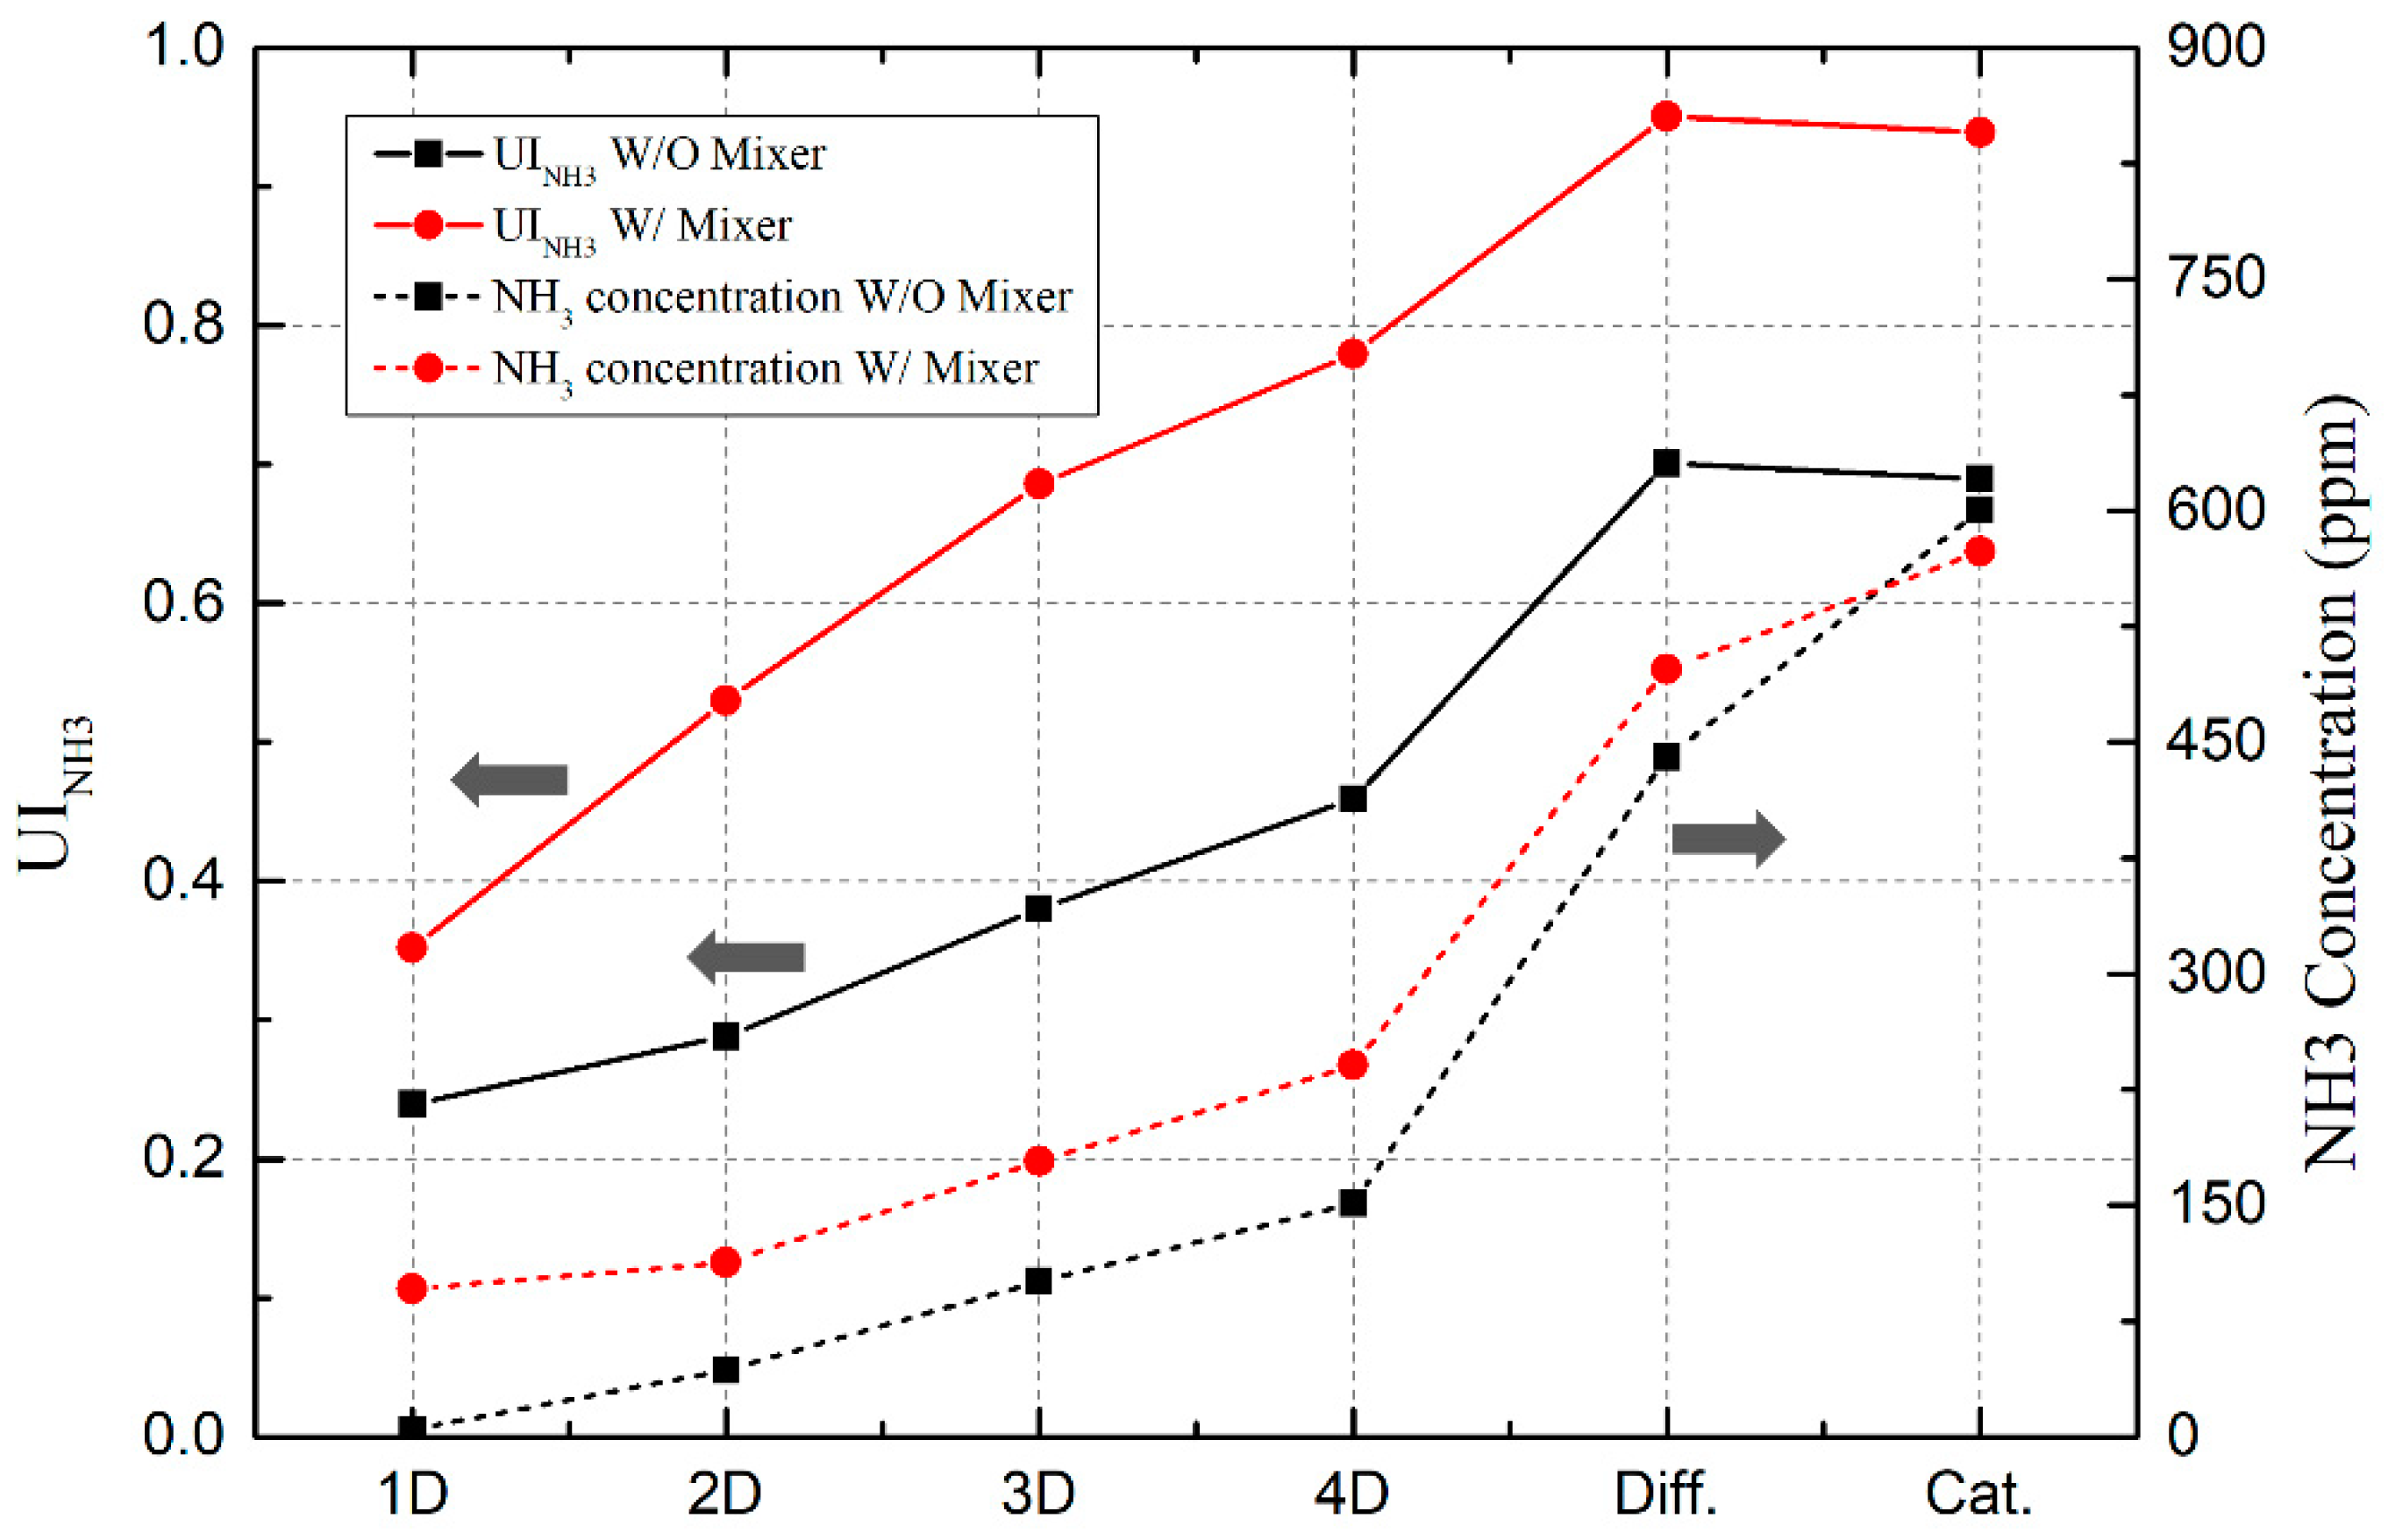
Figure 7 and Figure 8 denote characteristics of the uniformity index of the NH3 concentration (UINH3) with and without the mixer. When the mixer is applied, UINH3 is improved by 25% in front of the catalyst because of the strong mixing effect, evaporation, and thermolysis, as mentioned previously. Figure 7 shows that the NH3 conversion reaction tends to bias from the center to the top left due to the differences in exhaust gas flow velocity attributable to the shape of the mixer. Then, NH3 is distributed almost uniformly at the diffuser by passing two curved pipes.
On the other hand, UINH3 is lower without the mixer because the mixing is limited due to weak turbulence and a strong laminar flow pattern, as shown in the Figure 7. These flow and reaction characteristics lead the NH3 conversion to take place in a limited area, with NH3 is concentrated in the center. Thus, NH3 is not distributed proportionally at the diffuser despite passing two banded pipes. It rather shows a biased distribution at the inlet of the catalyst, resulting in a significant reduction of up to 69% in the UINH3. In other words, the system does not utilize all aspects of the catalyst for the de-NOx process and NH3 does not participate in the reaction and instead flows away (NH3 slip). This works against de-NOx efficiency and causes lower performance despite the inclusion of the proper amount of reductant. In our company, STX, there exists criteria for NH3 mixing using the peak/average ratio. According to our experience, de-NOx efficiency reaches almost 80% and 95% with the peak/average ratios of 2.00 and 1.30, respectively. The peak/average ratios of both cases with and without the mixer are 1.73 and 4.00. Since the standards of the IMO Tier 3 ECA regulations (80% de-NOx efficiency) state that this value be less than two, the mixer is crucial.
3.4. Uniformity of Flow-Field
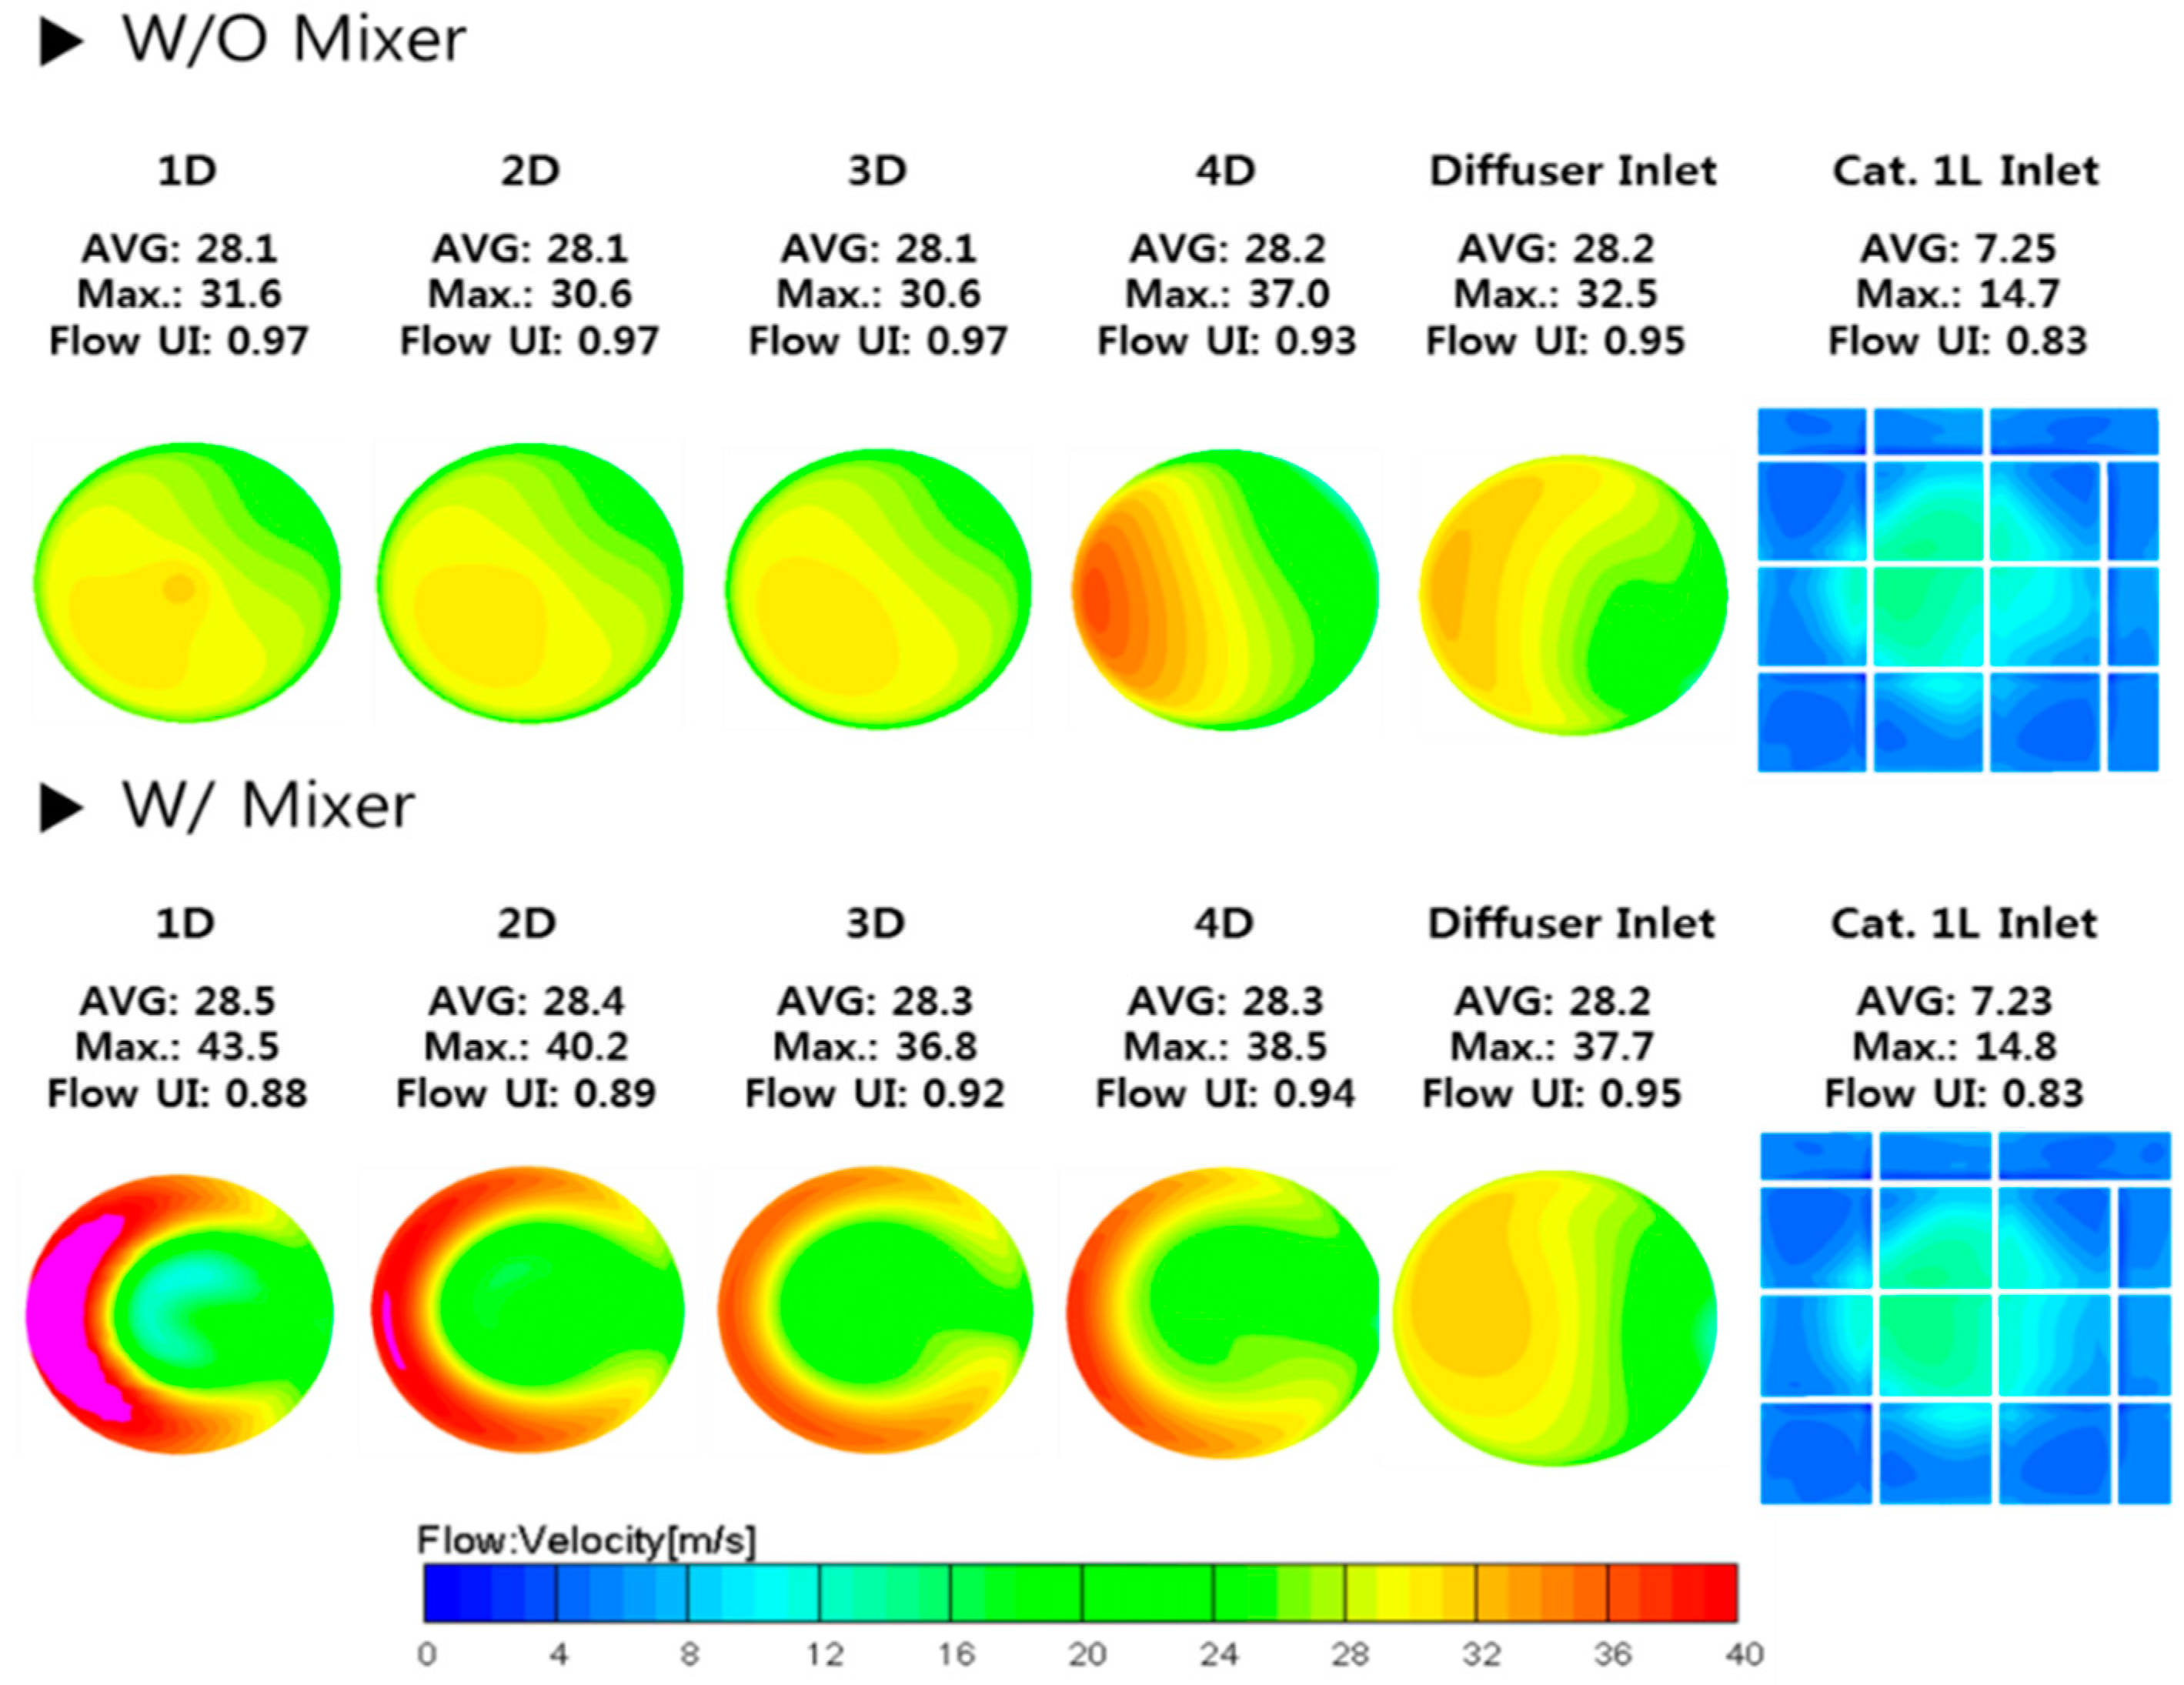
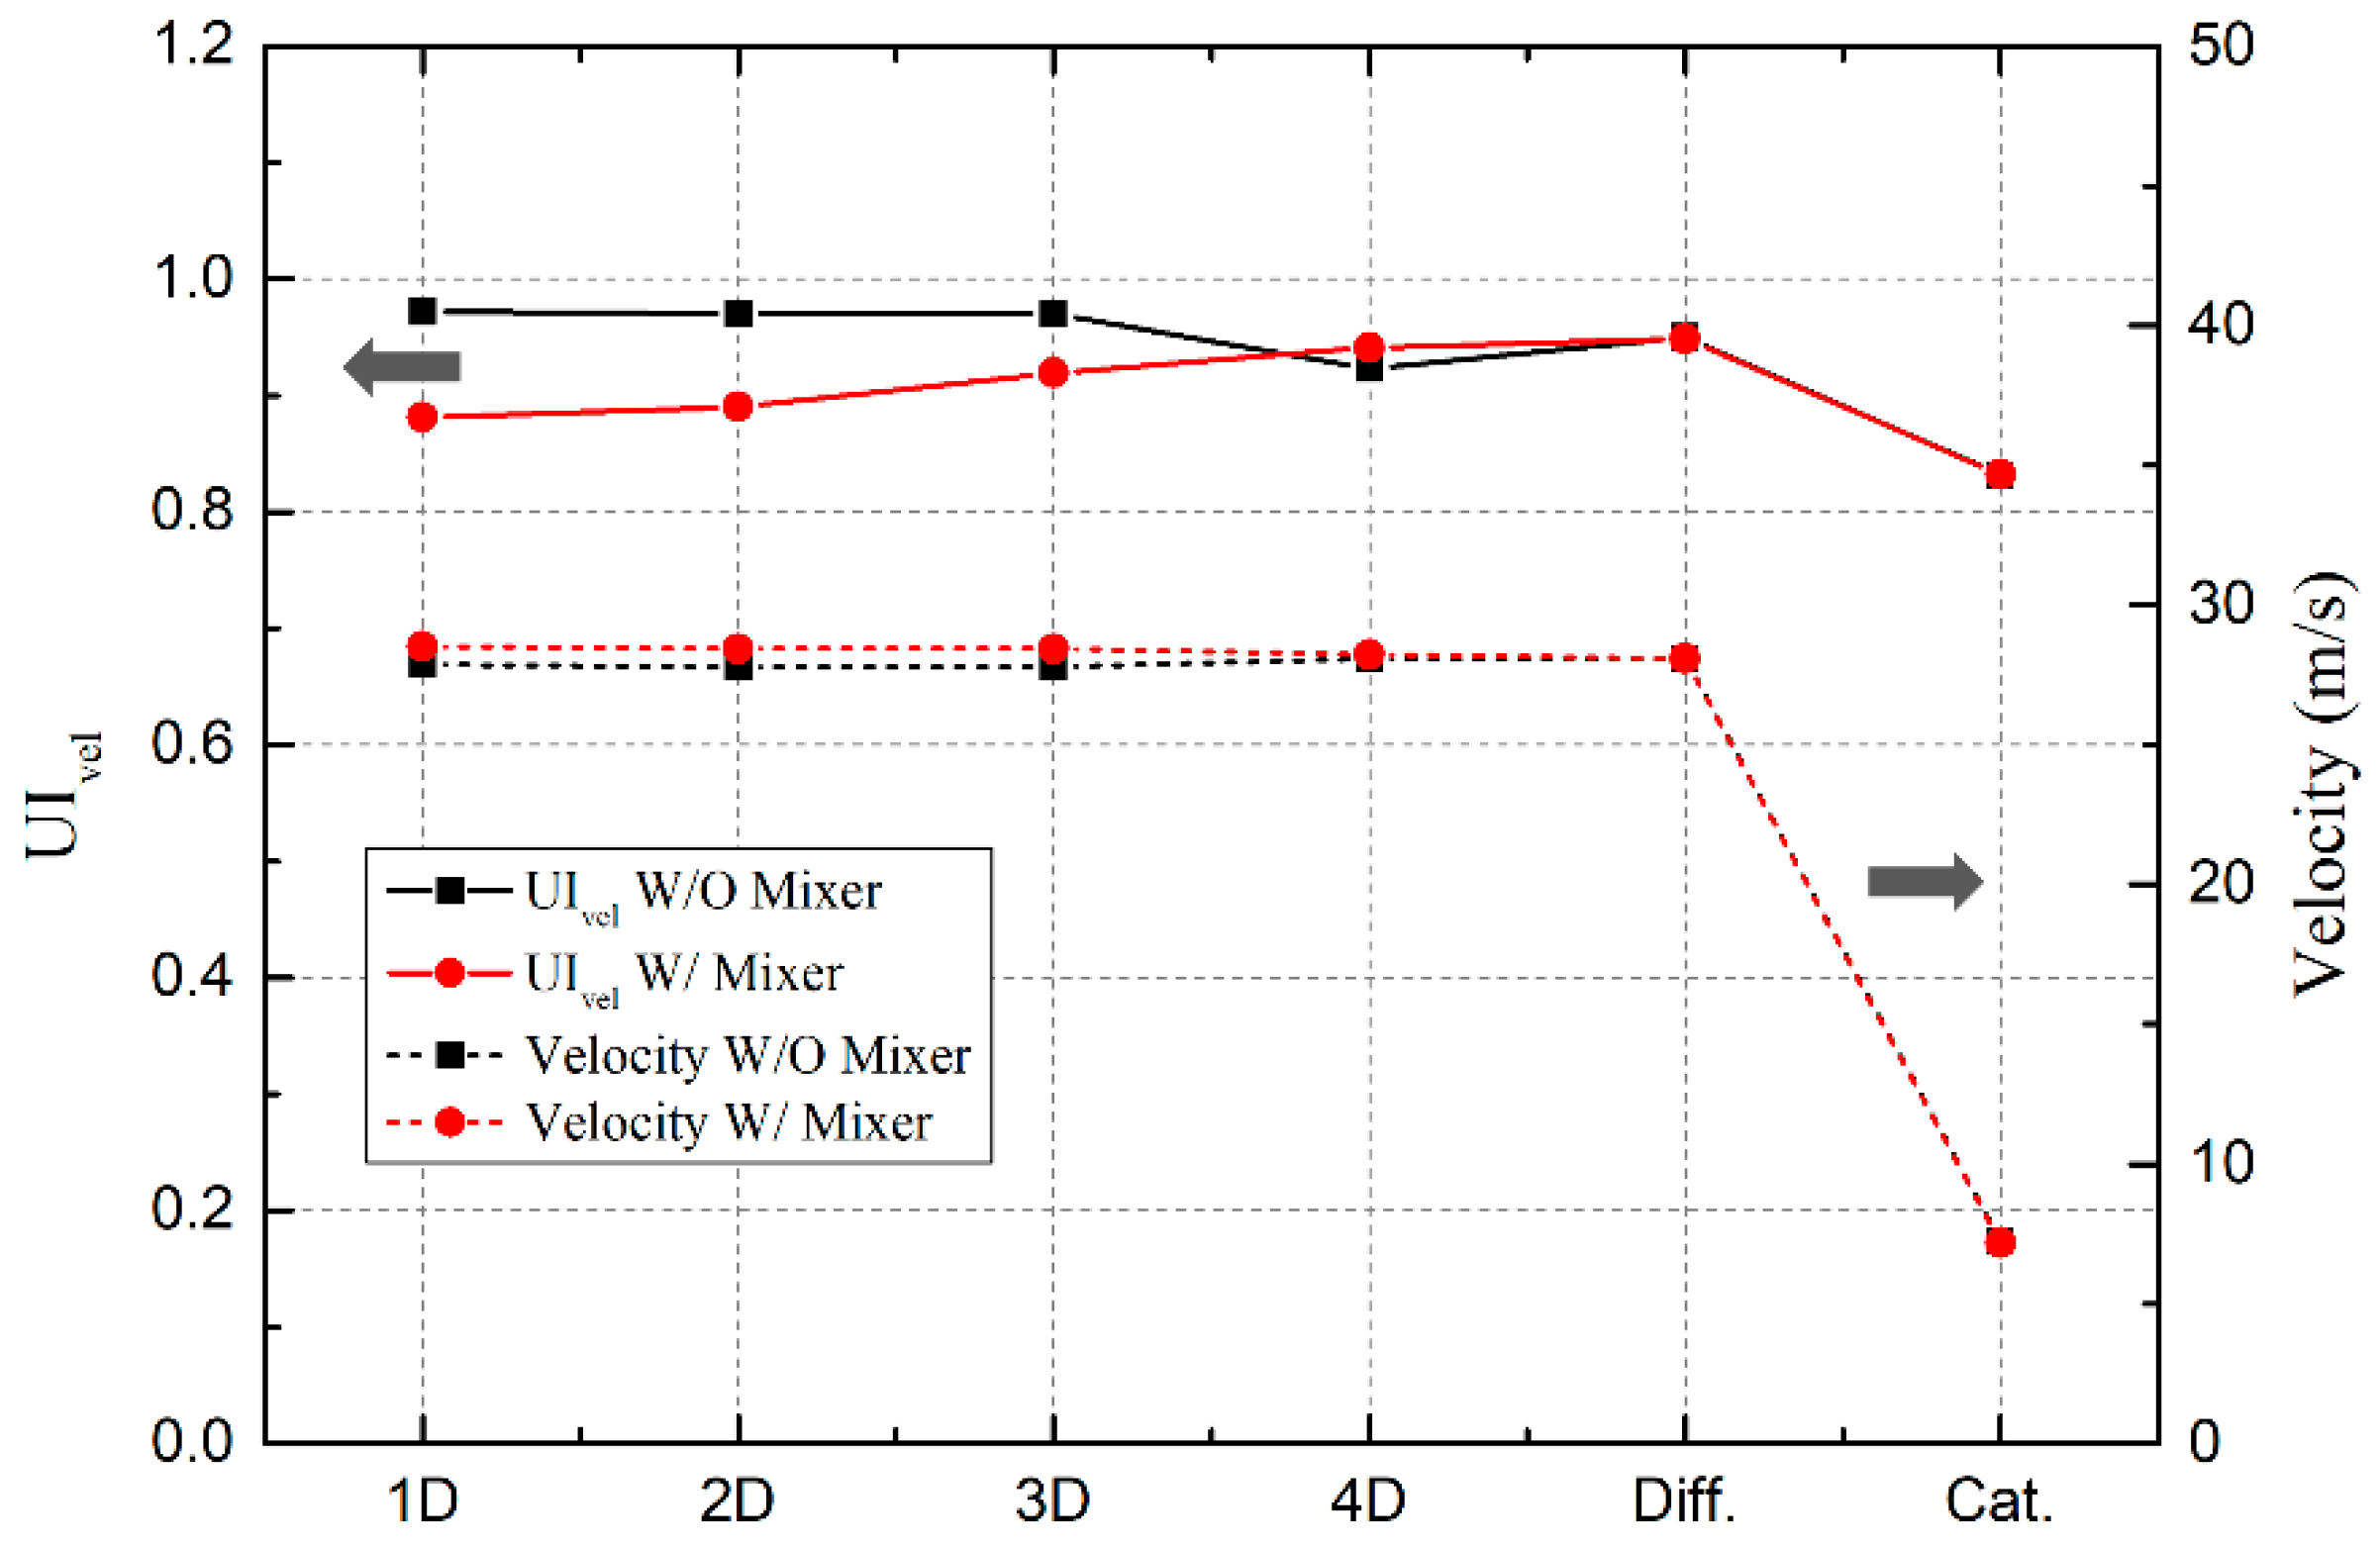
Figure 9 and Figure 10 demonstrate the uniformity of the flow-field based on axial velocity distribution in the SCR system. For the case without the mixer, the uniformity of the axial velocity (UIvel) is 98% at the mixing region (1D–3D), meaning that the flow resistance is almost zero. On the other hand, for the case with the mixer, the effect of tangential and swirl-flow in the mixing region causes a deviation in the flow velocity in the cross section, affecting the decrease in uniformity. As both cases are fully developed with sufficient length to the inlet of the diffuser, UIvel improves by 95%, as shown in Figure 9, but UIvel decreases due to floating separation and the recirculation of each corner attributable to a large variation in shape (round shaped pipe → square shaped diffuser), resulting in an improvement of about 83%.
From the results previously revealed, it is inferred that the recirculation of the flow in the opposite direction of the axial direction act is a factor that inhibits the uniformity of flow rates at the catalytic inlet owing to the morphological features of the diffuser. Furthermore, each case shows a gradual decrease in emission temperature and a similar NH3 concentration as it approaches the catalyst, but decreased UINH3 causes the balance of the NOx/NH3 ratio to be disrupted in local areas, resulting in a de-NOx efficiency decrease despite the use of the proper amount of reductant. Therefore, although the flow rate deviation in the cross section affects the decrease in flow rate within the mixing region, strong turbulence not only improves UINH3 at the inlet of the catalyst but also greatly affects de-NOx efficiency.
4. Conclusions
In this paper, exhaust gas flow and mixing characteristics are investigated in a marine SCR system with a static mixer by means of numerical analysis. The numerical simulation is performed for a urea-based SCR system in a 2MW class system used by the STX company. The simulation is validated by comparing the uniformity of the NH3 distribution with an experiment at a specific location. The important parameters that affect de-NOx performance such as flow characteristics, NH3 conversion, NH3 distribution, and axial velocity distribution are discussed in this study. The conclusion is listed as below:
- •
- The mixer induces strong turbulence in the exhaust gas flow, and the axial velocity becomes slow. Thus, the recirculating flow owing to the shape change at the diffuser which disturbing the de-NOx reaction at the catalyst is reduced.
- •
- The mean temperature of the exhaust gas is lowered by about 10 °C with the mixer than without at 1D. Meanwhile, the NH3 concentration is 80 ppm higher with the mixer. This is because the endothermic thermolysis reaction is more activated with the mixer, as well as due to the fact that the reaction takes place across a wider region.
- •
- The UINH3 is 25% higher with the mixer at the inlet of the catalyst in comparison to when the mixer is not present, even though the UIvel and NH3 concentration show similar values regardless of the existence of the mixer. This causes improved de-NOx efficiency, confirmed at a practical level in the industrial field.
- •
- The peak/average ratio of NH3 at the inlet of the catalyst is an important parameter for determining de-NOx efficiency. These values are 1.73 and 4.00 with and without the mixer, respectively. Since the standard of the IMO Tier 3 ECA regulations (80% de-NOx efficiency) state that this value be less than 2, the mixer is crucial.
- •
- The above conclusions demonstrate that a specific shape of mixer is required considering the uniformity of the reductant based on the NH3 concentration distributions in the mixing region (1D–3D). The application of a mixer to the marine SCR system is crucial as the marine system displays a limited mixing length compared to SCR systems in ground systems due to the complexity of the internal structure of the engine room.
Author Contributions
Conceptualization, J.J.; methodology, J.J. and H.R.; software, J.J., S.N. and H.R.; validation, J.J., S.N. and H.R.; formal analysis, J.J. and S.A.; investigation, J.J., S.N., H.R. and S.A.; resources, J.J.; data curation, J.J., S.N. and S.A.; writing—original draft preparation, J.J.; writing—review and editing, S.A. and G.C.; supervision, S.A.; project administration, G.C.; funding acquisition, J.J. and H.R. All authors have read and agreed to the published version of the manuscript.
Funding
This study is supported by the project ID EQ1R008 of STX Engine Co., Ltd.
Institutional Review Board Statement
Not applicable.
Informed Consent Statement
Not applicable.
Conflicts of Interest
The authors declare no conflict of interest.
References
- Nishioka, A.; Sukegawa, Y.; Katogi, K.; Mamada, H.; Kowatari, T.; Mukai, T.; Yokota, H. A Study of a New After-treatment System(2): Control of Urea Solution Spray for Urea-SCR.; SAE International: Warrendale, PA, USA, 2006. [Google Scholar]
- Park, C.W.; Kim, C.G.; Choi, Y.; Kang, K.Y. Performance of LNT Catalyst according to the Supply Condition of Hydrogen Reductants for Diesel Engine. KSAE 2009, 17, 142–148. [Google Scholar]
- Keobel, M.; Elsener, M.; Marti, T. NOx-Reduction in Diesel Exhaust Gas with Urea and Selective Catalytic Reduction. Comb. Sci. Technol. 1996, 121, 85–102. [Google Scholar] [CrossRef]
- Millstein, D.E.; Harley, R.A. Effects of Retrofitting Emission Control Systems on In-Use Heavy Diesel Vehicles. Environ. Sci. Technol. 2010, 44, 5042–5048. [Google Scholar] [CrossRef] [PubMed] [Green Version]
- Johnson, D.R.; Bedick, C.R.; Clark, N.N.; Mckain, D.L., Jr. Design and Testing of an Independently Controlled Urea SCR Retrofit System for the Reduction of NOx Emissions from Marine Diesels. Envrion. Sci. Technol. 2009, 43, 3959–3963. [Google Scholar] [CrossRef] [PubMed]
- Zheng, G.; Palmer, G.; Salanta, G.; Kotrba, A. Mixer Development for Urea SCR Applications; SAE Technical Paper; SAE International: Warrendale, PA, USA, 2009. [Google Scholar]
- Prabhu, S.; Nayak, N.; Kapilan, N.; Hidasageri, V. An experimental and numerical study on effects of exhaust gas temperature and flow rate on deposit formation in Urea-Selective Catalytic Reduction (SCR) system of modern automobiles. Appl. Therm. Eng. 2017, 111, 1211–1231. [Google Scholar] [CrossRef]
- Zhu, Y.; Li, T.; Xia, C.; Feng, Y.; Zhou, S. Simulation analysis on vaporizer/mixer performance of the high-pressure SCR system in a marine diesel. Chem. Eng. Proc. Proc. Intensif. 2020, 148, 107819. [Google Scholar] [CrossRef]
- Strom, H.; Lundstrom, A.; Andersson, B. Choice of urea-spray models in CFD simulations of urea-SCR systems. Chem. Eng. J. 2009, 150, 69–82. [Google Scholar] [CrossRef]
- Choi, C.; Sung, Y.; Choi, M.; Kim, D. Numerical analysis of NOx reduction for compact design in marine urea-SCR system. Int. J. Nav. Arch. Ocean. Eng. 2015, 7, 1020–1034. [Google Scholar] [CrossRef] [Green Version]
- Sung, Y.; Choi, M.; Park, T.; Choi, C.; Park, Y.; Choi, G. Synergistic effect of mixer and mixing chamber on flow mixing and NOx reduction in a marine urea-SCR system. Chem. Eng. Proc. Proc. Intensif. 2020, 150, 107888. [Google Scholar] [CrossRef]
- Lee, S.; Park, S. Numerical analysis of internal flow characteristics of urea injectors for SCR dosing system. Fuel 2014, 129, 54–60. [Google Scholar] [CrossRef]
- AVL FIRE User Guide (2014) CFD-Solver_v2014_05_CFD—Solver. Available online: https://www.avl.com/fire (accessed on 8 July 2021).
- Koebel, M.; Elsener, M.; Kleemann, M. Urea-SCR: A Promising Technique to Reduce NOx Emissions from Automotive Diesel Engines. Catal. Today 2000, 59, 335–345. [Google Scholar] [CrossRef]
- Birkhold, F.; Meingast, U.; Wassermann, P.; Deutschmann, O. Modeling and Simulation of the Injection of Urea-Water-Solution for Automotive SCR DeNOx-Systems. Appl. Catal. B Environ. 2007, 70, 119–127. [Google Scholar] [CrossRef]
- Kee, R.J.; Rupley, F.M.; Meeks, E.; Miller, J.A. Chemkin III: A Fortran Chemical Kinetics Package for the Analysis of Gas-Phase Chemical and Plasma Kinetics; Sandia National Laboratories: Livermore, CA, USA, 1996. [Google Scholar]
- Weltens, H.; Bressler, H.; Terres, F.; Neumaier, H.; Rammoser, D. Optimisation of Catalytic Converter Gas Flow Istribution by CFD Prediction; SAE 930780; SAE International: Warrendale, PA, USA, 1993. [Google Scholar]
- Bernhard, A.M. Catalytic Urea Decomposition, Side-Reactions and Urea Evaporation in the Selective Catalytic Reduction of NOx. Ph.D. Thesis, ETH, Zurich, Switzerland, 2012. [Google Scholar]
Figure 1.
(a) Picture of test bed and (b) computational modeling of the urea-SCR system.

Figure 2.
Droplet size distribution by the injector.

Figure 3.
Data acquisition for comparison with CFD results.

Figure 4.
Flow stream (left) and urea droplet distribution (right) in the urea-SCR system.

Figure 5.
Mean temperature distribution at specific locations with and without mixer.

Figure 6.
Mean temperature and NH3 concentration at specific positions with and without mixer.

Figure 7.
NH3 distribution at specific locations with and without mixer.

Figure 8.
UI and concentration of NH3 at specific locations with and without mixer.

Figure 9.
Distribution of mean velocity at specific locations with and without mixer.

Figure 10.
UI of axial velocity and mean axial velocity at specific locations with and without mixer.
Figure 10.
UI of axial velocity and mean axial velocity at specific locations with and without mixer.


Table 1.
Boundary conditions.
| Part | Component | Value | Unit |
|---|---|---|---|
| Exhaust system | Inlet mass flow | 10,903.5 | kg/h |
| Outlet pressure | 1.024 | bar | |
| Temperature | 633.15 | K | |
| Inlet velocity | 30 | m/s | |
| Inner diameter | 500 | mm | |
| Wall | Heat transfer coefficient | 15.0 | W/m2 K |
| Environmental temperature | 297.15 | K | |
| Wall catalyst | Thermal conductivity | 16.3 | W/m K |
| Cell density (CPSI) | 46 | 1/in2 | |
| Wall thickness | 24.016 | mil | |
| Catalyst | Washcoat thickness | 0.6100064 | mil |
| Type | Mineral wool | - | |
| Thickness of insulation | 50 | mm | |
| Insulation | Thermal conductivity | 0.0442 | W/m K |
| Specific heat | 840 | J/kg K |
Table 2.
Details of the injector.
| Part | Component | Value | Unit |
|---|---|---|---|
| Injector | Nozzle type | Single phase | |
| Number of nozzle hole | 1 | EA | |
| Tip hole size | 3.0 | mm | |
| Injection velocity | 100 | m/s | |
| Total mass flow rate | 7.629 | g/s | |
| Spray cone angle | 15 |
Table 3.
UI distributions of NH3 + HNCO for experiment and simulation.
| Detecting Points | Experiment | Simulation | Match Rate |
|---|---|---|---|
| 9 points (quarter) | 86 | 87 | 99% |
| 15 points (half) | 83 | 88 | 94% |
| 30 points (all) | 79 | 86 | 92% |
Publisher’s Note: MDPI stays neutral with regard to jurisdictional claims in published maps and institutional affiliations. |
© 2021 by the authors. Licensee MDPI, Basel, Switzerland. This article is an open access article distributed under the terms and conditions of the Creative Commons Attribution (CC BY) license (https://creativecommons.org/licenses/by/4.0/).
Share and Cite
MDPI and ACS Style
Jang, J.; Na, S.; Roh, H.; Ahn, S.; Choi, G. Spraying and Mixing Characteristics of Urea in a Static Mixer Applied Marine SCR System. Energies 2021, 14, 5788. https://doi.org/10.3390/en14185788
AMA Style
Jang J, Na S, Roh H, Ahn S, Choi G. Spraying and Mixing Characteristics of Urea in a Static Mixer Applied Marine SCR System. Energies. 2021; 14(18):5788. https://doi.org/10.3390/en14185788
Chicago/Turabian StyleJang, Jaehwan, Sangkyung Na, Heehwan Roh, Seongyool Ahn, and Gyungmin Choi. 2021. "Spraying and Mixing Characteristics of Urea in a Static Mixer Applied Marine SCR System" Energies 14, no. 18: 5788. https://doi.org/10.3390/en14185788
Note that from the first issue of 2016, this journal uses article numbers instead of page numbers. See further details here.