
Advances in the Application of Machine Learning Techniques for Power System Analytics: A Survey †
by
 , , and
Seyed Mahdi Miraftabzadeh
1,* ,
,
Michela Longo
1,* ,
,
Federica Foiadelli
1,
Marco Pasetti
2 and
Raul Igual
3 1
Department of Energy, Politecnico di Milano, Via Lambruschini 4, 20156 Milano, Italy
2
Department of Information Engineering, University of Brescia, Via Branze 38, 25123 Brescia, Italy
3
EduQTech, Electrical Engineering Department, EUP Teruel, Universidad de Zaragoza, 44003 Teruel, Spain
*
Authors to whom correspondence should be addressed.
†
This paper is an extension of the conference paper presented at IEEE EEEIC 2020, Genova, Italy, 11–14 June 2019.
Energies 2021, 14(16), 4776; https://doi.org/10.3390/en14164776
Submission received: 1 June 2021
/
Revised: 28 June 2021
/
Accepted: 2 August 2021
/
Published: 6 August 2021
(This article belongs to the Special Issue Modeling, Optimization, Control and Demand Response of Electric Power and Energy Systems)
Abstract
:The recent advances in computing technologies and the increasing availability of large amounts of data in smart grids and smart cities are generating new research opportunities in the application of Machine Learning (ML) for improving the observability and efficiency of modern power grids. However, as the number and diversity of ML techniques increase, questions arise about their performance and applicability, and on the most suitable ML method depending on the specific application. Trying to answer these questions, this manuscript presents a systematic review of the state-of-the-art studies implementing ML techniques in the context of power systems, with a specific focus on the analysis of power flows, power quality, photovoltaic systems, intelligent transportation, and load forecasting. The survey investigates, for each of the selected topics, the most recent and promising ML techniques proposed by the literature, by highlighting their main characteristics and relevant results. The review revealed that, when compared to traditional approaches, ML algorithms can handle massive quantities of data with high dimensionality, by allowing the identification of hidden characteristics of (even) complex systems. In particular, even though very different techniques can be used for each application, hybrid models generally show better performances when compared to single ML-based models.
1. Introduction
The power system management and development have constantly been changing due to expanding complexity and distributed modern power networks. [1]. Principally, the increasing distribution of Renewable Energy Sources (RESs) with intermittent energy generation and technological novelties in power system management and control demand reliable power predictions and more precise monitoring models [2,3]. In recent years, researchers developed advanced solutions based on Machine Learning (ML) algorithms to solve the bottleneck of conventional lumped parameter simulations. In practice, conventional traditional simulation techniques based on deterministic methods are still dominated in power grids. However, the high performance of machine learning solutions in terms of accuracy computational speed, and scalability brings novelties in power grids management and control. Therefore, it is expected to boost the adaptation of these techniques for short- to medium-term forecasts of the power grid system operation to meet this gap while getting benefits of advantages of traditional approaches.
As the high-quality sensor prices–such as smart meters, Phasor Measurement Units (PMUs), and Remote Terminal Units (RTUs), or other measurement devices—are constantly decreased, they are increasingly distributed in the power system and are continuously acquiring a massive amount of heterogeneous datasets. Analyzing and processing all these data provides new insights and advances in the control and operation of smart grids thanks to innovation in ML and big data frameworks to handle structured and unstructured data. Traditional time-domain methods are computationally inefficient; thus, they are not good candidates for real-time applications in which response time is a decisive concern [4,5]. The expected significant penetration of Electric Vehicles (EV) charging stations, and the increasing expansion of the Internet of Things (IoT) devices in private and public sectors such as smart buildings introduce new challenges and opportunities for the perception of accurate Day-Ahead Load Forecasts (DALFs) in micro-and smart- grids [6,7]. At the same time, the transition towards decarbonization of systems leads to the integration of distributed energy systems which usually generate energy in an intermittent and stochastic manner, such as wind or solar energy generators with no inertia. Consequently, the growing complexity of power flow patterns requires novel approaches to render reliable, efficient, and economical solutions.
In this context, advanced machine learning models have been shown promising results to provide new valuable knowledge and insights and identify hidden data patterns, trends, and relationships. In [8], the authors briefly summarized the ML paradigm and presented the literature review on applications of ML methods in Power systems till the end of 2017. This paper continues the authors’ work presented at [8] and aims at providing a systematic review of the various machine learning algorithms used to analyze, monitor, and model power flows, power quality events, photovoltaic systems, intelligent transportation systems, and load forecasting services. The authors selected the Journal papers for literature review based on publication date, number of citations, and novelty in contributions. The main contribution of this article is as follows:
The ML paradigm and well-known ML algorithms are categorized and presented;
The systematic review summarizes not only the main contributions of each article but also provides information regarding the explicit application, data source, and models, by mainly considering articles published since 2018; this study used Google Scholar, Scopus, IEEE Xplore, and the MPDI databases for literature review, which ended in February 2021.
To make a fair comparison between models, the characteristics of a standard dataset for the testing of the reviewed models are presented.
The remainder of the article is structured as follows: Section 2 explains the machine learning paradigms, well-known algorithms, and performance metrics. A literature survey on recent advanced machine learning applications in power flow, power quality, photovoltaic systems, electric transportation systems, and load forecasting is presented in Section 3. Section 4 discusses the results and notes achieved in the literature review, and Section 5 summarizes the final remarks and conclusions.
2. Machine Learning
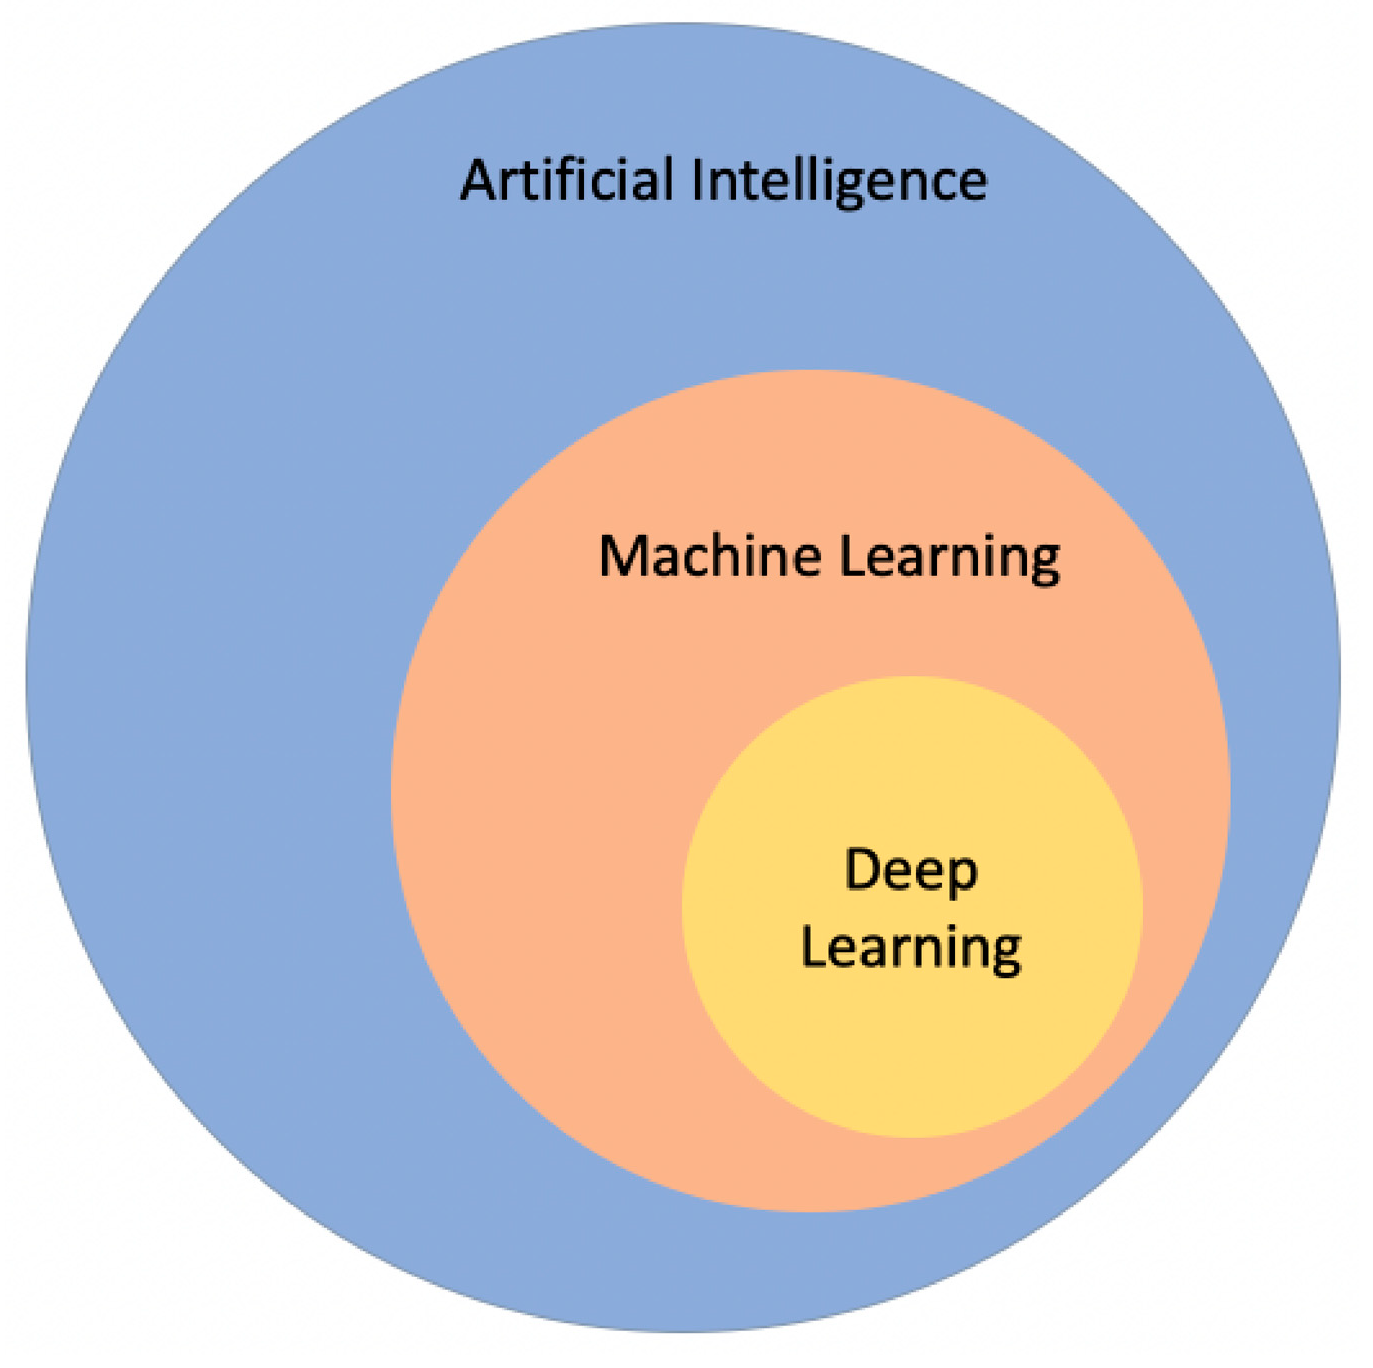
Artificial Intelligence (AI) deals with the broad topic related to the perception and extraction of knowledge from data. AI can be divided into two main subsets: machine learning and deep learning. Machine learning is the main subset of artificial intelligence, while deep learning can be represented as a subset of machine learning.
Machine learning is an interdisciplinary research field that consolidates expertise and knowledge from diverse areas and aims at proposing solutions to given problems that can be used to reply to similar questions raised by different contexts. More specifically, machine learning is the subset of AI that deals with the extraction of knowledge from the experience by analyzing and manipulating data gathered from real-world use cases. The primary purpose of machine learning is to develop reliable active learning models equipped with computerized patterns learning from raw data and perform fast-response predictions applied in decision-making processes [9,10].
Deep learning and neural networks are the most famous machine learning subset. Thanks to the use of (typically) multi-layered Artificial Neural Networks (ANNs), deep learning can handle unstructured datasets and can recognize complex input data patterns. In deep learning, different architectures can be designed using neural unit cells in various layers, unless other machine learning algorithms are fixed.
Figure 1 illustrates artificial intelligence, machine learning, and deep learning concepts in the schematic description by means of a Venn diagram.
2.1. Machine Learning Paradigms
In machine learning, training a model intends to learn the values of the parameters (or weights) and the bias from input data, while in traditional methods (i.e., with predefined algorithms), both the model and its parameters are given to a computer to perform a task. Labeled data are samples with a sort of meaningful “tag”, “label”, or “class” that are informative or desirable to know—for example, whether an Alternating Current (AC) power signal contains harmonic distortion(s) or not. In contrast, unlabeled data are samples with no explanation; in other words, it has only row data without any “tag” or “label” assigned to it—for instance, voltage and current signals of an electric motor.
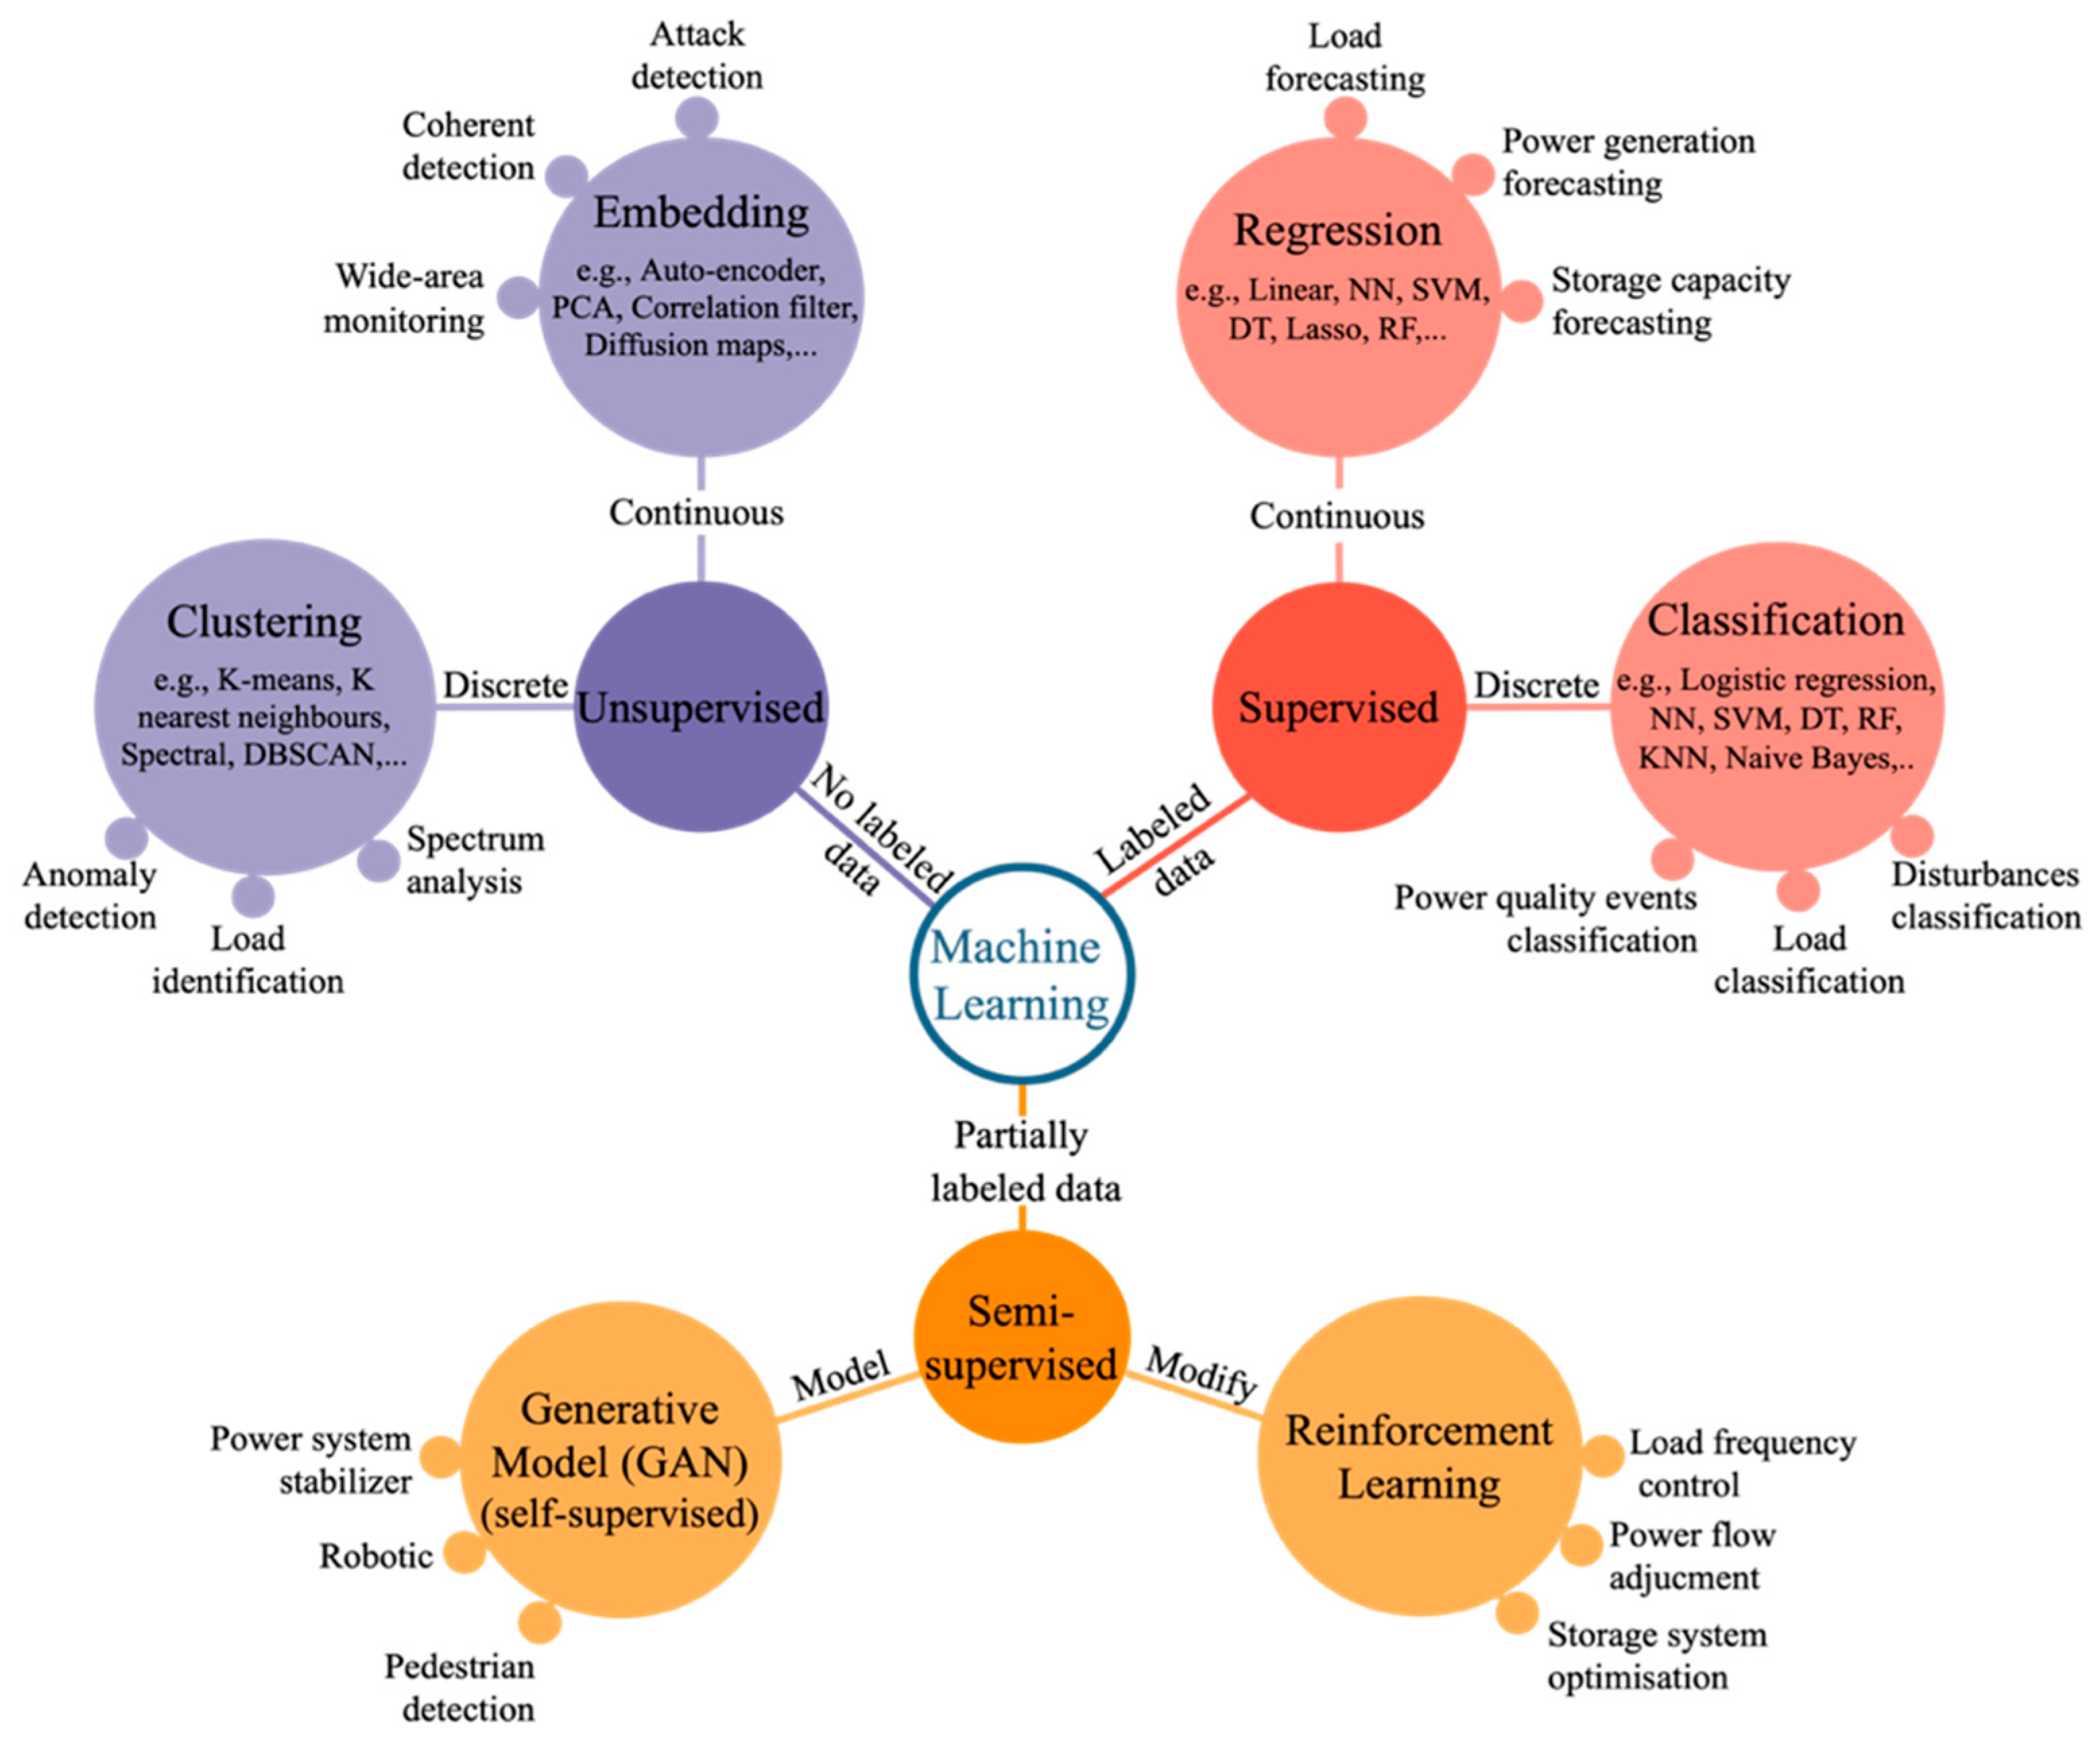
Machine learning tasks are principally arranged into three main classes: supervised, unsupervised, and semi-supervised learning. Supervised learning algorithms work with labeled data with the objective of mapping new input data to the known target output values. On the contrary, unsupervised learning models process an unlabeled dataset, in which target values are unknown, to draw insights by learning hidden complicated patterns and structures spontaneously. Semi-supervised algorithms deal with a dataset that some samples are labeled, and more extensive samples are unlabeled. These algorithms are designed to benefit from both advantages of supervised and unsupervised methods [11];
Supervised learning is categorized into classification and regression problems. A classification problem predicts output variables as a category, such as “cat” or “dog.” Contrarily, in regression problems output variables are numerical values [12];
Unsupervised learning algorithms are generally divided into clustering or dimensionality reduction (or sometimes called embedding) methods [11]. For instance, in anomaly detection, a clustering algorithm is applied to data to identify false data by scanning outliers in a dataset or noticing abnormal patterns;
Semi-supervised learning makes use of the mixture of labeled and unlabeled data as the training dataset. Semi-supervised models act as active learners [13]. There are two main semi-supervised learning algorithms, namely reinforcement learning and Generative Adversarial Networks (GANs). In reinforcement methods, if a model does a task correctly, it would get a reward. The objective of reinforcement learners is to build a model to maximize rewards through an iterative process [14]. Reinforcement learning is suitable for an interactive or dynamic environment that a model can improve itself based on policies defined by an expert, for example, playing a game or self-driving cars. GANs generate models based on deep neural learning methods to discover and learn patterns of input data. Then, the generative model can be used to create new data examples that resemble a training dataset. For instance, GANs can create pictures that look like human faces images, even though the faces don’t relate to any actual person.
2.2. Machine Learning Algorithms
Many different machine learning techniques have been proposed in recent years, particularly consisting of hybrid ML-based models, making use of two or more machine learning techniques or even other statistical or mathematical models. For example, ensemble learning models include different weak learners such as decision trees, support vector machines, and linear or logistic regression. This section discusses the basic and most relevant machine learning techniques in each category.
2.2.1. Classification Algorithms
There are several classification algorithms; the most commonly used ones are presented as follows [15]:
Logistic Regression (LR): LR is widely used for binary classification tasks where an output belongs to one class or another (0 or 1). In this algorithm, a threshold is defined to indicate examples will be labeled into which class using hypothesis and logistic function (usually sigmoid curve). The hypothesis determines the likelihood of events to generate data and fit them into the logarithm function that forms an S-shaped curve called sigmoid. Then, the logarithm function is used to predict the class of new inputs. Even though logistic regression provides better performance in binary classification tasks, it can also be used in multiclass classification problems, by applying the one versus all strategy [16];
K-Nearest Neighbors (KNN): this algorithm is one of the most basic yet broadly used classifiers. It is generally used to find data with similar characteristics and group them in the same class, without making any assumptions on data distribution. The groups are constructed by considering the attributes of the neighboring samples. It is used in real-life problems in several applications such as data mining, pattern recognition, and invasion detection [17,18];
Naïve Bayes (NB): this technique is one of the most powerful classification algorithms based on an extension of Bayes’ theorem, assuming each feature is independent to capture input-output relationships. Bayes’ theorem compares the probability of an event happening to what has already happened, for example, the probability of having a fire (event A) while the weather is hot (event B, which is present) [19]. The naïve algorithm is simple to implement and can easily predict labels of new inputs. Additionally, when domain knowledge confirms the feature independence, with less data, it has a better performance than other classification algorithms such as logistic regression. On the other hand, in real life, it is not easy to have data with entirely independent features; moreover, when there is an input that was not followed up in the training phase, the algorithm assigns zero probability, and it does not classify this input in any group. This technique is used in various applications such as text classification and spam filtering [20];
Support Vector Machine (SVM): This algorithm is widely used in classification tasks and also applied in regression problems. The main idea of SVM is to transfer data to higher n-dimensional space to find an ideal hyperplane to differentiate classes [21]. In simple words, these support vectors are coordinates of a new n-dimensional coordinate system. This method is commonly used in binary classification, but it is computationally expensive and slow in the big data domain;
Decision Tree (DT): This algorithm is based on different hierarchical steps that lead to certain decisions. It applies a treelike structure to represent decision paths with induction and pruning steps. In the induction step, the tree structure is built, while, in the pruning step, the complexities of the tree are reduced. The inputs are mapped to outputs by traversing each path through different branches of the tree [22]. DT is a powerful classification tool, simple to structure and with good performance. However, with even small variations in data, DT can become unstable. Furthermore, it can easily become overfitted, especially in a thorny tree with many branches and conditions, thus, it does not generalize well on new inputs. Regularization, bagging, and boosting techniques are usually used to avoid overfitting problems in the DT [23];
Random Forest (RF): This classifier is very similar to the decision tree. Compare to DT, RF uses several decision trees, instead of having only one tree. This technique can be applied in massive data set to classify data or measure the importance of each feature in the final decision. In many applications, the random forest is preferred over the decision tree because it can be more accurate and overcomes the overfitting issued of DT. However, this technique is not easy to implement since it has a complex structure, and it is not recommended for real-time prediction purposes because it is generally slower than other models [24].
2.2.2. Regression Algorithms
Several regression algorithms (numerical or continuous value prediction) have been introduced in the scientific literature; the most commonly used ones are presented in the following:
Linear Regression (LR): this technique tries to find the fittest straight hyperplane to the data [25]. It is commonly used when there are linear relationships between variables, and it can avoid overfitting by regularization techniques such as LASSO, Elastic-Net, and Ridge [26]. However, it is not flexible in finding the best solution for non-linear relationships in variables and complex patterns;
Regression Tree (RT): This technique has the same hierarchical structure as the decision tree, but it takes numerical values as input. The branching procedure not only maximizes the learning gain but also learns non-linear relationships between variables. Even if this method is robust to outliers and easy to implement, it is prone to overfitting problems [27]. In addition to the regression tree, random forests and Gradient Boosted Trees (GBM), which are the most commonly used ensemble methods, are also applied in numerical predictions and have better performance concerning overfitting issues;
Deep Neural Network (DNN): Deep neural network, or multi-layer neural network, is widely used in several domains. Indeed, thanks to their ability to capture complex patterns, DNNs can be used both as regression algorithms and classifiers. The non-linear relationships between features are learned by non-linear activation functions and hidden layers between the input and the output [28]. There are several techniques and methods to improve the performance of neural networks, as well as different advanced neural network-based models such as Convolutional Neural Network (CNN) or Recurrent Neural Network (RNN) [29,30]. Different from other algorithms, in DNNs, a deep knowledge of how to tune the parameters of the neural network is required to develop a working neural network model. In addition, even though neural network models work well in the big data domain, they are usually very computationally expensive methods;
Extreme Learning Machine (ELM) has a wide range of applications in the data-driven approach. ELM has been used in regression, classification, clustering, sparse representation, feature extraction or learning, and compression. This feedforward neural network does not apply the backpropagation gradient-based mechanism to update the network weighted values; instead, it randomly assigns random values to the weight and bias terms of the network [31]. The main advantages of this kind of algorithm are (i) the faster training phase and (ii) the better interpolation results. On the contrary, the accuracy results of ELM is not promising, even if compared to basic MLP models;
Support Vector Machine or kernel SVM can also be used for regression problems, even though it is mostly used in classification problems;
XGboost, finally, is a (recently) widely used rugged decision-tree- and ensemble-based algorithm with a framework that is designed considering a gradient boosting procedure [32].
2.2.3. Clustering Algorithms
Clustering techniques try to group instances with the same properties in the same cluster. These techniques are commonly used in other fields than machine learning, such as image analysis, pattern recognition, data compression, and statistical analysis. The most well-known algorithms are as follows:
K-means: this technique, one of the simplest and intuitive machine learning algorithms, separates instances in the k centroids or clusters with equal variance. After selecting the number of clusters (K), the algorithm finds the best k clusters by minimizing the criterion known as inertia through the iterative procedure and changing the position of centroids [33]. As it is simple to interpolate and scales well to big data, it has been applied across a wide range of applications in various domains;
DBSCAN: Density-Based Spatial Clustering of Applications with Noise (DBSCAN), which is widely used in data mining and machine learning, finds core instances of high density and extends clusters with the specified radius (usually Euclidean distance) around them. Low-density regions are distinguished as outliers. The primary problem in DBSCAN is selecting clustering attributes, detecting noise with varied densities, and significant differences of amounts of boundary objects in opposed directions of the corresponding clusters [34]. The smallest number of instances to constitute a dense region and how close instances should be to each other in the same region are defined by an expert. Even though this algorithm, which is a very popular clustering technique, is widely used, it badly behaves with very sparse or high dimensional datasets;
Spectral: this clustering algorithm, which is also an exploratory data analysis technique, performs dimensionality reduction through eigenvalues (spectrum) of the similarity of data instances, by then grouping similar data instances with reduced dimensions into the same cluster [35]. This approach is practically applied when the center of clusters and their spread does not appropriately describe the whole cluster (non-convex cluster), such as in image segmentation problems. The spectral technique is widely used because it is a fast response technique and outperforms other clustering techniques, especially in sparse datasets.
2.2.4. Embedding Algorithms
In many cases, especially in the big data domain, the presence of a large number of variables or features in a dataset makes it difficult to interpret the relationship between them. Training a model on the whole dataset could easily make the model not sufficiently generalized on new unseen data (overfitting problem). Embedded Algorithms (EAs) can be applied to extract new features from data without losing essential information before implementing sophisticated ML models. EA techniques could also be used directly for prediction purposes. Embedding algorithms can be subdivided as follows:
Principal Component Analysis (PCA): the main aim of PCA is to reduce high-dimensional datasets to a smaller dimension. PCA projects each data instance onto the main components or ranks while retaining as much data variation as possible. PCA techniques, such as Singular Value Decomposition (SVD), use eigenvectors of the covariance matrix of data to reduce the dimension of the dataset or making a prediction [36];
Autoencoder: this is one of the current states of the art techniques leveraging neural networks. Autoencoders are widely used in different applications, such as data compression. The autoencoder learns a representation (encoding) of the input dataset and ignores noise through embedding architecture, and reconstructs the input data as close as possible to its actual forms (decoder). A typical autoencoder consists of three parts, namely: an encoder, a bottleneck, and a decoder [37]. The encoder tries to compress the data to a lower dimension with the best representative, the decoder attempts to regenerate an input by eliminating the noise in the dataset, while the embedded data is stored in the bottleneck. It is possible to use the encoder part of a well-trained autoencoder for dimensionality reduction, or use the whole model, for example, in anomaly detection [38].
Figure 2 summarizes the different machine learning paradigms and techniques used in power system analytics, by providing examples for each category.
2.3. Model Performance Evaluation Metrics
The metrics that are used in each machine learning algorithm are different from each other. In Table 1 the most used metrics in discrete and continuous cases are discussed. In this table, True Positive (TP) and True Negative (TN) are samples that are correctly predicted as positive and negative, respectively. In contrast, False Positive (FP) and False Negative (FN) are samples that are incorrectly predicted as positive and negative, respectively. In continuous metrics, is the actual value, is the forecasted amount, and is the number of prediction samples.
3. Literature Review
Machine learning is widely applied to address various problems to bring novel solutions or improve the performance of existing applications. The main state-of-the-art machine learning-based applications in power systems are in power flow, power quality, photovoltaic system, intelligent transportation, and load forecasting.
3.1. Power Flow Applications
Compared to traditional algorithms, machine learning technologies make power flow problems easier to be handled. For example, algorithms like CNN, KNN, SVM, reinforcement learning, and decision tree affected power flow optimization problems in terms of accuracy, computational speed, and response time. Table 2 elaborates more into detail the recent advancements in machine learning applications in power flow.
3.2. Power Quality Applications
The power quality, one of the most critical topics in electrical systems, has also been affected by machine learning, which can be used to improve speed and accuracy in disturbances detection, or distortions classification, and estimations for future cycles. In addition, ML can also be used on a wide set of PQ parameters related to load functioning such as active power, reactive power, complex power, fundamental frequency, and power factor.
Table 3 summarizes the most recent improvements and achievements in the use of ML techniques in power quality applications.
3.3. Photovoltaic System Applications
Machine learning algorithms have been widely used for different purposes in Photovoltaic (PV), from forecasting the long-, medium-, and short-term energy generation, to fault detection and classification. The most recent works in this field are summarized in Table 4.
3.4. Intelligent Transportation Applications
Artificial intelligence, especially machine learning applications, are widely used in intelligent transportation, to develop smart online traffic management systems, from safety applications (e.g., driving distraction detection) to optimized traffic scheduling. Self-driving cars, for instance, have been recently developed only thanks to the advancements in machine learning.
Table 5 provides the most recent works based on ML in the field of intelligent transportation.
3.5. Load Forecasting Applications
Accurate load forecasting, both short- and long-term, is an essential task for the daily (economic) dispatching of electricity, both to prevent wasting energy production and integrating renewable energy resources.
Energy companies monitor, control, and schedule load demands and power generation to enhance energy management systems. However, electrical load profiles are becoming more complicated, not only because of the stochastic behavior of customers, but also because of the introduction of new non-linear components in power systems, such as electric vehicles, buses, and bikes. Therefore, many researchers have been developing both deterministic and probabilistic load forecasting models to improve the precision and speed of prediction models.
Table 6 presents recent advancements of machine learning studies in load forecasting.
4. Discussion
ML-based algorithms have shown remarkable results in power system analytics compared to traditional methods. However, even if the models proposed by the literature showed to work fine in real datasets, their performance in industrial applications has not been sufficiently demonstrated yet, due to cost or privacy issues. This suggests the need for further investigations at the industrial level, where the presence of input data with different distributions or big data properties (e.g., volume, velocity, variety, and veracity) could decrease the performance of ML models.
Regarding the data used for system validation, the studies generally presented customized datasets. They typically provided information on the total number of samples, sampling frequency, recording time, and percentage of data used for training and validation. As several datasets were synthetically generated using simulation software, only various studies reported problems with imbalanced datasets and missing items in the data. In this regard, Hong et al. [45] analyzed the case in which data were missing from one of the buses, concluding that system performance decreased significantly. Karagiannopoulos et al. [46] extrapolated historical data and used information from the public domain or from neighboring systems to deal with missing or noisy data. In this sense, Hafeez et al. [95] replaced missing values with the average values of preceding days, while El-Hendawi et al. [98] replaced missing data with the average values of the same day in previous years. Similarly, Ray et al. [75] used measurements from past hours to fill in missing data and performed data cleaning to exclude incorrect data from training. Jia [79], Ou et al. [84], and Alawad et al. [88] also highlighted the need to clean up missing data, while Li et al. [44] wrote the missing features as zero to keep the dimension of the matrix constant. Additionally, Gao et al. [73] presented an ML-based fault detection system in a photovoltaic array and quantified the impact of missing PV input data (irradiance, temperature, and different combinations of them) on system accuracy. On the other hand, Li et al. [83], Vantuch et al. [54], and Liao et al. [53] discussed the effect of the imbalanced dataset on performance. In this sense, Wang et al. [57] solved the data imbalance problem using an enhancement method that equalized the amount of data (random cropping of existing data to generate a new dataset, increase of random noise, signal reversing, etc.). Similarly, Jia [79] applied a synthetic minority over-sampling technique that addressed the dataset imbalance problem without overfitting the classifier.
The lack of standard datasets for the testing of ML-based algorithms also emerged as a relevant issue. Indeed, all the models presented in the literature are usually tested on not-standard datasets, with very different characteristics and peculiarities, thus making the comparison of the performance of such methods almost impossible. It is then apparent that, when it comes to the selection of the most suitable ML method to be implemented in large scale applications, this lack of information represents a relevant issue, that would eventually prevent the implementation of novel (and potentially more performing) methods in favor of (probably less performing) traditional ones. This, in the end, highlights the need for the definition of application-specific standard datasets, to allow a fair comparison between the very different ML methods proposed for each application. The standardized dataset should have the following properties:
Size: considering the industrial side, the dataset size should be considerably big with high dimensionality. Although some weak learners, such as DT, showed to work perfectly with a small amount of data, they would not well generalize in the big domain. On the contrary, neural network models have better accuracy results in the big domain;
Quality: if the focus is only on the performance of the machine learning model, the different input datasets should have the same properties. For example, some models are very robust to none values or outliers while others are not. Preparing a dataset before feeding it to a model relates to data engineering procedures rather than to the model performance;
Validity: the dataset should accurately represent the phenomena or reality of events. The statistical properties of the standardized dataset should be as much as possible close to real-life scenarios to show how practical models are;
Uniqueness and completeness: the information should be unique and not be duplicated over the dataset to make sure a trained model will generalize well enough in actual cases. Moreover, it should cover all the possible occurrences or conditions. When considering, for example, the power quality disturbance classification, the dataset should include all the essential distortions;
Train and test division: it is important the make sure that the performance of all models are evaluated with the same train set. Otherwise, a chosen test set probably only consists of easy instances, or it does not consist of all the possibilities;
Accuracy metrics: authors used different metrics to evaluate their model performance; however, it is not possible to compare various studies when the same accuracy metrics are not used. The metrics should be proposed taking into account the nature of problems. For example, there are much fewer abnormal events in anomaly detection than normal, so the model with 99% accuracy does not guarantee that it correctly detected all abnormal events; for such studies, F1-score or AUC should be taken into account.
Researchers proposed different models based on one or more techniques. Figure 3. shows the frequencies of techniques presented in the literature review of this study. In this figure, ANN consists of the traditional neural network such as MLP and Boltzmann machine, SVM includes both classification and regression, and PCA encompasses all PCA methods.
Alternatively, it seems the hybrid models had better performances compared to others, particularly the one that combined feature engineering techniques with prediction models. Reinforcement learning methods such as Q-learning have also enhanced accuracy in some applications like intelligent transportation systems and load forecasting. In some applications, such as PV prediction or load forecasting, which deal with temporal datasets, some sequential techniques such as GRU or LSTM are preferred.
5. Conclusions
When facing the challenges related to the management of smart power systems, it became apparent that traditional techniques are no more computationally promising solutions. One of the limitations of conventional algorithms is their inadequate capacity to handle a large amount of data—consisting of chunks of heterogeneous datasets—collecting from measurement devices such as phasor measurement units and smart meters. As a result, many researchers developed high-level, efficient, and reliable solutions based on state-of-the-art intelligent learning algorithms to provide innovative solutions or promote the overall performance of current models in various power system fields. In this context, the ML paradigm and modern ML algorithms are categorized and presented in this article. Furthermore, this study provided a systematic overview of the latest machine learning techniques and models employed to bring new resolutions in power flows, power quality events, power quality parameters, photovoltaic systems, intelligent transportation systems, and load forecasting services. The authors also suggested the properties of a standard dataset for testing and reviewing the ML-based models to make a fair comparison between the performances of proposed models for each topic. However, the literature analysis implies that hybrid models based on supervised machine learning algorithms are applied more exceeding than unsupervised or semi-supervised techniques. Thus, it can be highlighting that supervised algorithms convey more benefits to problems typically faced by electrical power engineers. Finally, it can also be concluded that the application of machine learning methods in electrical systems simplifies complex issues and ensures more reliable and accurate results. As numerous works proposed solutions based on ML techniques, the authors limited their research to well-known newly published articles. Accordingly, in future work, the authors focus on and review articles related to each topic separately to provide an informative survey.
Author Contributions
Conceptualization, S.M.M., F.F. and M.L.; methodology, S.M.M. and M.P.; formal analysis, S.M.M.; investigation, S.M.M.; resources, S.M.M.; writing—original draft preparation, S.M.M. and M.P.; writing—review and editing, S.M.M., M.P., M.L, R.I. and F.F.; visualization, S.M.M.; supervision, M.L. and F.F.; project administration, M.L. All authors have read and agreed to the published version of the manuscript.
Funding
This research received no external funding.
Conflicts of Interest
The authors declare no conflict of interest.
Abbreviation
| Abbreviation | Meaning |
| ACO | Ant colony optimization |
| Adrar | Algerian |
| AE | Autoencoder |
| AI | Artificial intelligence |
| ANFIS | Adaptive neuro-fuzzy inference system |
| ANN | Artificial neural network |
| AUC | Area under curve |
| CBCS | Chaotic mapping mechanism, and cuckoo search |
| CNN | Convolutional neural network |
| CPS | Cyber-physical system |
| D | Dimensional |
| DALFs | Day-Ahead Load Forecasts |
| dB | Decibels |
| DBSCAN | Density-based spatial clustering of applications with noise |
| DERs | Distributed energy resources |
| DNN | Deep neural network |
| DP | Dynamic Programming |
| DT | Decision Tree |
| DWT | Discrete wavelet transform |
| ELM | Extreme learning machine |
| EMD | Empirical mode decomposition |
| EV | Electric vehicles |
| FFT | Fast Fourier transform |
| FM | Dactorization machine |
| FN | False negative |
| FP | False positive |
| GANs | Generative adversarial networks |
| GBM | Gradient boosted trees |
| GPS | Global positioning system |
| GRU | Gated recurrent Unit |
| ICA | Independent component analysis |
| IEEE | Institute of electrical and electronics engineers |
| IoT | Internet of things |
| IPCA | Improved principal component analysis |
| KNN | K-nearest neighbors |
| LASSO | Least absolute shrinkage and selection operator |
| LR | Logistic regression/Linear regression |
| LSTM | Long short term memory |
| MAE | Mean absolute error |
| MAPE | Mean absolute percentage error |
| ML | Machine learning |
| MLP | Multi-layered perceptron |
| ms | milliseconds |
| MSE | Mean square error |
| NHTS | National household travel survey |
| OPAELM | Online p-norm adaptive extreme learning machine |
| OPF | Optimal power flow |
| PCA | Principle component analysis |
| PCWT | Pseudo-continuous wavelet transform |
| p.u. | Per unit |
| PM | Persistence model |
| PMU | Phasor measurement units |
| PQ | Power quality |
| PQEs | Power quality events |
| PSO | Particle swarm optimization |
| PSO-H-ELM | PSO hierarchical ELM |
| PV | Photovoltaic |
| R² | R-squared |
| RESs | Renewable energy sources |
| RF | Random forest |
| RK | Reduced kernel |
| RMSE | Root mean squared error |
| RMSEDD | Root mean squared Euclidean distance difference |
| RNN | Recurrent Neural Network |
| ROC curve | Receiver operating characteristic curve |
| RTU | Remote terminal units |
| SELM | Stacked extreme learning machine |
| SoC | State of charge |
| SPM | Space phasor model |
| SR | Self-recurrent mechanism |
| STFT | Short-time Fourier transform |
| SVM | Support vector machine |
| SVR | Support vector regression |
| TKEO | Teager–Kaiser energy operator |
| TN | True negative |
| TP | True positive |
| TS-SOM | Tree-structured self-organizing map |
| VMD | Variational mode decomposition |
| WASMs | Wide-area system measures |
| XGB/XGboost | Extreme gradient boosting |
References
- Howell, S.; Rezgui, Y.; Hippolyte, J.L.; Jayan, B.; Li, H. Towards the next generation of smart grids: Semantic and holonic multi-agent management of distributed energy resources. Renew. Sustain. Energy Rev. 2017, 77, 193–214. [Google Scholar] [CrossRef]
- Memon, A.A.; Kauhaniemi, K. A critical review of AC Microgrid protection issues and available solutions. Electr. Power Syst. Res. 2015, 129, 23–31. [Google Scholar] [CrossRef]
- Hu, J.; Vasilakos, A.V. Energy Big Data Analytics and Security: Challenges and Opportunities. IEEE Trans. Smart Grid 2016, 7, 2423–2436. [Google Scholar] [CrossRef]
- Hong, T.; Chen, C.; Huang, J.; Lu, N.; Xie, L.; Zareipour, H. Guest Editorial Big Data Analytics for Grid Modernization. IEEE Trans. Smart Grid 2016, 7, 2395–2396. [Google Scholar] [CrossRef]
- Wang, B.; Fang, B.; Wang, Y.; Liu, H.; Liu, Y. Power System Transient Stability Assessment Based on Big Data and the Core Vector Machine. IEEE Trans. Smart Grid 2016, 7, 2561–2570. [Google Scholar] [CrossRef]
- Pasetti, M.; Ferrari, P.; Silva, D.R.C.; Silva, I.; Sisinni, E. On the Use of LoRaWAN for the Monitoring and Control of Distributed Energy Resources in a Smart Campus. Appl. Sci. 2020, 10, 320. [Google Scholar] [CrossRef] [Green Version]
- Pasetti, M.; Rinaldi, S.; Flammini, A.; Longo, M.; Foiadelli, F. Assessment of electric vehicle charging costs in presence of distributed photovoltaic generation and variable electricity tariffs. Energies 2019, 12, 499. [Google Scholar] [CrossRef] [Green Version]
- Miraftabzadeh, S.M.; Foiadelli, F.; Longo, M.; Pasetti, M. A Survey of Machine Learning Applications for Power System Analytics. In Proceedings of the 2019 IEEE International Conference on Environment and Electrical Engineering and 2019 IEEE Industrial and Commercial Power Systems Europe (EEEIC/I CPS Europe), Genova, Italy, 10–14 June 2019; pp. 1–5. [Google Scholar]
- Hastie, T.; Tibshirani, R.; Friedman, J. Springer Series in Statistics. In The Elements of Statistical Learning, 2nd ed.; Springer: New York, NY, USA, 2009; ISBN 978-0-387-84858-7. [Google Scholar]
- Agneeswaran, V.S.; Tonpay, P.; Tiwary, J. Paradigms for realizing machine learning algorithms. Big Data 2013, 1, 207–214. [Google Scholar] [CrossRef]
- Huang, G.; Song, S.; Gupta, J.N.D.; Wu, C. Semi-supervised and unsupervised extreme learning machines. IEEE Trans. Cybern. 2014, 44, 2405–2417. [Google Scholar] [CrossRef]
- Breiman, L.; Friedman, J.H.; Olshen, R.A.; Stone, C.J. Chapman and Hall/CRC. In Classification and Regression Trees; Routledge: Abingdon, UK, 1984; ISBN 9780412048418. [Google Scholar]
- Qiu, J.; Wu, Q.; Ding, G.; Xu, Y.; Feng, S. A survey of machine learning for big data processing. EURASIP J. Adv. Signal Process. 2016, 2016, 1–16. [Google Scholar] [CrossRef] [Green Version]
- Wiering, M.A.; van Hasselt, H. Ensemble Algorithms in Reinforcement Learning. IEEE Trans. Syst. Man Cybern. Part B 2008, 38, 930–936. [Google Scholar] [CrossRef] [PubMed] [Green Version]
- Bartlett, P.L.; Jordan, M.I.; McAuliffe, J.D. Convexity, classification, and risk bounds. J. Am. Stat. Assoc. 2006, 101, 138–156. [Google Scholar] [CrossRef] [Green Version]
- Kleinbaum, D.G.; Klein, M. Statistics for Biology and Health. In Logistic Regression, 2nd ed.; Springer: New York, NY, USA, 2002; ISBN 978-0-387-21647-8. [Google Scholar]
- Peterson, L. K-nearest neighbor. Scholarpedia 2009, 4, 1883. [Google Scholar] [CrossRef]
- Keller, J.M.; Gray, M.R. A Fuzzy K-Nearest Neighbor Algorithm. IEEE Trans. Syst. Man Cybern. 1985, SMC-15, 580–585. [Google Scholar] [CrossRef]
- Devroye, L.; Györfi, L.; Lugosi, G. Stochastic Modelling and Applied Probability. In A Probabilistic Theory of Pattern Recognition, 1st ed.; Springer: New York, NY, USA, 1996; Volume 31, ISBN 978-1-4612-0711-5. [Google Scholar]
- Rish, I. An empirical study of the naive Bayes classifier. In Proceedings of the Seventeenth International Joint Conference on Artificial Intelligence (IJCAI 2001), Seattle, WA, USA, 4–10 August 2001; American Association for Artificial Intelligence: Seattle, WA, USA, 2001; Volume 3, pp. 41–46. [Google Scholar]
- Noble, W.S. What is a support vector machine? Nat. Biotechnol. 2006, 24, 1565–1567. [Google Scholar] [CrossRef]
- Safavian, S.R.; Landgrebe, D. A Survey of Decision Tree Classifier Methodology. IEEE Trans. Syst. Man Cybern. 1991, 21, 660–674. [Google Scholar] [CrossRef] [Green Version]
- Song, Y.Y.; Lu, Y. Decision tree methods: Applications for classification and prediction. Shanghai Arch. Psychiatry 2015, 27, 130–135. [Google Scholar] [CrossRef] [PubMed]
- Strobl, C.; Boulesteix, A.L.; Zeileis, A.; Hothorn, T. Bias in random forest variable importance measures: Illustrations, sources and a solution. BMC Bioinform. 2007, 8, 1–21. [Google Scholar] [CrossRef] [Green Version]
- Montgomery, D.C.; Peck, E.A.; Vining, G.G. Probability and Statistics. In Introduction to Linear Regression Analysis, 6th ed.; John Wiley & Sons: Hoboken, NJ, USA, 2021; ISBN 978-1-119-57875-8. [Google Scholar]
- Seber, G.A.F.; Lee, A.J. Linear Regression Analysis; John Wiley & Sons: Hoboken, NJ, USA, 2003; ISBN 978-0-471-41540-4. [Google Scholar]
- Prasad, A.M.; Iverson, L.R.; Liaw, A. Newer classification and regression tree techniques: Bagging and random forests for ecological prediction. Ecosystems 2006, 9, 181–199. [Google Scholar] [CrossRef]
- Anthony, M.; Bartlett, P.L. Neural Network Learning: Theoretical Foundations; Cambridge University Press: Cambridge, UK, 2009; ISBN 9780521118620. [Google Scholar]
- Kalchbrenner, N.; Grefenstette, E.; Blunsom, P. A Convolutional Neural Network for Modelling Sentences. In Proceedings of the 52nd Annual Meeting of the Association for Computational Linguistics (Volume 1: Long Papers), Baltimore, MD, USA, 22–27 June 2014; pp. 655–665. [Google Scholar]
- Gers, F.A.; Schmidhuber, J.; Cummins, F. Learning to forget: Continual prediction with LSTM. Neural Comput. 2000, 12, 2451–2471. [Google Scholar] [CrossRef]
- Huang, G.B.; Zhu, Q.Y.; Siew, C.K. Extreme learning machine: Theory and applications. Neurocomputing 2006, 70, 489–501. [Google Scholar] [CrossRef]
- Chen, T.; Guestrin, C. XGBoost: A scalable tree boosting system. In Proceedings of the ACM SIGKDD International Conference on Knowledge Discovery and Data Mining, San Francisco, CA, USA, 13–17 August 2016; ACM: San Francisco, CA, USA, 2016; Volume 13–17, pp. 785–794. [Google Scholar]
- Likas, A.; Vlassis, N.; Verbeek, J.J. The global k-means clustering algorithm. Pattern Recognit. 2003, 36, 451–461. [Google Scholar] [CrossRef] [Green Version]
- Birant, D.; Kut, A. ST-DBSCAN: An algorithm for clustering spatial-temporal data. Data Knowl. Eng. 2007, 60, 208–221. [Google Scholar] [CrossRef]
- Bendat, J.S.; Piersol, A.G. Engineering Applications of Correlation and Spectral Analysis, 2nd ed.; John Wiley & Sons: New York, NY, USA, 2013; ISBN 978-0-471-57055-4. [Google Scholar]
- Shlens, J. A Tutorial on Principal Component Analysis. arXiv 2014, arXiv:1404.1100. [Google Scholar]
- Tschannen, M.; Bachem, O.; Lucic, M. Recent advances in autoencoder-based representation learning. In Proceedings of the Third workshop on Bayesian Deep Learning (NeurIPS 2018), Montréal, QC, Canada, 7 December 2018. [Google Scholar]
- Aygun, R.C.; Yavuz, A.G. Network Anomaly Detection with Stochastically Improved Autoencoder Based Models. In Proceedings of the 4th IEEE International Conference on Cyber Security and Cloud Computing (CSCloud 2017), New York, NY, USA, 26–28 June 2017; IEEE: New York, NY, USA, 2017; pp. 193–198. [Google Scholar]
- Lei, X.; Yang, Z.; Yu, J.; Zhao, J.; Gao, Q.; Yu, H. Data-Driven Optimal Power Flow: A Physics-Informed Machine Learning Approach. IEEE Trans. Power Syst. 2021, 36, 346–354. [Google Scholar] [CrossRef]
- Wang, S.; Dehghanian, P.; Li, L.; Wang, B. A Machine Learning Approach to Detection of Geomagnetically Induced Currents in Power Grids. IEEE Trans. Ind. Appl. 2020, 56, 1098–1106. [Google Scholar] [CrossRef]
- Ravikumar, G.; Govindarasu, M. Anomaly Detection and Mitigation for Wide-Area Damping Control using Machine Learning. IEEE Trans. Smart Grid 2020, 1. [Google Scholar] [CrossRef]
- Zhang, Y.; Wang, X.; Wang, J.; Zhang, Y. Deep Reinforcement Learning Based Volt-VAR Optimization in Smart Distribution Systems. IEEE Trans. Smart Grid 2021, 12, 361–371. [Google Scholar] [CrossRef]
- Baker, K.; Bernstein, A. Joint Chance Constraints in AC Optimal Power Flow: Improving Bounds through Learning. IEEE Trans. Smart Grid 2019, 10, 6376–6385. [Google Scholar] [CrossRef] [Green Version]
- Li, N.; Li, B.; Gao, L. Transient Stability Assessment of Power System Based on XGBoost and Factorization Machine. IEEE Access 2020, 8, 28403–28414. [Google Scholar] [CrossRef]
- Hong, G.; Kim, Y.S. Supervised Learning Approach for State Estimation of Unmeasured Points of Distribution Network. IEEE Access 2020, 8, 113918–113931. [Google Scholar] [CrossRef]
- Karagiannopoulos, S.; Aristidou, P.; Hug, G. Data-Driven Local Control Design for Active Distribution Grids Using Off-Line Optimal Power Flow and Machine Learning Techniques. IEEE Trans. Smart Grid 2019, 10, 6461–6471. [Google Scholar] [CrossRef] [Green Version]
- Zhao, Y.; Chen, J.; Poor, H.V. A Learning-to-Infer Method for Real-Time Power Grid Multi-Line Outage Identification. IEEE Trans. Smart Grid 2020, 11, 555–564. [Google Scholar] [CrossRef] [Green Version]
- King, J.E.; Jupe, S.C.E.; Taylor, P.C. Network State-Based Algorithm Selection for Power Flow Management Using Machine Learning. IEEE Trans. Power Syst. 2015, 30, 2657–2664. [Google Scholar] [CrossRef]
- Labed, I.; Labed, D. Extreme learning machine-based alleviation for overloaded power system. IET Gener. Transm. Distrib. 2019, 13, 5058–5070. [Google Scholar] [CrossRef]
- Ray, P.K.; Mohanty, A.; Panigrahi, T. Power quality analysis in solar PV integrated microgrid using independent component analysis and support vector machine. Optik (Stuttg.) 2019, 180, 691–698. [Google Scholar] [CrossRef]
- Sahani, M.; Dash, P.K.; Samal, D. A real-time power quality events recognition using variational mode decomposition and online-sequential extreme learning machine. Measurement 2020, 157, 107597. [Google Scholar] [CrossRef]
- Turovic, R.; Stanisavljevic, A.; Dragan, D.; Katic, V. Machine learning for application in distribution grids for power quality applications. In Proceedings of the 2019 20th International Symposium on Power Electronics (Ee 2019), Novi Sad, Serbia, 23–16 October 2019; IEEE: Novi Sad, Serbia, 2019; pp. 1–6. [Google Scholar]
- Liao, H.; Milanovic, J.V.; Rodrigues, M.; Shenfield, A. Voltage Sag Estimation in Sparsely Monitored Power Systems Based on Deep Learning and System Area Mapping. IEEE Trans. Power Deliv. 2018, 33, 3162–3172. [Google Scholar] [CrossRef]
- Vantuch, T.; Misak, S.; Jezowicz, T.; Burianek, T.; Snasel, V. The Power Quality Forecasting Model for Off-Grid System Supported by Multiobjective Optimization. IEEE Trans. Ind. Electron. 2017, 64, 9507–9516. [Google Scholar] [CrossRef]
- Bagheri, A.; Gu, I.Y.H.; Bollen, M.H.J.; Balouji, E. A Robust Transform-Domain Deep Convolutional Network for Voltage Dip Classification. IEEE Trans. Power Deliv. 2018, 33, 2794–2802. [Google Scholar] [CrossRef]
- Sahani, M.; Dash, P.K. Automatic Power Quality Events Recognition Using Modes Decomposition Based Online P-Norm Adaptive Extreme Learning Machine. IEEE Trans. Ind. Inform. 2020, 16, 4355–4364. [Google Scholar] [CrossRef]
- Wang, J.; Xu, Z.; Che, Y. Power quality disturbance classification based on DWT and multilayer perceptron extreme learning machine. Appl. Sci. 2019, 9, 2315. [Google Scholar] [CrossRef] [Green Version]
- Shen, Y.; Abubakar, M.; Liu, H.; Hussain, F. Power Quality Disturbance Monitoring and Classification Based on Improved PCA and Convolution Neural Network for Wind-Grid Distribution Systems. Energies 2019, 12, 1280. [Google Scholar] [CrossRef] [Green Version]
- Deng, Y.; Wang, L.; Jia, H.; Tong, X.; Li, F. A Sequence-to-Sequence Deep Learning Architecture Based on Bidirectional GRU for Type Recognition and Time Location of Combined Power Quality Disturbance. IEEE Trans. Ind. Inform. 2019, 15, 4481–4493. [Google Scholar] [CrossRef]
- Cao, J.; Zhang, W.; Xiao, Z.; Hua, H. Reactive Power Optimization for Transient Voltage Stability in Energy Internet via Deep Reinforcement Learning Approach. Energies 2019, 12, 1556. [Google Scholar] [CrossRef] [Green Version]
- Abed, A. Improved Power Factor of Electrical Generation by using Clustering Neural Network. Int. J. Appl. Eng. Res. 2018, 13, 4633–4636. [Google Scholar]
- Zhang, X.; Wang, Y.; Zheng, Y.; Ding, R.; Chen, Y.; Wang, Y.; Cheng, X.; Yue, S. Reactive Load Prediction Based on a Long Short-Term Memory Neural Network. IEEE Access 2020, 8, 90969–90977. [Google Scholar] [CrossRef]
- Nakawiro, W. A Machine Learning Approach for Coordinated Voltage and Reactive Power Control. ECTI Trans. Electr. Eng. Electron. Commun. 2020, 18, 54–60. [Google Scholar] [CrossRef] [Green Version]
- Moreira, A.C.; Paredes, H.K.M.; de Souza, W.A.; Nardelli, P.H.J.; Marafão, F.P.; da Silva, L.C.P. Evaluation of Pattern Recognition Algorithms for Applications on Power Factor Compensation. J. Control Autom. Electr. Syst. 2018, 29, 75–90. [Google Scholar] [CrossRef] [Green Version]
- Valenti, M.; Bonfigli, R.; Principi, E.; Squartini, S. Exploiting the Reactive Power in Deep Neural Models for Non-Intrusive Load Monitoring. In Proceedings of the 2018 International Joint Conference on Neural Networks (IJCNN), Rio de Janeiro, Brazil, 8–13 July 2018; pp. 1–8. [Google Scholar]
- Keerthisinghe, C.; Mickelson, E.; Kirschen, D.S.; Shih, N.; Gibson, S. Improved PV Forecasts for Capacity Firming. IEEE Access 2020, 8, 152173–152182. [Google Scholar] [CrossRef]
- Wen, S.; Zhang, C.; Lan, H.; Xu, Y.; Tang, Y.; Huang, Y. A hybrid ensemble model for interval prediction of solar power output in ship onboard power systems. IEEE Trans. Sustain. Energy 2021, 12, 14–24. [Google Scholar] [CrossRef]
- Dhibi, K.; Fezai, R.; Mansouri, M.; Trabelsi, M.; Kouadri, A.; Bouzara, K.; Nounou, H.; Nounou, M. Reduced Kernel Random Forest Technique for Fault Detection and Classification in Grid-Tied PV Systems. IEEE J. Photovolt. 2020, 10, 1864–1871. [Google Scholar] [CrossRef]
- Zhang, Y.; Qin, C.; Srivastava, A.K.; Jin, C.; Sharma, R.K. Data-Driven Day-Ahead PV Estimation Using Autoencoder-LSTM and Persistence Model. IEEE Trans. Ind. Appl. 2020, 56, 7185–7192. [Google Scholar] [CrossRef]
- Chang, X.; Li, W.; Zomaya, A.Y. A Lightweight Short-Term Photovoltaic Power Prediction for Edge Computing. IEEE Trans. Green Commun. Netw. 2020, 4, 946–955. [Google Scholar] [CrossRef]
- Khan, M.A.; Kurukuru, V.S.B.; Haque, A.; Mekhilef, S. Islanding Classification Mechanism for Grid-Connected Photovoltaic Systems. IEEE J. Emerg. Sel. Top. Power Electron. 2020, 9, 1966–1975. [Google Scholar] [CrossRef]
- Wang, J.; Zhong, H.; Lai, X.; Xia, Q.; Wang, Y.; Kang, C. Exploring key weather factors from analytical modeling toward improved solar power forecasting. IEEE Trans. Smart Grid 2019, 10, 1417–1427. [Google Scholar] [CrossRef]
- Gao, W.; Wai, R.J. A Novel Fault Identification Method for Photovoltaic Array via Convolutional Neural Network and Residual Gated Recurrent Unit. IEEE Access 2020, 8, 159493–159510. [Google Scholar] [CrossRef]
- Catalina, A.; Alaiz, C.M.; Dorronsoro, J.R. Combining Numerical Weather Predictions and Satellite Data for PV Energy Nowcasting. IEEE Trans. Sustain. Energy 2020, 11, 1930–1937. [Google Scholar] [CrossRef]
- Ray, B.; Shah, R.; Islam, M.R.; Islam, S. A New Data Driven Long-Term Solar Yield Analysis Model of Photovoltaic Power Plants. IEEE Access 2020, 8, 136223–136233. [Google Scholar] [CrossRef]
- Yap, K.Y.; Sarimuthu, C.R.; Lim, J.M.Y. Grid Integration of Solar Photovoltaic System Using Machine Learning-Based Virtual Inertia Synthetization in Synchronverter. IEEE Access 2020, 8, 49961–49976. [Google Scholar] [CrossRef]
- Keerthisinghe, C.; Chapman, A.C.; Verbič, G. Energy Management of PV-Storage Systems: Policy Approximations Using Machine Learning. IEEE Trans. Ind. Inform. 2019, 15, 257–265. [Google Scholar] [CrossRef]
- Ashqar, H.I.; Almannaa, M.H.; Elhenawy, M.; Rakha, H.A.; House, L. Smartphone transportation mode recognition using a hierarchical machine learning classifier and pooled features from time and frequency domains. IEEE Trans. Intell. Transp. Syst. 2019, 20, 244–252. [Google Scholar] [CrossRef] [Green Version]
- Jia, J. Analysis of Alternative Fuel Vehicle (AFV) Adoption Utilizing Different Machine Learning Methods: A Case Study of 2017 NHTS. IEEE Access 2019, 7, 112726–112735. [Google Scholar] [CrossRef]
- Aksjonov, A.; Nedoma, P.; Vodovozov, V.; Petlenkov, E.; Herrmann, M. Detection and Evaluation of Driver Distraction Using Machine Learning and Fuzzy Logic. IEEE Trans. Intell. Transp. Syst. 2019, 20, 2048–2059. [Google Scholar] [CrossRef]
- Nallaperuma, D.; Nawaratne, R.; Bandaragoda, T.; Adikari, A.; Nguyen, S.; Kempitiya, T.; De Silva, D.; Alahakoon, D.; Pothuhera, D. Online Incremental Machine Learning Platform for Big Data-Driven Smart Traffic Management. IEEE Trans. Intell. Transp. Syst. 2019, 20, 4679–4690. [Google Scholar] [CrossRef]
- Gjoreski, M.; Gams, M.Z.; Luštrek, M.; Genc, P.; Garbas, J.U.; Hassan, T. Machine Learning and End-to-End Deep Learning for Monitoring Driver Distractions from Physiological and Visual Signals. IEEE Access 2020, 8, 70590–70603. [Google Scholar] [CrossRef]
- Li, Q.; Wang, F.; Wang, J.; Li, W. LSTM-Based SQL Injection Detection Method for Intelligent Transportation System. IEEE Trans. Veh. Technol. 2019, 68, 4182–4191. [Google Scholar] [CrossRef]
- Ou, J.; Lu, J.; Xia, J.; An, C.; Lu, Z. Learn, Assign, and Search: Real-Time Estimation of Dynamic Origin-Destination Flows Using Machine Learning Algorithms. IEEE Access 2019, 7, 26967–26983. [Google Scholar] [CrossRef]
- Khadilkar, H. A Scalable Reinforcement Learning Algorithm for Scheduling Railway Lines. IEEE Trans. Intell. Transp. Syst. 2019, 20, 727–736. [Google Scholar] [CrossRef]
- Zhang, K.; Liu, Z.; Zheng, L. Short-Term Prediction of Passenger Demand in Multi-Zone Level: Temporal Convolutional Neural Network with Multi-Task Learning. IEEE Trans. Intell. Transp. Syst. 2020, 21, 1480–1490. [Google Scholar] [CrossRef]
- Cheng, R.; Song, Y.; Chen, D.; Ma, X. Intelligent Positioning Approach for High Speed Trains Based on Ant Colony Optimization and Machine Learning Algorithms. IEEE Trans. Intell. Transp. Syst. 2019, 20, 3737–3746. [Google Scholar] [CrossRef]
- Alawad, H.; Kaewunruen, S.; An, M. Learning from Accidents: Machine Learning for Safety at Railway Stations. IEEE Access 2020, 8, 633–648. [Google Scholar] [CrossRef]
- Zhang, Z.; Hong, W.C.; Li, J. Electric Load Forecasting by Hybrid Self-Recurrent Support Vector Regression Model with Variational Mode Decomposition and Improved Cuckoo Search algorithm. IEEE Access 2020, 8, 14642–14658. [Google Scholar] [CrossRef]
- Feng, C.; Sun, M.; Zhang, J. Reinforced Deterministic and Probabilistic Load Forecasting via Q -Learning Dynamic Model Selection. IEEE Trans. Smart Grid 2020, 11, 1377–1386. [Google Scholar] [CrossRef]
- Ahmad, A.; Javaid, N.; Mateen, A.; Awais, M.; Khan, Z.A. Short-Term load forecasting in smart grids: An intelligent modular approach. Energies 2019, 12, 164. [Google Scholar] [CrossRef] [Green Version]
- Zheng, H.; Yuan, J.; Chen, L. Short-Term Load Forecasting Using EMD-LSTM neural networks with a xgboost algorithm for feature importance evaluation. Energies 2017, 10, 1168. [Google Scholar] [CrossRef] [Green Version]
- Dabbaghjamanesh, M.; Moeini, A.; Kavousi-Fard, A. Reinforcement Learning-based Load Forecasting of Electric Vehicle Charging Station Using Q-LearningTechnique. IEEE Trans. Ind. Inform. 2020, 17, 4229–4237. [Google Scholar] [CrossRef]
- Farsi, B.; Amayri, M.; Bouguila, N.; Eicker, U. On Short-Term Load Forecasting Using Machine Learning Techniques and a Novel Parallel Deep LSTM-CNN Approach. IEEE Access 2021, 9, 31191–31212. [Google Scholar] [CrossRef]
- Hafeez, G.; Alimgeer, K.S.; Khan, I. Electric load forecasting based on deep learning and optimized by heuristic algorithm in smart grid. Appl. Energy 2020, 269, 114915. [Google Scholar] [CrossRef]
- Han, L.; Peng, Y.; Li, Y.; Yong, B.; Zhou, Q.; Shu, L. Enhanced deep networks for short-term and medium-term load forecasting. IEEE Access 2019, 7, 4045–4055. [Google Scholar] [CrossRef]
- Chen, K.; Chen, K.; Wang, Q.; He, Z.; Hu, J.; He, J. Short-Term Load Forecasting with Deep Residual Networks. IEEE Trans. Smart Grid 2019, 10, 3943–3952. [Google Scholar] [CrossRef] [Green Version]
- El-Hendawi, M.; Wang, Z. An ensemble method of full wavelet packet transform and neural network for short term electrical load forecasting. Electr. Power Syst. Res. 2020, 182, 106265. [Google Scholar] [CrossRef]
Figure 1.
Artificial intelligence vs. Machine learning vs. Deep learning.

Figure 2.
Machine learning paradigms, algorithms, and applications in power systems.

Figure 3.
Frequencies of used techniques presented in the literature review.


Table 1.
Model Performance Evaluation Metrics.
| Discrete | Continuous | ||
|---|---|---|---|
| Metric | Formula | Metric | Formula |
| Accuracy | Mean Square Error (MSE) | ||
| Error | Root Mean Squared Error (RMSE) | ||
| Precision | Mean Absolute Error (MAE) | ||
| Recall | Mean Absolute Percentage Error (MAPE) | ||
| F1 | R-squared (R²) | ||
Table 2.
Overview of Research using Machine Learning for Power Flow.
| Reference | Year | Application | Data | Method(s) | Remark(s)/Contribution(s) |
|---|---|---|---|---|---|
| Lei et al. [39] | 2020 | Optimal Power Flow (OPF) | IEEE 39, 57, 118-bus, and Polish 2383-bus (wind and photovoltaic power connected) 30,000 samples for training, and 10,000 samples for validation | ELM | Decompose OPF via a data-driven regression framework with three stages stacked extreme learning machine (SELM); implemented the multiple supervised layers with reinforcement mode with an overall 98.71% accuracy rate, significantly higher than benchmarks. |
| Wang et al. [40] | 2020 | Online Detection of Geomagnetically Induced Currents in Power Grids | Simulation data based on real-life power grid operation (10,800 samples for training, 1200 samples for validation, and 6000 samples for testing) | CNN | Developed hybrid feature extraction consists of pseudo-continuous wavelet transform (PCWT) and short-time Fourier transform (STFT); improved overall detection accuracy to 90.15% for different noise levels and achieved the detection results within 30 m |
| Ravikumar et al. [41] | 2020 | Anomaly Detection and Mitigation (ADM) for Wide-Area Damping Control | Synchrophasor measurement data and simulated the cyber-physical system (CPS) dataset (60 fps transmission rate) | KNN and PCA | Improved efficiency of ADM with domain-specific features extraction and selection via Teager–Kaiser Energy Operator (TKEO), Principal Component Analysis (PCA), Wide-Area System Measures (WASMs), and Primitive Measures; Proposed KNN-based model with a 95.5% accuracy rate, better than other ML-based models. |
| Zhang et al. [42] | 2021 | Volt-VAR Optimization in Smart Distribution Systems | Unbalanced IEEE 13-bus and 123-bus systems (9000 operating conditions for training, and 13,000 operating conditions for testing) | Reinforcement learning | The improved accuracy rate of voltage regulation with an average of 99.80% compared to 90.02% of baselines; Achieved an average executive time of 21.7 and 46.2 ms for 13-bus and 123-bus systems, respectively, and 28.38% for the loss reduction percentage. |
| Baker et al. [43] | 2019 | Joint Chance Constraints in AC Optimal Power Flow | IEEE 37-node test feeder (5-min data from August 2012 weekdays) 1152 samples for training (4 days), and 864 samples for testing (3 days) | SVM | Improved classic methods based on union bound (or Boole’s inequality) and the accuracy rate with 0.19% and 4.73% error rate for false classification of binding and non-binding events, respectively. |
| Li et al. [44] | 2020 | Transient Stability Assessment of Power System | IEEE New England 10-machine 39-bus system, IEEE 16-machine 68-bus system, and IEEE 47-machine 140-bus system (5984, 11,792, and 29,520 samples, respectively) 6-s simulation time per instance, and 0.01-s step | XGBoost and FM | Proposed hybrid XGBoost-FM model robust to noise. Used extreme gradient boosting (XGBoost) for automatic feature builder, and factorization machine (FM) as a classifier with the enhanced detection time of 0.9349 s; improved accuracy by using both original and artificial features to 98.21%. |
| Hong et al. [45] | 2020 | State Estimation of Distribution Network | IEEE 13-, 34-, and 37-node test feeders (240 samples for training, and 60 samples for testing) | LR, SVM, and FFNN | Estimated the voltage magnitudes and angles of several successive buses with 0.01 p.u. and 0.189° error respectively; SVM outperformed LR and FFNN, especially when the relationship between inputs and outputs is unknown, the input bus was missing, there is a measurement error, and using few adjacent buses as input buses. |
| Karagiannopoulos et al. [46] | 2019 | Optimized Local Control for Active Distribution Grids | Seasonal historical data (30-day dataset; 1-h time resolution; 7200 samples) | SVM | Proposed Data-driven method to obtain local Distributed Energy Resources (DERs) controls without monitoring and communication infrastructure; outperformed standard industry local control with an overall RMSE accuracy of 0.158. |
| Zhao et al. [47] | 2020 | Real-Time Power Grid Multi-Line Outage Identification | IEEE 30, 118, and 300 bus systems (300,000, 800,000, and 2.2 million data generated, respectively) | ANN | Generated a large number of samples with Monte Carlo simulation with full-blown power flow models; Achieved an overall classification accuracy of 99%, and outstanding performance in recognizing multi-line outages in real-time with a small amount of data. |
| King et al. [48] | 2015 | Algorithm Selection for Power Flow Management | IEEE 14-bus (10,000 states for testing), IEEE 57-bus (10,000 states for testing), and a real 33-kV distribution networks (17,520 states for testing -a year of half-hourly profile data-) | ANN, DT and RF | Shown that ML-based methods can create effective algorithm selectors for power flow management based on algorithms’ behavior data within 1 ms for future complex networks |
| Labed et al. [49] | 2019 | Overloaded Power System Alleviation | Algerian (Adrar) 22-bus system (75% of data for training, and the remaining 25% for validation) | ELM | The proposed method outperforms SVM and ANN learning algorithms with 1.9465*10 MSE accuracy and 0.0023 s response time on the testing phase with generalization performance; this fast time response minimized the threat and risk of outage and cascade failure. |
Table 3.
Overview of Research Using Machine Learning for Power Quality.
| Reference | Year | Application | Data | Method(s) | Remark(s)/Contribution(s) |
|---|---|---|---|---|---|
| Ray et al. [50] | 2018 | PQ Disturbances Classification in Solar PV Integrated Microgrid | Generated dataset from solar PV integrated microgrid model (600 samples; 5-kHz sampling frequency) | SVM, ICA | Proposed the independent component analysis (ICA) and statistical feature extraction using SVM; ICA-SVM improved accuracy to 99.5% compared to 97.8% of traditional Wavelet transform-SVM |
| Sahani et al. [51] | 2020 | A Real-time Power Quality Events (PQEs) Recognition | Synthetic (50 samples for training, and 100 samples for validation) and real (100 samples per distortion –validation-) power quality events data | ELM | Robust anti-noise online PQEs classification; Outperform other models with 98.86% accuracy rate and 0.019 s response time |
| Turovic et al. [52] | 2019 | PQ Distortions Detection in Distribution Gird | IEEE 13-bus system modified with DG (85% of the samples for training, and 15% for validation) | ANN, SVM, and KNN | Detection speed comparison between ML algorithms and traditional FFT; ANN has the best detection’s speed with 0.432 ms (600% more than FFT) with a 99.41% accuracy rate |
| Liao et al. [53] | 2018 | Voltage Sag Estimation | IEEE 68-bus test network (374,400 faults simulated) | CNN | Automatic system area mapping and feature extraction in the input bus matrix from various local areas in the power network; reached 99.41% of overall estimation accuracy. |
| Vantuch et al. [54] | 2017 | PQ Forecasting for Off-Grid System | Experimental off-grid laboratory (141,537 one-minute-resolution measurements, more than 3 months) and simulated data | RF | More than overall 90% accuracy for forecasting short-term (15 min ahead) PQ disturbances |
| Bagheri et al. [55] | 2018 | Voltage Dip Classification | 6000 real measured voltage dips data over different countries One month of recording | CNN | Developed a robust automatic feature extraction using a space phasor model (SPM) and CNN; outperformed the other existing models with a 97.72% accuracy rate and 0.50% false alarm |
| Sahani et al. [56] | 2020 | Power Quality Events Recognition | Synthetic and laboratory PQDs (150 samples per class −50 for training and 100 for validation-; 3.2-kHz sampling frequency) | ELM and VDM | Developed an automatic PQEs patterns recognition system from nonstationary PQ data by using integrating variational mode decomposition (VMD) and Online P-Norm Adaptive Extreme Learning Machine (OPAELM); shorter event recognition time and classification accuracy rate of 99.3%. |
| Wang et al. [57] | 2019 | Power Quality Disturbance Classification | Synthetic data (16 PQDs) IEEE Power Engineering Society database (1000 samples; The influence of data imbalance is eliminated by applying an enhancement process) | ELM | Select less than 10 features out of 4500*1280 signal matrix via discrete wavelet transform (DWT) feature extraction and particle swarm optimization (PSO) feature selection; Proposed PSO hierarchical ELM (PSO-H-ELM) classification with automatic encoders and sparse constraints; overall classification accuracy rate is above 95%, and high calculation speed (less than 0.169 s). |
| Shen et al. [58] | 2019 | Detection and Classification of PQDs in Wind-Grid Distribution Systems | Synthetic data (2400 samples) Simulated data from the standard IEEE 13 node bus system with wind-grid distribution (5590 samples) 10-kHz sampling frequency | CNN and IPCA | Used Improved Principal Component Analysis (IPCA) for extracting statistical features; applied 1D-CNN classification, which gives 99.76% accuracy on average for different noise levels, higher than other classification methods. |
| Deng et al. [59] | 2019 | Type Recognition and Time Location of Combined Power Quality Disturbance | Synthetic data from IEEE 1159 power quality standard for training (1000 samples × 96 combinations of PQD) and real data generated in a lab for testing (140 samples) | GRU | Proposed bi-directional GRU model for classifying 96 different kinds of disturbances noiseless and with noise from 10 dB to 50 dB; have a 98% accuracy level on real operational data and the absolute error of starting-ending times location less than 0.469 ms. |
| Cao et al. [60] | 2019 | Transient voltage stability analysis based on frequency, active power, and reactive power | Simulated data of different nodes collected by phasor measurement units | CNN and Deep Learning | Decision optimization algorithm based on PQ parameters implemented; reactive power compensation decision based on deep learning performed |
| Abed [61] | 2018 | Power factor enhance and control | Simulated power system | Clustering neural network | The proposed method allows improving power factor |
| Zhang et al. [62] | 2020 | Reactive load prediction | SCADA data from a real power grid (357 busloads) Training set: data from June 1 to August 5 Test set: data from August 6 to August 22. 15-min sampling period | Deep learning | Reactive power load of buses can be accurately predicted; accuracy is better than that obtained with other prediction models; result of great significance for reactive voltage control |
| Nakawiro [63] | 2020 | Voltage and reactive power control | Simulated dataset of grip operation (on-load tap changer, load, and wind power) 1 year of operation (hourly data) | DT and KNN | The highest classification accuracy is achieved with a DT; accuracies obtained in the simulations are satisfactory for some classes; performance heavily relies on the distribution of the target output and number of samples per class |
| Moreira et al. [64] | 2018 | Power factor compensator (based on PQ parameters: power factor, unbalance factor, harmonic distortion, reactive power, etc.) | Training: Simulations characterized by a human specialist (1,355,154 samples per disturbing load). Real measurements added Test: IEEE 13-bus (111,055 samples). Three real test sets (disturbing loads) | DT, KNN, SVM, and ANN | PQ parameters used to analyze the functioning of a power system; DT is highly effective in classification; 100% accuracy achieved |
| Valenti et al. [65] | 2018 | Non-intrusive load monitoring based on active and reactive power | Two public datasets: Twenty-one power meters; 60-s sampling period; 2 years monitoring. Four different locations; multiple sampling frequencies | ANN | Introducing reactive power increases F1 score performance from +4.9% to +8.4%; reactive power provides significant information for non-intrusive load monitoring |
Table 4.
Overview of Research Using Machine Learning for Photovoltaics Systems.
| Reference | Year | Application | Data | Method(s) | Remark(s)/Contribution(s) |
|---|---|---|---|---|---|
| Keerthisinghe et al. [66] | 2020 | PV Forecasts for Capacity Firming | Dataset of 2013–2018 coming from empirical formula and 2019–2020 real-data of Arlington Microgrid; input frequency every half an hour for one day and two samples for output | LSTM | Proposed encoder-decoder LSTM-based model for short-term (1-h ahead) PV generation prediction resulted in reducing the yearly battery energy throughput by 29% and the number of battery cycles with a greater than 10% depth-of-discharge by 51%. |
| Wen et al. [67] | 2019 | PV Prediction in Ship Onboard | Historical hourly data of meteorological information along with the ship route movement for a year | ELM | The proposed ML-based model with the particle swarm optimization (PSO) has a MAPE accuracy level of 25.41% in the training phase for five-hour ahead prediction; the difference between prediction and experimental results has 14.96% of the absolute error in the test phase, which means it has a high potential in practical cases. |
| Dhibi et al. [68] | 2020 | Fault Detection and Classification in Grid-Tied PV System | Emulate the operational real PV array dataset using Chroma 62150H-1000S programmable dc power supply; 100 sampling time with 1501 samples for 6 different classes for both training and testing | RF and K-means | Proposed two classifiers based on Reduced kernel RF for detecting faults: Euclidean distance-based RK-RF and K-means clustering-based RK-RF with 100% accuracy and reduced computational time 65.16% and 53.33 compared to kernel RF, respectively; redundancy between samples was reduced by using Euclidean distance as a dissimilarity metric; the K-means clustering method used to reduce the training data amount. |
| Zhang et al. [69] | 2020 | Day-Ahead PV Estimation | Real datasets from Cupertino, CA, USA, from July 2015 to December 2016; and Catania, Sicily, Italy, from January 2011 to December 2011 with a 15-min sampling rate | LSTM and AE | Improved the prediction accuracy to 8.39% nRMSE compared to benchmarks with the proposed hybrid Auto Encoder (AE) LSTM model for three months testing; the proposed persistence model (PM) has a high accuracy of 0.72% nRMSE for consecutive clear days; Applied the Root Mean Squared Euclidean Distance Difference (RMSEDD) to extract and select the most valuable features to increase the model accuracy. |
| Chang et al. [70] | 2020 | Short-term Photovoltaic Power Prediction for Edge Computing | Real PV output and PV meteorological dataset; one sample every 30 min | LightGBM | Proposed a tree-structured self-organizing map (TS-SOM) algorithm for clustering weather; used Bayesian optimization algorithm is employed for temporal pattern aggregation to determine the optimal size of time steps; the proposed LightGBM outperforms other algorithms in training and execution time (0.020 s) with 35.49 RMSE accuracy, suited for edge computing devices. |
| Khan et al. [71] | 2020 | Islanding Classification for Grid-Connected PV | Simulation data; total size equals 4526 samples and 7 features; 3168 samples for training and 679 samples for testing | ANN | Proposed islanding detection model-based Wavelet transform for feature extraction and Multi-layered Perceptron (MLP) for classification with 97.8% accuracy under 0.2 s on unseen conditions. |
| Wang et al. [72] | 2019 | Key Weather Factors from Analytical Modeling Toward Improved PV Forecasting | Real hourly dataset for a year of three PV arrays in Australia from April 2012 to June 2013 with 11 independent variables | SVM, ANN, and KNN | Improved the accuracy level for each season by using PCA for feature extraction and KNN for classifying the prediction period into the historical periods with the most similar weather situations; for example, on sunny days, with the proposed method, SVM has 3.97 instead of 8.14, ANN has 4.09 instead of 8.45, and weighted KNN has 8.86 instead of 9.33 nRMSE accuracy; this method helps ANN converges much faster with 37.72% computational time reduction. |
| Gao et al. [73] | 2020 | Fault Identification Method for Photovoltaic Array | Simulation dataset with 1320 samples and experimental dataset with 1892 samples with a ratio of 6:2:2 for training, validation, and testing | CNN and GRU | Outperformed benchmark methods with 98.41% accuracy in 28.1 ms detection time using CNN as automatic feature extractions and Residual-GRU for memorizing time-series dynamic features; outperformed benchmarks also in the presence of 10 dB to 50 dB noise level; reached accuracy of 95.23% when some features are missing (temperatures and irradiances). |
| Catalina et al. [74] | 2020 | PV Energy Nowcasting | Hourly satellite and Numerical Weather Predictions (NWP) dataset with 4645 sample size for 2015 | SVR | Proposed Gaussian SVRs models using satellite data and NWP information to improve the PV energy nowcasting in the three real experimental regions. |
| Ray et al. [75] | 2020 | Long-term PV Output Forecasting | Historical hourly datasets of 24 years of four different locations in North Queensland in Australia; dataset from 1990 to 2013 was used for training and 2014 for testing | LSTM and CNN | The proposed hybrid model, consisting of CNN and LSTM, outperforms other methods with RMSE lower than 15 for all studied locations and low computational cost (203.63 s) for training and prediction. |
| Yap et al. [76] | 2020 | Grid Integration of PV | Simulation dataset with 0.1 s sampling time | Reinforcement learning | Proposed the new virtual inertia control algorithm for integrating PV to a grid with higher frequency nadir, lower frequency deviation (reduced by 0.1 Hz), smaller steady-state error (reduced by 27%), faster settling time (reduced by 35%), lesser active power injection or absorption, and lesser overshooting compared to traditional approaches. |
| Keerthisinghe et al. [77] | 2019 | Energy Management of PV-Storage Systems | Historical and one year-long simulation datasets with 30 min time intervals for each day | ANN | Proposed an ANN-based model based on dynamic programming (DP), which, compared to other methods, has better quality and faster response time (27.15 s); this method reduced a daily and yearly electric cost by more than 50% for four different scenarios considering PV output, electrical demand, electricity price, and battery SOC. |
Table 5.
Overview of Research using Machine Learning for Transportation.
| Reference | Year | Application | Data | Method(s) | Remark(s)/Contribution(s) |
|---|---|---|---|---|---|
| Ashqar et al. [78] | 2019 | Transportation Mode Recognition | Real data of GPS, accelerometer, gyroscope, and rotation vector sensors through a smartphone app for 10 travelers with 25 Hz sampling frequency | Two-layer hierarchical framework RF-SVM | Introduced new extracted frequency domain features and increased accuracy rate to 97.02% compared to 95.10% of traditional approaches |
| Jia [79] | 2019 | Analysis of Alternative Fuel Vehicle Adoption | Person-, household-, trip- and vehicle real-dataset (2017 NHTS Dataset) from April 2016 to April 2017 | RF | Extraction influencing factors from large-scale 2017 NHTS Dataset and Categorized them; RF outperformed other models (LR, NB, SVM, and DT) with good accuracy (97.99%) and high AUC value for adoption prediction. |
| Aksjonov et al. [80] | 2019 | Detection and Evaluation of Driver Distraction | Simulation data: speed limit, a radius of the road, lane-keeping offset, and vehicle speed for 18 subjects with 50 Hz sampling frequency | Nonlinear regression based on Euclidean distance and Fuzzy logic | The proposed method improved the RMSE accuracy level from 2.1345 to 1.9992 for speed and 0.1506 to 0.1405 for distance. Training time also decreased from 148.072 to 96.150 s compared to the standard ANFIS predictor |
| Nallaperuma et al. [81] | 2019 | Online Smart Traffic Management | Real-time Bluetooth sensor network data and social media data (Twitter) from the arterial road network in Victoria, Australia; 24 and 7 days data for training and testing, respectively, with data horizon equal to 15 min | LSTM and Reinforcement learning | Short-term traffic flow with normal fluctuation prediction with 0.0727 MAE accuracy; overcome the limitation of labeling data and strict assumptions regarding data and traffic behaviors. |
| Gjoreski et al. [82] | 2020 | Monitoring Driver Distractions | Real data of 68 people through physiological sensors, the emotional response, and facial-expression extraction with 1 Hz sampling frequency | Comparison of classical ML and deep learning algorithms | The classical extreme gradient boosting (XGB) outperforms the deep learning method with 94% F1-score accuracy compared to 87% for classifying complete driving sessions. |
| Li et al. [83] | 2019 | Security: SQL Injection Detection | Real-data and data augmentation from enterprises and various social platforms; 36,422 real samples and 30,000 generated samples | Deep LSTM network | Overcome the overfitting problem and increase accuracy (93.47–99.58%) due to data augmentation compared to the shallow and deep ML algorithms. |
| Ou et al. [84] | 2019 | Real-Time Estimation of Dynamic Origin-Destination flow | Generate training dataset from real-traffic dataset and traffic survey, and testing on real-time data with 15-min intervals sampling for 15 days in June 2017 | CNN | Capture the dynamic mapping patterns and reconstruct trajectories with MAPE average accuracy less than 5 (vehicle/15 min) on testing |
| Khadilkar et al. [85] | 2018 | Scheduling Railway Lines | Real single- and multi-track railway data of different routes with various number of trains and stations in routes | Reinforcement learning | Scalable to large scale dataset due to transfer learning; manage large, realistic problem instances in computation times and outperform other traditional techniques. |
| Zhang et al. [86] | 2020 | Short-term Passenger Demand Prediction | Real taxi dataset of New York City from January 2016 to June 2018 for 63 zones | MTL-TCNN | An automatic feature selector algorithm; outperform other models with 2.5% RMSE accuracy |
| Cheng et al. [87] | 2018 | High-Speed Trains Positioning | Beijing-Shanghai high-speed railway real-data contains 725 groups of data | KNN | Improve KNN performance by applying ant colony optimization (ACO) and online learning algorithms; obtain a better cluster number of positioning data; Outperform other algorithms with 2.21 MAE accuracy. |
| Alawad et al. [88] | 2019 | Railway Safely and Accidents | Real data of accidents and passenger information like passenger age and time of accident occurrence for 71 accidents | DT | Developed a classification model regarding the occurrence of accidents with good prediction accuracy of 88.7% on test data |
Table 6.
Overview of Research Using Machine Learning for Load forecasting.
| Reference | Year | Application | Data | Method(s) | Remark(s)/Contribution(s) |
|---|---|---|---|---|---|
| Zhang et al. [89] | 2020 | Medium-term Load Forecasting | Two real-world datasets: New York (1200 hourly electricity demand values of February 2018) and Queensland (1200 half-hour electric load values of January 2017) region | VMD, SR, SVR, CBCS | This study proposed a novel hybrid model based on variational mode decomposition (VMD), self-recurrent (SR) mechanism, support vector regression (SVR), chaotic mapping mechanism, and cuckoo search (CBCS). The VMD-SR-SVRCBCS outperformed other medium-range prediction methods (240 half-hours window) in both cases with 2.5 and 0.9 MAPE of New York and Queensland, respectively. |
| Feng et al. [90] | 2020 | Short-term Load Forecasting | Real hourly load data of University of Texas as Dallas for 2014 and 2015 | Reinforcement learning | This study proposed a deterministic and probabilistic load prediction using the two Q-learning agents to select the best model locally from deterministic load forecasting methods and ten state-of-the-art ML-based models. The results show 50–60% accuracy improvements compared to single-phase benchmarks models. |
| Ahmad et al. [91] | 2019 | A-Day Ahead Load Forecasting in Smart Grids | Real hourly data of two USA grids (DAYTOWN, Ohio and EKPC, Kentucky) for two years (2014–2015) | ANN | This study considers both accuracy and execution time to develop their model to scale well in bigger datasets. The authors introduced the pre-preparation, prediction, and optimization modules. Taking advantage of a heuristics-based optimization method minimized MAPE while reaching 98.76% accuracy, which was relatively better than existing bi-level techniques. |
| Zheng et al. [92] | 2017 | Short- and Medium- Term Load Prediction | Real hourly data of electricity load of ISO New England (2003–2016) | PCA, LSTM, XGBoost with K-means | The authors presented a hybrid algorithm based on supervised and unsupervised machine learning techniques as follows: firstly, they applied empirical mode decomposition (EMD) and similar days selection days to extract dominant features, then, they made predictions with LSTM considering a very rich dataset for 11 years for training, one year for validation, and one year (2016) for testing. The similarity between days achieved by XGboost-based weighted k-means. The testing results for one-day and one-week ahead shows this hybrid method improved the average accuracy of the LSTM-based model from 5.43 to 1.08 MAPE and 8.74 to 1.59 for a day ahead and a week ahead, respectively. |
| Dabbaghjamanesh et al. [93] | 2020 | A-Day Ahead Load Forecasting for EV Charging Station | Synthetic dataset with hourly resolution | Reinforcement learning | This study proposed a reinforcement learning-based model to predict a day ahead EV charging station load demand. The proposed Q-learning model outperformed CNN and RNN models in three different scenarios (coordinated, uncoordinated, and smart charging) in terms of MSE metrics. Higher accuracy, higher speed, and flexibility are three main advantages of the proposed model. |
| Farsi et al. [94] | 2021 | Short to Long Term Ahead Load Forecasting (1–30 days ahead) | Real datasets of hourly load consumption of Malaysia (2009 to 2010) and Germany (2012–2016) | CNN and LSTM | This article proposed a parallel LSTM-CNN Network (PLCNet). Compared to others, this study’s main advantage is to use LSTM and CNN in parallel and concatenate their outputs with a dense layer to make the final prediction. The proposed method outperformed statistical and machine learning models with 98.23% R-square accuracy for Malaysians and improved Germany’s R-square accuracy from 83.17 to 91.18% for a day ahead load prediction. |
| Hafeez et al. [95] | 2020 | A-Day Ahead Load Forecasting | Real hourly load data of three USA power grids (FE, EKPC, and Dayton) from 2005 to 2012 | ANN (restricted Boltzmann machine) | The authors introduced a hybrid model based on a deep neural network (restricted Boltzmann machine), modified mutual information (MMI) technique to extract features, and proposed a genetic wind-driven (GWDO) optimization method to adjust the model’s parameters. Together with their fine data engineering procedure, this new optimization algorithm helps to improve the MAPE accuracy between 4.7% to 17.3% compared to benchmarks. Moreover, their model’s average convergence time rate is 52 s which is less than 58–102 s of benchmarks’ expectations time. |
| Han et al. [96] | 2019 | Medium to Long Term Load Forecasting (a week to a year) | Two hourly real daily load datasets, Hangzhou from January 2015 to March 2017 and Toronto from May 2002 to July 2016. | CNN and LSTM | The authors proposed two methods, time-dependency convolutional neural network (TD-CNN) and cycle-based long short-term memory (C-LSTM), that outperformed other benchmarks in terms of accuracy and execution time. Their models’ main advantages are extraction of the long-term global combined features and short-term local similar features in the LSTM-based model and conversion of load’s temporal correlation into spatial ones in the CNN-based model. |
| Chen et al. [97] | 2019 | A-Day Ahead Load Forecasting | Two hourly real datasets North American Utility and the ISO-NE from 1985 to 1992; the datasets of 1991 and 1992 were used for testing | ANN with residual connections | This study introduced a deep neural network with residual connections, one of the well-known techniques to overcome the problem of lost information in earlier layers in a deep network by applying direct links from primary layers to deeper ones. Applying ensemble strategy on the two rich datasets provides the generalization capacity of their model. The proposed model improved the MAPE error rate from 1.48 of the best benchmark model to 1.447 in the ISO-NE dataset and from 1.73 to 1.575 for the North-American utility dataset, which also implies the robustness to temperature variation of the proposed model. |
| El-Hendawi et al. [98] | 2020 | A-Day Ahead Load Forecasting | Real dataset of the hourly electric market of Ontario, Canada from 2011 to 2016 | ANN | The authors used the wavelet transform to decompose the input data into different levels with different frequencies to feed several neural networks. Instead of having one model, they trained different neural-based models with part of transformed input data and made final forecasting considering all models’ predictions. The proposed ensemble model improved the MAPE accuracy by 20% compared to other traditional neural networks. |
Publisher’s Note: MDPI stays neutral with regard to jurisdictional claims in published maps and institutional affiliations. |
© 2021 by the authors. Licensee MDPI, Basel, Switzerland. This article is an open access article distributed under the terms and conditions of the Creative Commons Attribution (CC BY) license (https://creativecommons.org/licenses/by/4.0/).
Share and Cite
MDPI and ACS Style
Miraftabzadeh, S.M.; Longo, M.; Foiadelli, F.; Pasetti, M.; Igual, R. Advances in the Application of Machine Learning Techniques for Power System Analytics: A Survey. Energies 2021, 14, 4776. https://doi.org/10.3390/en14164776
AMA Style
Miraftabzadeh SM, Longo M, Foiadelli F, Pasetti M, Igual R. Advances in the Application of Machine Learning Techniques for Power System Analytics: A Survey. Energies. 2021; 14(16):4776. https://doi.org/10.3390/en14164776
Chicago/Turabian StyleMiraftabzadeh, Seyed Mahdi, Michela Longo, Federica Foiadelli, Marco Pasetti, and Raul Igual. 2021. "Advances in the Application of Machine Learning Techniques for Power System Analytics: A Survey" Energies 14, no. 16: 4776. https://doi.org/10.3390/en14164776
Note that from the first issue of 2016, this journal uses article numbers instead of page numbers. See further details here.