About the Influence of Eco-Friendly Fluids on the Performance of an External Gear Pump
by
 ,
,
Gabriele Muzzioli
1,* ,
,
Luca Montorsi
1,2, 
Andrea Polito
1,2,
Andrea Lucchi
3,
Alessandro Sassi
3 and
Massimo Milani
1,2 1
Department of Sciences and Methods for Engineering, University of Modena and Reggio Emilia, 42122 Reggio Emilia RE, Italy
2
InterMech—MO.RE., 41125 Modena MO, Italy
3
Dana Motion Systems Italia S.r.l., 42124 Reggio Emilia RE, Italy
*
Author to whom correspondence should be addressed.
Energies 2021, 14(4), 799; https://doi.org/10.3390/en14040799
Submission received: 20 December 2020
/
Revised: 25 January 2021
/
Accepted: 27 January 2021
/
Published: 3 February 2021
(This article belongs to the Special Issue Gear Pumps and Motors)
Abstract
:This paper wants to investigate the effects of eco-friendly fluids on the thermo-fluid-dynamic performance of external gear pumps in order to provide a first response to the increasingly urgent demands of the green economy. A computational fluid dynamics (CFD) approach based on the overset mesh technique was developed for the simulation of the full 3D geometry of an industrial pump, including all the characteristic leakages between components. A sensibility analysis of the numerical model with respect to different fluid properties was performed on a commonly used mineral oil, showing the key role of the fluid compressibility on the prediction of the pump volumetric efficiency. Moreover, the influence of temperature internal variations on both fluid density and viscosity were included. The BIOHYDRAN TMP 46 eco-friendly industrial oil and olive oil were further considered in this work, and the results of the simulations were compared for the three fluid configurations. A slightly lower volumetric efficiency was derived for the olive oil application against the other two conditions, but suggestive improvements were produced in terms of pressure and temperature distributions. Therefore, based on the obtained results, this paper encourages research activity towards the use of eco-friendly fluids in the hydraulic field.

1. Introduction
External gear pumps (EGPs) are largely employed in hydraulic applications thanks to their higher volumetric efficiency with respect to other positive displacement machines, as well as to their inherent propensity of dealing with a wide variety of operating fluids. These features typically make EGPs the best choice for several applications such as the lubrication process in automobiles and heavy truck power transmissions, where mineral oil is still commonly adopted, and within industrial continuous inkjet printers where a gear pump is used to deliver the ink-flow to the print head. Moreover, the possibility of working with high-viscosity fluids has led to a widespread use of EGPs in the food industry to transport, for example, vegetable fats, chocolate, and margarine. Constructively, the very simple internal structure of EGPs along with the minimum number of mechanical components gives them compactness and weight reduction with respect to other pumps, resulting in lower manufacturing costs. On the other hand, the most restrictive limitation of EGPs is their fixed displacement characteristic that is not suitable for applications where an adjustable flow rate is required.
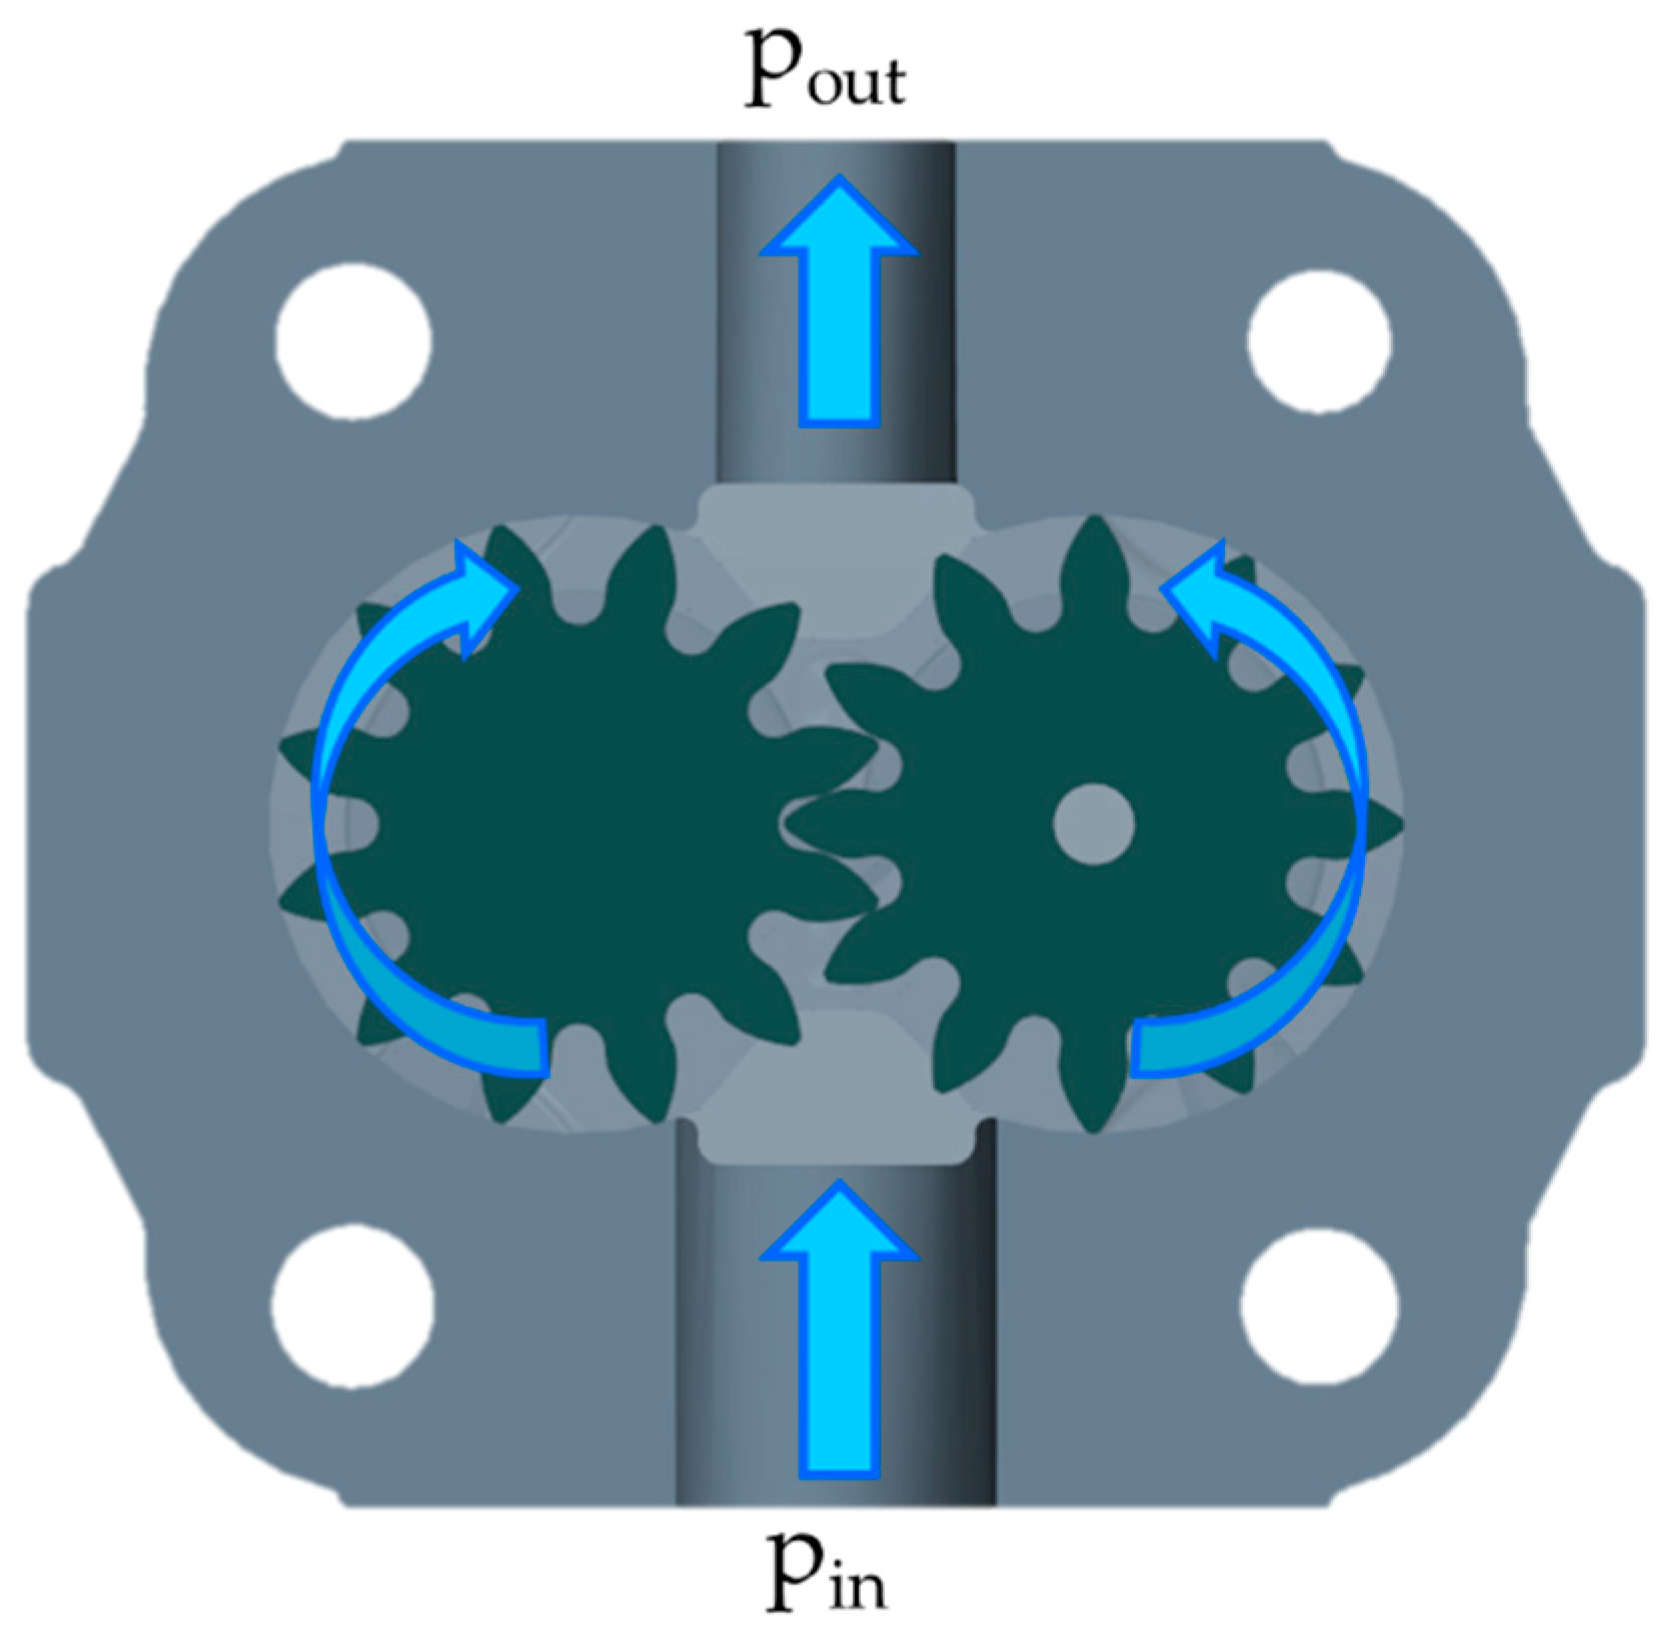
The working principle of EGPs is very simple because it is based on the meshing of two rotating gear wheels: the driving gear and the driven gear. The driving gear derives its motion from an external motor through a shaft connection, and the resulting rotational speed, a function of the gear ratio, is then transmitted to the driven gear by means of the meshing teeth pair. Therefore, in EGPs, the motion of the two gears is exploited to move the operating fluid from suction to delivery through the chamber between two adjacent teeth and the housing of the pump. Focusing on a single displacement chamber, the fluid is sucked in all over the volume expansion produced by the separation of the two mating teeth. Subsequently, as previously described, the fluid is transferred into the circumferential direction during the rotation of the wheel until the chamber opens to the pressure port and the delivered flow rate is finally produced by the compression of the control volume when entering the meshing region. In Figure 1, a set of blue arrows highlights the flow path produced by the gears’ rotation within a generic EGP.
Despite showing high volumetric efficiency, EGPs are characterized by several clearances where leakages may occur. In detail, the most influential gaps on the flow losses of EGPs are those between the tip of the teeth and the pump housing, namely the radial gaps, and those on the lateral sides of the gears, namely the axial gaps. In particular, the axial gaps allow for leakages both in the circumferential direction, directly to the suction side of the pump, and in the radial direction, through narrow gaps between the gear shafts and their journal bearings, which represent the drain connections of the pump. In these terms, there are several EGPs with slightly movable bushings that allow for a gap variation based on force balances in order to limit leakages through the axial gaps for high operating pressures.
The purpose of the previous paragraphs is to briefly introduce the reader to EGPs, which are the object of study in this paper. However, a more detailed description of the internal dynamics of these volumetric units requires thorough analytical models including geometrical and operating parameters of a pump. The authors of [1,2] presented a a very exhaustive picture of EGPs’ functioning.
In the past few decades, many studies have been carried out to deeply investigate the flow-dynamical and mechanical response of EGPs. In [3], a complete review of the methodologies used for the analysis of the gear machines was reported, and it highlighted the large interest in EGP simulation thanks to the worldwide spread of many computational environments for 0D/1D and 3D hydraulic models.
Among the first research works focusing on EGPs, in [4], a quasi-steady state mathematical model of the machine, accounting for the set of differential equations that define the volume variation within the displacement chamber, was developed.
In the following years, the growing desire for very detailed information about EGPs’ operating parameters along with the increasing computational power of computers led to the implementation of several numerical models. Firstly, the lumped parameter approach was used as a design tool to predict the effect of different parameters on the overall performance of a machine, thus leading to more efficient pumps in terms of both fluid-dynamical and mechanical characteristics. In [5], the early version of a lumped parameter model developed by the author’s research group for the analysis of EGPs was introduced, showing a good agreement between numerical results and experimental data. Subsequently, this model has been progressively optimized, including in [6], where the effect of fluid temperature variation within the pump was analyzed in order to have a precise estimation of the volumetric efficiency. Moreover, many other lumped parameter models of EGPs have been built for different purposes, including the optimization of the running in process in [7], the prediction of the pressure transient within the inter-teeth volume in [8], and the analysis of the axial balancing in [9].
However, despite deeply assisting and influencing the design of more efficient EGPs, the 0D/1D approach alone is typically not sufficient for a precise description of the time-evolution of the physical parameters within a full pump domain. Consequently, many 3D numerical tools have also been employed for the local investigation of both fluid-dynamical and mechanical phenomena in order to further increase the performance of machines, as well as to significantly extend their lifetimes. In [10], a finite element three-dimensional model of the static and dynamic contact-impact between the two gear wheels of an EGP was presented, while in [11], the same methodology was applied to a gerotor pump to determine stresses and deformations in cycloidal gears. In [12], a comparison between two axial clearance compensation systems of EGPs was addressed by means of a finite element method (FEM) analysis, thus proving the importance of this methodology in the detailed design phase of these volumetric machines. In [13], a combined numerical approach based on the computational fluid dynamics (CFD) method, FEM analysis, and acoustic analogy algorithm was developed to evaluate the noise emissions of an EGP.
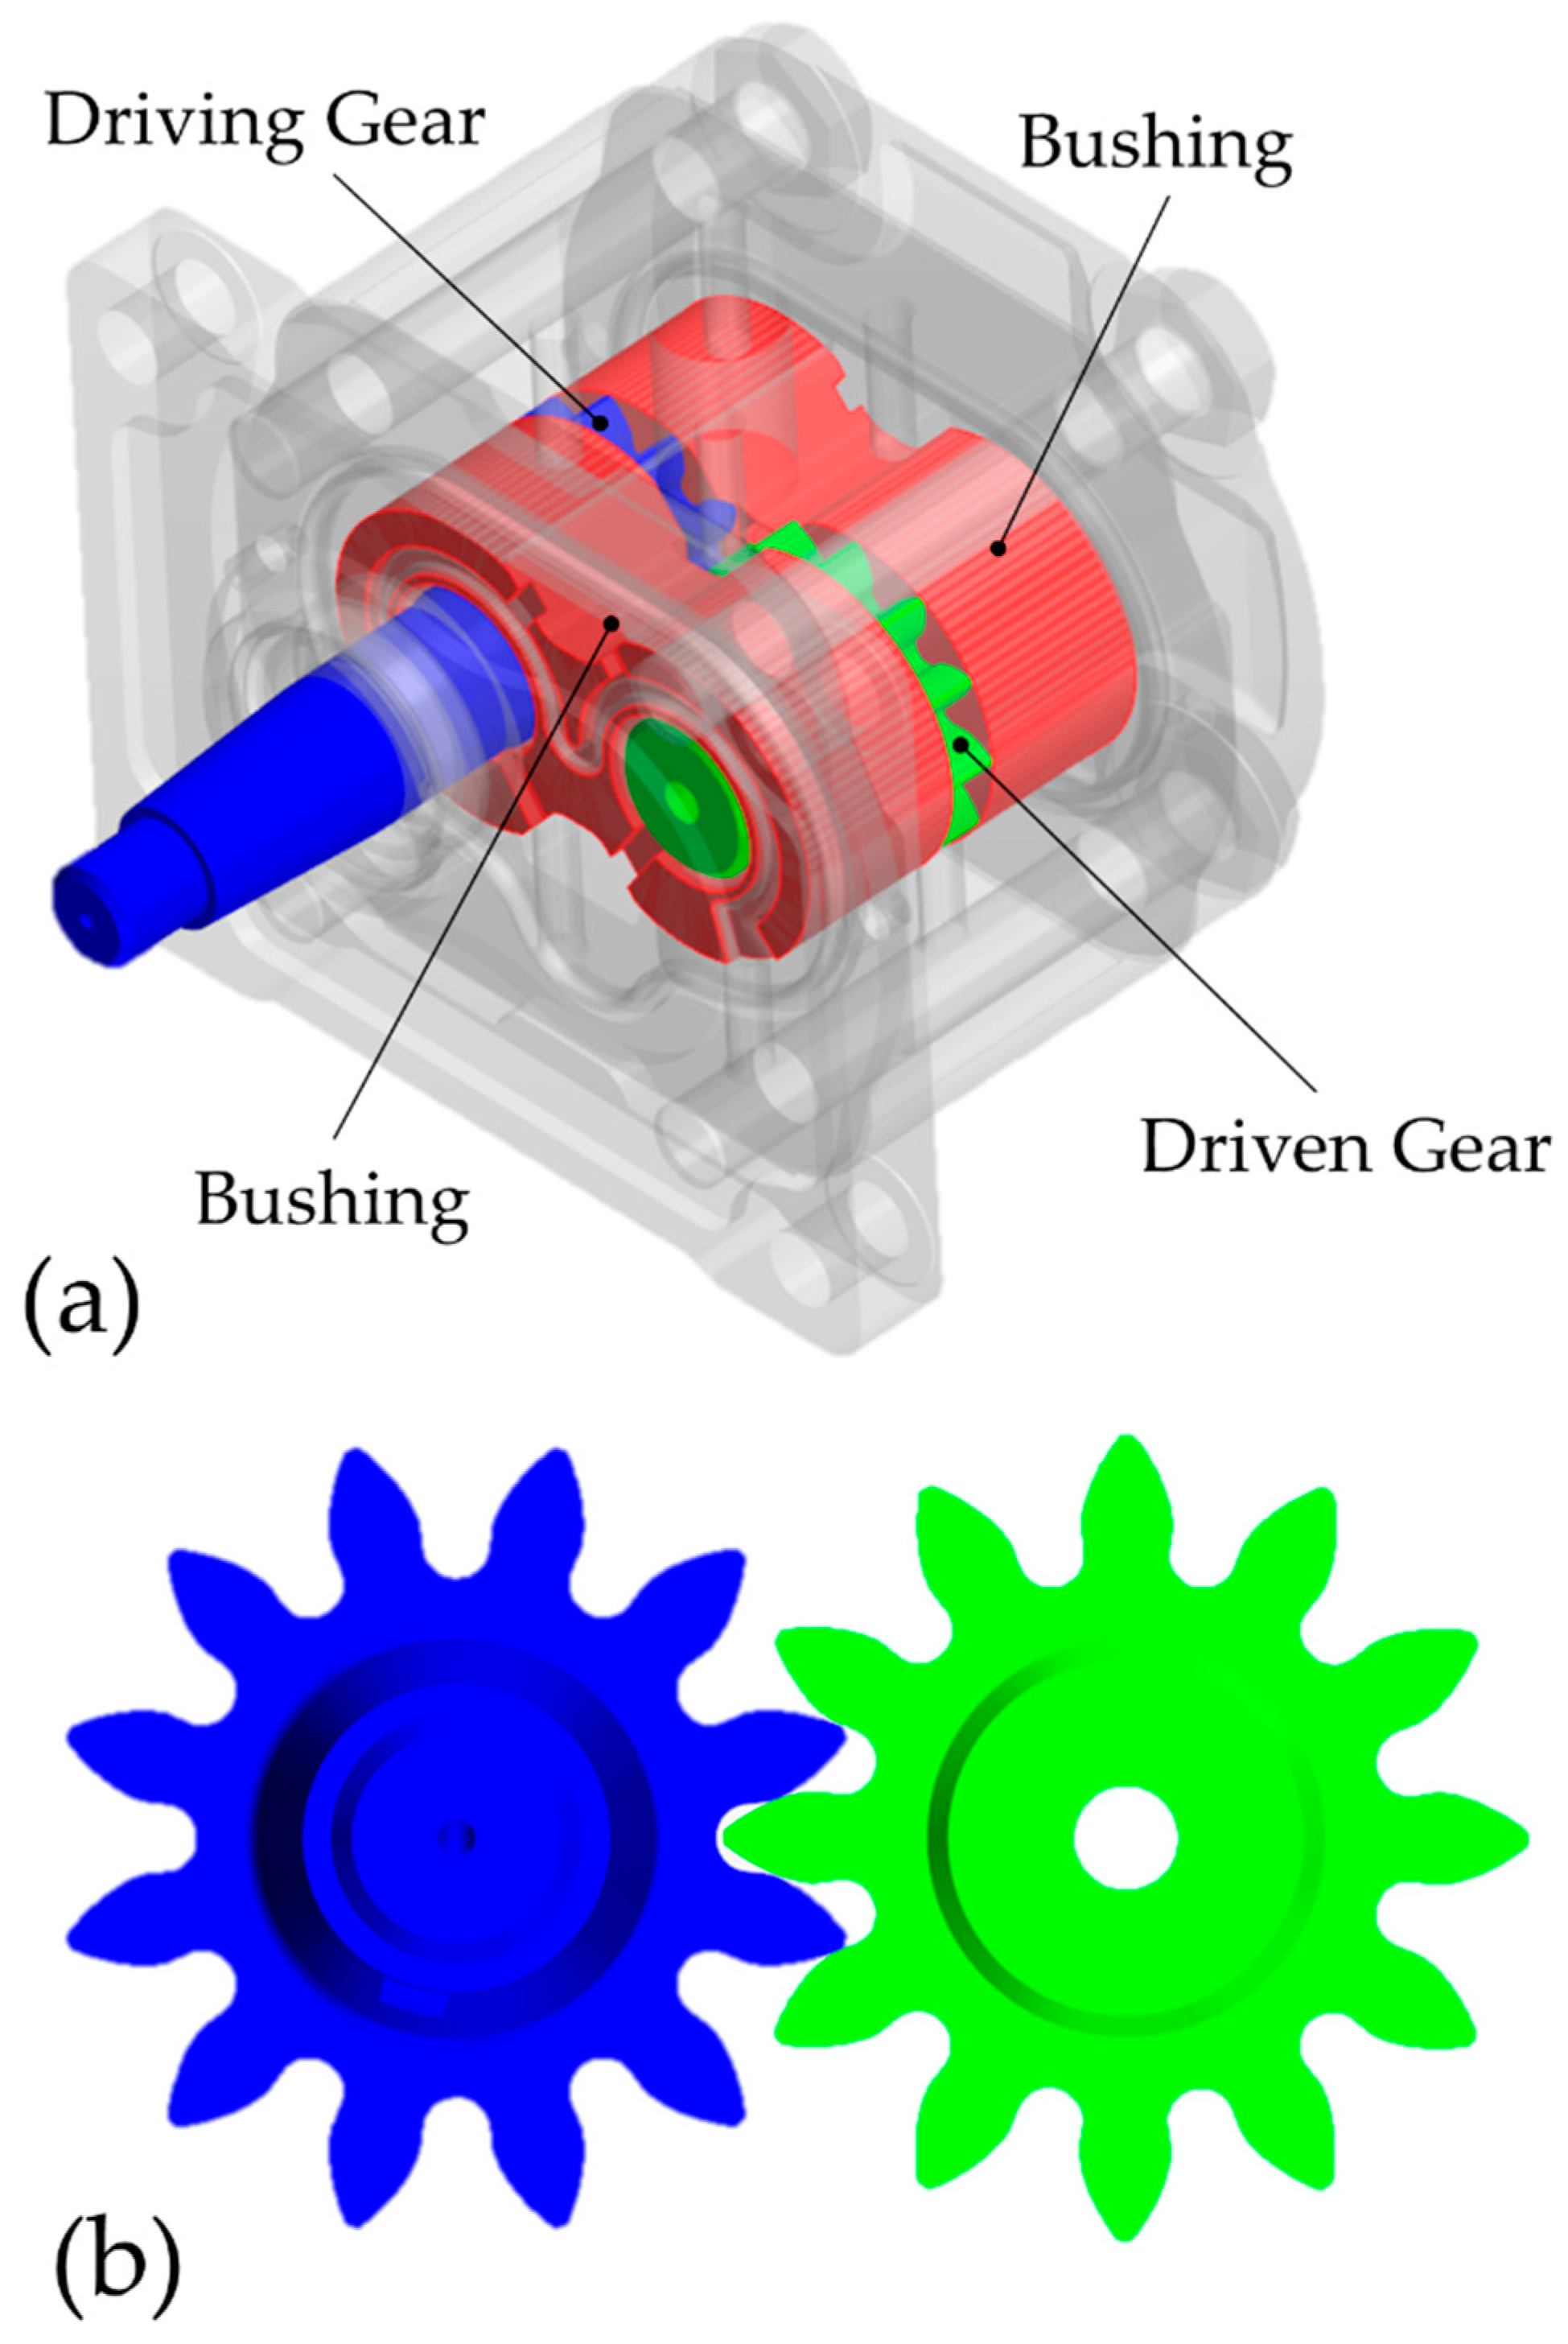
In this paper, a three-dimensional CFD methodology for the analysis of EGPs is proposed. This work focuses on an industrial pump including two spur gears and two lateral bushings to perform axial gap compensation at high loads. All the internal leakages of the machine were considered, and the effect of different working fluids was evaluated with respect to the volumetric efficiency of the pump at predetermined operating conditions. Figure 2a shows a three-dimensional prospect of the reference pump with a particular focus on its main mechanical components, while Figure 2b represents a frontal view of the two gears, whose geometrical features are summarized in Table 1.
As revealed by [3], the CFD approach has been widely used in the last five years for the study of the fluid-dynamic behavior of EGPs. In [14], a CFD model of an EGP was developed, but strong assumptions were made since no gaps between the components were taken into account. In [15], the effect of the radial gap was examined by means of a simplified gear geometry within a 2D domain under steady-state conditions. The results’ discrepancy between the theoretical and numerical ones proved the necessity of considering both the real geometry and real motion of the gear to achieve a consistent response. In [16], a full-3D CFD analysis of an EGP including radial gaps showed good agreement with experimental data. Nevertheless, the effect of the axial clearances was neglected in this simulation, thus introducing slight inaccuracies in the numerical predictions. In particular, the authors of [17,18] highlighted the non-negligible contribution of the axial leakages on the volumetric efficiency of EGPs, while in [19], a CFD-axial motion coupled model was developed for the accurate description of the lateral bushings’ balancing in gear pumps and motors.
This paper aimed to introduce the reader to a novel CFD methodology based on the overset mesh approach for the simulation of EGPs. The same technique was exploited by the authors’ research group to evaluate the performance of a gerotor pump in [20] and the thermo-fluid-dynamic behavior of a piston water pump in [21], but no material was found in the literature about the dynamic simulation of a full-3D EGP by means of the overset mesh tool, which is proposed here for the first time. The influence of fluid compressibility was assessed, and three operating fluids were tested in order to address the possibility of running the investigated pump in eco-friendly mode. In particular, two biodegradable liquids—the industrial Total BIOHYDRAN TMP 46 and olive oil—were compared in terms of pump performance with an ISO VG 46 mineral oil typically adopted in this positive displacement unit. Moreover, the fluid temperature distribution within the pump was monitored, and the effect of temperature variation on fluid density and viscosity was considered.
2. Materials and Methods
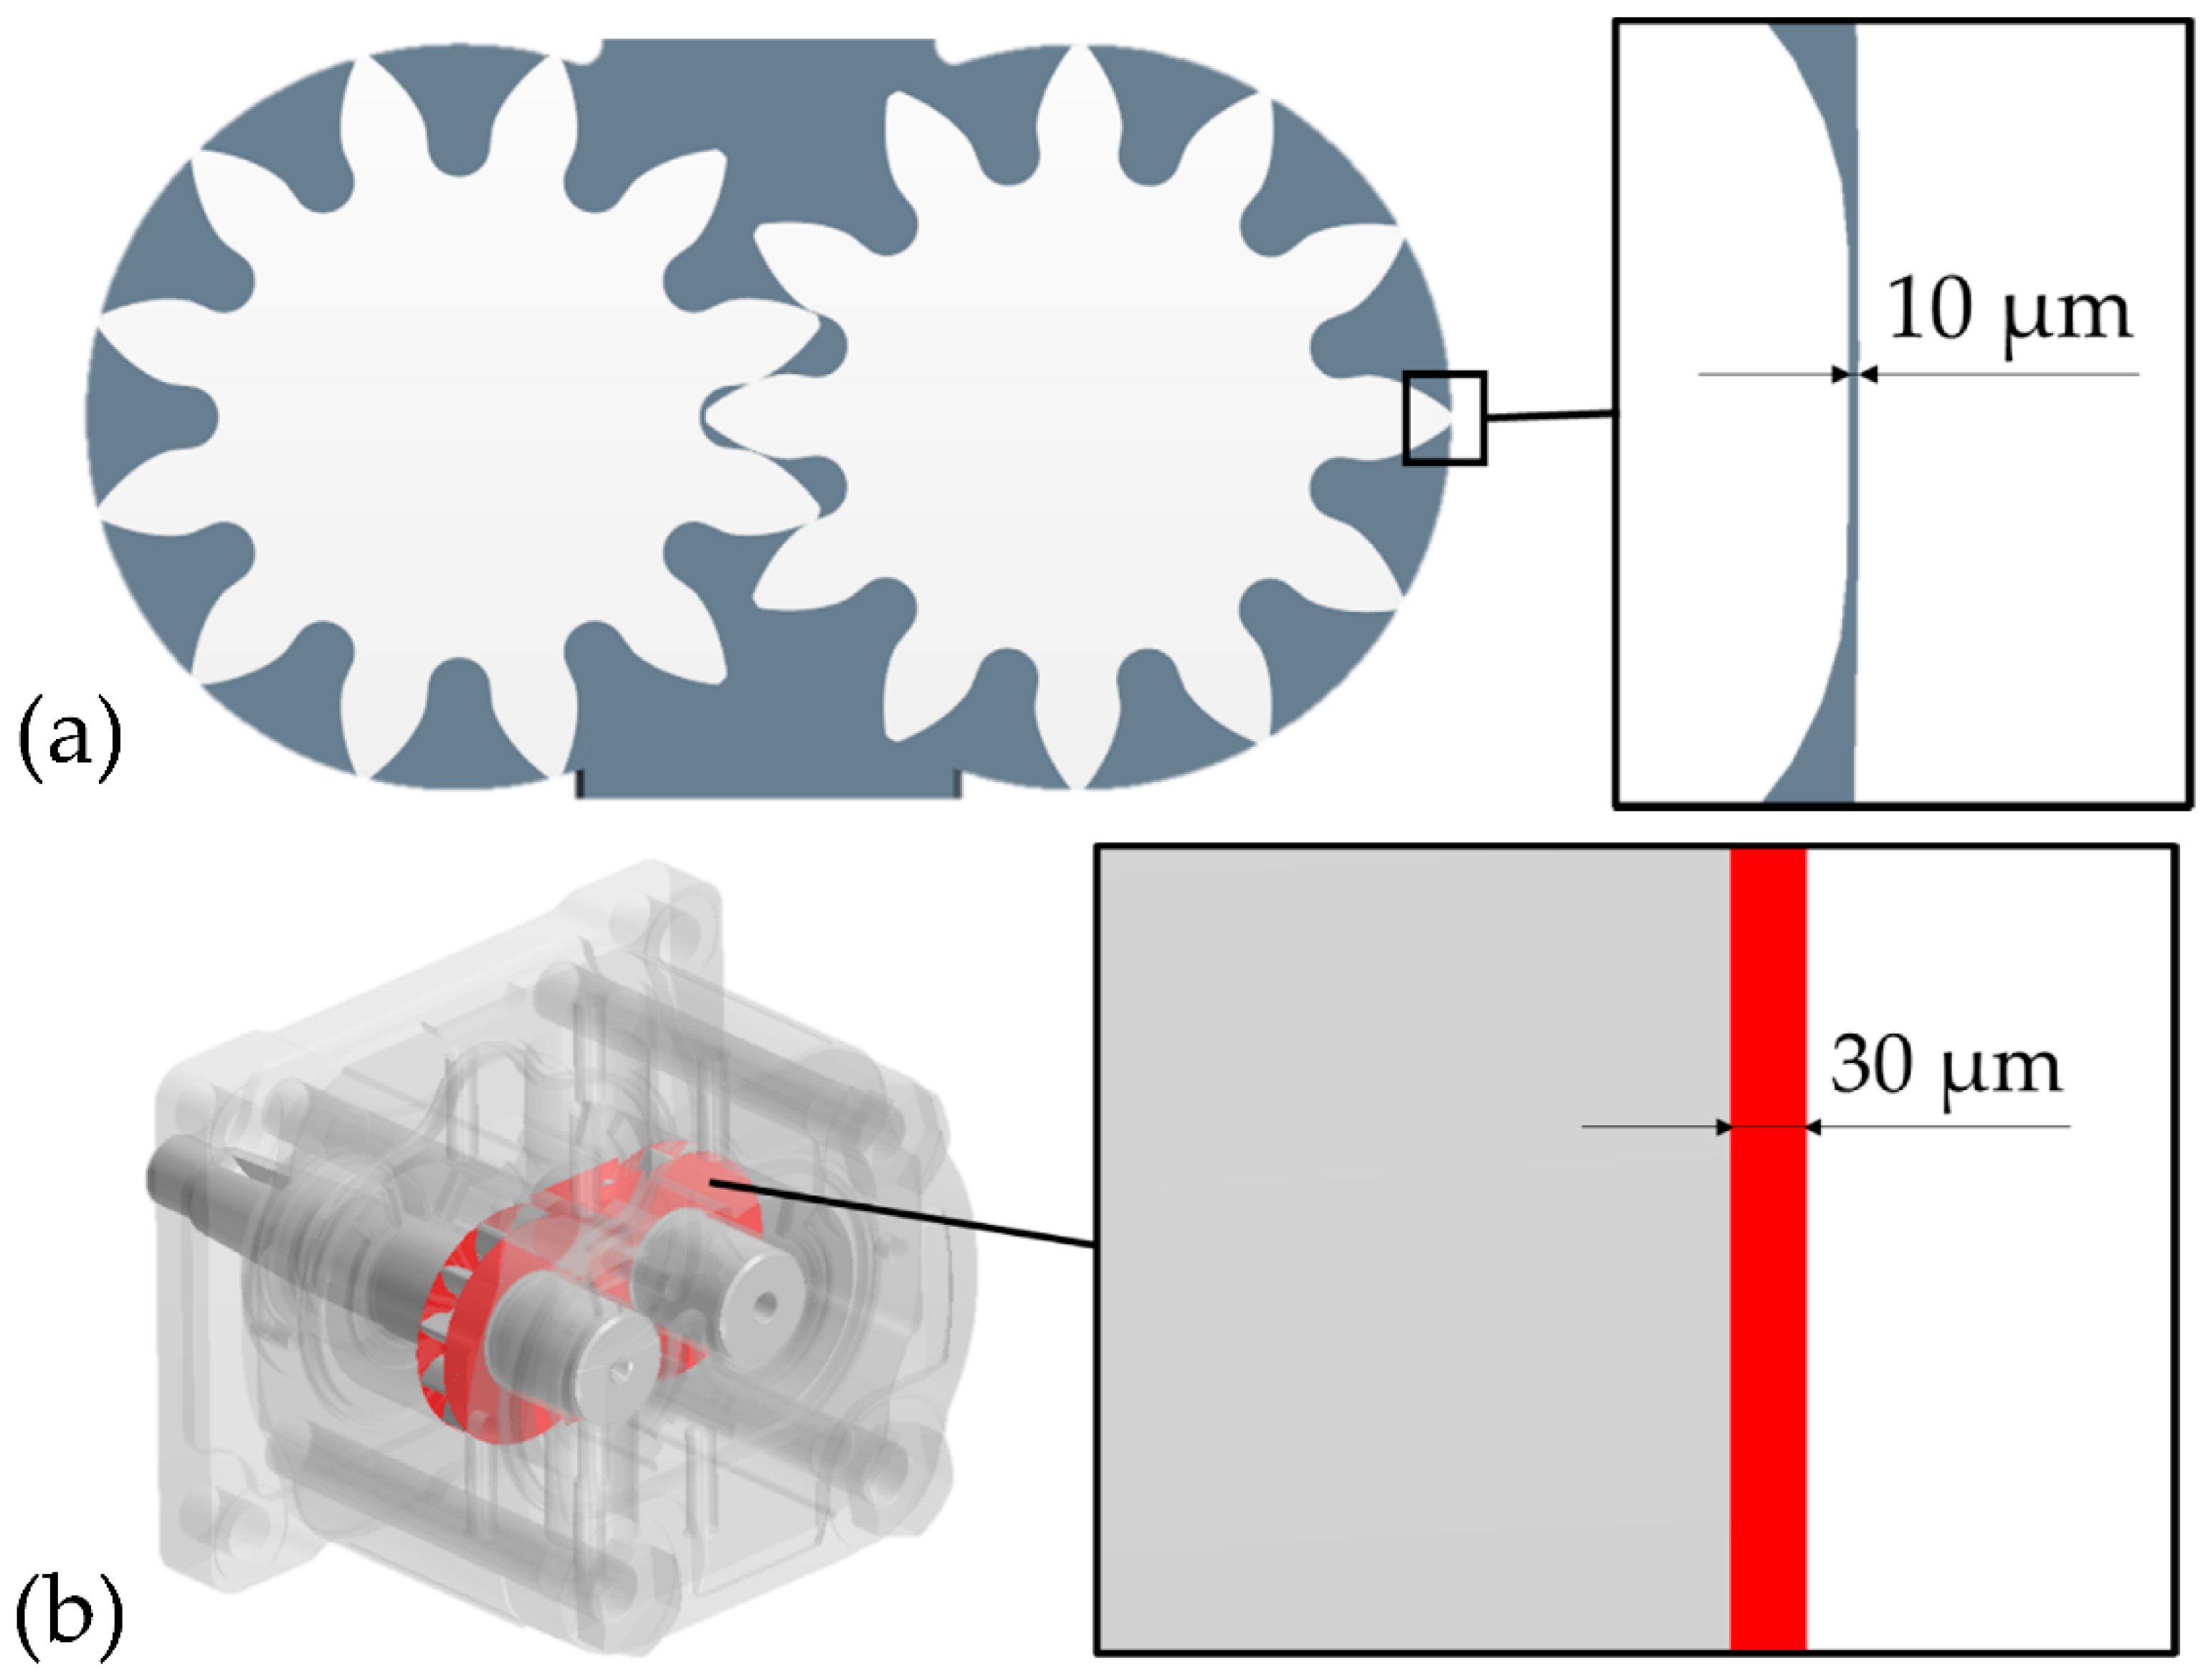
The CFD analysis of the EGP was performed with the multi-purpose STAR-CCM+ v.15.02.009 software, licensed by Siemens PLM Software, Plano, TX, USA [22]. The internal fluid domain was extracted from the 3D geometry of the real component within the computer-aided design (CAD) environment included in the software. The resulting geometry was farther divided into different regions in order to meet the guidelines of the overset mesh procedure used in this work. Furthermore, a fundamental step for an accurate prediction of the volumetric efficiency of the pump was the geometrical description of all the leakages occurring in the interstices between the mechanical components of the pump. Much research has been done on this subject and, in particular, on the micro-motion dynamics of bushings and gears, which are the main objects responsible for the deviation of the pump from its theoretical kinematics, thus producing gaps with variable heights. These gaps’ variation slightly influences the flow losses and, consequently, the overall volumetric efficiency of the pump. However, no micro-motions were addressed in this paper, and conventional gaps’ heights were chosen according to [1]. In detail, a 10 μm radial clearance was modeled at the tip of the teeth, while a 30 μm clearance was set on the lateral sides of the two wheels, representative of a nominal gear-bushing coupling tolerance. A 10-μm gap at the outer side of the two bushings was also considered in order to include the non-ideal coupling between the bushings and the front and rear end plates in the model. In Figure 3a, a zoomed view of a tooth tip region highlights the 10-μm radial leakage, while in Figure 3b, a lateral view of a single gear points out the 30-μm axial leakage.
The methodology for the CFD analysis presented in this manuscript was based on the overset mesh approach. This singular tool of STAR-CCM+ allowed us to simulate variable fluid domains defined by the time-dependent positioning of single or multiple moving objects. The innovative feature of this method is the capability of discretizing computational domains with several different meshes that overlap each other in an arbitrary manner. The procedure required a background region that enclosed the entire solution domain and one or more overset regions containing the bodies involved in the simulation. Therefore, the main idea behind a standard overset mesh approach is to shape a fluid domain by cutting the fixed background region through the moving overset regions.
The overset methodology becomes particularly useful when modeling deformations of a solution domain due to the rigid motion of multiple bodies. This is the case of EGPs where the rotations of the two gears induce continuous variations of the fluid geometry in the meshing area of the pump. In [20], an CFD analysis of a double inlet gerotor pump carried out by the authors’ research group proved the effectiveness of the overset mesh tool in developing three-dimensional dynamic models of gear pumps.
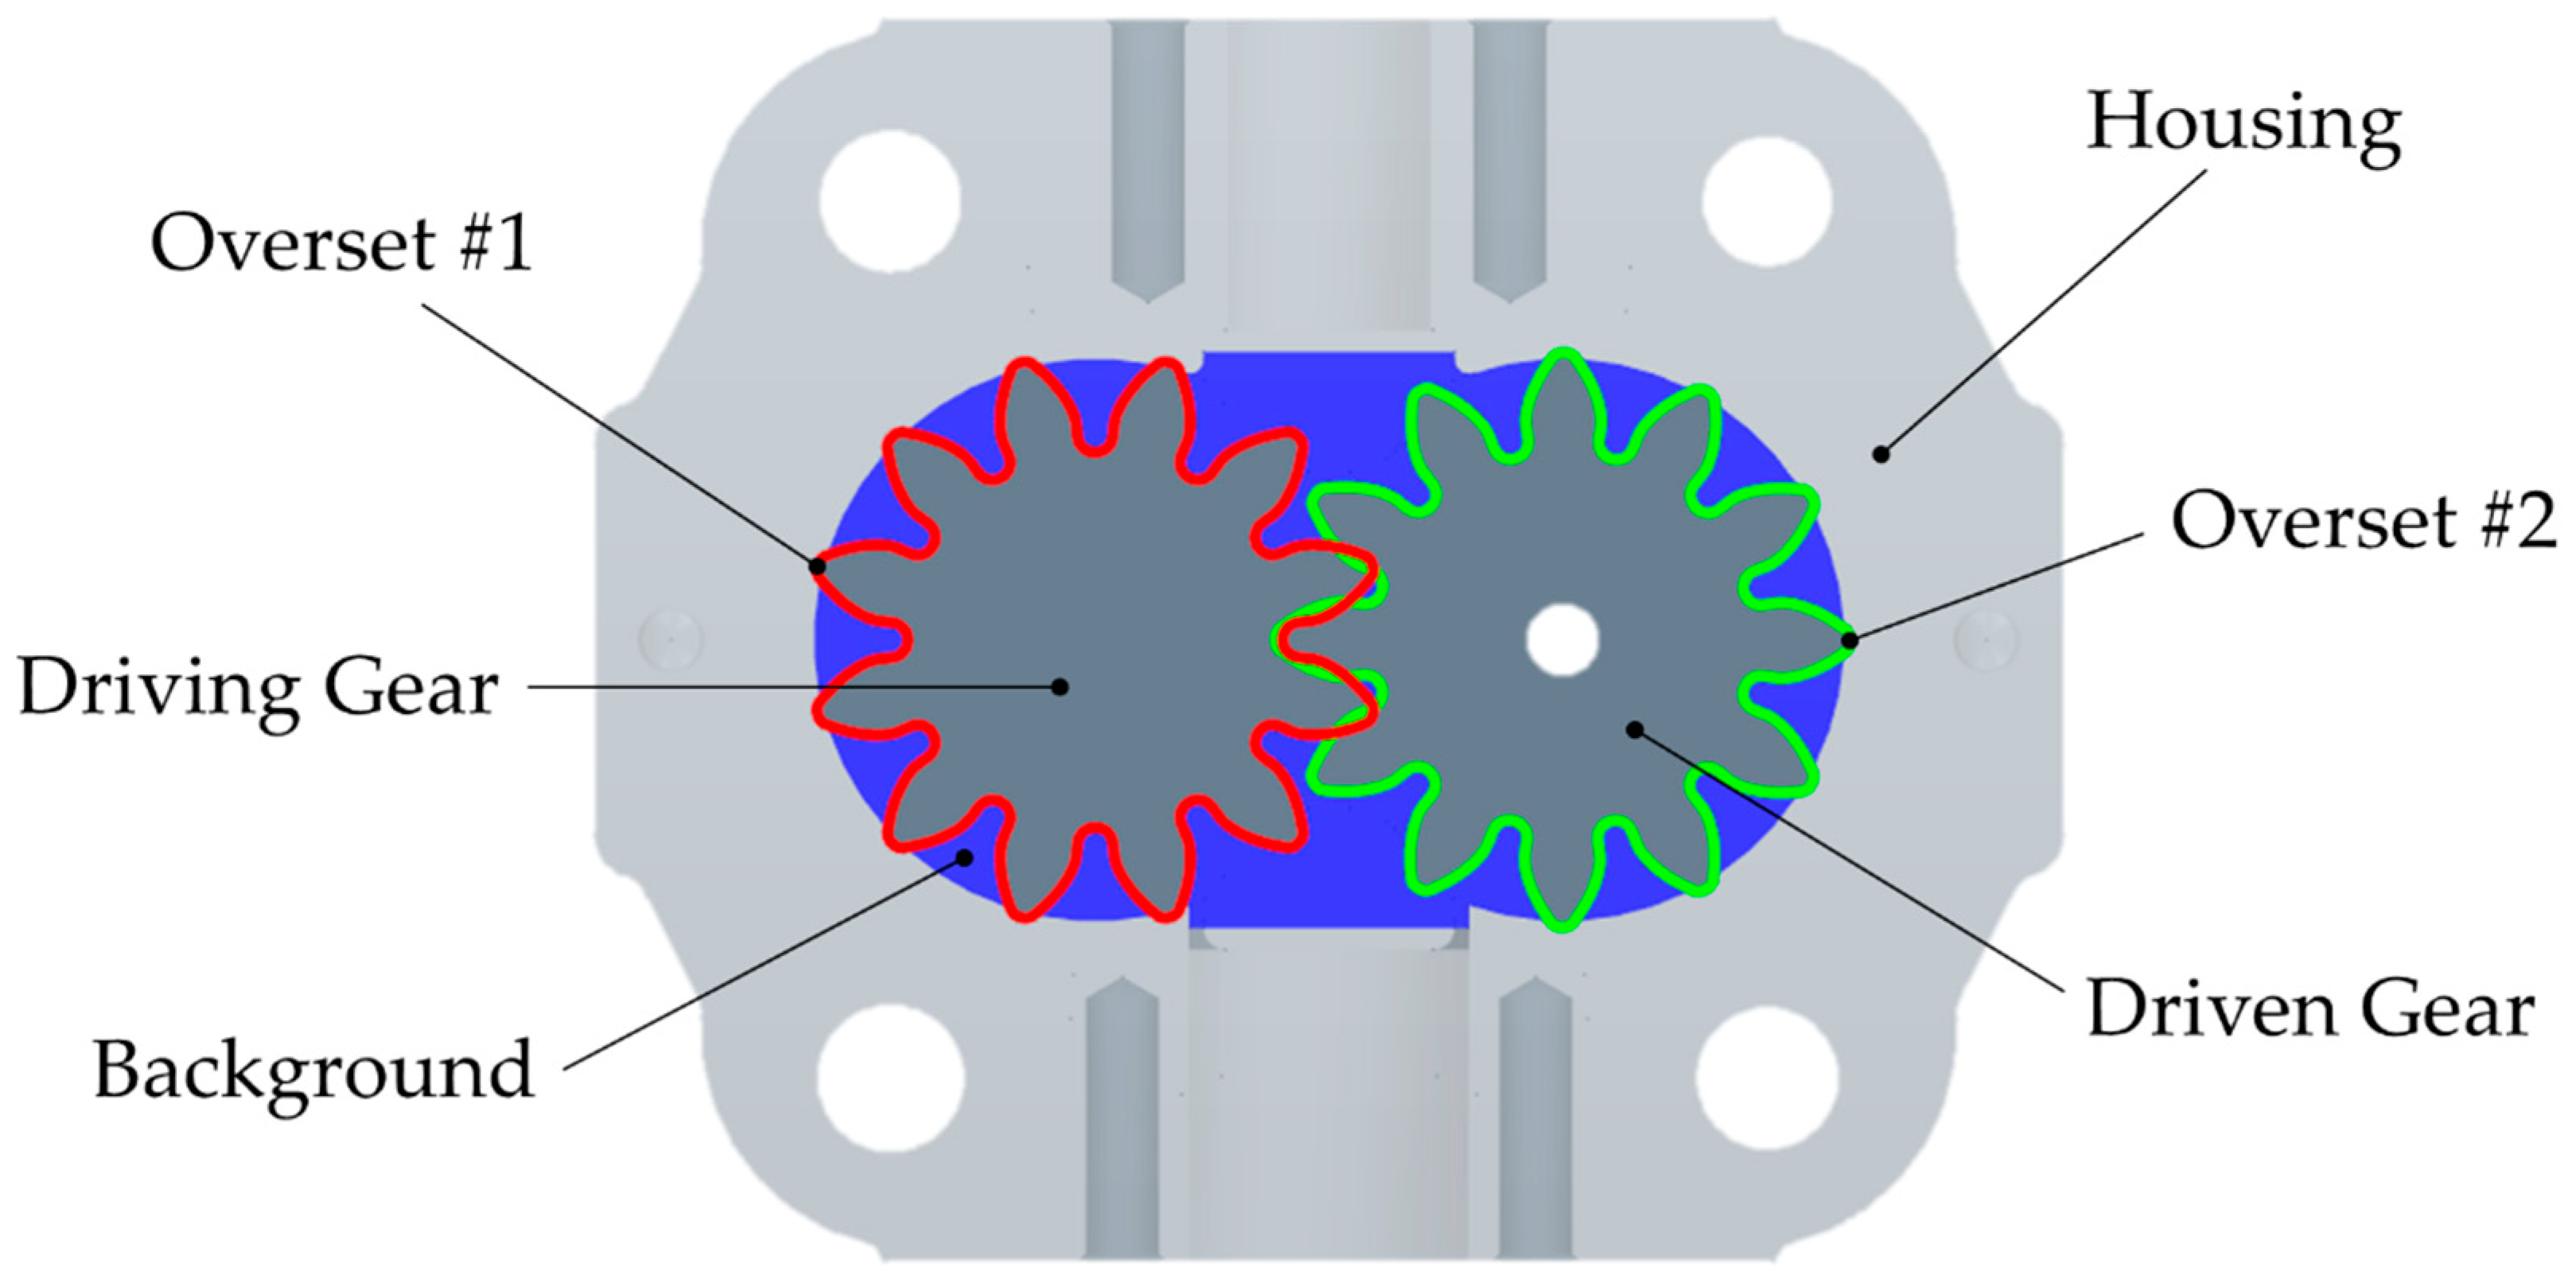
The same technique was adopted in this work to reproduce the internal kinematics of a reference EGP. An overset region was implemented for each single gear, thus resulting into two distinct parts overlapping in the meshing space, while a common background region was used to force the outer limit of the fluid domain beyond which the overset contribution was completely neglected. Moreover, the geometrical combination of the overset and the background regions provided the volumes between each pair of adjacent teeth, namely the displacement chambers of the pump. However, since it was a very highly demanding approach from a computational point of view, the overset methodology was exploited only in that area of the pump affected by the two gears. In other words, the background and overset regions were kept at constant width equal to the face width of the wheels. Figure 4 highlights these three regions with respect to the gears and the housing of the pump.
Particular care was also devoted to the inclusion of all the specific leakages of the pump within the 3D model, since both the radial and the axial leakages were strictly connected to the gears’ overset area. In detail, the radial leakage was modeled by outwardly extending the background region profile of the desired gap height, i.e., 10 µm, while the 30-µm axial gaps were directly coupled with the displacement chambers by means of sliding interfaces.
The most challenging phase of this work was the discretization of the entire fluid domain, which typically represents the crucial step in the CFD analysis of EGPs. A meticulous review of all the mesh models and dimensions was carried out to correctly address the right meshing dynamics between the two gears, as well as the very thin radial gap at the tip of the teeth. To better understand the next few paragraphs, it is important to underline that the word “meshing” could be related both to the discretization of the fluid domain into several elementary volumes and to the coupling mechanism between the two gears in the central region of the pump. In the first case, it is referred as the “meshing process” or “meshing phase”, while in the second case, the single word or, at most, the expression “meshing dynamics” is used.
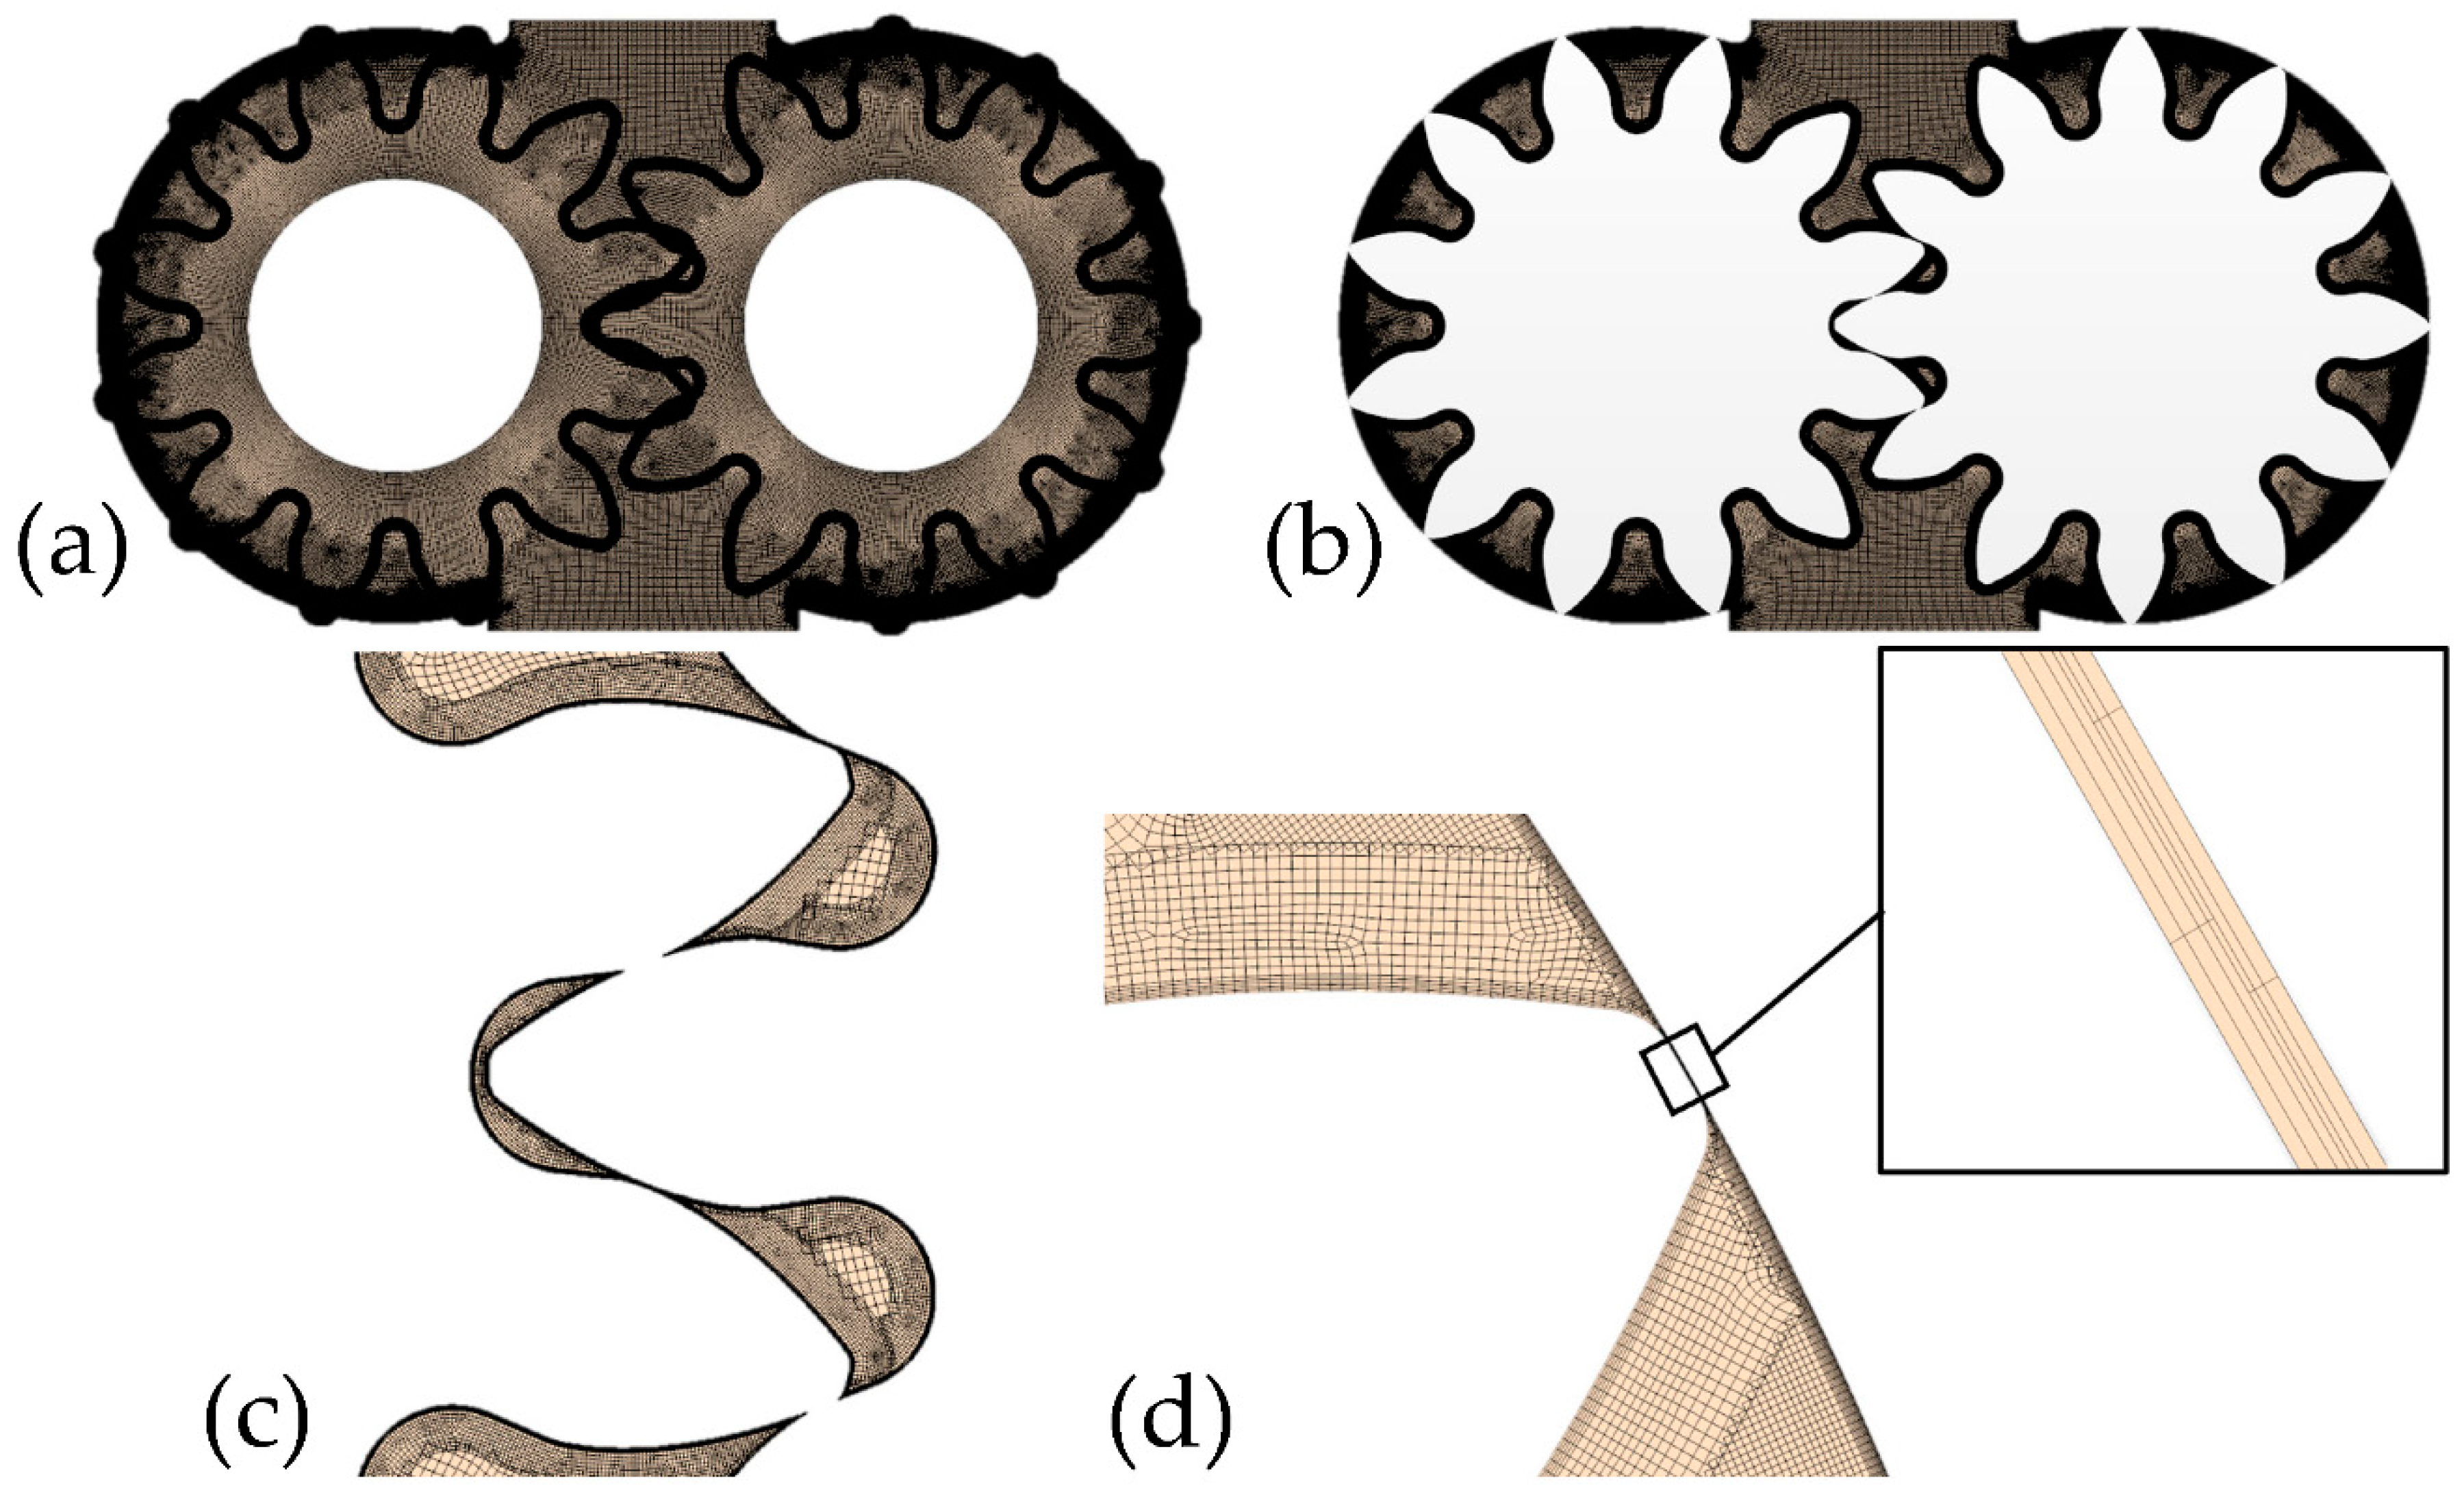
A quadrilateral mesh was adopted to discretize the full geometry, and a mean base size of 0.3 mm was chosen for the many regions of the pump except for those regions entering the overset mesh description, where further considerations were required. An extruded mesh was assigned to each of the background and overset regions, and fifty layers were fixed in the axial direction. This fundamental consideration significantly eased the reduction of the total number of cells and, as a direct consequence, the still-high simulation time. The background region was discretized by means of a 0.1 mm grid dimension, while 0.06 mm cells proved necessary to mesh the overset regions due to their more complex geometry. Several attempts were performed to determine these elements’ sizes as an optimal trade-off between the final computational effort and the geometrical approximation of the fluid domain, avoiding undesired holes in the overset cutting process. Furthermore, five prism layers were set on the wall-type boundaries of both the background and overset regions, and the shrinkage property of the overset mesh technique was activated to enforce six cells within the 10-µm radial gap. This specific tool of the software allowed us to simulate cases where some moving objects were expected to closely approach one another or other fixed parts, thus creating small gaps between wall boundaries. In those situations when the prism layer shrinkage (PLS) property was activated, the software morphed the cells in order to precisely address the narrow gap that was formed. This is exactly what happens in EGPs when the two gears find themselves next to the housing in the transition area, i.e., the angular sector where the generic displacement chamber is closed to both the suction port and the supply port as it transfers fluid from the low-pressure side to the high-pressure side. In addition, the prism layer shrinkage tool became extremely important to correctly discretize the meshing volume where the two gears approached, as well as to model the time-variable position of their contact point. Finally, two half-moon-shaped volumetric controls enforcing 0.04 mm cells were exploited all over the external circular boundary of the background region to ensure an acceptable cell aspect ratio within the radial leakage. Figure 5a shows the mesh implemented on the frontal face of the background and overset regions, and Figure 5b depicts the resulting gears’ fluid domain after the initialization of the interfaces. In Figure 5c, a central zoom of the previous image proves the capacity of the proposed numerical model to exactly reproduce the meshing dynamics of the two gears, while in Figure 5d, an enlarged picture of a single tooth tip highlights the 10-µm radial gap where six layers were enforced through the progressive shrinking of the prism layers.
The axial leakages were discretized by means of 0.2 mm-sized extruded meshes on the frontal surface and twenty layers in the axial dimension to accurately predict the dynamics of the fluid, as well as the flow losses through these gaps. The two internal boundaries of both regions were set as pressure outlets to mimic the effect of the drain connections of a pump without geometrically addressing the narrow gaps between the shafts and their journal bearings, thus permitting a significant reduction in the total number of elements. Figure 6a shows the surface mesh of the axial leakage, while in Figure 6b, a lateral view of the region points out the partition of the 30-µm thickness.
Furthermore, the regions constituting the entire fluid domain were connected by means of sliding interfaces in order to permit the fluid exchange through the common boundaries. A two-layer wall treatment was also adopted to predict the flow behavior near walls.
The overall meshing process resulted in almost 30 million cells, which was assessed as the best trade-off between the accuracy of the results and the required simulation time per revolution of the primary shaft. This last parameter was monitored over the entire duration of the analysis since one of the goals of this study was to create an industrial CFD methodology to be included in the design chain of EGPs. For this reason, a computational time that was as short as possible was required to extrapolate the results out of the simulation. In these terms, following all the modeling techniques that were listed in the previous paragraphs, an 18 h period per revolution of the pump was found as the minimum possible duration to guarantee accurate results.
In Table 2, the main parameters of the mesh concerning the discretization of the entire pump fluid domain are finally summarized.
The rotational kinematics of the two gears were implemented through local coordinate systems and motions. In particular, a clockwise rotation with respect to the primary shaft connection was imposed to the driving gear, while a counterclockwise rotation was applied to the driven gear. Quantitatively, for this work’s purposes, a constant rotational speed of 2000 rpm was assigned to both gears.
The actual workload of the machine was chosen according to a typical lubricating system in off-highway applications. In practice, a stagnation inlet boundary was used to force 0 bar at the suction port, while a pressure outlet boundary was set at the supply port of the pump to produce the desired 20 bar loading condition. Moreover, the atmospheric pressure was assumed at the drains’ boundaries. Extruded volumes were added at each external connection of the pump to allow for flux stabilization, therefore preventing undesired reversed flows from occurring. The slip property was enabled on the lateral walls of these volumes to remove the effect of shear forces on the sliding fluid. Figure 7 depicts two different 3D views of the fluid domain to show the numerical modeling of the suction and the pressure ports of the pump, while Table 3 summarizes the boundary conditions of the proposed CFD model.
In this paper, the effects of different working fluids on the global performance of an EGP was investigated. Firstly, the influence of more and more complex numerical models of fluid physics was evaluated by means of a standard ISO VG 46 mineral oil typically employed with these volumetric machines. In particular, starting from an elemental incompressible description of the fluid, a very precise physical model of the mineral oil was achieved by considering its compressible nature, thus including the dependency of fluid’s density and viscosity on both pressure and temperature. For this purpose, the ρ–p relation described by Equation (1) was implemented in the code as a user-defined field function, while the energy equation was activated to include the effect of temperature on both oil’s density and viscosity. An initial temperature of 25 °C was set within the entire fluid domain in order to address the starting phase of the pump where the pressure ripple and the thermal transient were particularly emphasized due to the higher bulk modulus. The analytical laws defining the dependency of density and viscosity over the fluid temperature were extrapolated through polynomial interpolations of some characteristic measurements. The resulting functions are reported in Equations (2) and (3). Figure 8a,b provides graphical illustrations of the interpolation procedure used to extract the ρ–T and µ–T mathematical equations, respectively.
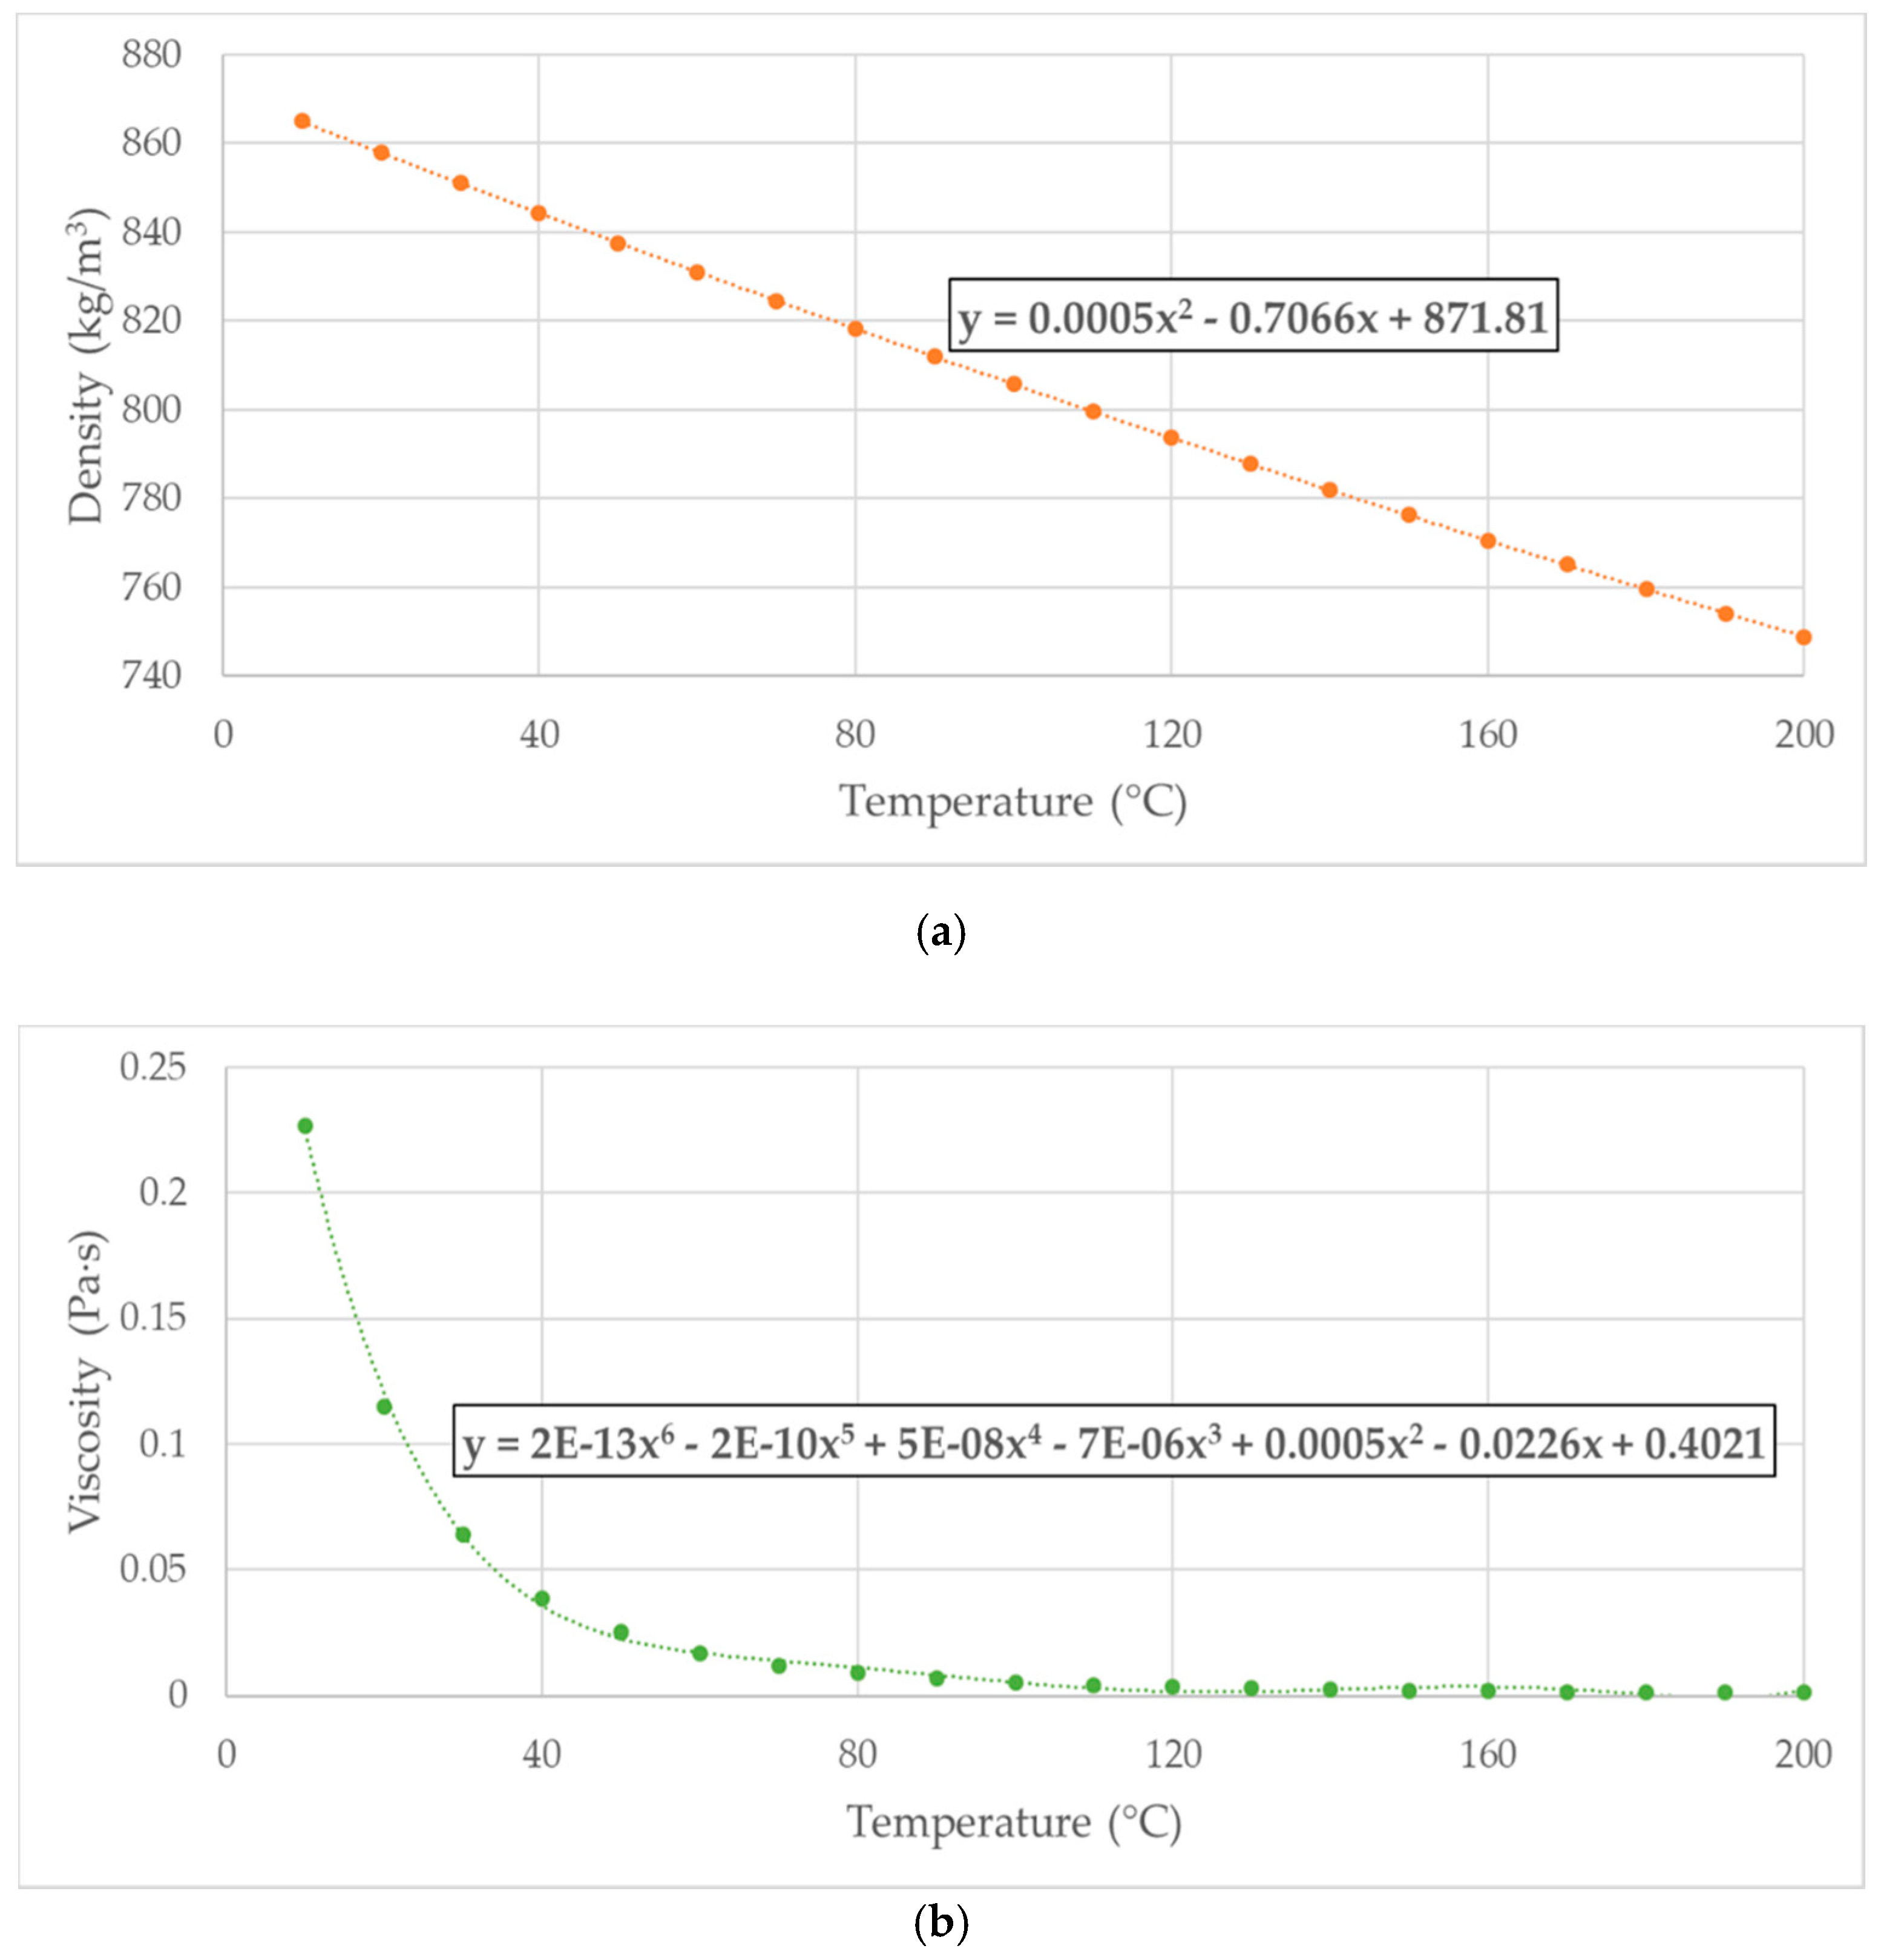
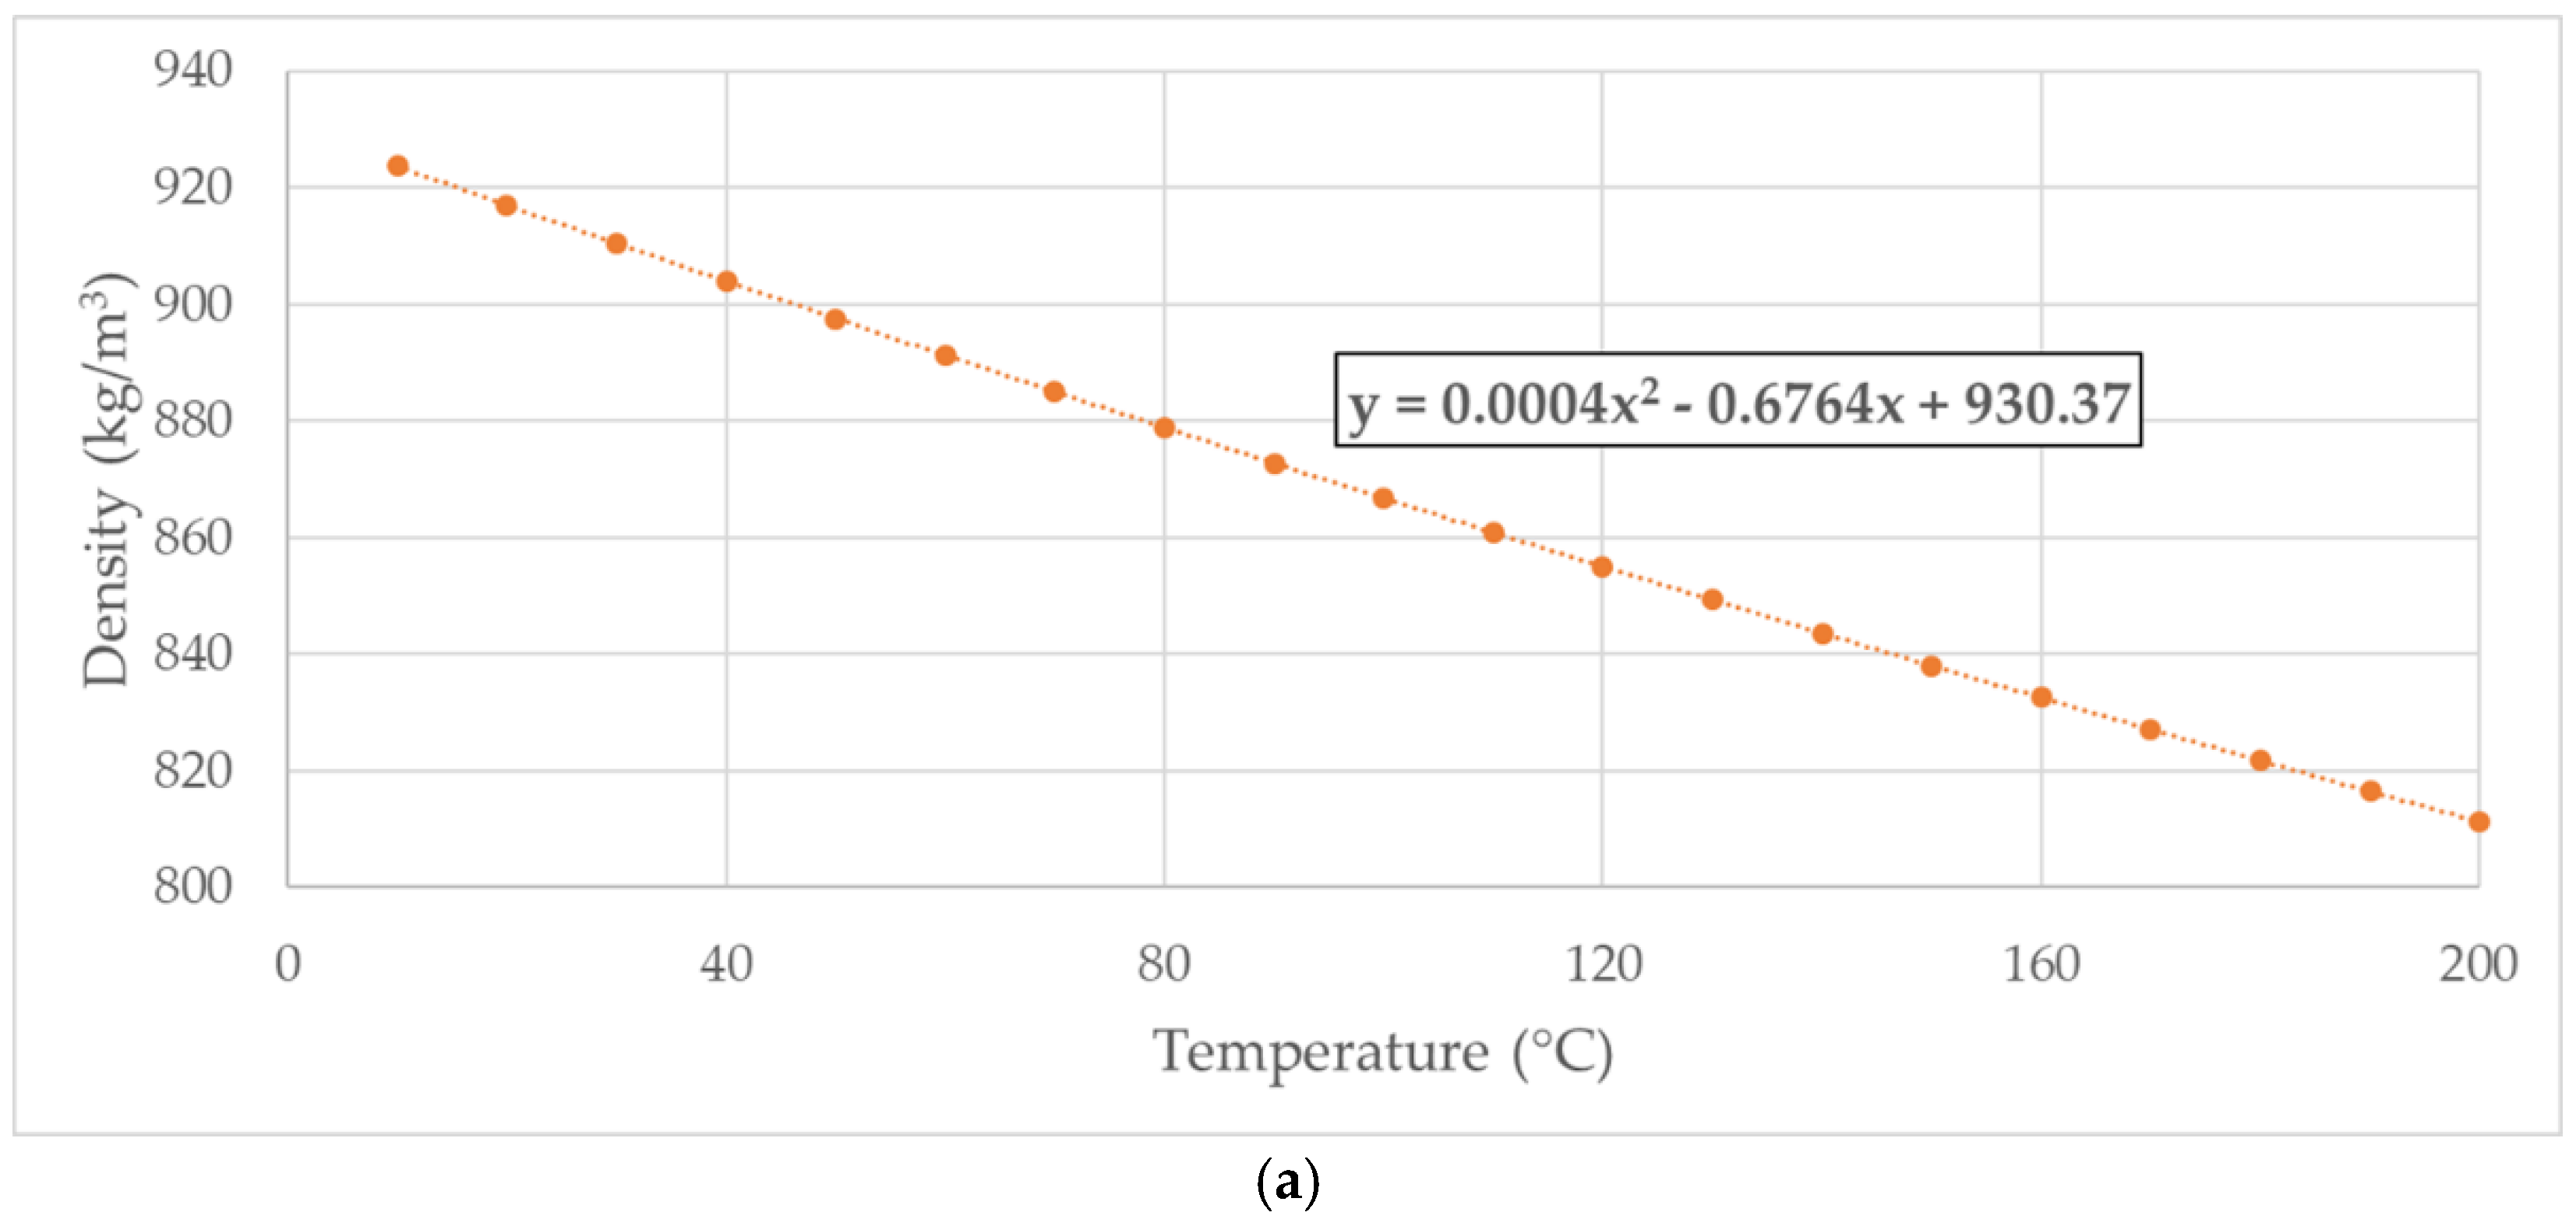
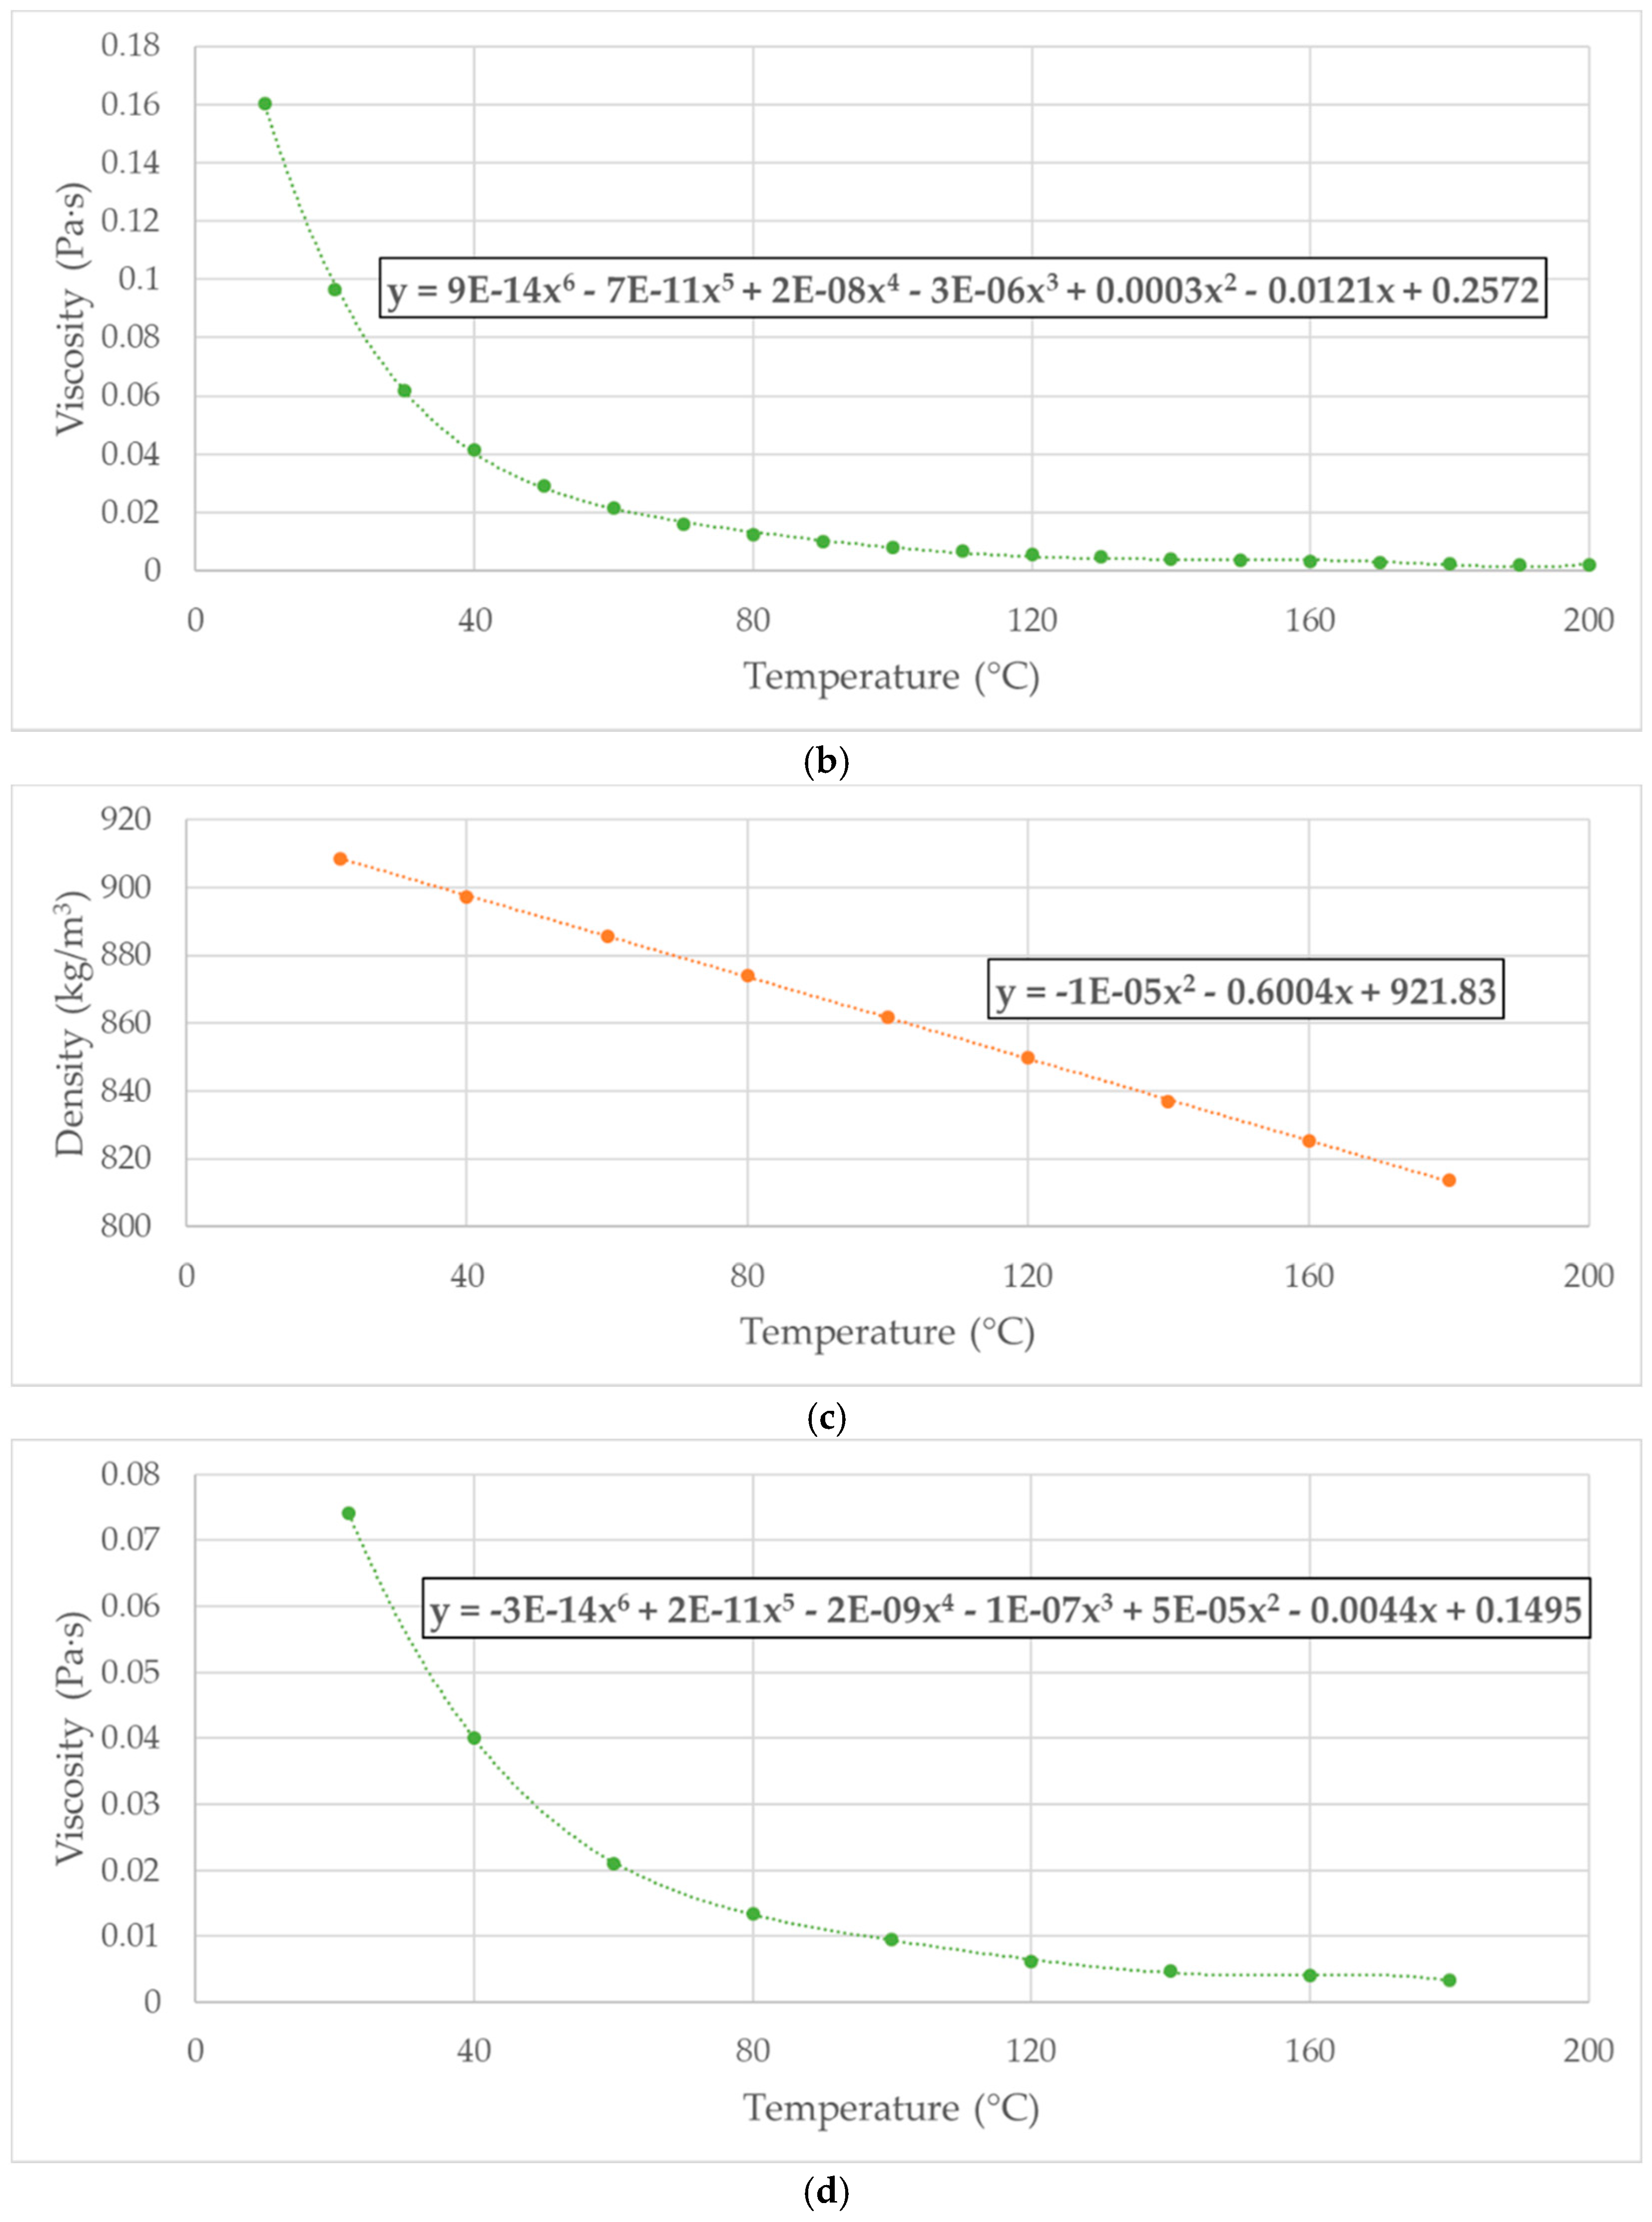
Though they still represent the by-far most used operating fluids in hydraulic systems for power transfer applications, mineral oils stand out for their strong environmental impact in terms of both emissions and disposal, thus quickly deviating from the increasingly stringent principles of the green economy. Consequently, the need for a progressive reduction in the use of mineral oils and other synthetic liquids in favor of biodegradable and sustainable fluids is gaining more and more interest all over the world. The work presented in this manuscript perfectly fits into this ecological context since a CFD analysis of a test case EGP was performed using both a biodegradable industrial oil, namely the Total BIOHYDRAN TMP 46, and a 100% eco-friendly fluid, namely olive oil. A thorough comparison of the several characteristic parameters of the pump with respect to the mineral oil application was finally produced in order to investigate the effects of the different liquids on the machine’s performance, thus numerically assessing the opportunity of employing biodegradable fluids in these pumps. The simulations were all set at the same operating conditions, and the incidence of both pressure and temperature on fluids’ density and viscosity was considered. The already mentioned interpolation technique was again adopted to describe the fluid properties’ variation as a function of temperature. A schematic representation of the numerical approach used to determine Equations (4) and (6), namely the ρ–T relations for the BIOHYDRAN TMP 46 oil and olive oil, is shown in Figure 9a,c, respectively. Moreover, Figure 9b,d reports the µ–T characterization of the two liquids, from which Equations (5) and (7) were derived. In [23], an experimental campaign was planned in order to deduce both density and viscosity of five common vegetable oils, including olive oil. These results were used as reference values in this work for the proper formulation of Equations (6) and (7).
In Table 4, an overview of all the other physical properties included in the simulations is presented in order to address the nature of the different fluids. These quantities were kept constant over the entire simulation.
The turbulent behavior of the fluid was addressed by means of a two-equation k-omega SST model in order to accurately predict the flow evolution in the viscous sublayer and in the free-stream region, as it combined the insensitivity to free-stream conditions of the k-epsilon model in the far-field with the advantages of the k-omega model near walls. Actually, several turbulence models were compared in [24], and the k-omega SST model showed particular accuracy in the prediction of the fluid-dynamic performance of the analyzed hydraulic components. This model’s choice was further supported by the Wall-Y+ considerations since values slightly smaller than one were measured at the most critical areas of the fluid domain, such as in the gears’ region and within leakages, due to the extremely reduced mesh size near walls. Moreover, the gamma transition model, only available with a k-omega SST turbulence model, was enabled in order to address the turbulent-to-laminar flow transition, as well as to map the turbulence intensity within the entire fluid domain of the pump. The implicit unsteady model was selected to cope with the dynamics of the analyzed phenomenon, and a time step corresponding to a one-degree-rotation of the driving shaft was chosen as the best tradeoff between variables’ convergence, computational demand, and the reliability of the results. In particular, higher time steps, i.e., two and five degrees of the shaft revolution, produced a non-negligible deterioration of the ripple curves of the pump or even the solution divergence, while a smaller time step corresponding to a half-degree shaft rotation led to a significant increase of the already high computational time without bringing considerable improvements to the results’ accuracy. The conservation equations for mass, momentum, and energy were simultaneously solved using a pseudo-time-marching approach by means of a coupled implicit solver with an automatic, adjustable CFL number. In Table 5, the layout of the simulation is summarized and the convergence criteria is highlighted. In particular, given the model complexity, the stabilization of the residuals below 0.01 was assumed as relevant for the results’ accuracy.
Finally, a list of all the simulations presented in this paper is reported in Table 6, where the four operating fluid models are highlighted.
3. Results
In this chapter, the results of the simulated cases are presented in terms of flow rate, pressure, and temperature in order to evaluate the fluid-dynamic performance of the pump. The main chapter is divided in two distinct sections to separately present the influence of different physical models of the fluid and to predict the possibility of running EGPs with eco-friendly fluids.
The simulations were all performed at a 2000-rpm shaft rotational speed and with a mean working temperature of the fluid of 25 °C.
The volumetric efficiency of the pump in the different conditions was evaluated with respect to the ideal delivered flow, the latter being derived from the geometrical parameters of the gears. In particular, in Equation (8), the expression of EGPs’ displacement is reported as a function of the displacement chamber area, Av, the face width, b, and the number of teeth, z. Meanwhile, in Equation (9), the formula for the computation of the ideal delivered flow rate is shown.
From Equation (2), a theoretical supply flow rate of 8.2 L/min was derived.
3.1. Physics Comparison
In this first subsection, the results produced by the two CFD analyses of the reference EGP with ISO VG 46 mineral oil are discussed in order to prove the importance of an accurate description of the fluid’s physical properties.
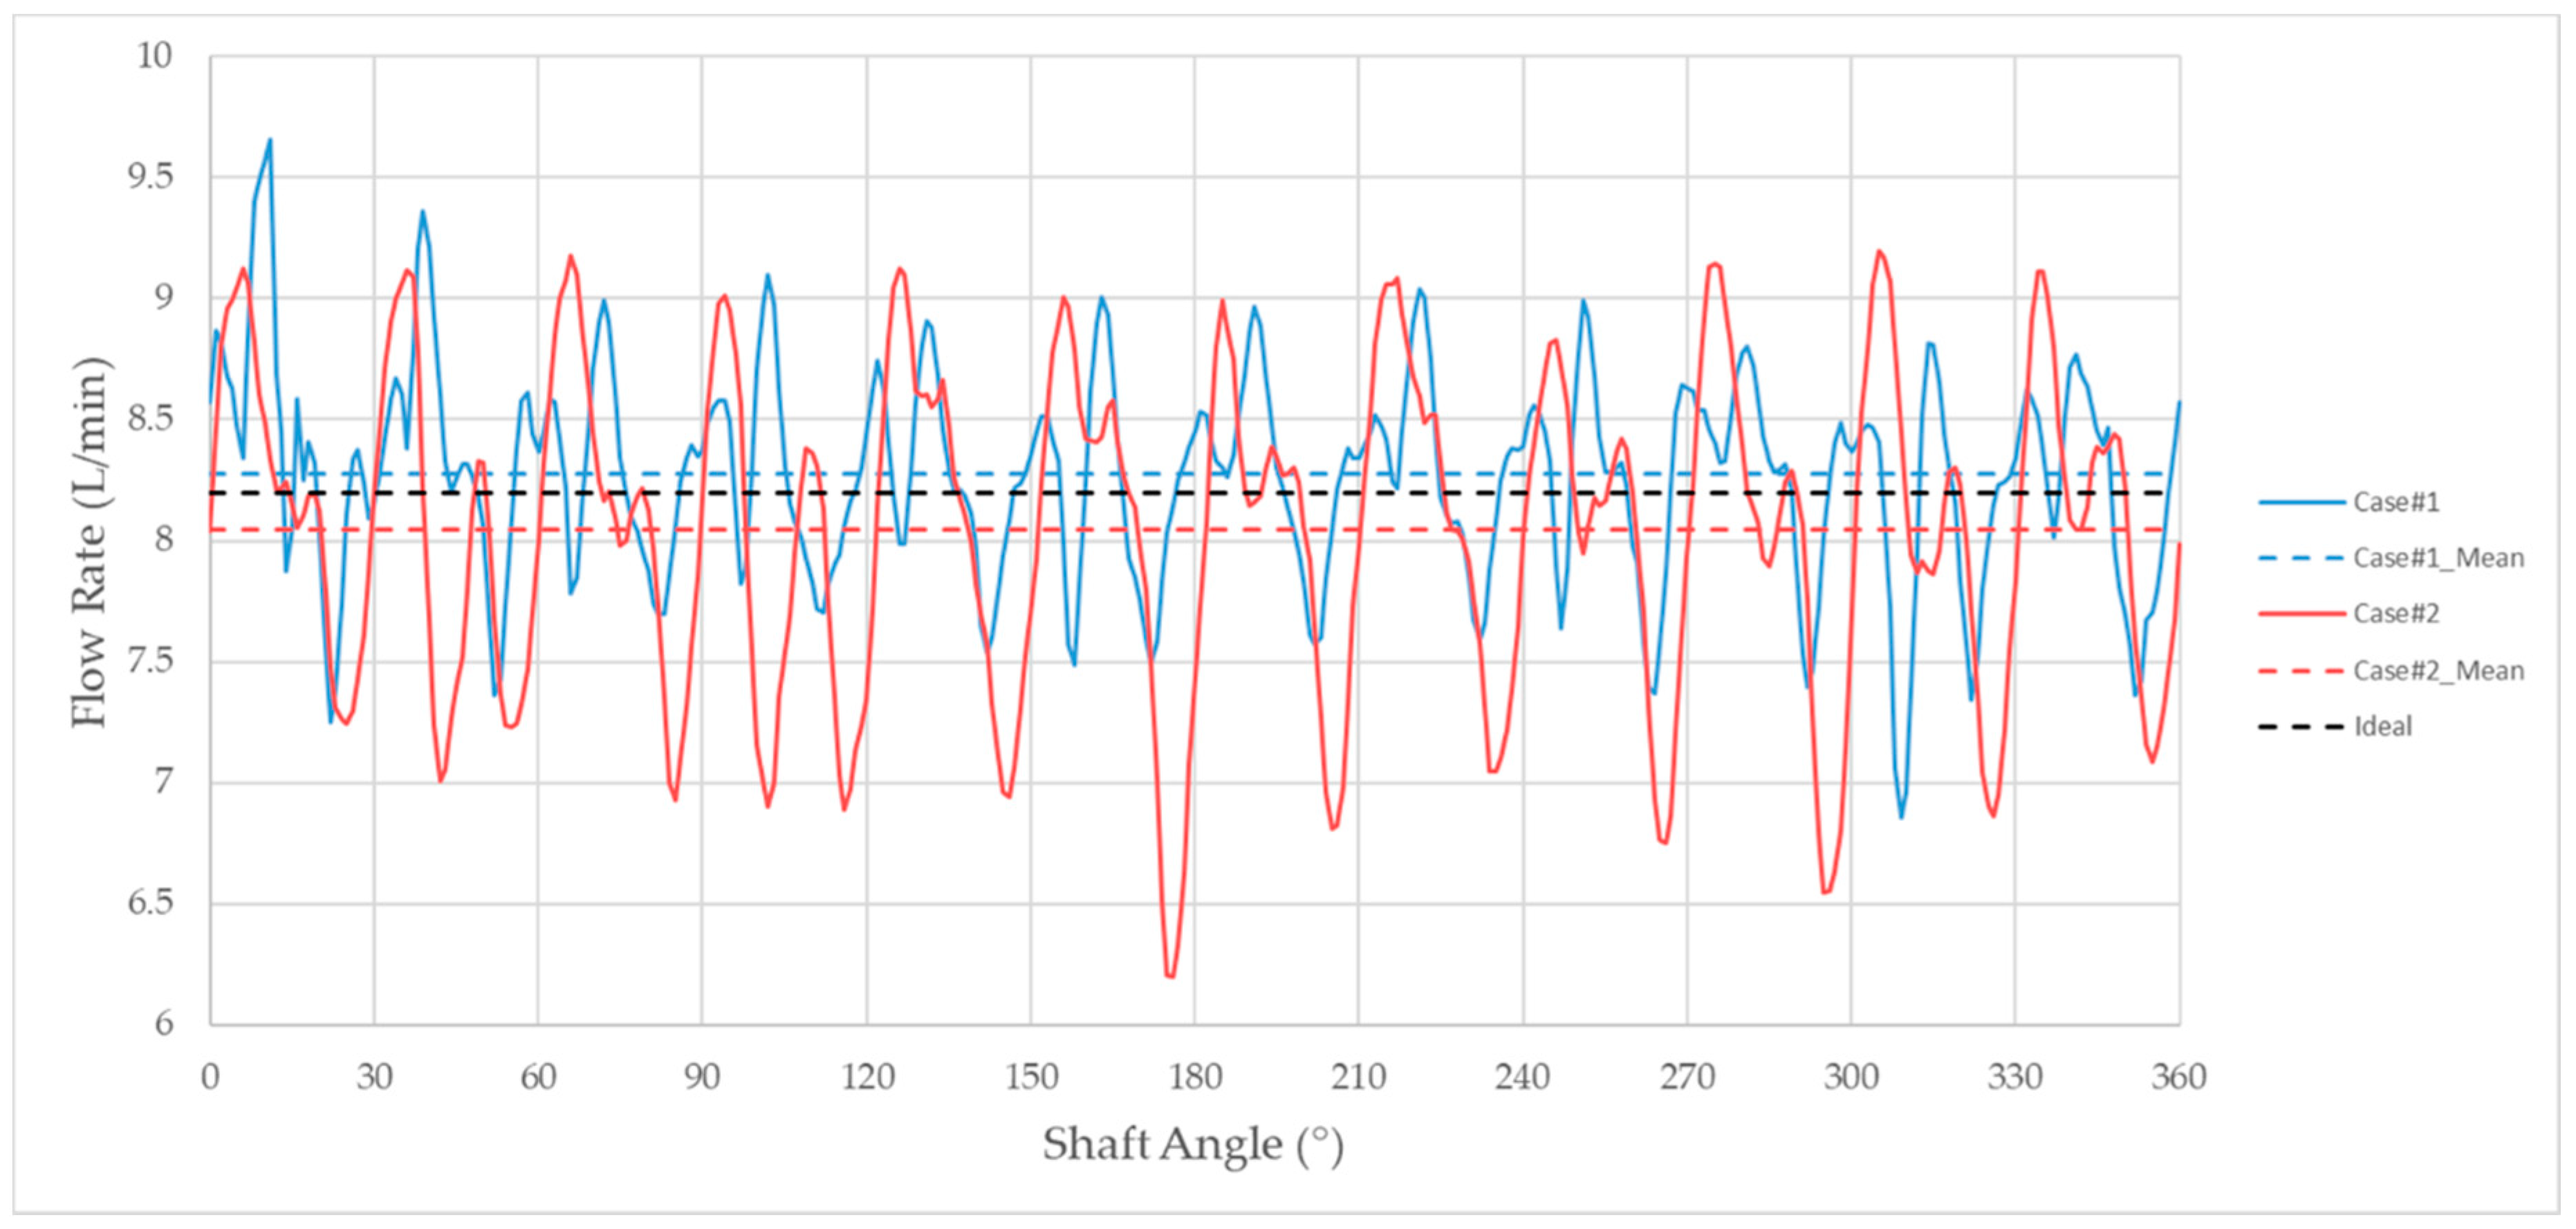
In Figure 10, the flow rate signal measured at the pump outlet is presented over an entire revolution of the driving shaft, and two straight lines were used to highlight the oscillatory characteristic extracted from both the simulated models. Similar flow ripples were derived in terms of the amplitude and frequency of the waves; in particular, twenty-four oscillations in the 360-degree revolution of the pump were observed, thus corresponding to twice the number of teeth of a single gear. Moreover, two dashed lines with the same colors of the original signals were added to the graph, showing the mean value of the delivered flow rate for each configuration, while a black line shows the previously defined ideal flow rate. Quantitatively, the incompressible solution produced a supply flow rate of 8.28 L/min, corresponding to an unrealistic 101% volumetric efficiency of the pump, while a significant improvement of this result was observed with a more detailed physical description of the operating fluid. In detail, the compressible model of the fluid led to a delivered flow rate of 8.04 L/min, corresponding to a volumetric efficiency of 98%, thus highlighting a non-negligible increment of the flow losses across the leakages due to the local viscosity variations induced by the internal temperature field. These results underline the importance of including the real properties of a fluid within a numerical physics model in order to achieve a reasonable description of the fluid-dynamic performance of a pump. In Table 7, the predicted flow rate is schematically compared to the ideally elaborated one, and the deriving volumetric efficiency is specified for both cases.
Furthermore, in Figure 11, the experimental characterization of the investigated EGP is reported as a function the shaft rotational speed at the constant working pressure of 20 bar. In particular, a 97% volumetric efficiency of the pump was measured at the rotation speed rate of 2000 rpm, thus showing a slight 1% discrepancy between numerical and experimental results. This approach definitely proved the extreme accuracy of the proposed CFD model while accounting for the oil compressibility.
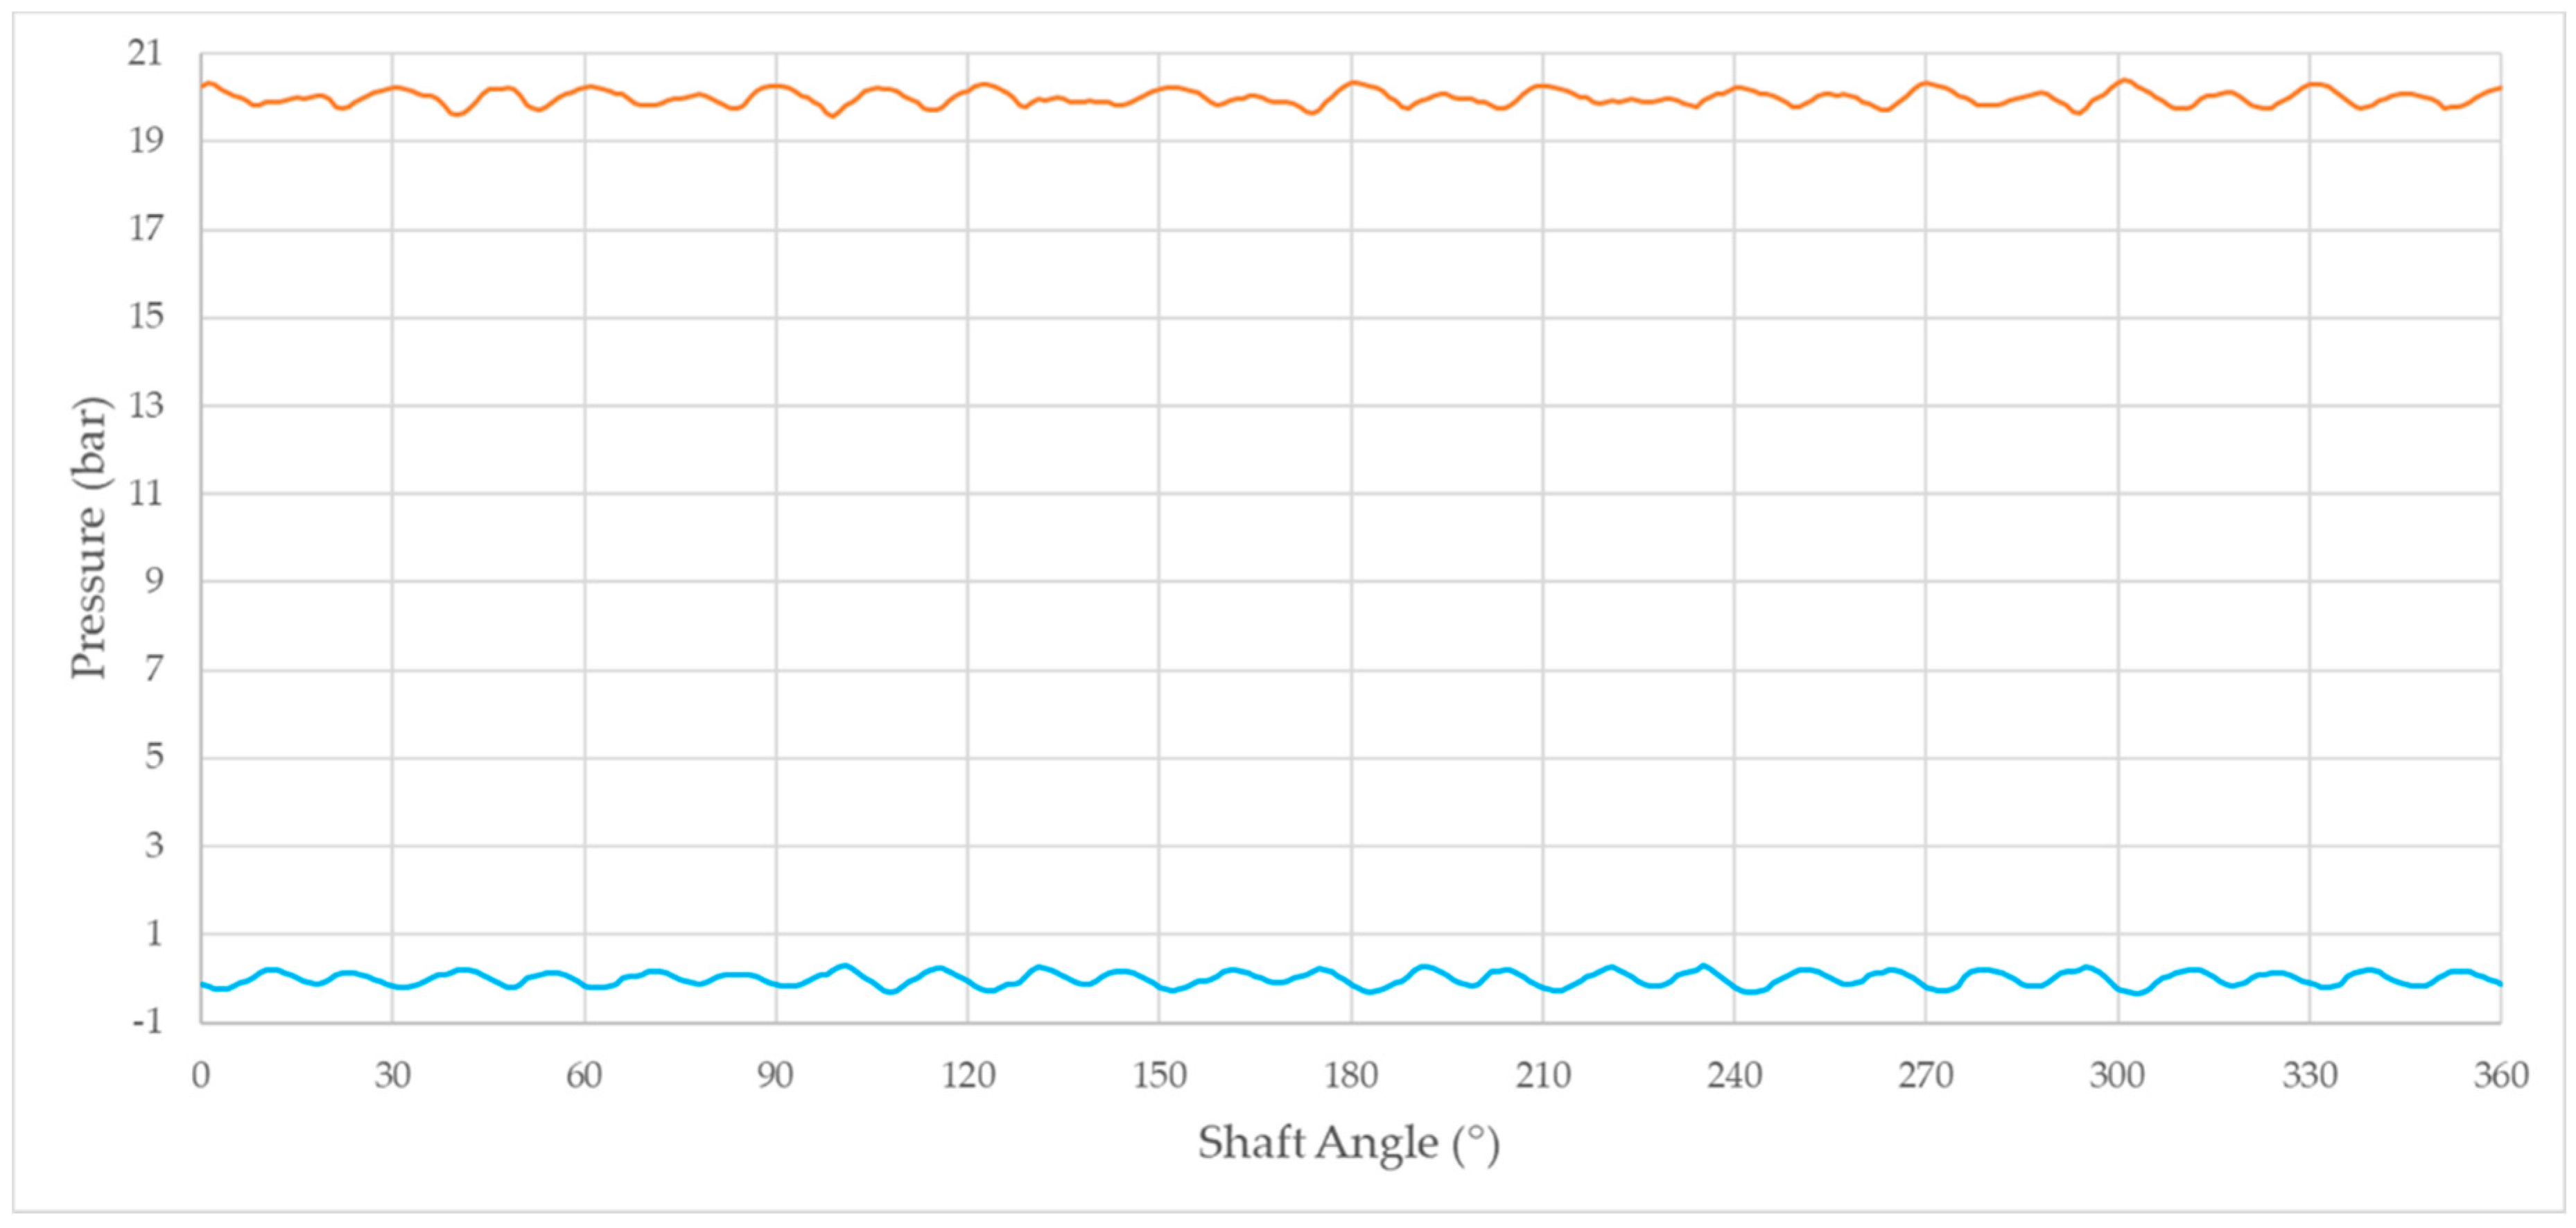
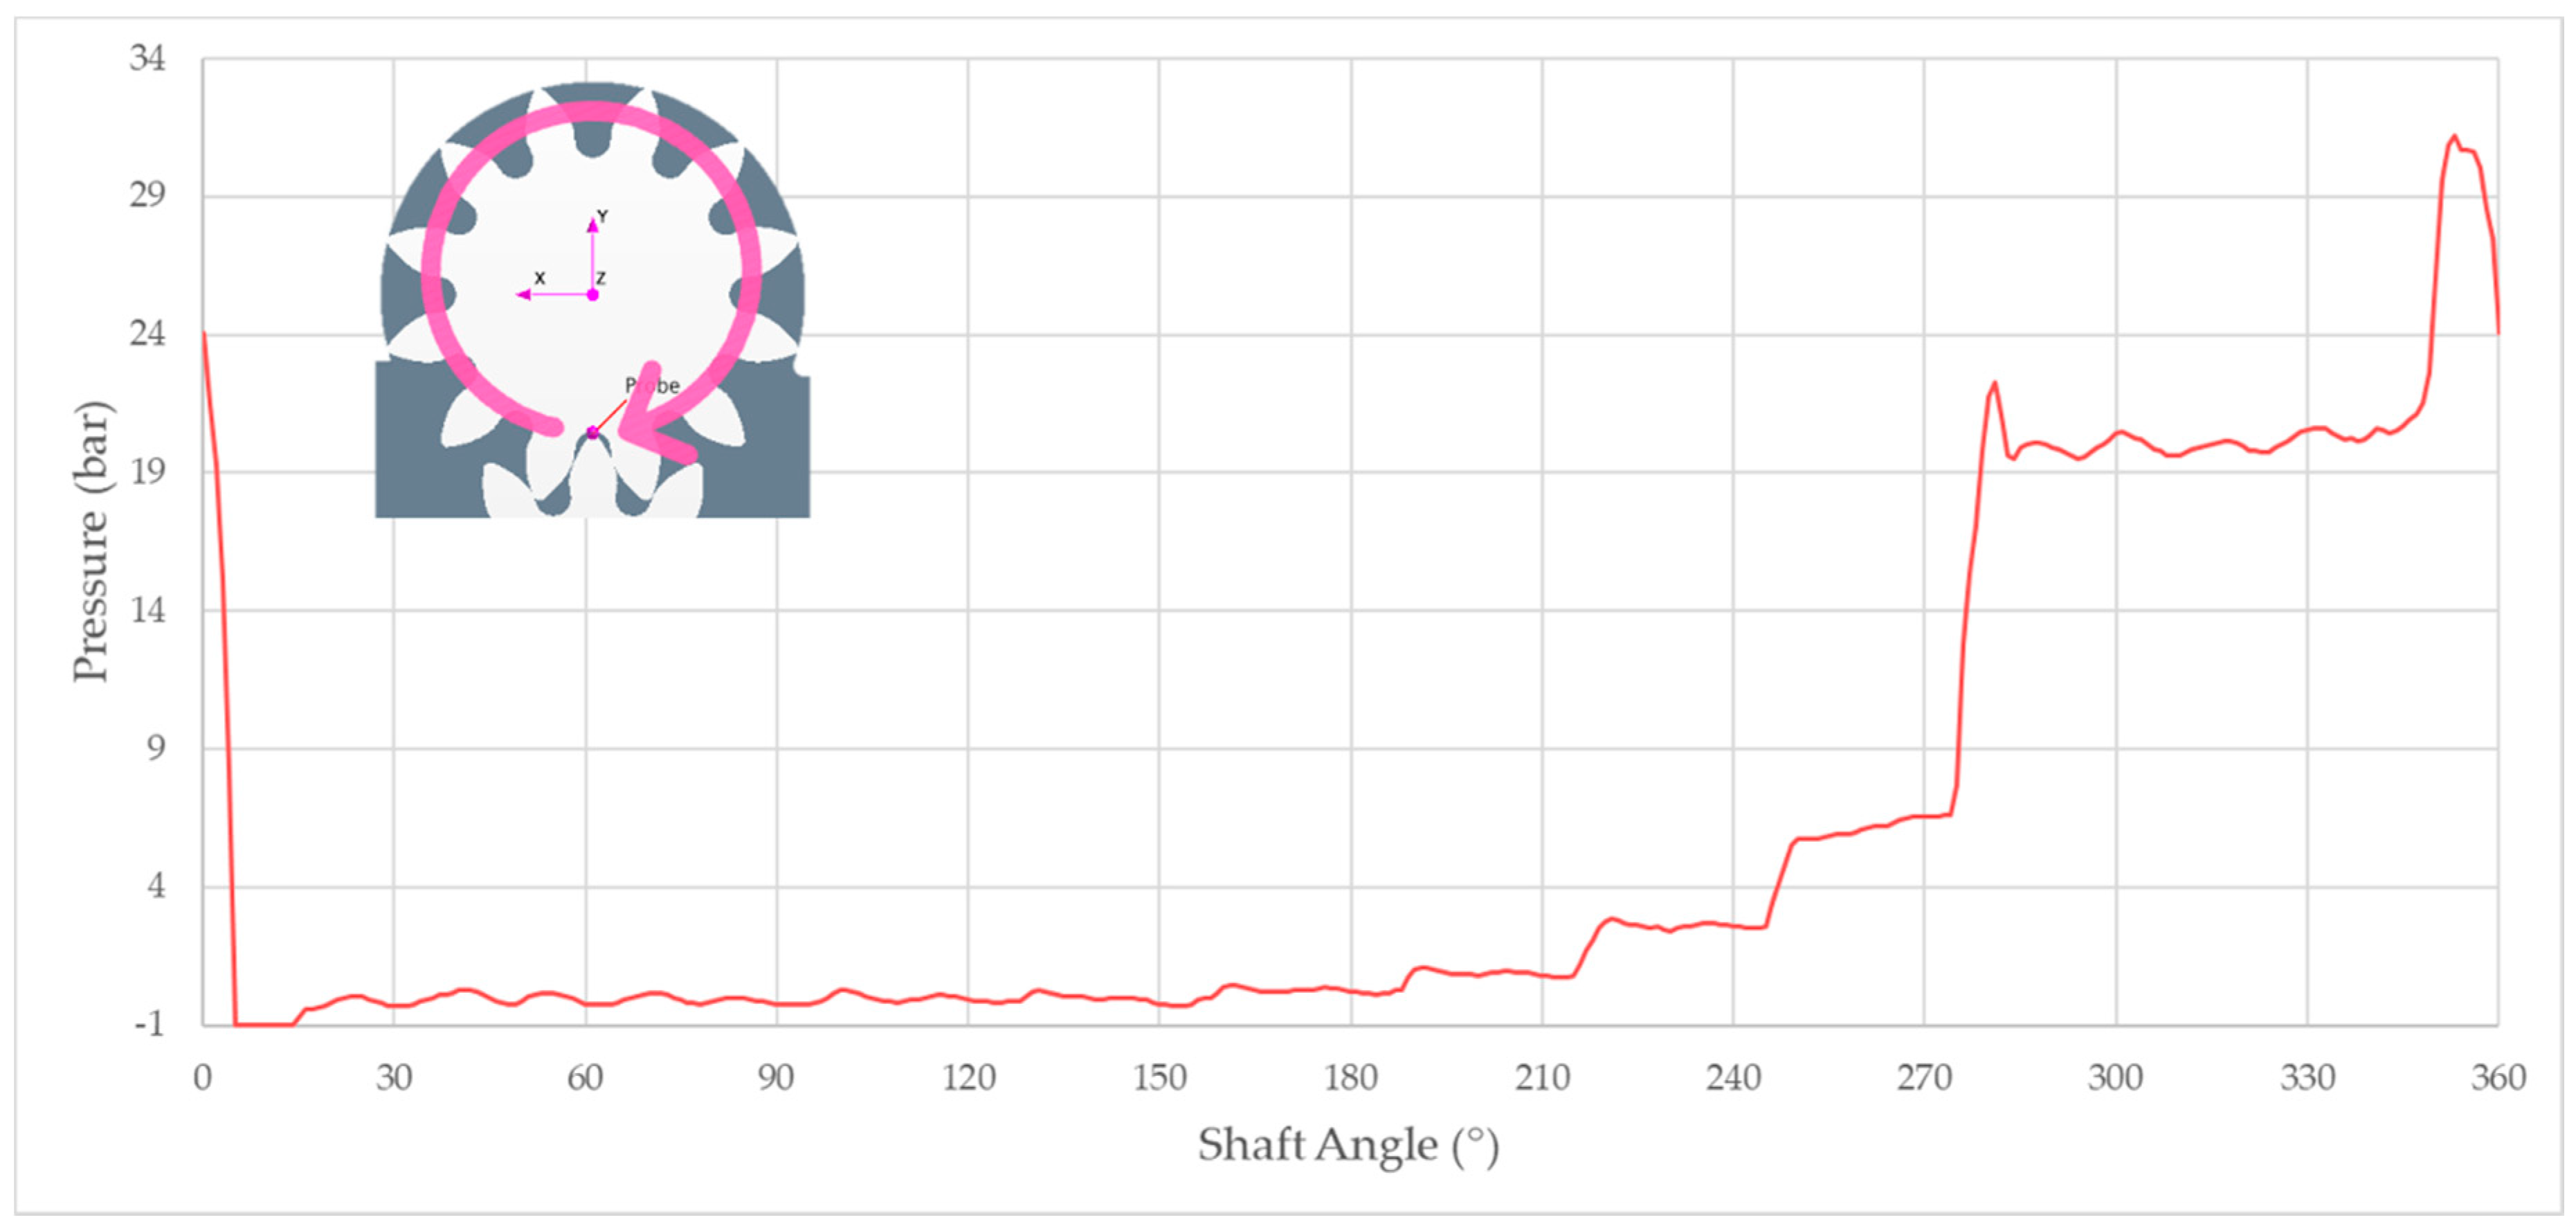
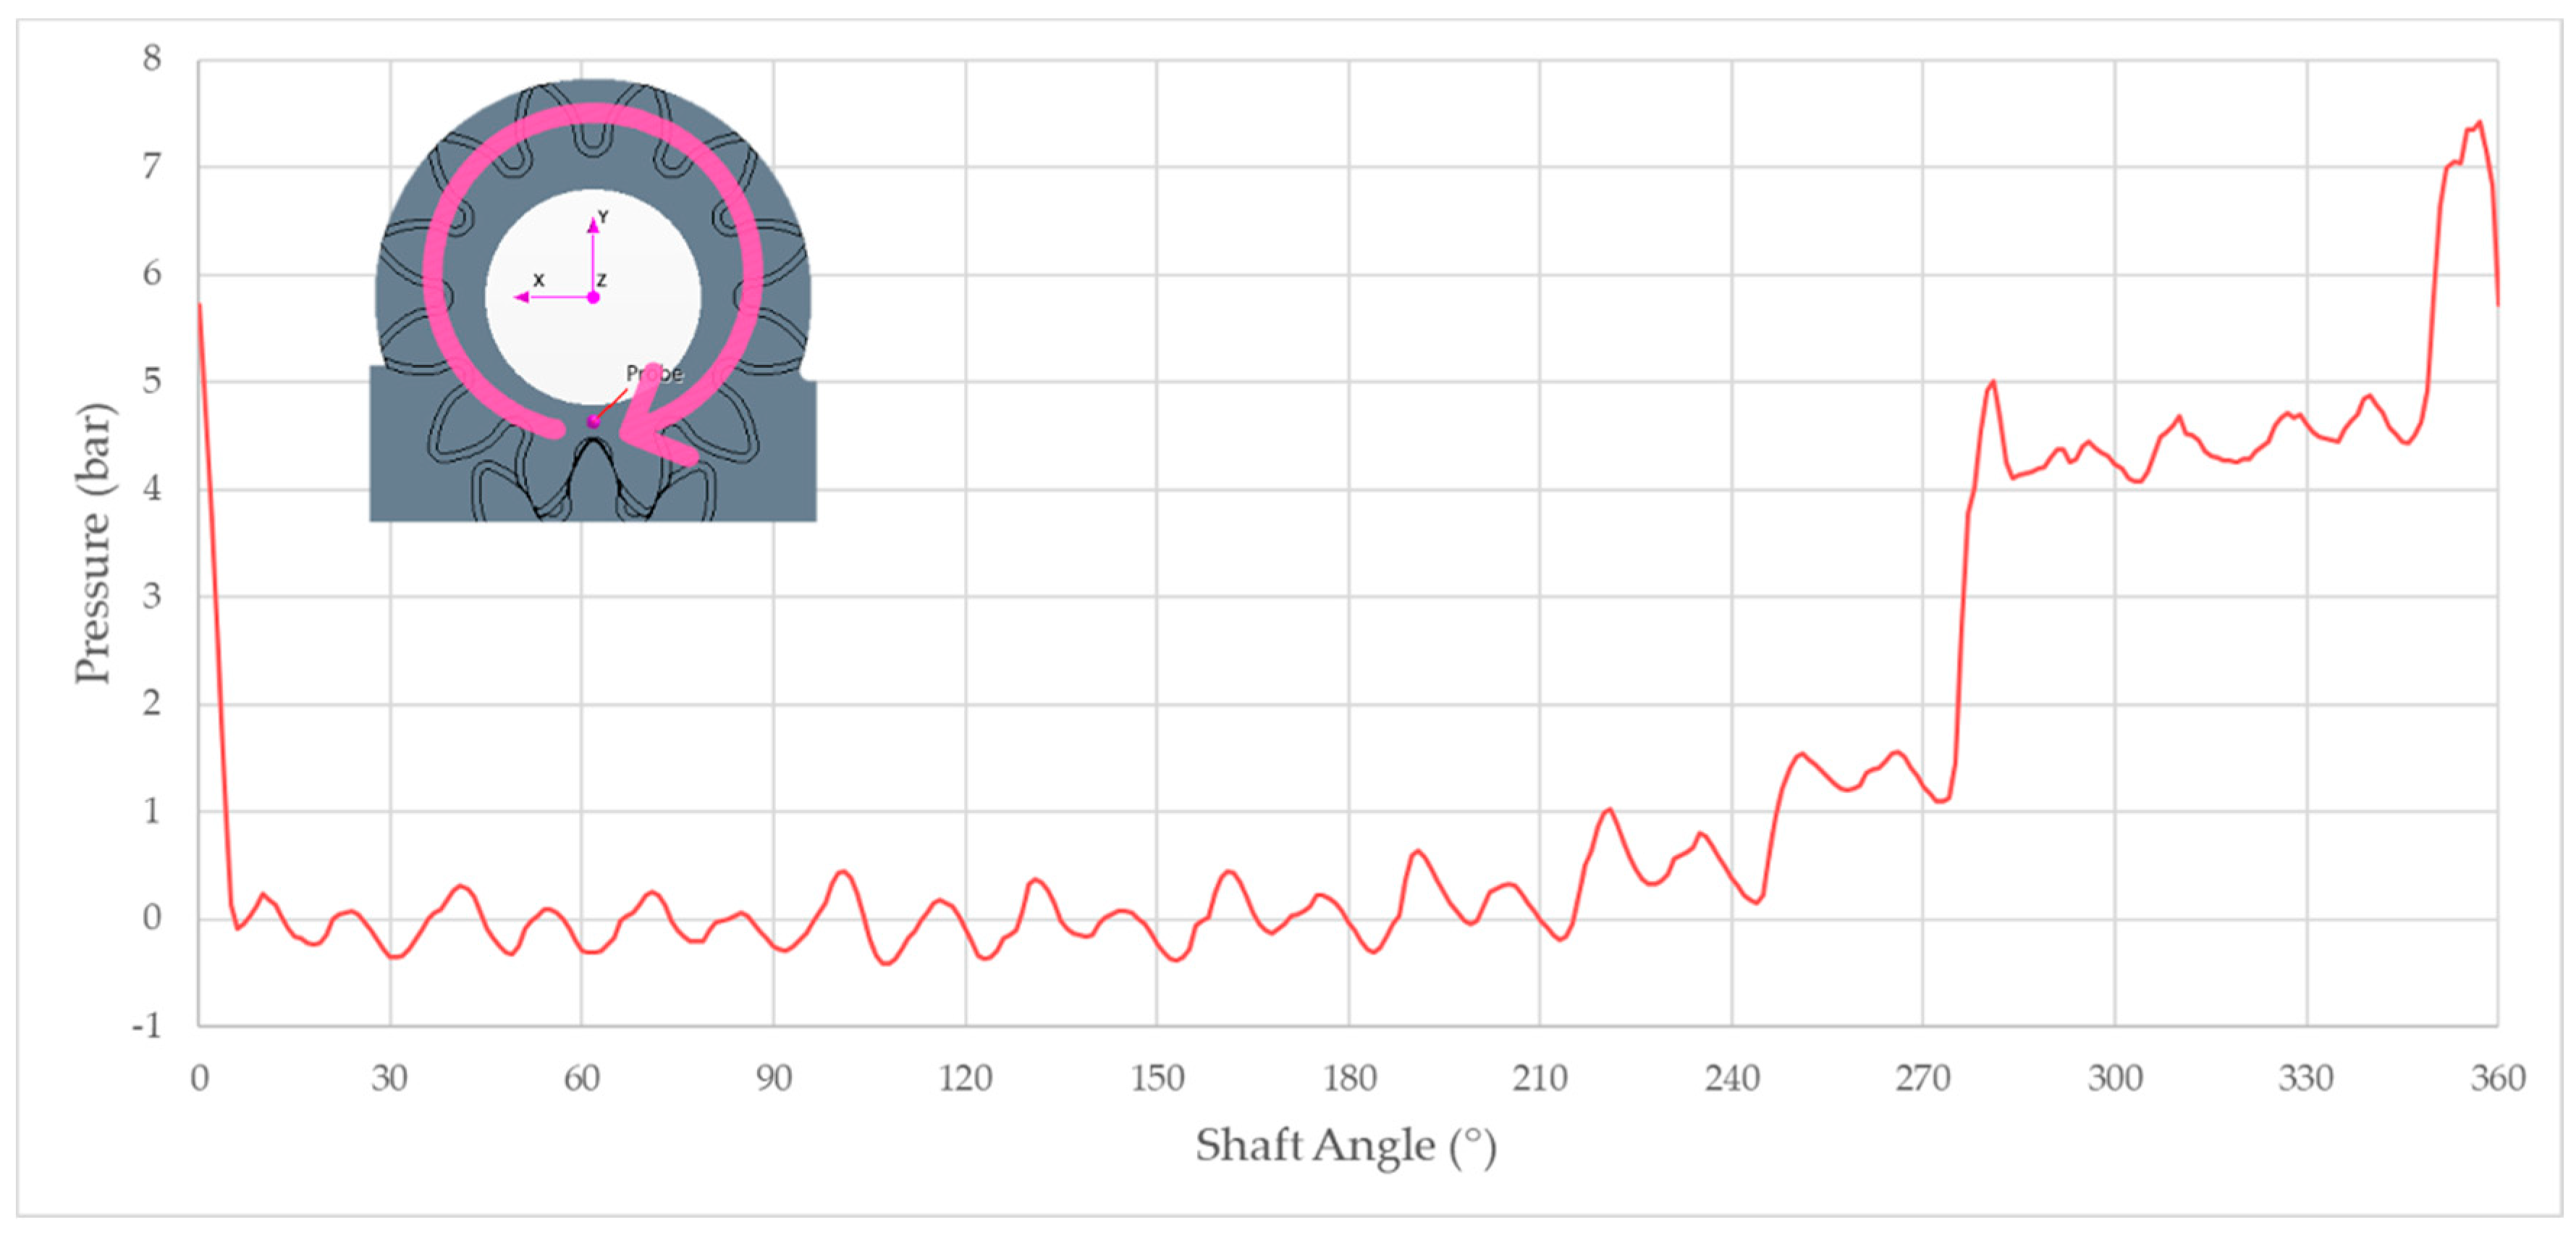
For those reasons, having demonstrated the inaccuracy of the incompressible flow assumption, from now on in this section, results are only shown for Case #2. The pressure signals measured at the suction and the delivery sides of the EGP are depicted in Figure 12 with separated colors. The two plots highlight regular profiles with a pressure ripple amplitude of 0.4 bar at both the suction and delivery ports of the pump. Furthermore, the high capability of the presented CFD model was exploited to predict the pressure evolution in some characteristic internal regions of the pump. In Figure 13, the pressure trend within a single displacement chamber of the driving gear highlights a progressive increment of pressure while approaching the delivery side of the pump, thus creating a sort of stepped curve. This phenomenon was due to the presence of leakages, where the high supply pressure was gradually transferred to the preceding vanes that still lie in the transition area of the machine. The plot was produced by means of a rotating monitoring point initially positioned in the meshing volume along the direction connecting the centers of the two gears. Therefore, a high-pressure peak in the meshing fluid region was noticed due to the strong volume reduction that occurred in this particular area of the pump because of the two gears’ centered position. In Figure 14a, a qualitative solution of the pressure field within the investigated EGP is shown. In particular, in Figure 14a, a three-dimensional view of the pump depicts the pressure distribution within the entire fluid domain, while in Figure 14b, a mid-section view of the two gears shows the pressure colored map in the main flux direction. In Figure 15, the pressure evolution within the axial gaps is presented with respect to the pump shaft angle. Qualitatively, the curve exhibited a similar trend to the one observed in Figure 13, but a consistent pressure drop was detected as a direct consequence of the 30-µm narrow passage between the gears’ flanks and the lateral bushings. This pressure difference was particularly evident at the delivery angular interval of the two plots, as only 4 bar were obtained in the axial gap with respect to the 20 bar measured within the displacement chamber.
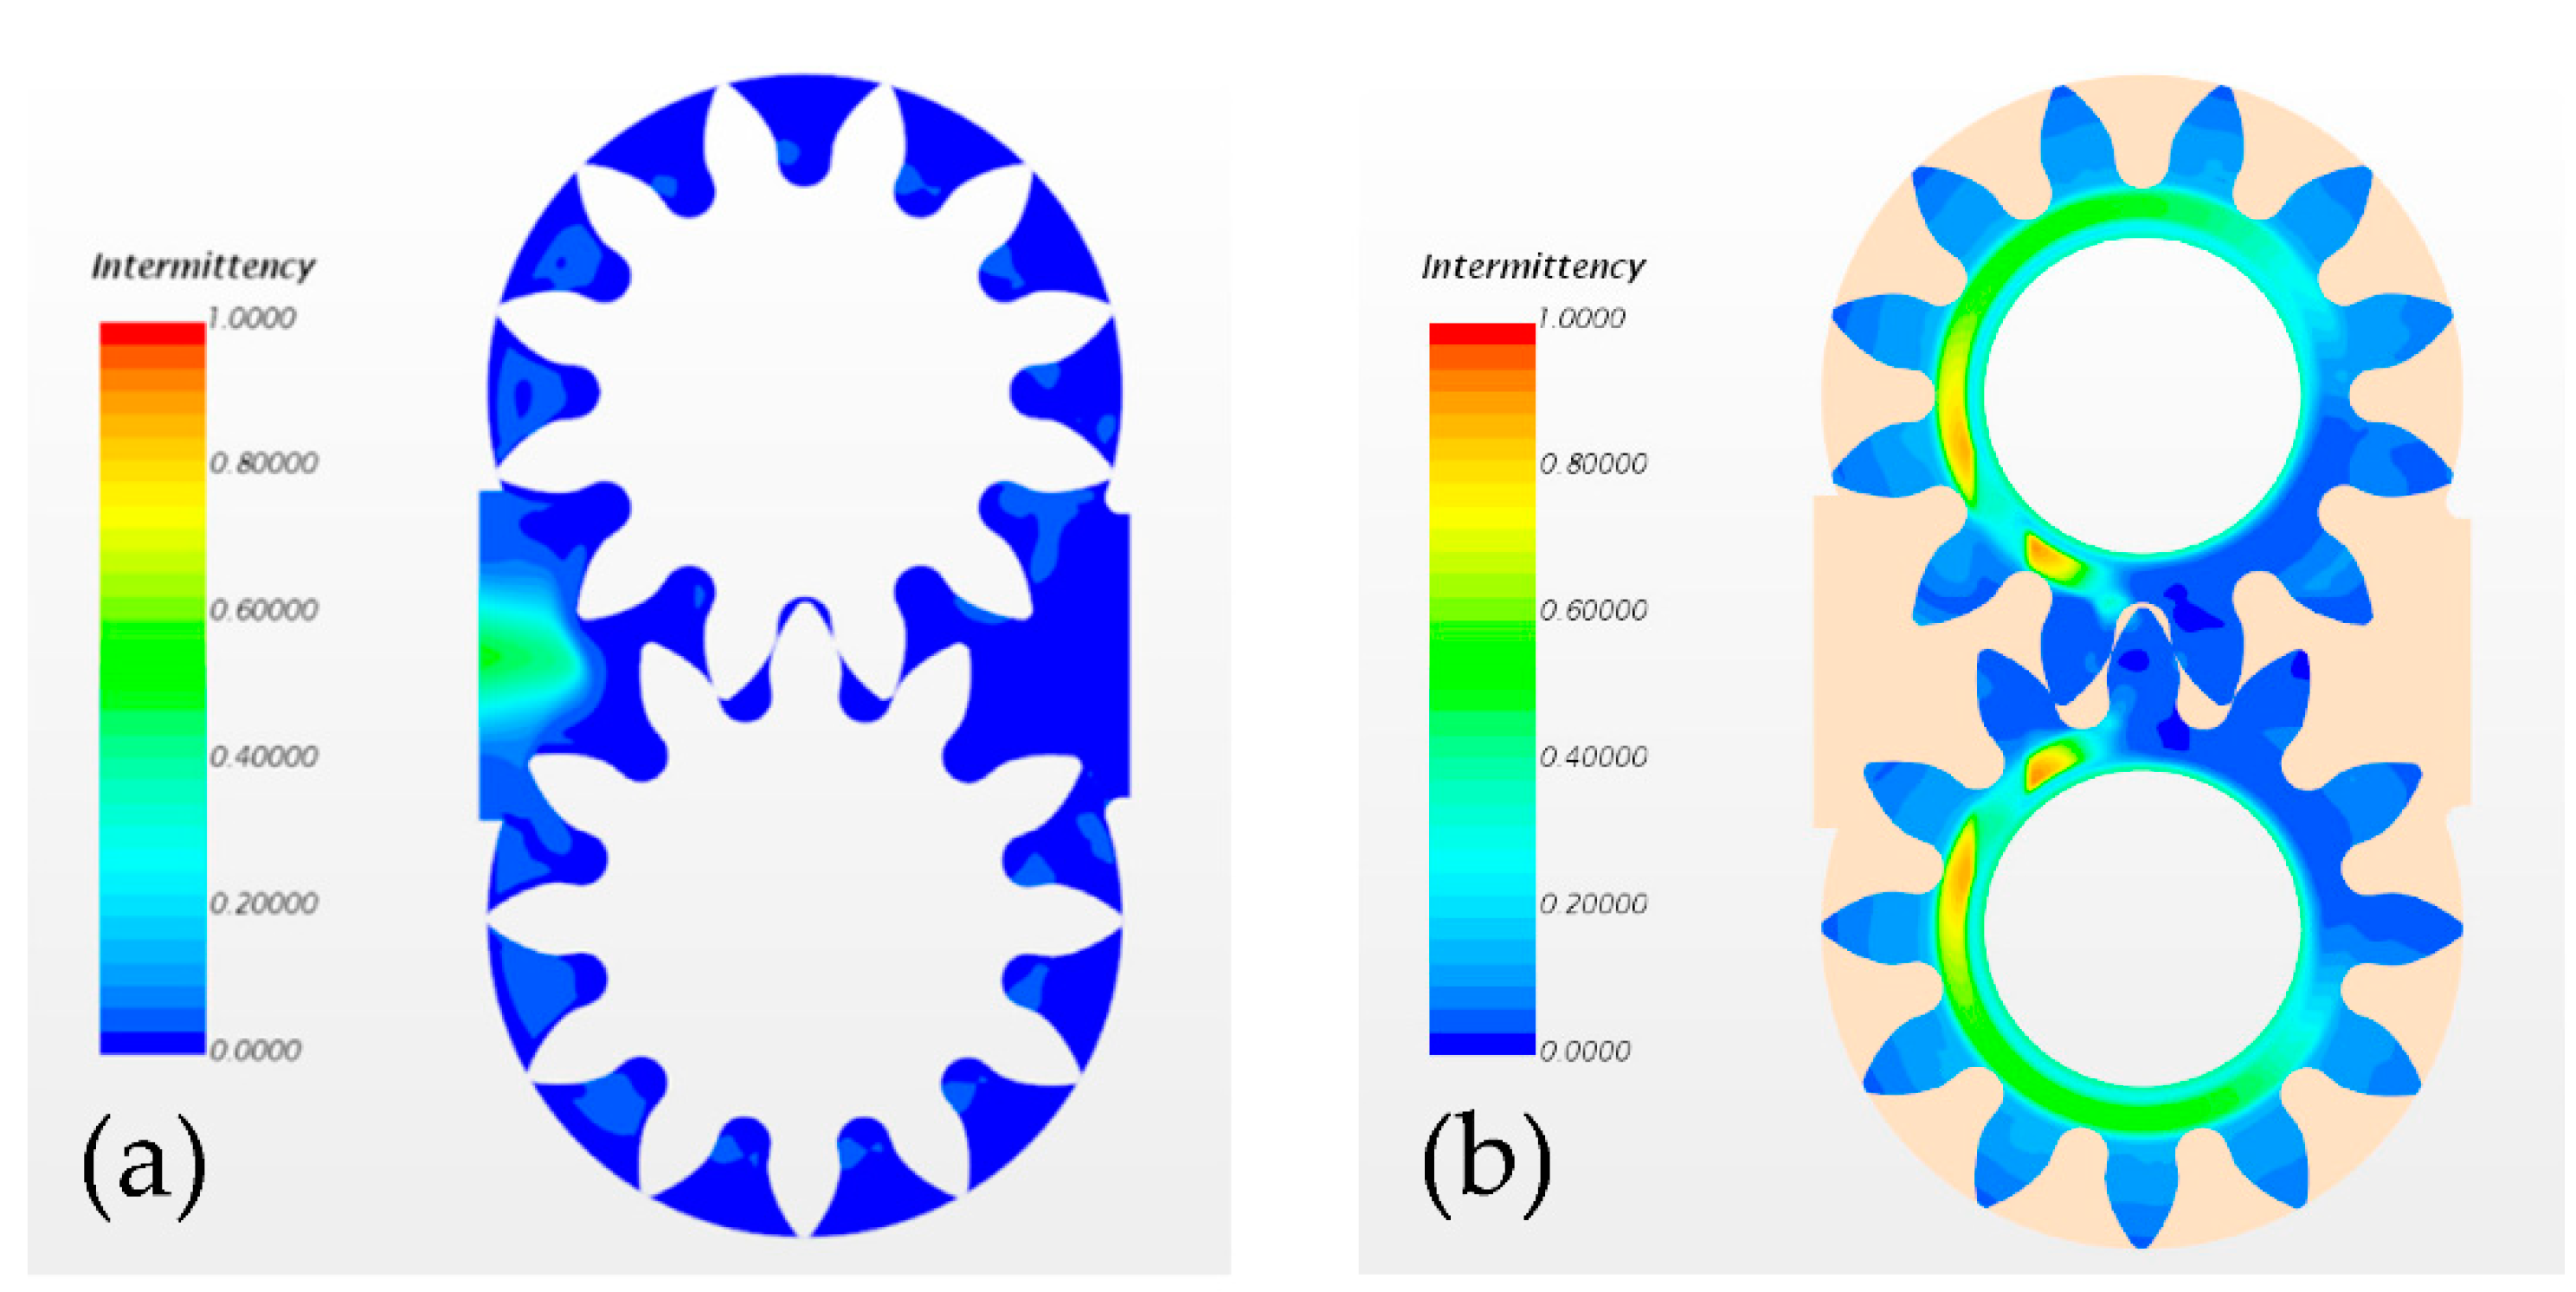
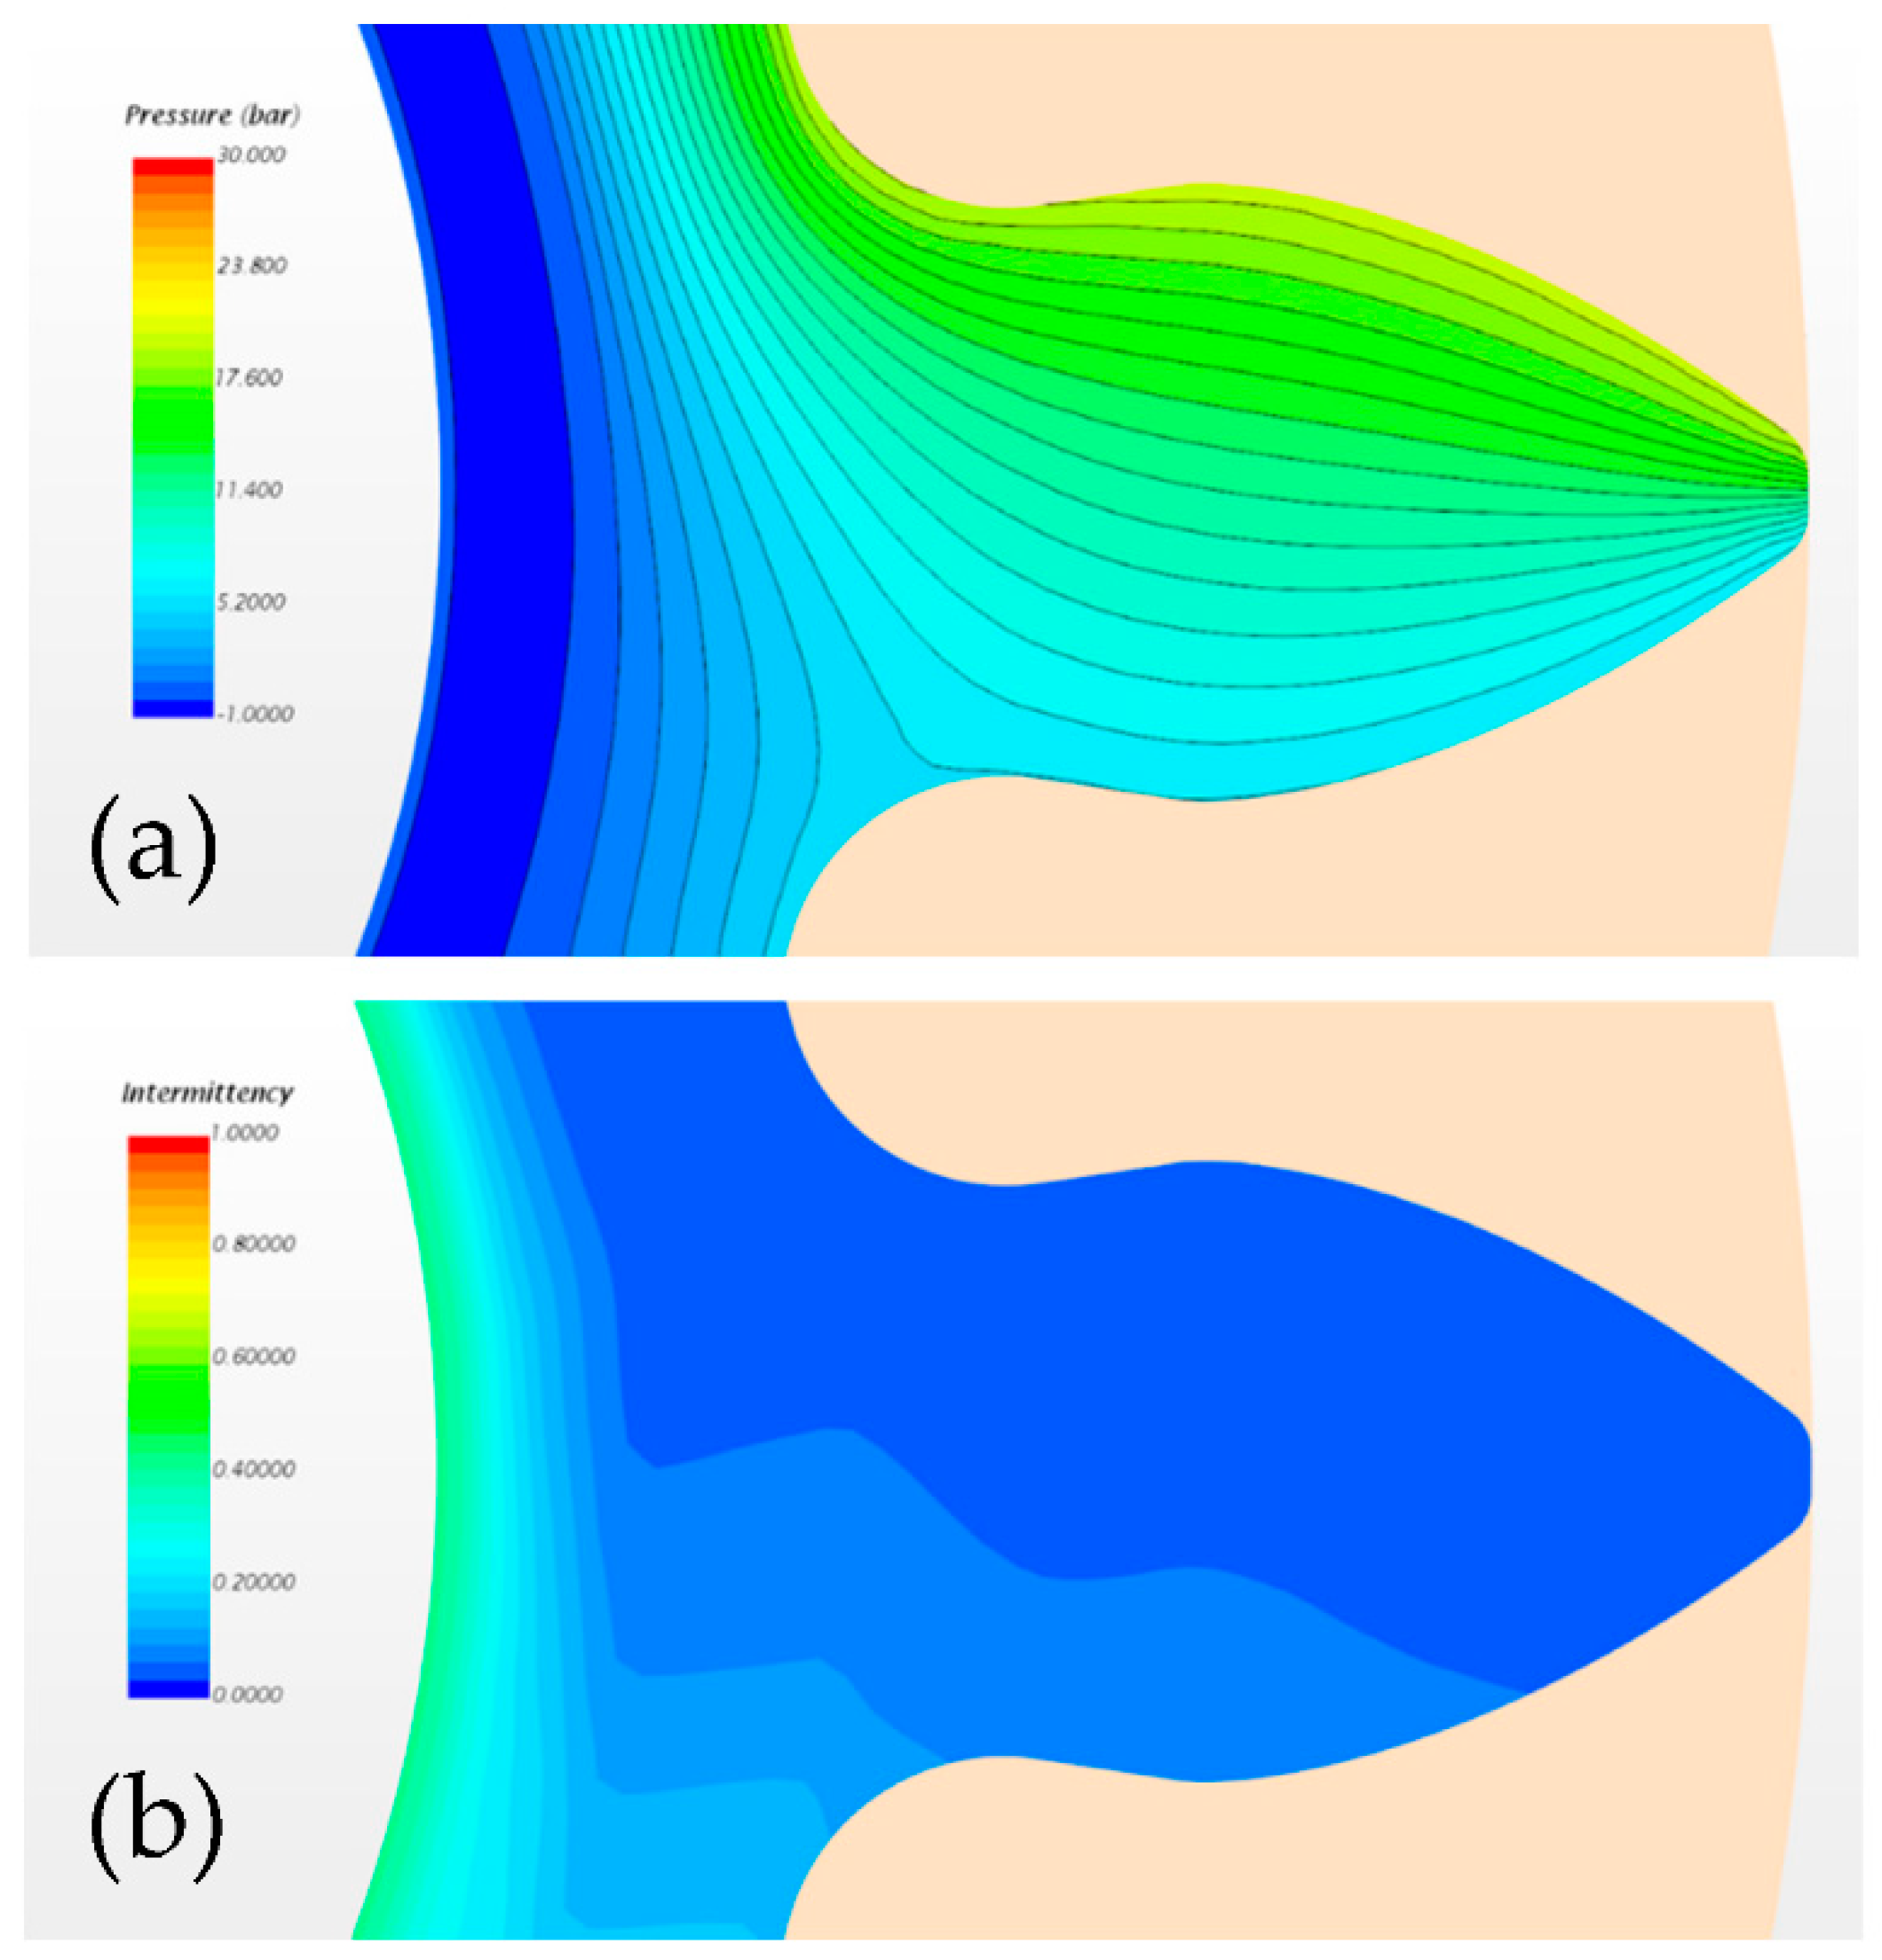
Subsequently, the turbulent behavior of the flow was investigated in order to predict the origin and intensity of the turbulent eddies at the most critical sections of the pump, thus producing the first numerical response at the recurring discussion about the fluid motion within leakages. In this paragraph, results are mostly discussed in terms of intermittency, a specific parameter of the software defining the intensity of the turbulent flow. In particular, a zero intermittency denotes a laminar flow, while an intermittency equal to one corresponds to a fully turbulent flow. In Figure 16a, a scalar scene showing intermittency across the gears’ section points out the predominantly laminar nature of the flow, thus supporting the laminar flow assumption within the radial leakages of the EGPs. Conversely, a higher turbulence was observed at the suction side of the pump. In Figure 16b, the intermittency across the axial leakage of the EGP highlights a low turbulent intensity of the flow, but a relevant vortex structure was noticed near the drainage boundaries due to the drag effect induced by the two gears’ motion on the local fluid. Moreover, in Figure 17a, the isobaric curves within a portion of the 30-µm axial gap underline a non-linear pressure drop among the displacement chamber and the drain outlet, thus proving the turbulent characteristic of the flow in this area of the pump, as reported in Figure 17b by means of the intermittency colored map. The proposed isobaric curves well-reproduced the results presented in [17] for an asymmetrical pressure condition between two adjacent displacement chambers. Nevertheless, slight differences were observed because of the significant influence of the gears’ drag on the pressure distribution within the axial leakage.
The temperature of the oil was finally monitored at different locations of the EGP during an entire revolution of the shaft in order to predict the flow thermal variations. In Figure 18, the evolution of the fluid temperature within a displacement chamber of the driving gear shows a progressive heating of the oil in the transition interval from suction to delivery due to the corresponding pressurization of the oil itself. Moreover, a peak of temperature of almost 26 °C was observed in the meshing volume, where pressure reached its highest value. Conversely, the oil’s temperature fell to a local valley of 23.8 °C at the suction opening, where the sudden increase of volume generated a low pressure area. In the same figure, a second line highlights larger temperature variations of the oil within the axial gap of the pump, thus producing a higher thermal stresses on the working fluid in this specific region. In particular, the maximum temperature of 26 °C reached within the trapped volume, namely the region of maximum fluid compression, was immediately followed by a local minimum of 14 °C measured at the end of the expansion transient, thus generating a 12 °C thermal shock on the oil.
In conclusion, in this section, a comparison between different physical models of an ISO VG 46 mineral oil was presented by discussing their influence on the CFD results of the analyzed EGP. The simulations proved the necessity of including the compressible nature of the liquid in terms of both pressure- and temperature-dependent fluid properties in order to get an accurate prediction of the pump fluid-dynamic performance.
3.2. Influence of Eco-Friendly Fluids on the Thermo-Fluid-Dynamic Performance of the Pump
The results of the previous analysis were exploited to investigate the effect of two eco-friendly fluids on both the volumetric efficiency of the EGP and the temperature distribution within the pump’s domain. The compressible model was implemented to accurately address the physical properties of the fluids, and consistent operating conditions were simulated in order to compare the performance of the pump with eco-friendly oils with respect to the aforementioned mineral oil application.
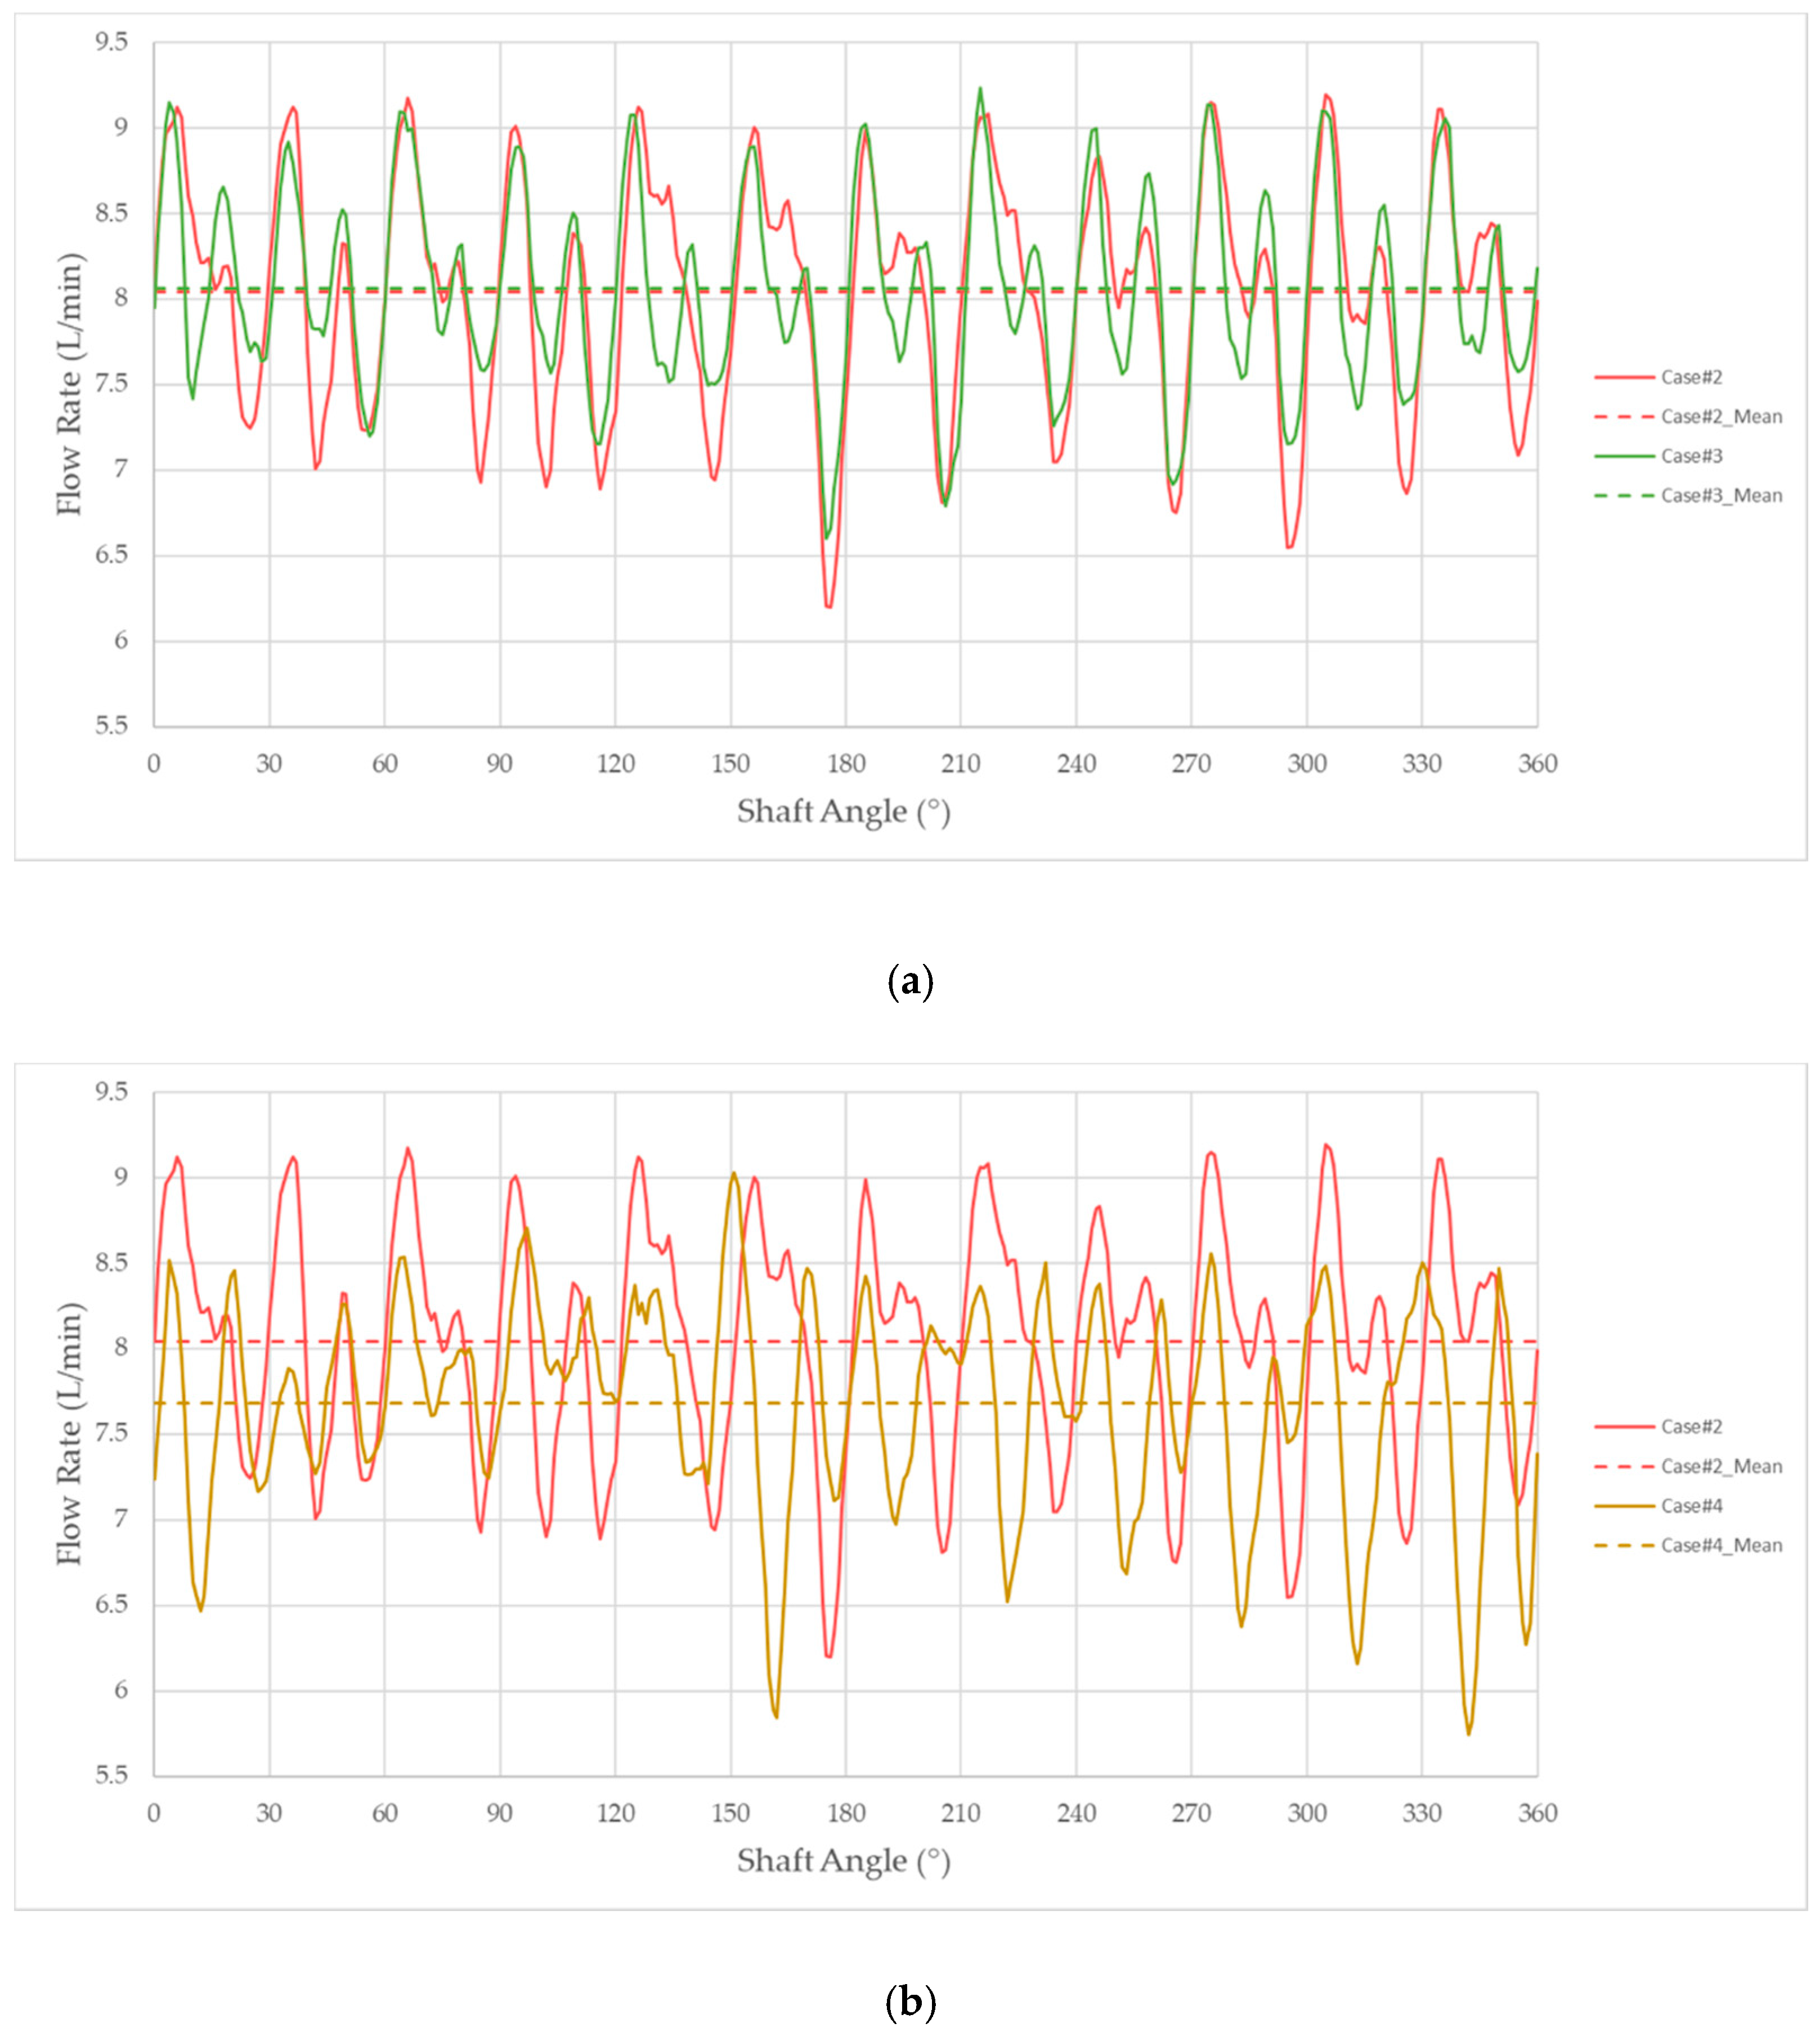
The results are firstly discussed in terms of delivered flow rate in order to evaluate the volumetric efficiency of the machine in the three analyzed operating conditions. In Figure 19, the flow rate measured at the outlet section of the pump is reported with respect to the shaft angular position, and a dotted line is used to point out the corresponding mean flow value. In detail, Figure 19a,b shows the pump flow ripple for Case #3 and Case #4, respectively, and a qualitative comparison with Case #2 is proposed. Similar frequencies and amplitudes were extracted from the plots for the three fluids’ configurations, and a slightly reduced performance of the pump was observed in Case #4 with respect to the other two cases. In particular, a volumetric efficiency of approximately 98.2% was derived for the BIOHYDRAN TMP 46 oil, while a 6.3% flow loss was predicted for the olive oil application, thus leading to a 93.7% volumetric efficiency of the pump. In Table 8, a synthetic representation of the delivered flow rate and the corresponding predicted volumetric efficiency of the pump are reported for each working fluid.
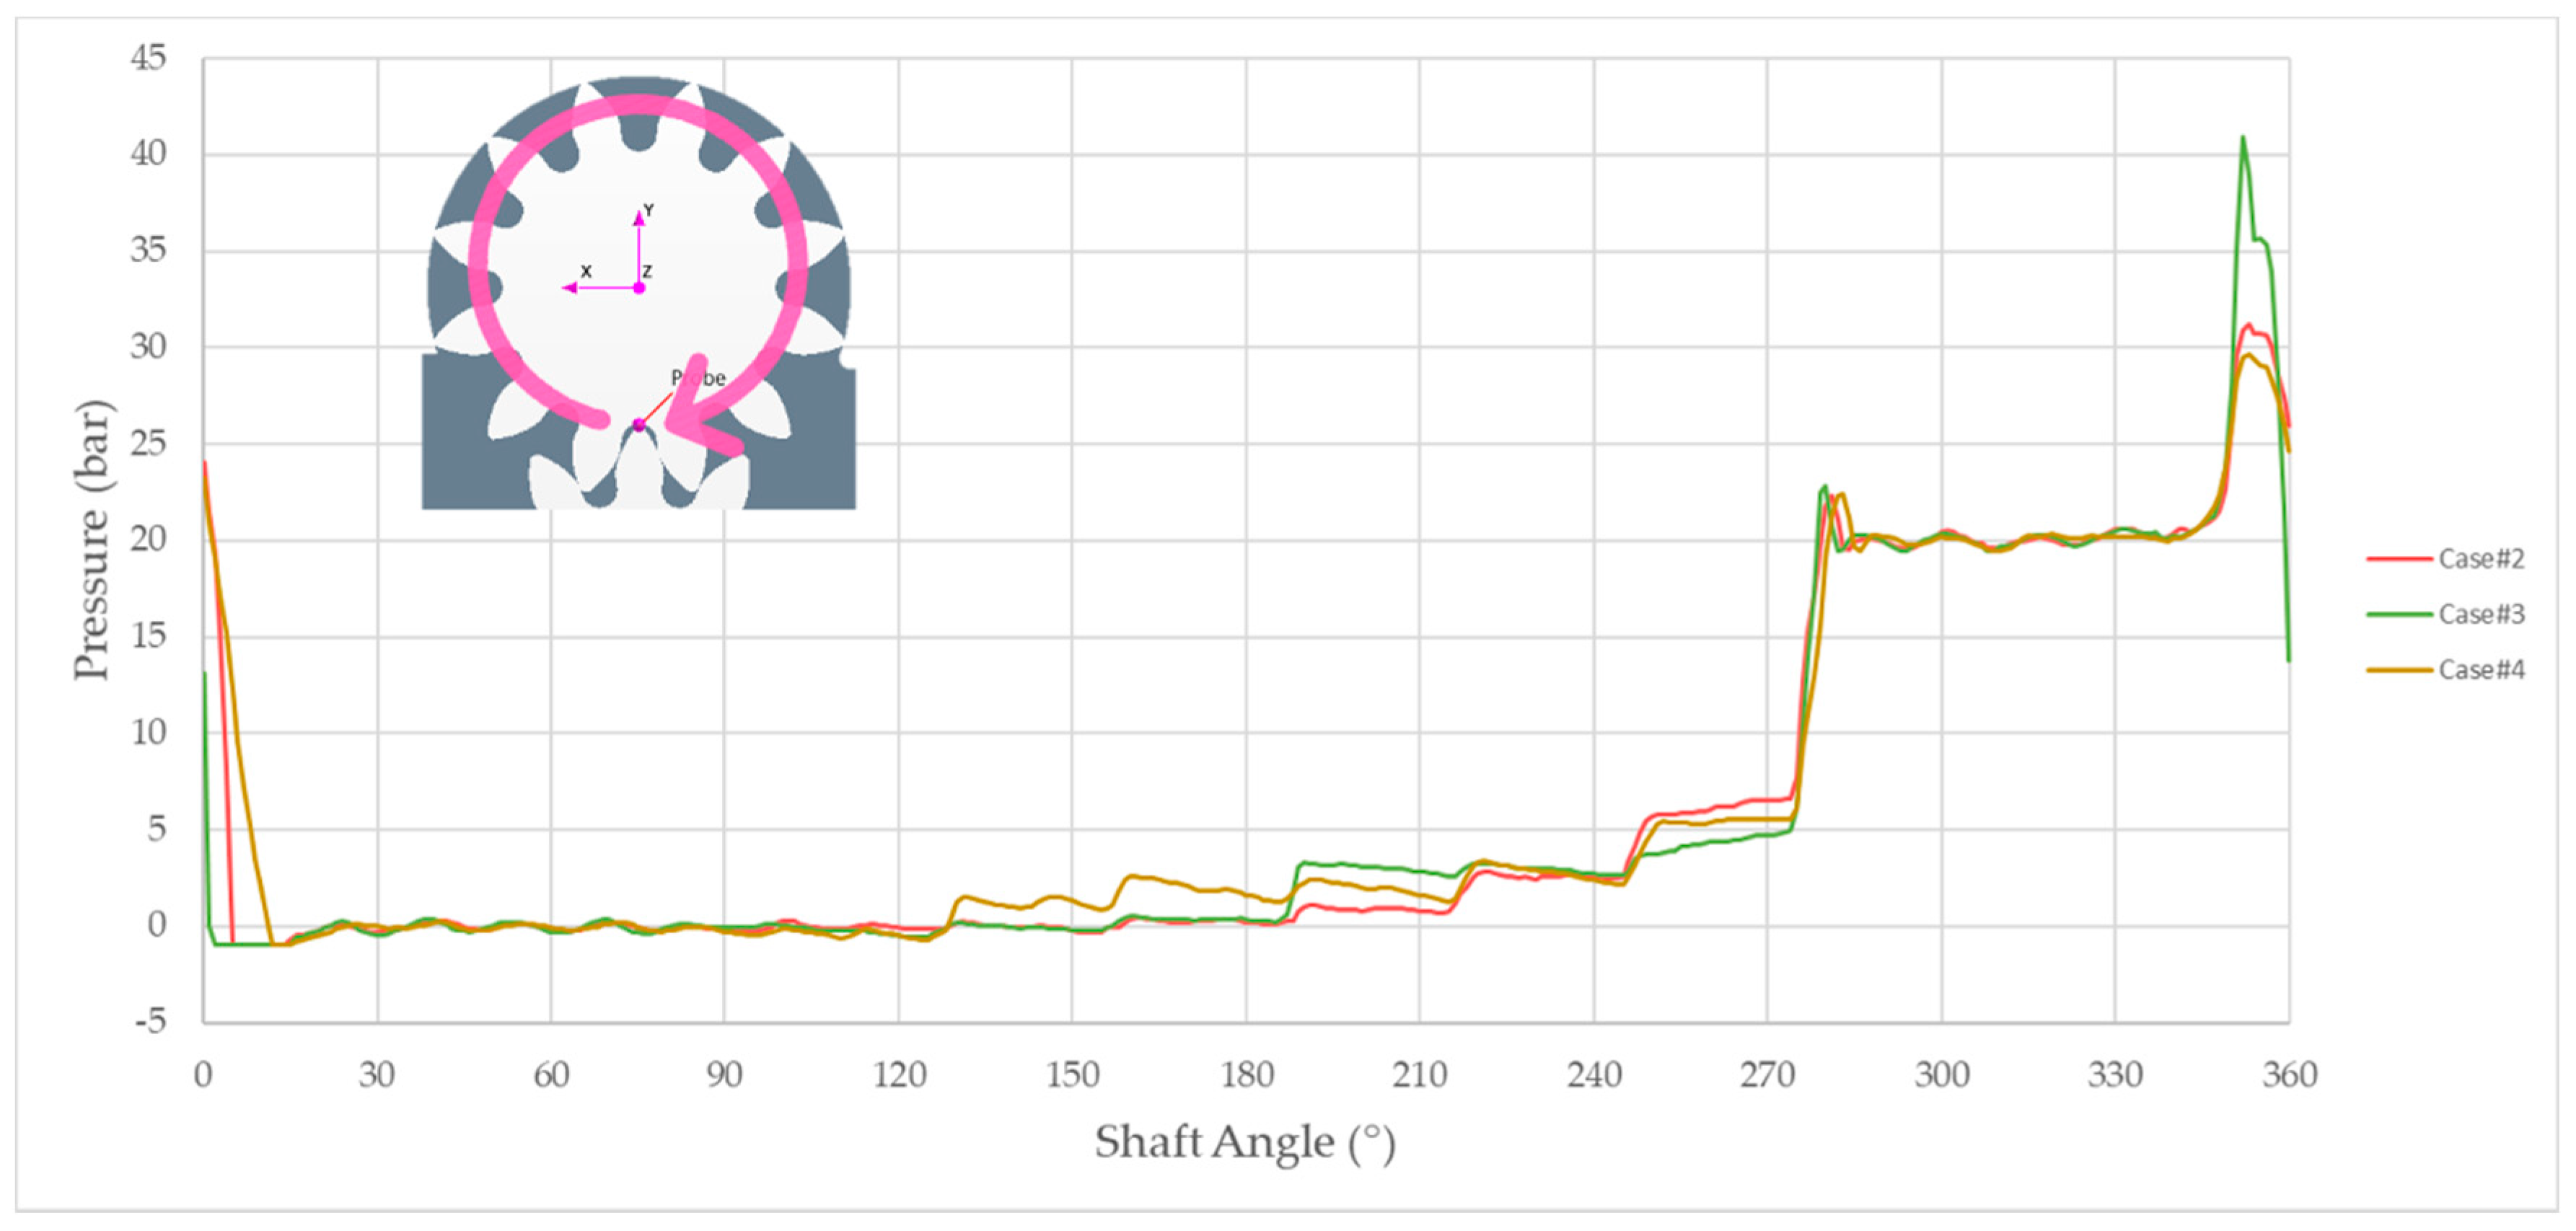
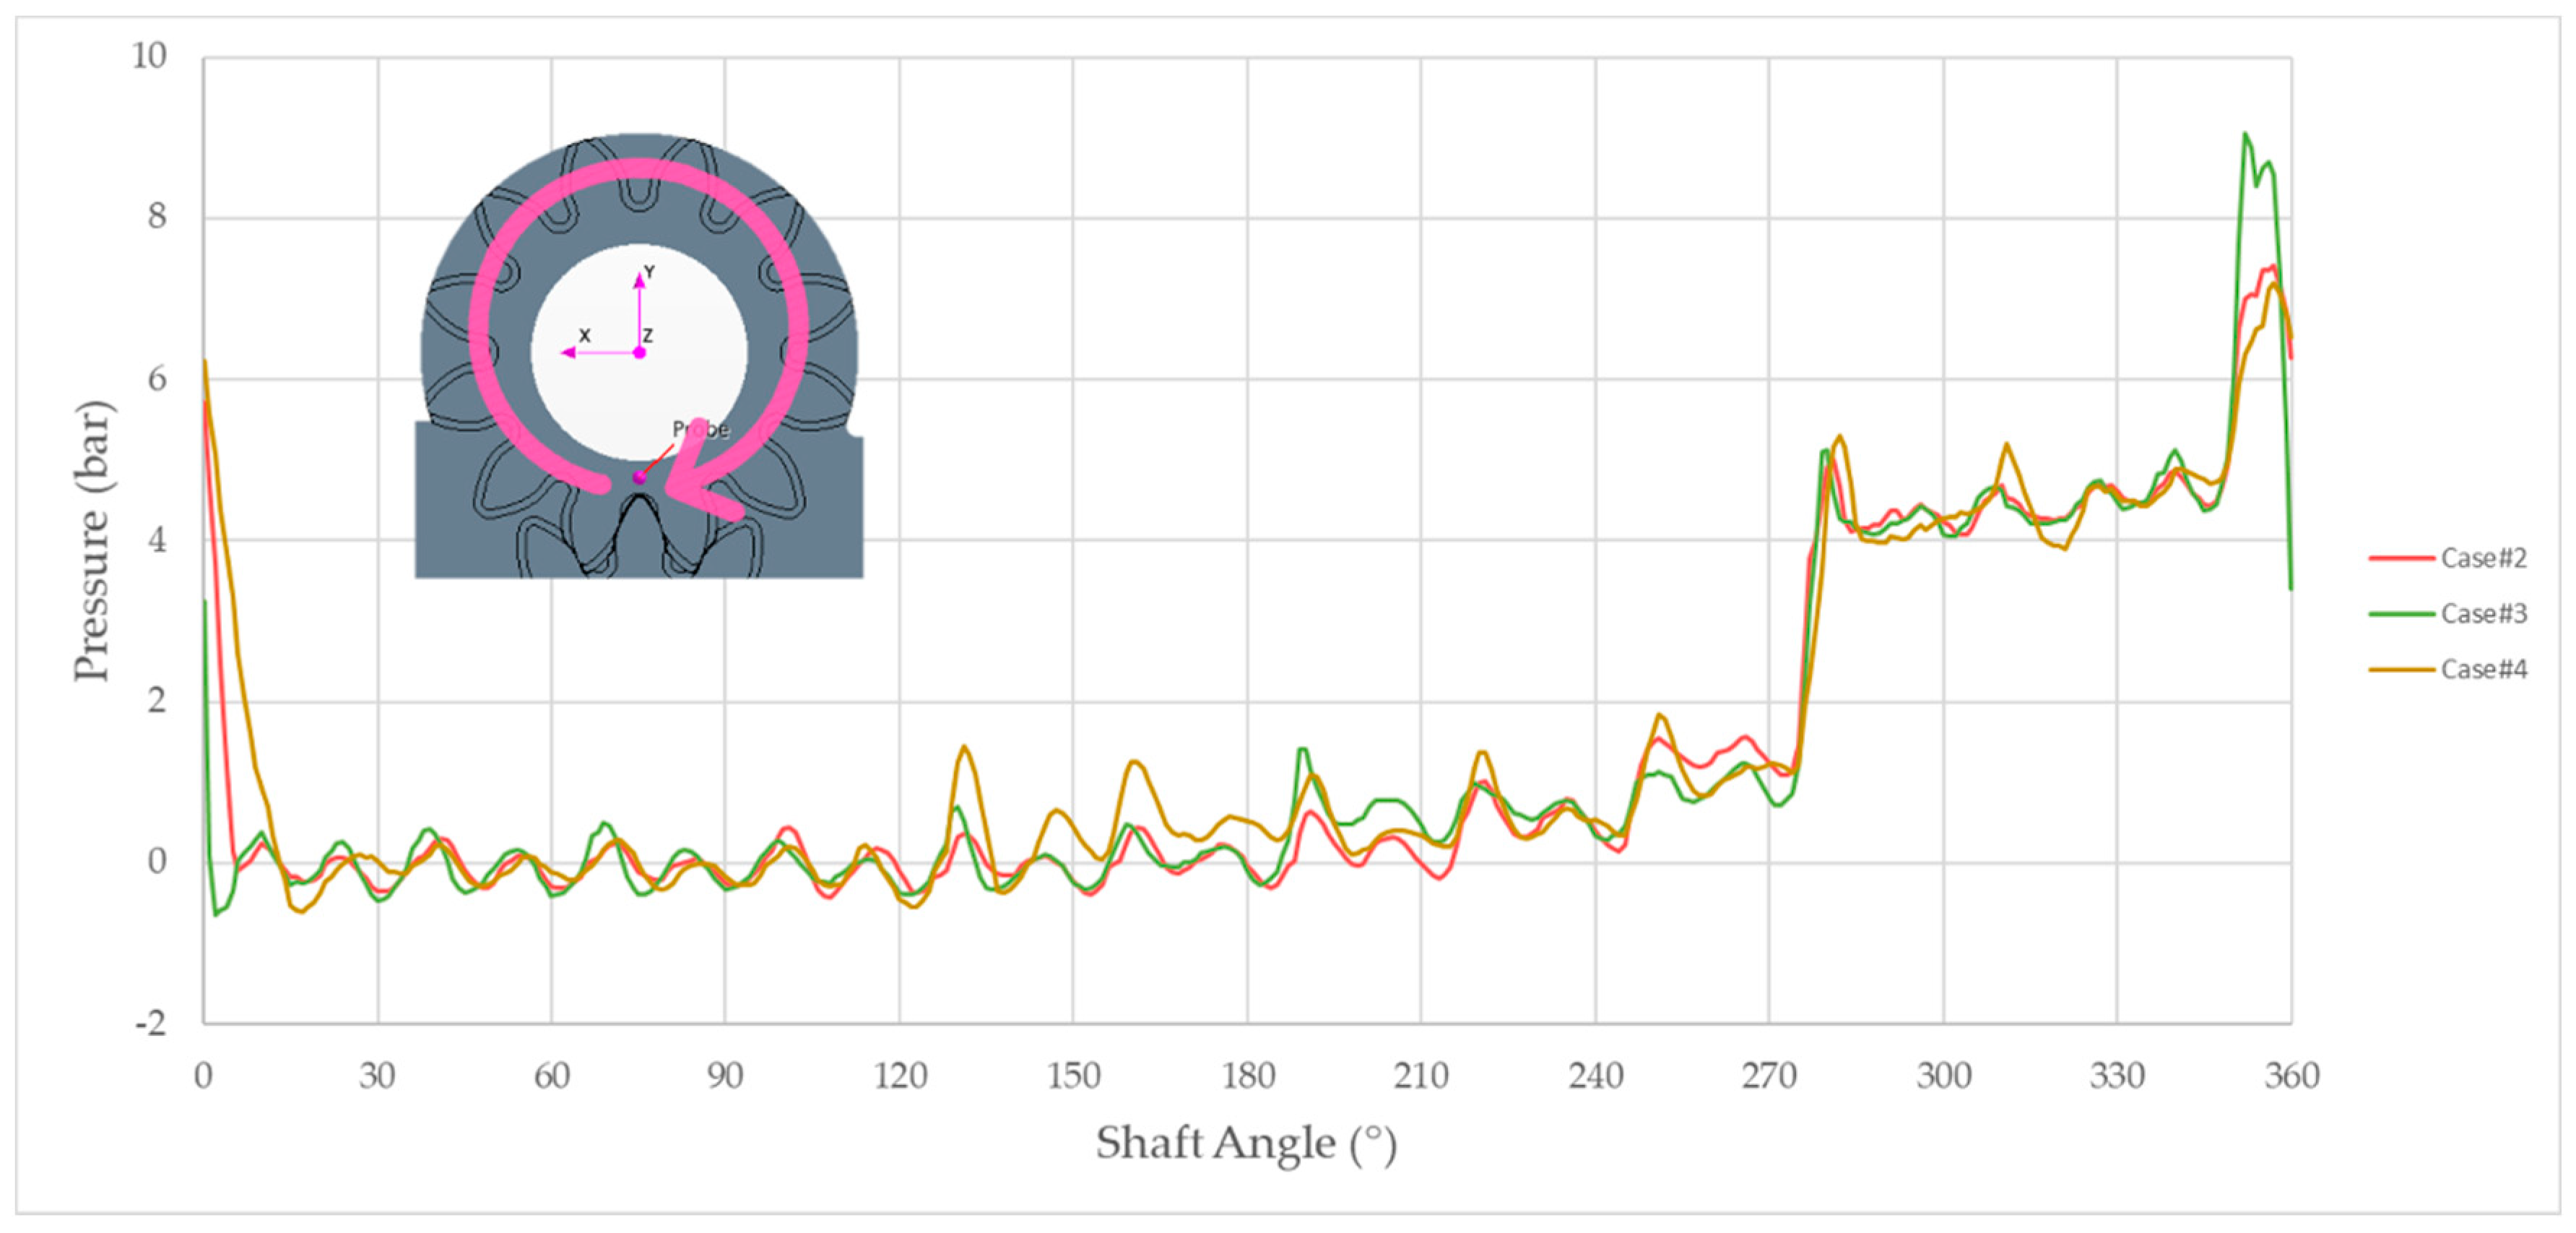
Subsequently, the influence of the two selected eco-friendly fluids on the internal pressure distribution of the pump was investigated by means of pressure measurements in several representative areas of the machine. In Figure 20a,b, the pressure ripples measured at the intake port of the pump are individually compared with the mineral oil result, and similar trends to those found earlier are shown. Similar considerations were derived from the separate analysis of the pressure signals at the outlet section of the pump, as depicted in Figure 21a,b. In detail, each simulation presented bounded pressure oscillations with values of 19.6 and 20.4 bar. Furthermore, Figure 22 depicts the pressure profile within a single displacement chamber of the EGP over an entire revolution of the driving shaft. These curves were derived by means of a rotating monitoring point initially positioned in the middle of the meshing volume along the centers’ axis, as represented in the top left corner of Figure 22. The plot highlights a higher pressure peak occurring at the meshing region of Case #3 with respect to the other two cases, since a slight difference of 2 bar was observed from Case #2 to Case #4. Moreover, in Case #3, a sudden decrease of pressure when leaving the gears’ contact position caused an extended local low pressure area where cavitation and aeration phenomena may have occurred. Conversely, in Case #4, a slower pressure drop at the intake opening region significantly reduced the cavitating area, thus preserving the mechanical components of the pump. Additionally, a progressive increment of pressure due to leakages was observed in the transition region of the pump at each simulated condition. In particular, a larger influence of the supply pressure on the furthest regions was observed in the olive oil configuration. Afterwards, in Figure 23, the pressure signals within the axial leakages of the pump are presented. Despite showing similar trends to the ones shown in Figure 22, lower pressure values were observed during the delivery phase due to the significant pressure drop across the 30-µm gap between the gears’ flanks and the lateral bushings.
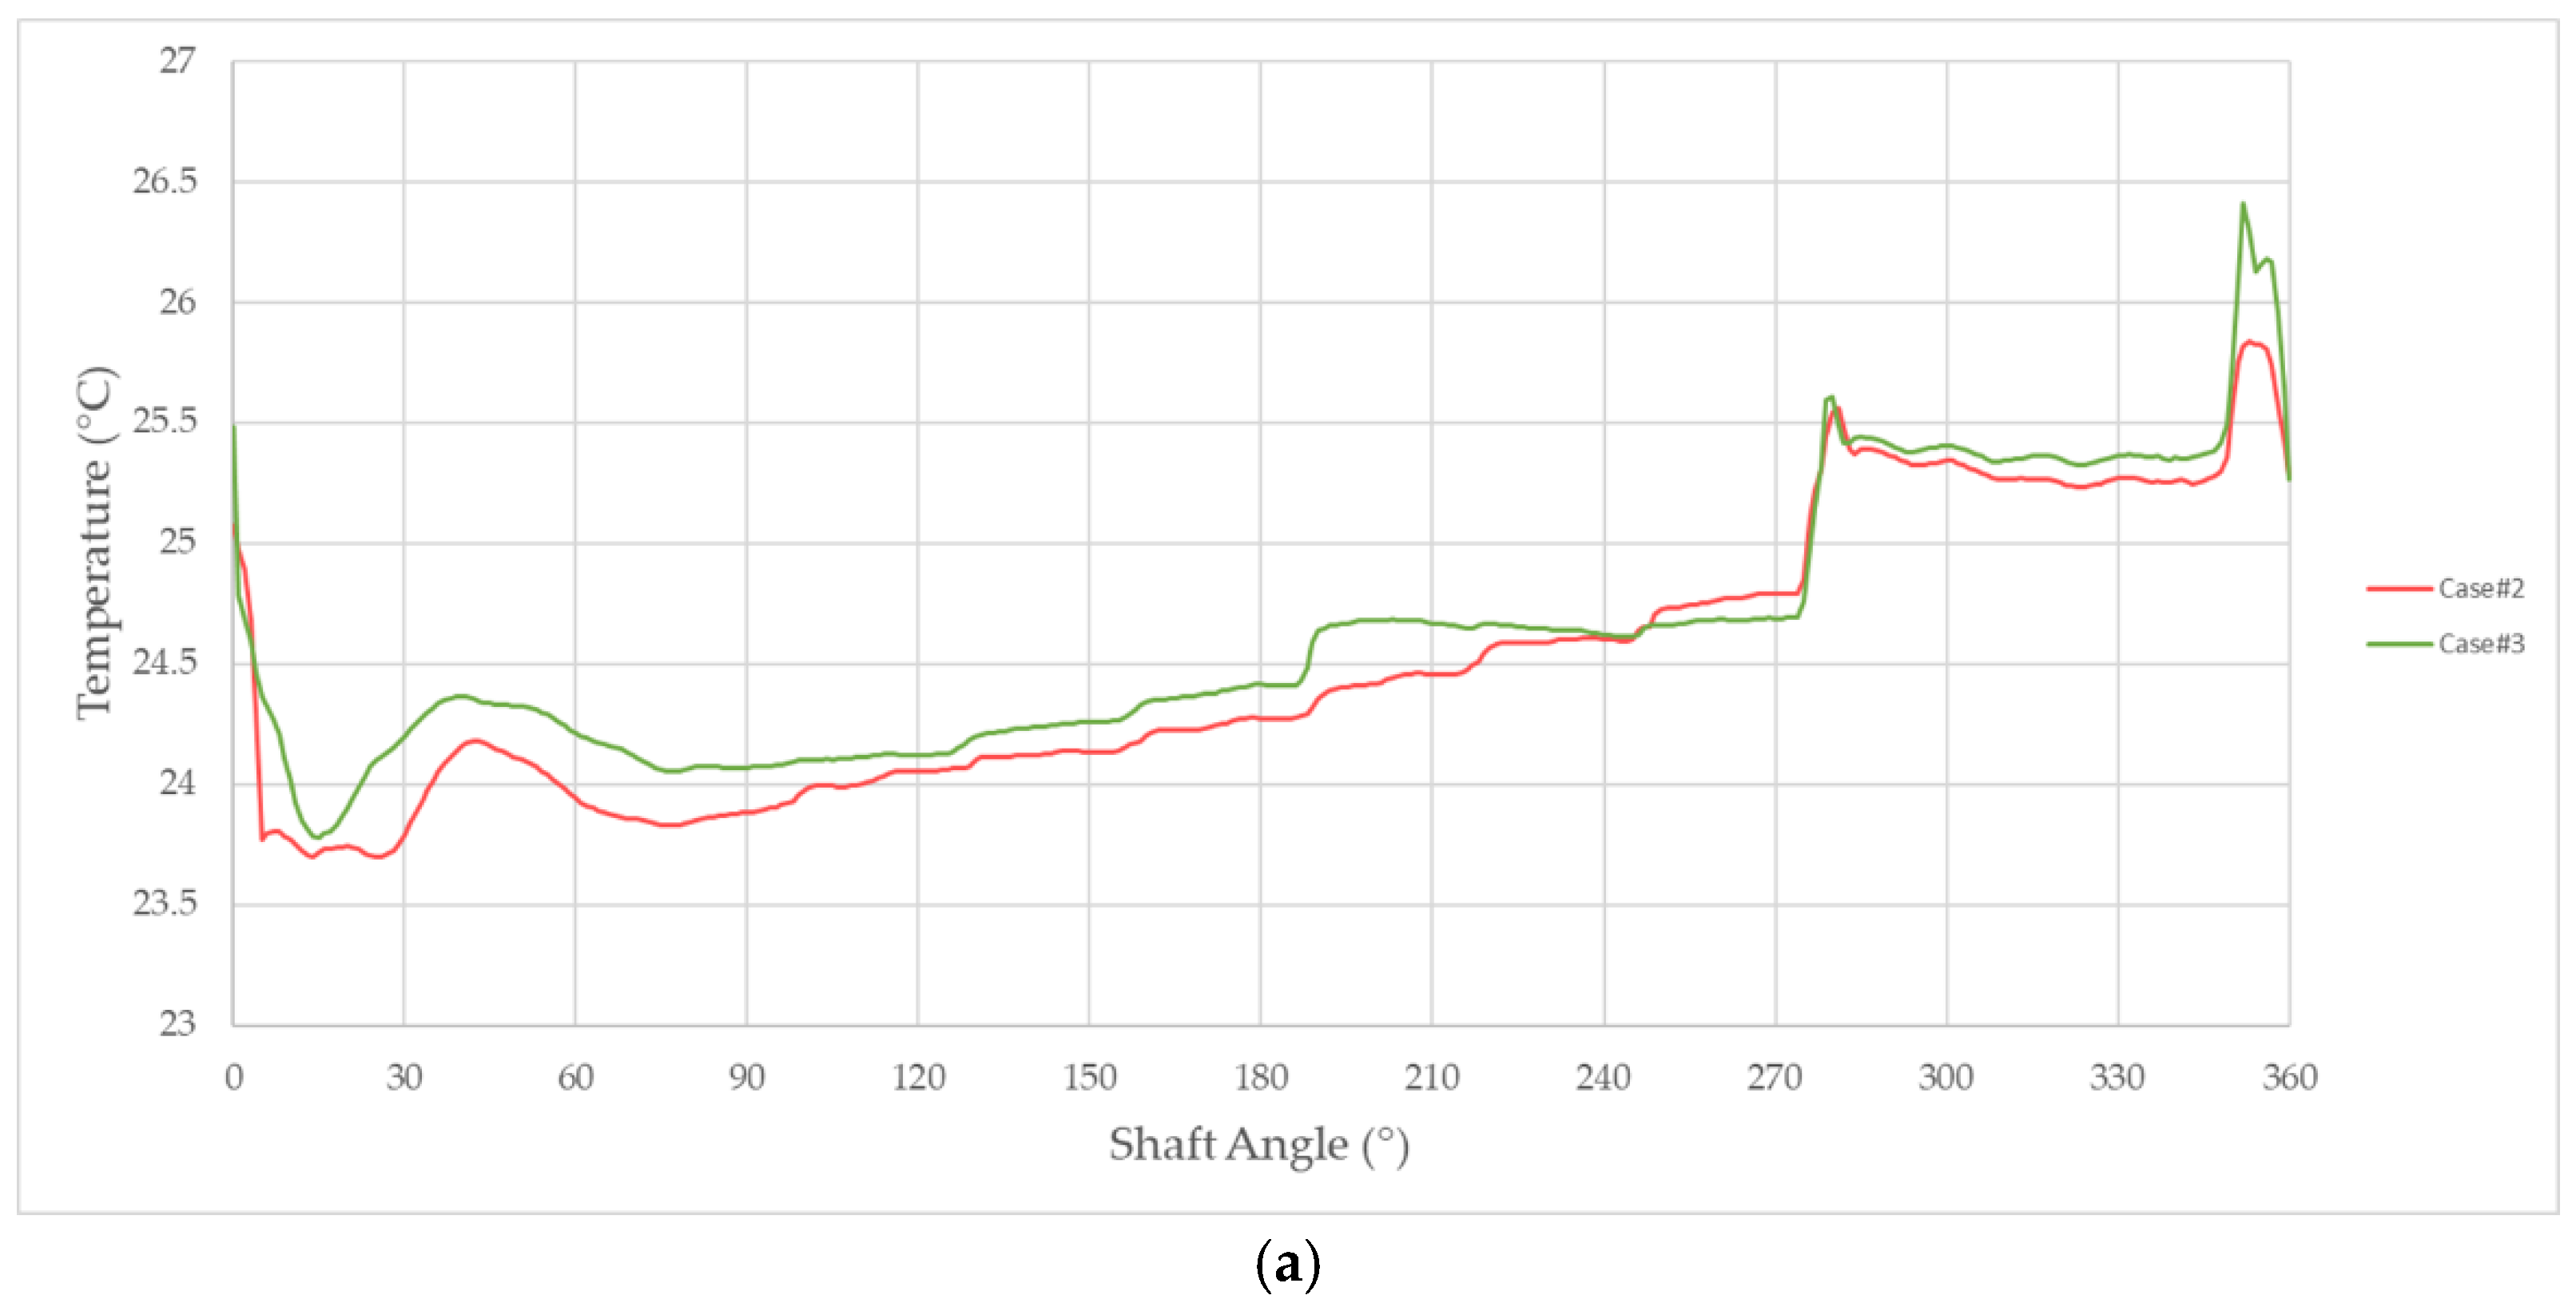
Finally, a thermal analysis of the EGP fluid domain was performed in order to predict local regions of oil heating and cooling. The results were extracted at the same monitoring positions as the previously described pressure signals, thus exploiting identical rotating probes. Figure 24a,b reports the temperature variation of both eco-friendly fluids as a comparison with the thermal behavior of the mineral oil. Almost overlapping curves were obtained for Case #2 and Case #3, except for the higher temperature observed in Case #3 within the meshing volume. On the other hand, olive oil showed a slightly different thermal behavior since higher temperatures were measured during the suction and the transition phases, while a one-centigrade-reduction was achieved in the delivery angular interval. Moreover, Figure 25a,b depicts, respectively, the temperature profile of the BIOHYDRAN TMP 46 and the olive oil within the axial gap of the pump with respect to the mineral oil result. A smooth curve was predicted in Case #4, whereas deeper temperature valleys of 14 and 6 °C were reached in Case #2 and Case #3, respectively, at the beginning of the intake stroke of the displacement chamber, namely the lower pressure region of the pump.
To summarize, the fluid-dynamic performance of the investigated EGP was numerically compared with different oil conditions in order to predict the influence of eco-friendly fluids on the internal parameters of the pump. The results highlighted acceptable volumetric efficiencies for both the BIOHYDRAN TMP 46 and olive oil configurations, even if slightly larger flow losses were measured in the second condition. Moreover, similar pressure and temperature signals were obtained for the two biodegradable oils with respect to the actual mineral one, proving these fluids’ suitability in the pump operation.
4. Conclusions
This paper presents a CFD methodology for the dynamic analysis of external gear pumps developed on the full three-dimensional geometry of a test case industrial EGP with spur gears.
An innovative representation of the dynamic fluid domain of the pump was achieved by means of the overset mesh technique embedded in the STAR-CCM+ multipurpose software, as it perfectly addressed the coupling of the two gears, as well as the contact between each pair of mating teeth. All the internal leakages of the pump were included in the proposed CFD model, and quadrilateral elements were used to discretize the entire geometry. Moreover, the prism layer shrinkage property and the extruded mesh model were, respectively, used to enforce six cells within the radial gap and twenty layers through the axial gaps.
The pump was initially investigated under actual operating conditions, including an ISO VG 46 mineral oil at the working temperature of 25 °C. This configuration was exploited to evaluate the influence of increasingly exhaustive fluid models on the simulation results. In particular, the compressible model of the oil, describing the effect of both pressure and temperature on the fluid properties, turned out to be a critical element in the prediction of the pump volumetric efficiency, as inconsistent results were instead derived from the incompressible flow assumption. To recap, the fluid compressibility led to a non-negligible drop of the delivered flow rate due to the effective viscosity reduction produced by local fluid heating, which in turn facilitated leakages through the small gaps between components. Consequently, this consideration proved the importance of including the energy equation in the physics models of the oil in order to accurately address the fluid-dynamic characteristics of the pump.
Furthermore, the turbulent-to-laminar transition was analyzed at some critical sections of the EGP by means of the gamma transition model. The results highlighted a very low turbulence intensity along the main direction of the flow, thus supporting the laminar flow assumption within the displacement chambers and in the radial leakages of the pump. A predominantly laminar flow was also observed within the axial leakages, but the non-negligible turbulence intensity near the drain connections of the machine suggested the incomplete accuracy of a fully laminar model in this specific area of the pump.
The CFD model was further validated by comparing numerical and experimental results. In particular, a 1% difference was observed in terms of pump volumetric efficiency with respect to the bench test, thus proving the accuracy and the reliability of the proposed numerical solutions.
These results were subsequently adopted to predict the influence of eco-friendly oils on the thermo-fluid-dynamic behavior of the EGP. Firstly, the Total BIOHYDRAN TMP 46 industrial oil was considered and a 98.2% volumetric efficiency of the pump was predicted, thus showing no substantial differences with the mineral oil application. Additionally, this work aimed to investigate—for the first time from the pump perspective—the effective opportunity of employing a 100% biodegradable fluid, such as olive oil, within a hydraulic lubrication circuit. The numerical simulation highlighted a 93.7% volumetric efficiency of the EGP under this fluid condition. Nevertheless, despite showing higher flow losses with respect to the other cases, the olive oil application ensured a shorter low-pressure area at the suction stage of the pump, thus significantly limiting aeration and cavitation phenomena. Simultaneously, a slightly lower fluid temperature was measured at the pressure port of the machine.
In conclusion, this work highlights the concrete possibility of actuating external gear pumps with eco-friendly fluids. However, future research on this topic is needed in order to predict the performance of the pump at higher fluid temperatures, as well as to remove the hypothesis of constant leakages, thus including the radial displacement of the two gears and the tilted positions of the lateral bushings.
Author Contributions
Conceptualization, M.M., L.M., A.L., and A.S.; methodology, M.M., L.M., G.M., and A.P.; software, G.M. and A.P.; validation, G.M., and A.P.; formal analysis, M.M., L.M., G.M., and A.P.; investigation, G.M. and A.P.; resources, M.M., L.M., A.L., and A.S.; data curation, G.M.; writing—original draft preparation, G.M.; writing—review and editing, G.M. and M.M.; visualization, G.M.; supervision, M.M., L.M., A.L., and A.S.; project administration, M.M., L.M., A.L., and A.S.; funding acquisition, M.M. and L.M. All authors have read and agreed to the published version of the manuscript.
Funding
This research was funded by Emilia Romagna Region—project PG/2018/632152, Efflics—Eco Friendly Fluidics for Fluid Power.
Institutional Review Board Statement
Not applicable.
Informed Consent Statement
Not applicable.
Data Availability Statement
The data presented in this study are available on request from the corresponding author. The data are not publicly available due to privacy restrictions.
Acknowledgments
The authors would like to acknowledge the staff of the Dana Motion Systems Italia S.r.l. company for the technical material. Finally, a sincere acknowledgement goes to the research team and to the partners of the project “Efflics—Eco Friendly Fluidics for Fluid Power” for the key support in this work’s development.
Conflicts of Interest
The authors declare no conflict of interest.
Nomenclature
| µ | Dynamic viscosity |
| µB | Dynamic viscosity of Total BIOHYDRAN TMP 46 |
| µM | Dynamic viscosity of mineral oil |
| µO | Dynamic viscosity of olive oil |
| ρ | Density |
| ρ0 | Density at the atmospheric pressure |
| ρ0,B | Density of the Total BIOHYDRAN TMP 46 at the atmospheric pressure |
| ρ0,M | Density of the mineral oil at the atmospheric pressure |
| ρ0,O | Density of the olive oil at the atmospheric pressure |
| Av | Area of the displacement chamber |
| b | Face width of the gears |
| c | Speed of sound of the fluid |
| CAD | Computer-aided design |
| CFD | Computational fluid dynamics |
| EGP | External gear pump |
| FEM | Finite element method |
| n | Pump rotation speed rate |
| Qth | Theoretical supply flow rate |
| T | Temperature |
| V | Displacement of the pump |
| z | Teeth of the gears |
References
- Ivantysyn, J.; Ivantysynova, M. Hydrostatic Pumps and Motors: Principles, Design, Performance, Modelling, Analysis, Control and Testing; Akademia Books International: New Delhi, India, 2001; ISBN 8185522162. [Google Scholar]
- Stryczek, J. Fundamentals of Designing Hydraulic Gear Machines; Wydawnictwo Naukowe PWN: Warsaw, Poland, 2020; ISBN 8301212268. [Google Scholar]
- Rundo, M. Models for Flow Rate Simulations in Gear Pumps: A Review. Energies 2017, 10, 1261. [Google Scholar] [CrossRef] [Green Version]
- Mancò, S.; Nervegna, N. Simulation of an External Gear Pump and Experimental Verification. In Proceedings of the International Symposium on Fluid Power, Tokyo, Japan, 13–16 March 1989. [Google Scholar]
- Casoli, P.; Vacca, A.; Franzoni, G. A Numerical Model for the Simulation of External Gear Pumps. In Proceedings of the 6th JFPS International Symposium on Fluid Power, Tsukuba, Japan, 7–10 November 2005. [Google Scholar] [CrossRef]
- Rituraj, R.; Vacca, A.; Morselli, M.A. Thermal Modelling of External Gear Machines and Experimental Validation. Energies 2020, 13, 2920. [Google Scholar] [CrossRef]
- Mucchi, E.; D’Elia, G.; Dalpiaz, G. Simulation of the Running in Process in External Gear Pumps and Experimental Verification. Meccanica 2012, 47, 621–637. [Google Scholar] [CrossRef]
- Borghi, M.; Milani, M.; Paltrinieri, F.; Zardin, B. About the Prediction of Pressure Variation in the Inter-Teeth Volumes of External Gear Pumps. In Proceedings of the 3rd FPNI-PhD Symposium on Fluid Power, Barcellona, Spain, 30 June–2 July 2004. [Google Scholar]
- Borghi, M.; Milani, M.; Paltrinieri, F.; Zardin, B. Studying the Axial Balance of External Gear Pumps. In Proceedings of the SAE Commercial Vehicle Engineering Congress and Exhibition, Chicago, IL, USA, 1–3 November 2005. [Google Scholar] [CrossRef]
- Lin, T.; Ou, H.; Li, R. A Finite Element Method for 3D Static and Dynamic Contact/Impact Analysis of Gear Drives. Comput. Methods Appl. Mech. Eng. 2007, 196, 1716–1728. [Google Scholar] [CrossRef]
- Biernacki, K.; Stryczek, J. Analysis of Stress and Deformation in Plastic Gears Used in Gerotor Pump. J. Strain Anal. Eng. Des. 2010, 45, 465–479. [Google Scholar] [CrossRef]
- Bednarczyk, S.; Stryczek, J. Axial Clearance Compensation in Gear Displacement Machines. In Proceedings of the 3rd FPNI-PhD Symposium on Fluid Power, Barcellona, Spain, 30 June–2 July 2004. [Google Scholar]
- Gafurov, S.; Rodionov, L.; Makaryants, G. Simulation of Gear Pump Noise Generation. In Proceedings of the 9th FPNI-PhD Symposium on Fluid Power, Florianópolis, Brazil, 26–28 October 2016. [Google Scholar] [CrossRef]
- Močilan, M.; Husár, Š.; Labaj, J.; Žmindák, M. Non-Stationary CFD Simulation of a Gear Pump. Procedia Eng. 2017, 177, 532–539. [Google Scholar] [CrossRef]
- Imamoğlu, D.; Ertunç, Ö. Analysis of Tip Leakage in External Gear Pump. In Proceedings of the 9th International Automotive Technologies Congress, Bursa, Turkey, 7–8 May 2018. [Google Scholar]
- Frosina, E.; Senatore, A.; Rigosi, M. Study of a High-Pressure External Gear Pump with a Computational Fluid Dynamic Modeling Approach. Energies 2017, 10, 1113. [Google Scholar] [CrossRef] [Green Version]
- Paltrinieri, F.; Borghi, M.; Milani, M. Studying the Flow Field Inside Lateral Clearances of External Gear Pumps. In Proceedings of the 3rd FPNI-PhD Symposium on Fluid Power, Barcellona, Spain, 30 June–2 July 2004. [Google Scholar]
- Zivkovic, M.; Miljojkovic, J.; Stozinic, T.; Bijelic, I.; Milosevic, S.; Mor, N. The Effect of Axial Clearance in Gear Pumps on Volumetric Efficiency. In Proceedings of the IMT Oradea, Oradea, Romania, 25–27 May 2017. [Google Scholar] [CrossRef]
- Dhar, S.; Vacca, A. A Novel CFD-Axial Motion Coupled Model for the Axial Balance of Lateral Bushings in External Gear Machines. Simul. Model. Pract. Theory 2012, 26, 60–76. [Google Scholar] [CrossRef]
- Milani, M.; Montorsi, L.; Terzi, S.; Storchi, G. Analysis of a Double Inlet Gerotor Pump: A Dynamic Multi-Phase CFD Approach Accounting for the Fluid Compressibility and Temperature Dependent Properties. In Proceedings of the ASME 2019 International Mechanical Engineering Congress and Exposition, Salt Lake City, UT, USA, 11–14 November 2019. [Google Scholar] [CrossRef]
- Milani, M.; Montorsi, L.; Venturelli, M. A Combined Numerical Approach for the Thermal Analysis of a Piston Water Pump. Int. J. Thermofluids 2020, 7, 100050. [Google Scholar] [CrossRef]
- Siemens PLM Software. Star-CCM+ 15.02.009 User Guide; Siemens PLM Software: Plano, TX, USA, 2020. [Google Scholar]
- Sahasrabudhe, S.N.; Rodriguez-Martinez, V.; O’Meara, M.; Farkas, B.E. Density, Viscosity and Surface Tension of Five Vegetable Oils at Elevated Temperatures: Measurement and Modeling. Int. J. Food Prop. 2017, 20, 1965–1981. [Google Scholar] [CrossRef] [Green Version]
- Franzoni, F.; Milani, M.; Montorsi, L. A CFD Multidimensional Approach to Hydraulic Components Design. SAE Tech. Pap. 2007, 116, 246–259. [Google Scholar] [CrossRef]
Figure 1.
Fluid transfer direction within an external gear pump (EGP).

Figure 2.
Layout of the pump: (a) Three-dimensional transparent view of the case test EGP and its main mechanical components; (b) driving gear and driven gear.
Figure 2.
Layout of the pump: (a) Three-dimensional transparent view of the case test EGP and its main mechanical components; (b) driving gear and driven gear.

Figure 3.
Internal leakages of the pump: (a) 10-μm radial leakage; (b) 30-μm axial leakage.

Figure 4.
Overset approach in the gears’ domain.

Figure 5.
Overset mesh approach: (a) Quadrilateral mesh of the background and overset regions; (b) initialized overset interfaces; (c) zoomed view of the gears’ meshing region; (d) zoomed view of the mesh in the 10-μm radial gap.
Figure 5.
Overset mesh approach: (a) Quadrilateral mesh of the background and overset regions; (b) initialized overset interfaces; (c) zoomed view of the gears’ meshing region; (d) zoomed view of the mesh in the 10-μm radial gap.

Figure 6.
Mesh of the axial leakages: (a) Surface mesh; (b) zoomed view of the mesh in the 30-μm axial gap. In the top left corner, a 3D view of the entire EGP highlights the position of the axial leakages.
Figure 6.
Mesh of the axial leakages: (a) Surface mesh; (b) zoomed view of the mesh in the 30-μm axial gap. In the top left corner, a 3D view of the entire EGP highlights the position of the axial leakages.

Figure 7.
Suction and delivery ports of the EGP model.

Figure 8.
Mineral oil properties: (a) density vs. temperature; (b) viscosity vs. temperature.

Figure 9.
Eco-friendly fluids properties: (a) BIOHYDRAN TMP 46: density vs. temperature; (b) BIOHYDRAN TMP 46: viscosity vs. temperature; (c) olive oil: density vs. temperature; (d) olive oil: viscosity vs. temperature.
Figure 9.
Eco-friendly fluids properties: (a) BIOHYDRAN TMP 46: density vs. temperature; (b) BIOHYDRAN TMP 46: viscosity vs. temperature; (c) olive oil: density vs. temperature; (d) olive oil: viscosity vs. temperature.


Figure 10.
Delivered flow rate in Case #1 and Case #2 with respect to the shaft angular position.

Figure 11.
Experimental volumetric efficiency of the pump (blue) and CFD result in Case #2 (orange).
Figure 11.
Experimental volumetric efficiency of the pump (blue) and CFD result in Case #2 (orange).

Figure 12.
Pressure ripple at suction (blue) and delivery (orange) ports.

Figure 13.
Pressure within a displacement chamber of the pump during an entire revolution of the driving shaft. On the top left corner, the initial position of the monitoring point is reported.
Figure 13.
Pressure within a displacement chamber of the pump during an entire revolution of the driving shaft. On the top left corner, the initial position of the monitoring point is reported.

Figure 14.
Pressure colored maps: (a) Pressure distribution within the entire 3D fluid domain of the pump; (b) section view of the pressure field in the gears’ region.
Figure 14.
Pressure colored maps: (a) Pressure distribution within the entire 3D fluid domain of the pump; (b) section view of the pressure field in the gears’ region.

Figure 15.
Pressure signal within the axial gap of the pump during an entire revolution of the driving shaft. On the top left corner, the initial position of the monitoring point is reported.
Figure 15.
Pressure signal within the axial gap of the pump during an entire revolution of the driving shaft. On the top left corner, the initial position of the monitoring point is reported.

Figure 16.
Intermittency colored maps: (a) Intermittency along the flow transfer section; (b) intermittency within the axial leakage. The background and overset regions are highlighted in beige.
Figure 16.
Intermittency colored maps: (a) Intermittency along the flow transfer section; (b) intermittency within the axial leakage. The background and overset regions are highlighted in beige.

Figure 17.
Pressure-intermittency correlation: (a) Isobaric curves on a zoomed view of the axial leakage; (b) intermittency on a zoomed view of the axial leakage. The background and overset regions are highlighted in beige.
Figure 17.
Pressure-intermittency correlation: (a) Isobaric curves on a zoomed view of the axial leakage; (b) intermittency on a zoomed view of the axial leakage. The background and overset regions are highlighted in beige.

Figure 18.
Temperature within a displacement chamber of the pump (green) and in the 30-µm axial gap (purple).
Figure 18.
Temperature within a displacement chamber of the pump (green) and in the 30-µm axial gap (purple).

Figure 19.
Delivered flow rate: (a) Case #2 and Case #3; (b) Case #2 and Case #4. Both graphs are illustrated with respect to the angular position of the pump driving shaft.
Figure 19.
Delivered flow rate: (a) Case #2 and Case #3; (b) Case #2 and Case #4. Both graphs are illustrated with respect to the angular position of the pump driving shaft.

Figure 20.
Intake pressure ripple: (a) Case #2 and Case #3; (b) Case #2 and Case #4.

Figure 21.
Supply pressure ripple: (a) Case #2 and Case #3; (b) Case #2 and Case #4.

Figure 22.
Pressure within a displacement chamber of the pump during an entire revolution of the driving shaft for Case #2, Case #3, and Case #4.
Figure 22.
Pressure within a displacement chamber of the pump during an entire revolution of the driving shaft for Case #2, Case #3, and Case #4.

Figure 23.
Pressure within the axial gap of the pump during an entire revolution of the driving shaft for Case #2, Case #3, and Case #4.
Figure 23.
Pressure within the axial gap of the pump during an entire revolution of the driving shaft for Case #2, Case #3, and Case #4.

Figure 24.
Temperature within a displacement chamber of the pump: (a) Case #2 and Case #3; (b) Case #2 and Case #4.
Figure 24.
Temperature within a displacement chamber of the pump: (a) Case #2 and Case #3; (b) Case #2 and Case #4.


Figure 25.
Temperature within the axial gap: (a) Case #2 and Case #3; (b) Case #2 and Case #4.


Table 1.
Main geometrical features of the two spur gears.
| Gears’ Geometrical Parameter | Value |
|---|---|
| Number of teeth | 12 |
| Outside diameter | 38.50 mm |
| Root diameter | 24.85 mm |
| Face width | 6 mm |
Table 2.
Mesh characteristics. PLS: prism layer shrinkage.
| Region | Cell Shape | Base Size | Extruded Layers | Wall Prism Layers |
|---|---|---|---|---|
| Background | Quadrilateral | 0.1 mm | 50 | 5 and PLS |
| Oversets | Quadrilateral | 0.06 mm | 50 | 5 and PLS |
| Axial Leakages | Quadrilateral | 0.2 mm | 20 | 5 |
| Others | Quadrilateral | 0.3 mm | / | 2 |
Table 3.
Boundary conditions.
| Port | Boundary | Value |
|---|---|---|
| Suction | Stagnation Inlet | 0 bar |
| Delivery | Pressure Outlet | 20 bar |
| Drain | Pressure Outlet | 0 bar |
Table 4.
Molecular weight, specific heat, speed of sound, and thermal conductivity of the three fluids.
Table 4.
Molecular weight, specific heat, speed of sound, and thermal conductivity of the three fluids.
| Fluid | Physical Parameter | Value |
|---|---|---|
| Mineral Oil | Molecular Weight | 480 kg/kmol |
| Mineral Oil | Specific Heat | 2000 J/kg-K |
| Mineral Oil | Speed of Sound | 1300 m/s |
| Mineral Oil | Thermal Conductivity | 0.13 W/m-K |
| BIOHYDRAN TMP 46 | Molecular Weight | 900 kg/kmol |
| BIOHYDRAN TMP 46 | Specific Heat | 2000 J/kg-K |
| BIOHYDRAN TMP 46 | Speed of Sound | 1257 m/s |
| BIOHYDRAN TMP 46 | Thermal Conductivity | 0.16 W/m-K |
| Olive Oil | Molecular Weight | 1382.2 kg/kmol |
| Olive Oil | Specific Heat | 2000 J/kg-K |
| Olive Oil | Speed of Sound | 1455 m/s |
| Olive Oil | Thermal Conductivity | 0.17 W/m-K |
Table 5.
Simulation setup, turbulence modeling, and convergence criteria.
| Solver | Time Step | Turbulence | Wall-Y+ | Residuals |
|---|---|---|---|---|
| Coupled Implicit | 8.33 × 10⁻⁵ s | k-ω SST Model and gamma transition | <0.92 | <0.01 |
Table 6.
Fluid models considered in the simulation cases.
| Case # | Fluid | Density | Viscosity | Energy |
|---|---|---|---|---|
| 1 | Mineral Oil | Yes | ||
| 2 | Mineral Oil | (1), (2) | (3) | Yes |
| 3 | BIOHYDRAN TMP 46 | (1), (4) | (5) | Yes |
| 4 | Olive Oil | (1), (6) | (7) | Yes |
Table 7.
Delivered flow rate and volumetric efficiency of the EGP for both the incompressible and the compressible fluid models. CFD: computational fluid dynamics.
Table 7.
Delivered flow rate and volumetric efficiency of the EGP for both the incompressible and the compressible fluid models. CFD: computational fluid dynamics.
| Case # | CFD Flow Rate | Ideal Flow Rate | Volumetric Efficiency |
|---|---|---|---|
| 1 | 8.28 L/min | 8.2 L/min | 101% |
| 2 | 8.04 L/min | 8.2 L/min | 98% |
Table 8.
Delivered flow rate and volumetric efficiency of the pump for three different fluids: mineral oil, Total BIOHYDRAN TMP 46, and olive oil.
Table 8.
Delivered flow rate and volumetric efficiency of the pump for three different fluids: mineral oil, Total BIOHYDRAN TMP 46, and olive oil.
| Case # | CFD Flow Rate | Ideal Flow Rate | Volumetric Efficiency |
|---|---|---|---|
| 2 | 8.04 L/min | 8.2 L/min | 98% |
| 3 | 8.06 L/min | 8.2 L/min | 98.2% |
| 4 | 7.68 L/min | 8.2 L/min | 93.7% |
Publisher’s Note: MDPI stays neutral with regard to jurisdictional claims in published maps and institutional affiliations. |
© 2021 by the authors. Licensee MDPI, Basel, Switzerland. This article is an open access article distributed under the terms and conditions of the Creative Commons Attribution (CC BY) license (http://creativecommons.org/licenses/by/4.0/).
Share and Cite
MDPI and ACS Style
Muzzioli, G.; Montorsi, L.; Polito, A.; Lucchi, A.; Sassi, A.; Milani, M. About the Influence of Eco-Friendly Fluids on the Performance of an External Gear Pump. Energies 2021, 14, 799. https://doi.org/10.3390/en14040799
AMA Style
Muzzioli G, Montorsi L, Polito A, Lucchi A, Sassi A, Milani M. About the Influence of Eco-Friendly Fluids on the Performance of an External Gear Pump. Energies. 2021; 14(4):799. https://doi.org/10.3390/en14040799
Chicago/Turabian StyleMuzzioli, Gabriele, Luca Montorsi, Andrea Polito, Andrea Lucchi, Alessandro Sassi, and Massimo Milani. 2021. "About the Influence of Eco-Friendly Fluids on the Performance of an External Gear Pump" Energies 14, no. 4: 799. https://doi.org/10.3390/en14040799
Note that from the first issue of 2016, this journal uses article numbers instead of page numbers. See further details here.