Numerical Characterization of Corona Spark Plugs and Its Effects on Radicals Production
by
 , , , and
Giorgio La Civita
*,† ,
,
Francesco Orlandi
†,
Valerio Mariani
†,
Giulio Cazzoli
and
Emanuele Ghedini
Department of Industrial Engineering DIN, Università degli Studi di Bologna, Viale del Risorgimento 2, 40136 Bologna, Italy
*
Author to whom correspondence should be addressed.
†
These authors contributed equally to this work.
Energies 2021, 14(2), 381; https://doi.org/10.3390/en14020381
Submission received: 7 December 2020
/
Revised: 4 January 2021
/
Accepted: 9 January 2021
/
Published: 12 January 2021
(This article belongs to the Special Issue Developments in Propulsion Systems, Advanced Fuels and Injection Systems)
Abstract
:A mono-dimensional code for the simulation of the effects of High Frequency Ignition systems (HFI) on the production of chemical radicals was developed and here presented. The simulations were carried out by considering the typical environmental thermodynamic conditions of a nowadays engine at full load. An electron transport model is linked with a Boltzmann solver coupled with a chemistry solver, affecting the Electron Energy Distribution Function (EEDF) in order to obtain the physical conditions leading to the production of radical components for a given fuel mixture. The transport equations for the electrons, the positive and the negative ions, and the Gauss’ law in a steady-state plasma region. Then the Boltzmann equation for the electrons, in a spatially homogeneous steady-state case, is solved in order to obtain the EEDF. Finally the chemical kinetics model is employed assuming a fuel-air mixture neglecting the fuel carbon atoms due to the assumption that electron-impact dissociation reactions, which initiate the combustion, exhibit a greater reaction rate compared to those based on hydrocarbon thermal dissociation and therefore can be neglected in this work. Results show the production of the hydrogen (H), nitrogen (N), and oxygen (O) radicals and the radius of the initial discharge under different simulated engine operating conditions characterizing the role of a plasma corona effect for the induced chemical ignition in gasoline-powered engines.
1. Introduction
Nowadays the design of gasoline-powered engines for passenger vehicles is becoming more challenging due to the increasingly stringent emissions regulation. In these engines, the combustion of lean-mixtures would be a quite effective strategy to strongly reduce the tailpipe emissions of unburned hydrocarbons (UHC), carbon monoxide (CO), and soot. Furthermore, operating lean mixtures reduces the heat losses resulting in higher engine efficiency, thus, lower fuel consumption while enhancing the knock occurrence with concerns on the engine reliability. Moreover, the combustion of lean mixtures in traditional spark ignited engines remains a concern since the presence of additional nitrogen together with the high temperature typical of those engines promote the formation of thermal Nitrogen Oxides (NO). Since passenger vehicles are one of the main sources of the overall atmospheric NO emission, their control and reduction is mandatory. As far as the installation of NO traps along the exhaust line on passengers vehicles needs to be avoided for cost and space reasons, mixture control strategies such as the use of high pressure (warm) and low pressure (cold) Exhaust Gas Recirculation (EGR) are mainly adopted together with stroichiometric or slight rich air-fuel mixtures. It is known that in traditional spark ignited combustion chambers the amount of EGR must be limited in order to avoid the significant increase of the Coefficient of Variation (COV) and unstable combustion events [1]. The use of innovative ignition systems is among the technological solutions to improve the implementation of low-impact engines. Indeed, in the nowadays highly-boosted gasoline engines the bottleneck with respect to the emissions target is represented by the current ignition system, which is called Transistor Coil Ignition (TCI), or simply spark. Under these conditions, in the case where a leaner fuel-air mixture is operated, the voltage required to ignite such mixtures can not be achieved with TCI systems. This can be understood by analyzing in detail the mechanism of the TCI: Once a high voltage is applied to the two electrodes of the spark, an intense electric field is generated accelerating the electrons of the mixture that migrate to the positive pole while colliding with other electrons along their path. These collisions lead to the breakdown of the dielectric first and to the electric arc then, resulting in the decreasing of the voltage between the two electrodes. The aforementioned electric phenomenon negatively affects the performances of the engine since the high amount of heat generated within the arc and transferred to the surrounding gas aims to maintain the ionization of the mixture to a sufficient value to initialize combustion. Furthermore, those high temperatures (around 1000 K at the spark plug walls) enhance the corrosion of the electrodes with concerns on their reliability and lifetime.
Currently, among all the plasma applications that have been implemented in industrial processes, the most flexibles are the so called non-LTE plasma (Local Thermal Equilibrium). In these plasma sources the interaction-mean free path is such that the electrons are not capable of transferring energy to ions resulting in a plasma configuration where the energies of ions and electrons highly differ. Under these conditions, the plasma is characterized by highly energized electrons (10–15 eV and 12,000–18,000 K) while ions show almost the ambient temperature (300 K). As a result, the plasma is characterized by an overall temperature which is the same than that of the ions and by highly energetic channels called streamers, namely regions where the local presence of those energetic electrons promotes a high electrical conductivity. The phenomenon is called Corona ignition and it is correlated to the use of electrode tips where the massive accumulation of the charge occurs due to high-curvature radius surfaces. As a consequence of the tip-shape of the electrode, the dielectric (i.e., air or mixture) breakdown and the following propagation from the tip of plasma streamers are observed. Under Corona ignition conditions, the classic hydrocarbon oxidation (by means of the spark) mechanism are replaced by electron impact dissociation reactions with reaction rates that are commonly two orders of magnitude greater than that of oxidation [2]. The implementation of a non-LTE plasma source of corona type in place of the classical spark is a new ignition configuration called High Frequency Ignition system (HFI). HFI systems have been already applied successfully in different industrial applications (see [3,4,5,6,7]) and its most recognized advantages are: (i) The lower voltage required at the electrode; (ii) the initial reactive volume, which is around three orders of magnitude higher with respect to TCI systems; and (iii) the characteristic time of the ignition event is around against the time range of the traditional sparks.
As reported in the current literature (refs. [1,8]), the implementation of the corona HFI system allows one to extend the lean and EGR mixture limits with advantages on the engine efficiency and brake specific emissions. In [1] Cimarello et al. have conducted experiments on a 1-cylinder optical accessible gasoline engine equipped with a 4-tip Corona igniter. The Design of Experiments (DOE) comprised of the comparison between the Corona igniter and the standard spark plug at low speed and low load with different spark advances and normalized air-fuel ratios () from stoichiometric to 1.7 lean. The authors reported that for a given air-fuel ratio the Corona igniter produced a faster flame propagation at every and a strong reduction of the COV at the leaner (>1.4). This suggested that the Corona ignition is capable of speeding up the combustion process while promoting more repeatable ignition events. Due to the faster combustion, the knock lean limit of the engine was extended allowing no-knock combustions at that were not achievable with the standard spark plug. Under this lean mixture quality, on the one hand the nitrogen mass amount into the combustion chamber was greater, with concerns on the potential increase of NO production. On the other hand such air excess promoted the gas cool down resulting in the overall significant reduction of the brake specific NO emission with respect to the stoichiometric and the leaner stable combustions with the traditional spark plug. In [8] Pineda et al. performed an experimental comparison of a standard spark plug and a 4-tip Corona igniter by analyzing the indicating and the brake performance of a 1-cylinder Gasoline Direct Injection (GDI) engine under three different operating points with the focus on the effect of EGR. With regards to the high speed and high load points, the authors confirmed the observations seen in [1] on the general improved combustion stability and velocity and the following knock tendency mitigation with the Corona ignition system. As a result, the Authors reported that the use of the Corona ignition allowed acceptable engine operations with higher fractions of EGR (from 10 wt% to 15 wt%), thus, with a lower NO production. Therefore, the on-board implementation of HFI systems on passenger vehicles is a promising and attractive technological solution to mitigate the knock tendency, increase engine efficiency, and reduce the NO emission thanks to the capability of this device to operate mixtures that are leaner in and richer in EGR.
Different works have been carried on to characterize non-LTE plasma in detail. It is underlined that two of the main key features for a rigorous and representative modeling of a non-LTE plasma are photo-ionization and the number of species considered: (i) The former is recognized as the main driver of the streamer path development and formation along the medium; (ii) the latter is a measure of the degree of complexity of the model with respect to the simulation of the potential electrons interactions during their diffusion along the medium. One species models consider only the electrons phase, neglecting the effects of the ions on the electric field and could poorly estimate the electrons population density. On the other hand, three species models, accounting the presence of positive and negative ions in addition to electrons, are the strictly needed compromise between complexity (number of species) and the electrical characteristics of the discharge. In the current literature, almost the whole findings on the topic regards non-LTE plasma modeling in air at atmospheric conditions for generic purposes without any specific target application. In [9], the authors studied the case of a positive Corona discharge wire and implemented a steady-state three species model, neglecting the recombination and photo-ionization effects, to compute the electron impact dissociation rates together with an in-house Boltzmann solver. In [10], Georghiou et al. has effectively conducted the study on the development and the generation of transient non-LTE plasma from gas discharge with numerical three-dimensional simulations by considering a three species model together with photo-ionization and recombination phenomena. In [11], Liu et al. applied their proposal of the transition of corona glow discharges into streamers by simulating a two-dimensional computation grid around a Corona tip. Transient regime, photo-ionization, and recombination were taken into account. Despite the fact that these works have contributed significantly in the knowledge advancement of numerical Corona discharge modeling, there is a lack of chemical kinetics integration, thus the assessment of the potential metastable molecules and radicals formation-destruction is not considered. Furthermore the main outputs returned and discussed by those works regard the electrons and ions number density, as well as the current and the electric field strength without any evaluation on the species distribution.
Among the most complete works on the generic characterization of Corona discharges in atmospheric air there are [12,13] since they included the integration of the charged particles balance equations with a chemical radical formation model. Furthermore both the above-mentioned models are capable of returning the distribution of the traced radicals. In [12], Naidis with the aim to simulate two-dimensional transient Corona discharge proposed a different simplified charged particles balance equations set. In particular the Naidis’ proposal consists in considering the electrons interactions with ions and radicals by means of two representative populations whose balances is solved together with the classical electrons balance without specific information on their species and charge. As a consequence of this approach, the direct resolution of the Boltzmann equation was not possible, therefore the values of the radicals production rates was calculated using given rate constants from other literature works. In [13], Tochikubo et al. developed the most comprehensive modeling of this phenomena including all the above-mentioned features plus a different photo-ionization source calculation method, the solution of the Boltzmann equation, and an extensive chemical kinetics model for two-dimensional transient simulations. To the knowledge of the present authors the most engine-oriented study of the Corona discharge process is that of [14] Varma et al. In [14], the authors implemented a code for the electrical characterization of a HFI system by solving the Gauss’ law with several simplificative hypothesis among which the most stringent ones are: (i) The ionization layer and its effects on radicals and ions production are neglected; (ii) the conductivity of the medium in set to zero; (iii) the mobility of the ions does not change; and (iv) the medium is represented by a single species. The code was tested on engine-like gas conditions assumed to reproduce the ones of a typical natural aspirated Spark Ignited (SI) engine. The results in terms of electric field and current density were validated against the measurements from an experimental test bench facility.
To the knowledge of the present authors, the current Computational Fluid Dynamics (CFD) engine simulation framework for the supporting of the design of the next low-impact engine lacks a methodology to integrate the modeling of the ignition conditions induced by those promising HFI systems with combustion simulations. This work is intended to propose a fast while reasonably accurate methodology to supply CFD engineers with the initial spatial distribution of the engine reactive species to provide chemical kinetics-based combustion models. This would be necessary since the Corona effect promotes low-temperature ignitions that are not enthalpy-driven but rather induced by a highly reactive large volume composed of the above-mentioned species. Despite the fact that, as mentioned before, Tochikubo et al. [13] have already developed a very comprehensive model for the simulation of Corona discharges involving the characterization of the reactive species in ambient air, their proposal does not fulfill the strict balance between computation time and distribution accuracy required for the target application. This is due to both the high computational effort and complexity and the lack of available and reliable swarm-transport properties under engine boundary conditions. As a consequence, one of the main focuses of this work was the in-house development of a methodology which approaches the Corona discharge modeling with implementations aimed to save computing time while ensuring numerical stability and accuracy in the prediction of the ignitable mixture distribution. This work deals with the steady-state mono-dimensional numerical modeling of the Corona discharge of a reference 1-tip HFI system. Furthermore the non-LTE discharge was characterized for engine-like conditions, i.e., pressure around 50 and temperature around 800 K, which are greater than those commonly used for the study of these phenomena, i.e., ambient conditions. The properties of the electrons population by means of the Electron Energy Distribution Function (EEDF) was solved with an in-house developed Boltzmann solver. The number density of the electrons was estimated with the electron-ion transport equations together with the Gauss’ law to map electron diffusion inside of the combustion chamber, namely the plasma extension. Finally, the classical chemical kinetics laws are adopted to estimate the molar fractions of the species. As a result, the radicals mapping around the corona tip is obtained. Differently from Varma et al. [14] which focused their study on the characterization of the HFI device and the Corona effect only from the electrical aspect point of view, the present work aims to reproduce the volume extension and the gas composition available for combustion triggered by the Corona discharge event. Moreover it needs to be considered that the implementations of Varma et al. were addressed by naturally aspirated engine conditions, which are no more consistent with the current marketplace scenario. Therefore in the present work the modeling was approached inline with the most recent highly-boosted GDI engines characteristics. The Boltzmann solver was validated against the results of two recognized open-access softwares (Bolsig+ and METHES) in terms of EEDF distribution and reactions rates calculation. The complete model was run to perform a parametric analysis according to an extensive DOE comprising the variation of different engine control parameters. The results are also discussed.
2. Methodology
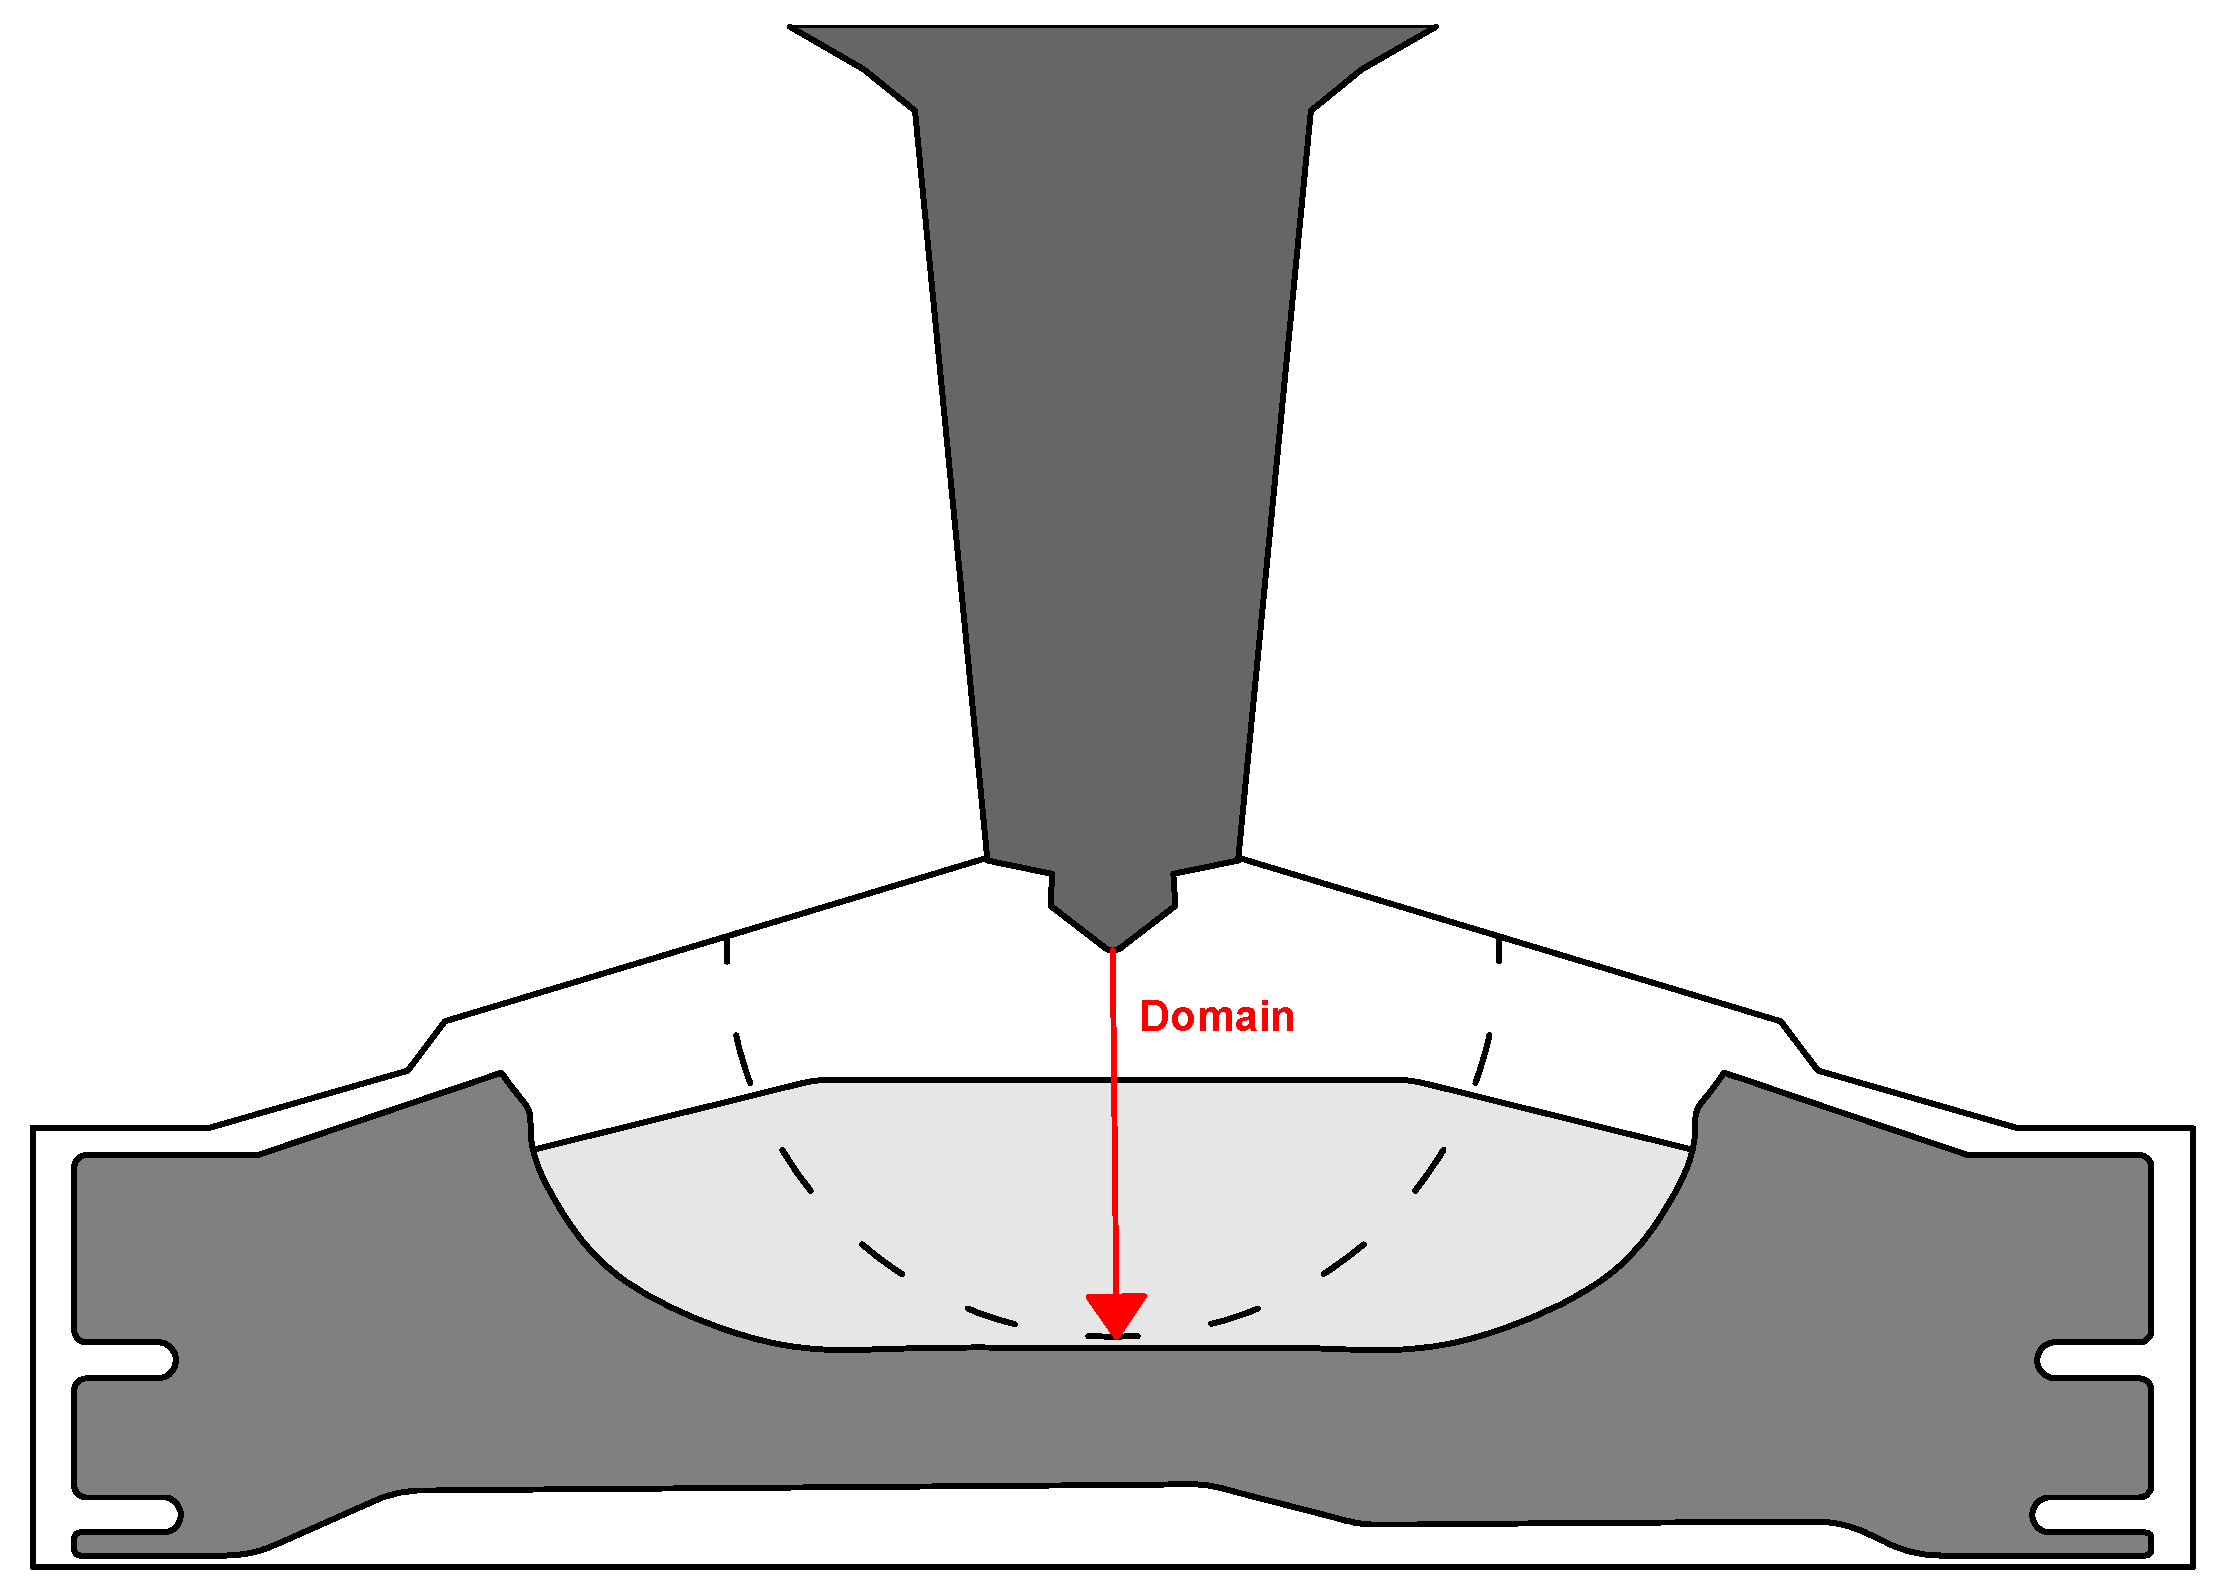
This work is focused on the mono-dimensional numerical modeling of the Corona discharge for a 1-tip HFI ignition system under highly boosted gasoline engine conditions. The 1-tip assumption was needed since the mutual influence between the streamers generated by multi-tip ignition systems are strongly random and multi-dimensional. This, together with the hypothesis of polar and azymuthal symmetry in a spherical coordinates system, allows the present authors to approximate the calculation grid as a one-dimensional radial domain which is centered on the corona tip as shown in Figure 1.
As far as the main goal is to investigate the creation of the initial discharge volume and its composition in terms of species that are available for the following combustion reactions, the Corona effect is considered to be reasonably approximated in its only steady-state (long-term) effect, i.e., neglecting the nano-pulsed effects that may be present. This assumption is supported by the fact that the Corona discharge temporal evolution is several orders of magnitude faster (ns time range) than the characteristic times of an internal combustion event (ms time range). The previous hypothesis is also supported by Moravej et al. [15], which have shown that the effect of an high-frequency applied voltage does not affect the radical distribution in the ms time range. Even the work of Tochikubo et al. [13], in which Figure 10a,b show that the N and O radicals number densities reach a quasi steady-state value after approximately 300 , supports the above-mentioned hypothesis. Another concern on the implementation of the transient regime for the charged species transport models is the compromise between computational cost and a straight representation of the unsteady aspects. Indeed, the time steps required by the typical time scales of the current propagation would result in the order of ns, in order to assure both the numerical stability and the capture of that time scales. However a such fine study would strongly slow down the solution time, which is one of the key features of the present proposal. It must be underlined that the subsequent combustion reactions that involve the reactive species distribution given by the present model, are not solved in this work since they are left to the computing power of the CFD solver in the future codes’ integration. It is further assumed that the overall swarm transport properties of the fuel-air mixture are not directly affected by the radicals production, although the electron transport equations account for the positive and negative ions effect on the electrons distribution. The model is capable of returning the initial discharge radius and distributions of both the radical species and the electrons’ energy along this radius.
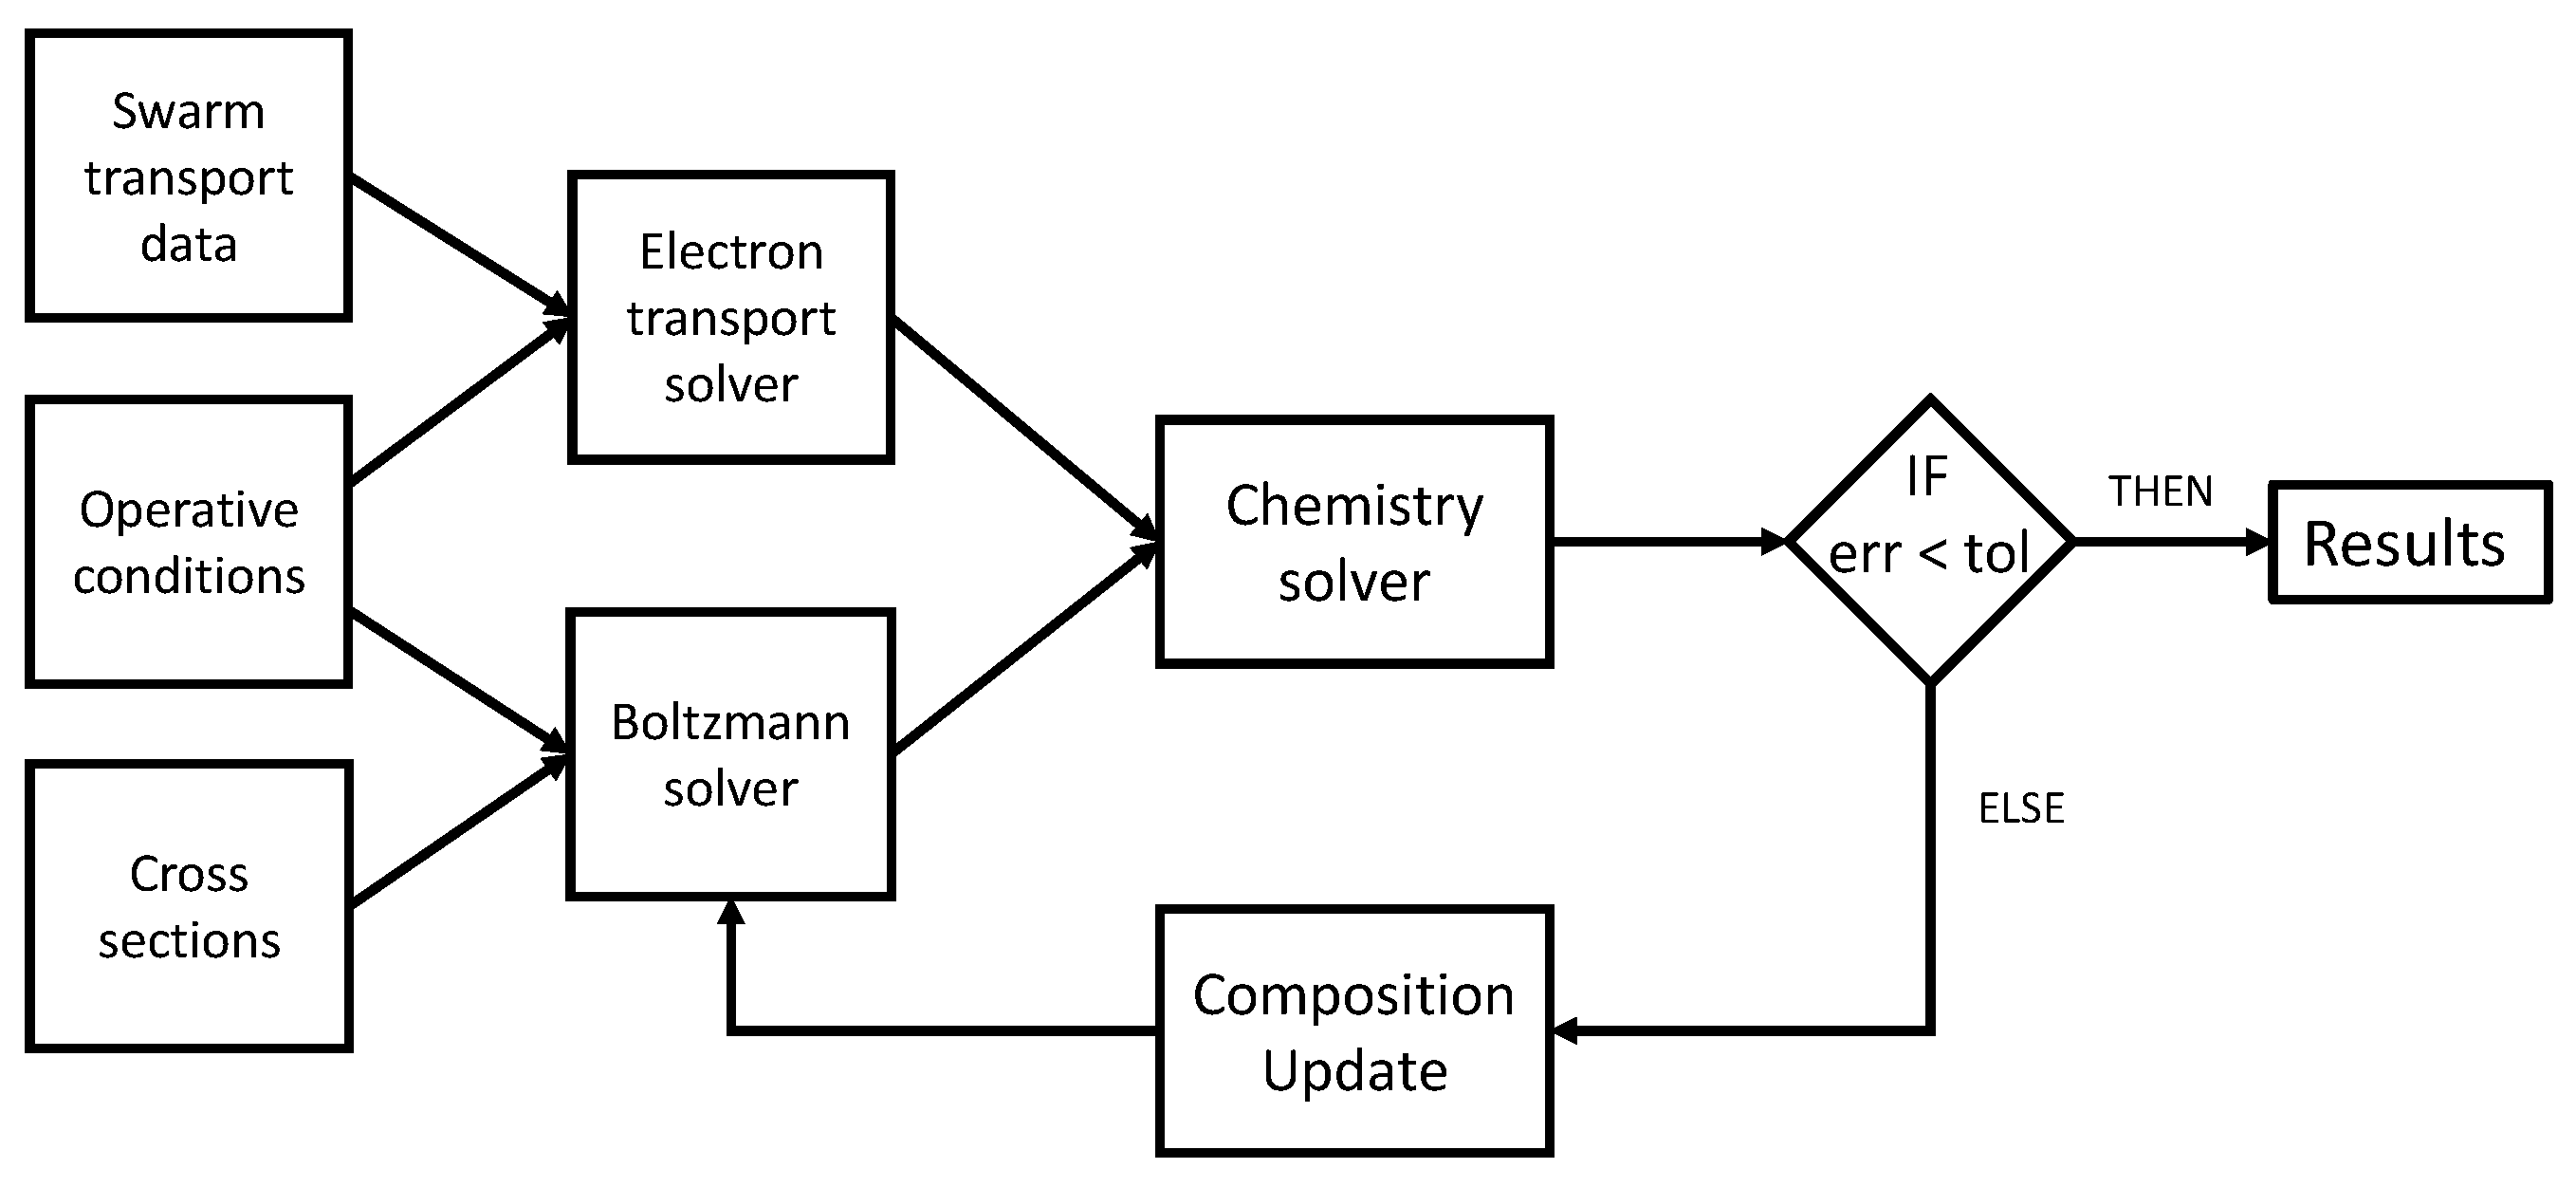
The model was developed in Matlab and comprises of three dedicated sub-models: (i) The transport of electrons, positive and negative ions with three different transport equations together with the Gauss’ law; (ii) the radicals production due to the electron-impact events described with the Boltzmann equation; and (iii) the re-combinations between the radicals created by the discharge by means of chemical kinetic solver which computes the radicals molar fraction. As a result, these modeling steps return the radicals created by the pre-flame species dissociation processes and their distribution inside the fresh mixture at the time-step next to the spark time. In the followings, a detailed presentation of the developed model and its sub-models is shown.
2.1. Electron Transport Equations
In a spherical coordinates system, neglecting the angular dependencies, the transport equations for electrons, positive ions, negative ions, and the Gauss’ law in a steady-state plasma region are used. The system of equations is summarized from Equation (1a–d):
where the subscripts e, p, and n are referred to electrons, positive ions, and negative ions respectively. , and are the number densities (#/); , and are the mobility coefficients ( ); , and are the diffusion coefficients (); and is the ionization coefficient (), the attachment coefficient (), the electron and positive-ion recombination coefficient () and the negative-ion and positive-ion recombination coefficient (). The electric potential field is defined as V (V), is the vacuum permittivity (F) and e () the electron charge. The photoionization source at the distance from the plug’s tip (#//) is calculated using Equation (2a–c) as proposed in [9]:
where is the photoionization coefficient. The values of , , , , , , and can be calculated with a Boltzmann solver or retrieved from specific electron transport databases (see [16]).
In this work the generic transport property of the gas mixture is calculated as the molar fraction weighted sum as in Equation (3):
where is the generic transport property of the i-th gas species and its molar fraction.
The boundary conditions adopted for Equation (1a), using a radial interval are: (i) A Robin type condition which describes the electrons charge flux at the tip (Equation (4)) and (ii) a Dirichlet type condition for the value of the number density (Equation (5)).
(A) is the electrons charge flux at the spark radius a and is the undisturbed radial distance, usually the spark tip-piston crown distance at the Top Dead Center (TDC). The electric field strength () is calculated each iteration using Equation (6):
For Equation (1b), a homogeneous Dirichlet type boundary condition is adopted which describes the null contribution of the positive ions to the total current at the tip surface, thus, their density is zero (Equation (7)). The same approach applies for negative ions with regards to Equation (1c). Therefore Equation (8) is used at the undisturbed radial distance:
The Dirichlet boundary conditions Equation (9a,b) are adopted for Equation (1d) with (V) the applied voltage:
The computational grid comprises of 10,000 elements distributed according to an exponential spacing that coarsens up from the spark tip to the undisturbed radial distance. In order to start the computation, Equation (1d) is solved with a null Right Hand Side (RHS). Once electrons, positive ions, and negative ions number densities are calculated, the electric potential field is updated by solving Equation (1d) which is used to update the transport properties until convergence using the relationship .
2.2. Boltzmann Equation
The Boltzmann equation for an ensemble of electrons in an ionized gas is defined as in Equation (10):
where f (eV) is the electron distribution function in the six-dimensional phase space, () the velocity, the electron’s mass (), the velocity-gradient operator, and C (eV/s) the rate of change of f due to collisions.
Inside of Corona discharges, elastic collisions are more frequent than the inelastic ones. During elastic collisions, electrons lose less energy having a mass which is several orders of magnitude smaller with respect to those of the heavy species. As a consequence, the direction of the electron velocity changes whilst its speed does not vary significantly. Furthermore, the electron drift velocity is considered to be small compared to the electron mean thermal speed, and the electron distribution can be approximated as isotropic in velocity space. Thus, the use of the two-term Legendre expansion for the electron velocity distribution is consistent with the above-mentioned hypotheses (in [17] an extensive treatment of this method is reported). At each radial position, the EEDF in the Corona plasma is obtained by solving the spatially homogeneous steady-state case Boltzmann equation [9]:
where is the EEDF, the mass of heavy species (), u electrons kinetic energy (eV), elastic collisions frequency () of electrons, and () the inelastic collisions integral.
A generic collision frequency is calculated using the related cross section () as in Equations (12) and (13):
with the mixture density ( ), the Avogadro constant (#/mol), and MW () the molar weight of the mixture. The cross sections are assumed as isotropic with respect to the scattering angle and are retrieved by the LxCat database [16].
Assuming the heavy species as a gas mixture, the collision frequency can be evaluated through the molar weighted sum of the specific gas as in Equation (14):
The inelastic collision integral is obtained by summing the contribution of excitation, dissociation, attachment, and ionization processes as from Equations (15) to (19):
where , , , and are the collision frequencies due to k-th excitation, i-th dissociation, j-th attachment, and m-th ionization process respectively; , are the energy thresholds for the k-th excitation and j-th dissociation process respectively; and is the m-th ionization potential.
Considering the RHS of Equations (16), (17) and (19) the right-end-tail terms are called energy shifted terms. From the inelastic collisions integral the above-mentioned energy shifted terms are extracted and used as the RHS of the linear system obtained. As the RHS depends on itself, it is iteratively updated and the solution re-calculated until the accomplishment of the convergence criterion, namely relative error ((new − old)/old) < . In order to speed up the convergence, an Aitken-based relaxation method is used.
The kinetic energy is discretized with an exponential spaced grid of 300 elements from to a value which should be greater enough with respect to the mean kinetic energy of the EEDF so that can be stated.
When an iteration of the algorithm ends, the EEDF must be normalized with the following constraint (Equation (22)):
Once the EEDF is determined, the reaction rate for the collision process i of the j species is calculated as in Equation (23):
where .
All equations that have been presented in this section are solved using the second order accurate Finite Difference Method with a Central Differencing Scheme for both the first and the second order derivatives.
2.3. Boltzmann Solver’s Validation
This subsection presents a comparison between the electron Boltzmann solver BOLSIG+ (v12/2017), which is available in literature [17] as open software, the Monte Carlo code METHES (v01.07.2015) also available in literature as open software [18], and the implemented model. The use of METHES as a comparison benchmark relies on the fact that it is based on a different approach with which the EEDF and the reaction rates are calculated. In fact it adopts the Monte Carlo method to directly simulate the movement and the subsequent collisions of an ensemble of electrons for given cross sections database. For this reason a good match between all the models confirms the reliability of the sub-model developed in this work.
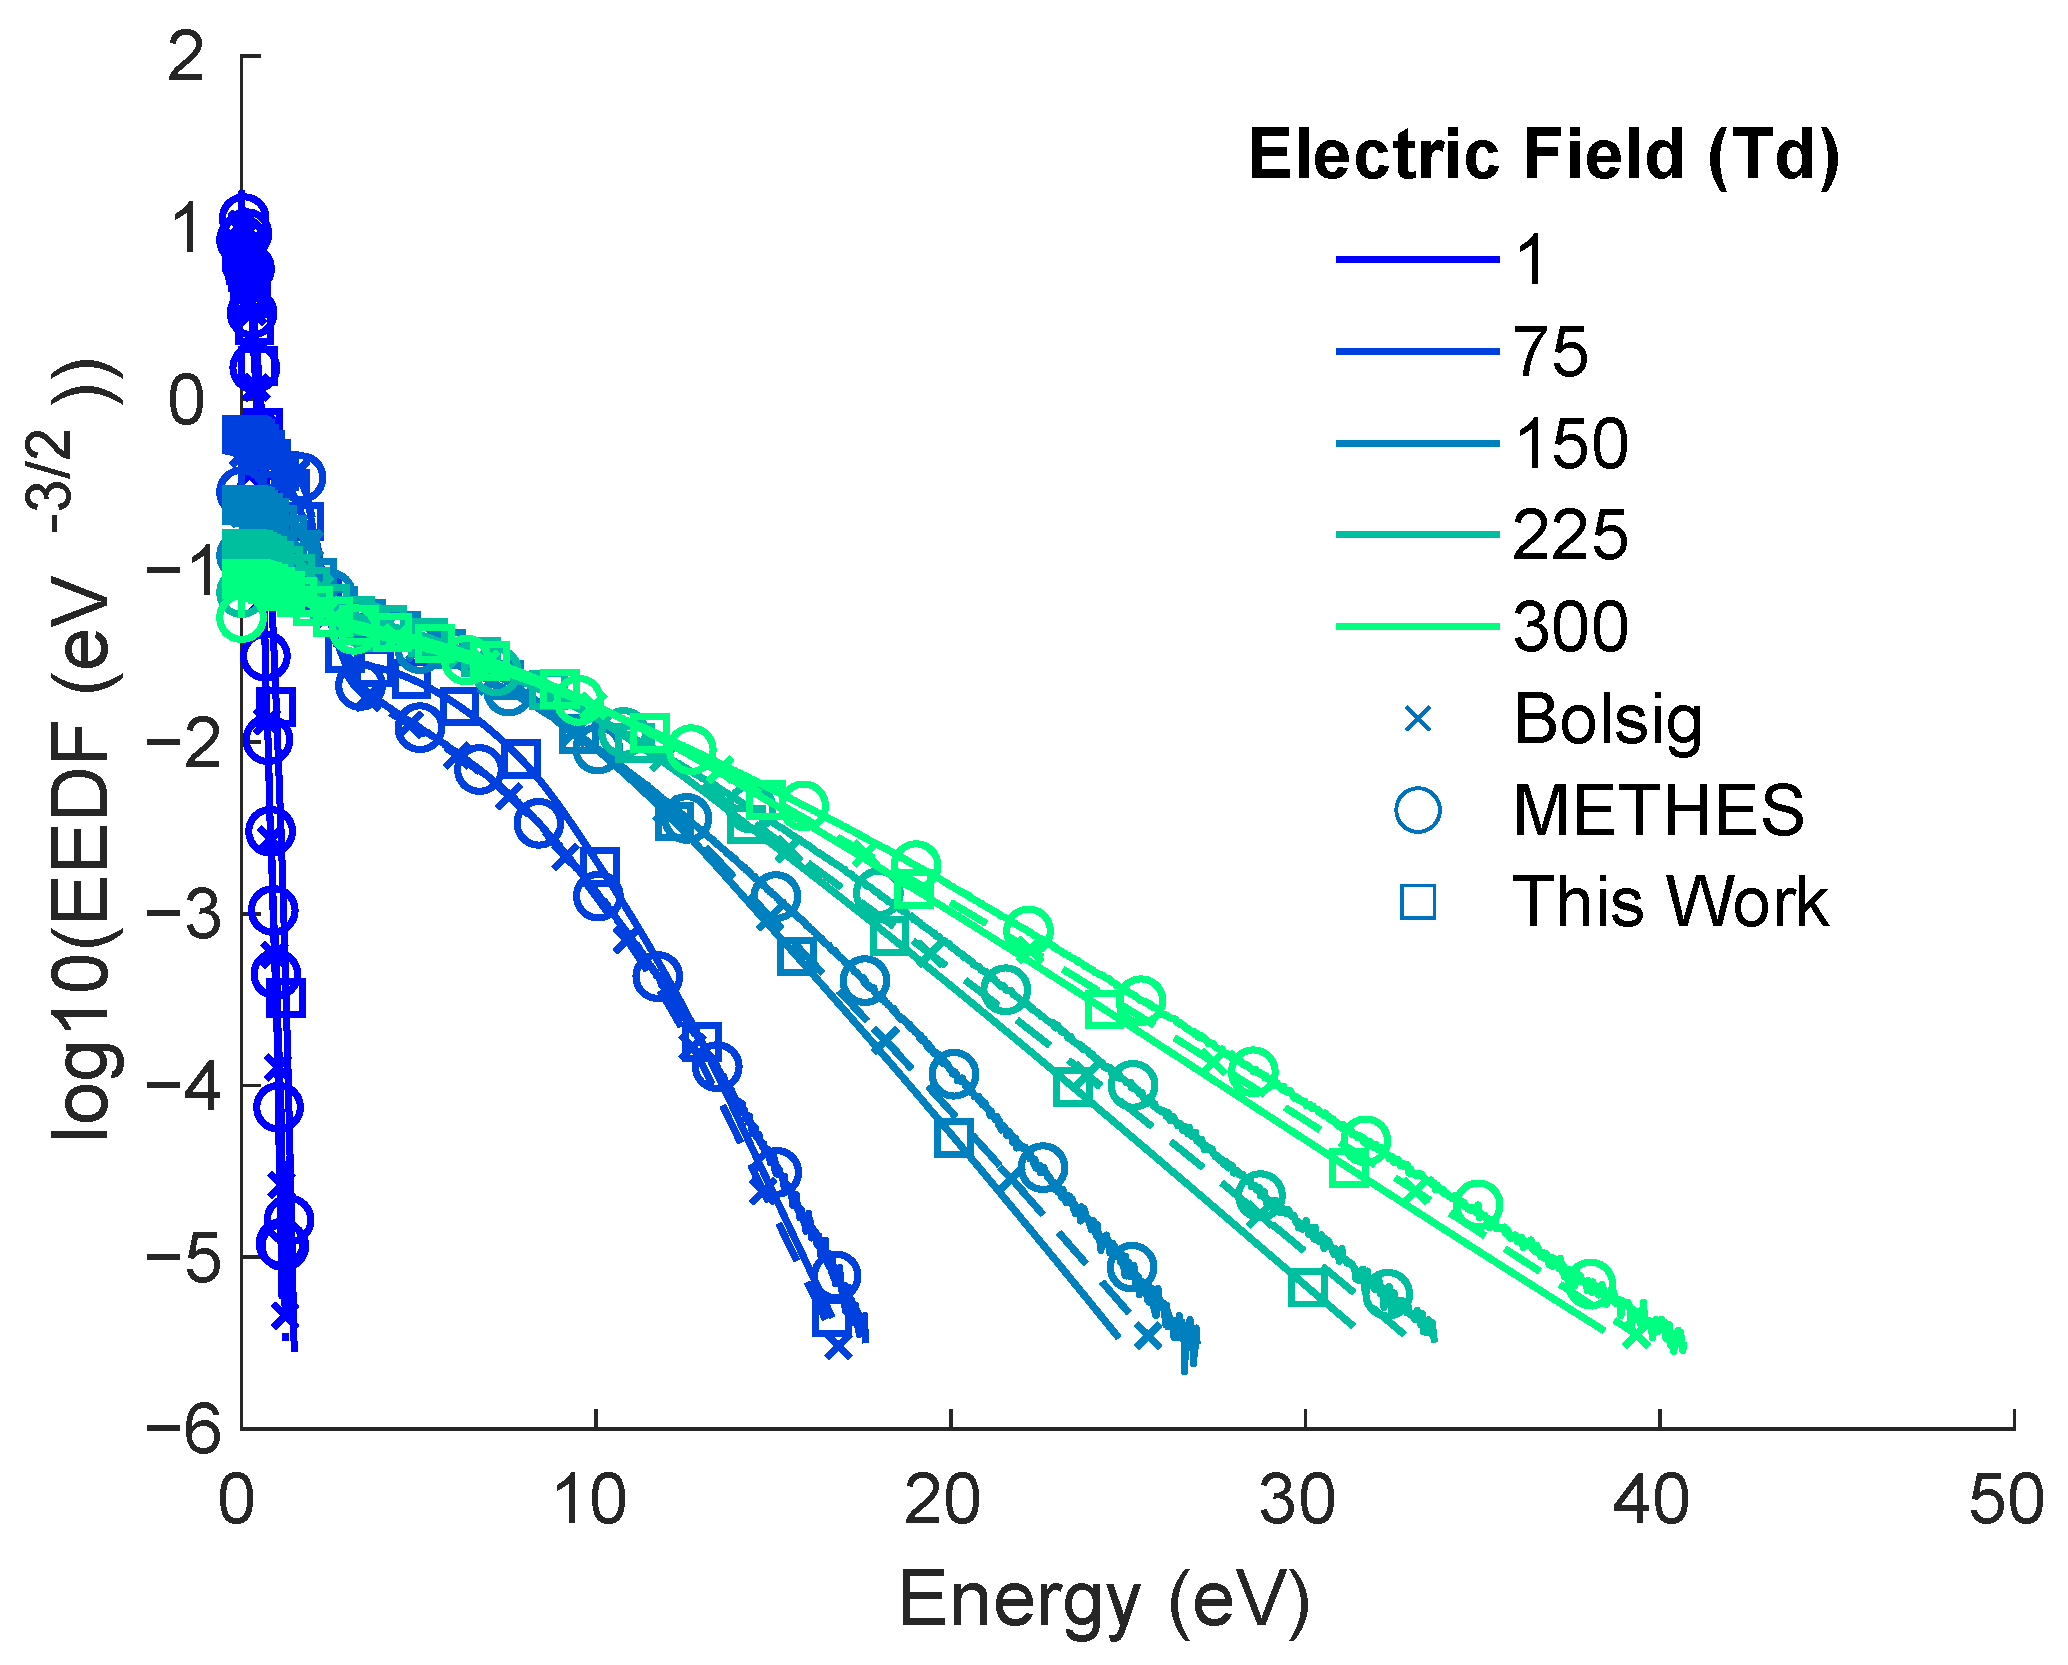
In order to perform a fair comparison, all the codes were provided with the same properties by the aforementioned LXCat (vJune2013) database. Five different electric field intensities under the same given mixture and temperature were tested and the results in terms of EEDF are shown in Figure 2.
Figure 2 shows that the wider the EEDF, the greater the overall energy content of the electrons population. This implies that electrons have enough energy to ionize/dissociate the fuel-air mixture as approaching the spark plug.
The general agreement between all the models can be noticed. Any difference in the EEDF distribution between Bolsig+ and this work is due to the different numerical schemes employed and the different numerical formulation implemented. In order to perform an additional comparison, the ionization and attachment total collision rates calculated (using Equation (23) divided by ) by all the models are reported in Table 1 and Table 2 respectively.
A good match between all the models is achieved. Since the models under comparison adopt the same methodology to compute the dissociation rates, the present authors are confident in the reasonable accuracy of the proposed model in the resolution of such rates and thus the distribution of the reactive species computation.
To the current authors’ knowledge, a similar work which studies numerically or experimentally the radicals distribution profile using engine-like conditions has not been conducted yet. Therefore a quantitative comparison of this output can not be performed.
2.4. Chemical Kinetics Model
In this work the carbon related interactions are neglected due to the fact that the reaction initiating hydrocarbon oxidation is replaced by electron impact dissociation reactions, whose reaction rate constants are considered to be at least two orders of magnitude larger.
The electron impact dissociation reactions are considered to be limited by the three-body recombination reactions of all the active species, represented by (24):
with their recombination rates expressed by Equation (24a–c):
The kinetic constants , , and are calculated by linear interpolation of the experimental data in [15,19,20] as function of temperature.
For a generic species i the steady-state composition is calculated by solving Equation (25):
where and are the molar concentrations () of the i species and its molecular form.
After each EEDF update, the new radicals composition are calculated using Equation (24a–c) until convergence.
In Figure 3 a schematic representation of the complete algorithm of the ignition model is shown.
2.5. Grid Independence Test
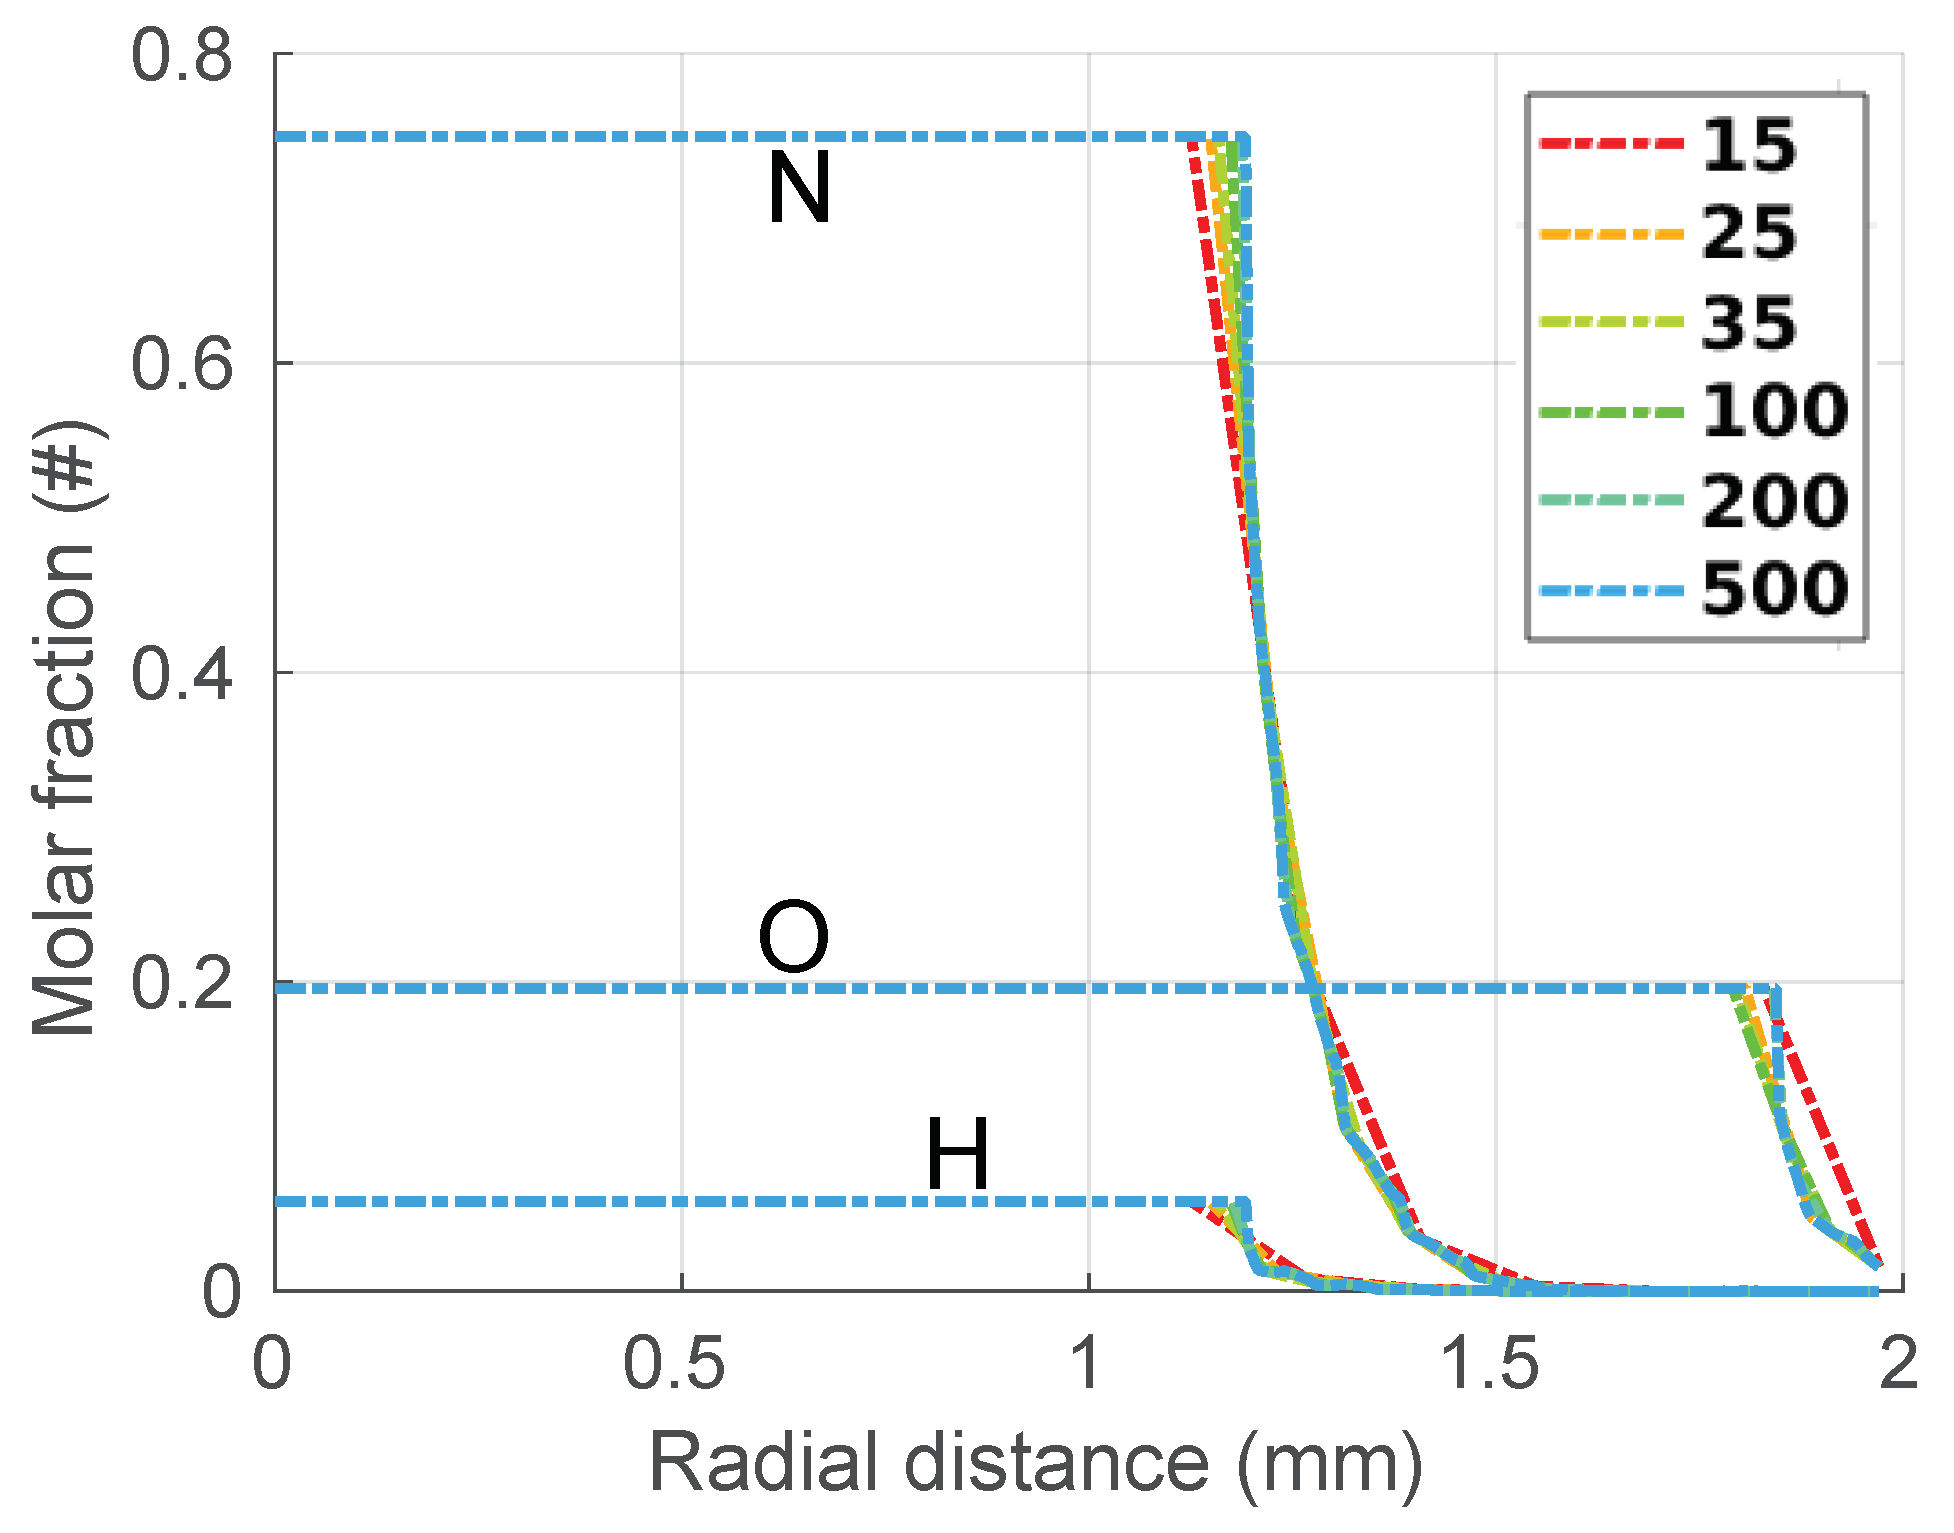
In this subsection, the authors present the grid independence test for the radical molar fractions computation. The operative conditions adopted to perform the grid independence test were the same as that of the reference engine simulation point which will be deeply presented in the following section. In Figure 4 the radial profiles for N, O and H radicals are shown using six different equally spaced grids ranging from 15 to 500 elements. It is shown that, except for the 15 elements grid which cannot sufficiently approximate the radicals radial evolution, the other grids exhibit the same profile for all the species involved. Minor differences with the initial radical decay point can be noticed. Such differences do not affect the radicals profile evolution and the final distribution values, which are the same among all the grids tested. As a consequence very fine discretizations with elements of micro-metric base size, which would be the common practice to capture the spherical evolution of the flame kernel of traditional TCI systems, seem to be not significantly helpful to capture the main feature of HFI systems, which is instead the diffusion profiles of the generated species whose characteristic length scale allows the use of a few dozens of elements to gain computational speed with a slight accuracy loss.
3. Results
In this section the results obtained for two different study cases are presented. Firstly, in order to test and validate the code in a qualitative manner, the ignition model was provided with the typical gas conditions of a reference modern gasoline boosted engine, i.e., gas temperature and density and the initial chemical composition i.e., nitrogen, oxygen, and hydrogen. The results are compared in terms of discharge radius with the ones recorded in an experimental characterization of a HFI device reported in the literature. Secondly, a simulation matrix comprising the variation of different engine parameters with respect to the baseline configuration was generated and the influence of each parameter discussed.
3.1. Reference Engine Conditions and Qualitative Validation
For the initial assessment of the ignition model results in terms of the discharge radius, the engine data were taken from a three-dimensional CFD engine simulation of an in-house designed engine geometry representative of the current market scenario. The engine in-cylinder values needed by the ignition model were produced by simulating a high speed and high load operation. The engine geometric and operating data are listed in Table 3 whilst the data retrieved by the CFD simulation are shown in Figure 5. According to the reference spark advance (8 deg) operated in this configuration, the filled black markers indicate the values adopted for the first calculation.
Starting from the main geometric and operating conditions reported in Table 3 and Figure 5, an analysis of the results’ variation has been carried out. This has been done by varying density and temperature by ±5% (Table 4) in order to analyze the sensitivity and robustness of the model with respect to a baseline input data set. This has been done to assess the reliability of the model for engine-like pressures, densities, and temperatures that are several order of magnitude greater than those commonly used for the modeling of this phenomenon.
For each case the value of the Equivalent Flame Radius (Discharge radius) has been calculated during the simulation. The common practice to compute the Electric onset value using the Paschen’s law (as done in [9]) is not suitable for the pressure and the temperature conditions under review. Therefore the onset voltage value is obtained by means of the experimental measures conducted by Carey et al. in [21] which account for the effect of the high pressure for different air gaps. In Table 5 the operating conditions of the ignition model are summarized.
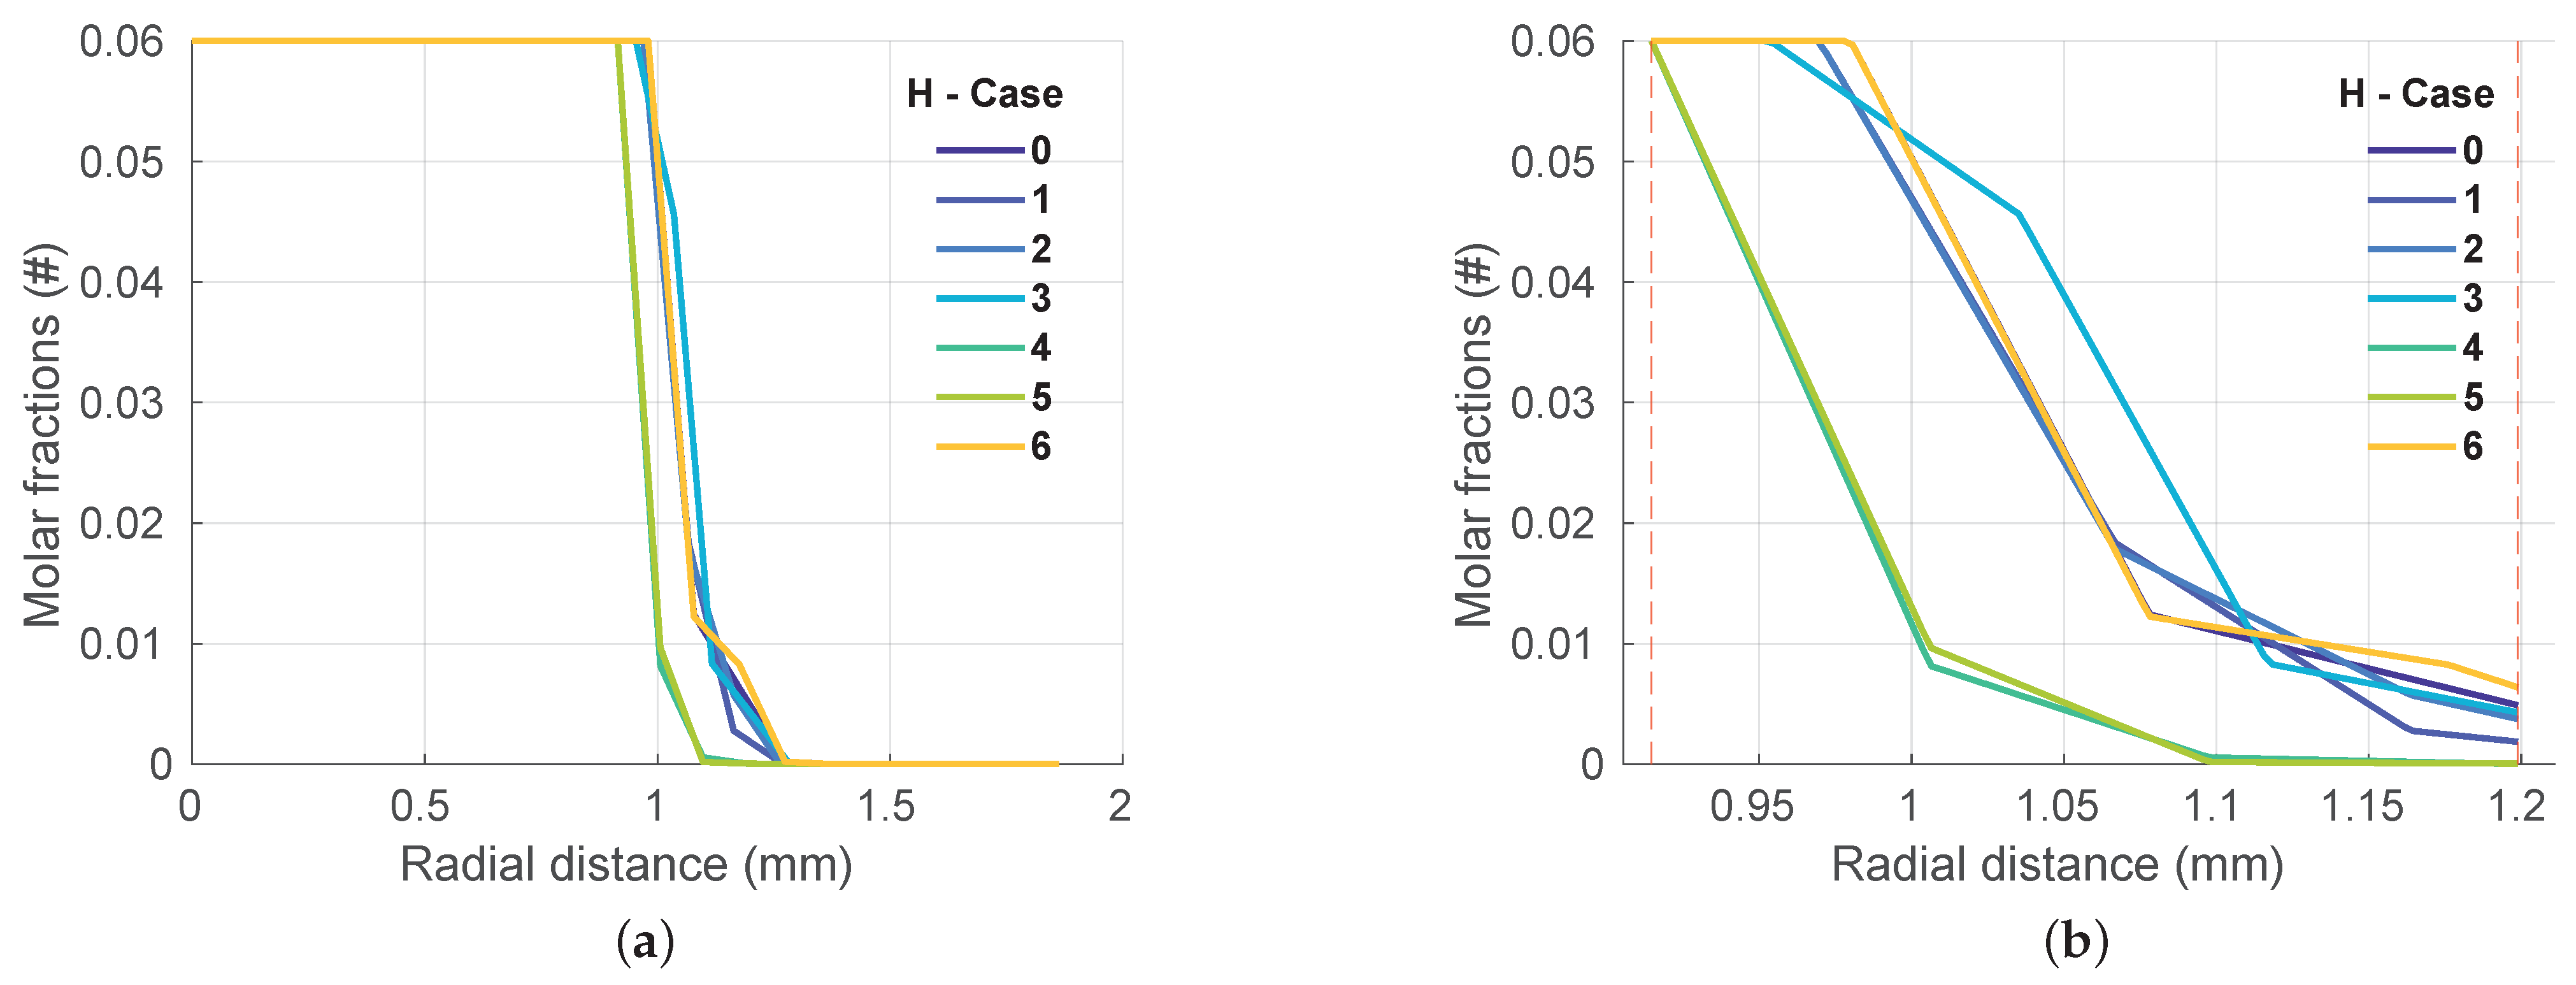
For each case reported in Table 4 a set of EEDF, electron number density, electric field and radical composition are returned. In Figure 6, Figure 7 and Figure 8, the molar fractions for each radical species are plotted with respect to the distance from the spark tip. The H radical’s evolution in Figure 6b shows almost the same behavior across all the cases except for cases 4 and 5. As reported in Table 4, the latter two are characterized by the smaller value of the gaseous mixture density. As a consequence, the mixture number density is smaller in value as visible in Equation (13). This reduces the computed reaction rate leading to a smaller radical production rate by electron impact dissociation, which therefore reduces the molar fraction and initial discharge radius reported in Table 4.
Considering cases 0, 3, and 6 differ only in temperature, the variation of the recombination reaction’s kinetic constant can be observed. The chemical kinetic constants of the species considered in this work (, and ) decrease monotonically as the temperature increases, leading to a smaller value of recombination rates calculated using Equation (24a–c) and therefore a slower radicals disappearance.
Considering cases 0 and 2, the effect of an increased density for a given temperature can be assessed. A greater value of the density enhances the radicals production (Equation (23)) increasing the radicals molar fractions. As a result, a slower decay of the radicals distributions and a greater initial ignition volume are achieved.
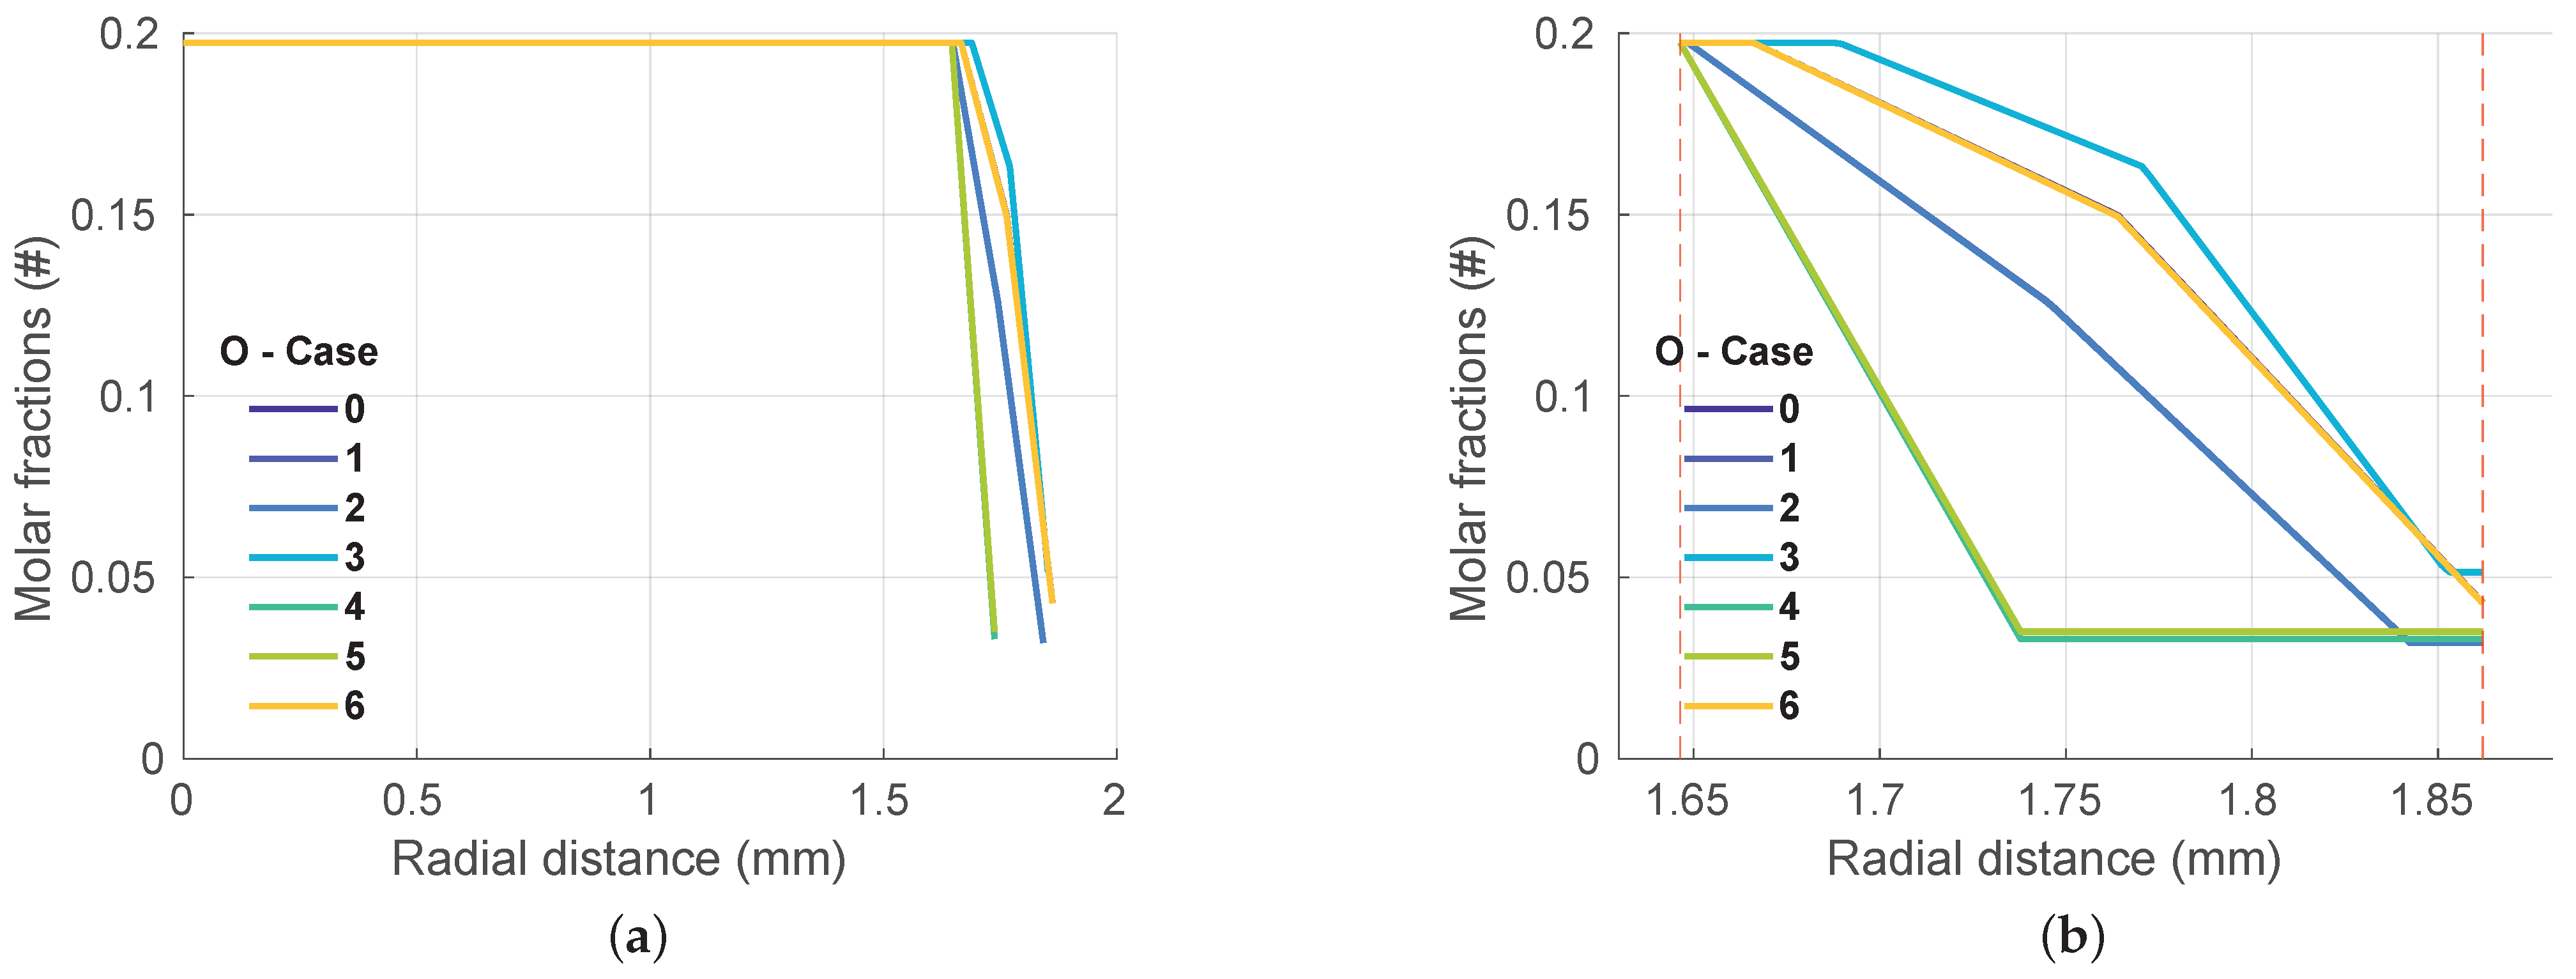
Since the dissociative cross section of the O molecule is high in value with respect to the other two considered species, a more extensive O radical generation occurs by shifting towards the radius at which the radical disappears (Figure 7b).
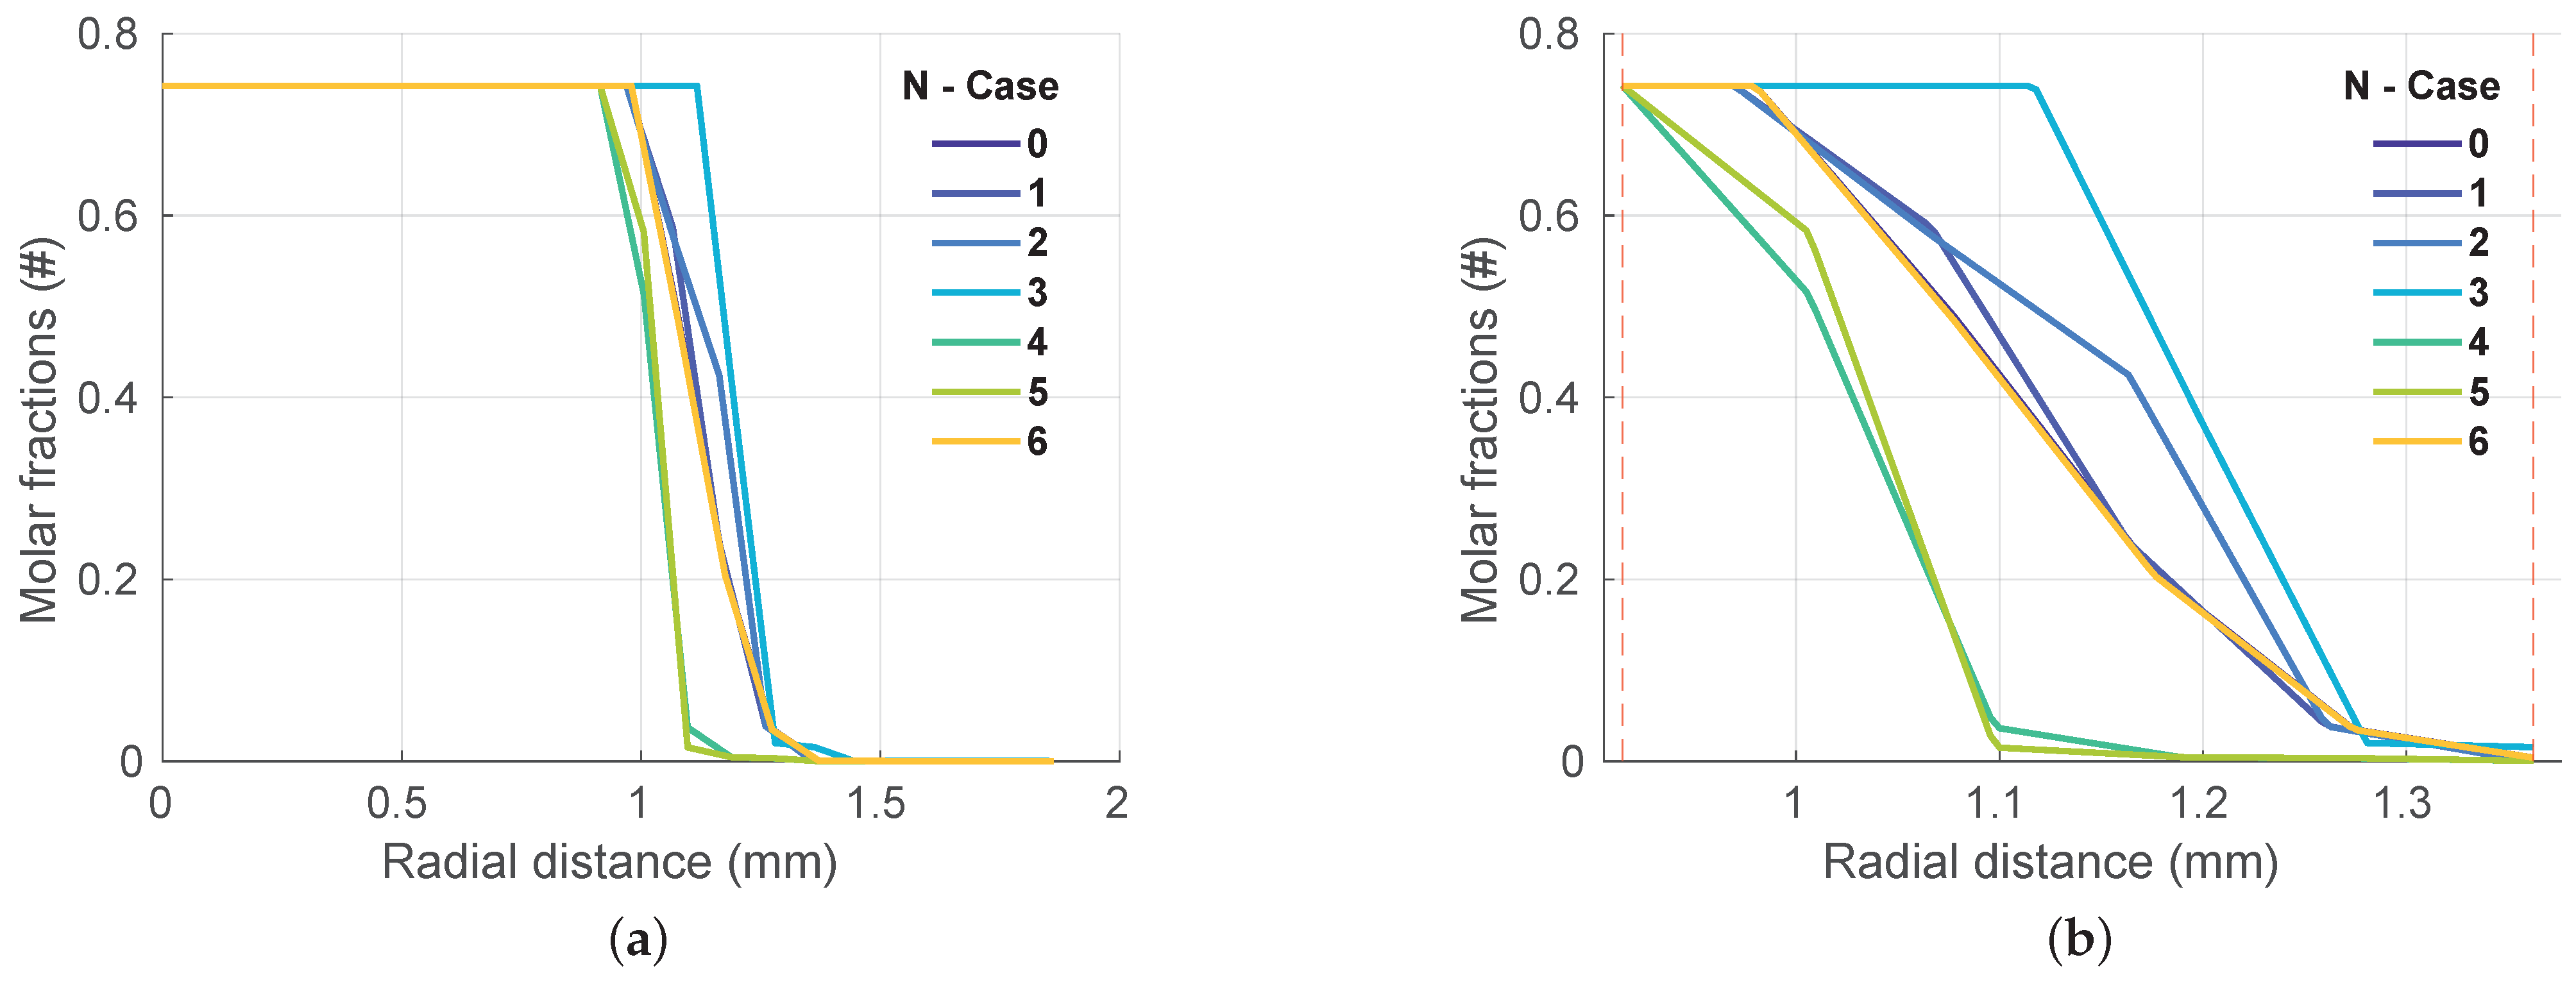
The N radical molar fractions trends shown in Figure 8b are in agreement with the aforementioned considerations. Any possible difference can be explained by the values of the cross sections and the ones of the kinetic recombination constant.
Comparing these results with those reported in [22] by Cruccolini et al. in an experimental analysis of a 4-tip Corona spark plug configuration, the model computes a smaller value of the initial ignition volume (i.e., by the model and by the experiments) although of the same order of magnitude. According to the expectations of the present authors, this difference can be correlated with the greater ignition capability of a 4-tip configuration. However the compared order of magnitudes can be taken as a proof of the model’s reliability.
3.2. Parametric Study
In order to discuss the influence of some common engine operating parameters on the initial discharge radius, a simulation matrix comprising the effect of spark advance, air-fuel ratio, and EGR was generated. Each value of the engine parameters in the simulation matrix leads to a different input data set to provide the Corona ignition model. In the following, the expected effect of each of those parameters affecting the interactions and the penetration of electrons and ions is described: (i) As the spark timing is anticipated (i.e., increased spark advance), temperature, pressure, and density at the ignition time (@IGN) are lower as visibile in Figure 5; (ii) operating leaner mixtures lead to higher values of pressure and temperature due to the different thermophysical properties of the air with respect to those of the fuel by considering mass average computations. Furthermore for the assessment of the following results, consider that the leaner the mixture, the more negligible the initial H fraction with respect to those of N and O; and (iii) operating more diluted intake charge (higher EGR) results in a more nitrogen-concentrated initial mixture, a temperature decrease due to the higher thermal inertia of the mixture as well as, a pressure and density increase caused by the introduction of an additional amount of compressed mass into the cylinder.
The input values for the ignition model are taken from the engine full load simulations performed with an in-house developed zero-dimensional model. The latter needs the engine geometrical and operating data and returns several outputs such as in-cylinder pressure and temperature, displacement volume evolution, combustion angles, and brake quantities. For this application, the in-cylinder results @IGN are required, thus, the zero-dimensional simulations were carried out from the Intake Valve Closing, which defines the initial fractions of the species inside the cylinder, to the spark advance. In this range the zero-dimensional model accounts for the heat losses through the walls by means of the tuned classical Woschni’s model [23] whilst the gas temperature and pressure are calculated by solving the in-cylinder energy balance and the perfect gas law, respectively. The engine presented in Table 3 was taken as the baseline configuration, then the spark advance, the air-fuel ratio, and the EGR were varied one at time. It must be underlined that, in order to make a comparison at the same electrical ignition device conditions, voltage, current, and tip radius are the same in all the simulations. The voltage value has been calculated using the experimental dataset of Carey et al. [21] which requires the gas pressure as a input. In the present analysis, this value was a mean pressure calculated by averaging the pressures @IGN of the simulation points, resulting in a mean value of 33 . The mean electric current was chosen by considering the typical values for this application (i.e., 100 ). Finally the tip radius is set to as in Table 5.
3.2.1. Exhaust Gas Recirculation
Five different EGR fractions, i.e., and , were tested. A summary of the relevant conditions are reported in Table 6.
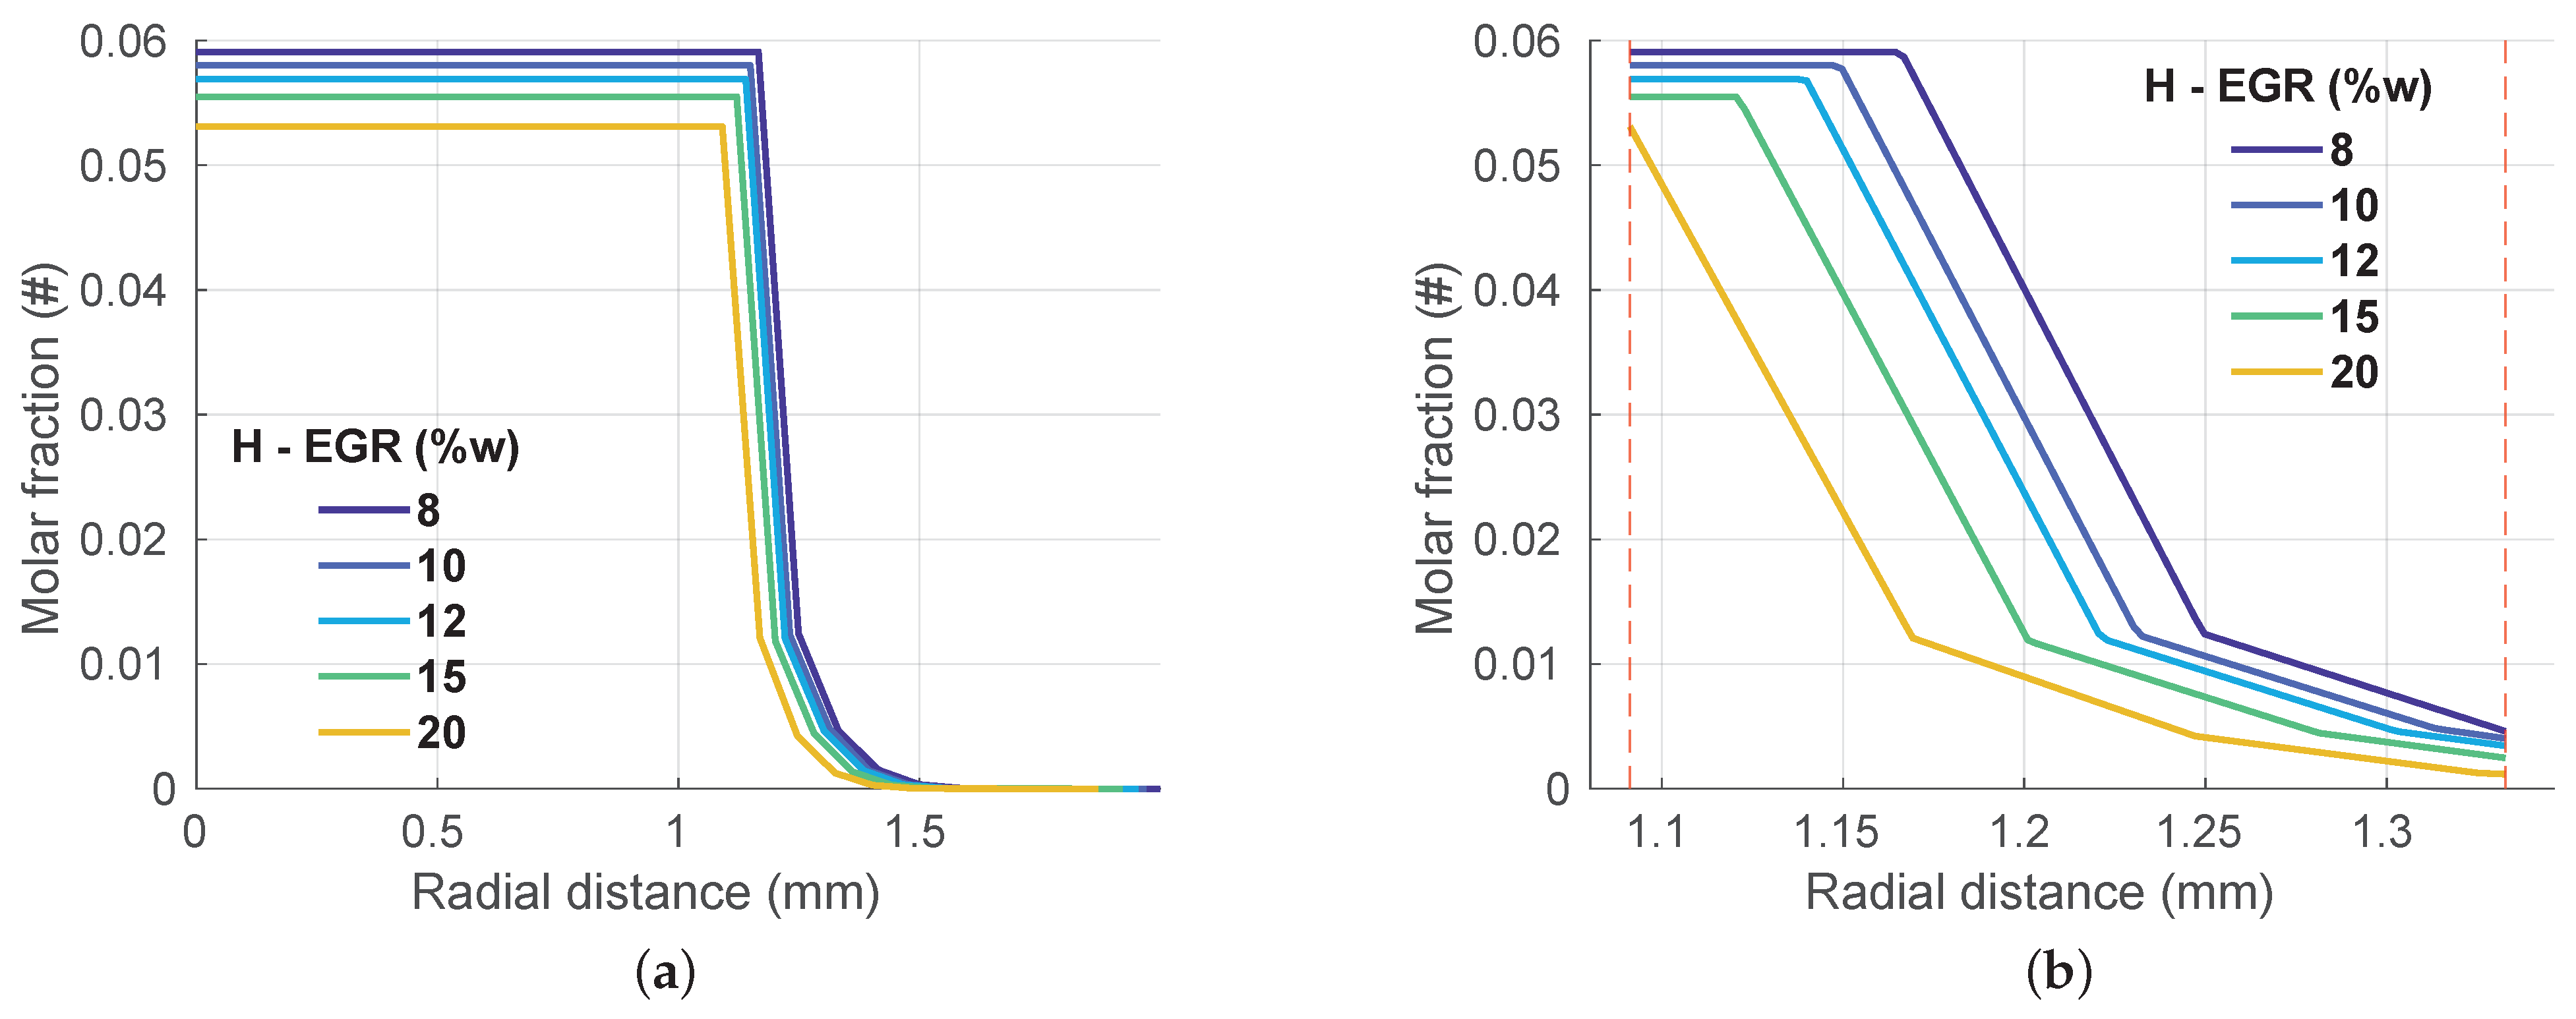
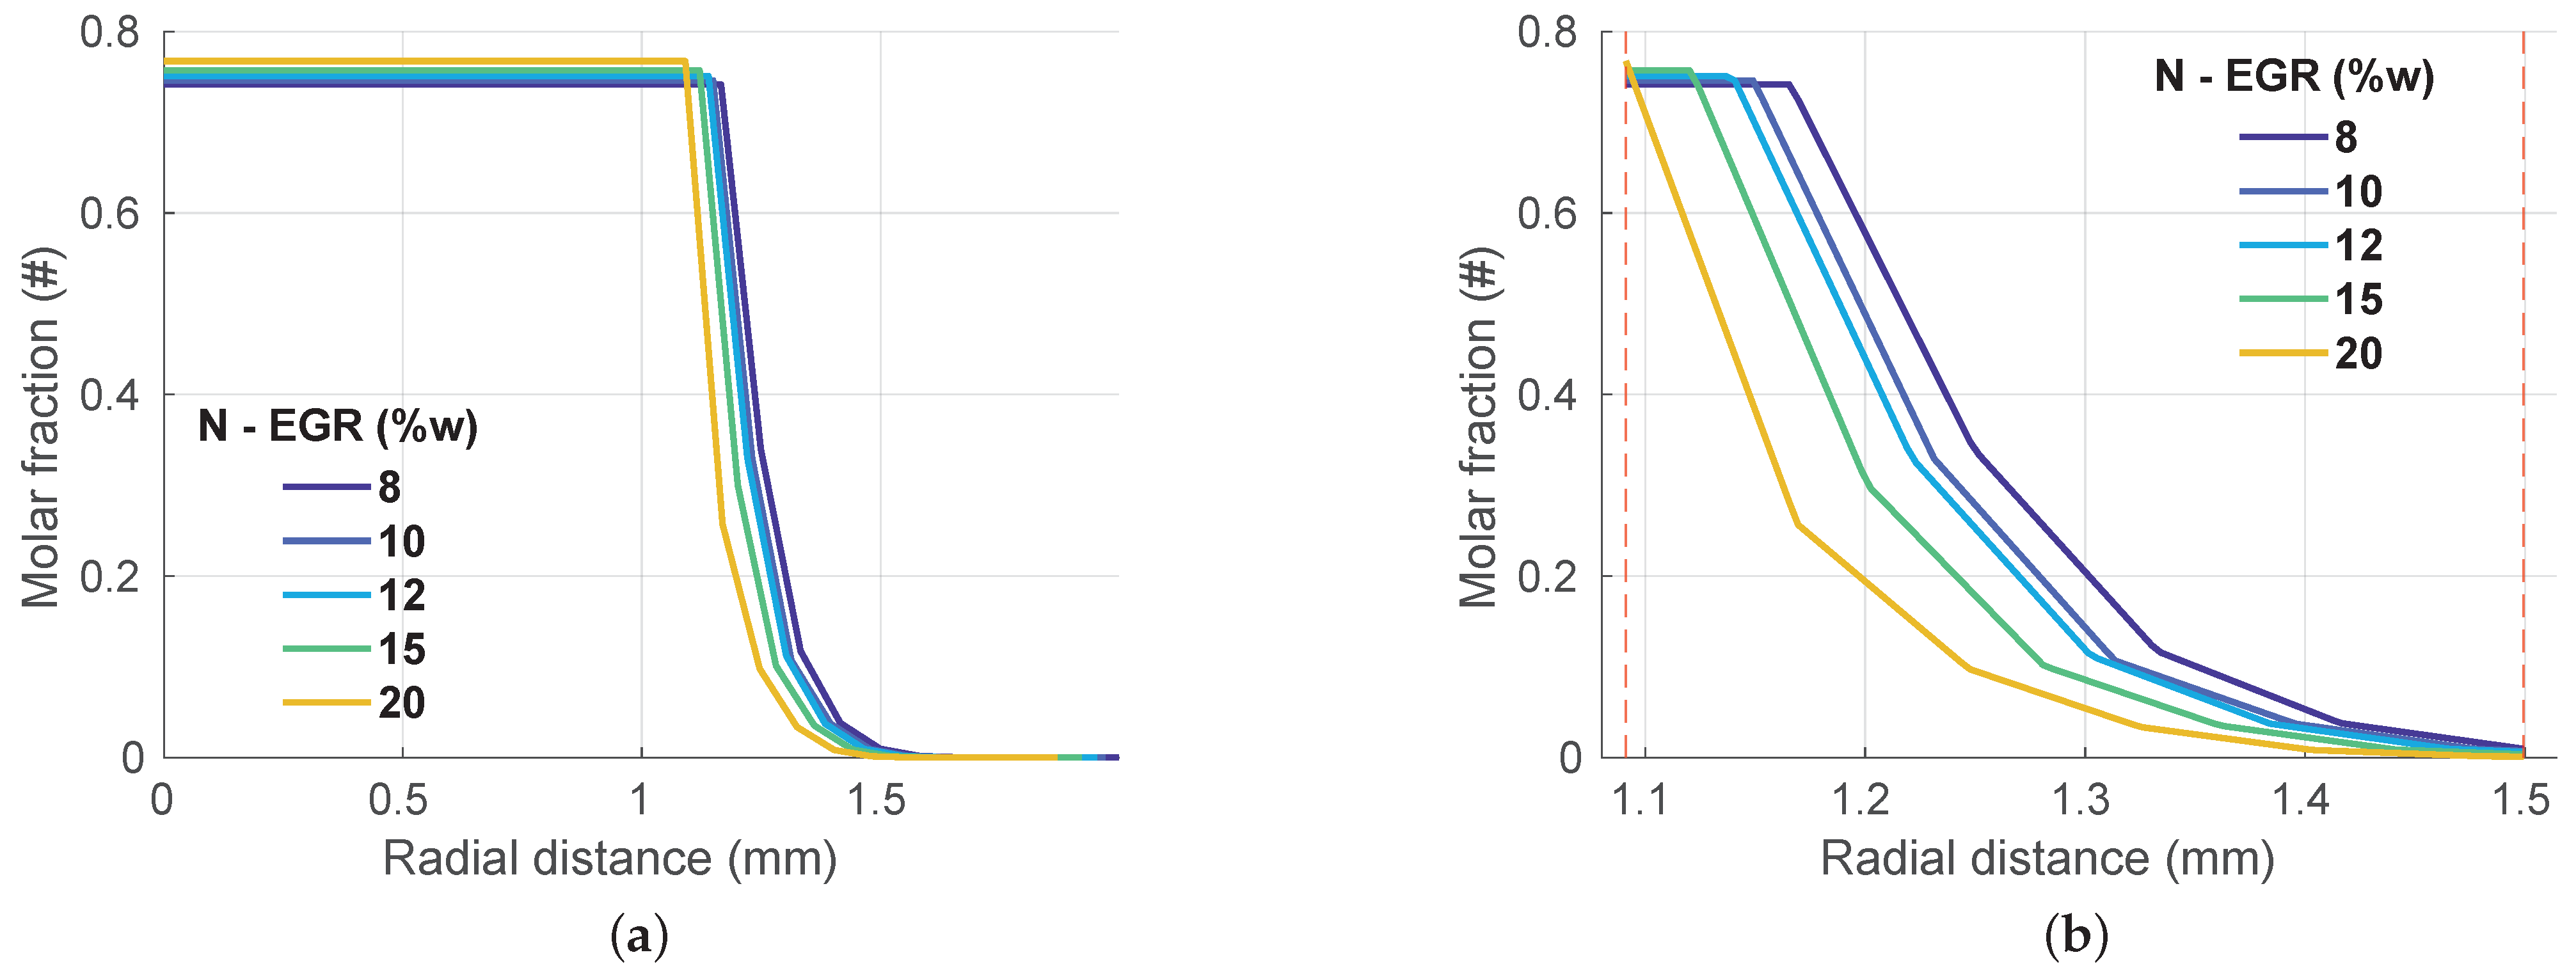
As shown in Figure 9, Figure 10 and Figure 11, the direct effect of the EGR increase is the unavoidable decrease of the initial production of the O and H radicals since the engine is operating with the same fresh mixture while recirculating a higher amount of the exhaust gas, which is mainly composed of nitrogen. Figure 9, Figure 10 and Figure 11 show the same sigmoid-shape for the distribution of radicals along space.
Focusing on the early right descending arm of the curve in Figure 9 and Figure 10, one can see that for a given radial distance the H and O radicals amount is strongly reduced to around 40–75% considering the EGR increase from 8 to 20%. This shorter penetration is due to the larger amount of nitrogen, which unavoidably increases the likelihood of electron-nitrogen interactions with production of N radicals (Figure 11) while depleting the availability of the electrons for oxygen and hydrogen. As seen in Figure 10, oxygen is more sensitive to the above-mentioned effect with respect to hydrogen.
3.2.2. Air-Fuel Ratio
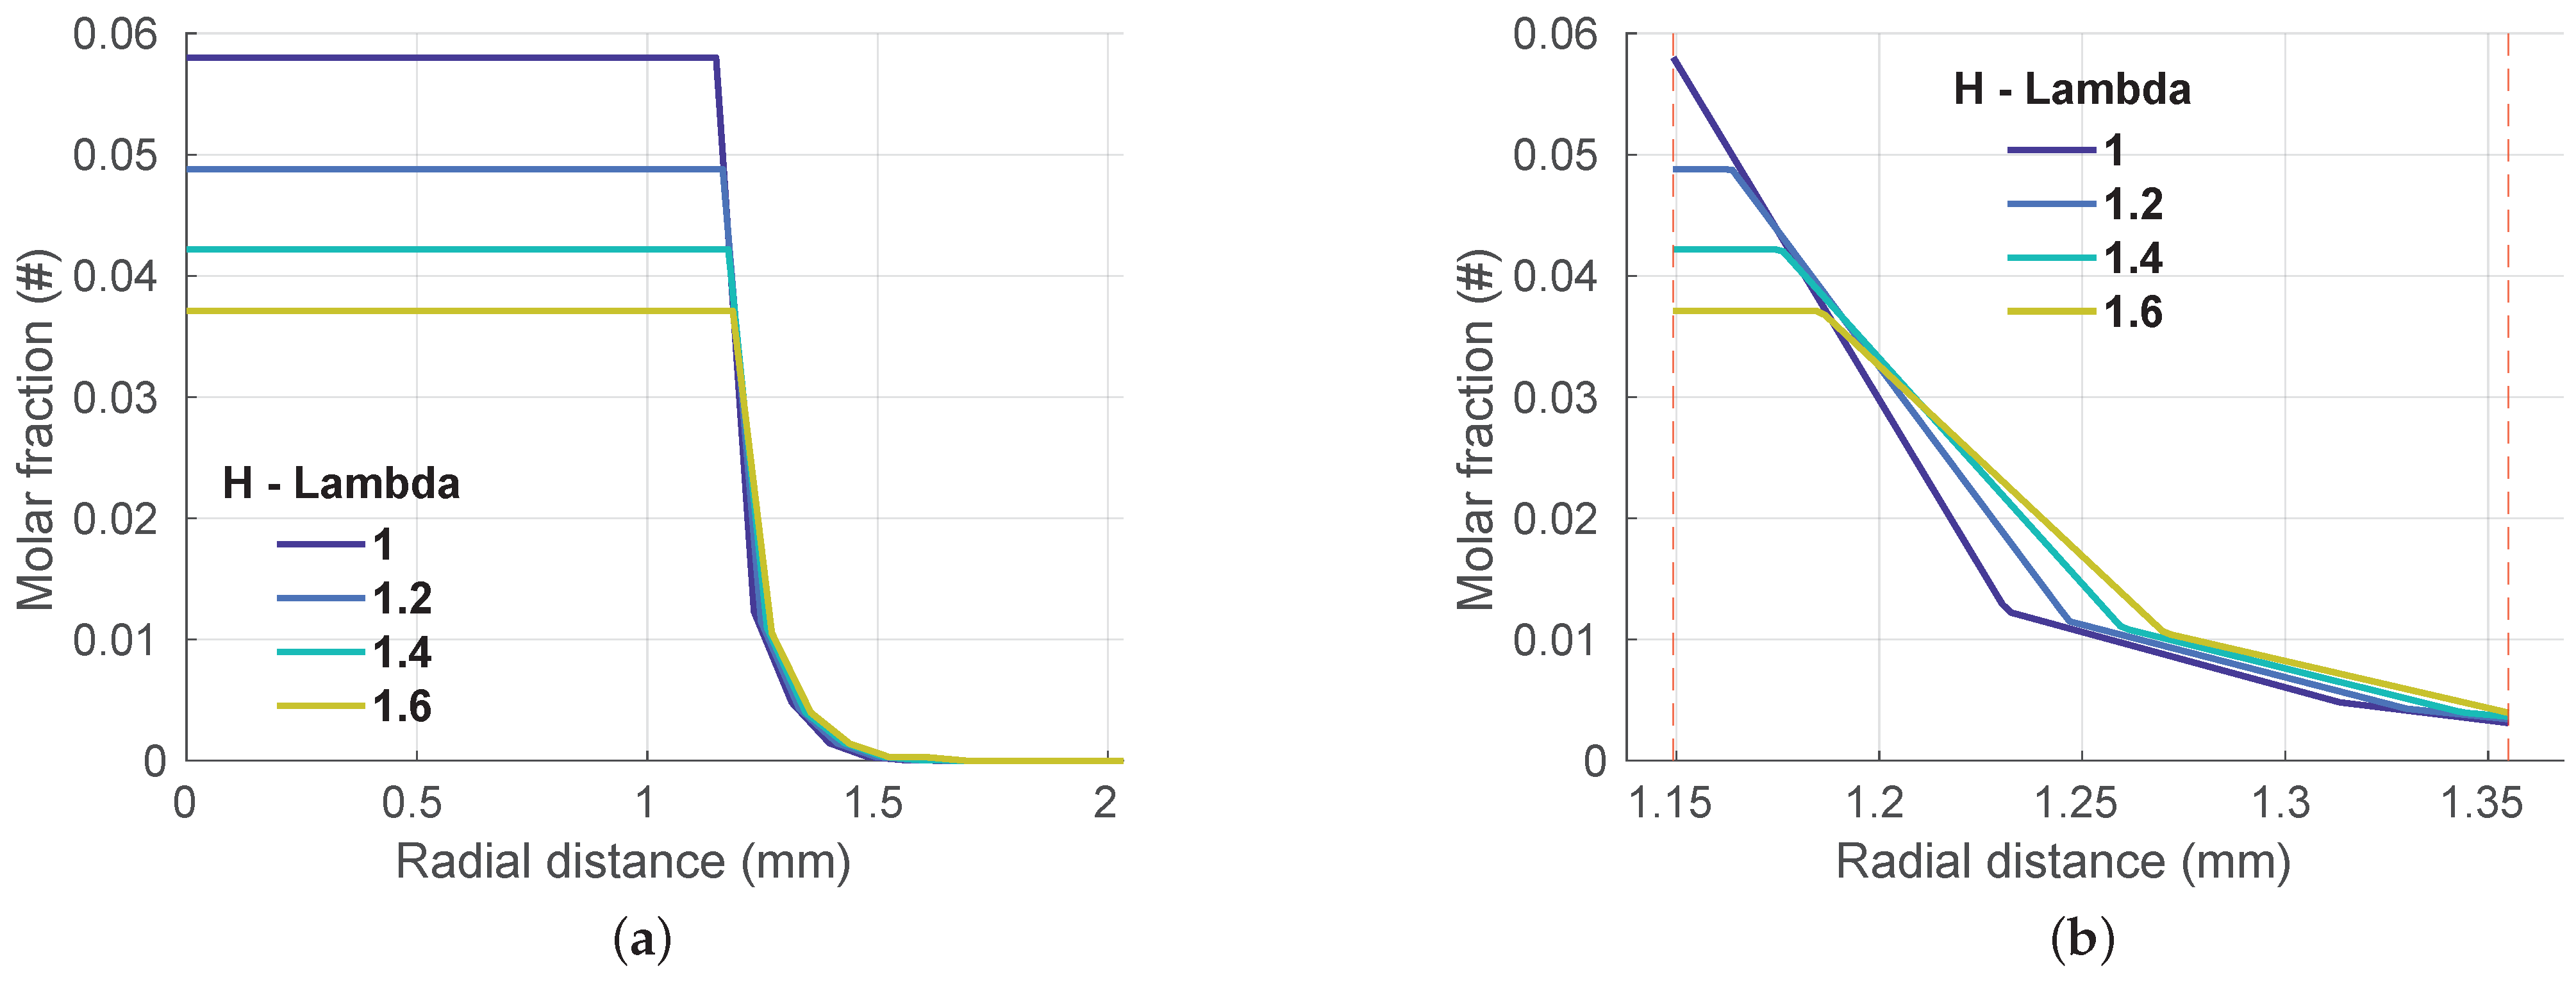
Four different values of the normalized air-fuel ratio () were tested. A summary of the relevant conditions is reported in Table 7. The tests involved the stoichiometric mixture, which is the current target for engines with TCI systems, and different leaner mixtures since the increasing of the air excess is the target for engines with HFI systems. The lean limit of 1.6 was chosen according to the results reported in [1], where unstable combustions were recorded for mixtures leaner than that. Equation (12) shows that as a consequence of the lower initial fraction of H in the intake mixture, the fraction of the produced H radicals (Figure 12) is lower. Despite the significant difference between the left constant arm of the curves, the code predicts that the shape, the overall descending behavior of the curve, and the maximum penetration of H radicals is not sensitive to the operated air-fuel ratio, which is in agreement with the considerations reported in [1].
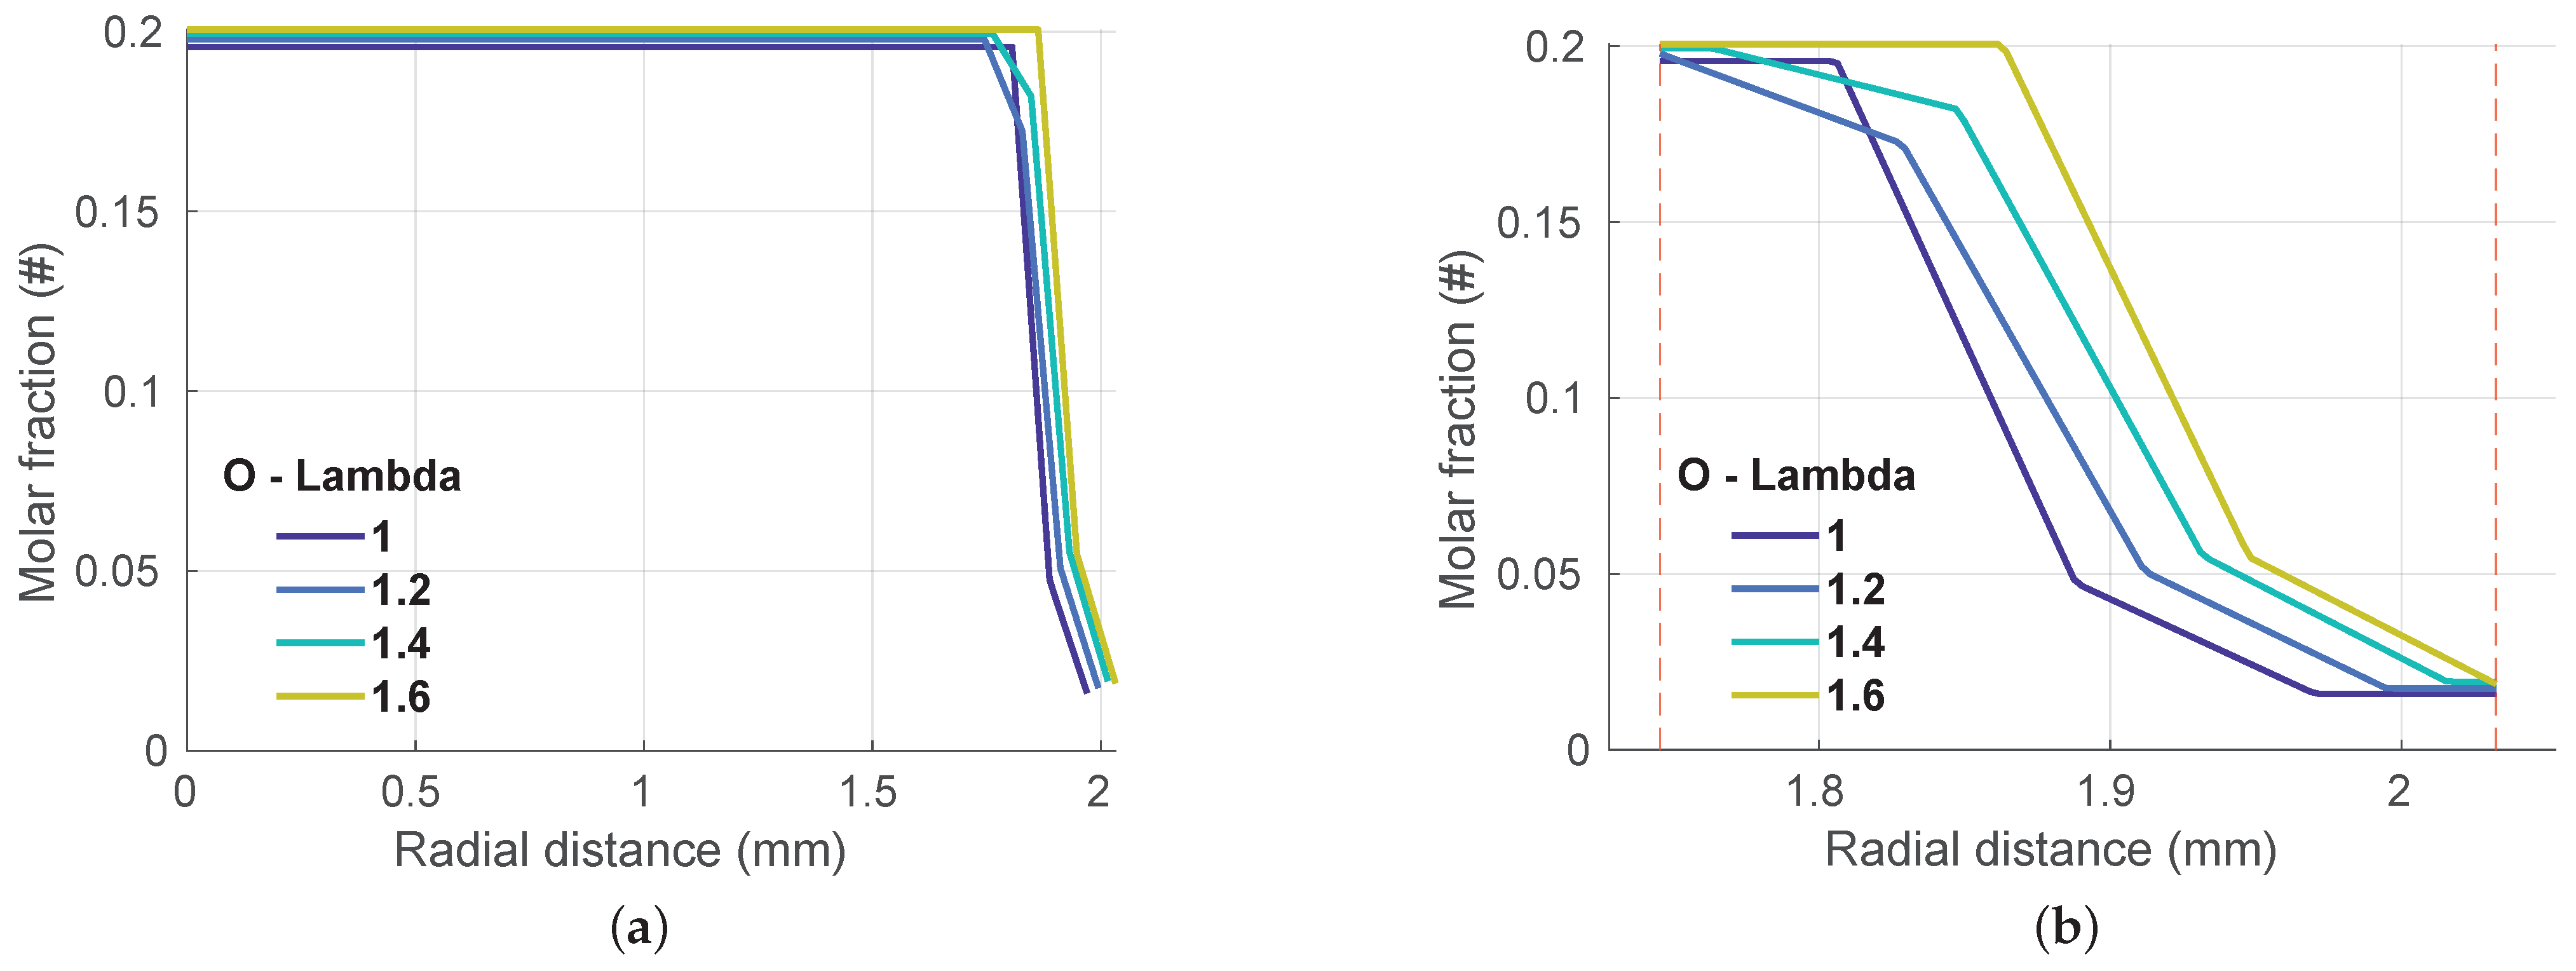
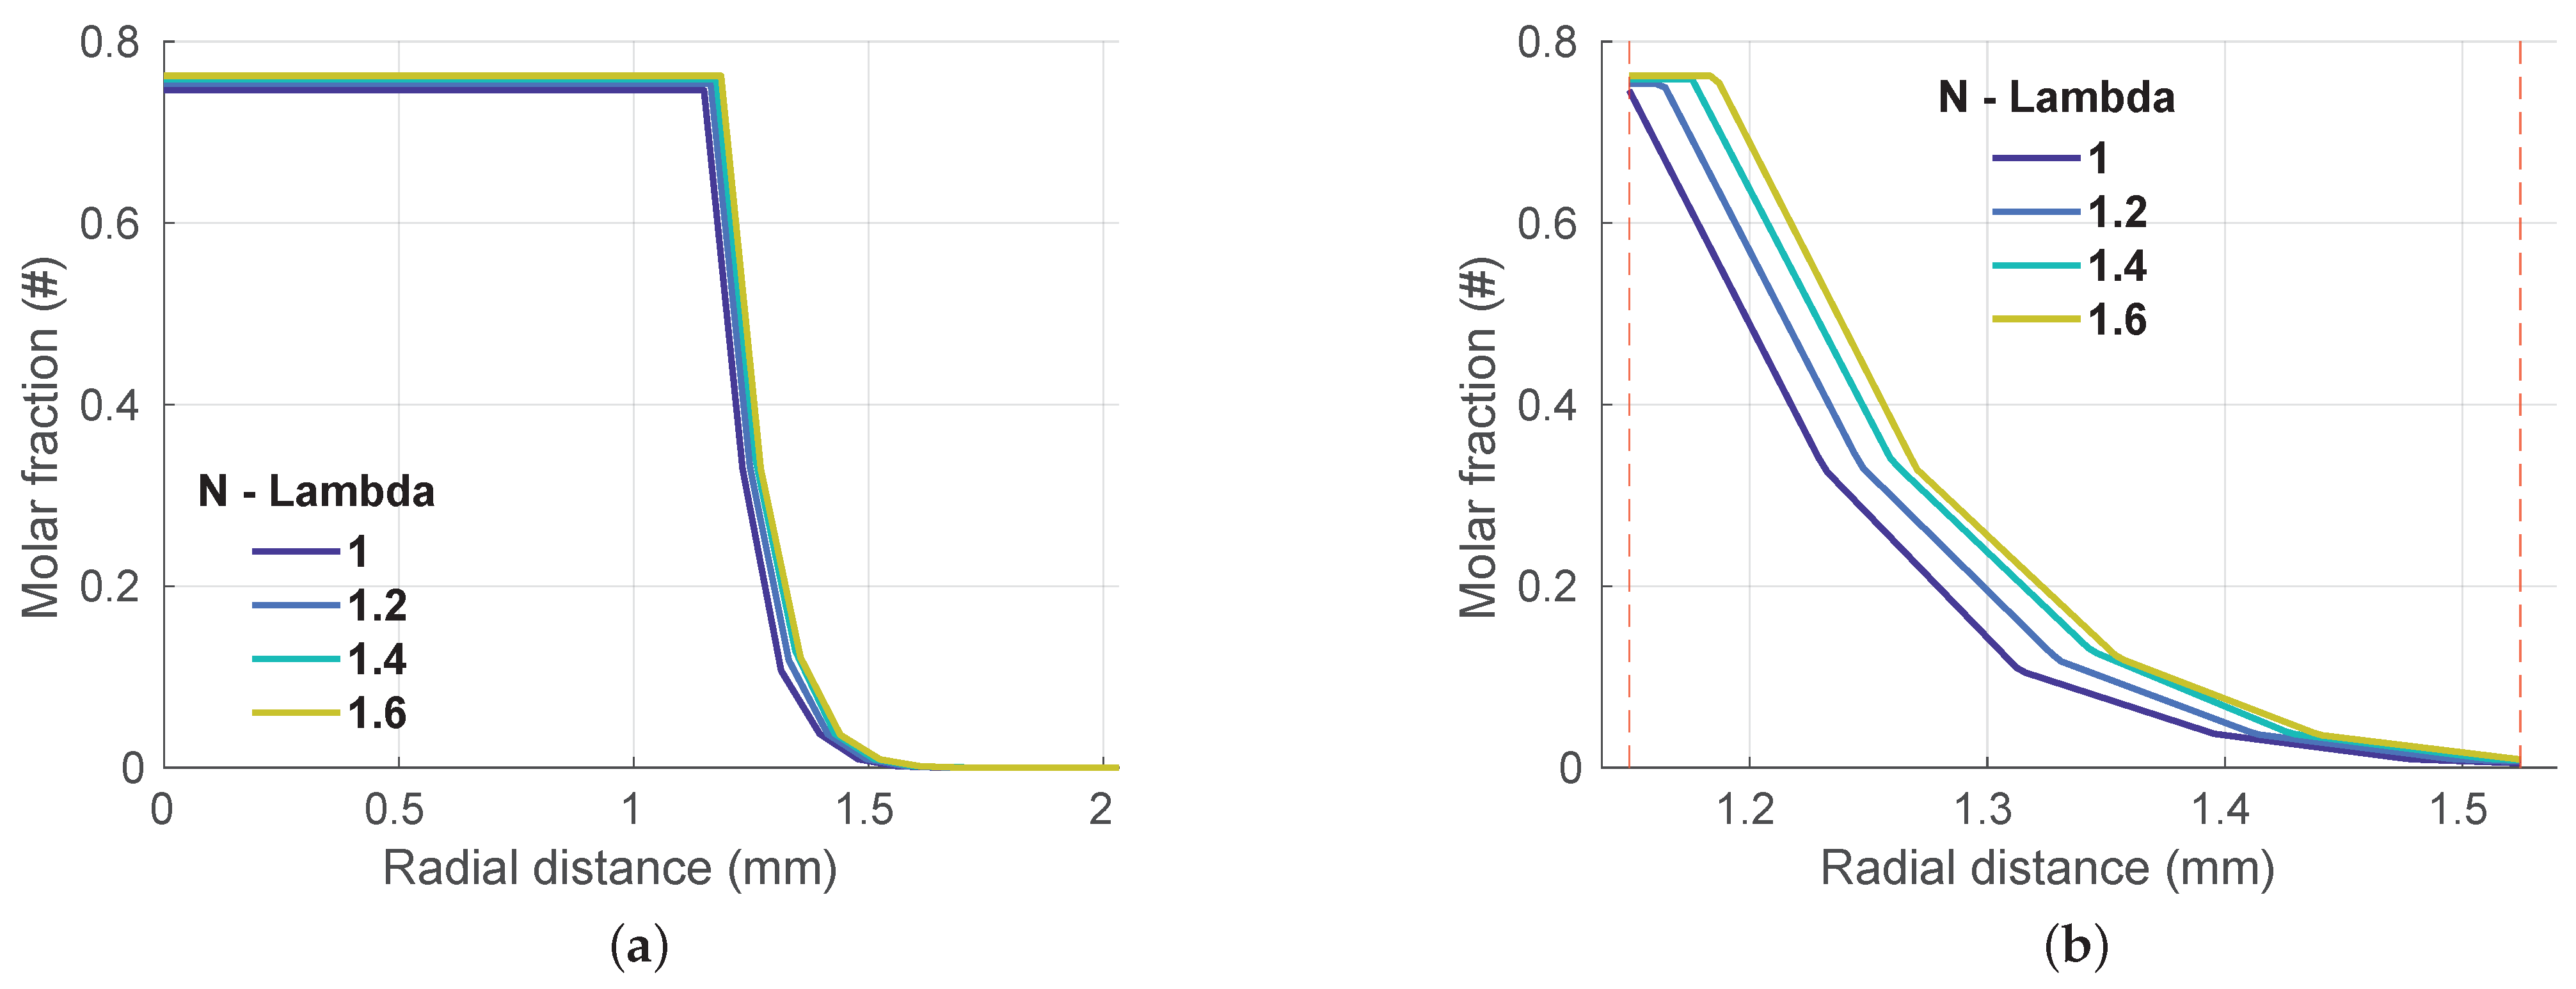
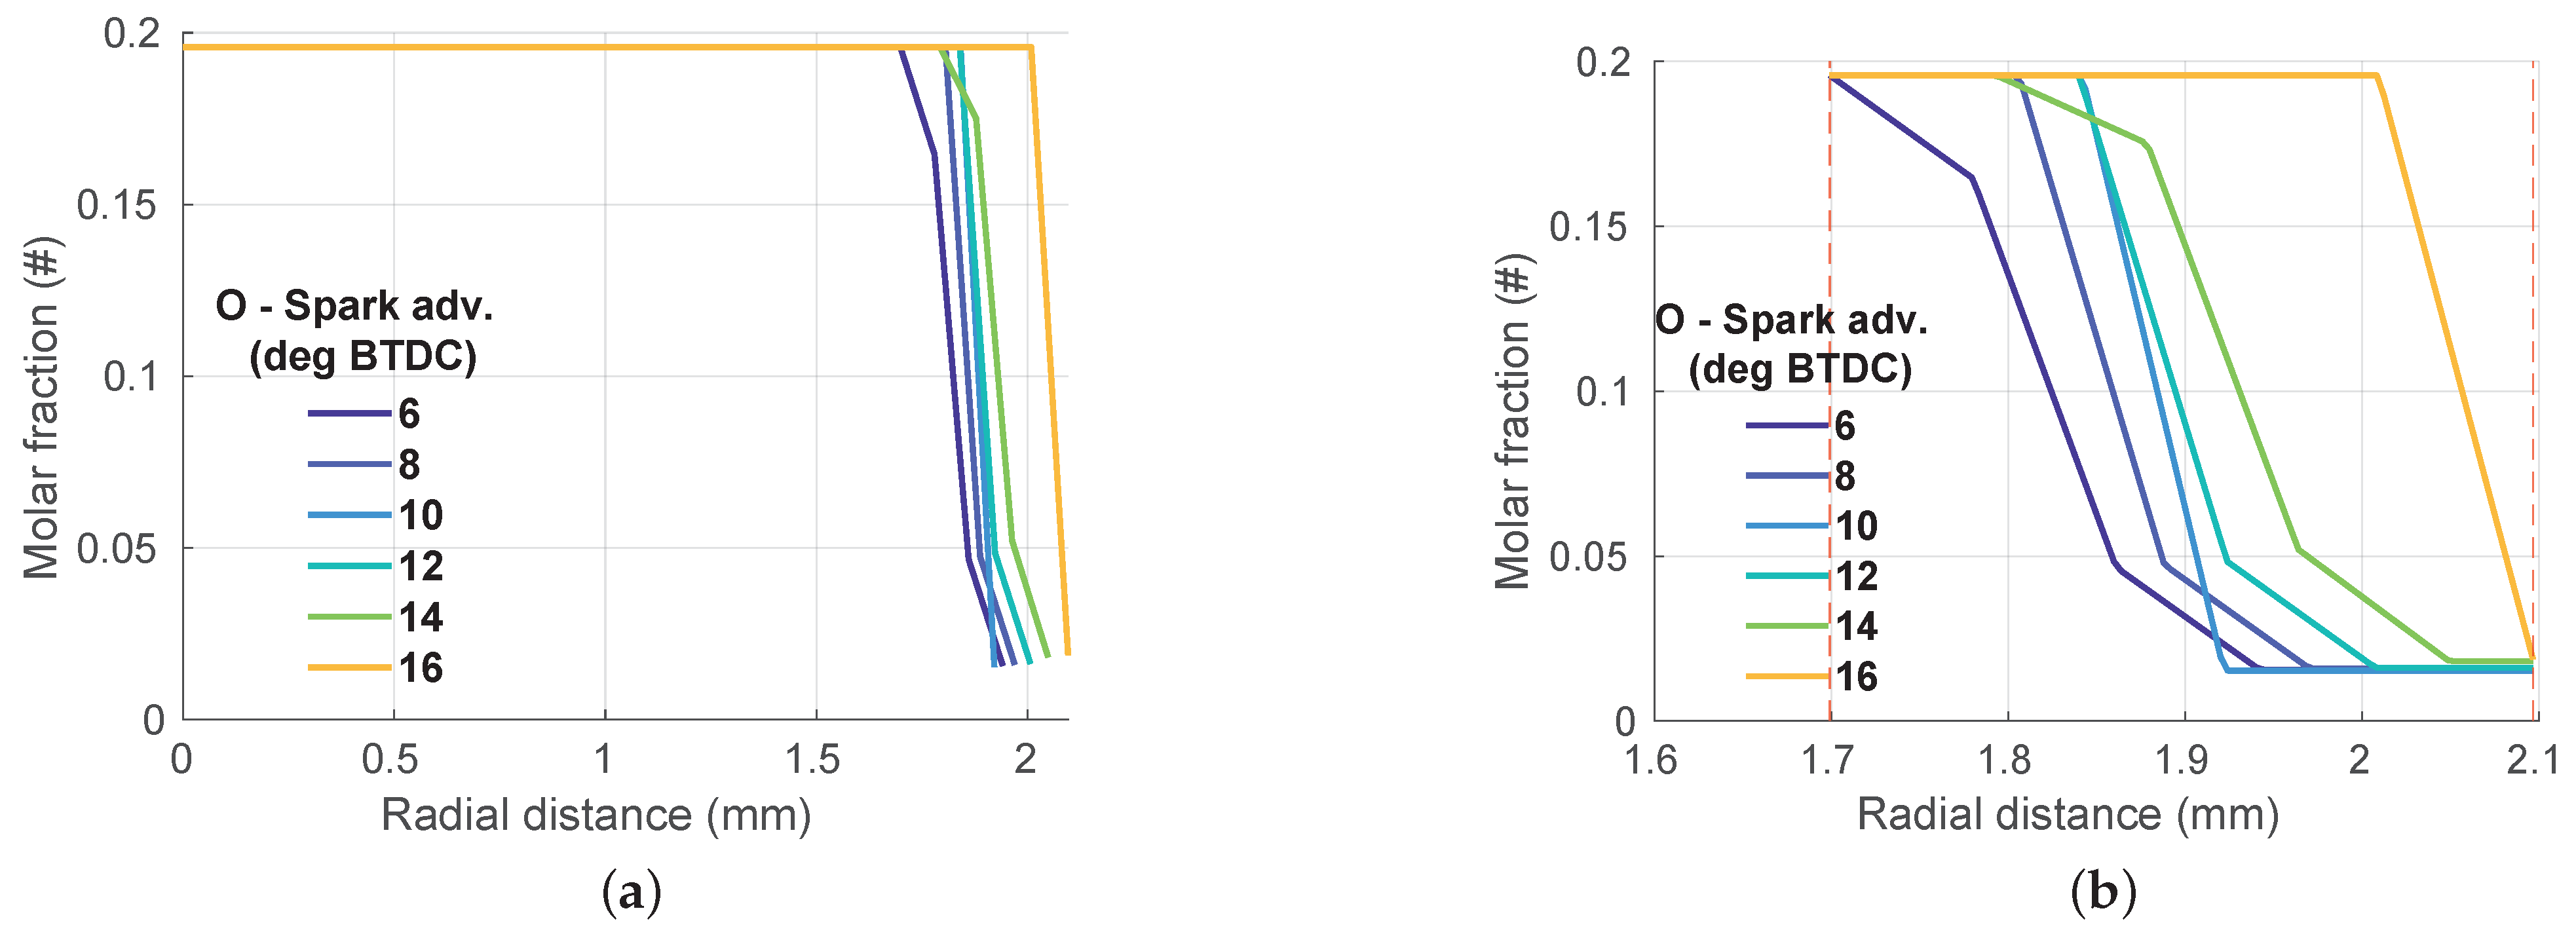
It needs to be underlined that in contrast to the results shown for the increasing EGR, the O radicals penetration in the cases of increasing (Figure 13) does not suffer from the nitrogen-induced electron depletion and indeed, as shown in Figure 13, the leaner the mixture, the more the O radicals decading radius is shifted towards a larger radii. This is due to the fact that operating a leaner mixture leads to the increasing of both the initial atmospheric oxygen and nitrogen, thus, when testing leaner mixtures, the proportion between oxygen and nitrogen is maintained and the O radicals production relies on the higher reactivity of the oxygen (higher cross sections). At these conditions, the longer penetration of both O and N radicals (Figure 13 and Figure 14) can be explained with the higher initial temperature.
3.2.3. Spark Advance
In this section different spark advances ranging from 6 degBTDC to 16 degBTDC are discussed under the same ignition conditions as the other cases, as reported in Table 8.
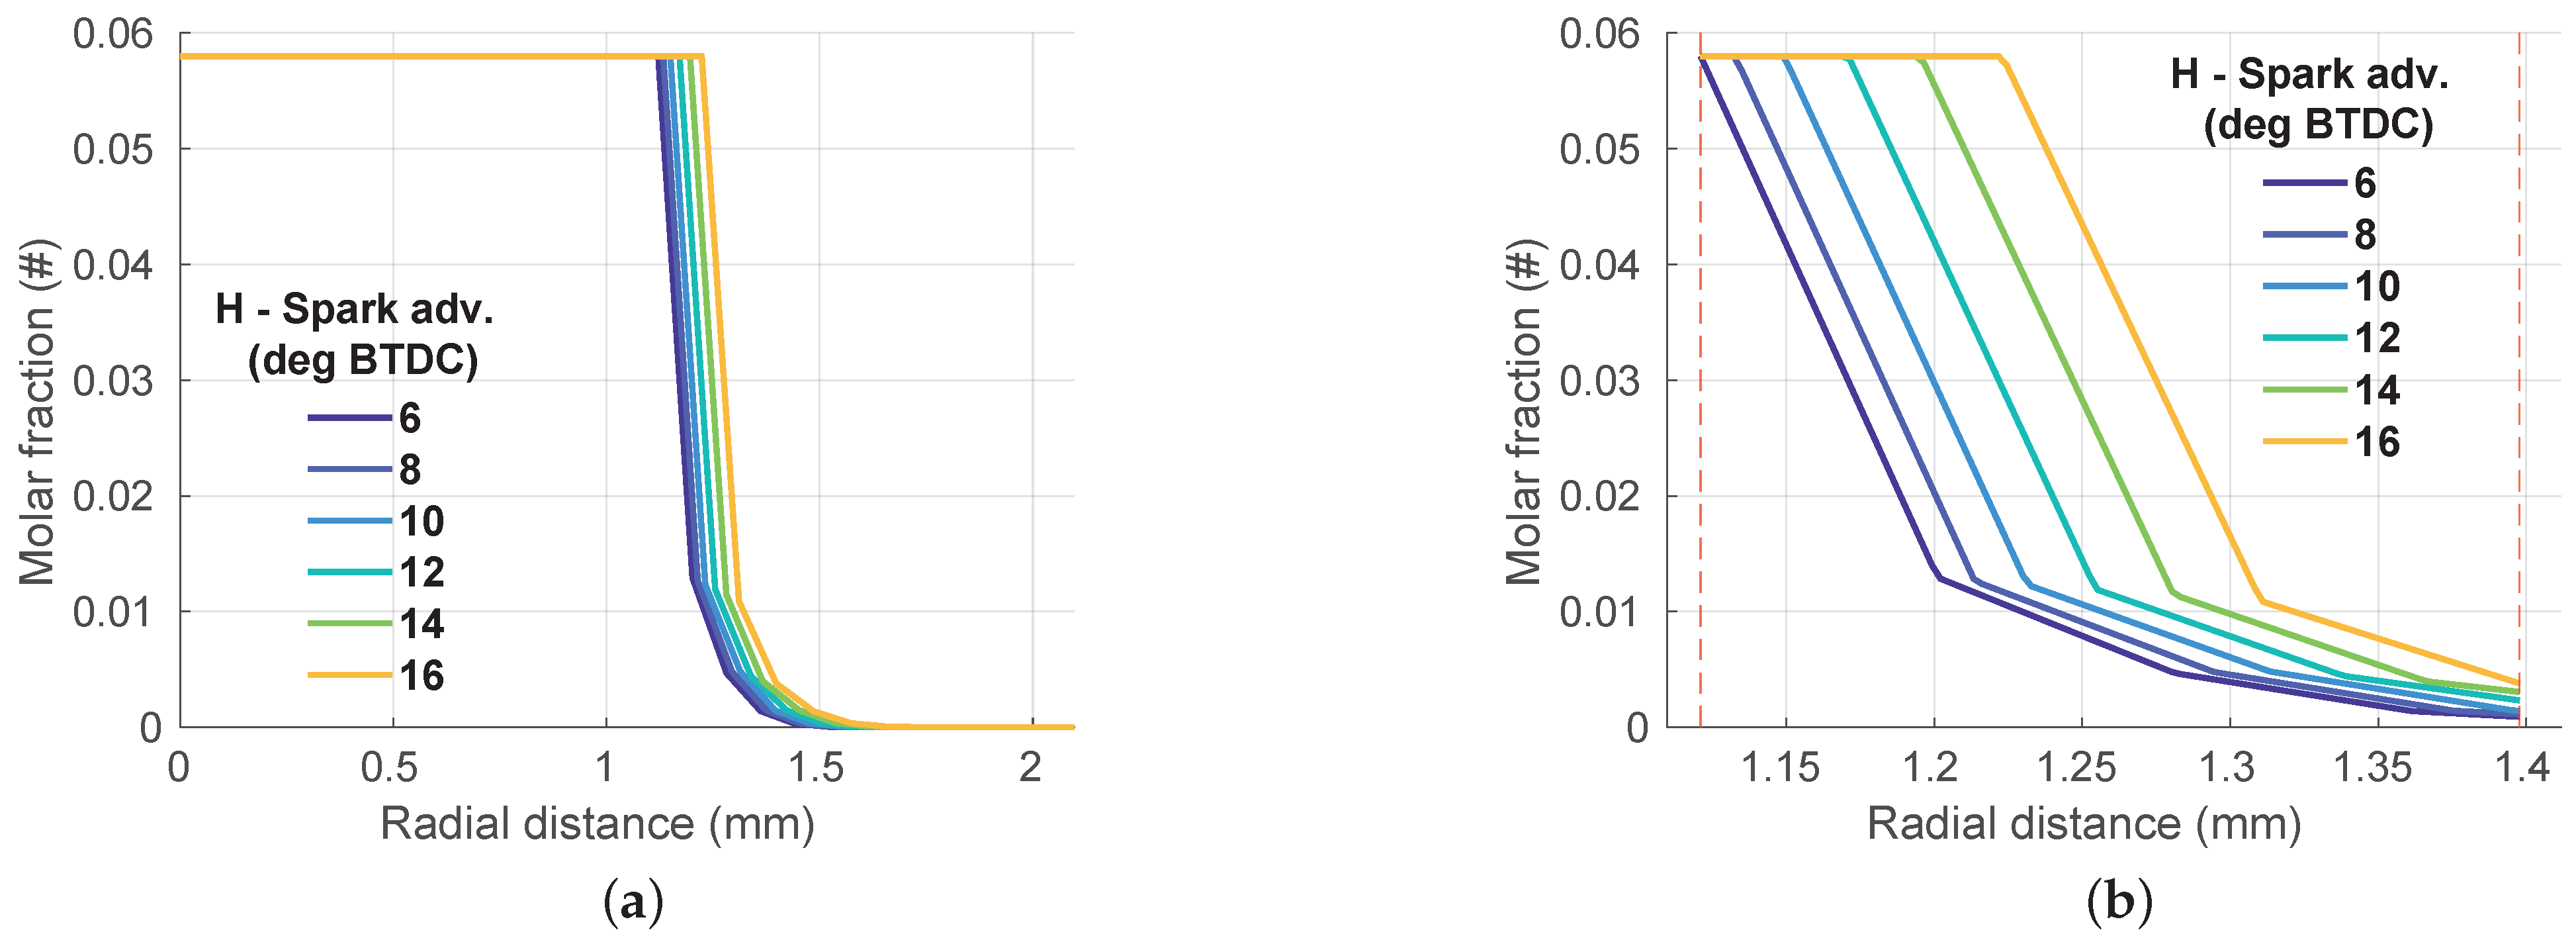
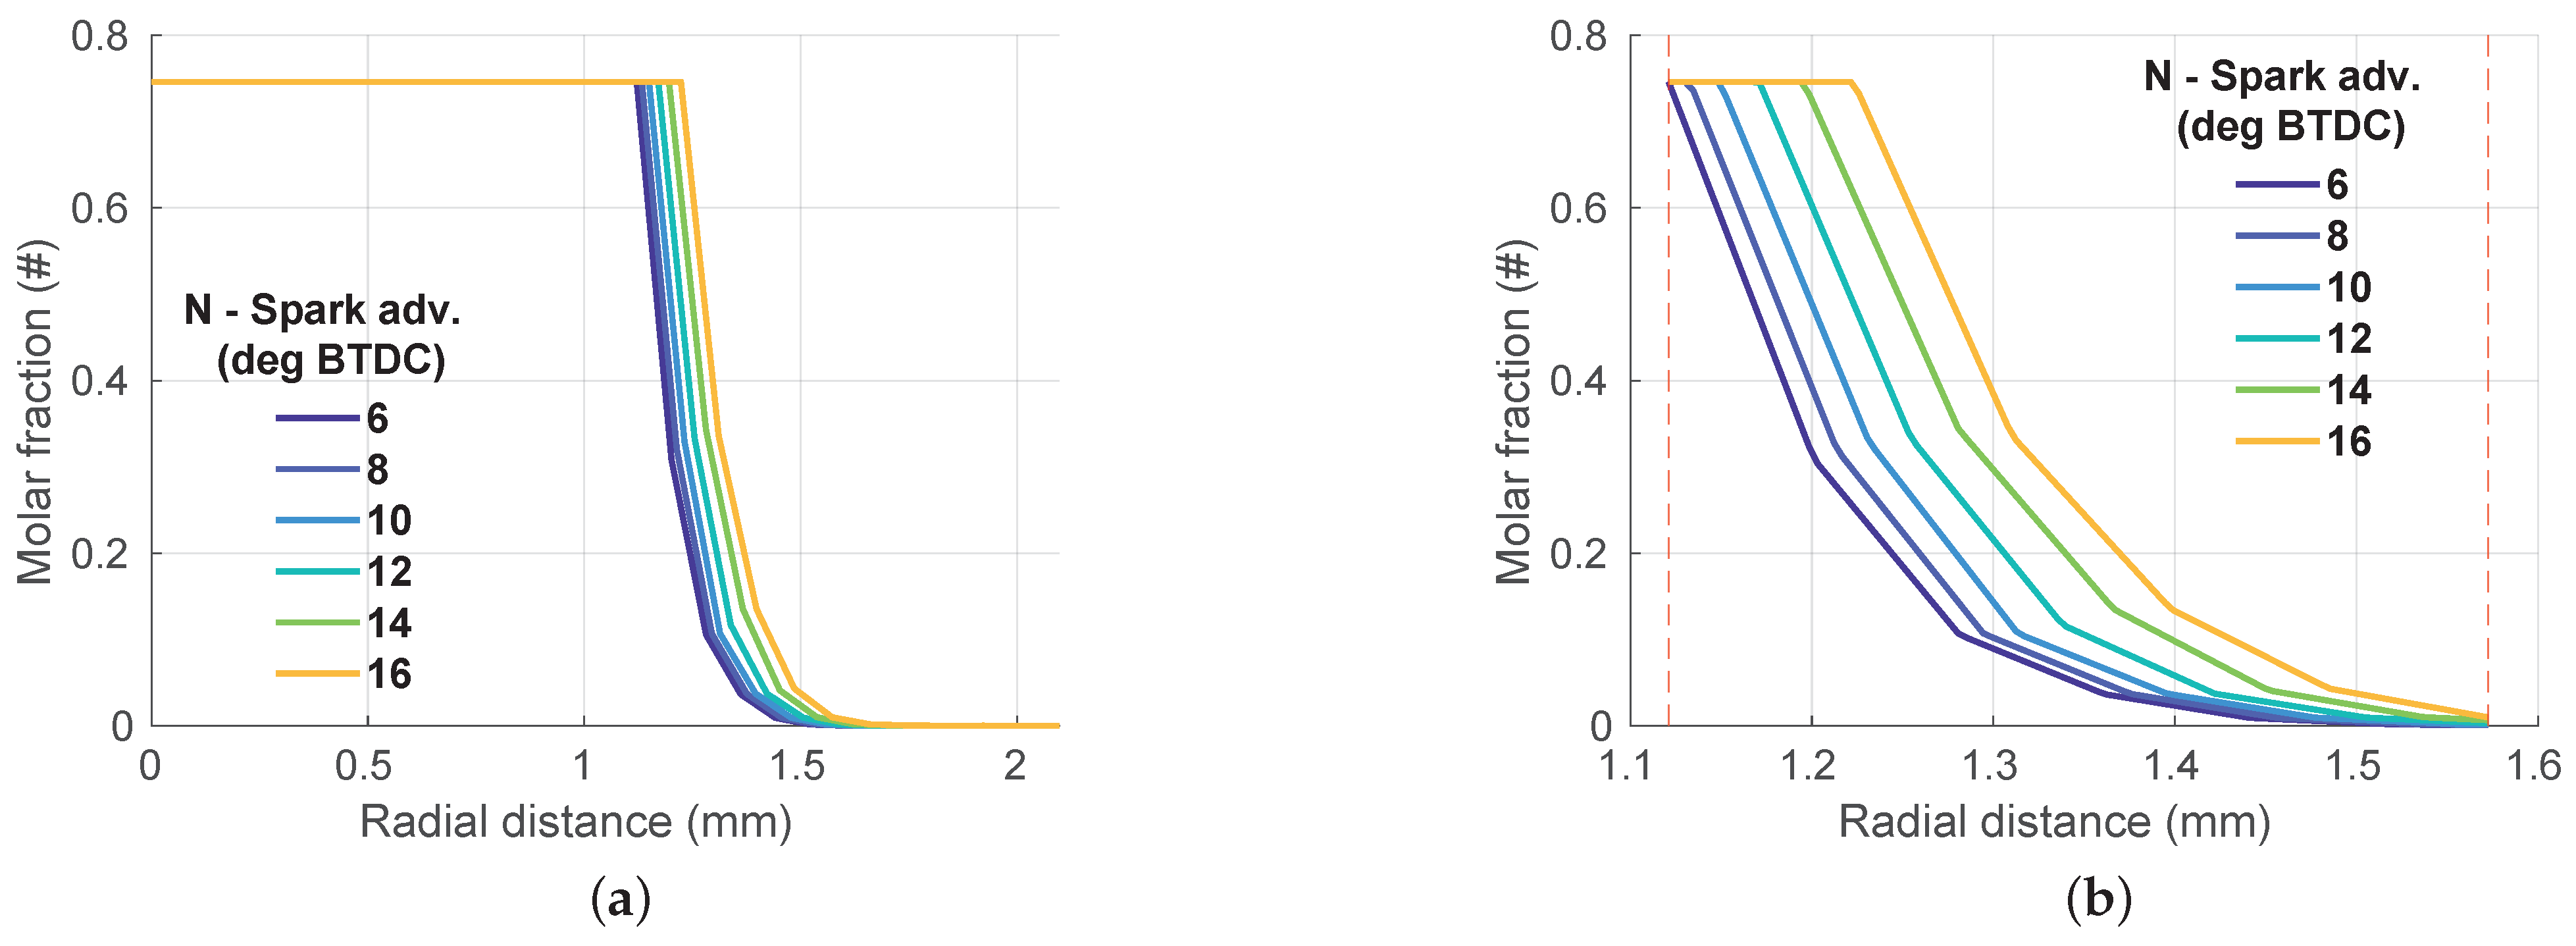
Figure 15, Figure 16 and Figure 17 show the radial penetration of N, H, and O radicals for the tested spark advances at the same voltage (33 ), which was chosen as the mean value of the pressure-dependent voltages returned by means of the correlation in [21]. In these cases, as the ignition time is anticipated (greater spark advance) a shorter penetration for all the traced species would be expected due to the lower temperature and pressure at that time. With regards to the lower temperature, as mentioned in Section 3.1, a cooler gas promotes the recombination rates of the species due to the monotonic decreasing behavior of their kinetic constants with respect to the temperature. Therefore, the chemical kinetics model is negatively affected by the advancing ignition timing since the increased recombination rate promotes the species’ molecular form instead of the radical one. Focusing on the lower pressure, thus the lower gas density, as seen in Equations (12) and (13) for the solution of the Boltzmann’s equation, a less dense mixture reduces the electrons collision frequency resulting in the reduced electron induced production rate of radicals. Nevertheless, as highlighted in Figure 15, Figure 16 and Figure 17, the above-mentioned negative effects of the time ignition advancing must be balanced by the growing up of the electron population, i.e., number density. As a result, in spite of the reduced electron collision frequency together and the larger number of recombination events, the production rate of the radicals (Equation (23)) returned by the Boltzmann solver and their penetration become greater due to the high electrons population despite their reduced mobility.
4. Discussion
The model here described is a first modeling step for the simulation of the relevant phenomena that occur during a Corona discharge with a particular focus on the internal combustion engine application. The implemented code can be used in place of the current ignition models to simulate the Corona ignition mechanism. Currently, the model is capable of supporting CFD combustion simulation software based on detailed chemical kinetics (e.g., CONVERGE). As revealed from the present results’ analysis the predicted response of the reactive species distributions to the variation of the engine control parameters are in line with some available experimental considerations and the characteristic physics of this framework. Moreover, the discharge radii predicted by the simulations are in the same order of magnitude (<10 mm) reported by a very detailed experimental campaign from the literature. The results have shown that the profiles of the oxygen radical is the most sensitive to any variation of EGR, air-fuel ratio, and Spark Advance (Figure 10, Figure 13 and Figure 16). On the other hand, hydrogen (Figure 9, Figure 12 and Figure 15) and nitrogen (Figure 11, Figure 14 and Figure 17) radical profiles are less sensitive to the above-mentioned parameters as they show an almost monotonous evolution according to the expectations with respect to the control parameters. Furthermore the oxygen exhibits the greater penetration distance. The analysis showed that both the radicals concentration and distribution profile shape are strongly affected with a particular emphasis by the Spark Advance. It must be highlighted that the model agrees with the experimental evidence that this ignition system is suitable for leaner operating conditions. Indeed considering a given radial distance from the ignition device, the oxygen radical concentration recorded for an air-fuel ratio of 1.6 is around three times with respect to the one recorded for a stoichiometric mixture (Figure 13).
Further developments will regard the including of the steady-state effect of a nano-pulsed electric field in the Boltzmann solver together with the coupling of the properties used by the electron transport model (i.e., electron diffusivity and mobility) with the chemical composition returned by the chemical kinetics model. As a result, an improved capture of the initial ignition region due to the more accurate computation of the production rate of the radical species will be achieved. Currently, the model relies on the assumption that the electron-ion interactions are allowed while the ion-ion interactions are neglected due to the characteristic time of the events under review. However, the introduction of several chemical species and their ion-ion reactions will be implemented. This allows one to provide the following three-dimensional CFD simulations with an extended palette of species aiming to improve the reliability of the combustion simulation. It needs to be underlined that currently the mono-dimensional simulations are almost timeless (5 ÷ 10 ). However, since the introduction of an extended palette of species will be mandatory to couple the mono-dimensional code with CFD engine simulations, the computing time is expected to significantly increase. Therefore, the implementation of the parallel run features will be programmed in order to maintain a low computing cost.
Author Contributions
Methodology, G.L.C., V.M., F.O., E.G. and G.C.; formal analysis, G.L.C.; software, G.L.C.; validation, G.L.C. and V.M.; visualization, G.L.C. and V.M.; writing–original draft, G.L.C., V.M. and F.O.; writing–review & editing, E.G. and G.C.; supervision, E.G. and G.C. All authors have read and agreed to the published version of the manuscript.
Funding
This research received no external funding.
Institutional Review Board Statement
Not applicable.
Informed Consent Statement
Not applicable.
Data Availability Statement
Data will be available upon reasonable requests.
Conflicts of Interest
The authors declare no conflict of interest.
References
- Cimarello, A.; Grimaldi, C.N.; Mariani, F.; Battistoni, M.; Re, M.D. Analysis of RF Corona Ignition in Lean Operating Conditions Using an Optical Access Engine; SAE Technical Paper Series; SAE International: Warrendale, PA, USA, 2017. [Google Scholar]
- Hampe, C.; Kubach, H.; Spicher, U.; Rixecker, G.; Bohne, S. Investigations of Ignition Processes Using High Frequency Ignition; SAE International: Warrendale, PA, USA, 2013. [Google Scholar]
- Stoffels, E.; Flikwert, A.J.; Stoffels, W.W.; Kroesen, G.M.W. Plasma needle: A non-detructive atmopspheric plasma source for fine surface treatment of (bio)materials. Plasma Sources Sci. Technol. 2002, 11, 383–388. [Google Scholar] [CrossRef]
- Klages, C.P.; Hoepfner, K.; Klaeke, N.; Thyen, R. Surface functionalization at atmospheric pressure by DBD-based pulsed plasma polymerization. Plasma Polym. 2000, 5, 79–89. [Google Scholar] [CrossRef]
- Kogelschatz, U. Industrial innovations based on fundamental physics. Plasma Sources Sci. Technol. 2002, 11, 1–6. [Google Scholar] [CrossRef]
- Takaki, K.; Fujiwara, T. Multipoint barrier discharge process for removal of NOx from diesel engine exhaust. IEEE Trans. Plasma Sci. 2001, 29, 518–523. [Google Scholar] [CrossRef]
- Kogelschatz, U. Filamentary, patterned and diffuse barrier discharges. IEEE Trans. Plasma Sci. 2002, 30, 1400–1408. [Google Scholar] [CrossRef]
- Pineda, D.I.; Wolk, B.; Chen, J.Y.; Dibble, R.W. Application of Corona Discharge Ignition in a Boosted Direct-Injection Single Cylinder Gasoline Engine: Effects on Combustion Phasing, Fuel Consumption, and Emissions. SAE Int. J. Engines 2016, 9, 1970–1988. [Google Scholar] [CrossRef]
- Chen, J.; Davidson, J.H. Electron Density and Energy Distributions in the Positive DC Corona: Interpretation for Corona-Enhanced Chemical Reactions. Plasma Chem. Plasma Process. 2001, 22, 199–224. [Google Scholar] [CrossRef]
- Georghiou, G.E.; Papadakis, A.P.; Morrow, R.; Metaxas, A.C. Numerical modelling of atmospheric pressure gas discharges leading to plasma production. J. Phys. D Appl. Phys. 2005, 38, R303. [Google Scholar] [CrossRef]
- Liu, L.; Becerra, M. An efficient model to simulate stable glow corona discharges and their transition into streamers. J. Phys. D Appl. Phys. 2017, 50, 105204. [Google Scholar] [CrossRef]
- Naidis, G.V. Modelling of plasma chemical processes in pulsed corona discharges. J. Phys. D Appl. Phys. 1996, 30, 1214. [Google Scholar] [CrossRef]
- Tochikubo, F.; Arai, H. Numerical simulation of streamer propagation and radical reactions in positive corona discharge in N2-NO and N2-O2-NO. Jpn. J. Appl. Phys. 2001. [Google Scholar] [CrossRef]
- Varma, A.R.; Thomas, S. Simulation, Design and Development of a High Frequency Corona Discharge Ignition System; SAE Technical Paper Series; SAE International: Warrendale, PA, USA, 2013. [Google Scholar]
- Moravej, M.; Yang, X.; Barankin, M.; Penelon, J.; Babayan, S.E.; Hicks, R.F. Properties of an atmospheric pressure radio-frequency argon and nitrogen plasma. Plasma Sources Sci. Technol. 2006, 15, 204. [Google Scholar] [CrossRef]
- Alves, L. The IST-Lisbon database on LXCat. J. Phys. Conf. Ser. 2014, 565, 012007. [Google Scholar] [CrossRef]
- Hagelaar, G.; Pitchford, L. Solving the Boltzmann equation to obtain electron transport coefficients and rate coefficients for fluid models. Plasma Sources Sci. Technol. 2005, 14, 722–733. [Google Scholar] [CrossRef]
- Rabie, M.; Franck, C. METHES: A Monte Carlo collision code for the simulation of electron transport in low temperature plasmas. Comput. Phys. Commun. 2016, 203, 268–277. [Google Scholar] [CrossRef] [Green Version]
- Schwenke, D. Calculations of rate constants for the three-body recombination of H2 in the presence of H2. J. Chem. Phys. 1988, 89, 2076–2091. [Google Scholar] [CrossRef] [Green Version]
- Pejakovic, D.A.; Kalogerakis, K.S.; Copeland, R.A.; Huestis, D.L. Laboratory determination of the rate coefficient for three-body recombination of oxygen atoms in nitrogen. J. Geophys. Res. 2008, 113. [Google Scholar] [CrossRef] [Green Version]
- Carey, W.; Wiebe, A.; Nord, R.; Altgilbers, L. Characterization of Paschen Curve Anomolies At High P*D Values. In Proceedings of the IEEE International Pulsed Power Conference (19th), Chicago, IL, USA, 19–23 June 2011. [Google Scholar]
- Cruccolini, V.; Grimaldi, C.N.; Discepoli, G.; Ricci, F.; Petrucci, L.; Papi, S. An optical method to characterize streamer variability and streamer-to-flame transition for radio-frequency corona discharges. Appl. Sci. 2020, 10, 2257. [Google Scholar] [CrossRef] [Green Version]
- Woschni, G. A Universally Applicable Equation for the Instantaneous Heat Transfer Coefficient in the Internal Combustion Engine; SAE International: Warrendale, PA, USA, 1967. [Google Scholar] [CrossRef]
Figure 1.
Conceptual representation of the ignition model domain.

Figure 2.
Electron Energy Distribution Function (EEDF) comparison between BOLSIG+, METHES, and the present model for different applied electric fields.
Figure 2.
Electron Energy Distribution Function (EEDF) comparison between BOLSIG+, METHES, and the present model for different applied electric fields.

Figure 3.
Flow chart of the ignition model algorithm.

Figure 4.
Grid independece result for different number of elements under the same operating conditions for N, O, and H radicals.
Figure 4.
Grid independece result for different number of elements under the same operating conditions for N, O, and H radicals.

Figure 5.
Pressure, density, and temperature simulated curves. The black markers indicate the reference values at the ignition time.
Figure 5.
Pressure, density, and temperature simulated curves. The black markers indicate the reference values at the ignition time.

Figure 6.
H radical molar fractions for cases in Table 4. Overall distribution (a) and detail (b).
Figure 6.
H radical molar fractions for cases in Table 4. Overall distribution (a) and detail (b).

Figure 7.
O radical molar fractions for cases in Table 4. Overall distribution (a) and detail (b).
Figure 7.
O radical molar fractions for cases in Table 4. Overall distribution (a) and detail (b).

Figure 8.
N radical molar fractions for cases in Table 4. Overall distribution (a) and detail (b).
Figure 8.
N radical molar fractions for cases in Table 4. Overall distribution (a) and detail (b).

Figure 9.
Effect of Exhaust Gas Recirculation (EGR) on H radical molar distribution against the distance from the tip. Overall distribution (a) and detail (b).
Figure 9.
Effect of Exhaust Gas Recirculation (EGR) on H radical molar distribution against the distance from the tip. Overall distribution (a) and detail (b).

Figure 10.
Effect of EGR on O radical molar distribution against the distance from the tip. Overall distribution (a) and detail (b).
Figure 10.
Effect of EGR on O radical molar distribution against the distance from the tip. Overall distribution (a) and detail (b).

Figure 11.
Effect of EGR on N radical molar distribution against the distance from the tip. Overall distribution (a) and detail (b).
Figure 11.
Effect of EGR on N radical molar distribution against the distance from the tip. Overall distribution (a) and detail (b).

Figure 12.
Effect of air-fuel ratio on H radical molar distribution against the distance from the tip. Overall distribution (a) and detail (b).
Figure 12.
Effect of air-fuel ratio on H radical molar distribution against the distance from the tip. Overall distribution (a) and detail (b).

Figure 13.
Effect of air-fuel ratio on O radical molar distribution against the distance from the tip. Overall distribution (a) and detail (b).
Figure 13.
Effect of air-fuel ratio on O radical molar distribution against the distance from the tip. Overall distribution (a) and detail (b).

Figure 14.
Effect of air-fuel ratio on N radical molar distribution against the distance from the tip. Overall distribution (a) and detail (b).
Figure 14.
Effect of air-fuel ratio on N radical molar distribution against the distance from the tip. Overall distribution (a) and detail (b).

Figure 15.
Effect of spark advance on H radical molar distribution against the distance from the tip. Overall distribution (a) and detail (b).
Figure 15.
Effect of spark advance on H radical molar distribution against the distance from the tip. Overall distribution (a) and detail (b).

Figure 16.
Effect of spark advance on O radical molar distribution against the distance from the tip. Overall distribution (a) and detail (b).
Figure 16.
Effect of spark advance on O radical molar distribution against the distance from the tip. Overall distribution (a) and detail (b).

Figure 17.
Effect of spark advance on N radical molar distribution against the distance from the tip. Overall distribution (a) and detail (b).
Figure 17.
Effect of spark advance on N radical molar distribution against the distance from the tip. Overall distribution (a) and detail (b).


Table 1.
Total ionization collision rates () calculated by the codes for the same operative conditions.
Table 1.
Total ionization collision rates () calculated by the codes for the same operative conditions.
| Ionization | 1 Td | 75 Td | 150 Td | 225 Td | 300 Td |
|---|---|---|---|---|---|
| This work | 0 | 2.1364 | 198.41 | 2297.4 | 5325.6 |
| Bolsig+ | 0 | 1.930 | 230.7 | 1568 | 4758 |
| METHES | 0 | 3.9256 | 376.44 | 2033.5 | 5547.2 |
Table 2.
Total attachment collision rates () calculated by the codes for the same operative conditions.
Table 2.
Total attachment collision rates () calculated by the codes for the same operative conditions.
| Attachment | 1 Td | 75 Td | 150 Td | 225 Td | 300 Td |
|---|---|---|---|---|---|
| This work | 0 | 13.280 | 62.541 | 78.743 | 81.301 |
| Bolsig+ | 0 | 16.57 | 67.42 | 85.38 | 89.98 |
| METHES | 0 | 17.006 | 59.824 | 70.268 | 70.860 |
Table 3.
Geometric and operating data of the reference gasoline engine.
| Bore () | 84 |
| Stroke () | 85 |
| Displacement volume () | 471.05 |
| Compression ratio | 9.5:1 |
| Load | Full |
| BMEP (bar) | 20 |
| Engine speed (r/min) | 7000 |
| Spark advance (deg) | 8 |
| 1 |
Table 4.
Simulation matrix generated for the robustness numerical tests.
| Case | 0 | 1 | 2 | 3 | 4 | 5 | 6 |
|---|---|---|---|---|---|---|---|
| Density ( ) | 22.7 | 23.835 | 23.835 | 22.7 | 21.565 | 21.565 | 22.7 |
| Temperature () | 790 | 829.5 | 790 | 829.5 | 750.5 | 790 | 750.5 |
| Discharge radius () | 1.862 | 1.843 | 1.843 | 1.862 | 1.7238 | 1.7238 | 1.862 |
Table 5.
Corona spark plug and fuel mixture settings.
| Voltage (kV) | Current (A) | Tip radius (m) | |
|---|---|---|---|
| Corona spark plug | 40 | 255 | |
| Hydrogen (%) | Nitrogen (%) | Oxygen (%) | |
| Fuel mixture | 0.06 | 0.7426 | 0.1974 |
| Temperature (K) | Density (kg m) | Pressure (bar) | |
| Engine working point (8 deg BTDC) | 790 | 22.7 | 49.37 |
Table 6.
Simulated conditions for different EGR values.
| Case | 1 | 2 | 3 | 4 | 5 |
|---|---|---|---|---|---|
| Spark adv. (deg) | 10 | 10 | 10 | 10 | 10 |
| 1 | 1 | 1 | 1 | 1 | |
| EGR (%w) | 10 | 8 | 12 | 15 | 20 |
| Density @IGN ( ) | 17.2 | 16.8 | 17.4 | 17.9 | 18.7 |
| Temperature @IGN () | 728.2 | 734.7 | 721.8 | 698.7 | 736.8 |
| H2 (%mol) | 0.058 | 0.0591 | 0.0569 | 0.0555 | 0.0531 |
| N2 (%mol) | 0.7462 | 0.7416 | 0.7508 | 0.7573 | 0.7674 |
| O2 (%mol) | 0.1958 | 0.1994 | 0.1923 | 0.1872 | 0.1794 |
Table 7.
Simulated conditions for different air-fuel ratio values.
| Case | 1 | 2 | 3 | 4 |
|---|---|---|---|---|
| Spark adv. (deg) | 10 | 10 | 10 | 10 |
| 1 | 1.2 | 1.4 | 1.6 | |
| EGR (%w) | 10 | 10 | 10 | 10 |
| Density @IGN ( ) | 17.2 | 17 | 16.8 | 16.7 |
| Temperature @IGN () | 728.2 | 744.7 | 756.9 | 766.4 |
| H2 (%mol) | 0.058 | 0.0583 | 0.0555 | 0.043 |
| N2 (%mol) | 0.7462 | 0.7517 | 0.7573 | 0.7539 |
| O2 (%mol) | 0.1958 | 0.19 | 0.1872 | 0.2031 |
Table 8.
Simulated conditions for different Spark advance values.
| Case | 1 | 2 | 3 | 4 | 5 | 6 |
|---|---|---|---|---|---|---|
| Spark adv. (deg) | 10 | 6 | 8 | 12 | 14 | 16 |
| 1 | 1 | 1 | 1 | 1 | 1 | |
| EGR (%w) | 10 | 10 | 10 | 10 | 10 | 10 |
| Density @IGN (/) | 17.2 | 17.9 | 17.6 | 16.7 | 16.1 | 15.5 |
| Temperature @IGN () | 728.2 | 736.8 | 733.1 | 722 | 715 | 707.1 |
| H2 (%mol) | 0.058 | 0.058 | 0.058 | 0.058 | 0.058 | 0.058 |
| N2 (%mol) | 0.7462 | 0.7462 | 0.7462 | 0.7462 | 0.7462 | 0.7462 |
| O2 (%mol) | 0.1958 | 0.1958 | 0.1958 | 0.1958 | 0.1958 | 0.1958 |
Publisher’s Note: MDPI stays neutral with regard to jurisdictional claims in published maps and institutional affiliations. |
© 2021 by the authors. Licensee MDPI, Basel, Switzerland. This article is an open access article distributed under the terms and conditions of the Creative Commons Attribution (CC BY) license (http://creativecommons.org/licenses/by/4.0/).
Share and Cite
MDPI and ACS Style
La Civita, G.; Orlandi, F.; Mariani, V.; Cazzoli, G.; Ghedini, E. Numerical Characterization of Corona Spark Plugs and Its Effects on Radicals Production. Energies 2021, 14, 381. https://doi.org/10.3390/en14020381
AMA Style
La Civita G, Orlandi F, Mariani V, Cazzoli G, Ghedini E. Numerical Characterization of Corona Spark Plugs and Its Effects on Radicals Production. Energies. 2021; 14(2):381. https://doi.org/10.3390/en14020381
Chicago/Turabian StyleLa Civita, Giorgio, Francesco Orlandi, Valerio Mariani, Giulio Cazzoli, and Emanuele Ghedini. 2021. "Numerical Characterization of Corona Spark Plugs and Its Effects on Radicals Production" Energies 14, no. 2: 381. https://doi.org/10.3390/en14020381
Note that from the first issue of 2016, this journal uses article numbers instead of page numbers. See further details here.