Shape Influence of Active Material Micro-Structure on Diffusion and Contact Stress in Lithium-Ion Batteries


Department of Mechanical and Aerospace Engineering, Politecnico di Torino, Corso duca degli Abruzzi 24, 10129 Torino, Italy
*
Authors to whom correspondence should be addressed.
Energies 2021, 14(1), 134; https://doi.org/10.3390/en14010134
Submission received: 27 November 2020
/
Revised: 21 December 2020
/
Accepted: 23 December 2020
/
Published: 29 December 2020
(This article belongs to the Special Issue Performance Test and Thermo-Mechanical Modeling of Lithium Batteries)
Abstract
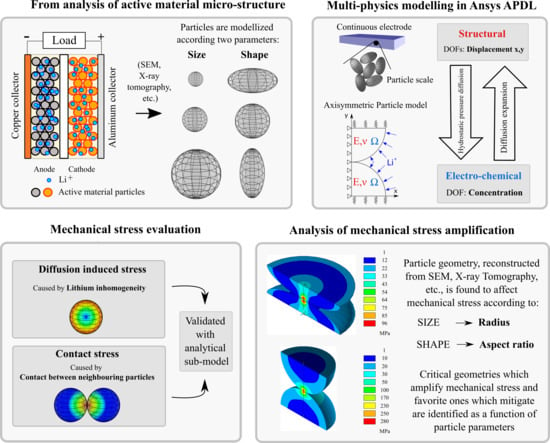
:Electrochemical-mechanical modelling is a key issue to estimate the damage of active material, as direct measurements cannot be performed due to the particles nanoscale. The aim of this paper is to overcome the common assumptions of spherical and standalone particle, proposing a general approach that considers a parametrized particle shape and studying its influence on the mechanical stresses which arise in active material particles during battery operation. The shape considered is a set of ellipsoids with variable aspect ratio (elongation), which aims to approximate real active material particles. Active material particle is divided in two domains: non-contact domain and contact domain, whether contact with neighbouring particles affects stress distribution or not. Non-contact areas are affected by diffusion stress, caused by lithium concentration gradient inside particles. Contact areas are affected simultaneously by diffusion stress and contact stress, caused by contact with neighbouring particles as a result of particle expansion due to lithium insertion. A finite element model is developed in Ansys™APDL to perform the multi-physics computation in non-spherical domain. The finite element model is validated in the spherical case by analytical models of diffusion and contact available for simple geometry. Then, the shape factor is derived to describe how particle shape affects mechanical stress in non-contact and contact domains.
1. Introduction
Lithium-ion batteries (LIB) play a strategical role in the actual green energy conversion, indeed they are the most widespread storage system of electrical energy so far, with a huge field of application: from small electronics up to heavy-duty vehicles [1,2].
Nowadays, the main challenge is to increase the amount of energy stored in the battery, working with simulations [3] on new materials which guarantee a greater nominal energy density (amount of energy stored per unit of weight) and ensuring that the nominal properties, such as capacity, power and internal resistance, could be kept through the whole life cycle as well. Indeed, complex ageing mechanisms [4] take place in lithium-ion batteries, damaging the cell itself and causing a reduction in the nominal properties.
Besides the electrochemical ageing mechanisms, the mechanical ones have a crucial role in battery damage [5], and they can be identified at the active material particles scale. Electrode manufacturing [6] consists in the mixing of active material powder (major content), binder, conductive components and additives to get the so-called wet slurry, which is then deposited on current collector and dried. In this manner, particles of the active material are embedded in a solid porous matrix, which is filled with electrolyte when battery is assembled. Insertion and extraction of lithium ions in active material during battery operation cause an inhomogeneous ions concentration in the active material particles which results in swelling and differential strain, causing mechanical stress. Differential strain causes the so-called diffusion-induced stress [7], and swelling causes contact stress between neighbouring particles [8]. In some cases, stress in the active material can overcome the yield stress and lead to pulverization and breakages, causing isolation of some portions of active material and crack growth, which combined with SEI precipitation concur in capacity fade [9]. In particular, the analysis of active material micro-structure shows the presence of small flaws even in the fresh material, known as pre-cracking. The flaws in fresh material are the nucleation points of cracks [10] induced by the mechanical stress computed in this paper. Therefore, the analysis of flaws size in electrode microstructure [11] is necessary to estimate how mechanical stress affect fractures growth. Moreover, the electrode manufacturing process itself can cause flaws during drying, thus new processes are being studied [6].
The study of mechanical ageing in LIB dates back to the works of Christensen and Newman [12], which established one of the first diffusion-induced stress (DIS) models applied to LIB, followed then by other authors [13,14]. The weaknesses of this type of model are the assumptions of perfectly spherical geometry and standalone particle. A more realistic approach should take into account the influence of the particle shape on the stress caused by lithium diffusion, and the contact stress which comes from the interaction with other particles.
Some works [15,16,17,18,19,20] focused their attention in computing the stress on real particle geometry reconstructed from SEM images, but the computation on a singular particle shape cannot be representative for a comprehensive study, neither be extended as an equivalent shape of a certain active material. Other works [13,21,22,23] considered ellipsoid as a representative particle shape for electrochemical-mechanical modelling.
Recently, Lu et al. [8] established an analytical framework to study the stress caused by the contact between spherical active material particles due to the their expansion during lithiation process. They showed that contact is the predominant source of mechanical stress, when compared to diffusion induced stress. The effect of matrix confinement was studied in all solid state battery [24] as well as in traditional batteries according to the porous electrode theory [25,26], but contact stress is not explicitly computed.
The aim of this paper is to deepen the role of particle shape on stress amplification and to describe the types of stress which arise in active material.
The particle is split in two domains: contact domain, affected by both diffusion and contact stress, and non-contact domain, affected by just diffusion stress, far enough from contact point to not be affected.
A set of ellipsoids with a parametrized aspect ratio is considered as an approximation of real particle shape. Then, shape factor, which describes the stress amplification compared to the spherical case, is deduced as a function of aspect ratio to estimate how the particle shape amplifies mechanical stress.
Mechanical stress is computed with a multi-physics FE model in Ansys APDL, capable of computing the lithium concentration inside the particle and the stress due to concentration gradient and contact with neighbouring particles. The FE model is validated in spherical geometry with analytical models of diffusion stress studied in a previous paper [7] and with Hertz theory. A dilute assumption is made in this paper, so stress generation due to phase transition [27,28,29] is neglected so far.
2. Equivalent Particle Shape
Most of the works presented in literature concerning DIS analysis in LIB address the domain problem according to two approaches. Active material particles are considered spherical according to the former [9,12,13,14], which is an acceptable approximation, allowing easier calculation and exploiting even analytical solutions [7]. Instead, real particle shape reconstructed from SEM images is considered for DIS calculation according to the latter [15,16,17,18,19,20].
The problem related to the first approach is that it neglects the effects of particle shape on the stress computation, as only spherical particles are considered. The weakness of the second approach concerns the representativity of the results of an analysis conducted over a single real particle geometry: the peculiarities of a single particle are unlikely to be extended to all the particles of the active material, even more so to other active materials particles.
Then, an equivalent geometry which approximates the average particle shape of the active material of interest must be chosen for a general study, which can be later applied to specific cases.
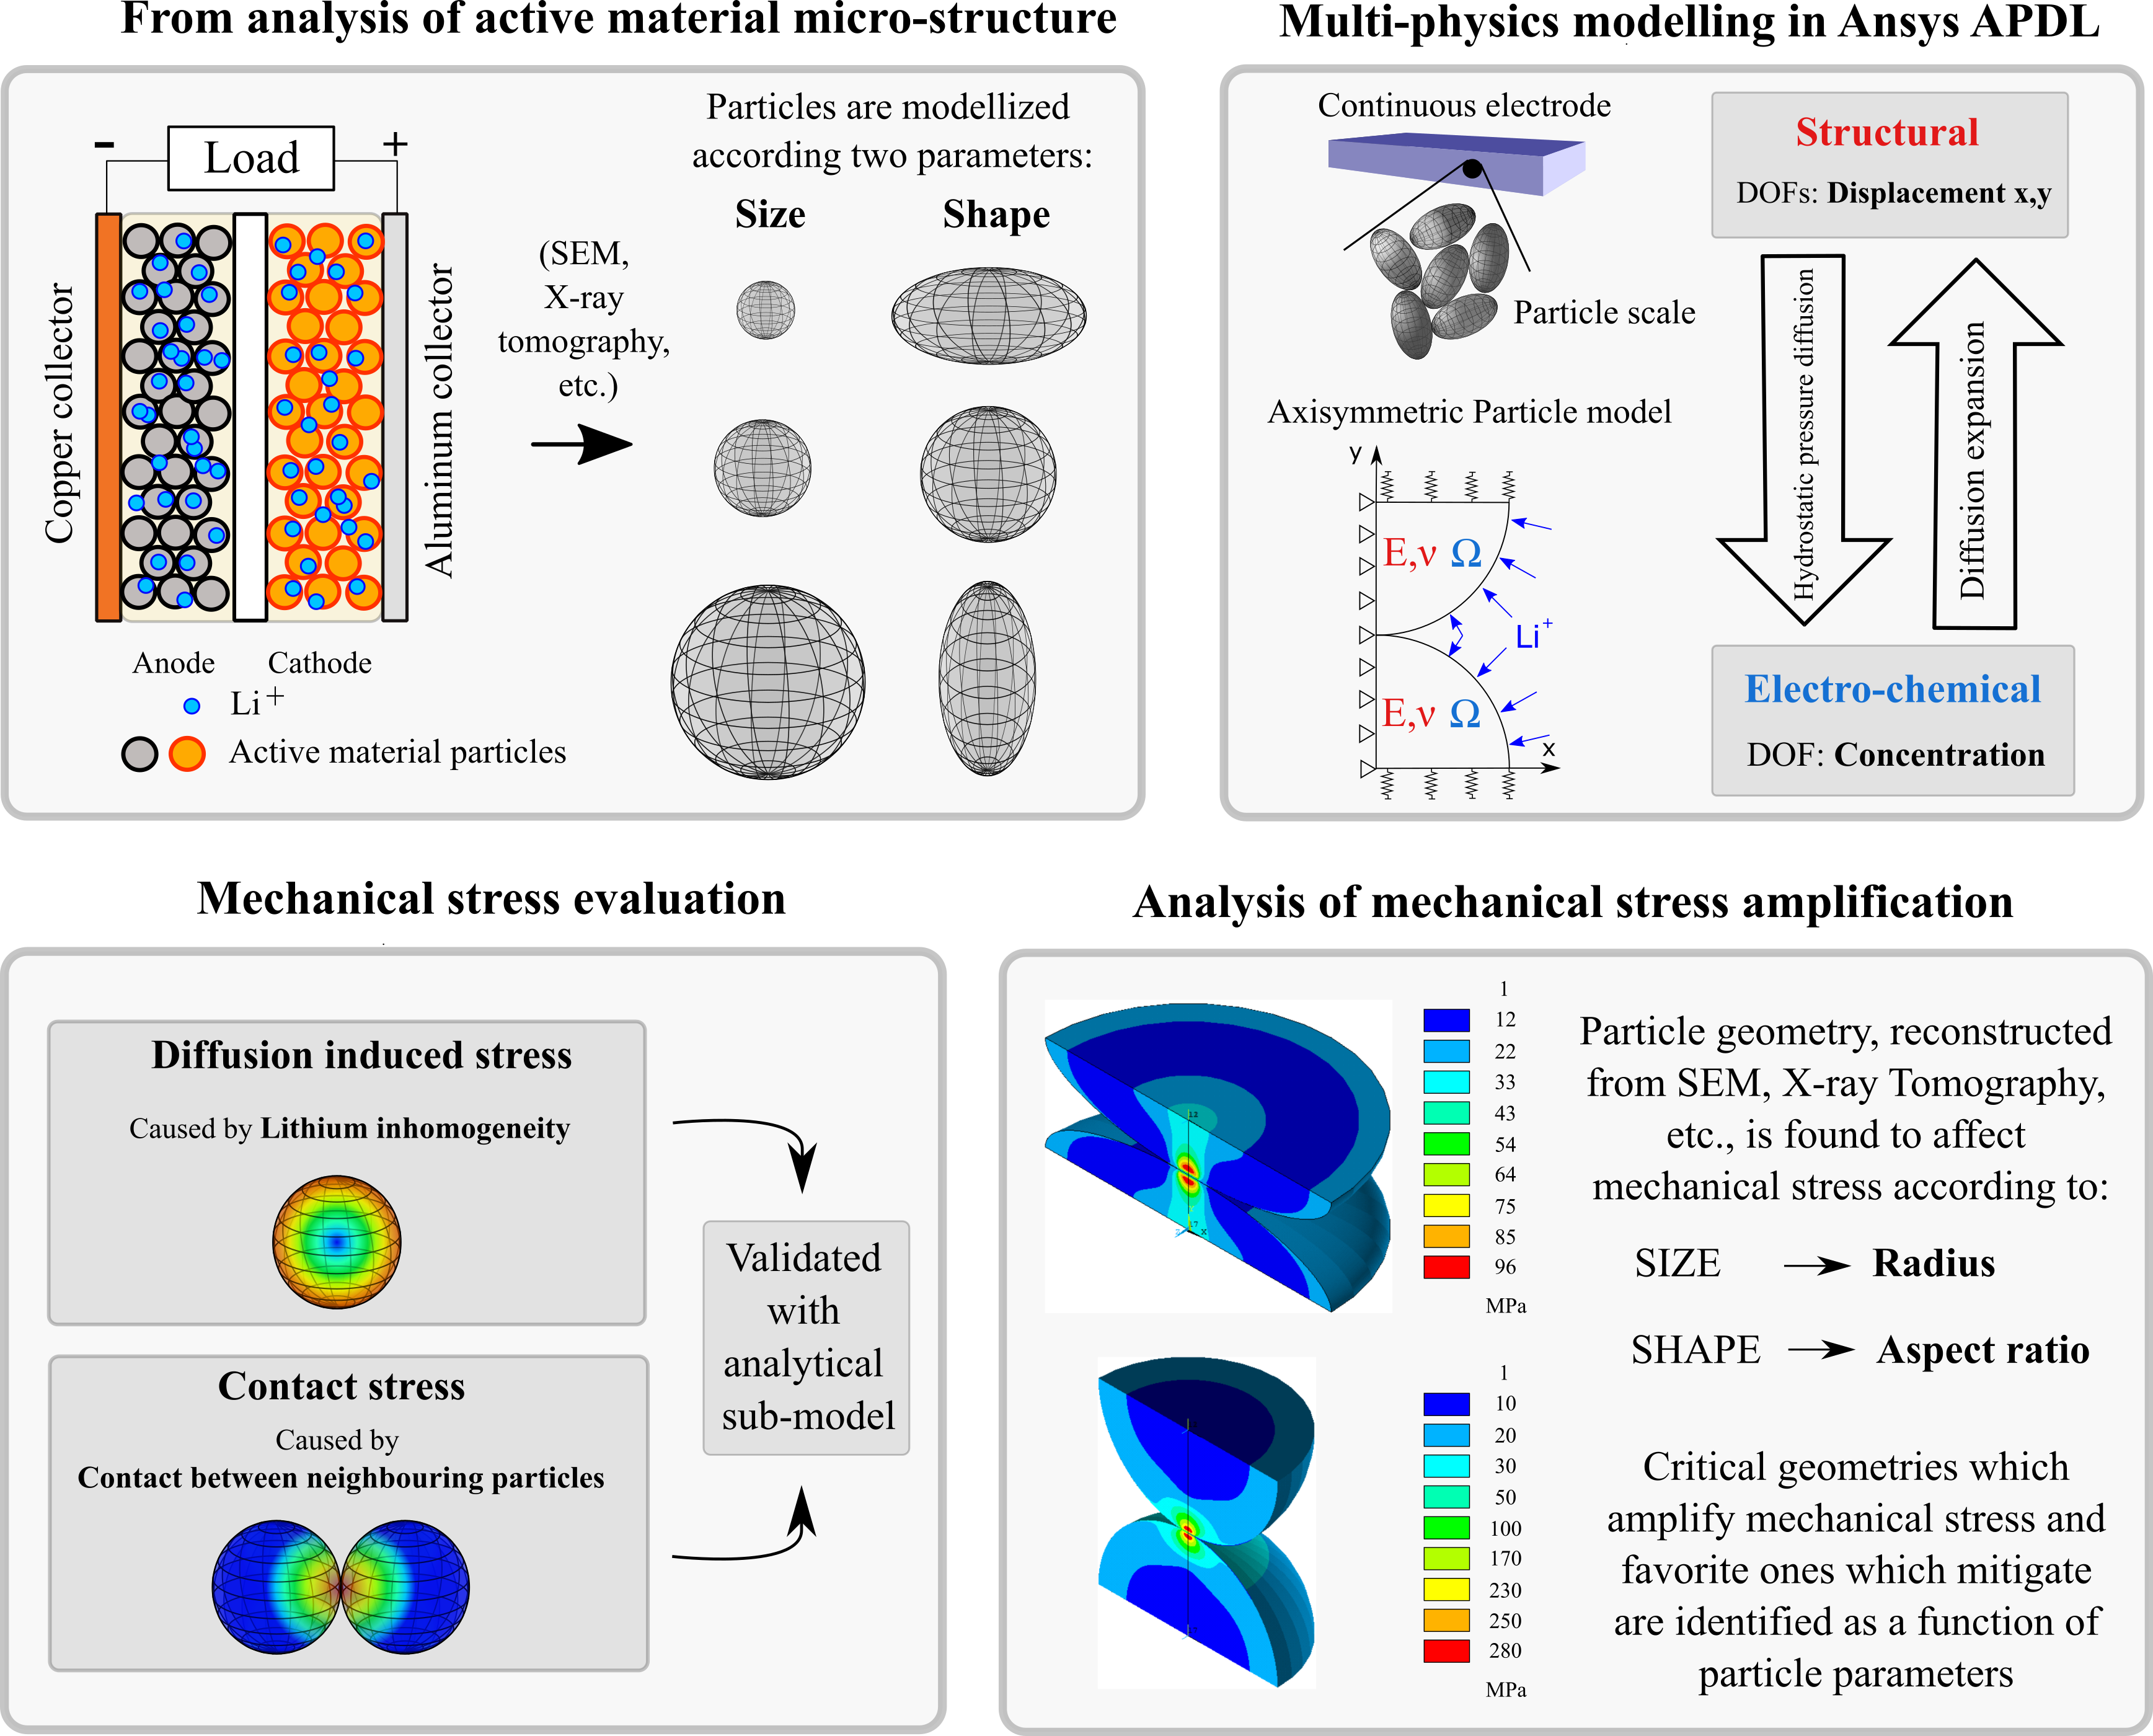
Ellipsoid, constructed as an axisymmetric semi-ellipse, is adopted as equivalent geometry in this paper, because it is a good trade-off between the accuracy of particle approximation and the possibility to get a geometry totally described by few parameters. The geometry problem can be divided in two issues: size and shape. Consequently, ellipsoid is defined by two parameters: radius and aspect ratio. The first parameter is equal the radius of the sphere when aspect ratio is equal to 1. It controls the size issue, which was addressed in a previous paper [7], where was showed that greater particles suffer greater diffusion stress [13,20]. The shape problem is addressed in this paper, and it is described by aspect ratio (), defined as the ratio between maximum and minimum ellipse semi-axes, as shown in Figure 1. In this paper, a fixed radius equal to 5 μm and a variable aspect ratio are considered. The condition followed to compute axes length is that aspect ratio has to be respected and the surface of the ellipsoid has to be equal to the surface of the reference sphere () with radius 5 μm. In this way the same amount of lithium, which is proportional to the battery state of charge (SOC), is stored in the particle with analysis carried out with the same simulation time and lithium flux (proportional to the (dis)charging rate of the cell). The particles of the active material of interest, captured with X-ray tomography [21] or using atomic force microscopy [19], are approximated choosing the proper aspect ratio and radius values [30], so that the equivalent ellipsoid circumscribes the average particle shape, as shown in Figure 1.
3. Multiphysics Modelling
Common active materials of LIBs, such as Lithium Manganese Oxide (LMO), Lithium Iron Phosphate (LFP), Lithium Nickel Cobalt Manganese Oxide (NMC) and Lithium Nickel Cobalt Aluminium Oxide (NCA) for cathode and Graphite, Silicon (with some exceptions) and Lithium titanate (LTO) for anode, are made of a matrix of micrometre particles which host and release lithium ions during battery operation [5,7,12,13,31].
Lithium ions cause a chemical strain when intercalated or deintercalated in active material particles, similar to thermal strain [7,13], which causes mechanical stress in turn. Lithium flux at the particle boundaries makes lithium ions diffuse from the surface to the core causing an inhomogeneous lithium concentration inside the particle. As active material particles expand proportionally to lithium content, the differential expansion of areas characterized by different lithium concentration causes the so called diffusion induced stress.
On the other hand, particles expansion causes the contact between neighbouring particles and gives rise to contact stress around the contact point due to the active material confinement.
The magnitude of diffusion-induced stress and contact stress have two different sources:
- Contact stress depends on the amount of inhibited displacement (), proportional to the amount of expansion which would occur if the particle was able to expand freely. The expansion of the particle surface does not depends on the distribution of the lithium concentration inside active material, but just on the amount of lithium stored in particle (K). Qualitatively, it is reasonable that higher lithium content causes greater particle expansion, and then the contact with neighbouring particles is stronger as a consequence.
- Diffusion induced stress depends uniquely on the concentration gradient: high differences in lithium content in the particle makes great differential strain which lead to high stress.
3.1. DIS Model
3.2. Hertz Model
Contact stress is implemented in the model of Section 3.1 to take into account the influence of surroundings on particle expansion. Considering liquid electrolyte, the interactions between neighbouring particles are the ones which lead to noteworthy contact stress, as binder and conductive material are much softer (lower Young modulus) and do not contribute to contact stress appreciably.
Contact stress is computed analytically for spherical geometry following the Hertz approach, resumed in this section. Then, the analytical theory validates the FE model algorithm embedded in the complete model in Section 3.3.
Particle expansion due to lithium insertion causes contact between particles, this means that the magnitude of the contact stress is proportional to the amount of lithium stored in the particle, as the greater the amount of lithium inserted, the greater the particle expansion. Then, contact stress is driven by the particle surface displacement, which depends on the parameters of the electrochemical simulation (simulation time and lithium flux), and the active material properties reported in Table 2.
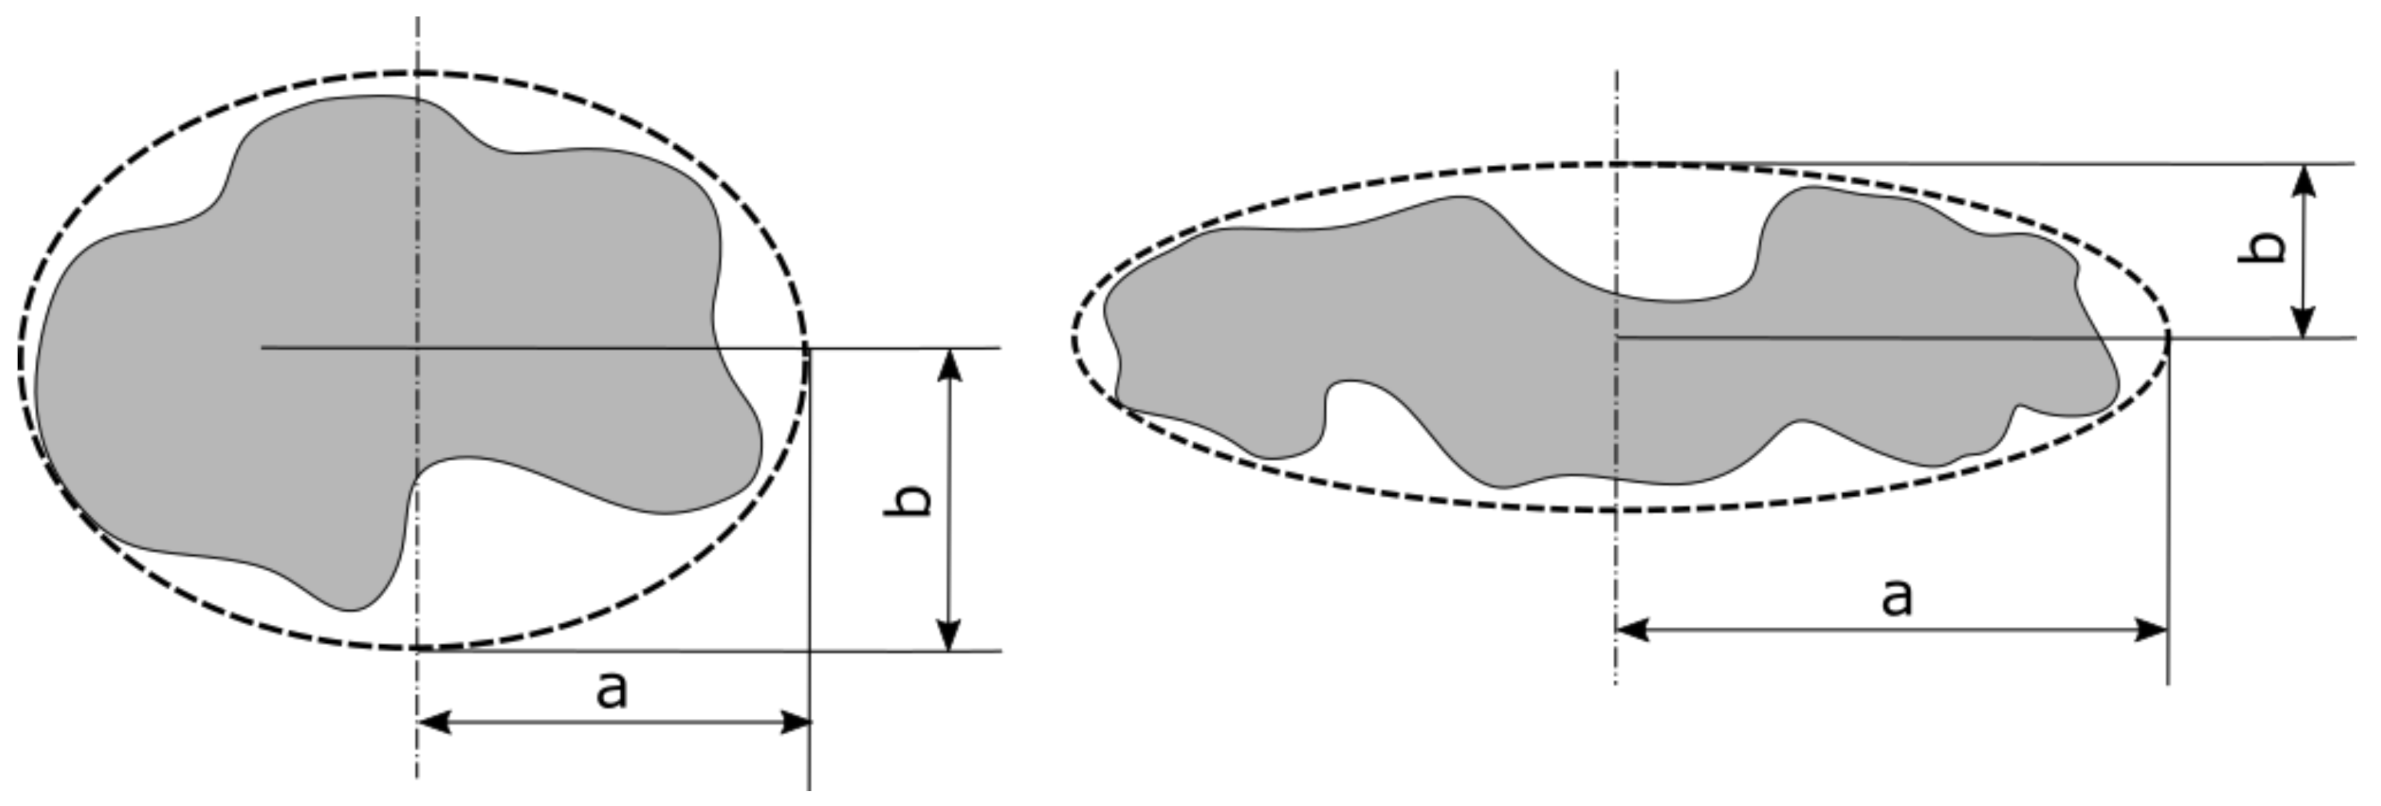
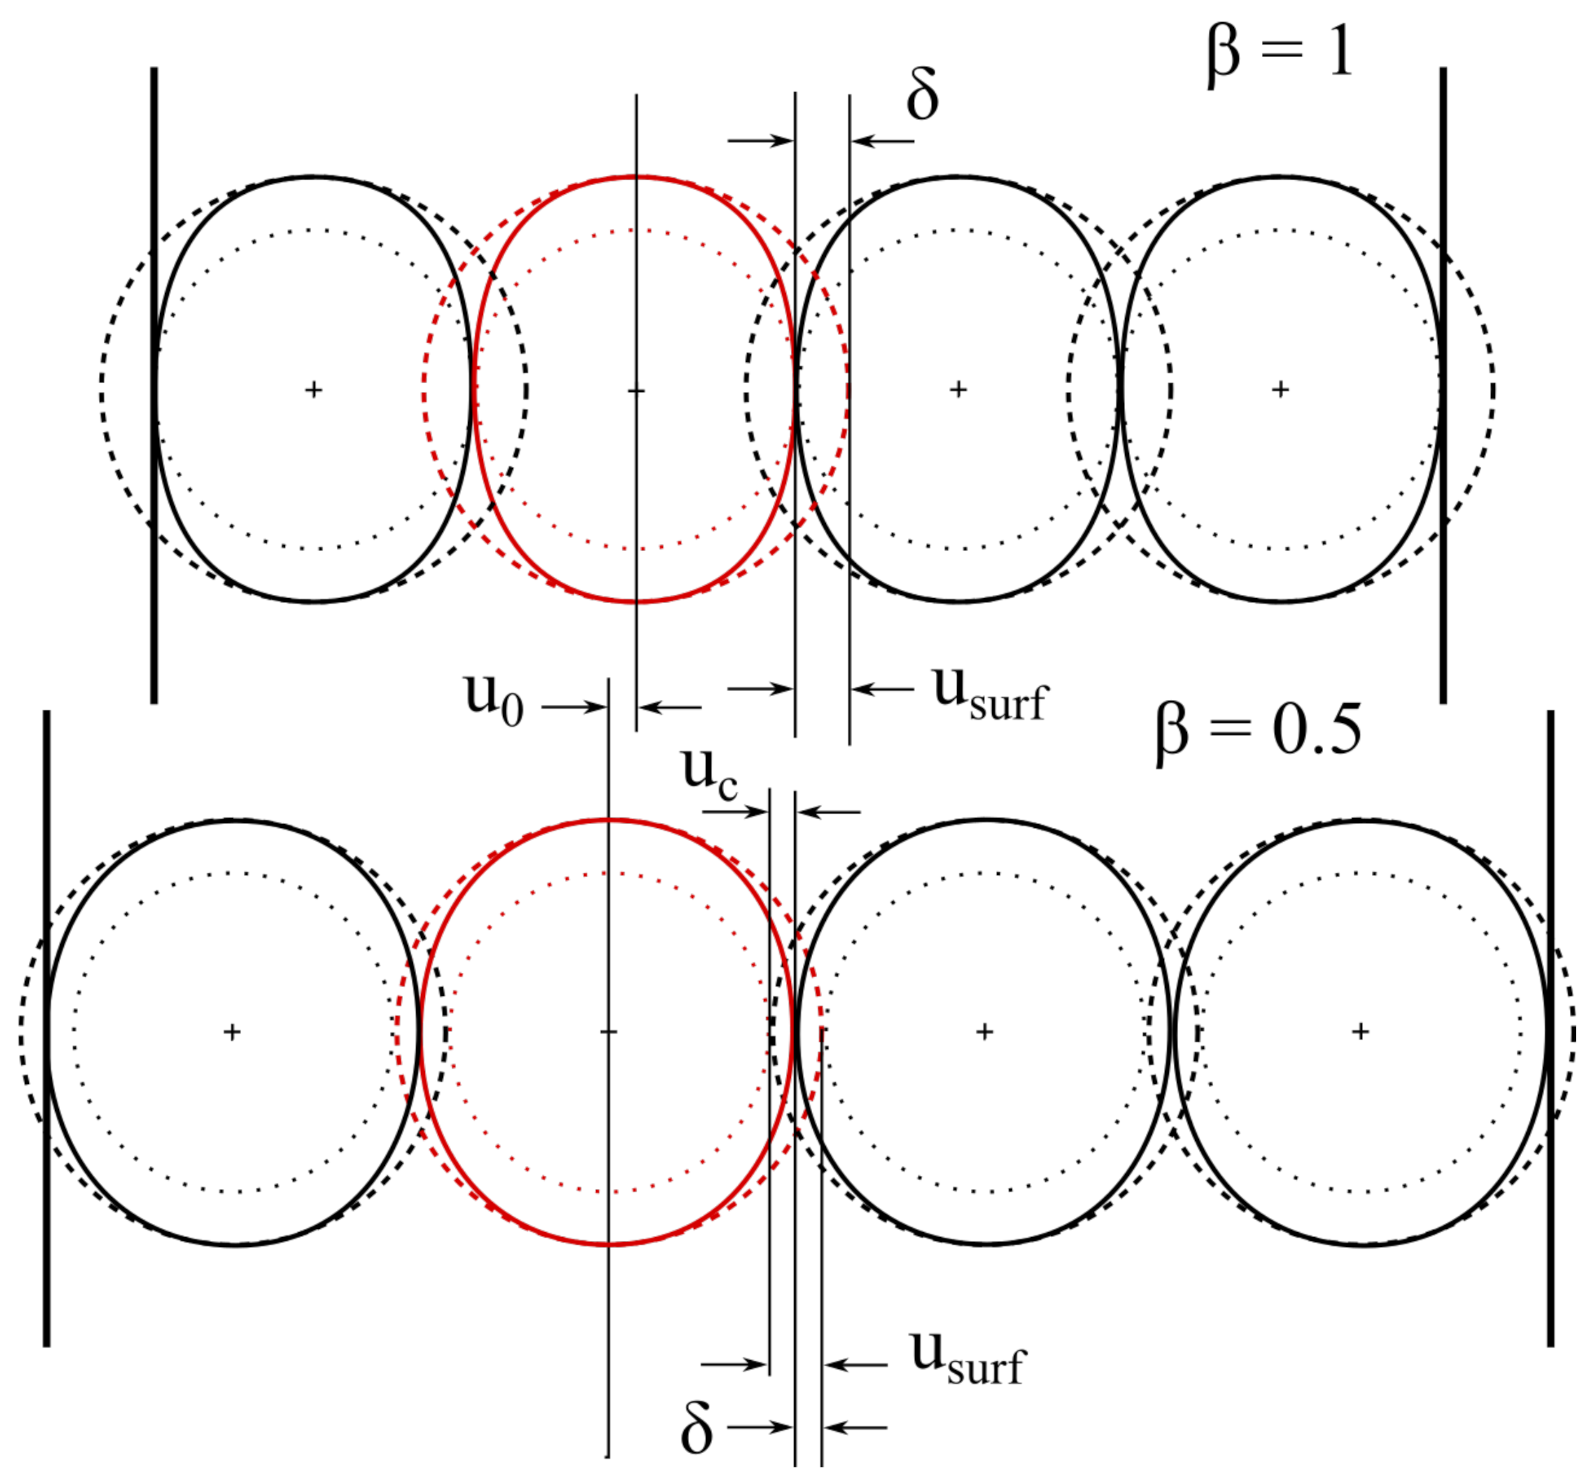
Referring to Figure 2, contact stress is caused by the amount of displacement inhibited by the neighbouring particles. As a first approximation, the boundary of the active material is considered infinitely rigid; this means that the active material layer does not expand and the centre of the particles is fixed, referring to the case in the upper part of Figure 2. In this scenario, the displacement , prevented by the surroundings, is identically equal to the displacement of the particle surface in free expansion condition (). On the contrary, if the edges of the active material layer expand, the centre of the spheres translates of a quantity to accommodate the particles deformation. This behaviour is described by the parameter in Equation (11), which is the ratio between the amount of displacement prevented by contact and the theoretical surface displacement due to lithium insertion without external constraints.
The case , which occurs when the displacement of the centre is equal to contact approach , is shown in the lower part of Figure 2.
The case is considered for sake of simplicity in all the simulations in this paper, but in general the prevented displacement is .
The displacement solution in free expansion of Table 1 is reported in Equation (13) as a function of dimensionless radius .
where and . Then, the displacement of the sphere surface () is reported in Equation (13).
where gives the percentage of lithium content in active material particle: it is equal to zero when no lithium is in the particle, and it is equal to one when lithium concentration approaches the solubility limit. K is the result of the electrochemical simulation and depends on the lithium flux applied on the particle surface (proportional to the C-rate) and on the simulation time (linked to the (dis)charging time), as well as on the electrochemical properties in Table 2.
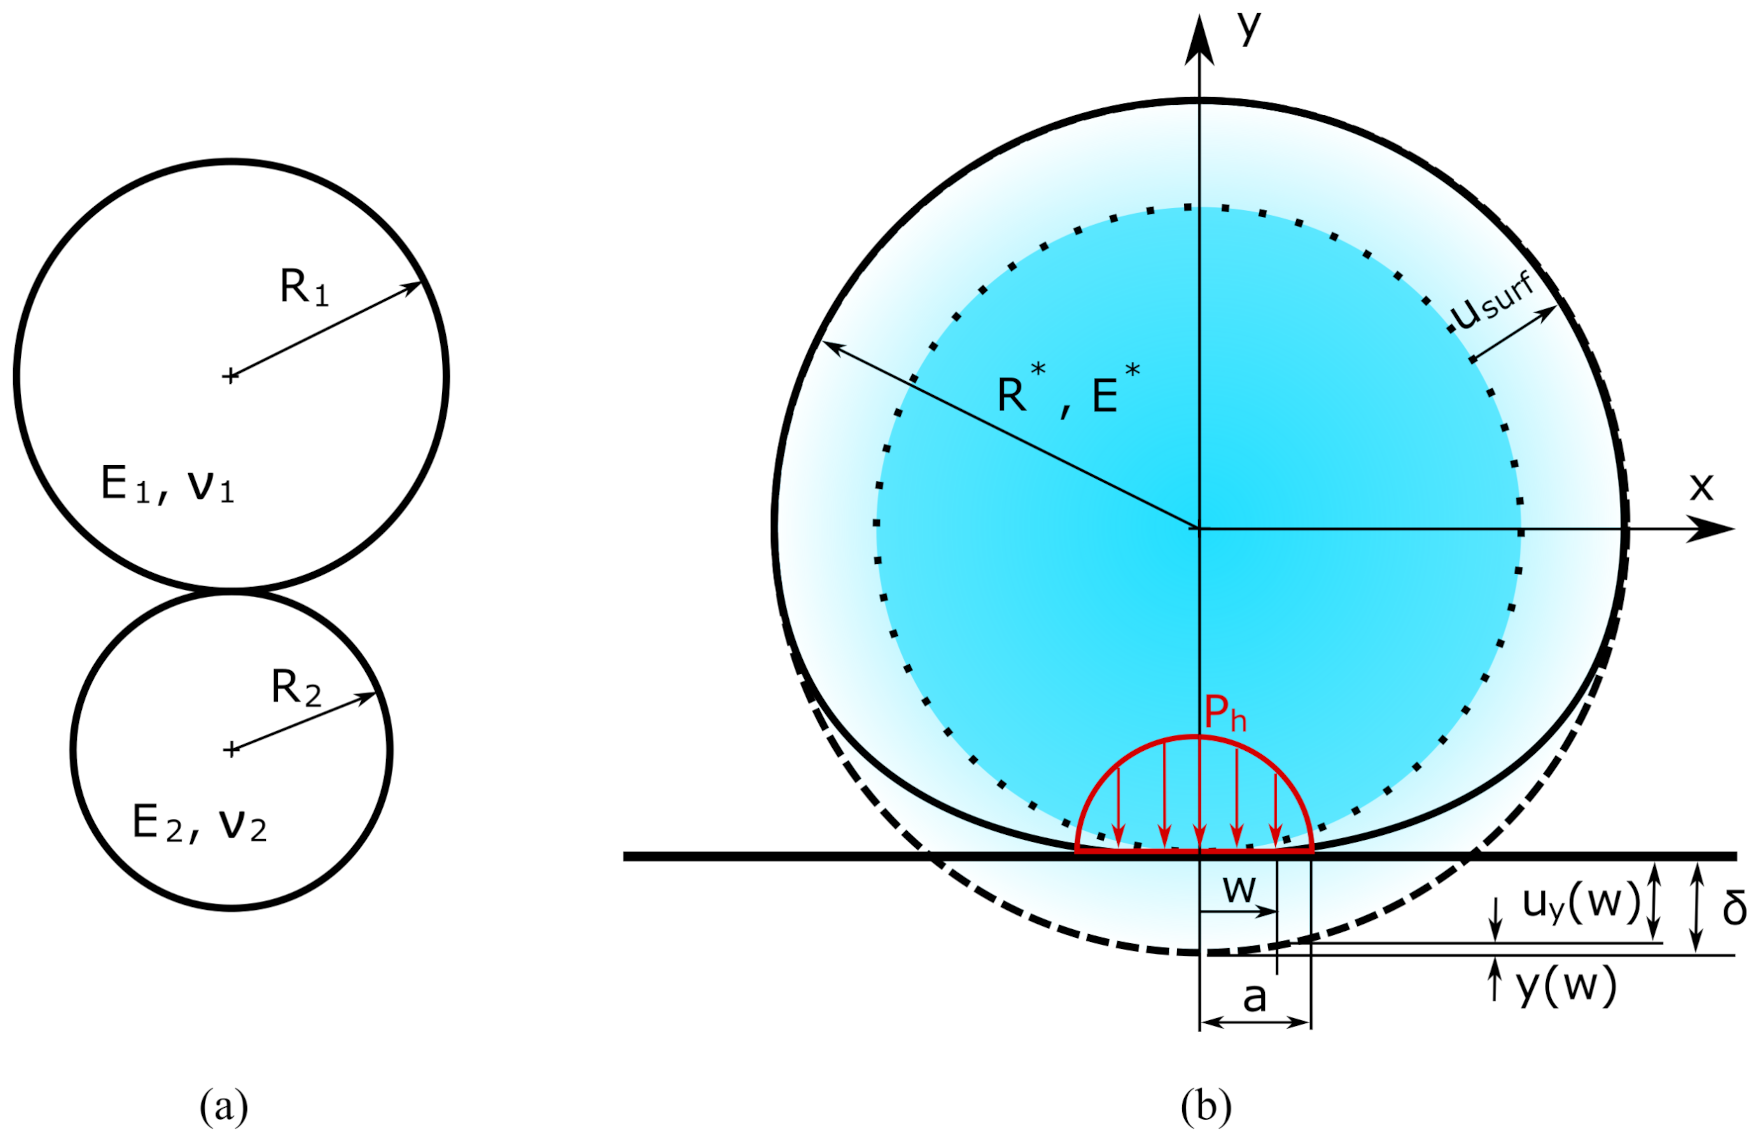
Assuming the contact between two particles as sketched in Figure 3a, the equivalent configuration in Figure 3b is studied, where the sphere, characterized by the equivalent mechanical properties and radius of Equation (14), comes in contact with a rigid half space surface.
For our purpose, the two spheres in contact are supposed to be equivalent, so . The normal contact approach represents the displacement of the surface due to contact stress compared to free condition, and it is expressed in Equation (15), referring to Figure 3.
where is the elastic displacement of the surface, and is the original surface separation inside the contact area. According to Hertz theory [32], the surface displacement in the contact area is reported in Equation (16).
The values of the elastic displacement at the centre and at the surface of the sphere are replaced in Equation (17) using Equation (15).
Then, the radius of contact area (a) and maximum contact pressure () are derived in Equations (18) and (19), respectively, solving the set of Equation (17).
Contact force is derived in Equation (20) from the maximum pressure .
In the end, contact stresses inside the elastic body are computed in Equation (21) [32], considering the sketch of Figure 3 for evaluating the Cartesian tensor. In general, the first principal stress is equal to the two circumferential stresses, and the third principal stress is the radial one.
where is defined as ratio between the depth below the contact point and the radius of the contact area: .
3.3. FE Multiphysics Model
In this section, mechanical stress and lithium concentration are computed simultaneously in a coupled electrochemical-mechanical FE model in Ansys APDL. The model is implemented according to the migration model (tb,migr command in Ansys APDL), considering lithium concentration and hydrostatic stress as driving forces of lithium diffusion. Therefore, the model is a coupled multiphysics problem, as lithium concentration, governed by diffusion equations (Equations (4)–(6)), causes mechanical stress (Equations (1) and (21)), that in turn affects lithium diffusion and thus concentration distribution [7]. The geometry is modelled with the bidimensional plane element “Plane223” in axisymmetric mode, which have three degrees of freedom according to the structural-diffusion nature of the problem: displacements along x and y and lithium concentration. Contact elements “Conta172” and “Targe 169” are used to simulate contact between the particles surfaces.
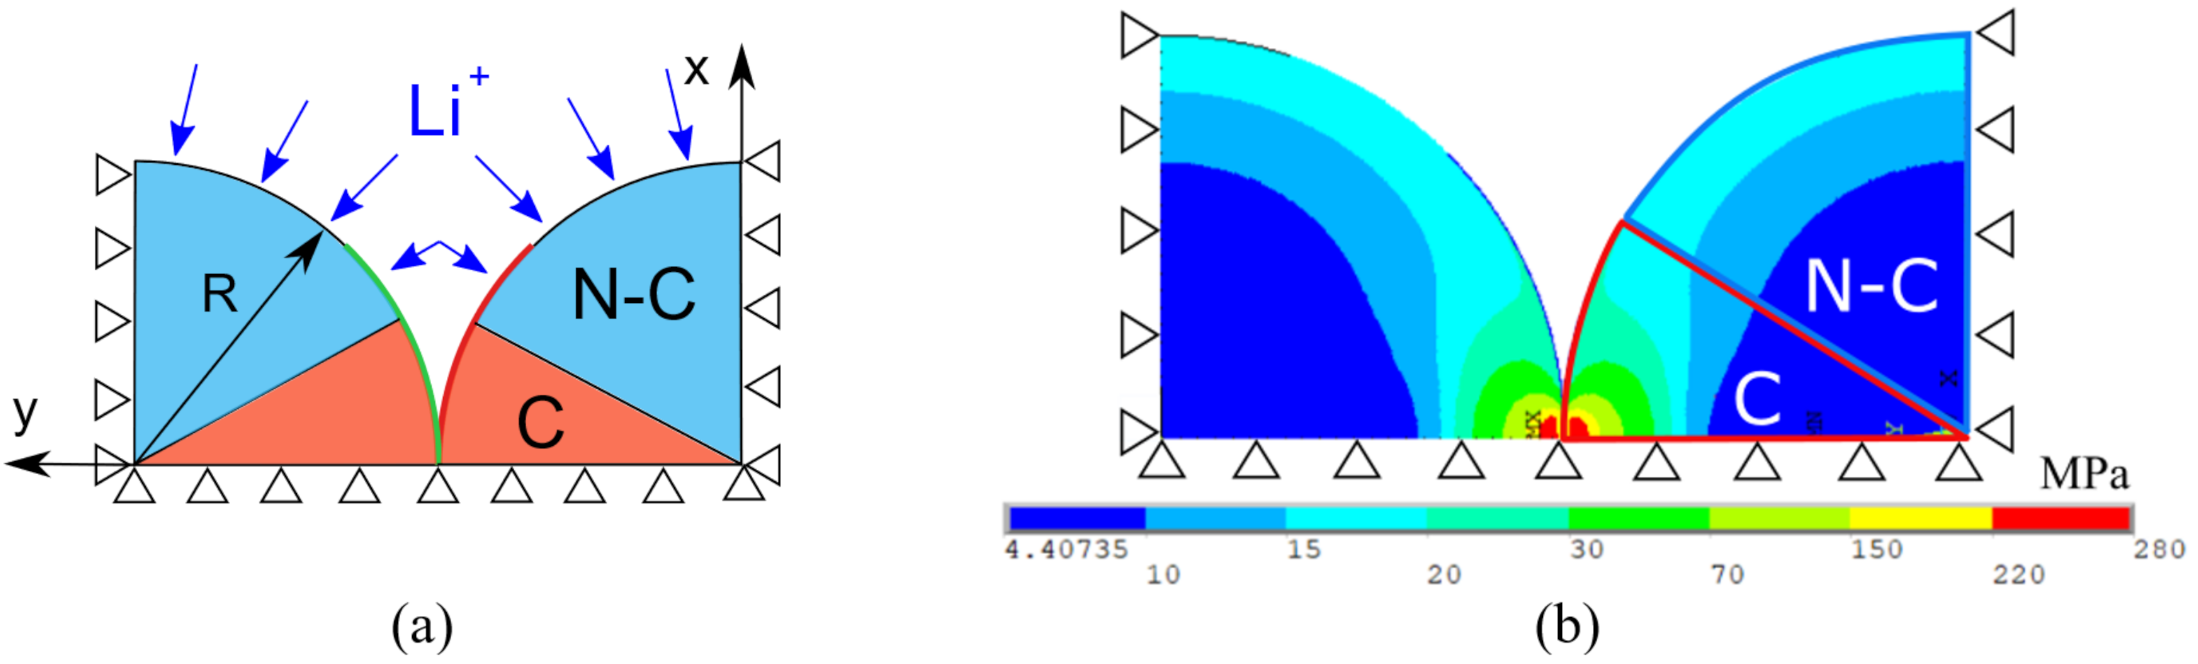
The axisymmetric section of two half particles in contact is modelled as shown in Figure 4, thanks to the symmetry around mid-plane. Figure 4b shows the reason behind the division in contact and non-contact domains: contact alters the stress distribution in the contact domain, even away from the contact area. On the contrary, the non-contact domain is far enough from contact point and the stress distribution due to diffusion is not affected. The model is mechanically constrained so that rigid body motion is prevented and the condition of infinity stiffness of active material layer () is satisfied, as showed in Figure 4a. Finally, constant lithium flux is applied to particles surfaces as electrochemical boundary condition to simulate galvanostatic operation.
4. Results
The validation of FE multiphysics model with analytical models in spherical geometry is shown in this section, then the results in contact and non-contact domain are presented along with the shape factor which highlights the effect of particle shape on mechanical stress.
4.1. FE Sub-Models Validation
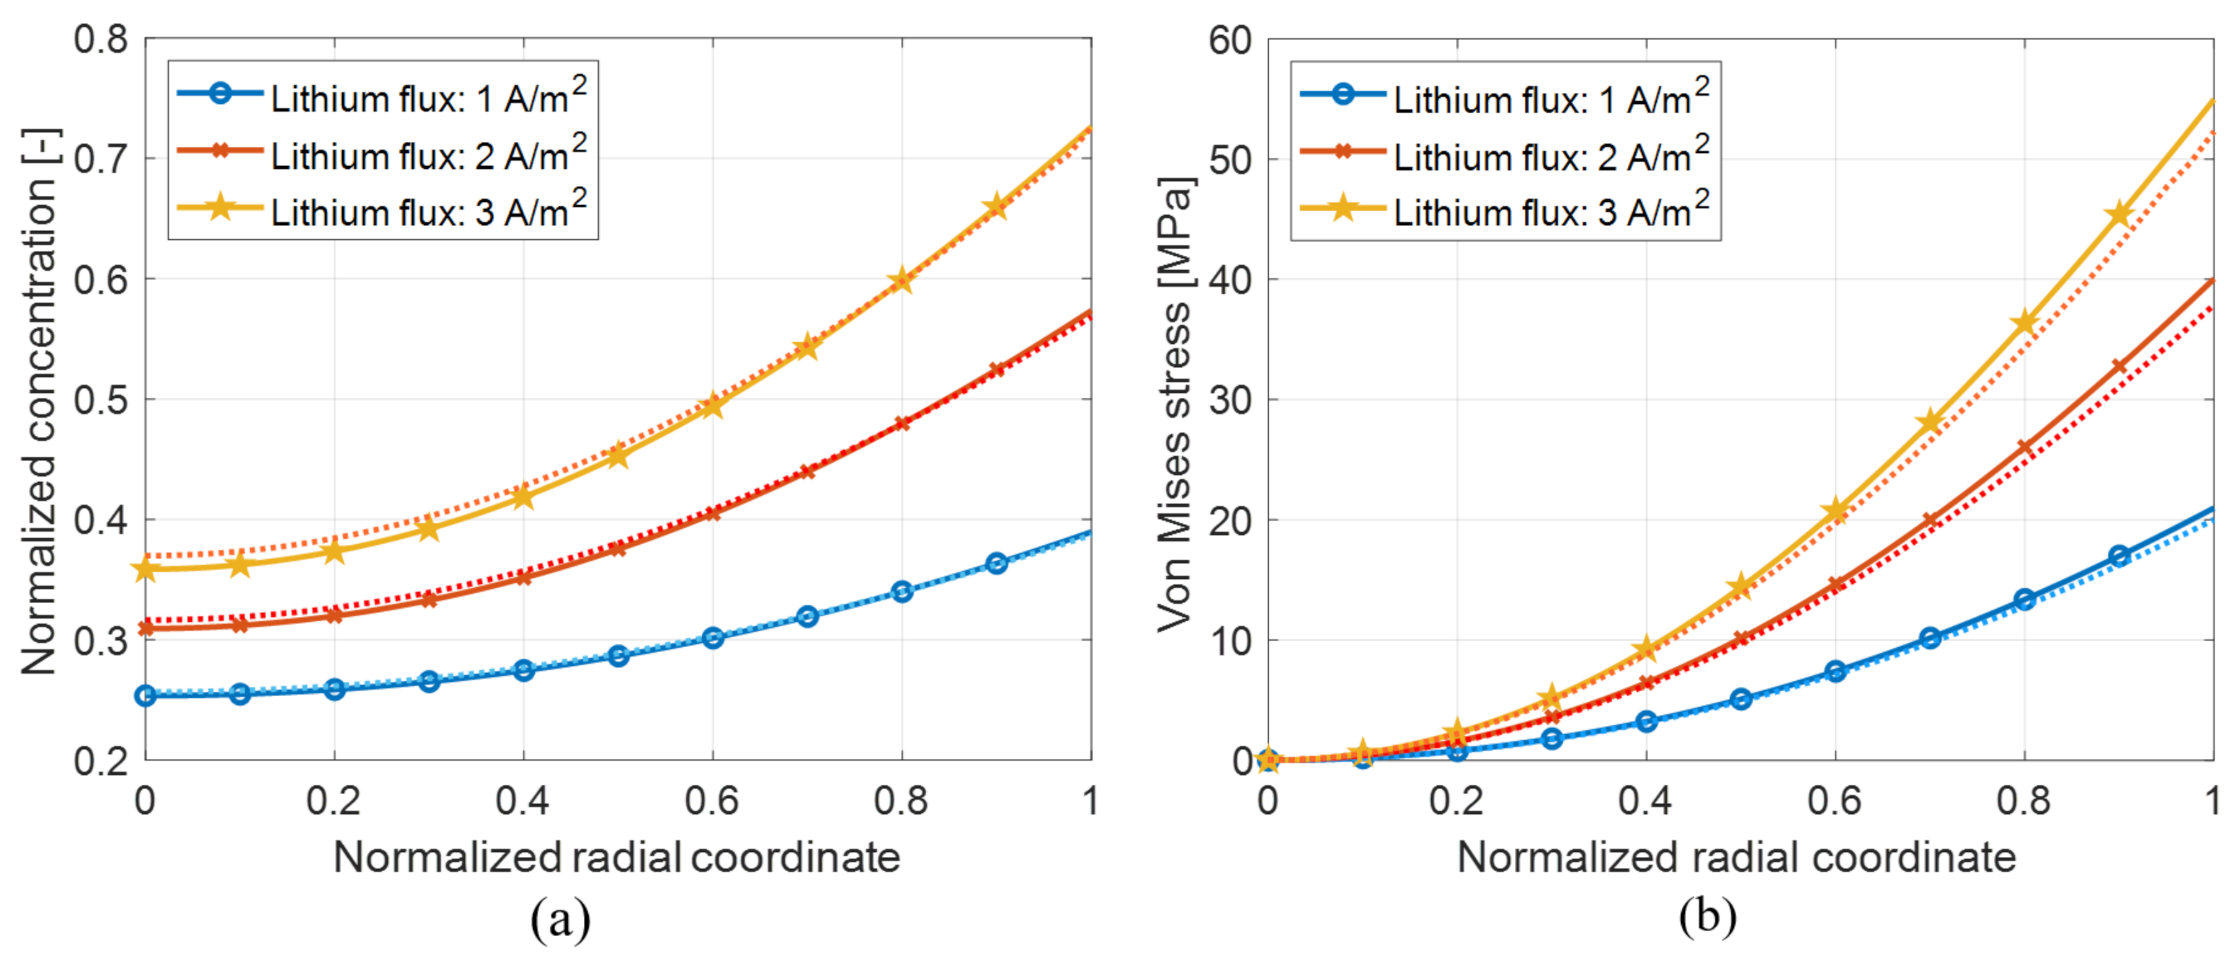
First, the computation of diffusion induced stress with the dedicated FE sub-model is validated. The results got through FE modelling in spherical geometry without contact contribution are compared with the analytical results of a previous study [7] in Figure 5 at different lithium flux. The results of Figure 5 validate the FE sub-model, which is expected to estimate correct results even in non-spherical geometry. Furthermore, the effect of boundary lithium flux is pointed out: greater flux causes steeper concentration gradient inside the particle (Figure 5a), which causes greater diffusion stress in turn (Figure 5b).
Then FE contact sub-model is validated following the approach of Figure 6a: the model is similar to the general multiphysics model of Section 3.3, but this sub-model predicts just contact stress related to a specific electrochemical condition.
The main differences with the model of Section 3.3 are the mechanical constraints and the external input. The constraints of the sub-model prevents rigid body motion and allow the displacement along y direction, where contact occurs.
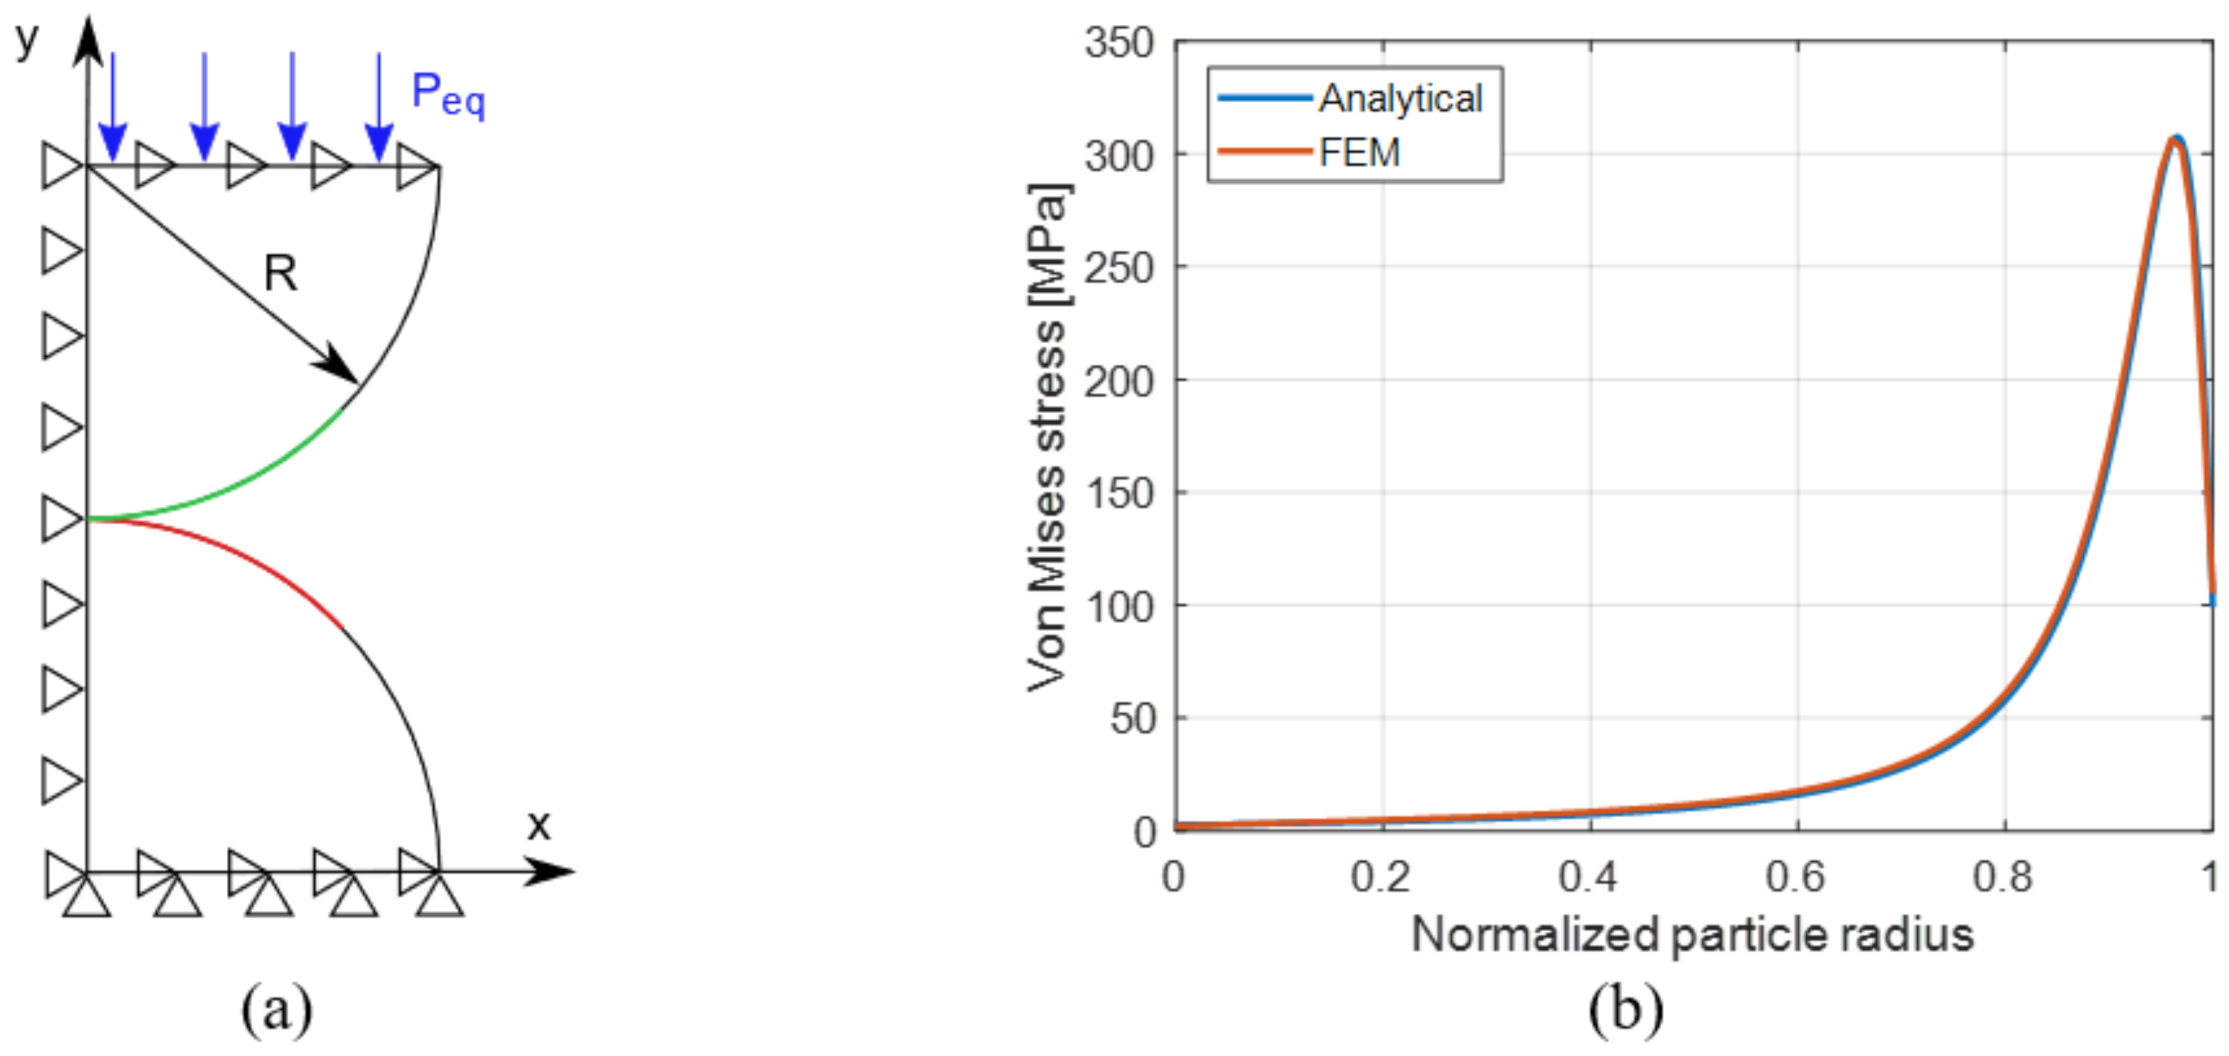
The input of this model is the displacement imposed at the particle surface, which results from the electrochemical-mechanical simulation of Table 1. Contact force caused by displacement , derived with the Hertz model of Section 3.2, is assigned both to FE sub-model and analytical model as boundary condition, instead of the lithium boundary flux. Actually, a distributed equivalent pressure so that is assigned to the upper edge of the hemisphere which is free to move in vertical direction, as shown in Figure 6a. As pointed out in Section 3.2, contact stress depends just on the particle expansion , which depends on the amount of lithium ions stored in the particle (K), which is the result of the combination of lithium flux and simulation time.
Contact is simulated with penalty function algorithm, with a contact stiffness equal to 5 N/mm, that, after some tries, it is found to guarantee no surfaces penetration and a reasonable computing time.
The comparison between analytical and FE sub-model results in Figure 6b are satisfactory and validate the contact algorithm of the FE sub-model.
Following this procedure, the contact FE sub-model gives two important results:
- a
- The contact algorithm is validated by the analytical model of Section 3.2 as shown in Figure 6b, so the effectiveness of the model is confirmed and can be incorporated in the electrochemical-mechanical FE model which aims to compute diffusion induced and contact stress simultaneously.
- b
- The contact stress due to a specific electrochemical operation is computed, independently from diffusion induced stress.
4.2. Coupling Effect
The multiphysics problem of Section 3.3 can be expressed according two approaches: coupled and uncoupled, whether mechanical stress influence on lithium diffusion is considered or not. The coupling resides in the expression of lithium flux (Table 1), and it is expressed in the uncoupled and coupled form in Equations (22) and (23) accordingly.
Concentration gradient is the only driving force in the uncoupled formulation. On the contrary, lithium diffusion depends on the gradient of concentration and hydrostatic stress in the case of coupled problem:
- Lithium diffuses from areas with higher concentration to areas with lower concentration. For this reason, lithium diffuses towards the core of the particle (negative lithium flux in Equation (23)) when the derivative of concentration is positive, according to Equation (23).
- Lithium diffuses from areas with low hydrostatic stress to areas with higher hydrostatic stress, assuming negative stress as compression and positive as tensile. Namely, the diffusion of lithium ions is enhanced from compression areas to tensile (or lower compression) areas. For this reason, a negative derivative of hydrostatic stress enhances lithium diffusion inside the particle (negative lithium flux) according to Equation (23).
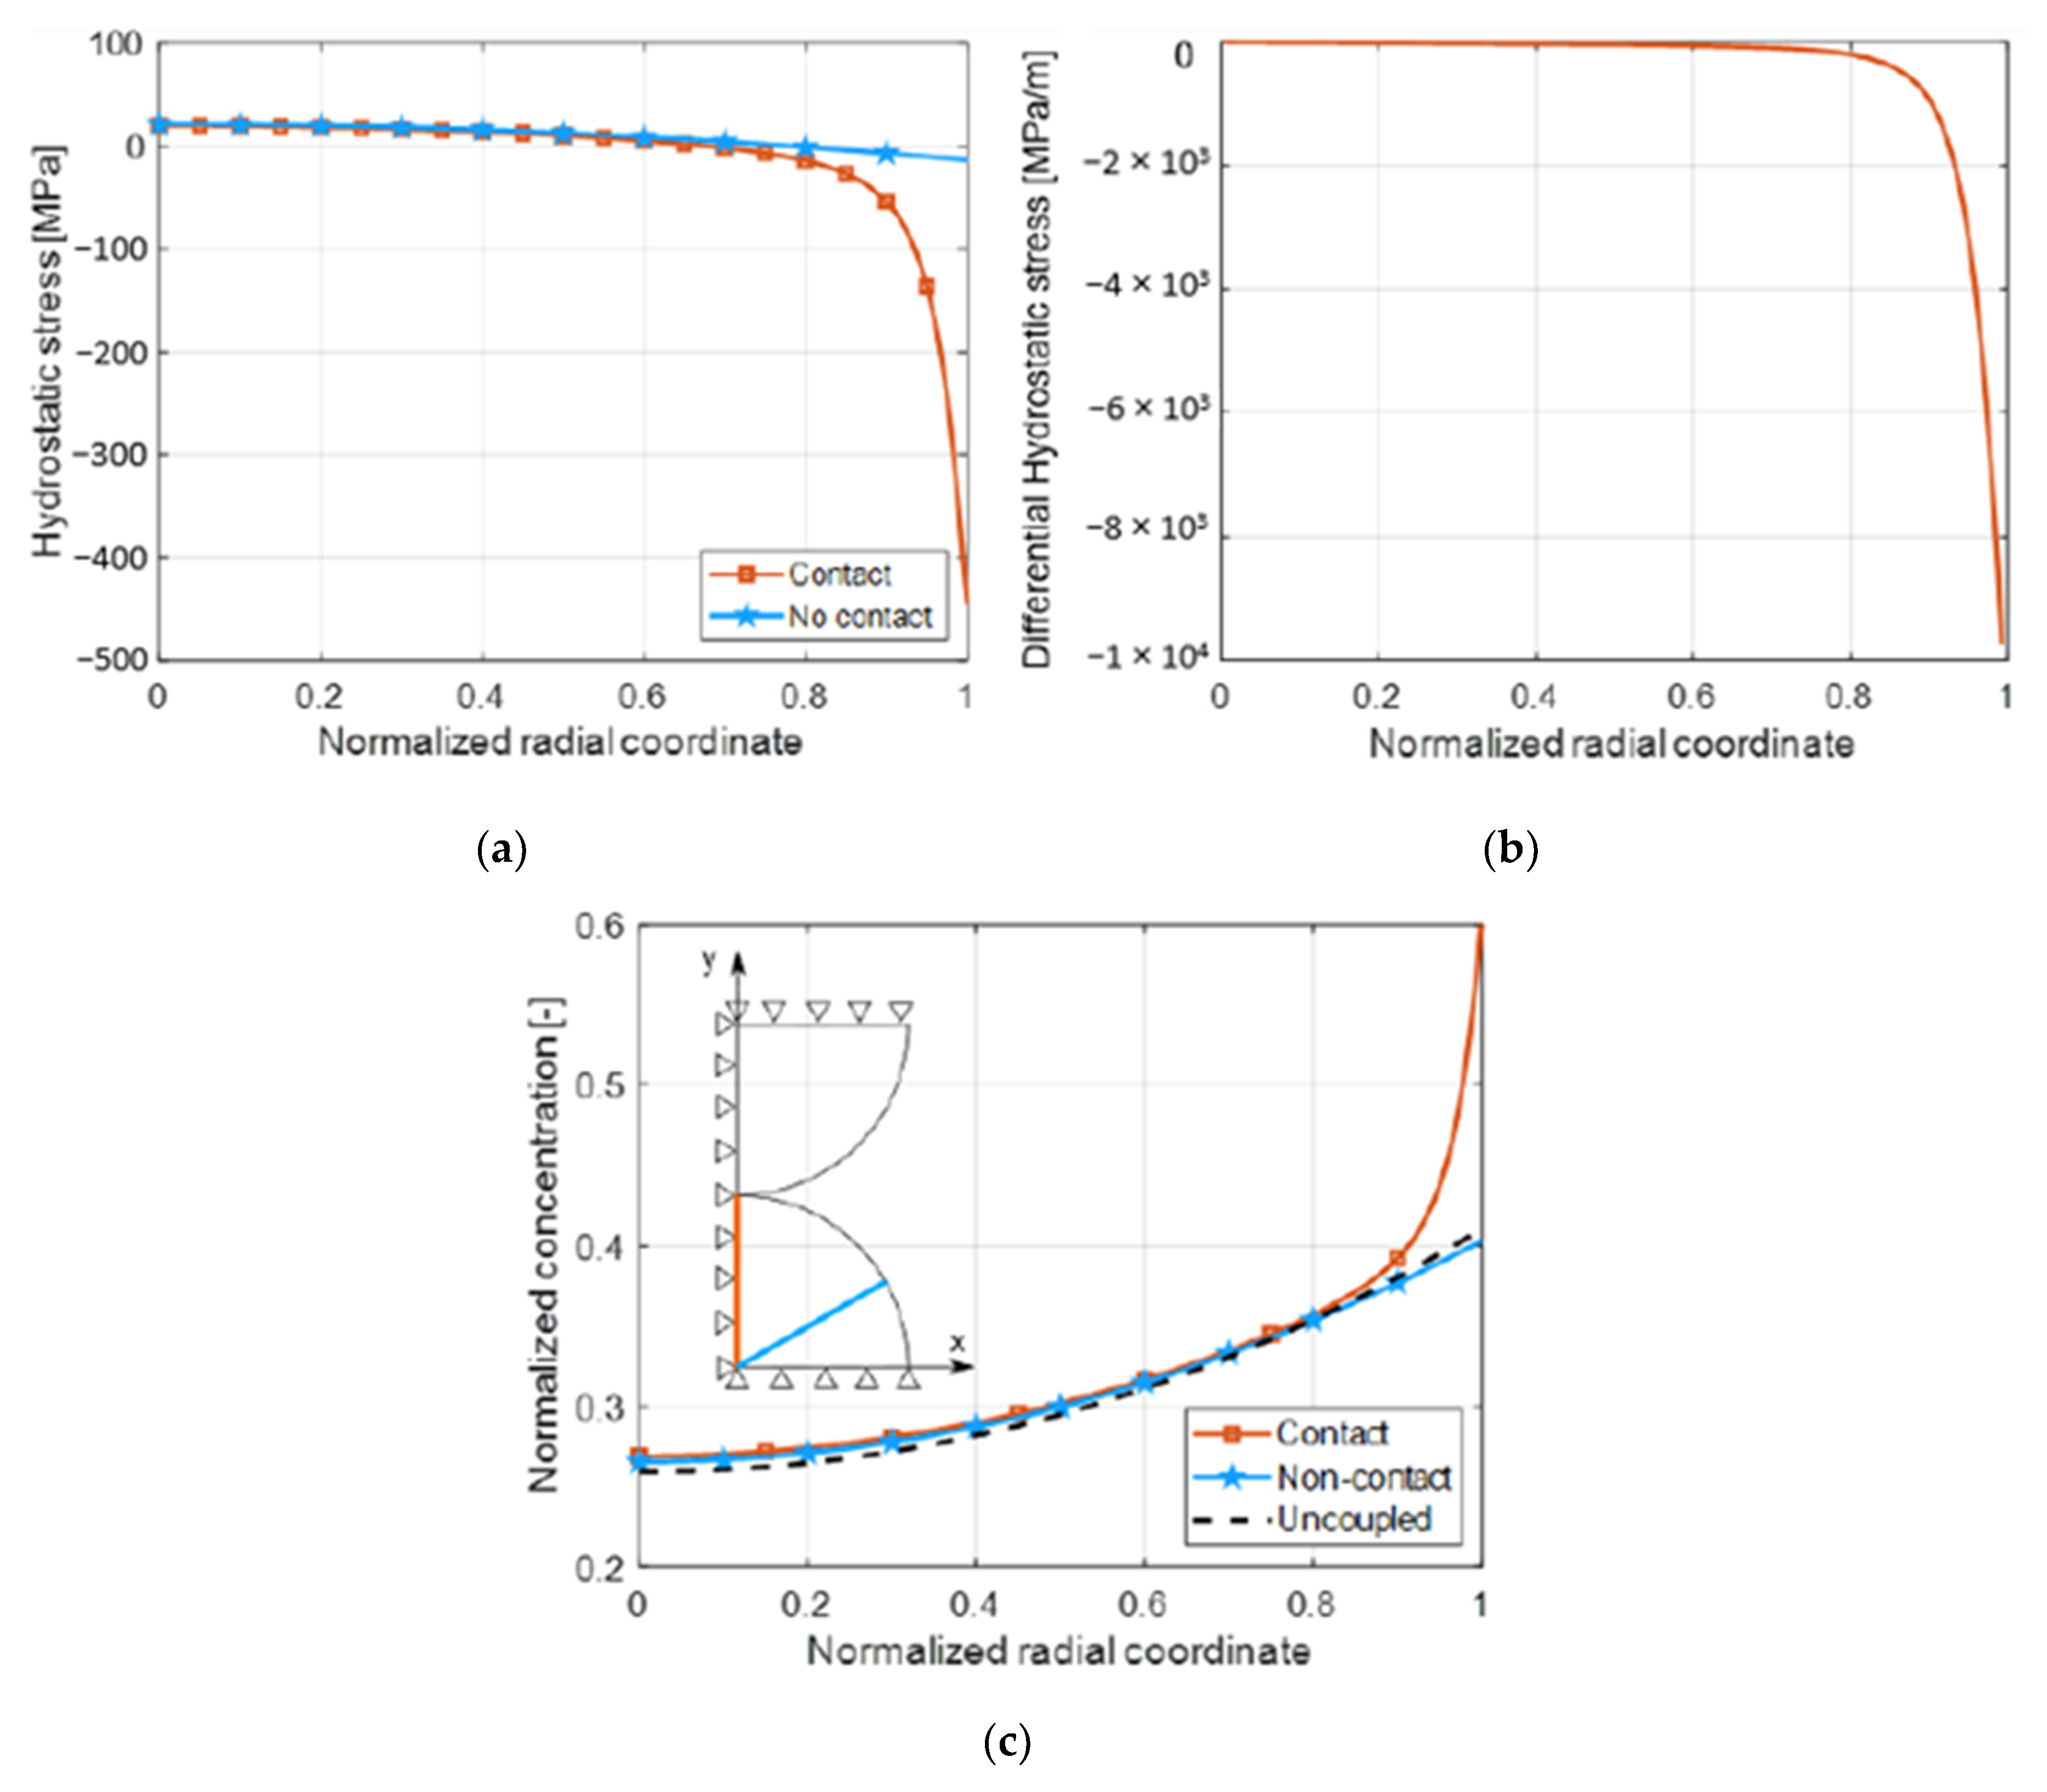
The hydrostatic stress is computed in non-contact areas and in contact areas together with its derivative with respect to radial coordinate in Figure 7a,b. The plot of Figure 7a highlights the stress contribution to lithium diffusion in non-contact and contact areas. The slight increase in hydrostatic stress from the surface towards the core of the particle when contact does not occur slightly enhances lithium diffusion all over the particle with respect to the uncoupled model [7], since the stress derivative is slightly negative, as shown by the comparison of blue and black dashed lines in Figure 7c.
On the other hand, the sharp hydrostatic stress gradient close to the contact point () causes a huge decrease of stress derivative (Figure 7b), then hydrostatic stress gives a substantial contribution to lithium flux in this area, according to Equation (23). The greater lithium flux in the external part of the particle causes an increase of lithium concentration in this area, as shown in Figure 7c.
The coupling between mechanical stress and lithium diffusion, which was already remarkable with diffusion stress alone [7], becomes substantial in the areas where contact occurs. Indeed, the steeper concentration gradient close to contact point causes higher diffusion stress, and the higher lithium content causes a greater expansion of particle surface, which results in greater contact stress in turn.
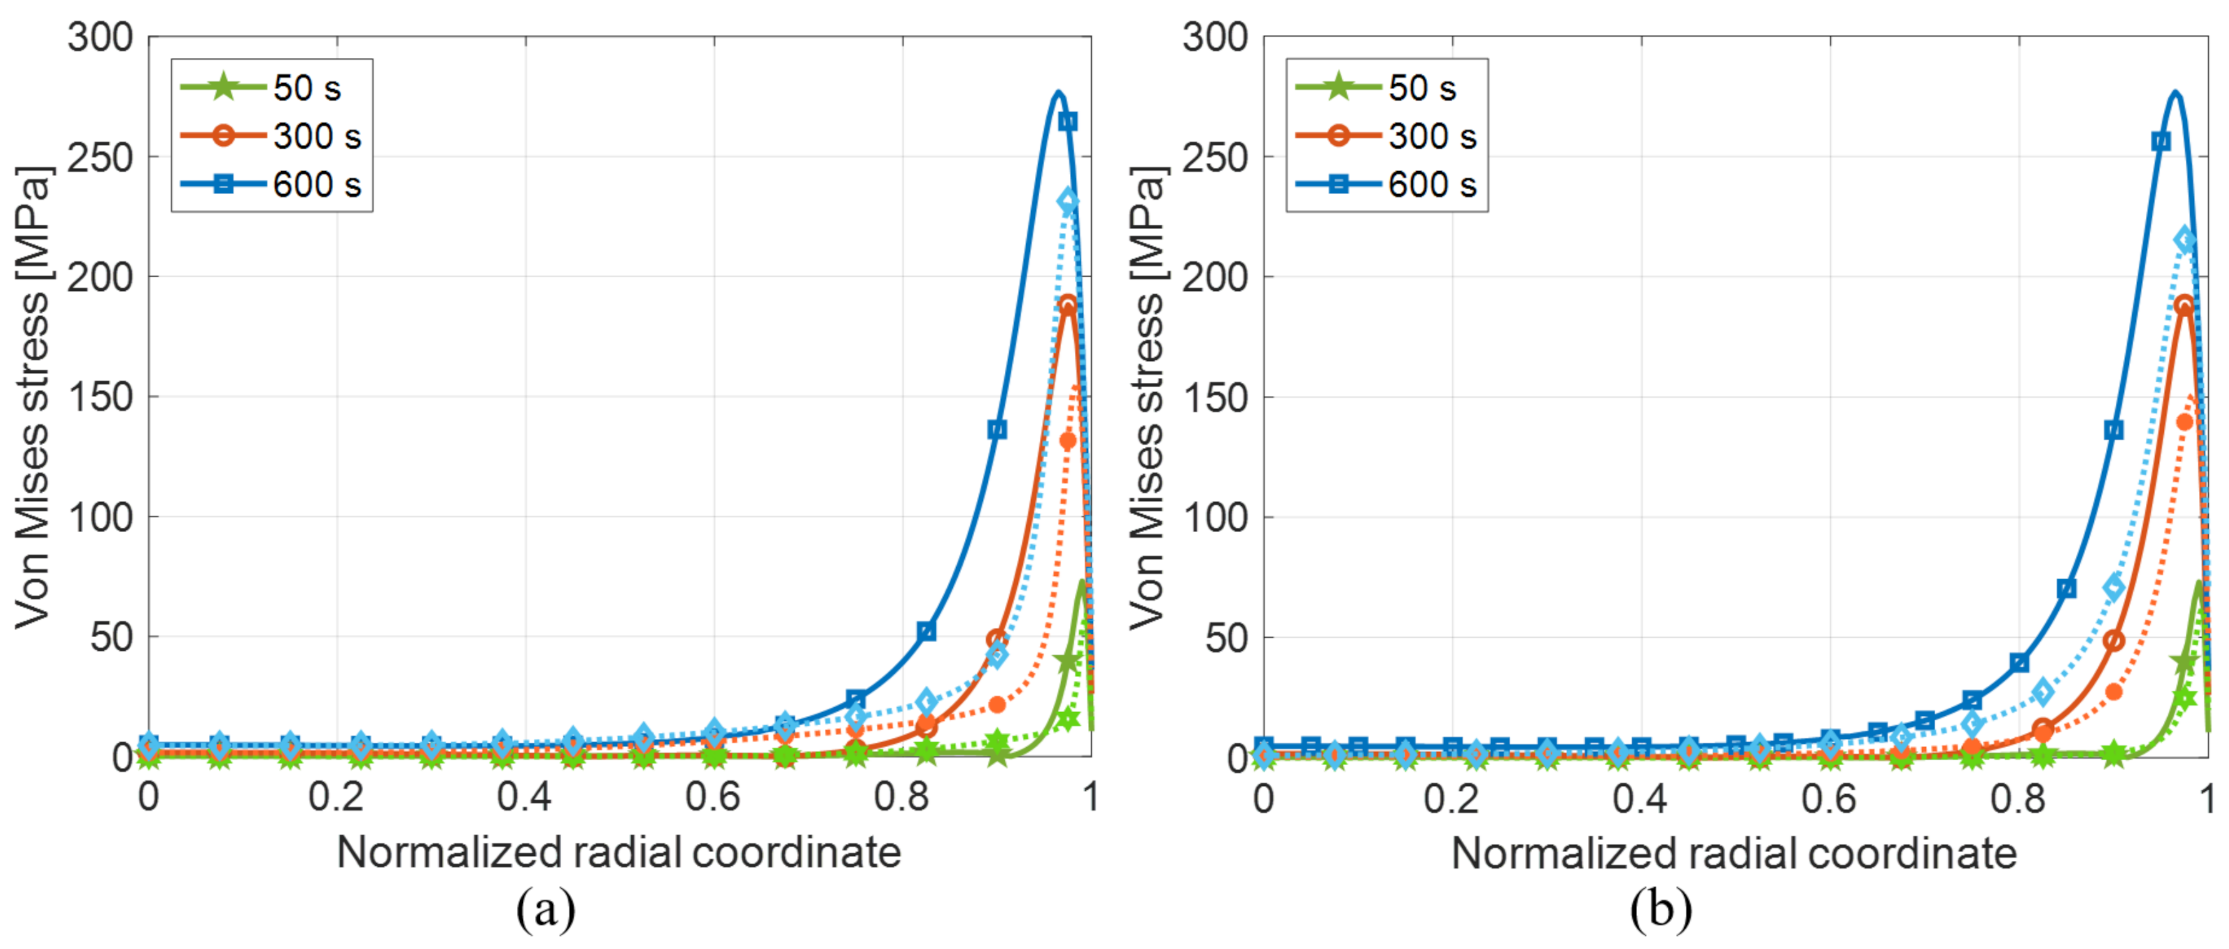
Von Mises stress in contact areas increases steadily as lithium insertion goes on in time because it is strongly influenced by contact stress, as shown in Figure 8. Indeed, contact stress is proportional to particle expansion that depends on lithium content in turn, while diffusion stress keeps nearly constant through the whole SOC window after an initial transient. The differences from the coupled and uncoupled model are highlighted in Figure 8a, which shows that the influence of mechanical stress on diffusion causes higher Von Mises stress, as qualitatively explained above. Furthermore, the discrepancy between the two models increases with time, as the coupling becomes stronger because of the increase of mechanical stress. Moreover, the comparison between the results of multi-physics model and contact model of Section 3.2 in Figure 8b shows that diffusion stress gives a remarkable contribution to total stress in contact domain. This makes the multiphysics model meaningful, as the stress state cannot be deduced by considering contact and diffusion stress separately, as supposed in previous works [8].
4.3. Shape Factor
Shape factor is presented in this section to understand how the particle shape affects mechanical stress. Shape factor is computed as the ratio between Von Mises stress in ellipsoids and in the reference sphere. A set of aspect ratio values from to are considered. Prolate ellipsoids are characterized by aspect ratio , oblate ellipsoids by , and refers to sphere. Particles in active material are assumed to have not so flattened shapes to be described by aspect ratios lower than 0.3 or greater than 3.5.
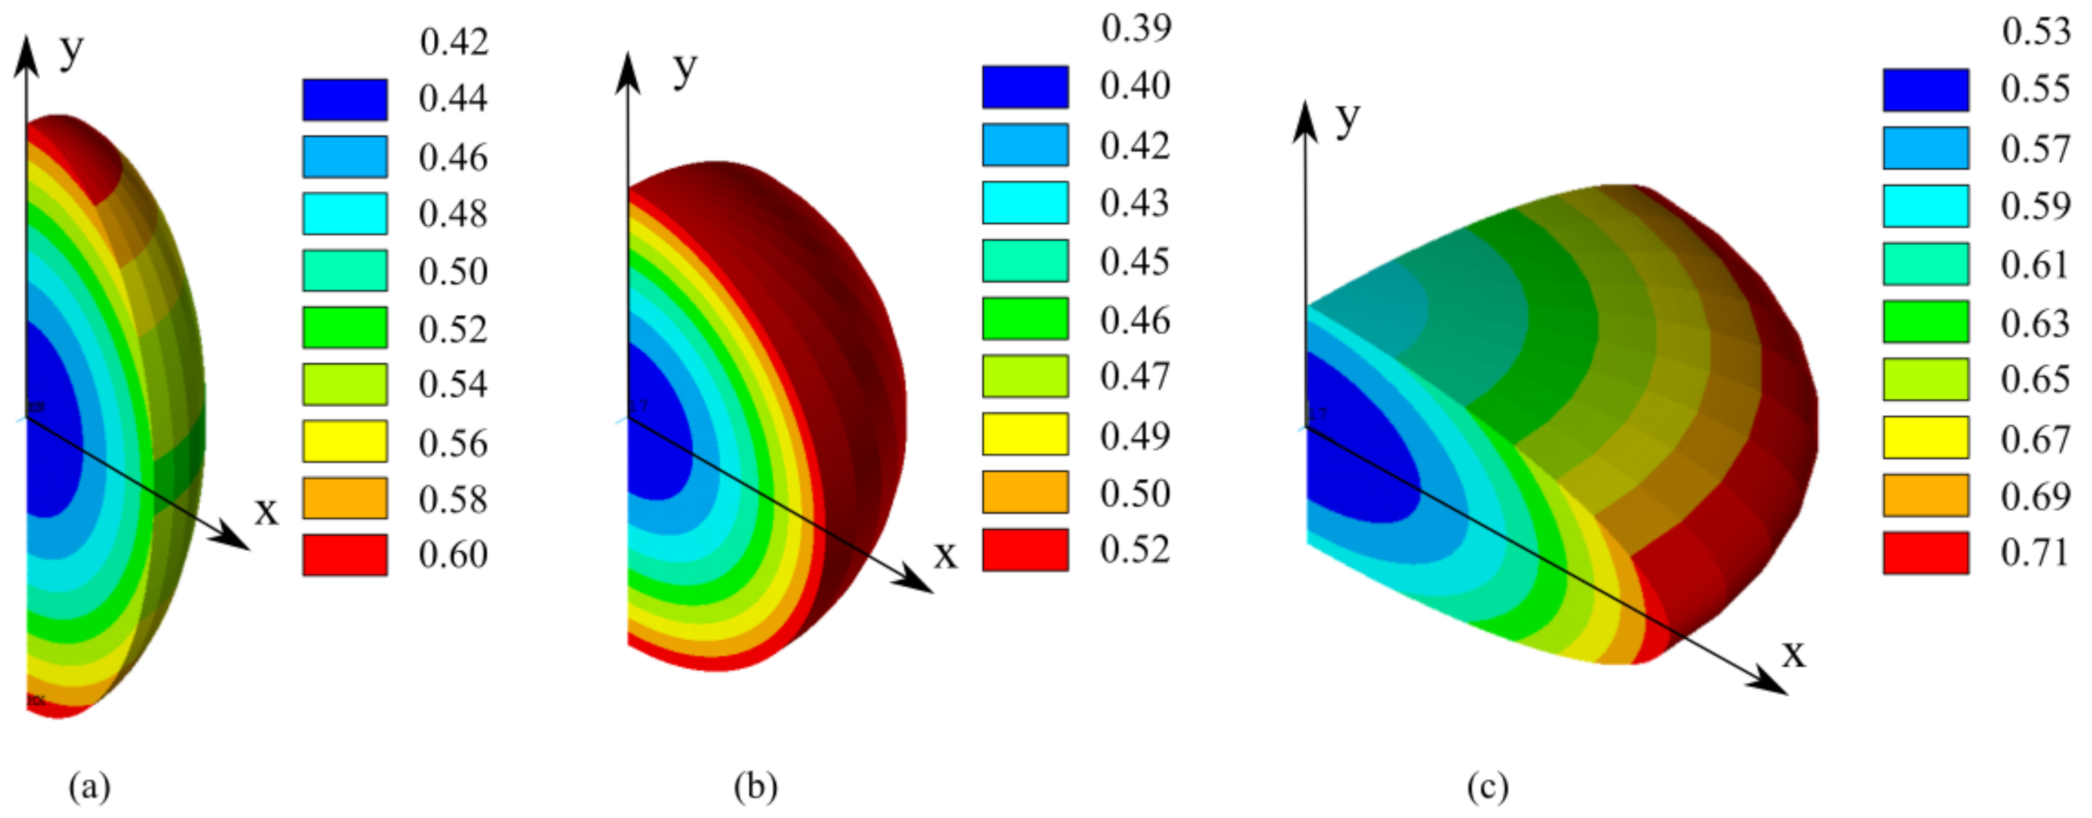
Firstly, non-contact domain is considered, then all the following considerations hold for the areas far enough from contact point not to be affected. Concentration distribution in sphere and ellipsoids are reported in Figure 9a–c, respectively. An inhomogeneous lithium distribution at the edge of the particle is observed in ellipsoids, which increases with aspect ratio, as pointed out also by other works [13,22,23]. The solubility limit is reached earlier in the more convex areas, as confirmed by the comparison of Figure 9a–c: the concentration value is up 33% higher in the more convex area of ellipsoids with the same simulation time.
As a consequence, even displacements are not symmetric any more: convex areas suffer greater displacements compared to flat areas due to higher lithium content.
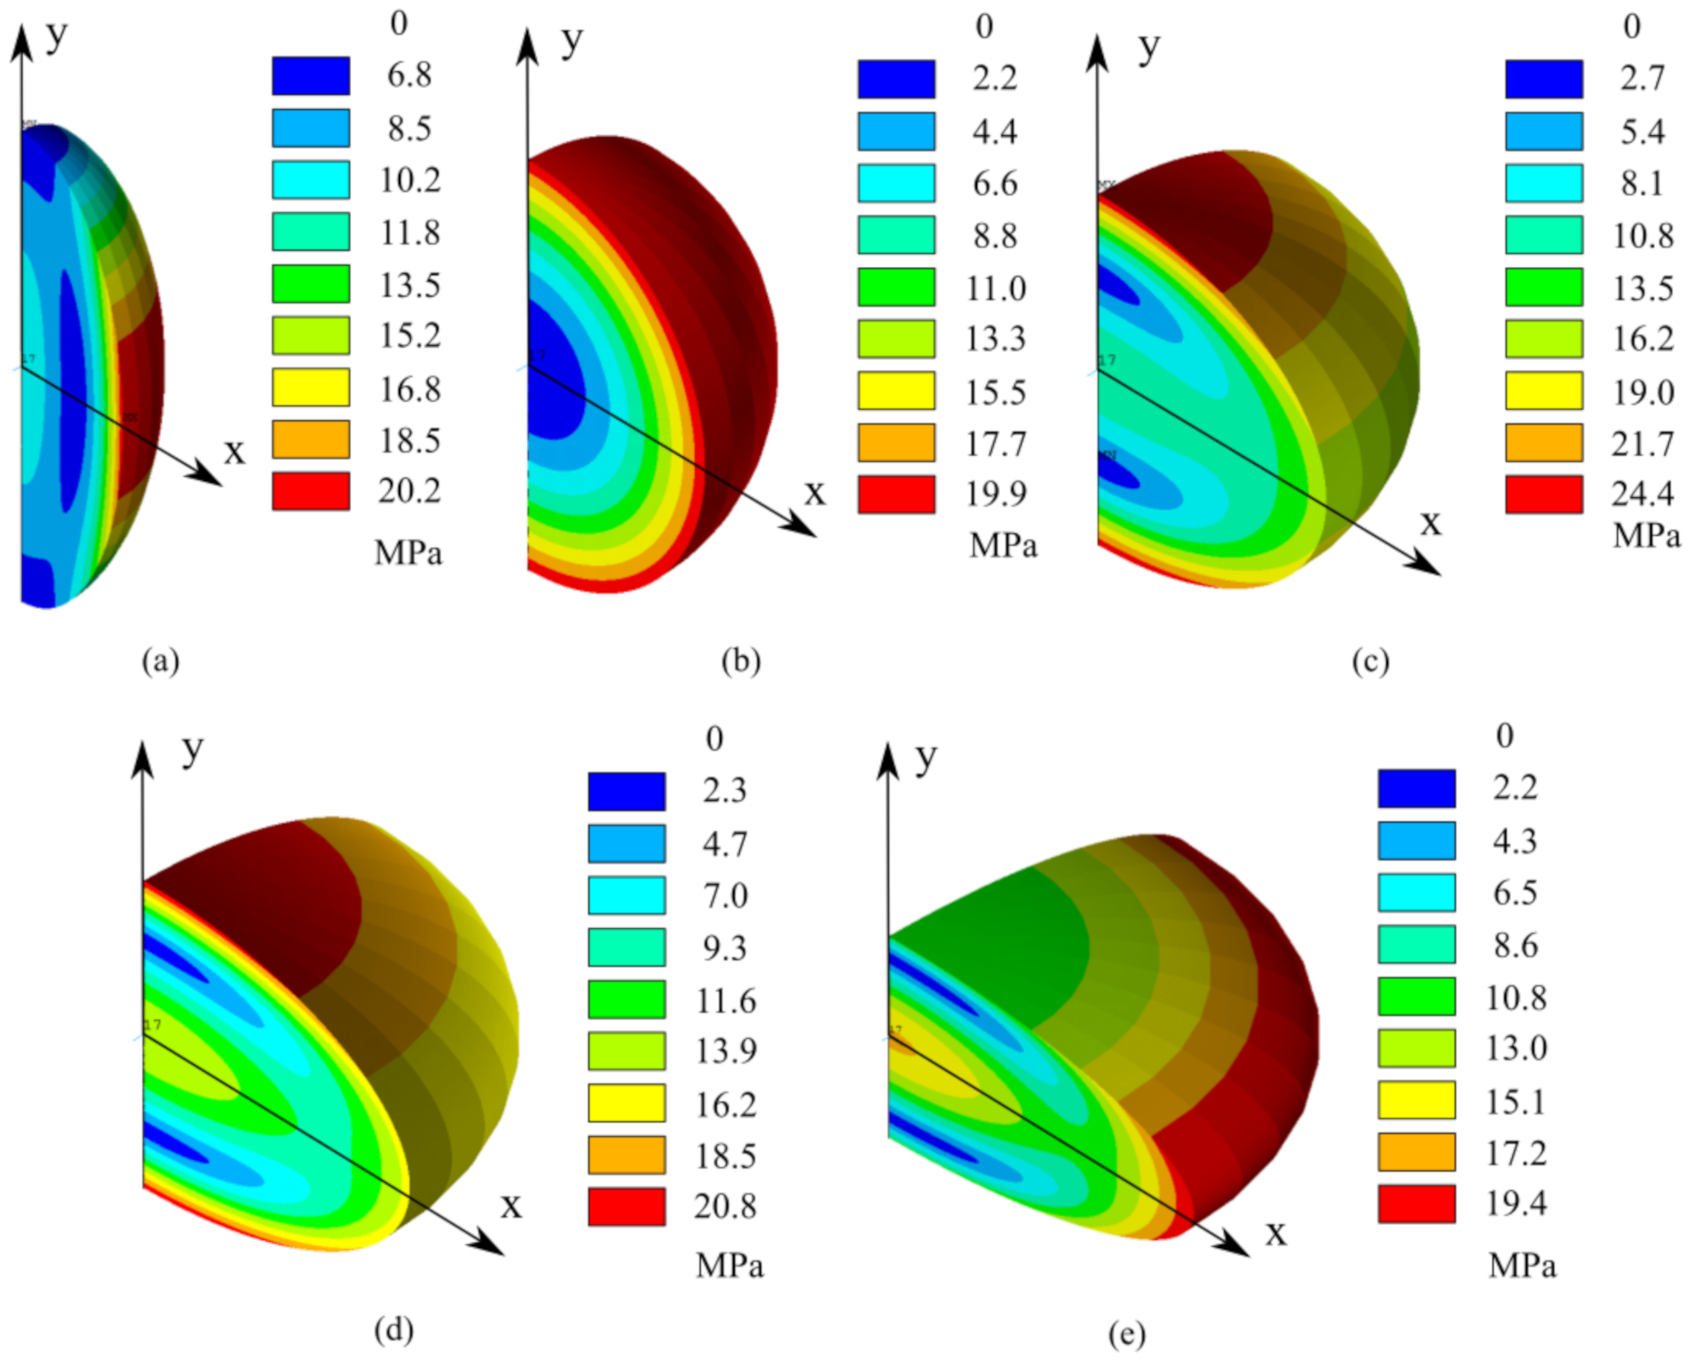
Particle shape influences Von Mises stress as well, as highlighted in Figure 10. Ellipsoid breaks the symmetry of stress distribution and makes some areas characterized by higher stress and other by lower stress compared to spherical geometry. Moreover, as the aspect ratio increases over 1, the maximum stress moves from less convex areas to more convex ones. On the contrary, peak stress is observed in flat areas in prolate ellipsoids ().
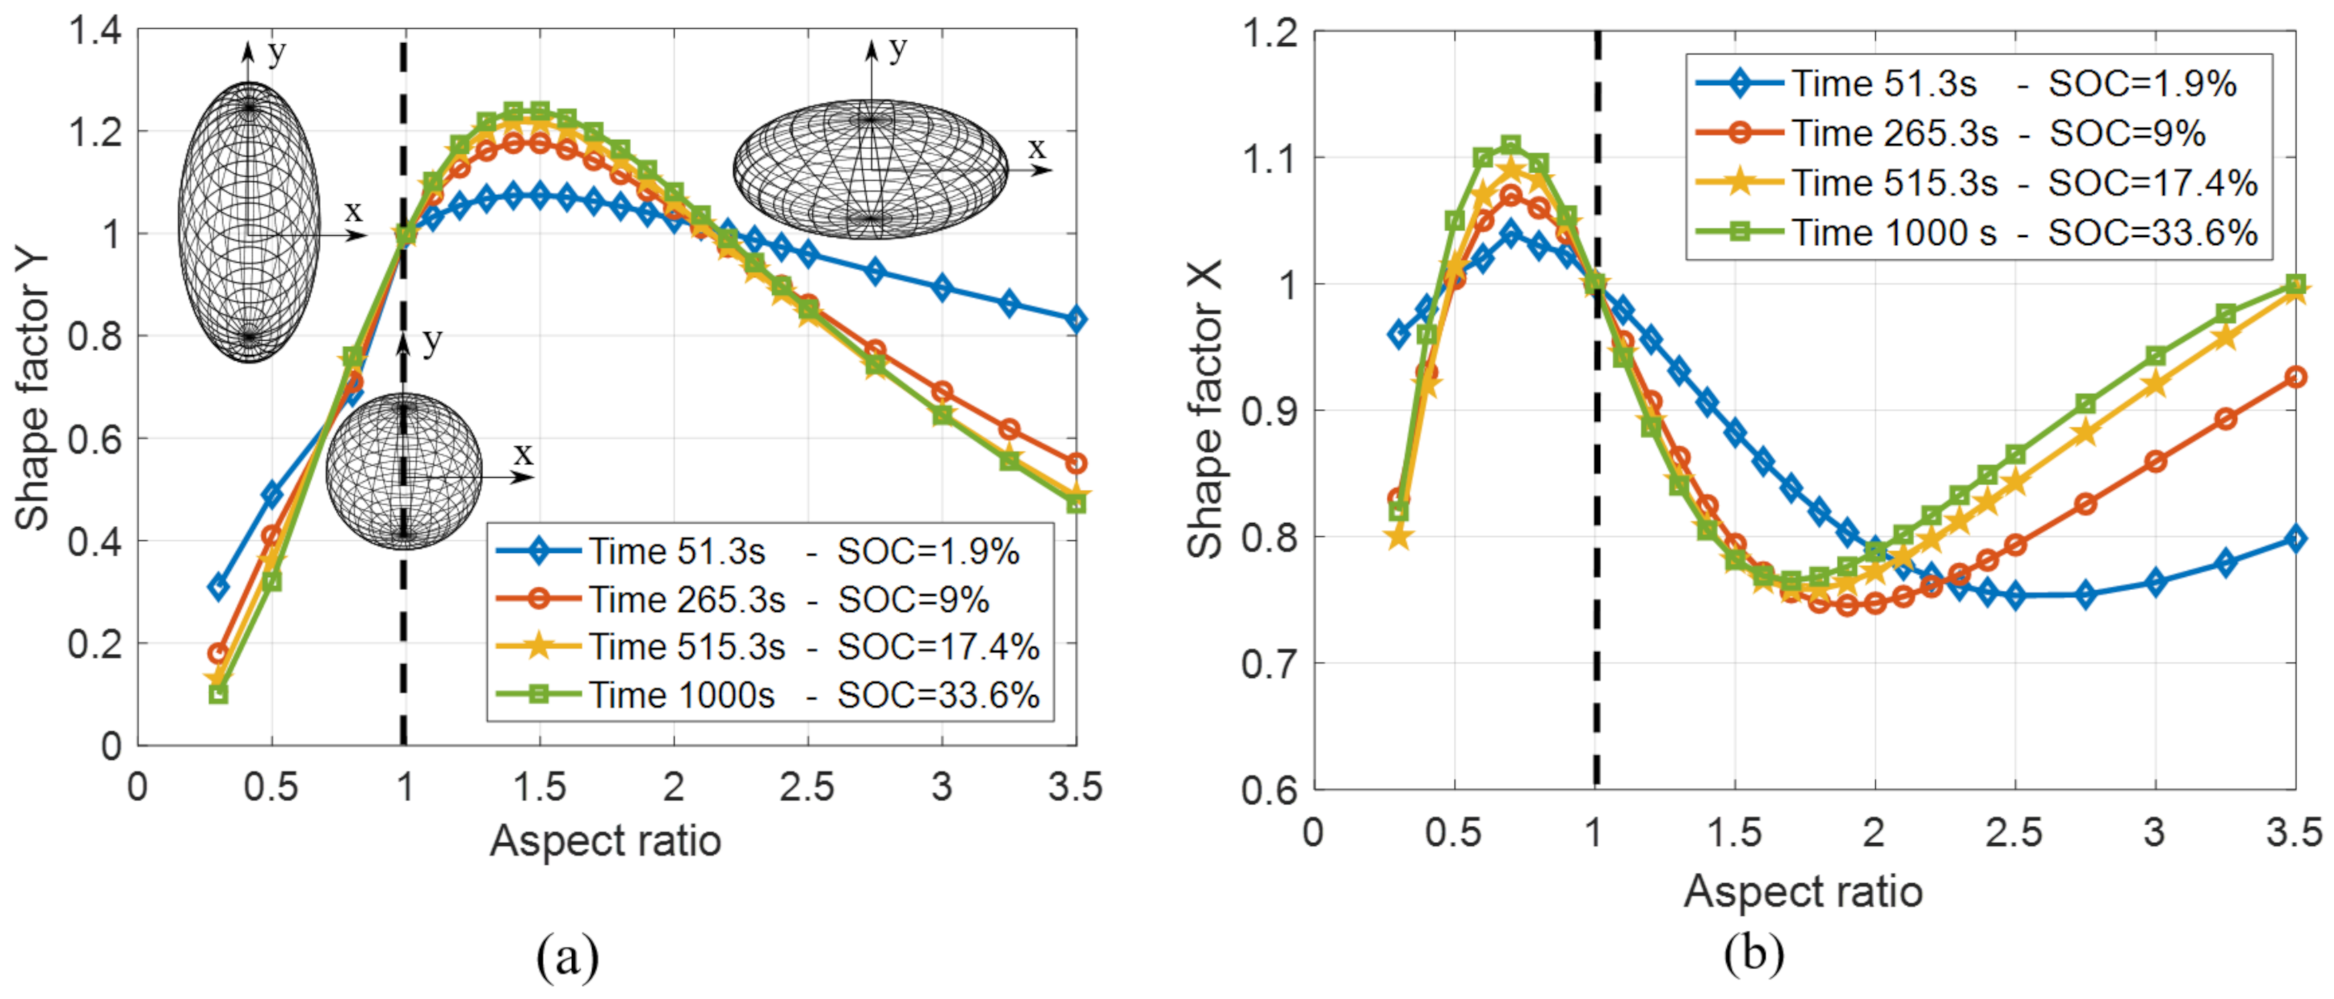
DIS shape factors are displayed in Figure 11 as the ratio between the maximum Von Mises stress computed in ellipsoid and in sphere in non-contact domain as a function of the aspect ratio. DIS shape factor is computed for x axis and y axis referring to Figure 10, which means that the maximum Von Mises stress along x direction and y direction is picked for the computation.
Flat areas in oblate ellipsoids with aspect ratio between 1 and 2 and in the corresponding prolate ellipsoids with aspect ratio between 0.5 and 1 are the most critical conditions, since a stress amplification over 20% is detected by the DIS shape factor along y and x directions, respectively, as shown in Figure 11a,b. The DIS shape factor can be fitted by a parable in these regions, then it decreases linearly outside. This trend can be deduced also by previous works [13,23], which detects greater Von Mises stress for aspect ratios between 1 and 2 in oblate ellipsoids.
On the other hand, DIS shape factors are lower than 1 in all the other regions in more convex areas, because the stress induced by diffusion is mitigated by the longer diffusion path.
The simulations of Figure 11 are conducted until a SOC of about 30%, because diffusion stress, after an initial transient, does not change beyond this value, and accordingly neither does the DIS shape factor.
As noticed before, with increasing aspect ratio over 1.5, the peak stress moves from less convex areas to more convex areas, then shape factor along y decreases and the one along x increases.
DIS shape factors have a weak dependence on lithium boundary flux, which controls the absolute magnitude of the stress induced by diffusion, but the trends remain unchanged.
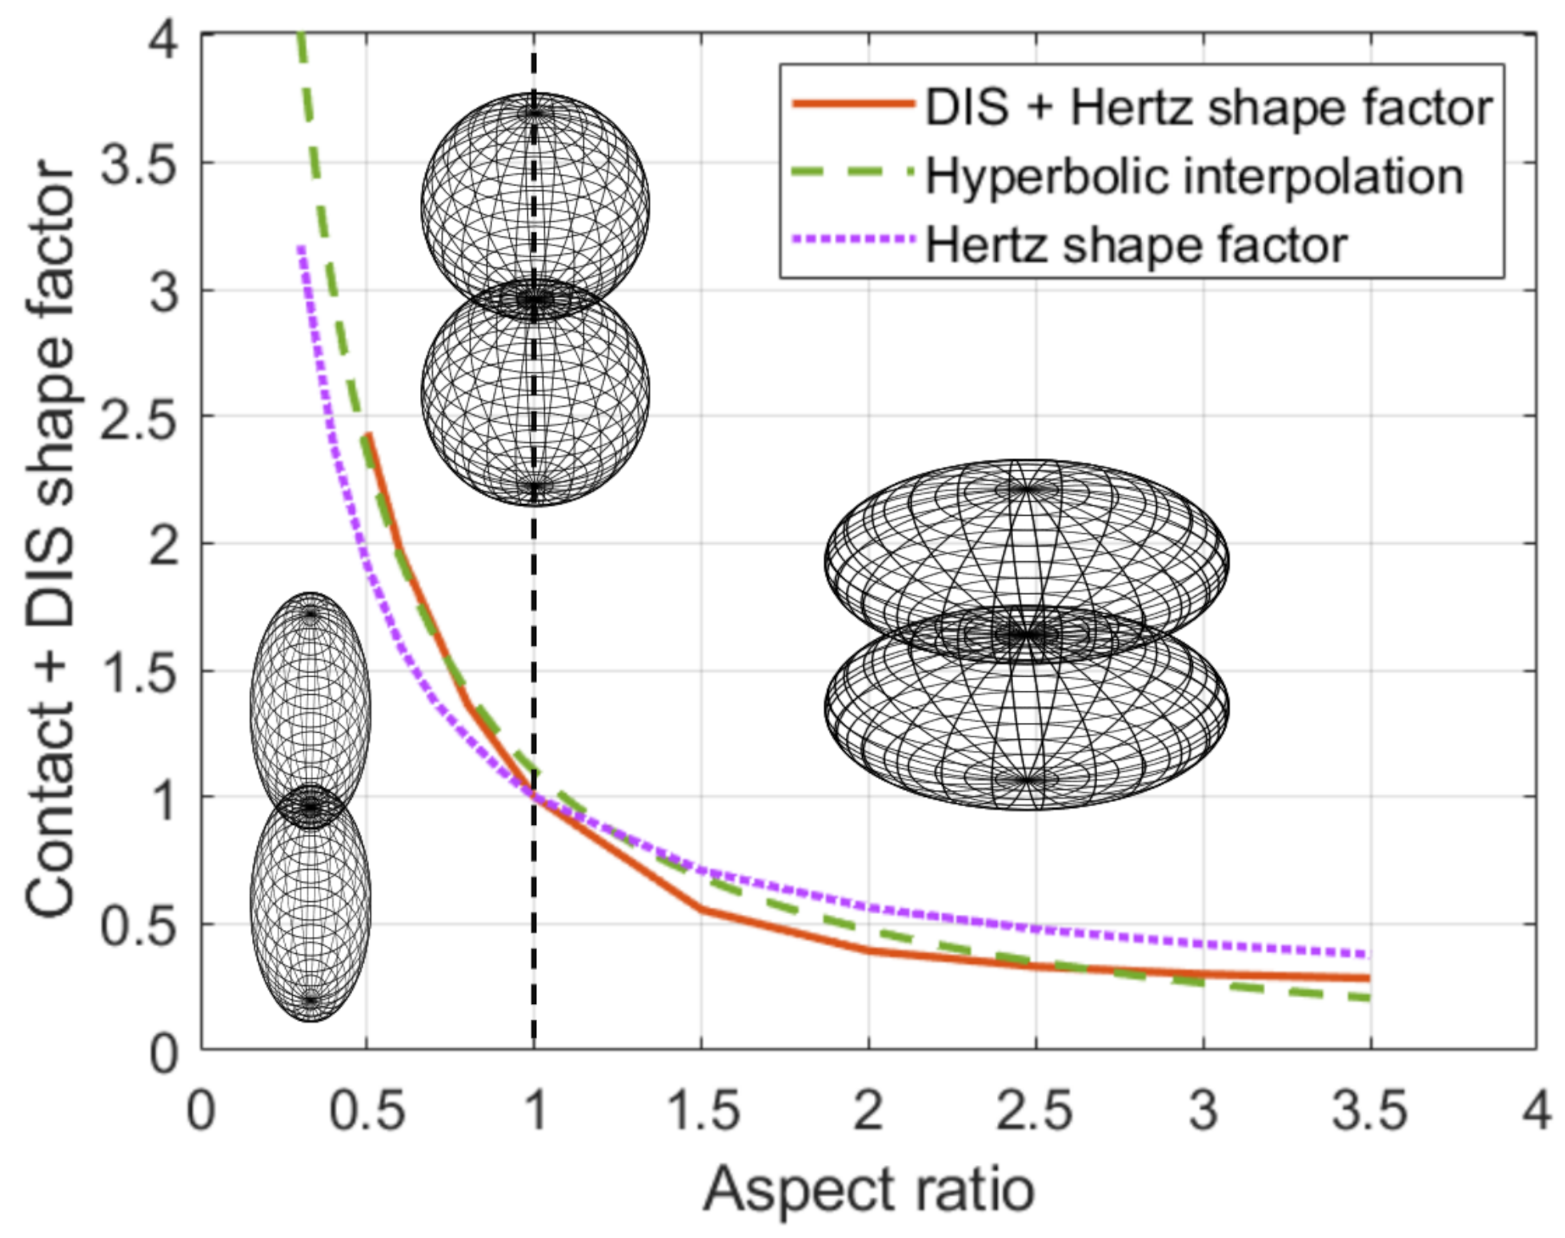
Finally, shape factor is computed in contact domain in Figure 12.
Overall shape factor in contact domain is highly influenced by contact stress as showed by the comparison of red line and dotted purple line in Figure 12, and thus it depends mainly on the size of contact area: prolate ellipsoid suffers greater contact stress because of the smaller contact area, oblate ellipsoid vice versa. The dotted purple line is obtained from the FE sub-model of Section 3.2, it is time-independent and satisfactory fitted by the hyperbolic function in Equation (24), with the constants and for the case reported in Figure 6.
However, some differences are highlighted between the contact and complete model due to the asymmetry of displacement in ellipsoid respect to sphere, already pointed out in Section 2: convex areas expand more than flat areas due to lithium diffusion; thus, the greater the particle expansion, the greater the contact stress. This fact causes higher contact stress in the areas where the convexity is greater than in the spherical case of reference (aspect ratio lower than one), which are already characterized by higher contact stress because of the smaller contact area. On the contrary, the lower expansion of flat areas, compared to the spherical case of reference, reduces the contact stress, which, however, is already mitigated by the larger contact surfaces.
These differences are highlighted by the comparison of red line and purple line in Figure 12: the overall shape factor is greater than the contact one when aspect ratio is lower than one, vice versa for aspect ratio greater than one. This trend makes the shape of the particle emphasize the total stress, intensifying the stress in convex areas in particular. However, overall shape factor is still well fitted by a hyperbolic curve, as shown by the comparison of red line and green dashed line in Figure 12. Interestingly, shape factor basically does not depend on lithium flux and lithium content.
5. Conclusions
The aim of this paper is to overcome the assumptions of spherical and standalone active material particle in the electrochemical-mechanical modelling of lithium-ion battery.
The geometry adopted is a parametrized ellipsoid: the parameter “radius” controls the size and “aspect ratio” controls the shape (elongation). The two parameters can be fitted to approximate real active material particles from X-ray tomography or atomic force microscopy.
Shape factor describes how particle shape affects mechanical stress in active material. It is computed as the ratio between the maximum Von Mises stress in ellipsoid and in the spherical geometry of reference, as a function of aspect ratio.
Mechanical stresses in active material particle are computed with a multiphysics model in Ansys APDL which solves the electrochemical and structural problem simultaneously. The model consistency is guaranteed by the validation of diffusion and contact sub-model with analytical solution available in spherical geometry reported in [7,32] respectively.
The active material particle is split in two domains: non-contact domain and contact domain, whether the area is affected by contact with neighbouring particles or not. Diffusion stress affects the non-contact domain, and it is the result of the inhomogeneous distribution of lithium ions inside active material particle due to diffusion. The combination of diffusion stress and contact stress affects the areas in contact domain because of the expansion of the particles in a confined active material layer during lithiation.
The multi-physics model is derived according to a coupled approach to capture the influence of mechanical stress on electro-chemistry. Namely, lithium diffusion is driven by concentration gradient and hydrostatic stress gradient. The coupling affects the results considerably in the non-contact areas, as already pointed out in a previous work [7], and has a substantial influence in contact domain, where contact causes a steep hydrostatic stress gradient close to the particle surface.
Shape factor in non-contact domain highlights that an increment of diffusion stress up to 20% occurs in oblate ellipsoids with aspect ratio between 1 and 2 and in prolate ellipsoids with aspect ratio between 0.5 and 1, which are the critical shapes that cause stress intensification. All the other shapes cause a considerable stress relaxation up to 80%.
Shape factor in contact domain follows an hyperbolic trend and highlights that convex areas (aspect ratio lower than 1) are characterized by a serious stress amplification, up to five time compared to the spherical case of reference because of the smaller contact areas and greater swelling due to lithium inhomogeneity. On the contrary, flat areas show a stress relaxation because of the larger contact area. Shape factor in the contact domain is basically independent on lithium flux and lithium content.
It can thus be concluded that shape factor analysis suggests the shape characteristics which guarantee a mitigation of mechanical stress and ageing consequently, providing a guidance for electrode and active material manufacturing.
From the results of the simulation displayed in this paper is possible to predict that particle size effect has an opposite influence on contact and non-contact domains. Greater particle size increases diffusion stress in non-contact domain because of the greater diffusion length. On the other hand, greater particle size makes the larger contact area mitigate the contact stress in contact domain.
Author Contributions
The authors contributed equally to this manuscript. All authors have read and agreed to the published version of the manuscript.
Funding
This research received no external funding.
Institutional Review Board Statement
Not applicable.
Informed Consent Statement
Not applicable.
Data Availability Statement
Data available in a publicly accessible repository.
Conflicts of Interest
The authors declare no conflict of interest.
Abbreviations
| a | Radius of contact area | m |
| c | Concentration | mol/m |
| Normalized concentration | - | |
| Initial concentration | mol/m | |
| Maximum concentration | mol/m | |
| D | Diffusion coefficient | m/s |
| E | Young Modulus | MPa |
| Young Modulus particle 1 in contact | MPa | |
| Young Modulus particle 2 in contact | MPa | |
| Equivalent young Modulus in contact analysis | MPa | |
| F | Contact force | N |
| Faraday constant | 96,485.332 As/mol | |
| I | Current density | A/m |
| J | Lithium flux | mol/ms |
| K | Percentage of lithium content | % |
| M | Mobility | mol·s/Kg |
| Equivalent pressure in contact analysis | MPa | |
| Maximum pressure in contact area | MPa | |
| r | Radial coordinate | m |
| Normalized radius | - | |
| R | Particle radius | m |
| Radius particle 1 in contact | m | |
| Radius particle 2 in contact | m | |
| Equivalent radius in contact analysis | m | |
| Gas constant | 8.3145 J/mol K | |
| Shape factor | - | |
| State of charge | - | |
| T | Temperature | 298 K |
| u | General displacement | m |
| Elastic displacement along y axis | m | |
| Displacement of particle centre | m | |
| Surface displacement | m | |
| Normalized x coordinate | - | |
| y | Original surface separation in contact area | m |
| Normalized y coordinate | - | |
| w | Radial coordinate in contact area | m |
| Aspect ratio | - | |
| constraint parameter | - | |
| prevented displacement in contact analysis | m | |
| Hoop strain | - | |
| Chemical strain | - | |
| Radial strain | - | |
| Chemical potential | J/mol | |
| Reference chemical potential | J/mol | |
| Poisson ratio | - | |
| Hoop stress | MPa | |
| Hydrostatic stress | MPa | |
| Radial stress | MPa | |
| Cartesian tensor | MPa | |
| Principal stresses | MPa | |
| Characteristic diffusion time | - | |
| Partial molar volume | m/mol | |
| Normalized contact depth | - |
References
- Somà, A.; Bruzzese, F.; Mocera, F.; Viglietti, E. Hybridization factor and performance of hybrid electric telehandler vehicle. IEEE Trans. Ind. Appl. 2016, 52, 5130–5138. [Google Scholar] [CrossRef]
- Mocera, F.; Vergori, E.; Somà, A. Battery Performance Analysis for Working Vehicle Applications. IEEE Trans. Ind. Appl. 2019, 56, 644–653. [Google Scholar] [CrossRef]
- Wang, Z.; Ni, J.; Li, L.; Lu, J. Theoretical Simulation and Modeling of Three-Dimensional Batteries. Cell Rep. Phys. Sci. 2020, 1, 100078. [Google Scholar] [CrossRef]
- Mocera, F.; Somà, A.; Clerici, D. Study of aging mechanisms in lithium-ion batteries for working vehicle applications. In Proceedings of the 2020 Fifteenth International Conference on Ecological Vehicles and Renewable Energies (EVER), MonteCarlo, Monaco, 10–12 September 2020; pp. 1–8. [Google Scholar] [CrossRef]
- Mukhopadhyay, A.; Sheldon, B.W. Deformation and stress in electrode materials for Li-ion batteries. Prog. Mater. Sci. 2014, 63, 58–116. [Google Scholar] [CrossRef]
- Blake, H.W.; Li, J. Electrode manufacturing for lithium-ion batteries—Analysis of current and next generation processing. J. Energy Storage 2019, 25, 100862. [Google Scholar]
- Clerici, D.; Mocera, F.; Somà, A. Analytical Solution for Coupled Diffusion Induced Stress Model for Lithium-Ion Battery. Energies 2020, 13, 1717. [Google Scholar] [CrossRef] [Green Version]
- Lu, B.; Zhao, Y.; Feng, J.; Song, Y.; Zhang, J. Mechanical contact in composite electrodes of lithium-ion batteries. J. Power Sources 2019, 440, 227115. [Google Scholar] [CrossRef]
- Deshpande, R.; Verbrugge, M.; Cheng, Y.T.; Wang, J.; Liu, P. Battery cycle life prediction with coupled chemical degradation and fatigue mechanics. J. Electrochem. Soc. 2012, 159, A1730. [Google Scholar] [CrossRef]
- Zhao, K.; Matt, P.; Vlassak, J.J.; Suo, Z. Fracture of electrodes in lithium-ion batteries caused by fast charging. J. Appl. Phys. 2010, 108, 073517. [Google Scholar] [CrossRef]
- Wilson, J.R.; Cronin, J.S.; Barnett, S.A.; Harris, S.J. Measurement of three-dimensional microstructure in a LiCoO2 positive electrode. J. Power Sources 2011, 196, 3443–3447. [Google Scholar] [CrossRef]
- Christensen, J.; Newman, J. Stress generation and fracture in lithium insertion materials. J. Solid State Electrochem. 2006, 10, 293–319. [Google Scholar] [CrossRef]
- Zhang, X.; Shyy, W.; Sastry, A.M. Numerical simulation of intercalation-induced stress in Li-ion battery electrode particles. J. Electrochem. Soc. 2007, 154, A910. [Google Scholar] [CrossRef]
- Cheng, Y.T.; Verbrugge, M.W. Evolution of stress within a spherical insertion electrode particle under potentiostatic and galvanostatic operation. J. Power Sources 2009, 190, 453–460. [Google Scholar] [CrossRef]
- Malavé, V.; Berger, J.; Zhu, H.; Kee, R.J. A computational model of the mechanical behavior within reconstructed LixCoO2 Li-ion battery cathode particles. Electrochim. Acta 2014, 130, 707–717. [Google Scholar] [CrossRef]
- Chung, M.; Seo, J.; Zhang, X.; Sastry, A. Implementing realistic geometry and measured diffusion coefficients into single particle electrode modeling based on experiments with single LiMn2O4 spinel particles. J. Electrochem. Soc. 2011, 158, A371. [Google Scholar] [CrossRef]
- Wiedemann, A.H.; Goldin, G.M.; Barnett, S.A.; Zhu, H.; Kee, R.J. Effects of three-dimensional cathode microstructure on the performance of lithium-ion battery cathodes. Electrochim. Acta 2013, 88, 580–588. [Google Scholar] [CrossRef]
- Mendoza, H.; Roberts, S.A.; Brunini, V.E.; Grillet, A.M. Mechanical and electrochemical response of a LiCoO2 cathode using reconstructed microstructures. Electrochim. Acta 2016, 190, 1–15. [Google Scholar] [CrossRef] [Green Version]
- Hun, J.; Chung, M.; Park, M.; Woo, S.; Zhang, X.; Marie, A. Generation of realistic particle structures and simulations of internal stress: A numerical/AFM study of LiMn2O4 particles. J. Electrochem. Soc. 2011, 158, A434. [Google Scholar] [CrossRef]
- Lim, C.; Yan, B.; Yin, L.; Zhu, L. Simulation of diffusion-induced stress using reconstructed electrodes particle structures generated by micro/nano-CT. Electrochim. Acta 2012, 75, 279–287. [Google Scholar] [CrossRef]
- Stershic, A.; Simunovic, S.; Nanda, J. Modeling the evolution of lithium-ion particle contact distributions using a fabric tensor approach. J. Power Sources 2015, 297, 540–550. [Google Scholar] [CrossRef] [Green Version]
- Xu, R.; Zhao, K. Mechanical interactions regulated kinetics and morphology of composite electrodes in Li-ion batteries. Extrem. Mech. Lett. 2016, 8, 13–21. [Google Scholar] [CrossRef]
- Stein, P.; Xu, B. 3D Isogeometric Analysis of intercalation-induced stresses in Li-ion battery electrode particles. Comput. Methods Appl. Mech. Eng. 2014, 268, 225–244. [Google Scholar] [CrossRef]
- Bucci, G.; Swamy, T.; Bishop, S.; Sheldon, B.W.; Chiang, Y.M.; Carter, W.C. The effect of stress on battery-electrode capacity. J. Electrochem. Soc. 2017, 164, A645. [Google Scholar] [CrossRef]
- Wu, B.; Lu, W. A battery model that fully couples mechanics and electrochemistry at both particle and electrode levels by incorporation of particle interaction. J. Power Sources 2017, 360, 360–372. [Google Scholar] [CrossRef]
- Mei, W.; Duan, Q.; Qin, P.; Xu, J.; Wang, Q.; Sun, J. A Three-Dimensional Electrochemical-Mechanical Model at the Particle Level for Lithium-Ion Battery. J. Electrochem. Soc. 2019, 166, A3319. [Google Scholar] [CrossRef]
- Huttin, M.; Kamlah, M. Phase-field modeling of stress generation in electrode particles of lithium ion batteries. Appl. Phys. Lett. 2012, 101, 133902. [Google Scholar] [CrossRef]
- Bohn, E.; Eckl, T.; Kamlah, M.; McMeeking, R. A model for lithium diffusion and stress generation in an intercalation storage particle with phase change. J. Electrochem. Soc. 2013, 160, A1638. [Google Scholar] [CrossRef]
- Miller, M.I.; Christensen, G.E.; Amit, Y.; Grenander, U. Mathematical textbook of deformable neuroanatomies. Proc. Natl. Acad. Sci. USA 1993, 90, 11944–11948. [Google Scholar] [CrossRef] [Green Version]
- Martin, E.; Chung, D.-W.; Edwin, G.R.; Vanessa, W. Tortuosity anisotropy in lithium-ion battery electrodes. Adv. Energy Mater. 2014, 4, 1301278. [Google Scholar]
- Zhao, Y.; Stein, P.; Bai, Y.; Al-Siraj, M.; Yang, Y.; Xu, B.X. A review on modeling of electro-chemo-mechanics in lithium-ion batteries. J. Power Sources 2019, 413, 259–283. [Google Scholar] [CrossRef]
- Johnson, K. Contact Mechanics; Cambridge University Press: Cambridge, UK, 1985; Volume 95, p. 365. [Google Scholar]
Figure 1.
Sketch of a section of an hypothetical real particles in grey and the equivalent elliptical geometries in dashed line. Aspect ratio is defined as . Ellipsoid is constructed rotating one half of the section around its central vertical axis.
Figure 1.
Sketch of a section of an hypothetical real particles in grey and the equivalent elliptical geometries in dashed line. Aspect ratio is defined as . Ellipsoid is constructed rotating one half of the section around its central vertical axis.

Figure 2.
Sketch of an ideal section of active material. Dotted lines refers to rest condition (no lithium inserted in particle), dashed line refers to the free expansion of the particle as a result of lithiation and solid line refers to particle surface considering both expansion due to lithiation and contact. The upper figure refers to extremely rigid boundary () and the lower figure refers to the case ().

Figure 3.
Contact of spherical surfaces. Real model (a) and equivalent model (b). Dotted lines refers to rest condition (no lithium inserted in particle). Dashed line refers to the free expansion of the particle as a result of lithiation. Solid line refers to particle surface considering both expansion due to lithiation and contact. The red line represents the pressure distribution in the contact area, and is the maximum pressure.

Figure 4.
Sketch of the electrochemical-mechanical model, axisymmetric around y axis (a). Green and red lines are the conta172 and targe169 contact elements. Light blue arrows refer to the lithium flux applied to particles boundaries. Von Mises stress with lithium flux equal to 1 A/m and s shows contact (C) and non-contact (N-C) areas (b).

Figure 5.
Validation of the FE sub-model dedicated to diffusion stress (dashed lines) with the analytical model (solid lines) of a previous paper [7]. Concentration profile (a) and Von Mises stress (b) in spherical particle with the properties listed in Table 2; simulation time: 500 s and variable lithium flux.

Figure 6.
Sketch of the contact model (a). Green and red layers are the conta172 and targe169 elements, respectively. Comparison of Von Mises stress computed with FE and analytical model along contact direction (y axis) (b). Simulation is carried out with model parameters of Table 2, reaching the percentage amount of lithium with a lithium flux of 2 A/m and a simulation time of 350 s.

Figure 7.
Hydrostatic stress (a) and lithium concentration (c) in contact (red), non-contact (blue) domains. Hydrostatic stress derivative with respect to radial coordinate in contact domain (b). Lithium flux 1 A/m.
Figure 7.
Hydrostatic stress (a) and lithium concentration (c) in contact (red), non-contact (blue) domains. Hydrostatic stress derivative with respect to radial coordinate in contact domain (b). Lithium flux 1 A/m.

Figure 8.
Von Mises stress in contact domain at increasing simulation times. Von Mises stress of coupled and uncoupled model in solid and dashed lines, respectively (a). Von Mises stress of the complete model (diffusion and contact) and contact alone in solid and dashed lines, respectively (b). Lithium flux 1 A/m.

Figure 9.
Normalized concentration distribution () in sphere, (b) and in ellipsoids, (a) and (c). Chemical and mechanical properties are listed in Table 2: lithium flux is 1 A/m and simulation time is 1000 s.
Figure 9.
Normalized concentration distribution () in sphere, (b) and in ellipsoids, (a) and (c). Chemical and mechanical properties are listed in Table 2: lithium flux is 1 A/m and simulation time is 1000 s.

Figure 10.
Von Mises stress (MPa) in geometries with different aspect ratio: (a) , (b) , (c) , (d) and (e) . Chemical and mechanical properties are listed in Table 2, lithium flux is 1 A/m, simulation time is 1000 s.
Figure 10.
Von Mises stress (MPa) in geometries with different aspect ratio: (a) , (b) , (c) , (d) and (e) . Chemical and mechanical properties are listed in Table 2, lithium flux is 1 A/m, simulation time is 1000 s.

Figure 11.
DIS shape factor along y (a) and x (b) direction with 1 A/m lithium flux. The images of prolate ellipsoid, sphere and oblate ellipsoid, along with coordinate system, belong to the cases , and (a).
Figure 11.
DIS shape factor along y (a) and x (b) direction with 1 A/m lithium flux. The images of prolate ellipsoid, sphere and oblate ellipsoid, along with coordinate system, belong to the cases , and (a).

Figure 12.
Overall shape factor computed as the ratio of maximum Von Mises stress in ellipsoid and in sphere (red line). Hyperbolic interpolation of the overall shape factor is reported in green dashed line. The “only contact” shape factor is reported in dotted purple line.
Figure 12.
Overall shape factor computed as the ratio of maximum Von Mises stress in ellipsoid and in sphere (red line). Hyperbolic interpolation of the overall shape factor is reported in green dashed line. The “only contact” shape factor is reported in dotted purple line.


Table 1.
Diffusion-induced stress (DIS) model equations [7].
Table 1.
Diffusion-induced stress (DIS) model equations [7].
| Mechanical Equations | |
|---|---|
| Constitutive | |
| Congruence | |
| Equilibrium | |
| Diffusion Equation | |
| Chemical potential | |
| Flux | |
| Mass conservation | |
| Solutions | |
| Displacement | |
| Radial stress | |
| Hoop stress | |
| Concentration |
Table 2.
Chemical and mechanical properties of LixMn2O4 (LMO) [7].
Table 2.
Chemical and mechanical properties of LixMn2O4 (LMO) [7].
| Parameter | Symbol | Value | Unit |
|---|---|---|---|
| Diffusion coefficient | D | m/s | |
| Partial molar volume | m/mol | ||
| Maximum concentration | mol/m | ||
| Young modulus | E | 10 | GPa |
| Poisson ratio | 0.3 | - | |
| Particle radius (sphere) | R | m |
Publisher’s Note: MDPI stays neutral with regard to jurisdictional claims in published maps and institutional affiliations. |
© 2020 by the authors. Licensee MDPI, Basel, Switzerland. This article is an open access article distributed under the terms and conditions of the Creative Commons Attribution (CC BY) license (http://creativecommons.org/licenses/by/4.0/).
Share and Cite
MDPI and ACS Style
Clerici, D.; Mocera, F.; Somà, A. Shape Influence of Active Material Micro-Structure on Diffusion and Contact Stress in Lithium-Ion Batteries. Energies 2021, 14, 134. https://doi.org/10.3390/en14010134
AMA Style
Clerici D, Mocera F, Somà A. Shape Influence of Active Material Micro-Structure on Diffusion and Contact Stress in Lithium-Ion Batteries. Energies. 2021; 14(1):134. https://doi.org/10.3390/en14010134
Chicago/Turabian StyleClerici, Davide, Francesco Mocera, and Aurelio Somà. 2021. "Shape Influence of Active Material Micro-Structure on Diffusion and Contact Stress in Lithium-Ion Batteries" Energies 14, no. 1: 134. https://doi.org/10.3390/en14010134
Note that from the first issue of 2016, this journal uses article numbers instead of page numbers. See further details here.