Microwave Heating Improvement: Permittivity Characterization of Water–Ethanol and Water–NaCl Binary Mixtures †


1
Department of Mechanical, Chemical and Material Engineering, University of Cagliari, 09123 Cagliari, Italy
2
Department of Electric and Electronic Engineering, University of Cagliari, 09123 Cagliari, Italy
*
Author to whom correspondence should be addressed.
†
This paper is an extended version of our paper published in 26th Telecommunications forum (TELFOR) 2018, Belgrade, Serbia, 20–21 November 2018; pp. 1–4.
Energies 2020, 13(18), 4861; https://doi.org/10.3390/en13184861
Submission received: 8 July 2020
/
Revised: 5 August 2020
/
Accepted: 15 September 2020
/
Published: 17 September 2020
(This article belongs to the Special Issue Selected Papers from PRES’19: The 22nd Conference on Process Integration, Modelling and Optimisation for Energy Saving and Pollution Reduction)
Abstract
:Microwave heating offers a lot of advantages compared to conventional heating methods in the chemical reactions field due to its positive effects on reaction time and selectivity. Dielectric properties, and in particular permittivity, of substances and mixtures, are important for the optimization of microwave heating processes; notwithstanding this, specific databases are poor and far from being complete, and in the scientific literature very little data regarding these properties can be found. In this work, impedance measurements were carried out using a specially designed system to get the real and imaginary parts of the dielectric constant. The apparatus was tested in the estimation of permittivity of water–ethanol and water–NaCl mixtures, varying their composition to obtain a wide range of permittivity values. The results were compared to literature data and fitted with available literature models to verify the correspondence between them, finding that permittivity dependence on mixture composition can be effectively described by the models.

1. Introduction
Microwaves (MWs) refer to electromagnetic radiation in the frequency range of 300 MHz–300 GHz with a wavelength between 1 mm and 1 m [1]. MWs can be generated by high-power sources including magnetrons (used in microwave ovens and available at lower costs than other sources), klystrons, traveling wave tubes, and gyrotrons [2]. Electromagnetic energy propagates through space using time-varying electric and magnetic fields [3].
MW heating is a characteristic phenomenon that cannot be imitated by other heating methods: it can lead to internal heating, selective heating, the formation of hotspots, local heating, superheating, and non-uniform heating [4]. There are two main mechanisms of MW heating: dipolar reorientation and ionic conduction [5]. Dipolar reorientation is mainly connected with the presence of water, dipoles, or charged materials in general. Water molecules are dipolar and they try to follow the electric field which alternates at very high frequency. For a commonly used microwave frequency of 2450 MHz, the electric field changes directions times per second, making the dipoles move with it [6]. Such rotation of molecules means heat generation inside the material; therefore, MWs can generate significant volumetric heat in materials containing high amounts of water [7]. The second major mechanism is ionic conduction linked to the ability of ions to migrate under the influence of the electric field and to generate heat [5].
The heating efficiency of this process can reach values of about 80–85%, which are higher than the efficiencies of the conventional heating methods [8]. MWs can be more efficient and economic than conventional heating methods, as the heat transferred through this technique is generated directly in the material through molecular interactions, instead of originating from external surfaces (as happens in the case of conventional methods) and not conducted from the surface of the heating source into the sample [9]. So, the core of the material gets heated up quickly and the heat flows outwards from the core to the surface. Thus, in microwave heating, there is an inverse heating profile due to convective and radiative heat loss from the surface of the material to the surroundings [10].
In reacting systems, this selective volumetric heating mechanism allows several advantages [4]: (i) it brings an important reduction of reaction times [11]; (ii) it mitigates the reaction conditions [12]; (iii) it provides selective heating with an increase of product yields and purities [13]. In addition, using this way of heating makes the process easier to control and safer, also reducing the complexity of the exchange units and is more environmentally friendly [14].
After the second world war, due to the discovery of the potential of this technique, a slow increment of interest around it was registered [1], which allowed researchers to gradually move from a laboratory-scale approach to an established method that is now also heavily used in industrial applications. Currently, microwave heating under the commercial frequency of 915 or 2450 MHz has been increasingly applied in several fields, including organic and pharmaceutical chemistry, solid-phase peptide and polymer synthesis, material science, nanomaterials research [15], and a variety of chemical [16] and biochemical processes, like enzyme reactions [17], soil treatment [18], disinfection [19], biomass pyrolysis [20], and metallurgy [21].
Microwave heating is based on the dielectric properties of the material and can occur both inside and in the boundaries, where the latter phenomenon is explained by the Maxwell–Wagner polarization [22]. Dielectric properties influence the reflection of electromagnetic waves at the interfaces and the attenuation of the wave energy within materials, which determines the amount of energy that can be absorbed and converted into heat [23]. The dielectric properties of materials that are related to the interactions with microwaves are permeability, permittivity, and electrical conductivity [24]. It is generally accepted that, for most dielectric materials, the permeability presents no or very small contribution to dielectric heating, and so it is usually not considered [25]. Knowing the value of permittivity, on the contrary, is useful to estimate the reaction temperature [15] and to optimize the heating process in order to minimize the energy consumption. The penetration depth of the material is an important parameter for the heating processes efficiency improvement, and it depends on the dielectric properties of the substance [26]. Microwave heating also depends on other elements, i.e., the applicator characteristics, the geometry of the object to be irradiated, the mode of wave propagation, and the radiation frequency and to the temperature, but the dielectric properties of the material have a central role.
In addition to chemistry, the knowledge of material dielectric properties is fundamental to improve MW heating in other interesting fields like, for example, food technology [27], pyrolysis [28], hyperthermia cancer treatments [29], and sterilization of agricultural lands [30].
Despite the important role that permittivity data play in the knowledge of the microwave heating properties, there is still a lack of fundamental data on the dielectric properties of substances and materials, which generates several difficulties with the scaling up from laboratory units to industrial equipment. So, the goal of this work is to provide some useful information about the dielectric properties of a water–ethanol system, which can be representative of many typical solvents of industrial interest, due to the common use of the alcohols in the organic chemistry. In addition to this, also the dielectric properties of water–NaCl mixtures were investigated to extend the applicability of the measurement technique. The measurement method and the collected information suggest how the dielectric characterization of pure substances and binary mixtures can be done with the purposes of the reaction process optimization and the minimization of its energy consumption.
Elements of Dielectric Theory
As already introduced in the previous main section, permittivity is a very important parameter in the characterization of the behavior of a material when exposed to an electromagnetic field. Permittivity is defined as the ability to store electrical energy of a non-conductive material subjected to an electrical field [31]. In the frequency (f) domain, this parameter () is expressed as:
where and are, respectively, the real and the imaginary part, and j the imaginary unit. The real part of permittivity () is also known as the dielectric constant and it represents the energy storage capacity of a material exposed to an electromagnetic field or, in other words, the ability to polarize [32]. The charged molecules contained within materials, under an electromagnetic field, try to orientate following the field and storing electromagnetic energy [6]. This phenomenon is the so-called polarization phenomena: higher values of represent a greater capacity to store electromagnetic energy due to the electronic charge orientation following the field [33]. Four different kinds of polarization phenomena can occur in materials: electronic, atomic, ion, and orientation polarization [34]. The first one occurs in neutral atoms when an electric field displaces the nucleus with respect to the electrons that surround it, resulting in a dipole moment that responds to the applied field, whereas atomic polarization results from nuclei displacement of different atoms in a molecule [35]. The orientation polarization exists only in polar materials and consists of the re-orientation of permanent dipoles caused by the electromagnetic field [36]. This is the dominant mechanism at microwave frequencies [37], persisting in a wide frequency range, approximately 102–1010 Hz, and it depends on the material conductivity and temperature [34].
The imaginary part of permittivity (), on the other side, is related to the dielectric loss, which generally originates from the processes of conduction and polarization and it is known as loss factor [38]. So, materials with a high dissipate more energy and are easier to heat than materials with a low [26]. A perfect insulator has a great value of and its electric charge can instantly react to the field by orientating according to this; however, most of the materials present a phase delay between the dipole alignment and the appearance of the electromagnetic field, so part of the radiation energy is converted into thermal energy. At radio and microwave frequencies, ionic conduction and dipole rotation are the dominant loss mechanisms [39]. In addition to the material ionic conductivity and dipole rotation ability, permittivity depends on the material composition [28] and texture [40], and to a lesser extent on pressure [41]; however, the parameters that mainly affect this variable are frequency and temperature [41]. The frequency influence, in the case of pure liquids, is described by the Debye model [42], where the relaxation time of the material is also taken into account. The relaxation time is a measure of the polarization ability of the material, as it represents the time delay on the material response to an electric field change; this parameter is correlated to the molecular conformation and, in general, increases with the size of molecules [43].
2. Materials and Methods
2.1. Measurement Method
Several techniques for permittivity measurement are available, but all methods have limitations of sample kind and especially in the frequency range.
Alcohols or other dielectric liquids can be considered as good solvents for many biological molecules, body tissues, blood, and bone marrow; therefore, an in-depth permittivity study of various common solvents is essential for chemical and biomedical research. Several techniques have been developed for the measurement of the complex permittivity of liquids. For instance, the most commonly used techniques are coaxial line measurements and capacitive techniques; also the waveguide, the open-ended waveguide, the open-ended coaxial line, the dispersive Fourier transform spectroscopy (DFTS), and the microwave resonant methods, have been applied [44]. In the case of the present study, the parallel plate technique was used. This technique is characterized by the following advantages: it is relatively easy to use, non-destructive, it gives quick responses [45], and it is acceptably accurate (±5%) [29]. For the measurement by this technique, the sample is packed between two electrodes, so realizing an electric condenser, and the value of permittivity is estimated from impedance measurements obtained with the use of an impedance analyzer or an LCR meter [33]. In this work, an impedance analyzer was used, as already done in previous work [29]. This kind of instrument is usually used to measure the transmission and reflection characteristics of devices and networks when a sinusoidal signal with time-variable frequency is applied. After this, the transmitted or reflected signal is compared with the transmitted signal and converted into an impedance measure. In particular, the impedance (Z) values were calculated using the following equation [46]:
where is the impedance of the measuring cell, is the reference impedance of the instrument, calculated using its calibration process, and is the reflection coefficient that takes into account the electromagnetic waves that are reflected by the measurement device. To correlate the impedance measures with the dielectric ones, the following expressions derived from the dielectric theory [31] were used:
where is the capacitance, is the reactance, and is the resistance of the system. The dielectric constant is inversely proportional to the reactance, while the loss factor is inversely proportional to the resistance. So, two calibration straight lines have been built, one where is a function of the inverse of reactance, and another one where is a function of the inverse of resistance, taking as the references two substances with known values of permittivity. This method allowed us to estimate the value of permittivity of the different mixtures analyzed here.
2.2. Design of the Parallel Plate Cell
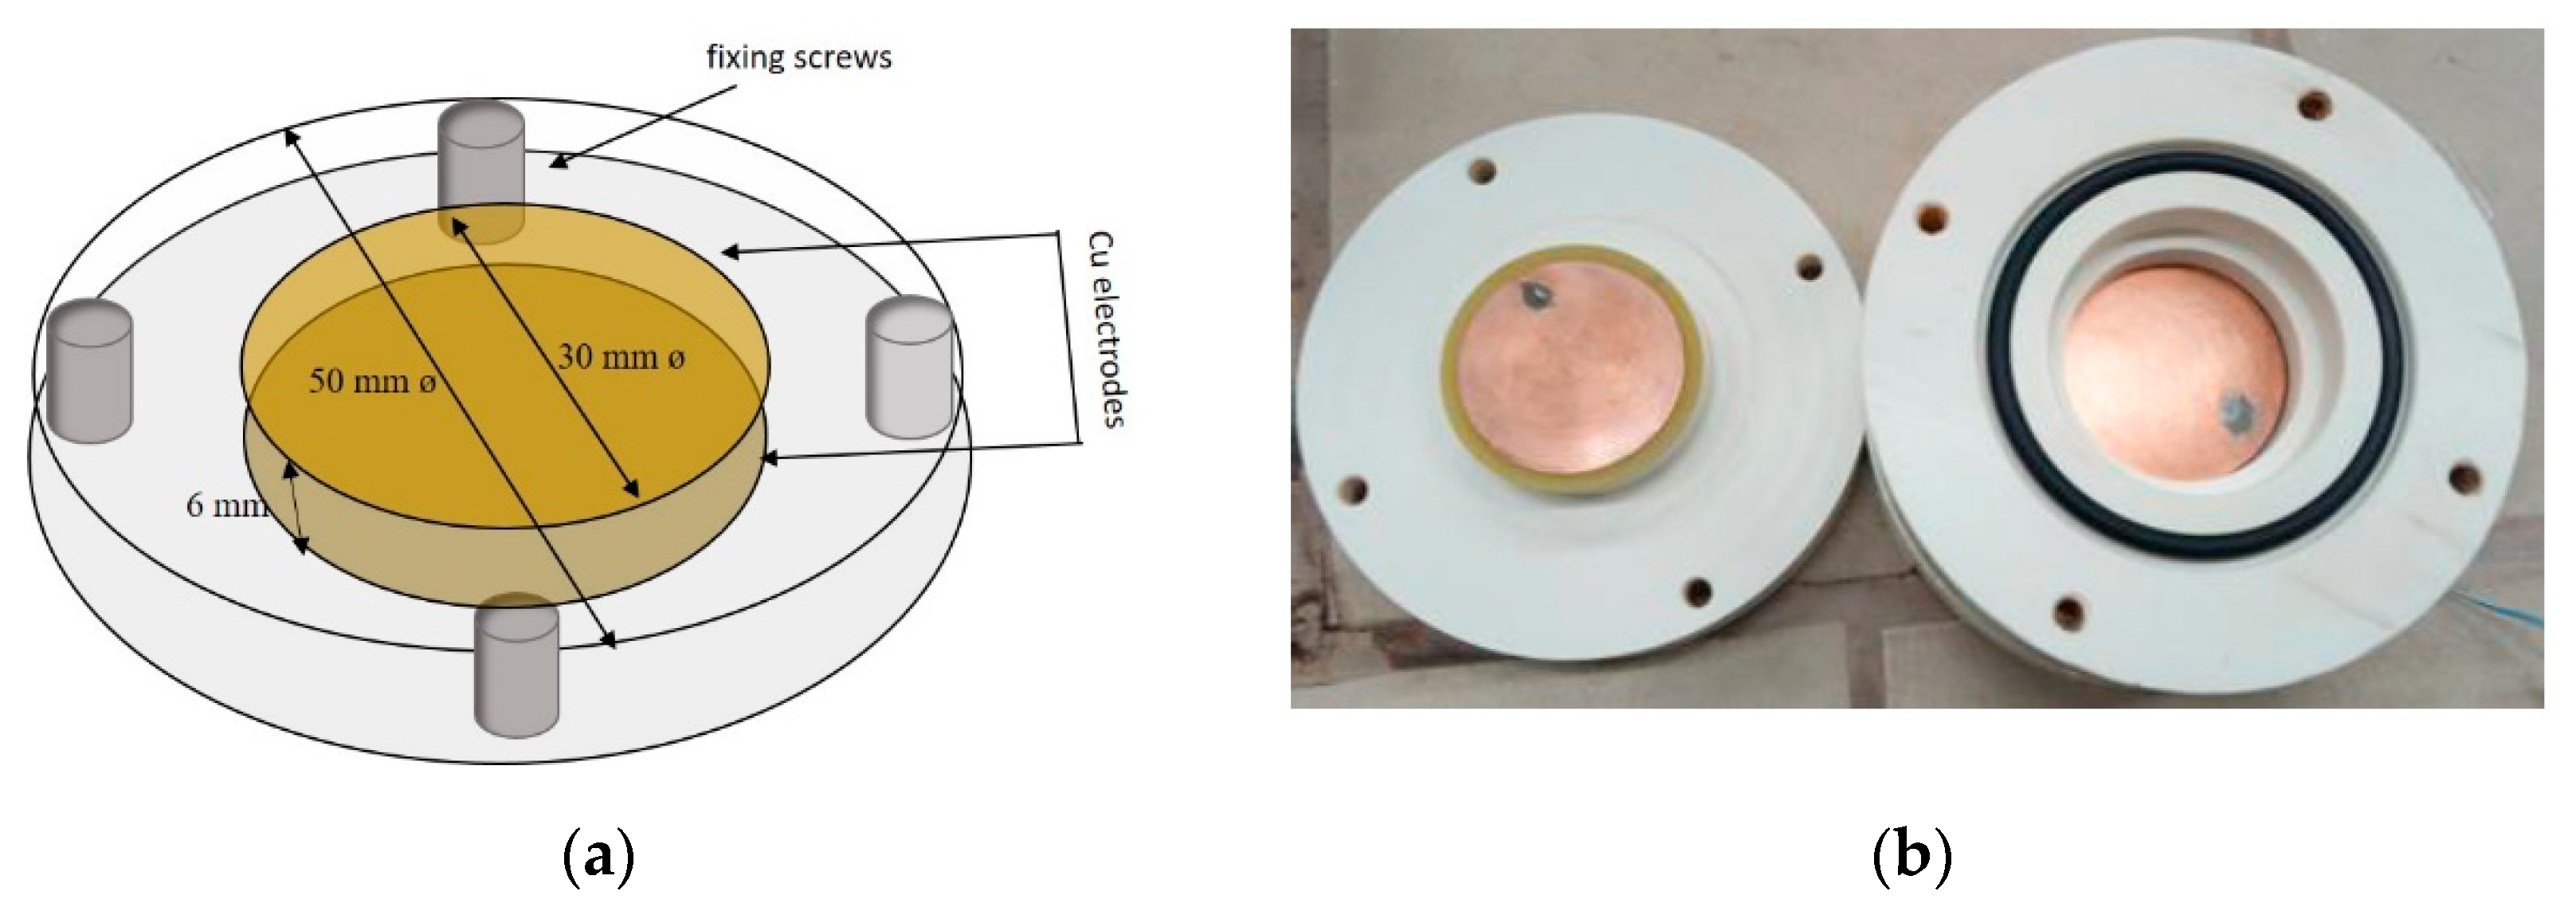
The parallel plate system (shown in Figure 1), to be connected to the impedance analyzer, is a cell, the body of which is made of plastic material (PVC). The cell has two circular copper electrodes of 30 mm diameter and a spacing of 6 mm. In the volume included between the two copper plates, the liquid sample is inserted.
2.3. Experimental
The impedance analyzer used in this work was a Vector Network Analyzer (Hewlett-Packard, model 8720C). This instrument works in the range of frequencies between 50 MHz and 20 GHz, with a frequency resolution of 100 kHz. The cell was connected to the analyzer through a coaxial cable and an SMA connector. Water–ethanol and water–NaCl mixtures, with different compositions, were prepared and measured at room temperature (25 °C). Because of the different structure and varying dynamic response to the external field, each material shows a unique complex dielectric spectrum in the radio–microwave frequency range.
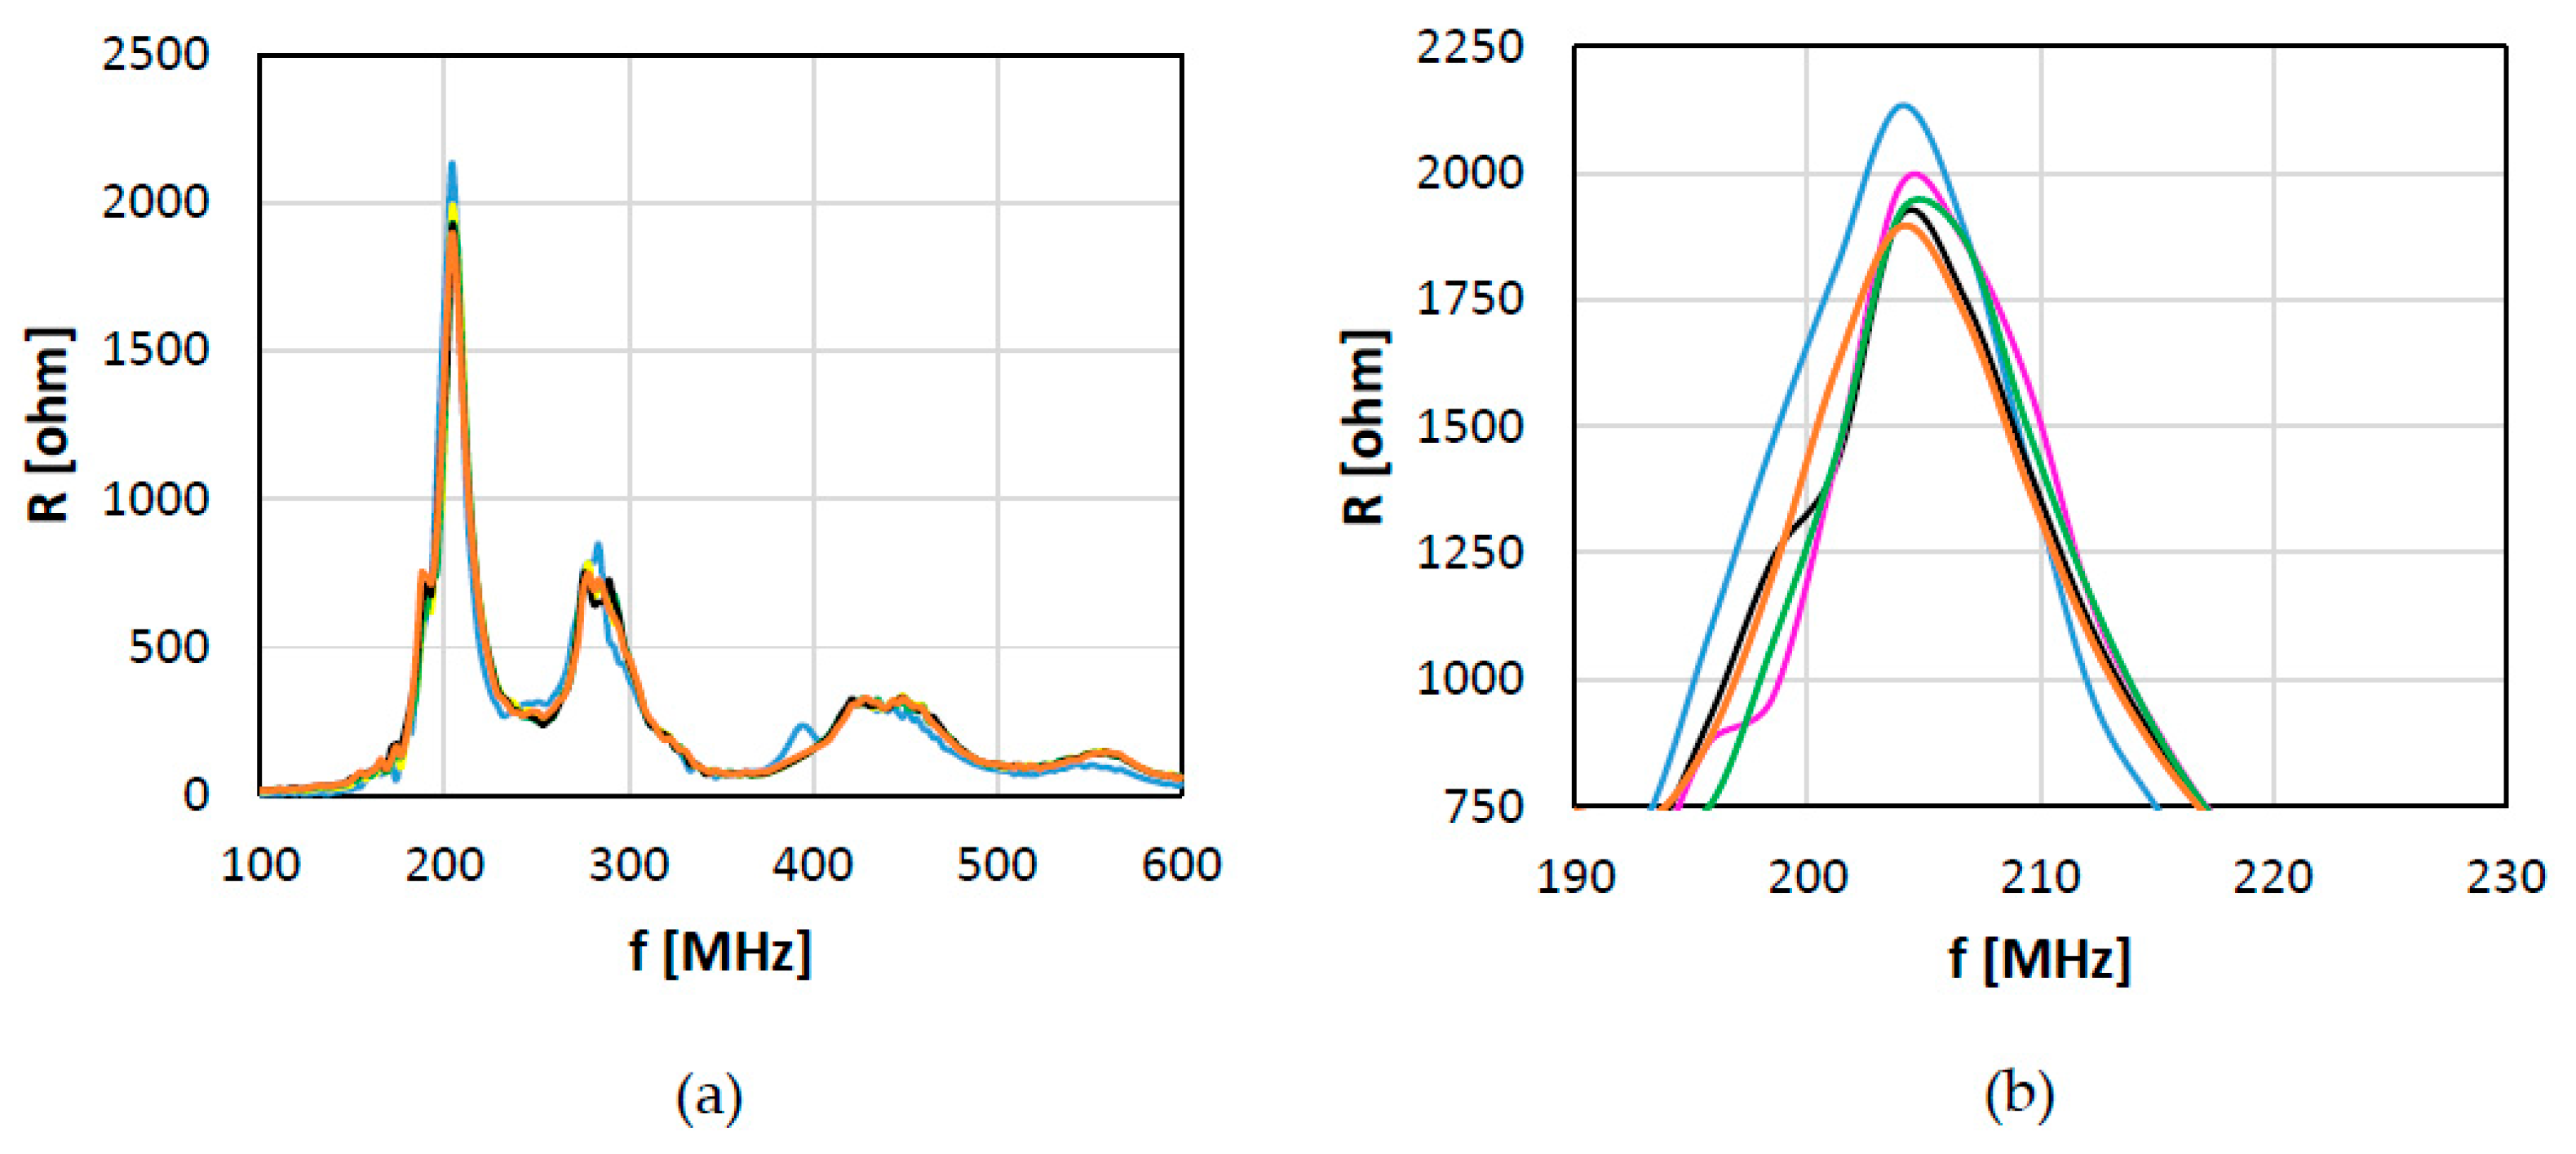
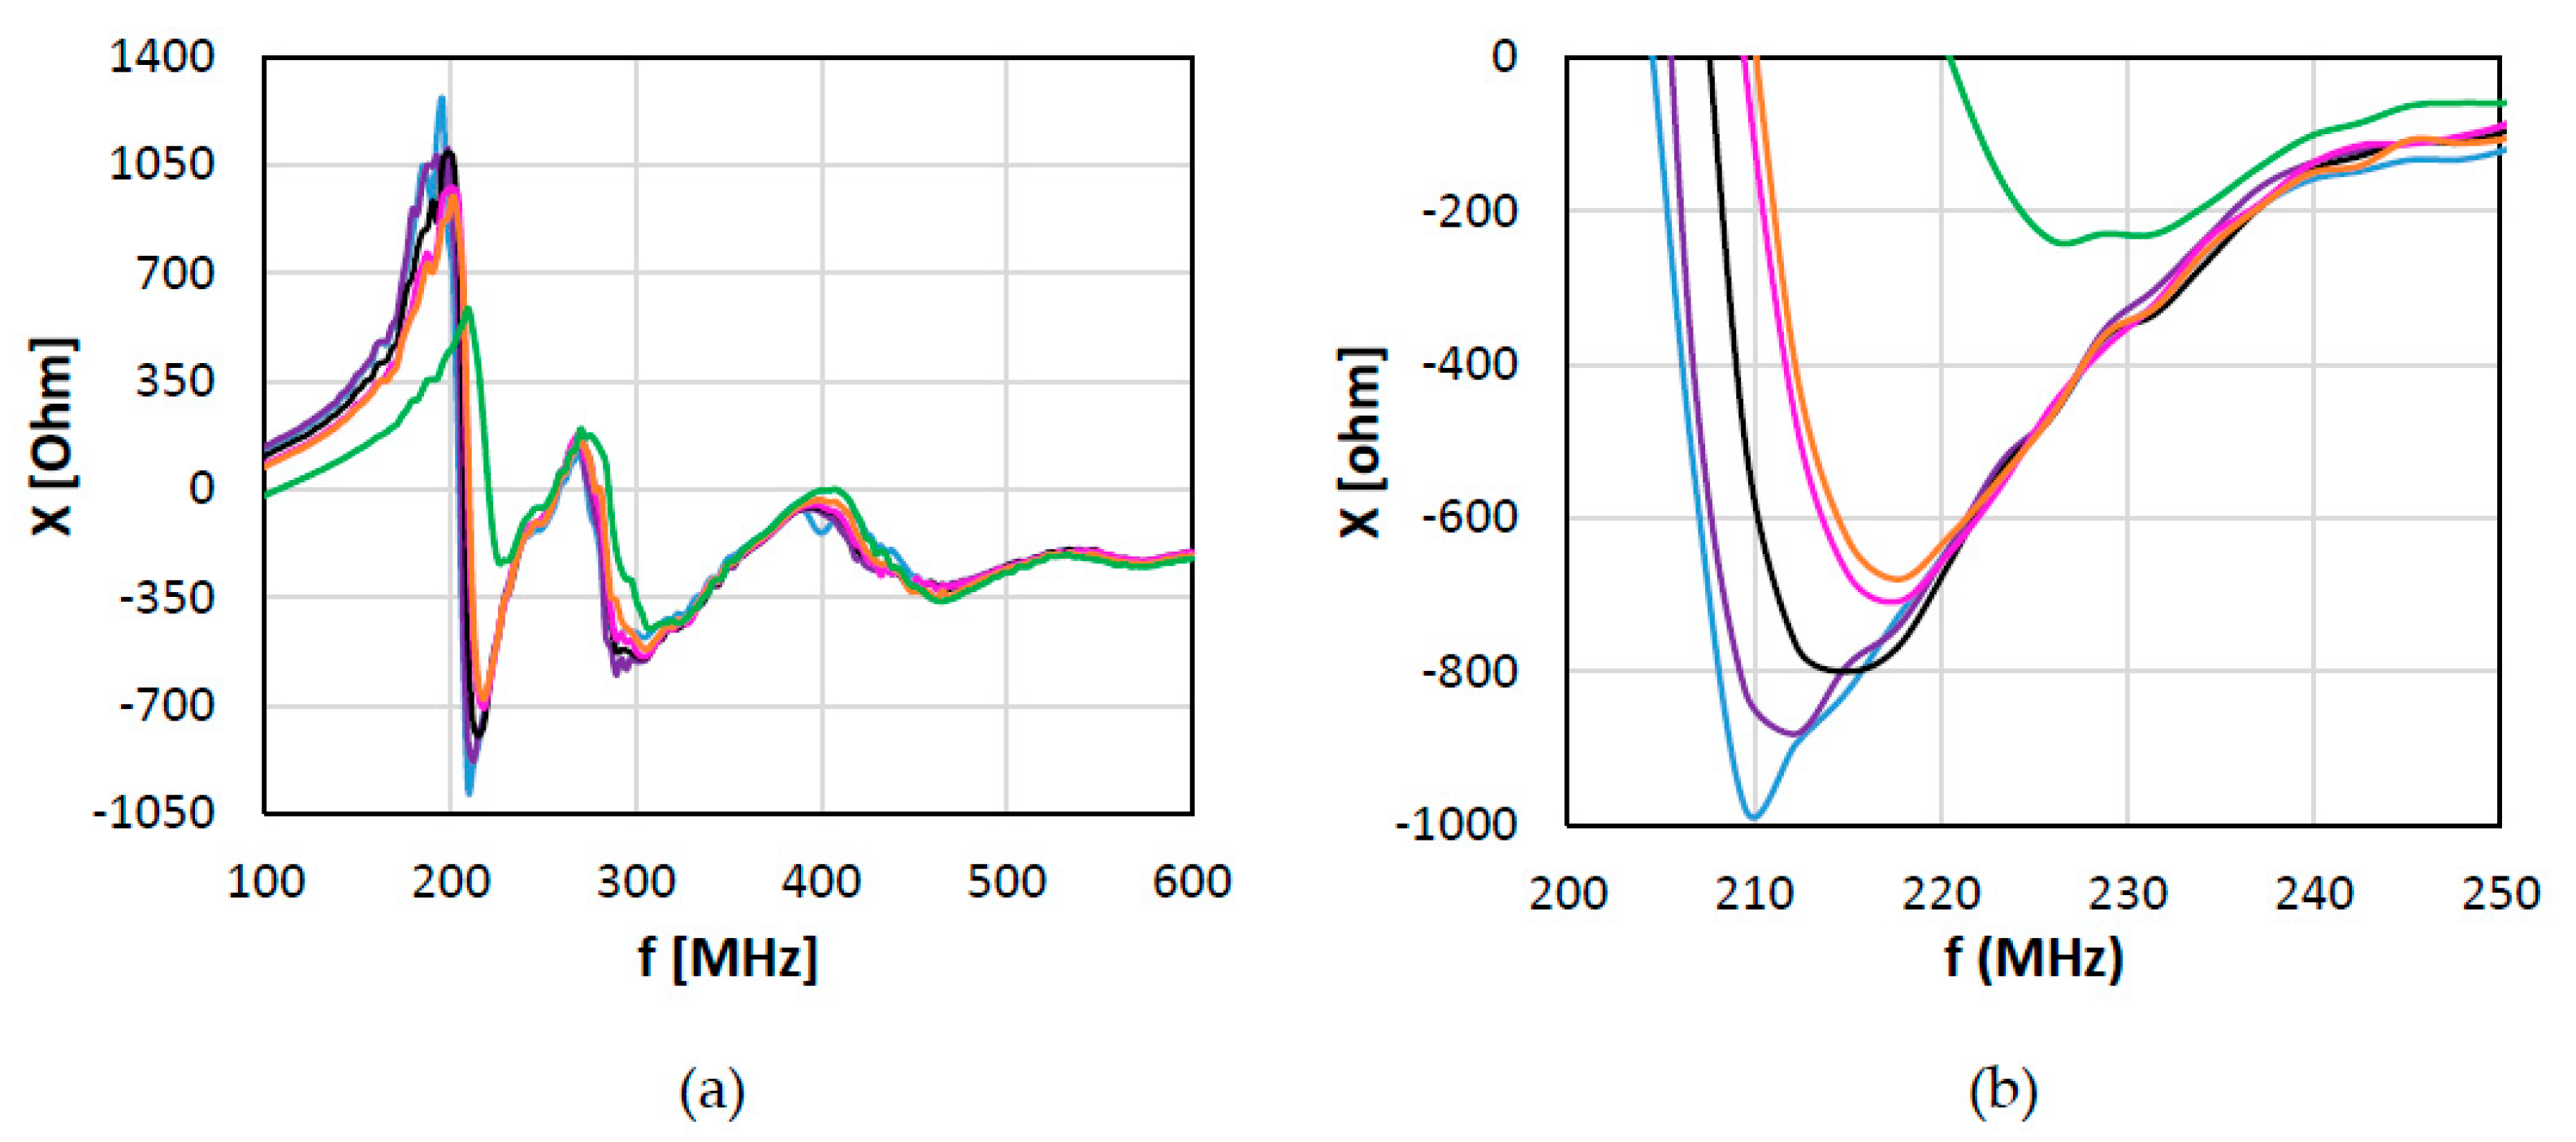
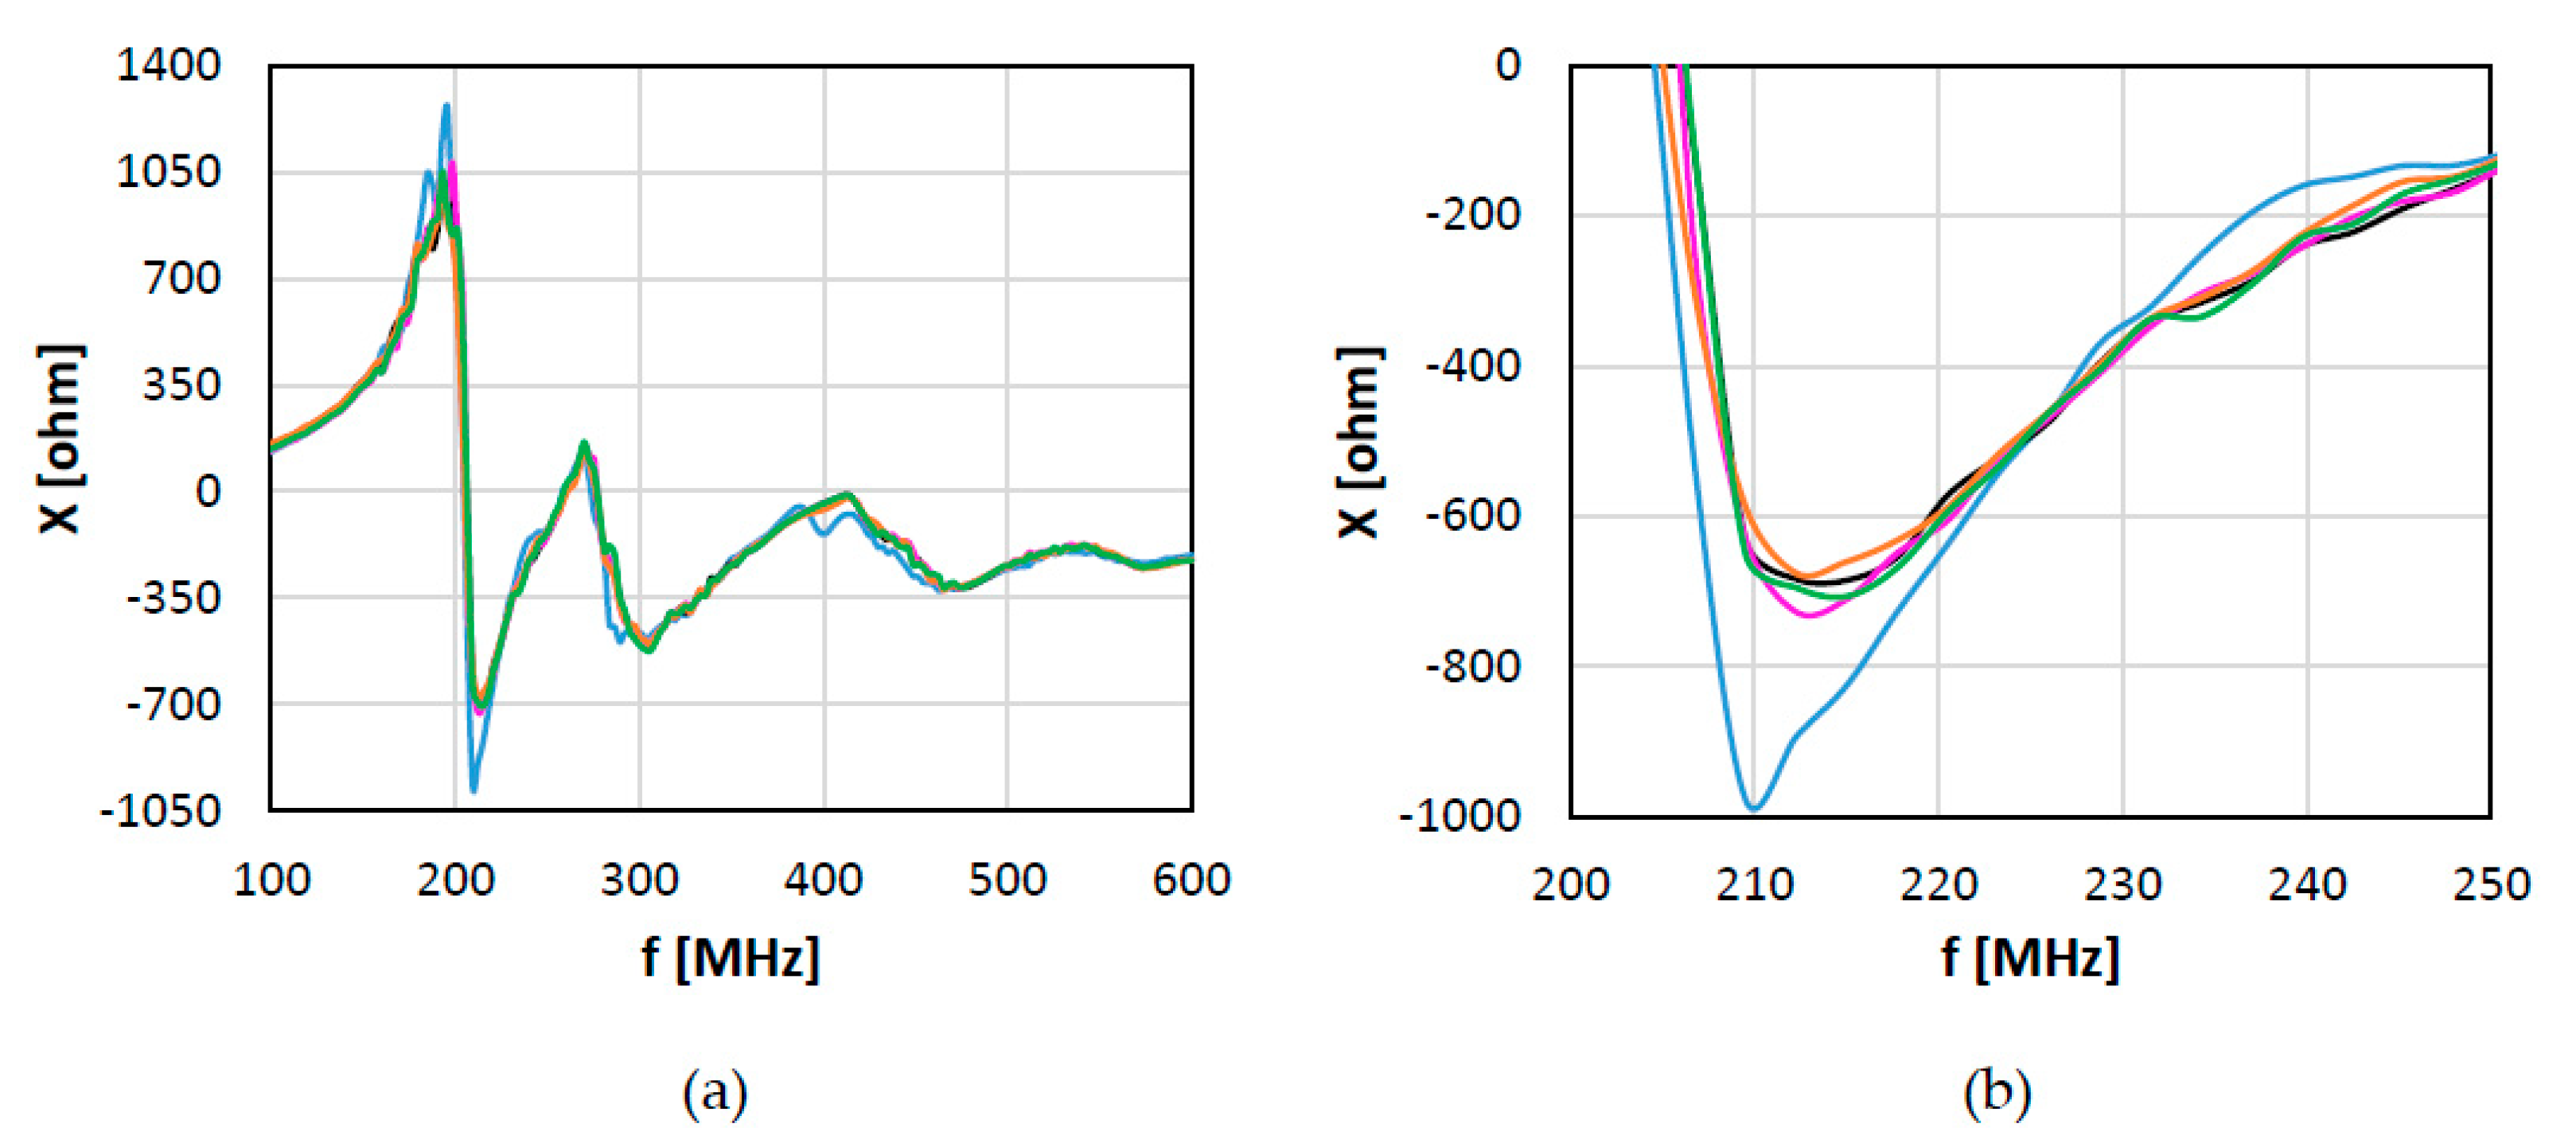
Analyzing the frequency spectra of reported in Figure 2 and Figure 3, and of in Figure 4 and Figure 5, we see that the maximum differences of these values among the various mixtures are located in the maximum peak zone for and the minimum peak zone for . This is true both for water–ethanol mixtures (Figure 2 and Figure 4) and for water–NaCl mixtures (Figure 3 and Figure 5).
According to this, an indication can be obtained focusing on these peak values of and and, in particular, on the maximum values of and the minimum values of . Before carrying out the measurements, the calibration lines were built. Calibration lines for water–ethanol mixtures were obtained using water and 1-propanol with known permittivity values as references, so the measuring range was between 77.5 and 16 for , and between 6.32 and 1.24 for (values of the permittivity of the pure substances—water and 1-propanol, respectively) [41]. For the water–NaCl mixtures, instead, water and water–NaCl 0.1 N (0.584%) were chosen as the reference since the tests showed a flat trend of as the salt increased over this concentration, so it was not useful to utilize solutions with higher salt concentrations. Considering this, the measuring range, in this case, was between 77.0 and 76.0 for and between 59.28 and 1.24 for [41], but in this case, the interest was mainly focused on the imaginary part measure. In Figure 2 and Figure 4, we show that the R and X values of the water–ethanol solutions lie between those of the reference substances and that an increase of the ethanol concentration in the solution corresponds to a decrease of R (Figure 2), and to an increase of X. Similar conclusions can be formulated for NaCl–water solutions (Figure 3 and Figure 5).
2.4. Data Modeling
The experimental data were fitted using two literature models: the Acree model [48] and the King and Queen model [49].
The Acree model is a thermodynamic derivation one that finds application in the prediction of mixtures properties like density, viscosity, surface tension, molar volume [50], and solute solubility in binary solvent mixtures [51]. In this case, it was used in the form given in the literature [52], where to calculate permittivity of a binary mixture with water and alcohol, as was done also by Jouyban [53], was used; therefore, this was the most appropriate to describe the dielectric properties of water–ethanol mixtures, at least. The model equations, respectively for water–ethanol (Equation (7)) and water–NaCl (Equation (8)) mixtures, are the following:
where represents the molar fraction, the subscripts “Eth” and “W” respectively stand for ethanol and water, and the “s” one represents NaCl (salt); i indicates the i-component in the mixture and are the model parameters. For the specific cases under study, the permittivity real part values for the pure substances are and [41]. was set as a model parameter for different reasons: aside the impossibility of measuring, with the same experimental apparatus, the dielectric constant of the pure NaCl, this condition is well outside the range of composition that was studied and would be closer to a biphasic system than to a monophasic (homogeneous) one. Even if, in the cited literature, the model was applied only to the real part of the permittivity, in the present work it was used, with acceptable results, also for the imaginary one, just substituting to in Equations (7) and (8), and considering that, for the pure substances, the permittivity imaginary part values are and [41]; was set, also in this case, as a model parameter. To calculate of the water–salt mixtures, also was set as a model parameter to avoid the calculation problems due to the very high impact of NaCl on the mixture value.
The King and Queen model, instead, was suggested in the literature for the representation of dielectric constant properties of mixtures [52,54]. It was introduced to model other physical properties like critical temperature, density, and compressibility factor [49]. This model uses the Padè approximation of polynomial functions and it is frequently used because its equation form describes the trend of different scientific quantities. In Equation (9) shows the form used to describe the dielectric constant for water–ethanol mixtures, whereas in Equation (10) shows the one used for the water–NaCl real part of permittivity regressions, both in the form proposed by Jouyban et al. [52]:
where α0,1 and β0,1 are the model parameters. Also, in this case, the use of this model was extended to the imaginary part of permittivity, notwithstanding the absence of any application in the literature (as far as we know).
3. Results
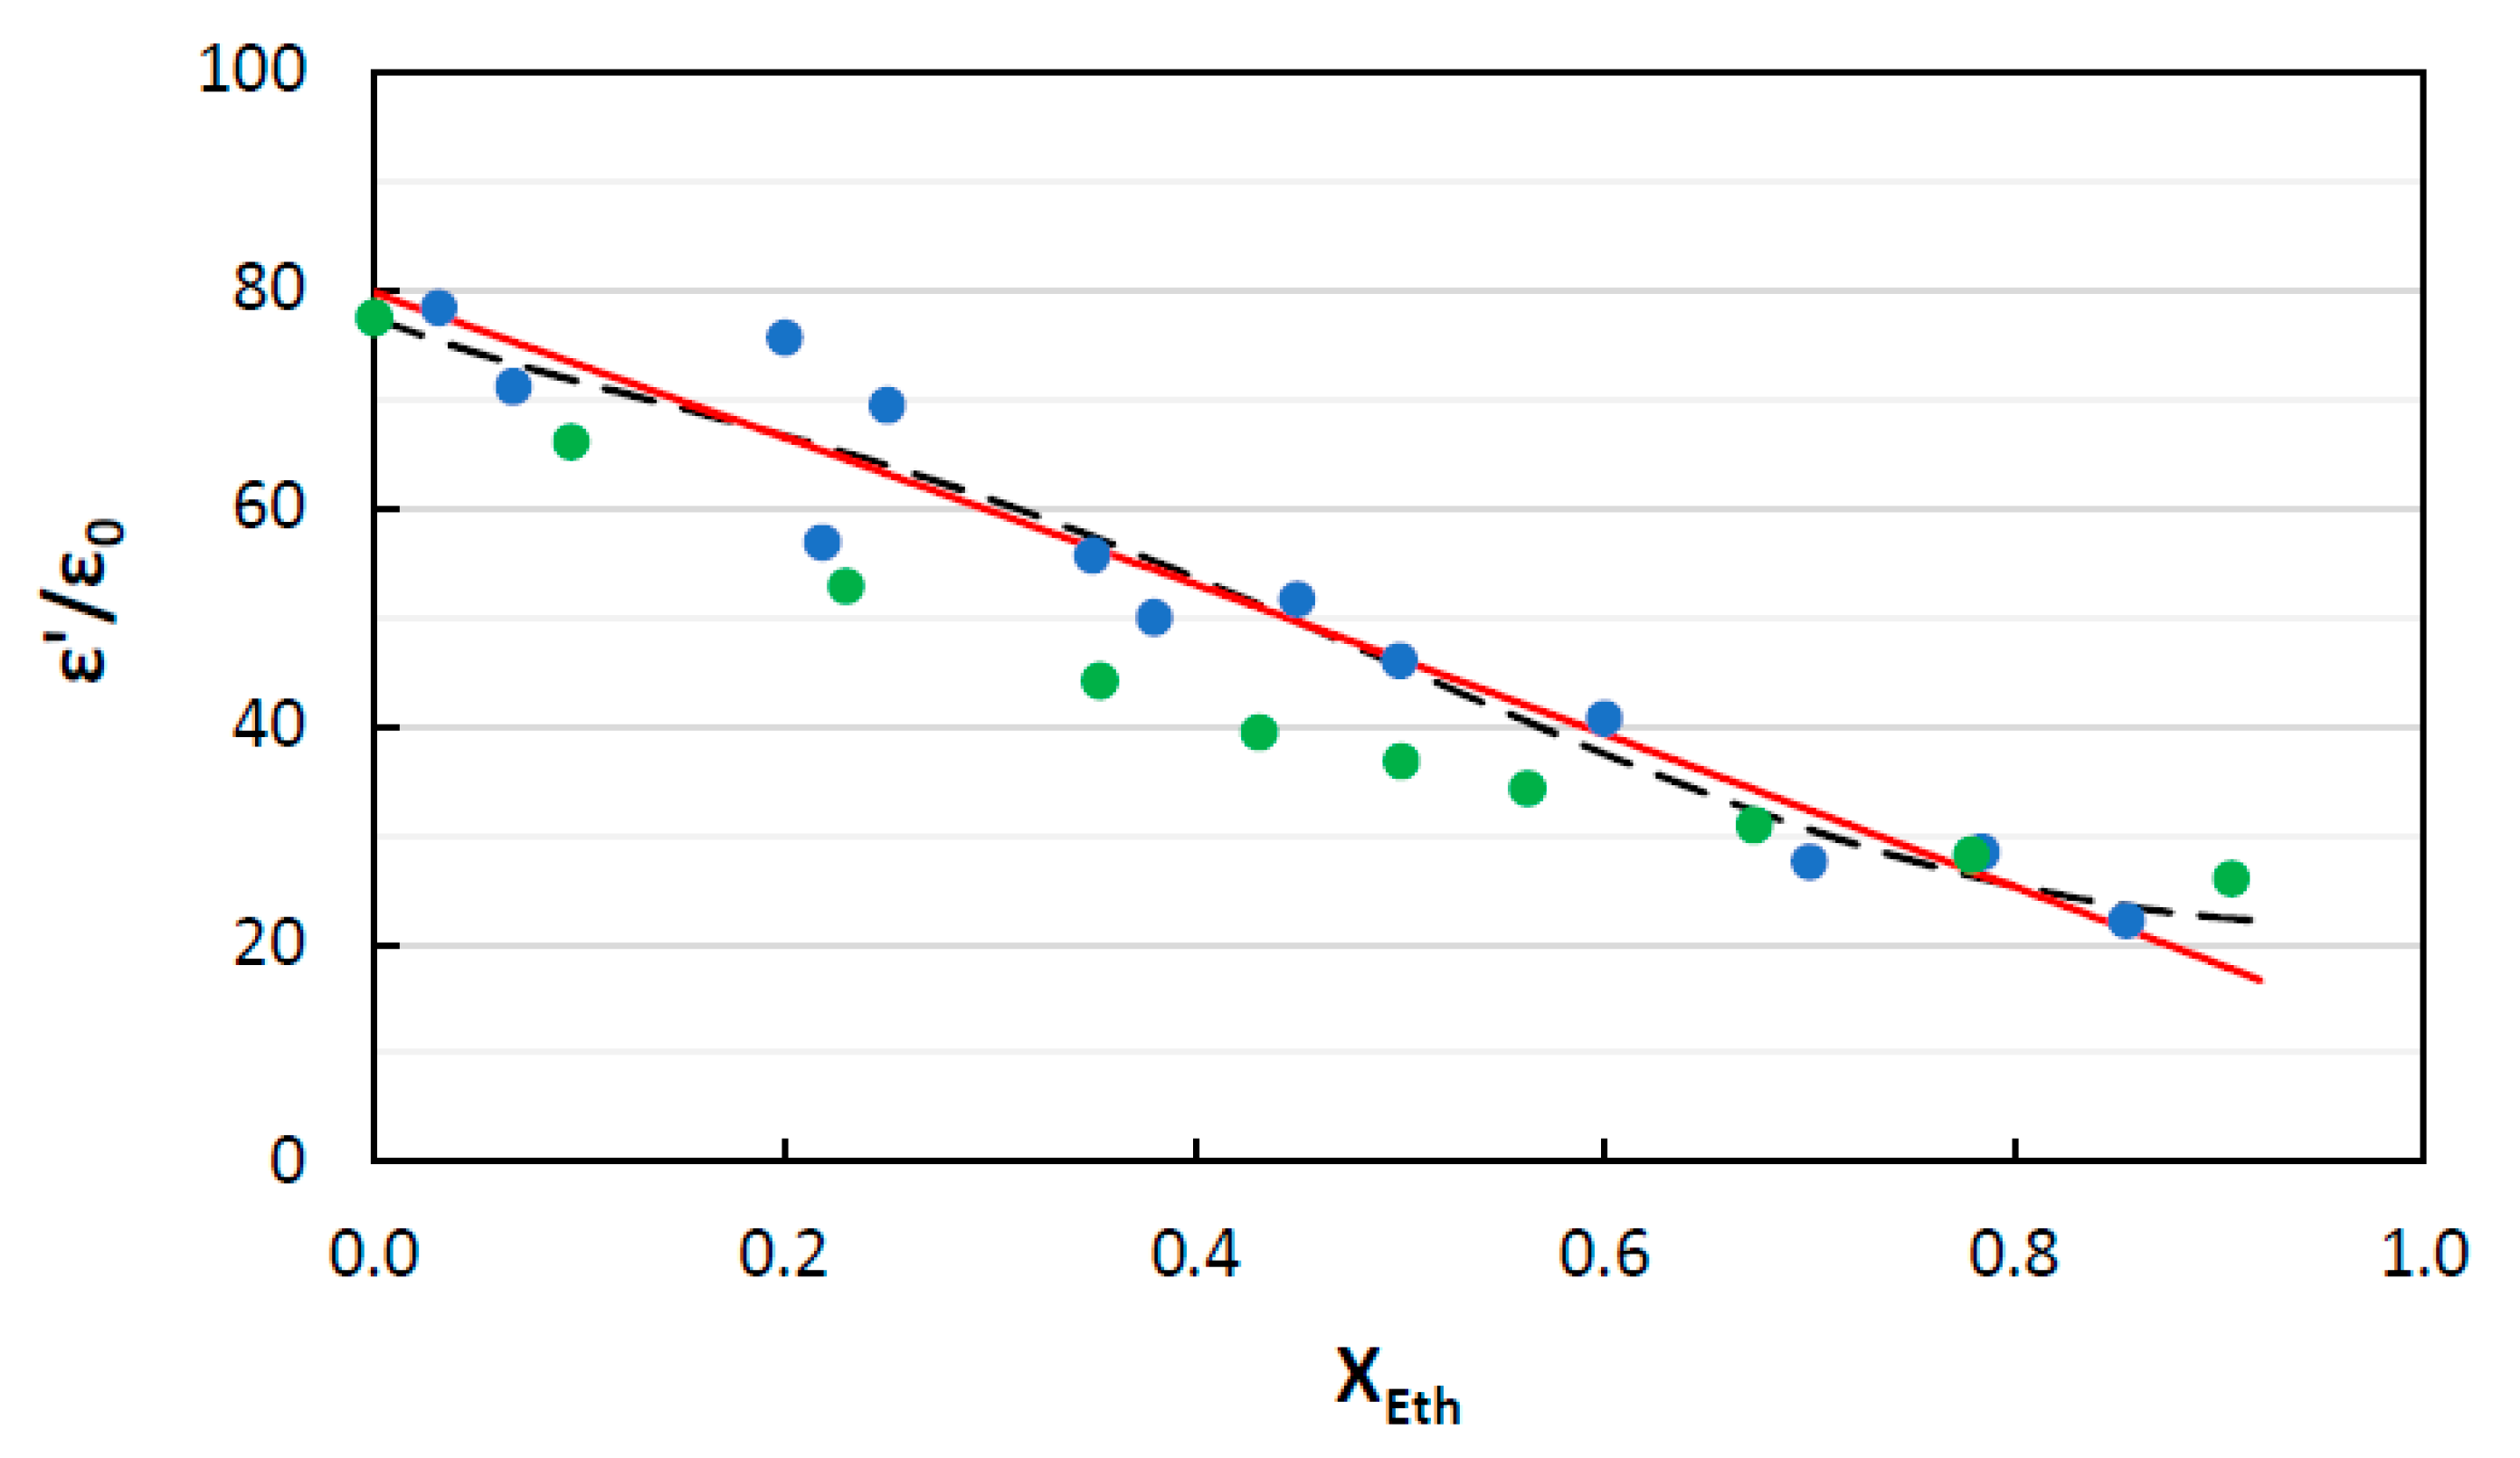
The values of experimental (Figure 6) and (Figure 7) of the water–ethanol mixtures are reported as a function of ethanol mole fraction. Looking at the graphs, the trend as a function of the composition is near to being linear for both and . We also compared the experimental values of , for different compositions, to the water–ethanol mixtures data reported in the literature [55]. The experimental values are different from the literature values near the intermediate compositions, and less for high water or high ethanol concentrations. The overall differences are quite small and the trend is very similar, so it is possible to deduce that the measurement technique is reliable and sufficiently accurate. Both the models, Acree and King and Queen in Figure 6, revealed their ability to accurately describe . The comparison between the two models shows that Acree is more accurate for the measured data.
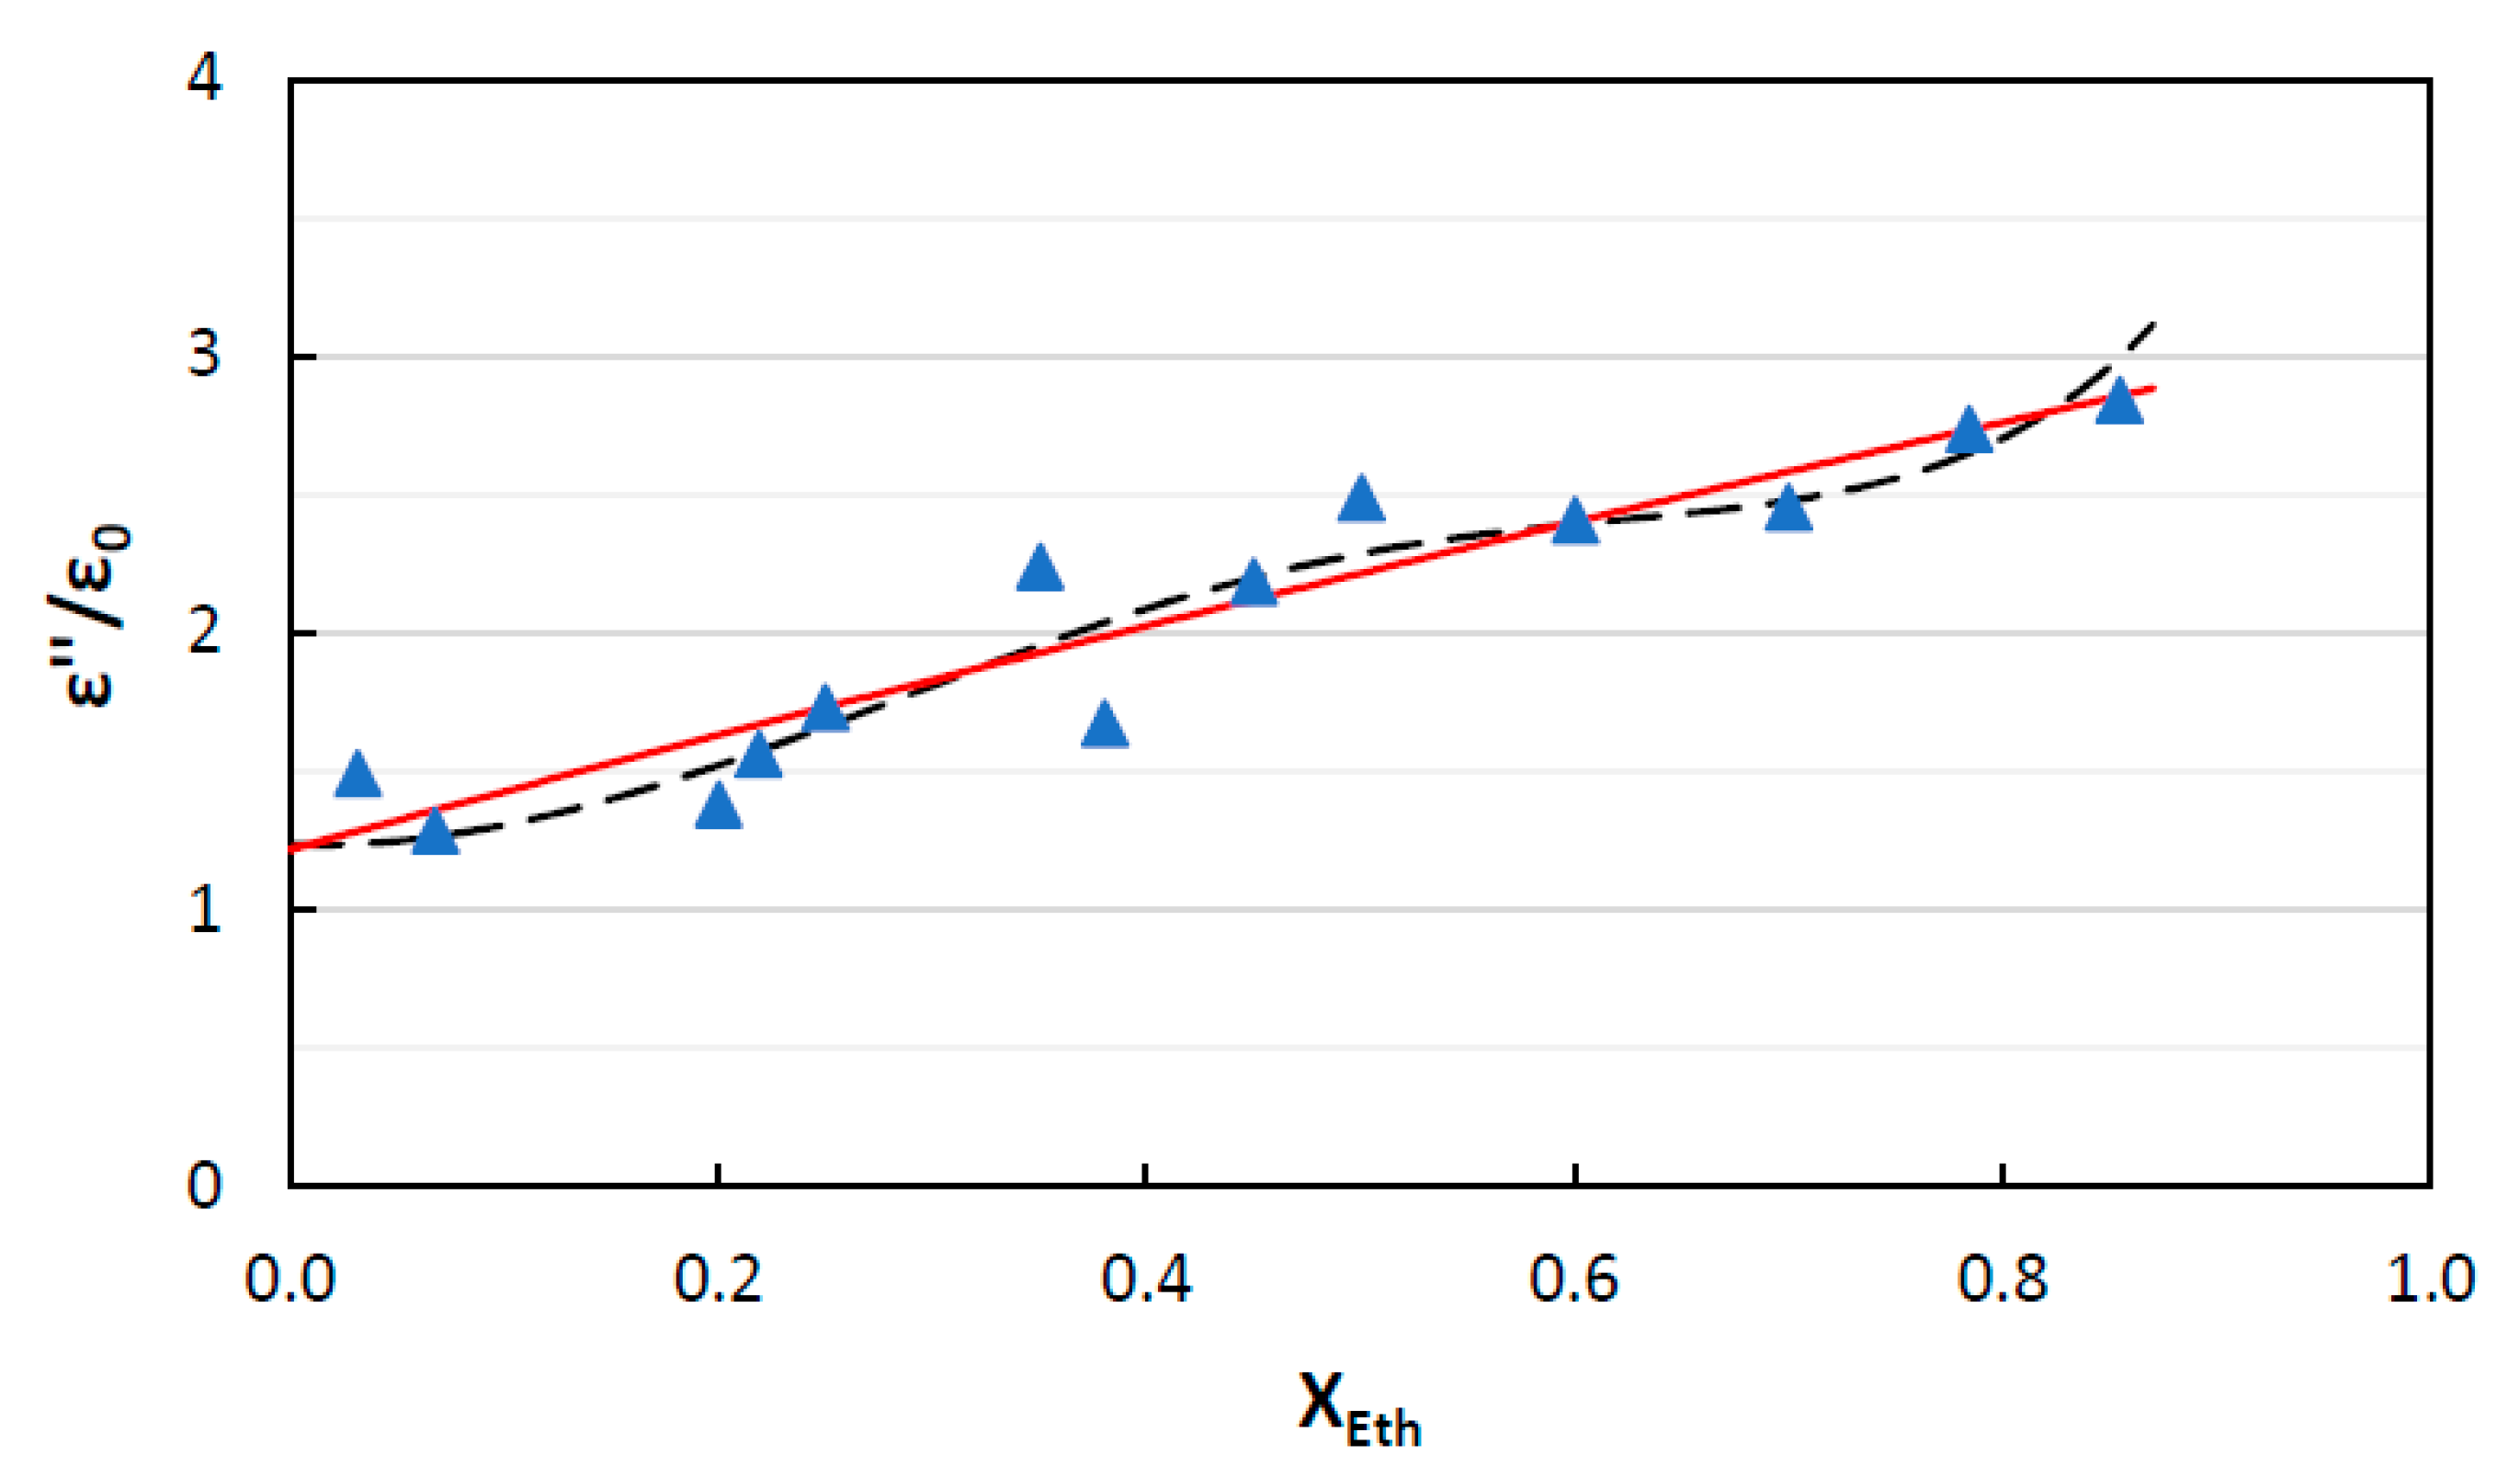
Regarding the values of , it was not possible to make a similar comparison due to the lack (as far as we know) of values of this parameter for the same binary system in the literature. We used the model to test its efficiency for our experimental data. In this case, the dielectric loss is well described by the models.
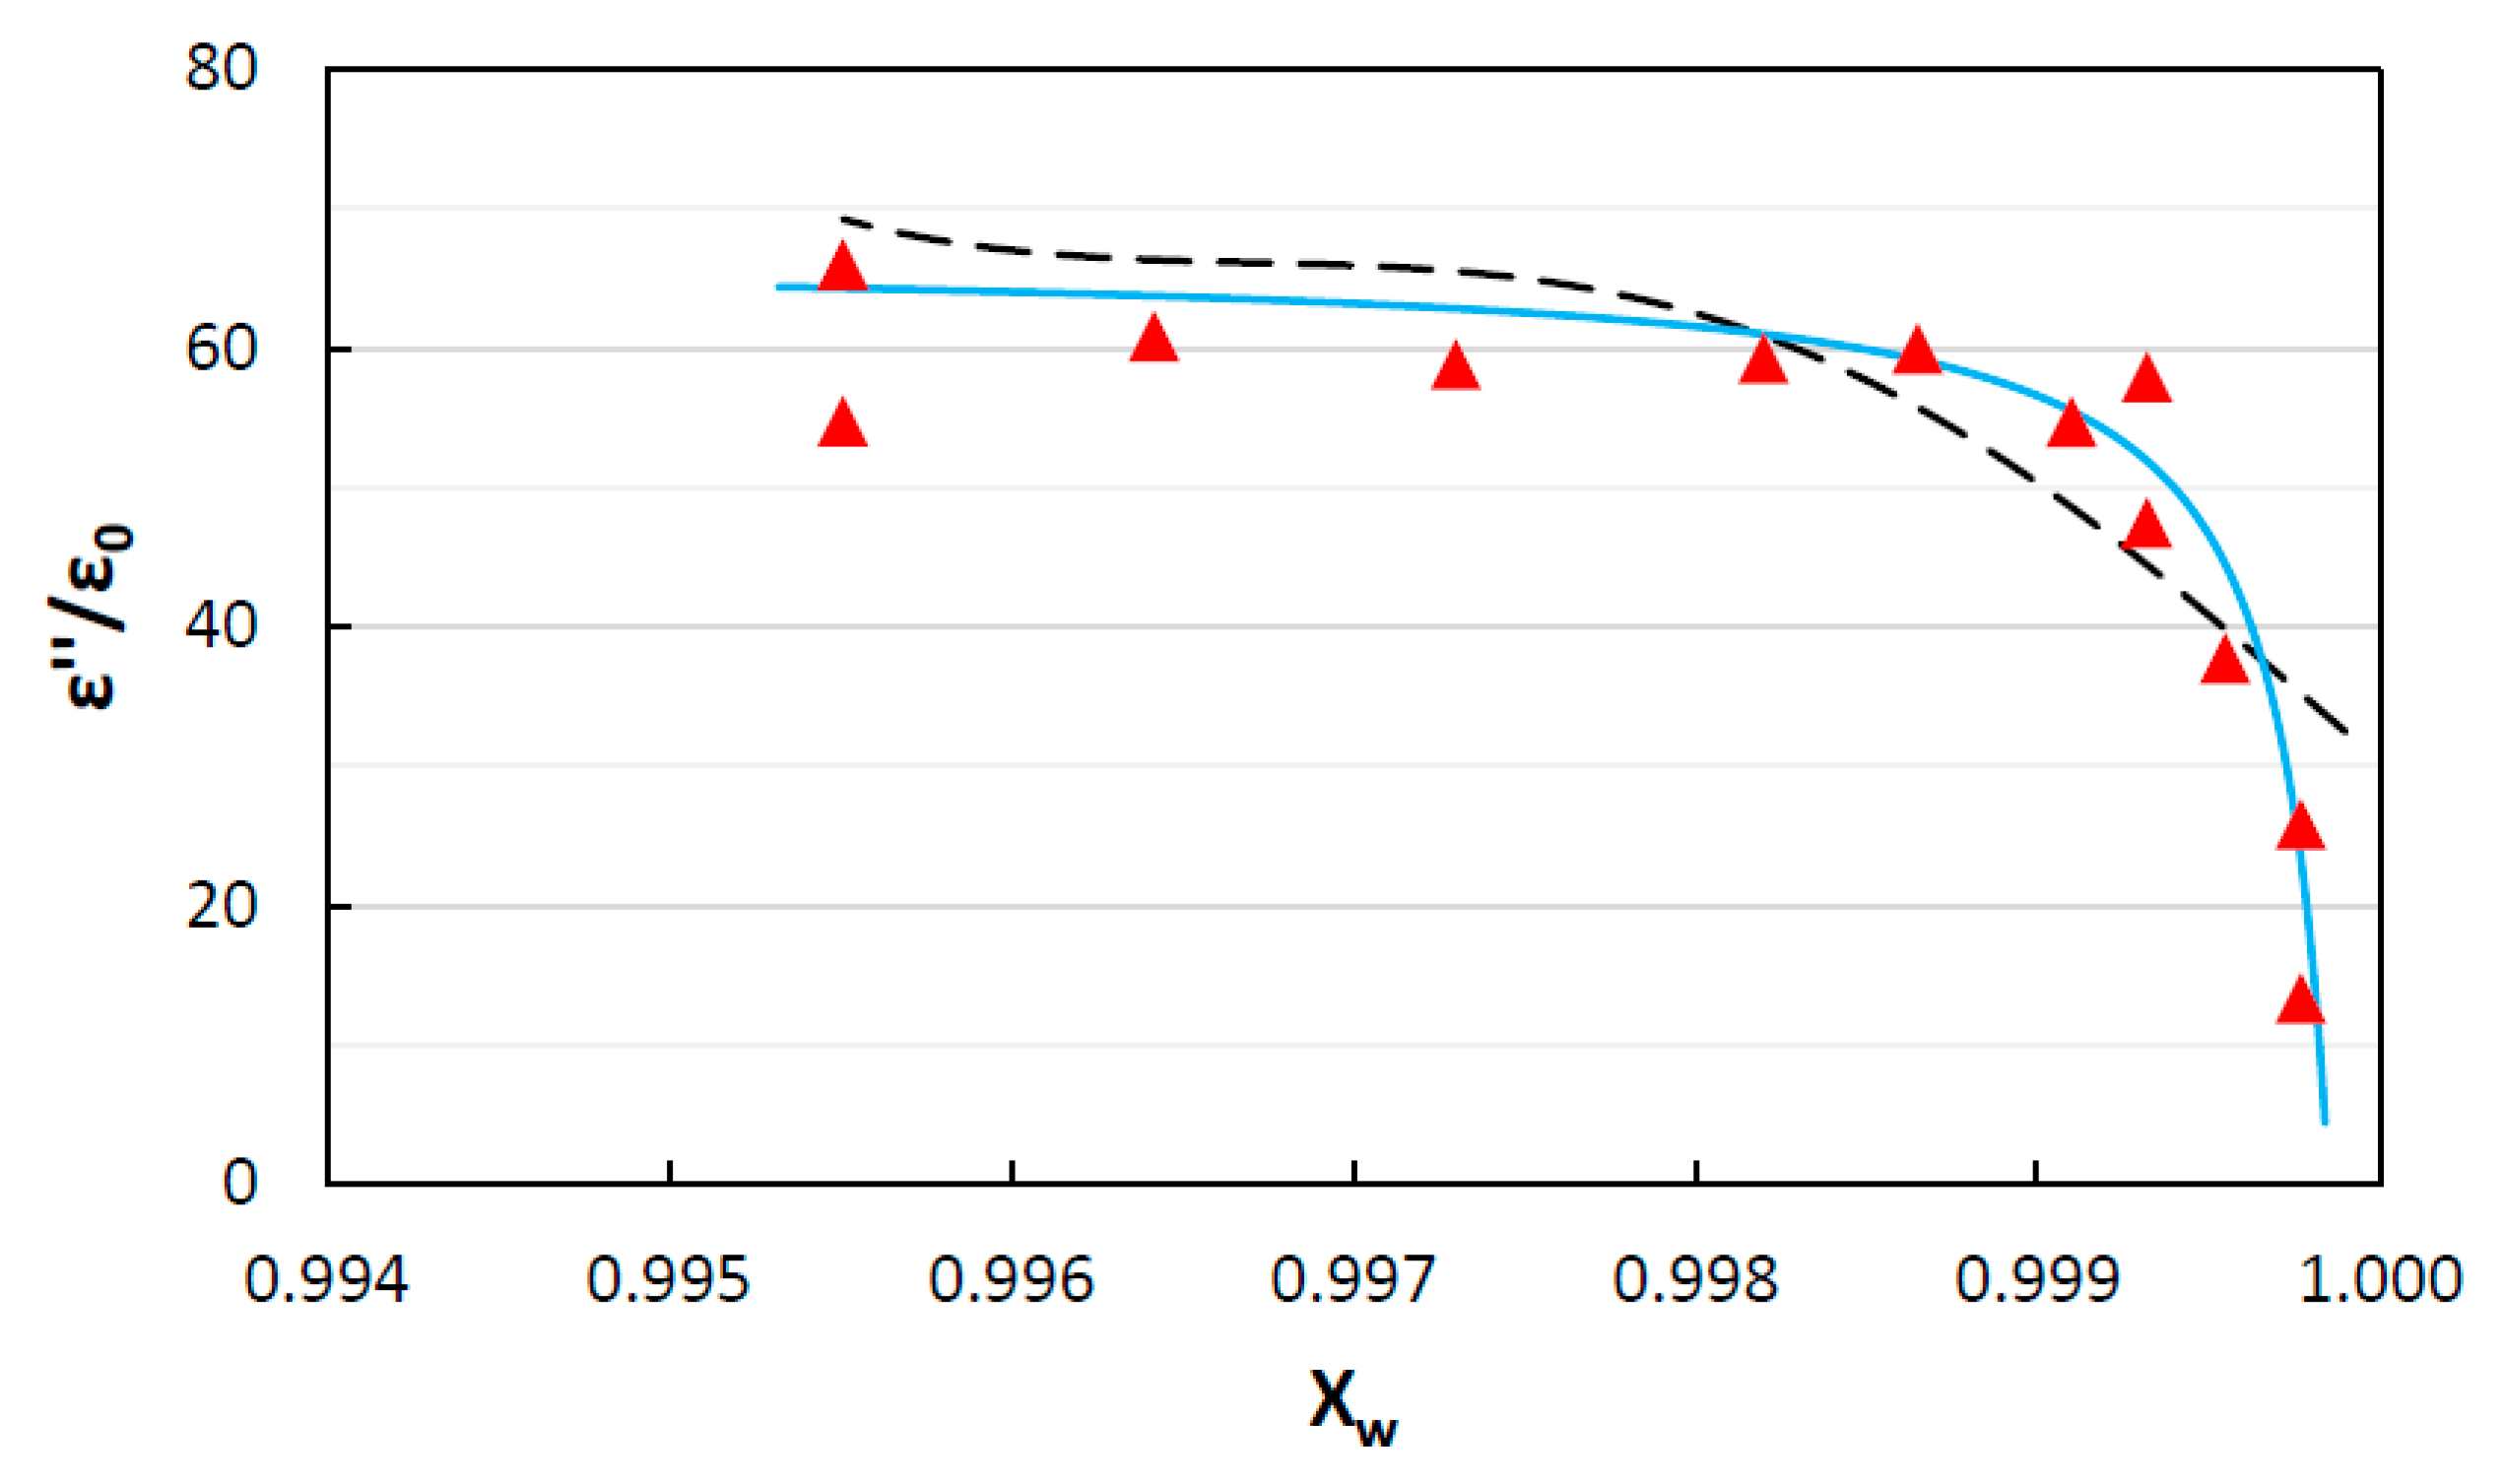
Figure 8 and Figure 9 report, respectively, the values of and of of the water–NaCl mixtures as a function of composition. An increase in the salt concentration leads to a slight decrease of the mixture dielectric constant and a quick increase of the mixture dielectric loss, which ends with a flatter trend for high values of NaCl molar fraction (higher than 0.001). In this case, the data were modeled with the Acree and the King and Queen models, with acceptable results, especially for the dielectric constant. Regarding the dielectric loss, the Acree model appears to be deficient in the description of the data, while the King and Queen one is better and also follows the plateau region that is reached at higher concentrations of NaCl.
4. Discussion
The comparison of the obtained data with the literature data confirmed that the experimental device, designed and developed to measure the impedance of liquid substances and mixtures, and the method of deriving the material permittivity, are suitable to the scope. The models here tested (Acree and King and Queen), even if coming from near, but not the same, experimental applications, were revealed to well fit the experimental data, even with binary chemical systems with very different nature from the dielectric point of view (low conductivity for the water–ethanol mixtures, electrolyte solutions with high conductivity in the case of the water–NaCl systems). As far as we know, these models have been applied for the first time to the loss factor, revealing the possibility of using the same kind of models as for the dielectric constant, even if with different potential to be generalized, probably higher for the King and Queen model.
The Acree model resulted in less accuracy, especially in the case of ε’’ of the water–salt mixtures and, in the other cases, it showed a fluctuating behavior, unlike the King and Queen model, probably because it was set to follow the permittivity of the pure substances as references. The King and Queen model was revealed to be more versatile, offering a better description in the cases of a non-linear trend of the data.
As a goal of future work, it would be interesting to extend this approach to other mixtures and to develop proper modeling to describe possible similitudes and/or differences between similar or different substances. Deeper knowledge about the dielectric behavior of complex systems would be very helpful to make heating and reaction processes more and more selective and efficient, thus contributing to the minimization of their energy consumption and environmental impact.
5. Conclusions
As widely shown in the scientific literature, the use of microwaves is a valid alternative to conventional heating in many industrial processes and technological applications, due to the high efficiency and specificity concerning the heating target. In many chemical and biochemical applications, microwaves show positive effects on reaction time and selectivity. These effects are largely described in many works, but less interest is focused on the physical and chemical mechanisms of interactions between microwave electromagnetic energy and matter. On the other hand, this missing knowledge would be important for the optimization and energy-saving purposes of the microwave heating process in different cases and applications. The method and measure of microwave heating (i.e., transferred energy) strongly depend on the dielectric properties of substances and mixtures, which commonly show a non-ideal behavior concerning the pure substances, but the literature is lacking in wide and detailed databases of their dielectric properties, particularly of the loss factor (which is the main factor responsible for the heating mechanism), and extremely poor of mixtures data and models.
The present work tackles this problem and missing data by proposing a specially designed measuring system that can be used in many different cases of liquid mixtures, and presenting data, of both the real and the imaginary part of permittivity, for two mixtures that are representative of industrially relevant chemical systems (alcohol and salt in water solution), as a function of the binary composition. After this, efforts were devoted to model the experimental data to generalize the results. Two literature models were tested with the experimental data: the Acree model and the King and Queen model. These models were applied, in the literature, to other properties, and in some cases to the real part of permittivity (the dielectric constant). Both of them were revealed to be acceptably suitable to describe the permittivity (both the real and the imaginary part) of the considered mixtures, whose components are very different from the dielectric point of view. The King and Queen model was shown to be overall more accurate. The results highlight the need for wider and deeper studies on the dielectric properties of materials, and particularly of mixtures of substances. The topic is still unconsolidated, and a complete assessment of the model accuracy in describing the permittivity of mixtures will be possible only when much more data will be available in the literature.
Author Contributions
Conceptualization, F.F., G.M., and F.D.; methodology, F.F., G.M., and F.D.; software, F.F., G.M., and C.D.; validation, F.F. and F.D.; formal analysis, R.C. and F.D.; investigation, F.F. and C.D.; resources, F.D. and G.M.; data curation, F.F.; writing—original draft preparation, F.F.; writing—review and editing, F.D. and R.C.; visualization, F.F. and F.D.; supervision, F.D.; project administration, F.D. All authors have read and agreed to the published version of the manuscript.
Funding
This research received no external funding.
Conflicts of Interest
The authors declare no conflict of interest.
References
- Jones, D.A.; Lelyveld, T.P.; Mavrofidis, S.D.; Kingman, S.W.; Miles, N.J. Microwave heating applications in environmental engineering—A review. Resour. Conserv. Recycl. 2002, 34, 75–90. [Google Scholar] [CrossRef]
- Council, N.R. Microwave Processing of Materials; The National Academies Press: Washington, DC, USA, 1994; ISBN 978-0-309-05027-2. [Google Scholar]
- Feng, H.; Yin, Y.; Tang, J. Microwave Drying of Food and Agricultural Materials: Basics and Heat and Mass Transfer Modeling. Food Eng. Rev. 2012, 4, 89–106. [Google Scholar] [CrossRef]
- Horikoshi, S.; Schiffmann, R.F.; Fukushima, J.; Serpone, N. Microwave Heating. In Microwave Chemical and Materials Processing; Springer: Singapore, 2018; pp. 47–85. [Google Scholar]
- Kumar, C.; Karim, M.A. Microwave-convective drying of food materials: A critical review. Crit. Rev. Food Sci. Nutr. 2019, 59, 379–394. [Google Scholar] [CrossRef] [Green Version]
- Kumar, C. Modelling Intermittent Microwave Convective Drying (IMCD) of Food Materials. Ph.D. Thesis, Queensland University of Technology, Brisbane, Australia, 2015. [Google Scholar]
- Zhang, M.; Jiang, H.; Lim, R.X. Recent developments in microwave-assisted drying of vegetables, fruits, and aquatic products-drying kinetics and quality considerations. Dry. Technol. 2010, 28, 1307–1316. [Google Scholar] [CrossRef]
- Metaxas, A.C.; Meredith, R.J. Book Review: Industrial Microwave Heating. J. Microw. Power Electromagn. Energy 1989, 24, 108. [Google Scholar] [CrossRef]
- Jiang, Y.; Liu, B.; Liu, P.; Peng, J.; Zhang, L. Dielectric Characterization and Microwave Roasting of Molybdenite Concentrates at 915 MHz Frequency. J. Harbin Inst. Technol. New Ser. 2019, 26, 58–67. [Google Scholar]
- Vasudev, H.; Singh, G.; Bansal, A.; Vardhan, S.; Thakur, L. Microwave heating and its applications in surface engineering: A review. Mater. Res. Express 2019, 6, 102001. [Google Scholar] [CrossRef]
- Motasemi, F.; Salema, A.A.; Afzal, M.T. Dielectric characterization of corn stover for microwave processing technology. Fuel Process. Technol. 2015, 131, 370–375. [Google Scholar] [CrossRef]
- De La Hoz, A.; Díaz-Ortiz, Á.; Moreno, A. Microwaves in organic synthesis. Thermal and non-thermal microwave effects. Chem. Soc. Rev. 2005, 34, 164–178. [Google Scholar] [CrossRef]
- Jahirul, M.I.; Rasul, M.G.; Chowdhury, A.A.; Ashwath, N. Biofuels production through biomass pyrolysis—A technological review. Energies 2012, 5, 4952–5001. [Google Scholar] [CrossRef]
- Chen, H.; Li, T.; Wang, Z.; Ye, R.; Li, Q. Effect of dielectric properties on heat transfer characteristics of rubber materials via microwave heating. Int. J. Therm. Sci. 2020, 148, 106162. [Google Scholar] [CrossRef]
- Kappe, C.O. How to measure reaction temperature in microwave-heated transformations. Chem. Soc. Rev. 2013, 42, 4977–4990. [Google Scholar] [CrossRef] [PubMed]
- Fanti, A.; Casu, S.; Desogus, F.; Djuric, N.; Mazzarella, G. Design and optimization of a microwave irradiated and resonant continuous biochemical reactor. Radio Sci. 2016, 51, 1199–1212. [Google Scholar] [CrossRef] [Green Version]
- Casu, S.; Fanti, A.; Djuric, N.; Desogus, F.; Mazzarella, G. Microwave resonant cavity as a reactor for the enzymatic hydrolysis of sucrose. In Proceedings of the 2015 IEEE 15th Mediterranean Microwave Symposium (MMS), Lecce, Italy, 30 November–2 December 2015. [Google Scholar]
- Fanari, F.; Dachena, C.; Carta, R.; Desogus, F. Heat transfer modeling in soil microwave heating. Chem. Eng. Trans. 2019, 76, 709–714. [Google Scholar]
- Desogus, F.; Fanti, A.; Casu, S.; Spanu, M.; Bruno Lodi, M.; Mazzarella, G.; Bisceglia, B. Use of microwaves for disinfection of farmland: A feasibility study. Chem. Eng. Trans. 2016, 52, 1195–1200. [Google Scholar]
- Paz-García, E.J.; Paredes-Carrera, S.P.; Flores-Valle, S.O.; Rodríguez-Clavel, I.S.; Sánchez-Ochoa, J.C.; Pérez-Gutiérrez, R.M. Synthesis of CuO for microwave-assisted pyrolysis of biomass. Appl. Sci. 2019, 9, 5525. [Google Scholar] [CrossRef] [Green Version]
- Mattli, M.; Matli, P.; Shakoor, A.; Amer Mohamed, A. Structural and Mechanical Properties of Amorphous Si3N4 Nanoparticles Reinforced Al Matrix Composites Prepared by Microwave Sintering. Ceramics 2019, 2, 126–134. [Google Scholar] [CrossRef] [Green Version]
- Zlotorzynski, A. The Application of Microwave Radiation to Analytical and Environmental Chemistry. Crit. Rev. Anal. Chem. 1995, 25, 43–76. [Google Scholar] [CrossRef]
- Birla, S.L.; Wang, S.; Tang, J.; Tiwari, G. Characterization of radio frequency heating of fresh fruits influenced by dielectric properties. J. Food Eng. 2008, 89, 390–398. [Google Scholar] [CrossRef] [Green Version]
- Huang, Z.; Marra, F.; Subbiah, J.; Wang, S. Computer simulation for improving radio frequency (RF) heating uniformity of food products: A review. Crit. Rev. Food Sci. Nutr. 2018, 58, 1033–1057. [Google Scholar] [CrossRef]
- Zhang, H.; Datta, A.K. Electromagnetics of Microwave Heating: Magnitude and Uniformity of Energy Absorption in an Oven. In Handbook of Microwave Technology for Food Applications; CRC Press: Cleveland, OH, USA, 2001; pp. 33–68. [Google Scholar]
- Marra, F.; Zhang, L.; Lyng, J.G. Radio frequency treatment of foods: Review of recent advances. J. Food Eng. 2009, 91, 497–508. [Google Scholar] [CrossRef]
- Datta, A.K. Handbook of Microwave Technology for Food Application; CRC Press: Boca Raton, FL, USA, 2001. [Google Scholar]
- Desogus, F.; Pili, F.; Carta, R. Experimental study on the axial mass transport of minced biomass (rape straw) into a pyrolysis rotating reactor working in the slipping regime. Chem. Eng. Sci. 2016, 145, 80–89. [Google Scholar] [CrossRef]
- Fanari, F.; Muntoni, G.; Dachena, C. Permittivity Measurements of Simulated Biological Tissues for Hyperthermia Applications. In Proceedings of the 2018 26th Telecommunications Forum (TELFOR), Belgrade, Serbia, 20–21 November 2018. [Google Scholar]
- Fanti, A.; Spanu, M.; Lodi, M.B.; Desogus, F.; Mazzarella, G. Nonlinear Analysis of Soil Microwave Heating: Application to Agricultural Soils Disinfection. IEEE J. Multiscale Multiphysics Comput. Tech. 2017, 2, 105–114. [Google Scholar] [CrossRef]
- Lvovich, V.F. Impedance Spectroscopy: Applications to Electrochemical and Dielectric Phenomena; Wiley: Hoboken, NJ, USA, 2012; ISBN 9780470627785. [Google Scholar]
- Yin, P.; Zhang, L.; Wang, J.; Feng, X.; Zhao, L.; Rao, H.; Wang, Y.; Dai, J. Preparation of SiO2-MnFe2O4 composites via one-pot hydrothermal synthesis method and microwave absorption investigation in S-band. Molecules 2019, 24, 2605. [Google Scholar] [CrossRef] [Green Version]
- Nollet, L.M.L.; Toldrá, F. Advances in Food Diagnostics; John Wiley & Sons: Hoboken, NJ, USA, 2007; ISBN 0813822211. [Google Scholar]
- Schönhals, A.; Kremer, F. Theory of Dielectric Relaxation. In Broadband Dielectric Spectroscopy; Springer: Berlin/Heidelberg, Germany, 2003; pp. 1–33. [Google Scholar]
- Wei, W.; Shao, Z.; Zhang, Y.; Qiao, R.; Gao, J. Fundamentals and applications of microwave energy in rock and concrete processing—A review. Appl. Therm. Eng. 2019, 157, 113751. [Google Scholar] [CrossRef]
- Bobicki, E.R.; Pickles, C.A.; Forster, J.; Marzoughi, O.; Hutcheon, R. High temperature permittivity measurements of selected industrially relevant ores: Review and analysis. Miner. Eng. 2020, 145, 106055. [Google Scholar] [CrossRef]
- Koops, C.G. On the dispersion of resistivity and dielectric constant of some semiconductors at audiofrequencies. Phys. Rev. 1951, 83, 121–124. [Google Scholar] [CrossRef]
- Cheng, C.; Fan, R.; Fan, G.; Liu, H.; Zhang, J.; Shen, J.; Ma, Q.; Wei, R.; Guo, Z. Tunable negative permittivity and magnetic performance of yttrium iron garnet/polypyrrole metacomposites at the RF frequency. J. Mater. Chem. C 2019, 7, 3160–3167. [Google Scholar] [CrossRef]
- Ryynänen, S. The electromagnetic properties of food materials: A review of the basic principles. J. Food Eng. 1995, 26, 409–429. [Google Scholar] [CrossRef]
- Casu, S.; Fanti, A.; Lodi, M.B.; Spanu, M.; Desogus, F.; Mazzarella, G. Numerical Estimation of Agricultural Raised Bed Microwave Disinfection. Radio Sci. 2018, 53, 1176–1186. [Google Scholar] [CrossRef]
- Von Hippel, A.R. Dielectric Materials and Applications; Artech House: Norwood, MA, USA, 1995; ISBN 1580531237. [Google Scholar]
- Debye, P. Polar Molecules; The Chemical Catalog Company Inc.: New York, NY, USA, 1929. [Google Scholar]
- Komarov, V.; Wang, S.; Tang, J. Permittivity and Measurements. In Encyclopedia of RF and Microwave Engineering; John Wiley & Sons, Inc.: Hoboken, NJ, USA, 2005. [Google Scholar]
- Wang, Y.; Afsar, M.N. Measurement of complex permittivity of liquids using waveguide techniques—Abstract. J. Electromagn. Waves Appl. 2003, 17, 1311–1312. [Google Scholar] [CrossRef]
- Angela, A.; d′Amore, M. Relevance of Dielectric Properties in Microwave Assisted Processes. In Microwave Materials Characterization; InTech: London, UK, 2012. [Google Scholar]
- Bao, J.-Z.; Davis, C.C.; Swicord, M.L. Microwave Dielectric Measurements of Erythrocyte Suspensions. Biophys. J. 1994, 66, 2173–2180. [Google Scholar] [CrossRef]
- Fanari, F.; Muntoni, G.; Dachena, C.; Carta, R.; Desogus, F. Permittivity measurements of mixtures as a function of their composition for microwave heating improving. Chem. Eng. Trans. 2019, 76, 871–876. [Google Scholar]
- Acree, W.E., Jr. Mathematical representation of thermodynamic properties: Part 2. Derivation of the combined nearly ideal binary solvent (NIBS)/Redlich-Kister mathematical representation from a two-body and three-body interactional mixing model. Thermochim. Acta 1992, 198, 71–79. [Google Scholar] [CrossRef]
- King, M.B.; Queen, N.M. Use of Rational Functions for Representing Data. J. Chem. Eng. Data 1979, 24, 178–181. [Google Scholar] [CrossRef]
- Khattab, I.S.; Bandarkar, F.; Khoubnasabjafari, M.; Jouyban, A. Density, viscosity, surface tension, and molar volume of propylene glycol + water mixtures from 293 to 323 K and correlations by the Jouyban–Acree model. Arab. J. Chem. 2017, 10, S71–S75. [Google Scholar] [CrossRef] [Green Version]
- Fathi Azarbayjani, A.; Aliasgharlou, N.; Khoshbakht, S.; Ghanbarpour, P.; Rahimpour, E.; Barzegar-Jalali, M.; Jouyban, A. Experimental Solubility and Density Functional Theory Studies of Deferasirox in Binary Solvent Mixtures: Performance of Polarizable Continuum Model and Jouyban-Acree Model. J. Chem. Eng. Data 2019, 64, 2273–2279. [Google Scholar] [CrossRef]
- Jouyban, A.; Soltanpour, S.; Chan, H.K. A simple relationship between dielectric constant of mixed solvents with solvent composition and temperature. Int. J. Pharm. 2004, 269, 353–360. [Google Scholar] [CrossRef]
- Jouyban, A. Further computations on physico-chemical properties of binary solvent mixtures of N,N-dimethylformamide with N-propylpropan-1-amine, N-butylbutan-1-amine, butan-1-amine and hexan-1-amine at several temperatures. J. Mol. Liq. 2017, 242, 928–930. [Google Scholar] [CrossRef]
- Franchini, G.C.; Marchetti, A.; Tagliazucchi, M.; Tassi, L.; Tosi, G. Ethane-1,2-diol-2-methoxyethanol solvent system. Dependence of the relative permittivity and refractive index on the temperature and composition of the binary mixture. J. Chem. Soc. Faraday Trans. 1991, 87, 2583–2588. [Google Scholar] [CrossRef]
- Dortmund Data Bank—DDBST GmbH. Available online: http://www.ddbst.com/ddb.html (accessed on 21 April 2020).
Figure 1.
Sketch (a) and picture (b) of the measuring cell [47].
Figure 1.
Sketch (a) and picture (b) of the measuring cell [47].

Figure 2.
Spectra of R (a) and values of the maximum peak in the restricted range considered for the measurements (b), for water (–), 1-propanol (–) and water–ethanol mixtures with ethanol molar fraction of 0.007 (–), 0.219, (–), 0.495 (–), and 0.854 (–).
Figure 2.
Spectra of R (a) and values of the maximum peak in the restricted range considered for the measurements (b), for water (–), 1-propanol (–) and water–ethanol mixtures with ethanol molar fraction of 0.007 (–), 0.219, (–), 0.495 (–), and 0.854 (–).

Figure 3.
Spectra of R (a) and maximum peak values in the restricted range considered for the measurements (b), for water (–) and water–NaCl mixtures with NaCl molar fraction of (–), (–), (–), and (–).
Figure 3.
Spectra of R (a) and maximum peak values in the restricted range considered for the measurements (b), for water (–) and water–NaCl mixtures with NaCl molar fraction of (–), (–), (–), and (–).

Figure 4.
Spectra of X (a) and values of the minimum peak in the restricted range considered for the measurements (b), for water (–), 1-propanol (–) and water–ethanol mixtures with ethanol molar fraction of 0.007 (–), 0.219, (–), 0.495 (–), and 0.854 (–).
Figure 4.
Spectra of X (a) and values of the minimum peak in the restricted range considered for the measurements (b), for water (–), 1-propanol (–) and water–ethanol mixtures with ethanol molar fraction of 0.007 (–), 0.219, (–), 0.495 (–), and 0.854 (–).

Figure 5.
Spectra of X (a) and values of the minimum peak in the restricted range considered for the measurements (b), for water (–) and water–NaCl mixtures with NaCl molar fraction of (–), (–), (–), and (–).
Figure 5.
Spectra of X (a) and values of the minimum peak in the restricted range considered for the measurements (b), for water (–) and water–NaCl mixtures with NaCl molar fraction of (–), (–), (–), and (–).

Figure 6.
Measured values (•), literature values [55] (•), Acree model curve (---), and King and Queen model curve (−) of for the water–ethanol mixtures, reported as a function of the ethanol molar fraction (xEth).
Figure 6.
Measured values (•), literature values [55] (•), Acree model curve (---), and King and Queen model curve (−) of for the water–ethanol mixtures, reported as a function of the ethanol molar fraction (xEth).

Figure 7.
Measured values (▲), Acree model curve (---), and King and Queen model curve (−) of for the water–ethanol mixtures, reported as a function of the ethanol molar fraction (xEth).
Figure 7.
Measured values (▲), Acree model curve (---), and King and Queen model curve (−) of for the water–ethanol mixtures, reported as a function of the ethanol molar fraction (xEth).

Figure 8.
Measured values (•), Acree model curve (---), and King and Queen model curve (−) of for the water–NaCl mixtures, reported as a function of the water molar fraction (xw).
Figure 8.
Measured values (•), Acree model curve (---), and King and Queen model curve (−) of for the water–NaCl mixtures, reported as a function of the water molar fraction (xw).

Figure 9.
Measured values (▲), Acree model curve (---), and King and Queen model curve (–) of for the water–NaCl mixtures, reported as a function of water molar fraction (xw).
Figure 9.
Measured values (▲), Acree model curve (---), and King and Queen model curve (–) of for the water–NaCl mixtures, reported as a function of water molar fraction (xw).


Table 1.
Values of the model parameters and statistical indicators of the regression carried out with the Acree model; the superscript K indicates the single or the double quotes, depending on the row (real or imaginary part of permittivity); the subscript i indicates the second component of the mixture, depending on the row (ethanol or NaCl).
| Mixture | SSE | RMSE | ||||||
|---|---|---|---|---|---|---|---|---|
| W-Eth | 4.350 | 3.105 | 0.362 | 1.145 | −1.197 | 0.087 | 0.093 | 0.948 |
| W-Eth | 0.215 | 1.726 | −0.570 | 1.729 | −2.953 | 0.114 | 0.105 | 0.846 |
| W-S | 4.350 | 3.387 × 10⁸ | −5.938 × 10⁸ | −3.4082 × 10⁸ | −8.573 × 10⁷ | 6.673 × 10⁻⁶ | 0.008 | 0.828 |
| W-S | 195.548 | 3.414 | 5.136 × 10⁶ | 1.037 × 10⁷ | 5.239 × 10⁶ | 1.142 | 0.356 | 0.436 |
Table 2.
Values of the model parameters and the statistical indicators regarding the regression carried out with the King and Queen model; the superscript k indicates which part of the permittivity (real or imaginary) the parameter represents while the subscript i or j specify the pure component considered.
| Mixture | SSE | RMSE | |||||
|---|---|---|---|---|---|---|---|
| W-Eth | 15.074 | −13.105 | 0.189 | −0.009 | 265.208 | 5.429 | 0.915 |
| W-Eth | 1.019 | 1.890 | 0.835 | 0.101 | 0.412 | 0.214 | 0.841 |
| W-S | 1.688 | −1.683 | 0.022 | −0.022 | 0.404 | 0.201 | 0.821 |
| W-S | 6.694 | −6.695 | 0.101 | −0.101 | 186.6 | 5.163 | 0.906 |
© 2020 by the authors. Licensee MDPI, Basel, Switzerland. This article is an open access article distributed under the terms and conditions of the Creative Commons Attribution (CC BY) license (http://creativecommons.org/licenses/by/4.0/).
Share and Cite
MDPI and ACS Style
Fanari, F.; Muntoni, G.; Dachena, C.; Carta, R.; Desogus, F. Microwave Heating Improvement: Permittivity Characterization of Water–Ethanol and Water–NaCl Binary Mixtures. Energies 2020, 13, 4861. https://doi.org/10.3390/en13184861
AMA Style
Fanari F, Muntoni G, Dachena C, Carta R, Desogus F. Microwave Heating Improvement: Permittivity Characterization of Water–Ethanol and Water–NaCl Binary Mixtures. Energies. 2020; 13(18):4861. https://doi.org/10.3390/en13184861
Chicago/Turabian StyleFanari, Fabio, Giacomo Muntoni, Chiara Dachena, Renzo Carta, and Francesco Desogus. 2020. "Microwave Heating Improvement: Permittivity Characterization of Water–Ethanol and Water–NaCl Binary Mixtures" Energies 13, no. 18: 4861. https://doi.org/10.3390/en13184861
Note that from the first issue of 2016, this journal uses article numbers instead of page numbers. See further details here.