Long-Term Performance Measurement and Analysis of a Small-Scale Ground Source Heat Pump System


1
Division of Energy and Building Design, Department of Architecture and the Built Environment, Lund University, 221 00 Lund, Sweden
2
Division of Building Services, Department of Architecture and Civil Engineering, Chalmers University of Technology, 412 96 Gothenburg, Sweden
*
Author to whom correspondence should be addressed.
Energies 2020, 13(17), 4527; https://doi.org/10.3390/en13174527
Submission received: 23 July 2020
/
Revised: 26 August 2020
/
Accepted: 28 August 2020
/
Published: 1 September 2020
(This article belongs to the Special Issue Advances in Ground Heat Exchangers and Ground-Coupled Heat Pumps)
Abstract
:Recent data suggest that heat pumps, despite having the potential to cover over 90% of the global space and water heating demands, only provide less than 5% of global heating. Heat pumps, in general, and ground source heat pumps, specifically, offer significant potential for energy savings and carbon emissions reduction in buildings. The realization of these potential benefits, however, requires proper design, installation, and operation of the entire heat pump system. This paper presents the performance analysis of a Swedish ground source heat pump system providing space heating and hot water to a sports clubhouse. The installation has been carefully instrumented to enable full characterization of the whole system including auxiliary components such as circulation pumps and supplementary heating. Seasonal performance factors, calculated for monthly and annual periods using high-quality, high-resolution measurement data collected over three years of system operation, have been reported based on the SEPEMO (SEasonal PErformance factor and MOnitoring for heat pump systems) and Annex 52 boundary schemes for evaluating and benchmarking the performance of the ground source heat pump system. The auxiliary system components were shown to have a large impact on the overall performance of the system. In particular, the legionella protection system was found to affect performance considerably. Recommendations as to how to improve the performance of the system under study and other similar systems are made from the design, installation, and operation perspectives.
1. Introduction
Buildings are among the top consumers of energy and materials and the biggest producers of carbon emissions in the world. At present, together, the buildings and buildings construction sectors account for over one-third of global final energy use and almost 40% of total direct and indirect CO2 emissions [1]. In buildings, heating, ventilation, and air-conditioning (HVAC) systems are the largest consumers of energy. Space and water heating and space cooling account for over 50% of the energy use of buildings globally [2]. The share of energy consumption used for heating in cold climates is even higher. Space and water heating constitute roughly 80% of the overall energy consumption in the European residential sector [3] and also make up nearly one-third of the European Union’s final energy demand [4].
Most of the thermal energy used for the heating and cooling of buildings is produced from non-renewable resources. Fossil fuel-based equipment and conventional electric heating technologies currently hold over three-quarters of the global heat equipment market [5]. In Europe, two-thirds of the thermal energy is produced from fossil fuels [4]. Decarbonization of the heating sector is key to mitigating climate change and achieving deep reductions in emissions. The International Energy Agency (IEA) has urged an increase in the market share of clean energy technologies including heat pumps, low-carbon district heating, and renewable and hydrogen-based heating to 50% of new heating equipment sales by 2030 to achieve the objectives of the Paris Agreement [5]. Moreover, the International Energy Agency has also sought to triple the share of residential heat supplied by heat pumps globally by 2030 to meet the sustainable development scenario [6].
Heat pumps offer significant potential for energy savings in buildings and decarbonization of the heating sector. Heat pumps currently provide only 5% of the overall building heating, but have the potential to supply more than 90% of global space and water heating demands [6]. Air-source and ground-source are the two most common and widely used types of heat pumps. Ground-source heat pump (GSHP) systems are one of the most energy-efficient and environmentally clean heating technologies available today [7]. However, their widespread deployment in many regions of the world has been hampered due to their relatively high capital costs. The higher up-front cost of GSHP systems can be offset by their higher energy-efficiency and lower operating costs. Another barrier is the complexity of the GSHP system installation in comparison with conventional technologies such as natural gas or electric boilers.
The current global installed capacities of GSHP systems are around 50,000 MWt, of which more than two-thirds are in three countries alone: the USA, China, and Sweden [8]. Sweden has the highest installation rate per capita worldwide [6]. In a country of 10 million inhabitants, there are around 600,000 installations of GSHP systems [9]. Sweden is also at the forefront of research and development on GSHP systems including design methods and experimental procedures [10,11,12,13], technology and product development [14,15,16], and state-of-the-art and innovative applications [17,18]. The application examples and case studies from Sweden and other countries with extended experience in GSHP systems can offer lessons and guidance for GSHP applications in emerging markets as well as provide insights into the technical feasibility, limitations, and practical aspects of different GSHP system configurations. This could also help improve the quality of GSHP system installations in emerging markets, which, would, in turn, positively influence their energy performance and improve their economic feasibility.
1.1. Background
The energy performance of GSHP systems holds the key to gaining market share and competitive advantage over conventional fossil-fuel-based technologies. Standard testing and rating procedures [19,20] have been established to measure the performance efficiencies of GSHPs under carefully controlled conditions. However, the performance of GSHP systems under actual operating conditions deviate significantly from the standard rating conditions due to two main reasons. First, the performance of the heat pump itself depends on many site-specific factors such as the source temperature, temperature lift provided by the heat pump, and the heating demand of the building. Second, the overall performance of the GSHP system depends not only on how the heat pump performs in isolation, but also on the parasitic energy consumption of the auxiliary components like circulation pumps and electric heaters as well as on the quality of the design and installation. Although some evaluation approaches have been proposed, no standard or widely agreed-upon method to measure the actual performance of GSHP systems under real operating conditions exists until now. The existing evaluation schemes use different system boundaries for calculating seasonal performance factors (SPFs). Not surprisingly, this has led to confusion as results of different performance evaluation studies that appear similar, but are fundamentally dissimilar, have been compared and analyzed.
One popular boundary scheme for evaluating and benchmarking the performance of GSHP systems and for identifying sources of poor system performance was developed within the SEasonal PErformance factor and MOnitoring for heat pump systems (SEPEMO) project [21]. The so-called SEPEMO boundary scheme includes four different system boundaries for the calculation of SPFs. The first boundary only includes the refrigeration cycle; the second boundary includes the refrigeration cycle and the source-side circulation pump; the third boundary includes the refrigeration cycle, the source-side circulation pump, and the auxiliary heating or cooling; and the fourth boundary includes the refrigeration cycle, the source-side circulation pump, the auxiliary heating or cooling, and the load-side circulation pump. The details of the system boundaries are also presented in Table 1. The SEPEMO boundary scheme was originally developed for small-scale and relatively simple residential systems, but has since been applied to subsequently larger and more complex GSHP systems [18,22,23]. However, certain limitations have been noted in applying the SEPEMO boundary scheme to commercial, institutional, and multi-family residential buildings [24].
The IEA Heat Pump Technologies (HPT) Annex 52 has recently proposed a new system boundary scheme, comprising of six distinct boundaries and an indicator for use of supplemental heating or cooling within each boundary [24]. The Annex 52 boundary scheme for calculation of SPFs is in fact an extension of the SEPEMO boundary scheme. Each boundary in the SEPEMO scheme corresponds to one of the boundaries in the Annex 52 scheme. However, the Annex 52 boundary scheme has an additional boundary for the ground-source and two additional boundaries for more complex distribution systems. Due to these additional boundaries, the Annex 52 boundary scheme is claimed to be better suited for larger and more complex GSHP systems than those covered by the SEPEMO boundary scheme. Table 2 presents the details of the system boundaries proposed by the Annex 52 boundary scheme for calculating the SPFs.
1.2. Literature Review
Performance evaluation of GSHP systems is a topic of growing interest because of their ever-increasing use in space heating, cooling, and domestic hot water applications [25]. Several evaluation studies with varying methodologies and levels of analysis have been reported in the literature. A comprehensive and exhaustive review of the literature on the performance measurements of GSHP systems in both residential and commercial buildings has recently been provided by Spitler and Gehlin [18]. We do not seek to repeat this literature review and our focus here is to provide some representative overview of the major developments and trends in the area of performance evaluations of GSHP systems.
Previous studies on the performance evaluation of GSHP systems in residential buildings have often been based on a group of systems rather than individual systems. These studies have indicated general trends concerning the performance of GSHP systems in residential applications, but have not systematically reviewed individual system performances in specific situations. Miara et al. [26] presented performance measurements of 56 GSHP systems in residential buildings over three years using a boundary scheme quite like the SEPEMO scheme. The study reported only the average values of the performance factors. The reported range of average performance factors between different boundaries varied in a fairly narrow range of 4.19 to 3.79. The load-side distribution pumps and the back-up electric heaters, respectively, were reported to have the largest and the smallest impact on the performance. Nordman et al. [21] reviewed the one-year performance measurements of 29 GSHP systems, most of which were residential, in six European countries using the SEPEMO boundary scheme. The results were given as SPF3 values, which represent the performance of the heating system excluding the distribution system. Fifteen systems had measured performance factors over four, six systems had performance factors between three and four, seven systems had performance factors between 2 and 3, and one system had a performance factor below two. Stafford [27] carried out a performance evaluation of 10 GSHP systems with identical heat pumps in single-family houses in the Borough of Harrogate, England. The annual performance factors, SPF3 and SPF4, corresponding respectively to boundaries 3 and 4 of the SEPEMO boundary scheme, were reported for each system. The SPF3 values over the 10 systems ranged between 2.21 and 2.72 and had an average value of less than 2.4. The SPF4 values ranged between 2.02 and 2.48 and had an average value of below 2.2. The performance factors were pretty low despite relatively low energy consumption of circulation pumps and auxiliary heaters (between 15 and 24%). Gleeson and Lowe [28] performed a so-called meta-analysis of the seasonal performance of over 350 residential GSHP systems in six European countries. The authors reported that for 216 systems evaluated with the SEPEMO boundary scheme, the overall system performance factors, corresponding to boundary four of the SEPEMO boundary scheme, ranged between 1.4 and 5.1. The authors noted unmeasured or unreported uncertainties as a major limitation of most studies reviewed by them.
Earlier studies on the performance evaluation of GSHP systems in non-residential buildings have focused on both groups of systems as well as single individual systems. Hughes [29] assessed the performance of 19 GSHP systems in non-residential buildings in the United Kingdom using the SEPEMO boundary scheme. The measured performance factors SPF2 and SPF4, corresponding to levels two and four of the SEPEMO boundary scheme, ranged from 2.24 to 4.49 and from 1.21 to 4.12, respectively. Winiger et al. [30] calculated the performance of 16 GSHP systems in non-residential buildings in Germany using a set of self-defined boundaries. The performance factors for the ground source and sink were reported to be between 2.9 and 61.7 and between 3.5 and 42.1 in heating and free cooling modes, respectively. One of the boundaries defined by the authors includes the refrigeration cycle and the source-side circulation pump and corresponds to SPF2 of the SEPEMO boundary scheme. The performance factors for this system boundary ranged between 2.9 and 6.1 in heating mode and between 2.1 and 5.0 in active-cooling mode. Liu et al. [31] evaluated the performance of 10 GSHP systems installed in commercial buildings in the United States. The results, presented as system coefficient of performance (SCOP) in heating and cooling modes, were based on inconsistent system boundaries. The annual heating SCOP ranged between 2.5 and 4.5, whereas the annual cooling SCOP ranged between 3.0 and 5.3. Mendrinos and Karytsas [32] carried out a performance evaluation of eight GSHP systems in non-residential buildings in southern Europe using the SEPEMO boundary scheme. The study is one of the very few to have presented the seasonal performance factors of all studied buildings for each SEPEMO boundary in both heating and cooling modes. The difference in the seasonal performance of the refrigeration cycle and the overall system was substantial in several cases. The measured performance factors, corresponding to level two of the SEPEMO boundary scheme, ranged between 3.6 and 5.9 in heating mode, between 4.9 and 6.8 in active-cooling mode, and between 9.8 and 16.6 in free-cooling mode.
More recently, some new case-reports evaluating the long-term performance of GSHP systems have been published within the framework of the IEA HPT Annex 52. Bockelmann and Fisch [23] carried out a performance evaluation of six GSHP systems in commercial, institutional, and multi-family buildings in Germany using the SEPEMO boundary scheme. The annual performance factors, SPF2 in heating and cooling modes, corresponding to the performance of the refrigeration cycle and the source-side circulation pump, were determined. The SPF2 in heating mode ranged between 2.5 and 6 and the SPF2 in cooling mode ranged between 4 to over 100 depending on the ratio of free and active cooling. Naicker and Rees [22] performed a performance analysis of a large geothermal heating and cooling system comprising of a mix-use university building in the UK using SEPEMO boundary scheme. The performance factors, SPF1, SPF2, and SPF4, corresponding, respectively, to boundaries 1, 2, and 4 of the SEPEMO boundary scheme were calculated. The mean values of SPF2 and SPF4 were reported to be 2.97 and 2.49, respectively. The authors noted that the two factors influencing the performance factors adversely were the operating temperature level and the circulation pump energy demands. In a continuing study, Naicker and Rees [33] have also analyzed the performance of the ground heat exchanger system using 38 months of monitored data. Spitler and Gehlin [18] have conducted a performance evaluation of a multi-use university building using SEPEMO boundary scheme for one year of measurement data. Performance factors of 3.7 ± 0.2 and 2.7 ± 0.2 were obtained for boundaries 2 and 3 in the heating mode. A performance factor of 27 ± 5 was reported for boundary 2 in the cooling mode. The authors also extended the one-year analysis to nearly four years using the Annex 52 boundary scheme in a continuing study [34]. The authors noticed several limitations of the SEPEMO method when applied to complex GSHP systems with both heating and cooling as well as supplementary heating and cooling sources and heat recovery. The authors also observed a particularly strong influence of legionella protection and domestic hot water recirculation systems on the overall performance of the system.
It is evident from the literature review that SEPEMO boundary scheme have been used by most studies to carry out the performance evaluation of GSHP systems. However, hardly any studies have presented the seasonal performance factors for all four SEPEMO boundaries. In many cases, the seasonal performance factors have only been presented for one or two boundaries. Some studies have reported significant limitations in applying the SEPEMO boundary scheme to complex GSHP systems, but comparisons with other boundary schemes have not been reported. Furthermore, uncertainty analysis of the actual measurements and the calculated performance factors has rarely been undertaken in the literature. This is also a major limitation given that there can be large uncertainties associated with the presented results. Furthermore, only a handful of studies have investigated the operational factors affecting the performance of the GSHP systems, and only a fraction of these have examined the sensitivity of performance factors to variations in operating conditions.
1.3. Scope of This Work
This study aims to provide long-term performance measurements of a GSHP system installed in a small clubhouse building in Sweden for the provision of space heating and hot water. The performance evaluation was based on high-resolution data collected at 2-min intervals from January 2014 to December 2016. The analysis included the calculation of monthly and yearly seasonal performance factors for the entire 3-year measurement period. The full range of system boundaries defined by SEPEMO and Annex 52 boundary schemes were used for evaluating the seasonal performance factors. The system performance for all boundaries of the SEPEMO and Annex 52 boundary schemes was benchmarked. The drop in seasonal performance factors from one system boundary to another was analyzed. The results for the two boundary schemes were compared, contrasted, and interpreted. A methodology for the uncertainty analysis of the measured performance was implemented and the uncertainty bounds for all seasonal performance factors were computed. The impacts of the system components and operational strategies including circulation pumps, auxiliary heaters, and the legionella protection system on the system performance were characterized.
2. System Description and Measurements
This section describes the studied system in detail and explains the measurement setup that has been used for this study.
2.1. System Description
The building considered in this study is an orienteering clubhouse. The clubhouse is used as a central gathering and service space for outdoor orienteering activities. It caters to over 200 members with a mix of gender, age, and experience. The members train throughout the year, with several training activities scheduled every week. The edifice also hosts some regional, national, and international competitions each year. The clubhouse is not only a focal point for outdoor activities, but also serves as a meeting and socializing space. It is frequently used for lunch and dinner gatherings and sauna sessions by the members and club visitors. The clubhouse is located at 57.629 LAT, 11.966 LON in the southern suburb area of Gothenburg, Sweden. The clubhouse building is 12 km from the Gothenburg city center and 34 km from Landvetter airport. Directly next to the clubhouse is the 17.7 km2 nature reserve of Sandsjöbacka. The clubhouse building, which was constructed in 2004, has a footprint area of about 240 m2. It is a one-story building with a partially raised basement. The principal floor houses the club office, a multipurpose community room, storage areas, kitchen, and two locker rooms with eight hot showers and two saunas. The basement houses the utilities including the heating and sewage system as well as ample storage. Figure 1 shows an image of the clubhouse. Figure 2 and Figure 3 show the elevations and floor plan of the clubhouse, respectively.
The clubhouse uses a GSHP system to provide space heating and hot water. Figure 4 shows a schematic of the clubhouse GSHP system. The heat pump unit consists of a 5-kW compressor, a 6-kW auxiliary heater, and two circulation pumps. The rated performance of the heat pump including circulation pumps at standard test conditions of B0W35 according to EN 14511 is 4.20. The compressor and the auxiliary heater are automatically controlled by the heat pump’s control system. The electric heater in the heat pump unit is used only for hot water and legionella protection. The heat pump is connected to two 500-L buffer tanks. The ground heat exchanger consists of a single vertical ground heat exchanger, drilled to a depth of 230 m, and fitted with a single U-pipe filled with an ethanol/water mixture. As is common in Scandinavian countries, the ground heat exchanger is of the groundwater-filled type [35].
The clubhouse has a relatively high hot water consumption because of the frequent use of showers. The two buffer tanks provide for the high hot water demand of the installation. The heat pump operates in either space heating or hot water mode. A shunt valve controls the flow between the hot water and space heating systems. Hot water production is prioritized by the heat pump ahead of the space heating. The temperature of the hot water produced by the heat pump cannot be adjusted. The hot water production is ceased when the compressor reaches its maximum operating pressure, which corresponds to a hot water temperature of approximately 55–65 °C. The heat pump has a built-in legionella protection system. This protection system runs once a week and raises the water temperature in the tank connected to the heat pump to 60 °C. A 3-kW auxiliary electric heater with a thermostat is installed in the second tank from which the hot water is drawn. The primary purpose of the tank auxiliary heater is to keep the water temperature in the buffer tank supplying the hot water between 55 to 60 °C to provide legionella protection. During a draw, the hot water from the second buffer tank is blended with the cold city water in a thermostatic mixing valve to prevent scalding. For the provision of space heating, the heat pump has a built-in control system that provides an outdoor temperature-compensated supply temperature to the radiator system of the clubhouse. The supply water temperature for space heating is provided between 30–45 °C. The ground heat exchanger and heating system circulation pumps are both 3-speed (low, medium, high) units, manually set on the medium speed. As per the manufacturer’s recommendations, the heat pump works at optimum efficiency when the temperature difference between the ground heat exchanger supply and return is 3 K and between the heat supply and return is 7–10 K.
2.2. Measurements and Data Analysis
The GSHP system of the clubhouse has been monitored since 2010. During this period, high-frequency measurement data have been collected to characterize the performance of the GSHP system. However, the measurement setup has been modified a couple of times over the years and the measurement frequency has also been altered and adjusted a few times between 2 min and 15 min. For this study, 3-years of measurement data (2014–2016) with 2-min intervals were used.
The measurement setup used for the present study is shown in Figure 4. The measurements included temperature and flow values at various points in the system and electrical energy consumption of different GSHP system components. In total, 10 temperature sensors, six flow meters, and four power meters were used. All sensors recorded measurements at a 2-min interval. Temperature measurements were taken using laboratory calibrated PT100 sensors. The measurement accuracy of the temperature sensors was less than 0.5 K. The temperature sensors used for heat metering were matched pairs with a maximum discrepancy of ±0.1 K. The water flow measurements were taken using vortex flow meters. The minimum resolution of the water flow measurements was 0.0033 L/s. The manufacturer-reported accuracy of the water flowmeters was ±1.5% of the full scale, which corresponded to less than ±3% uncertainty at actual flow levels. The brine flow measurements were taken using a vortex flowmeter compatible with liquids with high kinematic viscosity. The manufacturer-reported accuracy of the brine flowmeters was ±3.0% of the full scale, which corresponded to less than ±5% uncertainty at actual flow levels. The electrical energy consumption was metered by high-accuracy power meters. The uncertainty of the power meters was ±1%.
The heat transfer rates for space heating and hot water systems were determined calorimetrically from the measured values of flow and temperature increase over the heat pump. The delivered thermal energies for space heating and hot water were calculated by integrating the respective heat transfer rates over time. The electrical energy consumed by the heat pump unit, the compressor, and the two auxiliary electric heaters was measured individually by separate power meters. The electrical energy consumption of the two circulation pumps—both fixed-speed with 3-speed settings—were determined based on measured power ratings integrated over run time at actual run speeds. The power input of each pump at a certain speed level was obtained from the measured data considering periods over which only the pump was operating. The input power to the pumps was also checked separately with precision wattmeters with an accuracy better than 1% of the reading.
3. Method
In this study, the performance of the clubhouse GSHP system was evaluated using the SEPEMO and Annex 52 boundary schemes. An uncertainty analysis was also carried out to calculate the impact of measurement uncertainties on the evaluated performance.
3.1. SEPEMO Scheme
Figure 5 shows the SEPEMO boundary scheme applied to the clubhouse GSHP system. SPF1 evaluates the performance of the refrigeration cycle. SPF2 includes the source-side circulation pump. SPF3 includes the auxiliary heating installed in the heat pump and the hot water tank. SPF4 includes the distribution-side circulation pump and provides the overall energy efficiency of the GSHP system. Table 3 shows the formulas used for evaluating the seasonal performance of the GSHP system based on the SEPEMO boundary scheme.
3.2. Annex 52 Scheme
Figure 6 and Figure 7 show the Annex 52 boundary scheme applied to the clubhouse GSHP system. SPF0 evaluates the performance of the ground source. SPF1 measures the performance of the refrigeration cycle. SPF2 gives the performance of the refrigeration cycle and the source-side circulation pump. SPF3 provides the performance of the refrigeration cycle, the source-side circulation pump, and the distribution-side circulation pump between the heat pump and the buffer tank. SPF1+ measures the performance of the refrigeration cycle and the heat pump electric heater. SPF2+ presents the performance of the refrigeration cycle, the source-side circulation pump, and the heat pump electric heater. SPF3+ provides the performance of the refrigeration cycle, the source-side circulation pump, the heat pump electric heater, the distribution-side circulation pump between the heat pump and the buffer tank, and the electric heater installed in the buffer tank. For the clubhouse system, the SPF3+ provides the overall energy efficiency of the clubhouse GSHP system as boundary levels 4 and 5 are not applicable. Table 4 shows the formulas used for evaluating the seasonal performance of the GSHP system based on the Annex 52 boundary scheme.
3.3. Uncertainty Analysis
All measurement data used for analyzing the performance in this study have some degree of uncertainty associated with it. It is well known that the measurement uncertainties propagate through calculations and lead to uncertainty in the final results. Hence, to quantify the effects of the propagation of measurement uncertainties on the performance evaluations of the clubhouse GSHP system, an uncertainty analysis was carried out. The uncertainty analysis only reflects the systematic measurement errors under a common experience that random errors are dwarfed by the systematic errors in high-frequency measurements. The analysis performed by Spitler and Gehlin [18] was used as a reference scheme and uncertainties in thermal energy, electricity use, and SPF were calculated.
Heat transfer rates, used for calculation of thermal energies for heating and domestic hot water, are determined from the measured values of flows and temperature differences. The uncertainty in the heat transfer rate depends on the uncertainties in measured flow and temperature difference values as well as uncertainties in density and specific heat values of the heat carrier fluid. The uncertainty in density and specific heat values was smaller than 0.1% [36]. The maximum uncertainty in the temperature difference measured with matched pairs of sensors was ±0.1 K. The uncertainty in the water flow measurements was 3% and in the brine flow measurement, it was 6%. The uncertainties in temperature difference and flow measurements are expressed as follows using upper-case “E” for absolute and lower-case “e” for fractional uncertainties.
The measurement uncertainty in the heat transfer rate is determined by propagating the uncertainties in flow and temperature difference values. The uncertainties in density and specific heat values are very small and so are ignored. As the uncertainties in temperature difference and flow measurements are uncorrelated and independent of each other, they are added in quadrature.
Next, the fractional uncertainties in heat transfer rate are converted to absolute values, which are subsequently converted to uncertainties in heat energy transfer at each time step.
The uncertainty in supplied thermal energy is determined by aggregating the absolute uncertainties in heat transfer at each time step to monthly and annual totals.
The electrical energy consumption of heat pump, compressor, and auxiliary heaters measured with high-accuracy power meters had an uncertainty of ±1%. The electrical energy consumption of circulation pumps deduced from measured data and cross-checked using precision wattmeters also had an uncertainty of ±1%. For each boundary condition, the uncertainty in the electrical energy consumption is calculated by propagating the absolute uncertainties of the quantities involved in quadrature. For example, the uncertainty in the electrical energy consumption of different SEPEMO boundaries is calculated as:
Next, the absolute uncertainties in electrical energy consumption are aggregated to monthly and yearly uncertainty values, which are then converted into fractional uncertainties.
Finally, as the monthly and yearly fractional uncertainties in the supplied thermal energies and the electrical energy consumption are uncorrelated, they are added in quadrature to obtain the corresponding uncertainties in the SPF values.
4. Results
This section presents the results of the measurements made on the clubhouse system and the performance measurements of the clubhouse GSHP system for three years of operation.
4.1. Temperature and Flow
Figure 8 shows the measured daily average fluid temperatures leaving the ground heat exchanger and entering the heat pump over the three-year measurement period, along with the corresponding daily average outdoor air temperatures obtained from a nearby weather station. The extraction fluid temperatures from the ground heat exchanger did not exhibit any pronounced seasonal variations, and the daily average fluid temperatures varied in a rather narrow range of approximately 4.1 to 8.0 °C during the whole measurement period. The high extraction fluid temperatures indicate that the ground heat exchanger is somewhat over-sized. In comparison, the outdoor air temperatures underwent strong seasonal variations, and the daily average air temperatures fluctuated from below −10 °C in winter to nearly 25 °C in summer during the three-year measurement period. The more favorable and stable extraction fluid temperatures provided the basis for achieving high energy efficiency in the clubhouse space heating and hot water system. The measured flow in the ground heat exchanger remained fairly constant at approximately 0.45 L/s throughout the measurement period.
Figure 9, left, presents the measured daily average heat pump supply and return water temperatures for space heating as a function of the outdoor air temperature. The measurements confirm that the supply temperature for space heating was the outdoor temperature-compensated. The supply water temperature increased linearly from 30 to 40 °C as the outdoor temperature decreased from 10 to −5 °C. At outdoor air temperatures lower than −5 °C and higher than 10 °C, the heat pump provided supply water at 40 and 30 °C, respectively. The measured flow in the space heating loop was essentially constant at approximately 0.33 L/s for the first twenty-one months of the measurement period and at approximately 0.35 L/s for the latter 15 months of the measurement period. The flow was marginally increased after the manual 3-stage speed setting of the circulation pump was switched in September 2015 from medium to high speed. The temperature difference between the supply and return water for space heating was also nearly constant at about 8.8 K at medium pump speed and about 8.0 K at high pump speed. Figure 9, right, shows the measured daily average heat pump supply and return hot water temperatures for domestic use as a function of outdoor air temperature. Regardless of the outdoor air temperature, the hot water was always produced at temperatures between 53 and 60 °C. However, periodically, the hot water temperature was raised to above 60 °C to provide legionella protection. The measured hot water flow in the closed-loop between the heat pump and the buffer tank was largely constant at approximately 0.38 L/s for the first twenty-one months of the measurement period and at approximately 0.41 L/s for the latter fifteen months of the measurement period after the manual 3-stage speed setting of the circulation pump was switched from medium to high. The hot water supply and return temperature differences were around 7.6 K at medium pump speed and around 6.8 K at high pump speed.
The measured daily average hot water temperatures drew from the buffer bank and the water temperatures delivered to the users after blending with the cold city water are presented in Figure 10. As seen from the figure, the temperature of the hot water drawn from the buffer tank ranged approximately between 50 and 60 °C. However, the temperature of the water distributed to the clubhouse after mixing with the city cold water in a thermostatic mixing valve to prevent scalding was lower, ranging between 47 and 50 °C. Additional hot water safety valves for scalding prevention incorporated in toilets, showers, and wash-basins regulated the water temperature at the point-of-use. The measurements show that from July 2015 onward, there was an increase in the temperatures of the hot water drawn from the buffer tank and distributed to the clubhouse. This was because the thermostat setpoint temperature of the auxiliary heater installed in the second buffer tank was changed from 55 °C to 60 °C.
Figure 11 presents the monthly hot water volume supplied to the clubhouse during the three years of measurements. The monthly drawn volumes varied between 3.0 and 8.5 m3 with a total annual consumption of 73 to 75 m3 for three years, corresponding to approximately 310 L/m2/year. Considering that the clubhouse is used intermittently, mostly on the weekends, the hot water consumption, as expected, is relatively high.
4.2. Space Heating and Hot Water Loads
The measured monthly space heating and hot water loads for the clubhouse for the three years of the measurement period are shown in Figure 12. As seen from the figure, the space heating loads peaked during the winter months of December to February, whereas the hot water loads remained fairly constant throughout the year. The space heating loads were several-fold larger than the hot water loads in winter, but the hot water loads were larger than the space heating loads in summer between June and September.
Figure 13 shows the measured annual space heating and hot water loads for the clubhouse for years 2014 to 2016. Both the space heating and hot water loads were relatively constant from year to year. The space heating loads were within a range of about 15.1–16.3 MWh, and hot water loads were within a range of about 7.9–8.3 MWh, over the study period.
The energy signature for the clubhouse building based on the three-year measurement data is shown in Figure 14. The space heating and hot water loads shown in the figure are based on hourly average data. It can be readily observed that the space heating loads were seasonal and were negatively correlated with outdoor air temperature, especially during winter. The hot water loads, on the other hand, were not particularly dependent on the outdoor air temperature.
4.3. Electrical Energy Consumption
The measured monthly electrical energy consumption of all space heating and hot water system components including the compressor, the heat pump auxiliary heater, the tank auxiliary heater, and the circulation pumps is shown in Figure 15. As expected, the total electrical energy consumption of the GSHP system was weather dependent and was substantially higher in winter than in summer. In winter months, the compressor had the largest energy consumption of all system components, whereas, in summer, the energy consumption of the tank auxiliary heater was the largest. The circulation pumps contributed to a significant portion of the total monthly energy consumption. Due to longer operation time, the energy consumption of the circulation pumps in winter months was higher compared to summer months. The heat pump auxiliary heater had typically the lowest monthly energy consumption among all components. However, in January 2014, the heat pump auxiliary heater consumed approximately half of the total monthly energy due to a compressor failure, which caused the space heating and hot water to be produced by the electric heater instead.
Figure 16 shows the measured annual electrical energy consumption of different space heating and hot water system components of the clubhouse system for the years 2014 to 2016. The total electrical consumption varied between approximately 9.3 and 10.5 MWh per year during the study period. The annual energy consumption of the compressor was highest among all components followed by that of the tank auxiliary heater. The electricity consumption of the compressor was between 4.9 and 5.7 MWh per year and of the tank auxiliary heater was between 2.1 and 2.6 MWh per year. The electricity consumption of the circulation pumps was almost constant over the years, varying between 1.2 to 1.4 MWh per year. The annual energy consumption of the heat pump auxiliary heater was lowest among all components and was less than 1 MWh in 2015 and 2016, but was unusually higher at about 1.6 MWh in 2014 due to the compressor breakdown in January.
Figure 17 presents the annual electrical energy consumption of space heating and hot water systems for the years 2014 to 2016. The electrical energy consumption of the space heating system was fairly constant between 5.2 and 5.5 MWh over the study period. The annual energy consumption of the space heating was in sync with the measured annual space heating loads presented in Figure 13. The electrical energy consumption of the hot water system was 4.3, 4.1, and 5.0 for 2014, 2015, and 2016, respectively. Although the hot water loads, as shown in Figure 13, were quite similar for all three years, the electrical energy consumption of the hot water system in 2016 was significantly higher than in 2014 and 2015. This was due to the change of the thermostat setpoint temperature of the auxiliary heater installed in the second buffer tank from 55 °C to 60 °C.
4.4. Performance Evaluation Based on SEPEMO Scheme
The monthly performance of the clubhouse system for 2014–2016 for the SEPEMO boundaries is presented in Figure 18. The figure also shows the uncertainty of the SPF values. However, to keep the figure easily readable, uncertainty bars were included only for the SPF1 and SPF4 values.
The monthly SPF1 values ranged between 3.3 ± 0.2 and 4.3 ± 0.3 over the three-year measurement period. Surprisingly, the monthly SPF1 values, indicating the performance of the refrigeration cycle, were higher in winter and lower in summer. This can be explained by observing that, in summer, the heat pump predominantly operated in the hot water mode, in which its efficiency, due to high-temperature lifts, was lower than that in the space heating mode. The monthly SPF2 values were slightly lower than the SPF1 values and ranged between 2.9 ± 0.2 and 3.9 ± 0.2 over the measurement period. This was expected as the energy consumption of the source-side circulation pump is relatively low. The monthly SPF3 values were significantly lower than SPF2 values and ranged between 1.7 ± 0.1 and 3.2 ± 0.2 over the three-year measurement period. The substantial decrease in the SPF3 values compared to the SPF2 values implies that the auxiliary heating installed in the heat pump and the hot water tank is among the main factors affecting the performance of the clubhouse space heating and hot water system. Another notable difference between the SPF3 and SPF2 levels is that the drop in SPF3 values in summer months is much more pronounced than the SPF2 values. This is because, in summer, the energy consumption of the auxiliary electric heaters constitutes a major portion of the overall energy consumption. The monthly SPF4 values were a little lower than the SPF3 values and ranged between 1.5 ± 0.1 and 3.1 ± 0.2 over the measurement period. This, again, indicates relatively low energy consumption of the distribution-side circulation pump. The lower values of SPF3 and SPF4 in January 2014 were due to compressor failure, which resulted in space heating and hot water to be produced by the electric heater instead.
Figure 19 presents the annual performance of the clubhouse system for 2014–2016 for the four SEPEMO boundaries. The figure also shows the uncertainty bars related to the estimation of the SPF values. The annual performance factors followed a trend similar to the monthly performance factors. The annual SPF1 values for the three years of measurement period were between 3.6 ± 0.2 and 3.9 ± 0.2. The annual SPF2 values for the three years were marginally lower than the SPF1 values and were between 3.3 ± 0.2 and 3.6 ± 0.2. The annual SPF3 values for the studied period were considerably lower than the SPF2 values and were between 2.4 ± 0.2 and 2.6 ± 0.2. The annual SPF4 values for the measurement period were slightly lower than the SPF3 values and were between 2.2 ± 0.2 and 2.3 ± 0.2. As with monthly SPF values, there was a sharp decrease in the annual SPF3 values compared with the annual SPF2 values, indicating a significant impact of auxiliary heating on the performance of the clubhouse space heating and hot water system.
4.5. Performance Evaluation Based on Annex 52 Scheme
The monthly performance of the clubhouse system with the Annex 52 boundaries for 2014–2016 is presented in Figure 20, Figure 21 and Figure 22. The uncertainty of the SPF values is also shown. The monthly SPF0 values, shown in Figure 20, ranged between 29 ± 1.7 and 40 ± 2.4 over the three-year measurement period. Strangely, the monthly SPF0 values, indicating the performance of the ground source, were higher in winter than in summer months. This can be traced back to higher ground heat exchanger supply and return temperatures and a smaller temperature difference between them in the summer period. The monthly SPF1 values, presenting the performance of the refrigeration cycle, ranged between 3.3 ± 0.2 and 4.2 ± 0.3 over the measurement period, as shown in Figure 21. Like SPF0, the SPF1 values were also higher in winter and lower in summer. This, however, is quite understandable as the heat pump in summer operates mainly in the hot water mode at comparatively lower efficiencies than in space heating mode. The monthly values of SPF2 and SPF3 ranged between 2.9 ± 0.2 and 3.9 ± 0.2 and between 2.2 ± 0.1 and 3.5 ± 0.2, respectively, over the measurement period. The two factors, showing, respectively, the effect of the source-side and distribution-side circulation pumps on the performance of the clubhouse space heating and hot water system, followed the same trend as SPF0 and SPF1 and were higher in winter than in summer. The effect of the distribution-side circulation pump on the performance of the system was more pronounced than that of the source-side circulation pump. The SPF1+, SPF2+, and SPF3+ values show the effect of auxiliary heating within each respective boundary. The monthly values of SPF1+ and SPF2+ were slightly lower than the corresponding values of SPF1 and SPF2 and ranged between 2.6 ± 0.2 and 4.0 ± 0.3 and between 2.4 ± 0.2 and 3.7 ± 0.2, respectively, over the measurement period. The SPF3+ values, presenting the overall monthly performance of the clubhouse system, were between 1.5 ± 0.1 and 3.0 ± 0.2. The noticeably lower values of SPF1+, SPF2+, and SPF3+ values in January 2014 were due to the compressor breakdown, which triggered the auxiliary heating to make up for the loss of refrigeration cycle output. The large variation in performance factors between SPF1 and SPF3+ indicates that the energy consumption of the circulation pumps and auxiliary heaters in the system has a significant impact on the overall system performance.
Figure 23 presents the annual performance of the clubhouse system for 2014–2016 with the Annex 52 boundaries. The uncertainty bars related to the estimation of the annual SPF values are also shown. The annual performance factors for different boundaries show a pattern similar to the monthly performance factors. The annual values of SPF0 (not shown in Figure 23) were between 33.8 ± 2.0 and 34.9 ± 2.0 for the three years of the measurement period. The annual SPF1 and SPF1+ values ranged between 3.6 ± 0.2 and 3.9 ± 0.2, and between 3.2 ± 0.2 and 3.6 ± 0.2, respectively. The annual SPF2 and SPF2+ values for the studied period were between 3.3 ± 0.2 and 3.6 ± 0.2, and between 2.9 ± 0.2 and 3.2 ± 0.2, respectively. The annual SPF3 and SPF3+ values for the measurement period were between 2.8 ± 0.2 and 3.0 ± 0.2, and between 2.2 ± 0.2 and 2.3 ± 0.2, respectively. As seen from the figure, the annual performance factors decreased progressively as energy consumption of various system components was added-on from boundary 0 to boundary 3. Furthermore, it can also be observed that the performance factors were profoundly affected by the auxiliary heating. For instance, the large drop in annual SPF3+ values in comparison to the SPF2+ and SPF3 values illustrates the influence of tank auxiliary heating on the overall annual seasonal performance of the clubhouse space heating and hot water system.
5. Discussion and Analysis
The use of SEPEMO and Annex 52 boundary schemes to evaluate the seasonal performance of the clubhouse space heating and hot water system provides a basis for comparing the two schemes. Compared to the four defined boundaries in SEPEMO scheme, the Annex 52 scheme consists of six defined boundaries and an indicator for the use of supplemental heating or cooling. Moreover, each SEPEMO boundary matches one of the Annex 52 boundaries, thereby making it possible to compare results across the two schemes. For the clubhouse system, the SEPEMO boundaries 1, 2, 3, and 4 matched Annex 52 boundaries 1, 2, 2+, and 3+ respectively. Nevertheless, the Annex 52 boundary scheme, due to its larger number of boundaries, is more comprehensive and provides a more thorough analysis of the system performances. For instance, the boundary 0 is unique to Annex 52 and evaluates the performance of the ground source. For the clubhouse system, the annual values of SPF0 were calculated to be between 33.8 ± 2.0 and 34.9 ± 2.0 for the three years of the measurement period. These values lie at the middle to the high end of the range reported by Winiger et al. [30], covering 13 different systems. It is, however, important here to make a distinction between water-based and antifreeze-based systems. Systems using antifreeze mixtures are deemed to require greater pumping energies than systems using pure water to keep a turbulent flow in the ground heat exchanger. Although significant pump savings can be realized by reducing flows in the ground heat exchanger, but this approach generally comes at the cost of increased thermal resistance and lower specific heat extraction rates from the ground as demonstrated by [37].
As noted in the literature review section of this paper, most previous studies on performance analysis of GSHP systems are limited to evaluating SPFs for one or two boundaries of the SEPEMO scheme. A large number of studies have reported only SPF2 or SPF3 values, which enable the comparison of GSHP systems with other heating technologies. For the clubhouse system, the annual SPF2 values ranged between 3.3 ± 0.2 and 3.6 ± 0.2, and the annual SPF3 values ranged between 2.4 ± 0.2 and 2.6 ± 0.2 for the three-year study period. The calculated SPF2 values lay in the same range as reported in several previous studies [18,23,29,30,32]. In contrast, the computed values of the SPF3 were considerably lower than the values reported by [23], but are comparable to those reported by [18,27]. The significantly lower SPF3 values of the clubhouse system and several other reported and unreported cases signify the impact of auxiliary heating on the overall performance of GSHP systems. This issue was further investigated in the following.
The evaluation of the seasonal performance of the clubhouse space heating and hot water system outlines several operational and design issues that can be analyzed in greater detail. For instance, the impact of parasitic energy due to pumping and auxiliary systems on the performance factor can be assessed more objectively. In Section 4.3, the measured monthly electrical energy consumption of different space heating and hot water system elements were presented in absolute terms. To further interpret and analyze the system performance, the relative contribution of different system components to the monthly energy consumption may also be considered. The percentage plot of Figure 24 shows the relative share of each system component in the total monthly electrical consumption of the overall system and indicates how the relative share of each system component changes over time. It can be seen from the figure that the compressor in winter months accounts for approximately two-thirds of the total monthly energy consumption of the system, whereas, the energy consumed by the compressor in summer months was down to less than one-third of the total monthly energy consumption. It can also be seen that the relative share of auxiliary heating in the total monthly electrical consumption of the clubhouse system increased from less than one-quarter in winter months to more than three-quarters in summer months. The figure demonstrates that in summer, a period of low space heating demand, the parasitic energy consumption attributable to circulation pumps, auxiliary heaters, and controls contribute the largest share of the total monthly energy consumption of the system. The overall share of parasitic energy consumption in summer was up to 75%, which explains the reason for the comparatively low monthly seasonal performance factors in summer months as observed in Figure 18, Figure 21 and Figure 22.
Another issue that is worth further examining when analyzing the seasonal performance of the clubhouse system is the effect of the pump and auxiliary energy consumption on the performance factors. Figure 24 indicates that the relative share of circulation pumps in the total monthly electrical consumption of the clubhouse system is fairly low and nearly constant, varying roughly between 10 and 15%. Nevertheless, the results of Figure 19 and Figure 23 suggest that SPFs for the clubhouse system are still affected by the electrical consumption of the circulation pumps. As noted earlier in Section 4.1, in September 2015, the flow in the distribution side of the system was altered by changing the speed setting of the distribution-side circulation pump from medium to high. This change in pump speed was seen to have a negative impact on the overall performance of the system. To help demonstrate the impact of pump speed modulation on the performance factors, the SPF3 values based on the Annex 52 boundary scheme or the SPF4 values based on the SEPEMO boundary scheme can be used. Figure 25 and Figure 26 present the daily SPF3 values based on the Annex 52 boundary scheme for hot water and space heating, respectively, as a function of outdoor temperatures. The figures to the left show SPF3 values for the period January 2014 to September 2015, corresponding to the operation of the distribution-side circulation pump at medium speed. The figures to the right present SPF3 values for the period October 2015 to December 2016, corresponding to the operation of the distribution-side circulation pump at high speed. The figures clearly show that, in both space heating and hot water modes, the SPF3 values were negatively affected by the increase in the distribution-side circulation pump speed. Increasing the pump speed lowered the SPF3 in hot water mode from an average value of around 3.0 to 2.4. The SPF3 in space heating mode was also lowered by up to 10%.
What can also be seen from Figure 24 is a considerable increase in the electrical energy consumption of the tank auxiliary heater from July 2015 onward when the thermostat setpoint temperature was changed from 55 °C to 60 °C. It is also worth investigating how this change in setpoint temperature influenced the performance of the clubhouse system. However, it is not possible to fully analyze the impact of this change on the performance factors using either the SEPEMO or Annex 52 boundary schemes. The impact of this change can only be partially demonstrated by, for example, comparing the SPF3+ based on the Annex 52 boundary scheme for periods before and after the change of the setpoint temperature. Figure 27 presents the daily SPF3+ values for the hot water system plotted against outdoor temperatures for the two time periods. The figure to the left shows the SPF3+ values for January 2014 to June 2015, corresponding to the thermostat setpoint temperature of 55 °C, whereas the figure to the right shows the SPF3+ values for July 2015 to Dec 2016, corresponding to the thermostat setpoint temperature of 60 °C. It is, however, important to realize that the comparison shown in Figure 27 does not show the specific impact of changing the thermostat setpoint temperature on the SPF3+ values as the thermostat setpoint temperature and the speed of the distribution-side circulation pump, discussed in the preceding paragraph, were both changed within a few weeks of each other. This means that the comparison of Figure 27 shows the combined effect of changing the distribution-side pump speed and the thermostat setpoint temperature of the tank auxiliary heater on the SPF3+ values. The figure indicates that the average daily SPF3+ values for hot water decreased from an average value of around 2.0 to 1.5 after the speed of the distribution-side circulation pump was increased from medium to high and after the thermostat setpoint temperature was changed from 55 °C to 60 °C.
A novel aspect of this study is the uncertainty analysis of the measurements and the performance evaluation results. As noted in the literature review section, the uncertainty analysis of the actual measurements and the calculated performance factors has seldom been reported in the literature. The lack of uncertainty analysis in the performance analysis of GSHP systems greatly reduces the reliability of the evaluation results, which, in turn, limits the understanding of the role of different components on the overall system performance. In this study, a practical approach to performing uncertainty analysis of performance evaluation of GSHP systems has been presented. Figure 28 shows the fractional uncertainties in all calculated SPFs based on both the SEPEMO and Annex 52 boundaries. It can be seen that despite using high-accuracy sensors and lab-grade measurement equipment, there remains some degree of uncertainty in the calculated seasonal performance factors. The uncertainties range from about 6% to 8% with larger values at expanded boundaries. The uncertainty analysis approach presented in this study can act as a guideline for future studies and the uncertainty results presented here can serve as a benchmark for comparison.
The results of this study can also be used to further analyze and understand certain specific aspects of GSHP systems. One aspect that is important to explore briefly is the amount of electrical energy consumed by the legionella protection systems. Previous studies have reported that legionella protection systems may have quite high energy consumption, especially when the system is running all the time [18,29]. As mentioned earlier, the clubhouse heat pump runs a heating cycle for legionella protection every week and raises the water temperature in the tank connected to the heat pump to above 60 °C. Moreover, the auxiliary heater in the second tank keeps the water temperature in the buffer tank above 55–60 °C to provide legionella protection. Figure 29 shows the distribution of the electrical energy consumed by the heat pump in the hot water mode for 2015. As seen from the figure, the energy consumption for legionella protection showed slight variations, but remained nearly constant over time. The energy consumption for the DHW production had slightly larger variations but was still fairly consistent over time. The annual energy used by the legionella protection system is approximately 2730 kWh, which is around 63% of the energy consumed by the clubhouse hot water system, and approximately 29% of the total energy consumed by the clubhouse heating and hot water system. The high energy consumption of the legionella protection system, especially of the auxiliary heater in the second buffer tank, raises questions about the present legionella protection approach. The heat pump legionella protection system operates only once weekly and does not consume much energy. In contrast, the auxiliary heater used for the legionella protection system in the second tank works continuously and consumes several-fold more energy than the heat pump legionella protection system. The energy consumption of the auxiliary tank electric heater can be significantly reduced by implementing a legionella protection system running only once or twice per week. It is also realized that with a single large hot water tank without a continuously operating legionella protection system, the clubhouse hot water system would have performed better than the existing two-tank system. For the clubhouse system, lowering the energy consumption of the auxiliary tank electric heater by 50% would increase the overall annual seasonal performance by 10–15%. However, further research is recommended to ascertain the generality of these observations for other similar systems.
Another important aspect worth analyzing is the performance of the ground heat exchanger. Figure 30 shows, to the left, the hourly ground heating load as a function of outdoor air temperature and to the right, the corresponding specific ground heat extraction rates. As seen from the figure on the left-side, the clubhouse ground heat exchanger seldom provides a heating power above 3 kW. The corresponding peak specific heat extraction rates, seen from the figure to the right, were only slightly above 15 W/m. The common range of specific heat extraction rates for the rock type under consideration was between 50 and 70 W/m [38]. The specific energy extraction from the ground heat exchanger was noted to be below 70 kWh/m, which again was smaller than the typical values for ground heat exchangers in Sweden. These numbers suggest that the clubhouse ground heat exchanger has been rather generously sized. This was also noticed earlier from the relatively stable and high extraction fluid temperatures observed in Figure 8. It can thus be deduced that due to the over-sized ground heat exchanger, the pumping energy of the source-side circulation pump of the clubhouse system is higher than the conventionally sized ground heat exchangers. This, in turn, implies that the SPF0 values shown in Figure 20 and Figure 23, and corresponding to the ground source performance in the Annex 52 boundary scheme, must be lower for the clubhouse system compared to ground heat exchangers with higher heat extraction rates. Nevertheless, the lower SPF0 would anyhow be offset by higher SPF1 values due to elevated entering fluid temperatures to the heat pump.
6. Conclusions
This paper presented a thorough and systematic analysis of the performance of a clubhouse GSHP system in Gothenburg, Sweden, based on three years of measured data from 2014 to 2017. The system was extensively instrumented, making it possible to measure high-resolution data for temperature and flow at various points of interest as well as the energy consumed by the compressor, circulation pumps, and auxiliary heating elements. The performance evaluation was done following the SEPEMO and Annex 52 boundary schemes.
The results showed that the annual performance of the refrigeration cycle ranged between 3.6 ± 0.2 and 3.9 ± 0.2 for the three years of the measurement period. On the other hand, the annual performance of the entire space heating and hot water system was considerably lower and ranged between 2.2 ± 0.2 and 2.3 ± 0.2 over the measurement period. The principal differences between these two spectra were shown to be caused by the parasitic energy consumption of the circulation pumps and the auxiliary heaters. Having applied the SEPEMO and Annex 52 boundary schemes to the clubhouse heating and hot water system, several overlaps were found to exist between the two approaches. Nonetheless, the Annex 52 boundary scheme was found to be more comprehensive and extensive than the SEPEMO boundary scheme.
The paper also addressed several key design issues and considerations for future applications of GSHP systems. The system performance, as expected, was found to be weather dependent. Surprisingly, the performance was higher in winter and spring than in summer and fall. The higher ground extraction fluid temperatures in summer did not result in a better refrigeration cycle or system performance. The percentage share of parasitic energy consumption in summer was noticed to be as high as 75%. The legionella protection system was shown to have a large impact on the overall performance of the GSHP system. Its continuous operation was found to be a significant factor impacting the performance of the system. The intermittent operation of the legionella protection system once or twice weekly was suggested.
The paper additionally highlighted several general issues for consideration of the practitioners and researchers. The monthly profile of hot water consumption for a small-sized clubhouse building was presented. The measured specific heat extraction rates and specific energy extraction for a groundwater-filled ground heat exchanger were also presented.
In conclusion, the use of GSHP systems to meet the heating and cooling demands of buildings can be fostered by improving their energy performance, reducing their capital costs, and decreasing their installation and operational complexity. A key step in this regard is to understand the real-world performance of GSHP systems based on measured long-term performance data—as presented in this paper—to identify and eliminate the non-optimal system designs and operating practices.
Author Contributions
This manuscript was planned as part of the IEA HPT Annex 52. The measurement data were collected and coordinated by S.J. The data was analyzed, evaluated, and curated by H.L. and H.Z. under the supervision of S.J. The visualizations were developed by H.L. and H.Z. The original manuscript was drafted by S.J. with help from H.L. and H.Z. The manuscript was reviewed, edited, and approved by all authors. The project administration including the acquisition of funding was performed by S.J. All authors have read and agreed to the published version of the manuscript.
Funding
The financial support for this work was provided by the Swedish Energy Agency (Energimyndigheten) through their national research programs TERMO and EFFSYS.
Acknowledgments
This work is part of the IEA HPT Annex 52, long term performance measurement of GSHP systems serving commercial, institutional, and multi-family buildings. The assistance of Lennart Vamling of the Chalmers University of Technology in providing access to the Frölunda OL clubhouse is gratefully acknowledged. The continuous support of Håkan Larsson, Research Engineer, of the Chalmers University of Technology with the long-term measurements is greatly recognized and appreciated.
Conflicts of Interest
The authors declare no conflict of interest. The funders had no role in the design of the study; in the collection, analyses, or interpretation of data; in the writing of the manuscript, or in the decision to publish the results.
Nomenclature
| Nomenclature | Explanation |
| Fractional uncertainty in temperature difference | |
| Fractional uncertainty in flow | |
| Fractional uncertainty in heat transfer rate | |
| Fractional uncertainty in thermal energy | |
| Fractional uncertainty in electrical energy consumption | |
| eSPF | Fractional uncertainty in SPF |
| Fractional uncertainty in electrical energy consumption of source-side pump | |
| Fractional uncertainty in electrical energy consumption of load-side pump | |
| Fractional uncertainty in electrical energy consumption of compressor | |
| Absolute uncertainty in temperature difference (K) | |
| Absolute uncertainty in heat transfer rate (W) | |
| Absolute uncertainty in thermal energy (kWh) | |
| Absolute uncertainty in electrical energy consumption (kWh) | |
| Heat transfer rate (W) | |
| Heat energy transfer (kWh) | |
| Thermal energy output of auxiliary heating (kWh) | |
| Thermal energy output of ground heat exchanger (kWh) | |
| Thermal energy output of refrigeration cycle (kWh) | |
| Electrical energy consumption of auxiliary heating (kWh) | |
| Electrical energy consumption of compressor (kWh) | |
| Electrical energy consumption of source-side pump (kWh) | |
| Electrical energy consumption of load-side pump (kWh) | |
| Abbreviation | Explanation |
| COP | Coefficient of performance |
| GSHP | Ground source heat pump |
| HP | Heat pump |
| ODA | Outdoor air |
| SEPEMO | SEasonal PErformance factor and MOnitoring for heat pump systems |
| SPF | Seasonal performance factor |
| Symbol | Explanation |
 | Space heating |
 | Domestic hot water |
 | Water tank |
 | Ground heat exchanger |
 | Refrigeration cycle |
 | Circulation pump |
 | Temperature sensor |
 | Electrical energy meter |
 | Flowmeter |
 | Electric heater |
 | City water |
References
- International Energy Agency. Global Status Report for Buildings and Construction: Towards a Zero-Emission, Efficient and Resilient Buildings and Construction Sector. Available online: https://www.iea.org/reports/global-status-report-for-buildings-and-construction-2019 (accessed on 15 July 2020).
- International Energy Agency (IEA). Transition to Sustainable Buildings: Strategies and Opportunities to 2050; OECD: Paris, France, 2013. [Google Scholar]
- Eurostat. Energy, Transport and Environment Statistics, 2019 ed.; Publications Office of the European Union: Luxembourg, 2019.
- Heat Roadmap Europe 2050. Heating and Cooling: Facts and Figures—The Transformation towards a Low-Carbon Heating and Cooling Sector. Available online: https://heatroadmap.eu/wp-content/uploads/2019/03/Brochure_Heating-and-Cooling_web.pdf (accessed on 15 July 2020).
- International Energy Agency (IEA). Heating. Available online: https://www.iea.org/reports/heating (accessed on 15 July 2020).
- International Energy Agency (IEA). Heat Pumps. Available online: https://www.iea.org/reports/heat-pumps (accessed on 15 July 2020).
- Rees, S. (Ed.) Advances in Ground-Source Heat Pump Systems; Woodhead Publishing: Cambridge, UK, 2016. [Google Scholar]
- Lund, J.W.; Boyd, T.L. Direct Utilization of Geothermal Energy 2015 Worldwide Review. Geothermics 2016, 60, 66–93. [Google Scholar] [CrossRef]
- European Geothermal Energy Council (EGEC). EGEC Geothermal Market Report 2019; EGEC: Brussels, Belgium, 2020. [Google Scholar]
- Eskilson, P. Thermal Analysis of Heat Extraction Boreholes. Ph.D. Thesis, University of Lund, Lund, Sweden, 1987. [Google Scholar]
- Hellström, G. Ground Heat Storage, Thermal Analyses of Duct Storage Systems, Part I: Theory. Ph.D. Thesis, University of Lund, Lund, Sweden, 1991. [Google Scholar]
- Gehlin, S. Thermal Response Test—Method Development and Evaluation. Ph.D. Thesis, Luleå University of Technology, Luleå, Sweden, 2020. [Google Scholar]
- Javed, S.; Claesson, J. New analytical and numerical solutions for the short-term analysis of vertical ground heat exchangers. ASHRAE Trans. 2011, 117, 3–12. [Google Scholar]
- Margen, P.H.E.; Studsvik, E.A.B. Heat Pump System. U.S. Patent 4,091,636, 30 May 1978. [Google Scholar]
- Graslund, J.; Nordberg, G.; Skanska, K.U.N.A.B. Method and Device for Cooling. U.S. Patent 8,745,994, 10 June 2014. [Google Scholar]
- Ojala, M.; Ojala, J.; Ojala, K.; Ojala, H.; Muovitech, A.B. Pipe Collector for Heat Pump Systems. U.S. Patent 9,546,802, 17 January 2017. [Google Scholar]
- Nordell, B.O.; Hellström, G. High temperature solar heated seasonal storage system for low temperature heating of buildings. Sol. Energy 2000, 69, 511–523. [Google Scholar] [CrossRef]
- Spitler, J.D.; Gehlin, S. Measured performance of a mixed-use commercial-building ground source heat pump system in Sweden. Energies 2019, 12, 2020. [Google Scholar] [CrossRef] [Green Version]
- International Standards Office. ISO 13256-2 Water-source Heat Pumps—Testing and Rating for Performance. Part 2: Water-to-Water and Brine-to-Water Heat Pumps; ISO: Geneva, Switzerland, 1998. [Google Scholar]
- European Committee for Standardization (CEN). EN14511 Air Conditioners, Liquid Chilling Packages and Heat Pumps with Electrically Driven Compressors for Space Heating and Cooling; CEN: Brussels, Belgium, 2018. [Google Scholar]
- Nordman, R.; Kleefkens, O.; Riviere, P.; Nowak, T.; Zottl, A.; Arzano-Daurelle, C.; Lehmann, A.; Polyzou, O.; Karytsas, K.; Riederer, P.; et al. SEasonal PErformance Factor and MOnitoring for Heat Pump Systems in the Building Sector (SEPEMO-Build). Final Report; SP Technical Research Institute of Sweden: Borås, Sweden, 2012. [Google Scholar]
- Naicker, S.S.; Rees, S.J. Performance analysis of a large geothermal heating and cooling system. Renew. Energy 2018, 122, 429–442. [Google Scholar] [CrossRef] [Green Version]
- Bockelmann, F.; Fisch, M.N. It works—Long-term performance measurement and optimization of six ground source heat pump systems in Germany. Energies 2019, 12, 4691. [Google Scholar] [CrossRef]
- Gehlin, S.; Spitler, J.D. Half-term results from IEA HPT Annex 52—Long-term performance monitoring of large GSHP systems. In Proceedings of the 13th IEA Heat Pump Conference, Jeju, Korea, 11–14 May 2020. (postponed). [Google Scholar]
- Spitler, J.D. Addressing the building energy performance gap with measurements. Sci. Technol. Built Environ. 2020, 26, 283–284. [Google Scholar] [CrossRef] [Green Version]
- Miara, M.; Günther, D.; Kramer, T.; Oltersdorf, T.; Wapler, J. Heat Pump Efficiency Analysis and Evaluation of Heat Pump Efficiency in Real-Life Conditions; Fraunhofer ISE: Freiburg, Germany, 2011. [Google Scholar]
- Stafford, A. Long-term monitoring and performance of ground source heat pumps. Build. Res. Inf. 2011, 39, 566–573. [Google Scholar] [CrossRef]
- Gleeson, C.P.; Lowe, R. Meta-analysis of European heat pump field trial efficiencies. Energy Build. 2013, 66, 637–647. [Google Scholar] [CrossRef]
- Hughes, D. Monitoring of Non-Domestic Renewable Heat Incentive Ground-Source and Water-Source Heat Pumps—Final Report; UK Department for Business, Energy & Industrial Strategy: Belfast, UK, 2018.
- Winiger, S.; Kalz, D.; Sonntag, M.; Miara, M. Cross comparison by means of long-term measurements: Energy and efficiency analysis of heat pump systems in non-residential buildings. In Proceedings of the 11th IEA Heat Pump Conference, Montréal, QC, Canada, 12–16 May 2014. [Google Scholar]
- Liu, X.; Malhotra, M.; Im, P. Performance analysis of ground source heat pump demonstration projects in the United States. In Proceedings of the 12th IEA Heat Pump Conference, Rotterdam, The Netherlands, 15–18 May 2017. [Google Scholar]
- Mendrinos, D.; Karytsas, C. Monitoring results after 12 months of provision of heating and cooling at the 8 demonstration buildings of the European project “Ground-Med”. In Proceedings of the European Geothermal Congress 2016, Strasbourg, France, 19–23 September 2016. [Google Scholar]
- Naicker, S.S.; Rees, S.J. Long-term high frequency monitoring of a large borehole heat exchanger array. Renew. Energy 2020, 145, 1528–1542. [Google Scholar] [CrossRef]
- Spitler, J.D.; Gehlin, S. Three years’ performance monitoring of a mixed-use ground source heat pump system in Stockholm. In Proceedings of the 13th IEA Heat Pump Conference, Jeju, Korea, 11–14 May 2020. (postponed). [Google Scholar]
- Spitler, J.D.; Javed, S.; Ramstad, R.K. Natural convection in groundwater-filled boreholes used as ground heat exchangers. Appl. Energy 2016, 164, 352–365. [Google Scholar] [CrossRef]
- Haynes, W.M. (Ed.) CRC Handbook of Chemistry and Physics; CRC Press: Boca Raton, FL, USA, 2014. [Google Scholar]
- Javed, S.; Spitler, J.D. Calculation of borehole thermal resistance. In Advances in Ground-Source Heat Pump Systems; Woodhead Publishing: Cambridge, UK, 2016; pp. 63–95. [Google Scholar]
- Verein Deutscher Ingenieure (VDI). VDI 4640 Thermal Use of the Underground. Part 2: Ground Source Heat Pump Systems; VDI: Berlin, Germany, 2001. [Google Scholar]
Figure 1.
Image of the clubhouse building.

Figure 2.
Side and front elevations of the clubhouse building.

Figure 3.
Floorplan of the clubhouse building.

Figure 4.
Schematic of the clubhouse GSHP system. Pictograms in drawing used with permission from TU Braunschweig IGS (Institut für Gebäude- und Solartechnik, Technische Universität Braunschweig).
Figure 4.
Schematic of the clubhouse GSHP system. Pictograms in drawing used with permission from TU Braunschweig IGS (Institut für Gebäude- und Solartechnik, Technische Universität Braunschweig).

Figure 5.
SEPEMO boundary scheme applied to the clubhouse GSHP system. Pictograms in drawing used with permission from TU Braunschweig IGS.
Figure 5.
SEPEMO boundary scheme applied to the clubhouse GSHP system. Pictograms in drawing used with permission from TU Braunschweig IGS.

Figure 6.
Annex 52 boundary levels 0, 1, 2, and 3 applied to the clubhouse GSHP system. Pictograms in drawing used with permission from TU Braunschweig IGS.
Figure 6.
Annex 52 boundary levels 0, 1, 2, and 3 applied to the clubhouse GSHP system. Pictograms in drawing used with permission from TU Braunschweig IGS.

Figure 7.
Annex 52 boundary levels 1+, 2+, and 3+ applied to the clubhouse GSHP system. Pictograms in drawing used with permission from TU Braunschweig IGS.
Figure 7.
Annex 52 boundary levels 1+, 2+, and 3+ applied to the clubhouse GSHP system. Pictograms in drawing used with permission from TU Braunschweig IGS.

Figure 8.
Measured daily average outdoor air and ground heat exchanger exit fluid temperatures.

Figure 9.
Measured daily average supply and return temperatures for space heating (left) and hot water (right) plotted against outdoor air temperatures.
Figure 9.
Measured daily average supply and return temperatures for space heating (left) and hot water (right) plotted against outdoor air temperatures.

Figure 10.
Measured daily average hot water temperatures drawn from the buffer tank and supplied to the building after anti-scalding tempering.
Figure 10.
Measured daily average hot water temperatures drawn from the buffer tank and supplied to the building after anti-scalding tempering.

Figure 11.
Measured monthly hot water consumption.

Figure 12.
Measured monthly heating and hot water loads.

Figure 13.
Measured yearly heating and hot water loads.

Figure 14.
Measured building energy signature for 2014–2016.

Figure 15.
Measured monthly electrical energy consumption of GSHP system components.

Figure 16.
Measured yearly electrical energy consumption of GSHP system components.

Figure 17.
Measured yearly electrical energy consumption of space heating and hot water systems.

Figure 18.
Monthly SPF values based on SEPEMO boundaries.

Figure 19.
Annual SPF values based on SEPEMO boundaries.

Figure 20.
Monthly SPF0 values based on Annex 52 boundaries.

Figure 21.
Monthly SPF1, SPF2, and SPF3 values based on Annex 52 boundaries.

Figure 22.
Monthly SPF1+, SPF2+, and SPF3+ values based on Annex 52 boundaries.

Figure 23.
Annual SPF values based on Annex 52 boundaries.

Figure 24.
The percentage share of different system components in the total monthly electrical consumption of the space heating and hot water system.
Figure 24.
The percentage share of different system components in the total monthly electrical consumption of the space heating and hot water system.

Figure 25.
Daily SPF3 values for hot water plotted against outdoor air temperatures for medium (left) and high (right) pump speeds.
Figure 25.
Daily SPF3 values for hot water plotted against outdoor air temperatures for medium (left) and high (right) pump speeds.

Figure 26.
Daily SPF3 values for space heating plotted against outdoor air temperatures for medium (left) and high (right) pump speeds.
Figure 26.
Daily SPF3 values for space heating plotted against outdoor air temperatures for medium (left) and high (right) pump speeds.

Figure 27.
Daily SPF3+ values for hot water plotted against outdoor air temperatures before (left) and after (right) the change of the thermostat setpoint temperature of the tank auxiliary heater.
Figure 27.
Daily SPF3+ values for hot water plotted against outdoor air temperatures before (left) and after (right) the change of the thermostat setpoint temperature of the tank auxiliary heater.

Figure 28.
Uncertainty in the calculated SPFs for SEPEMO (left) and Annex 52 (right) boundary schemes.
Figure 28.
Uncertainty in the calculated SPFs for SEPEMO (left) and Annex 52 (right) boundary schemes.

Figure 29.
Measured monthly electrical energy consumption of hot water production and legionella protection system for 2015.
Figure 29.
Measured monthly electrical energy consumption of hot water production and legionella protection system for 2015.

Figure 30.
Hourly ground heating loads (left) and specific ground heat extraction rates (right) as a function of outdoor air temperatures.
Figure 30.
Hourly ground heating loads (left) and specific ground heat extraction rates (right) as a function of outdoor air temperatures.


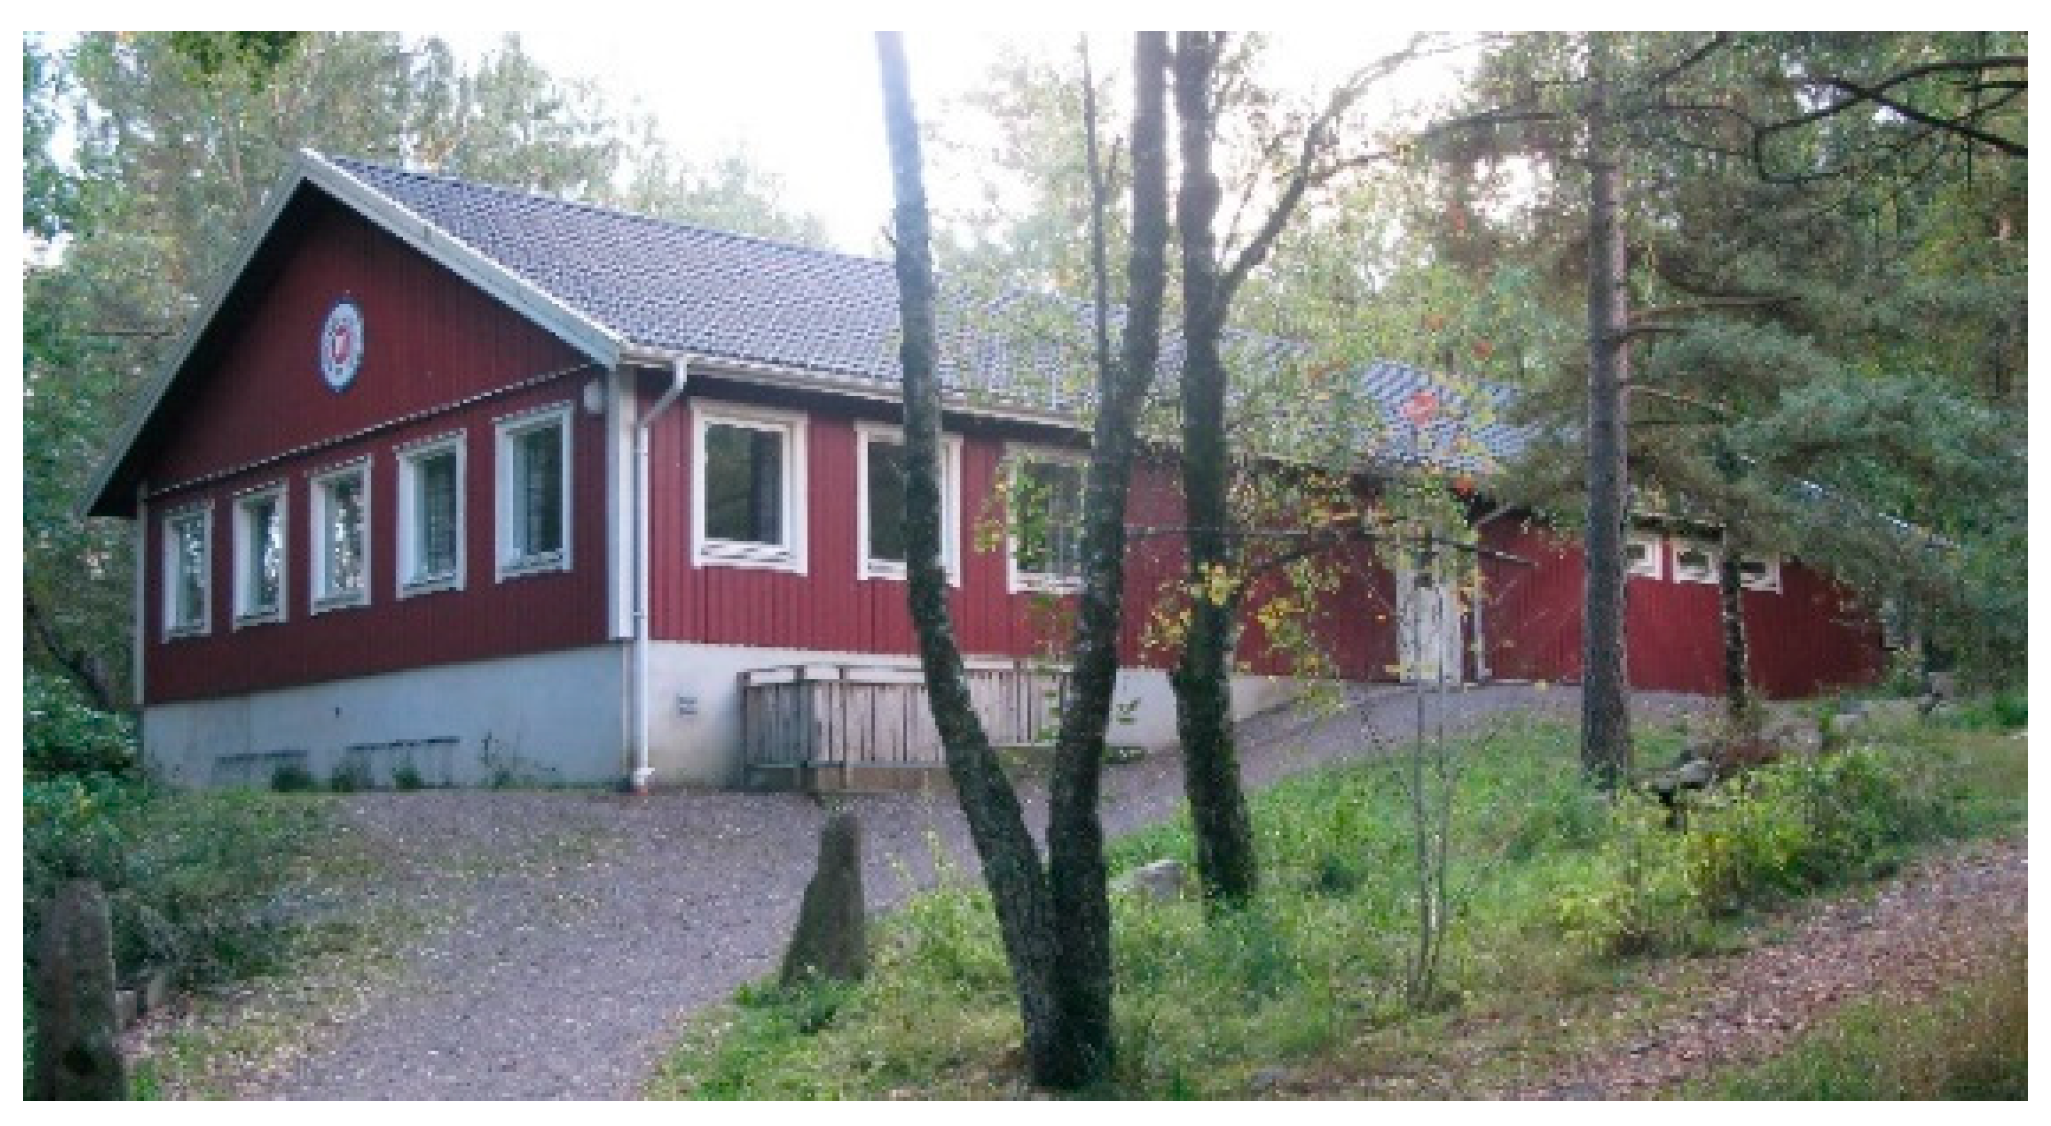
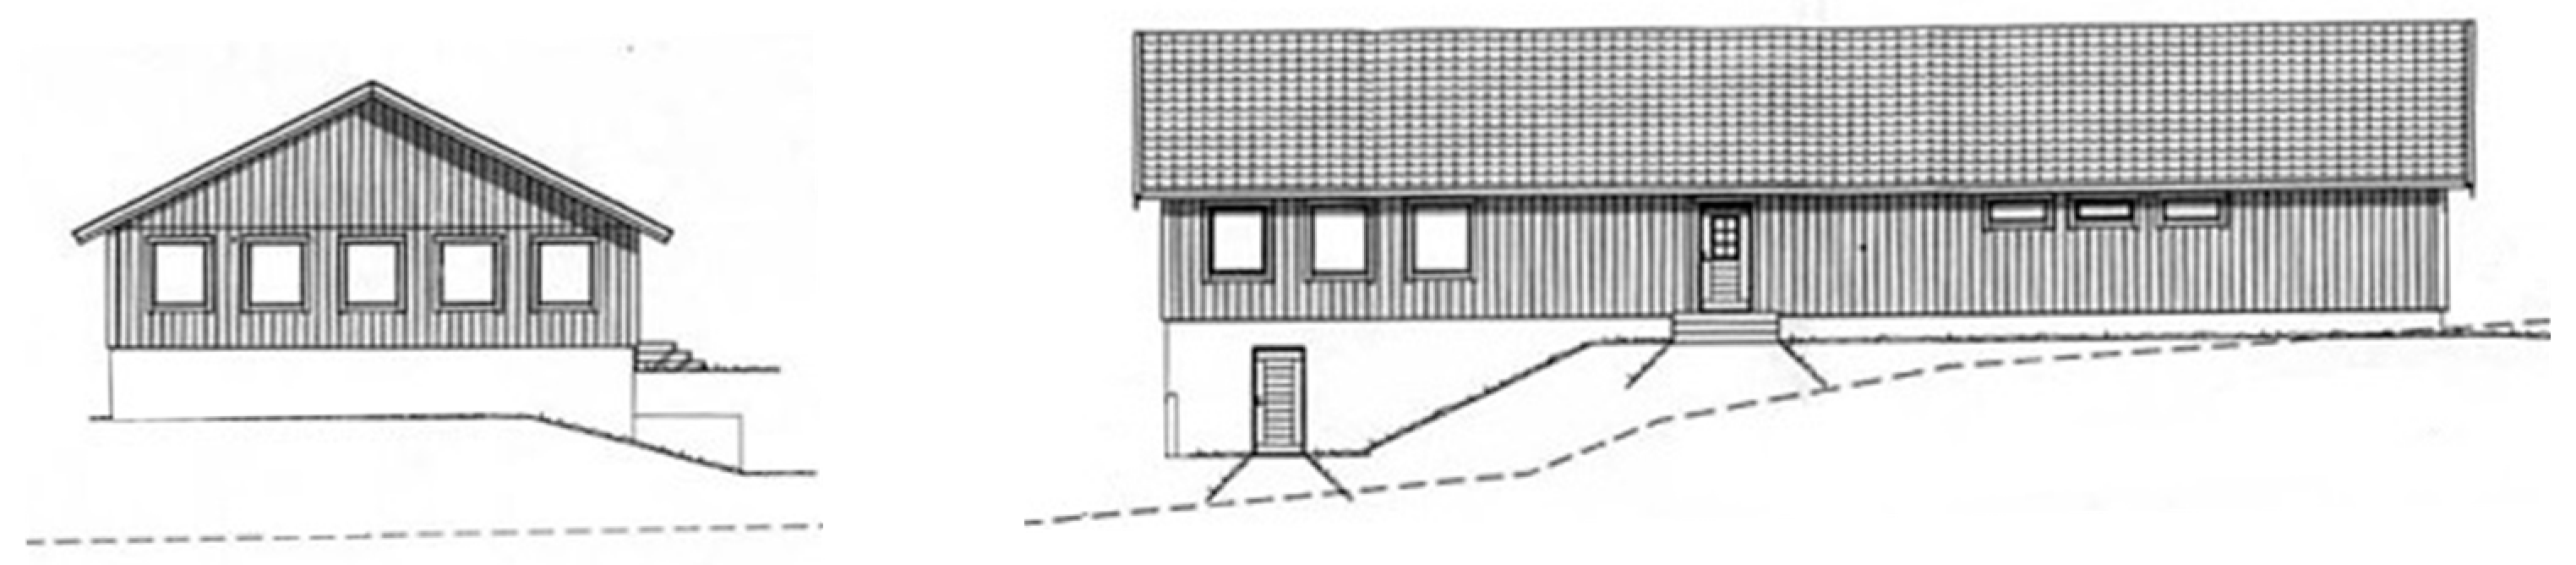
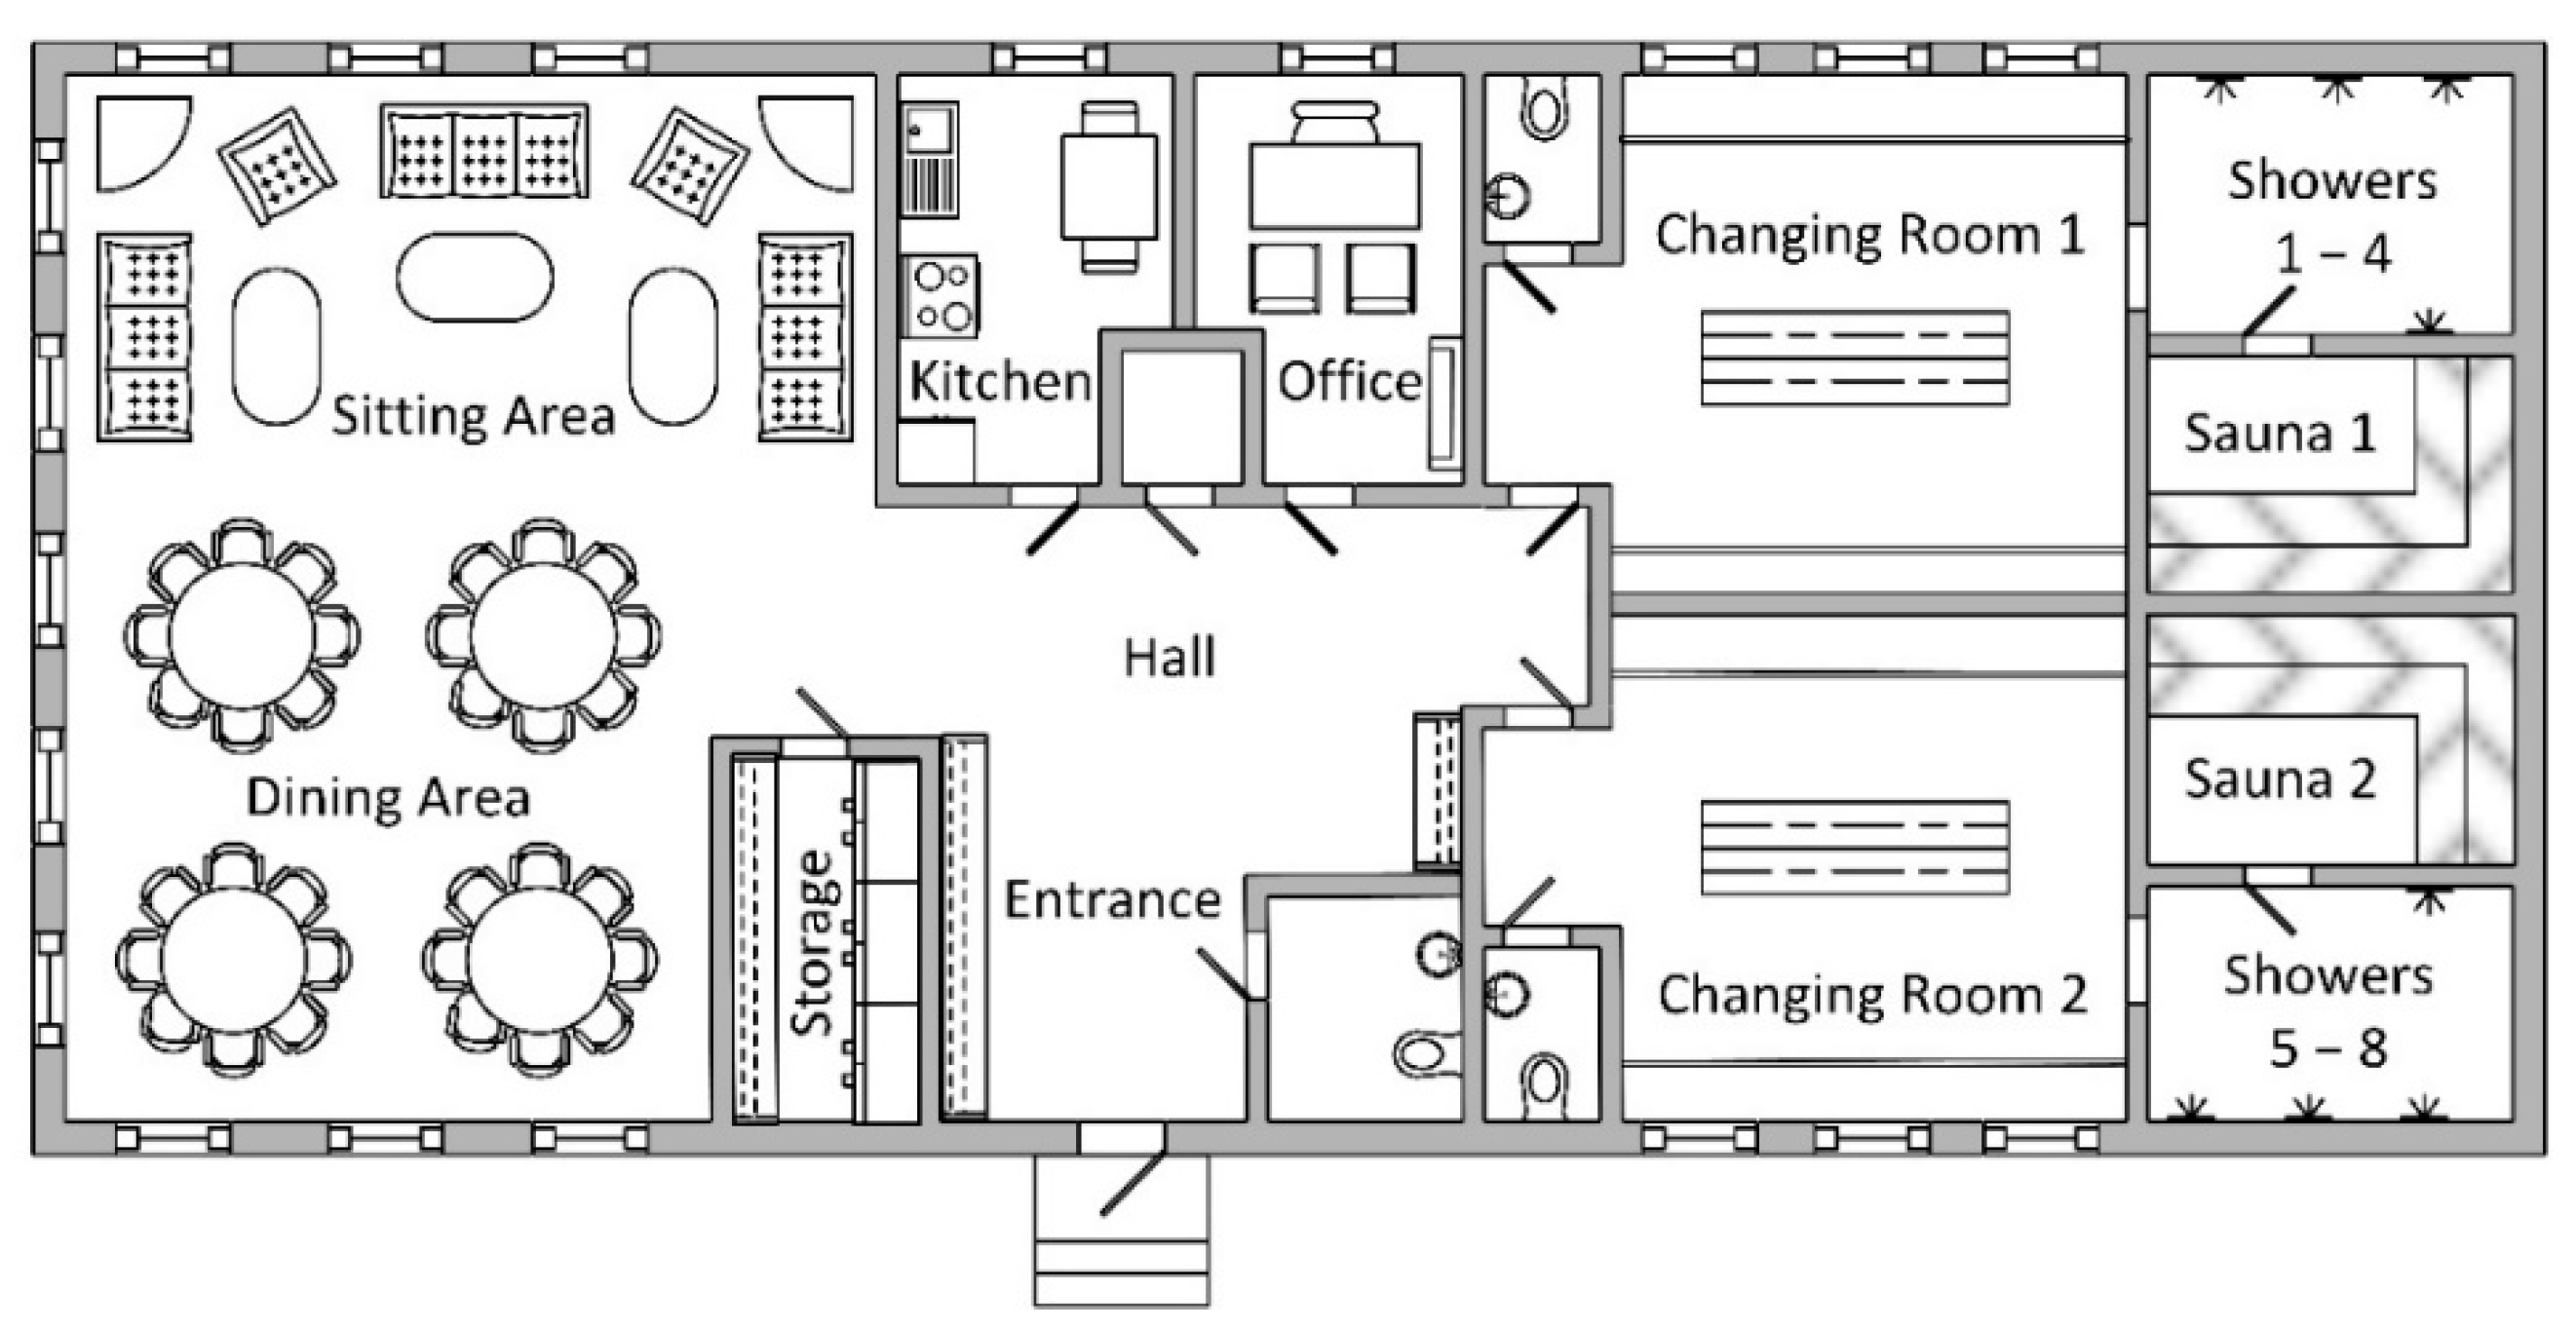
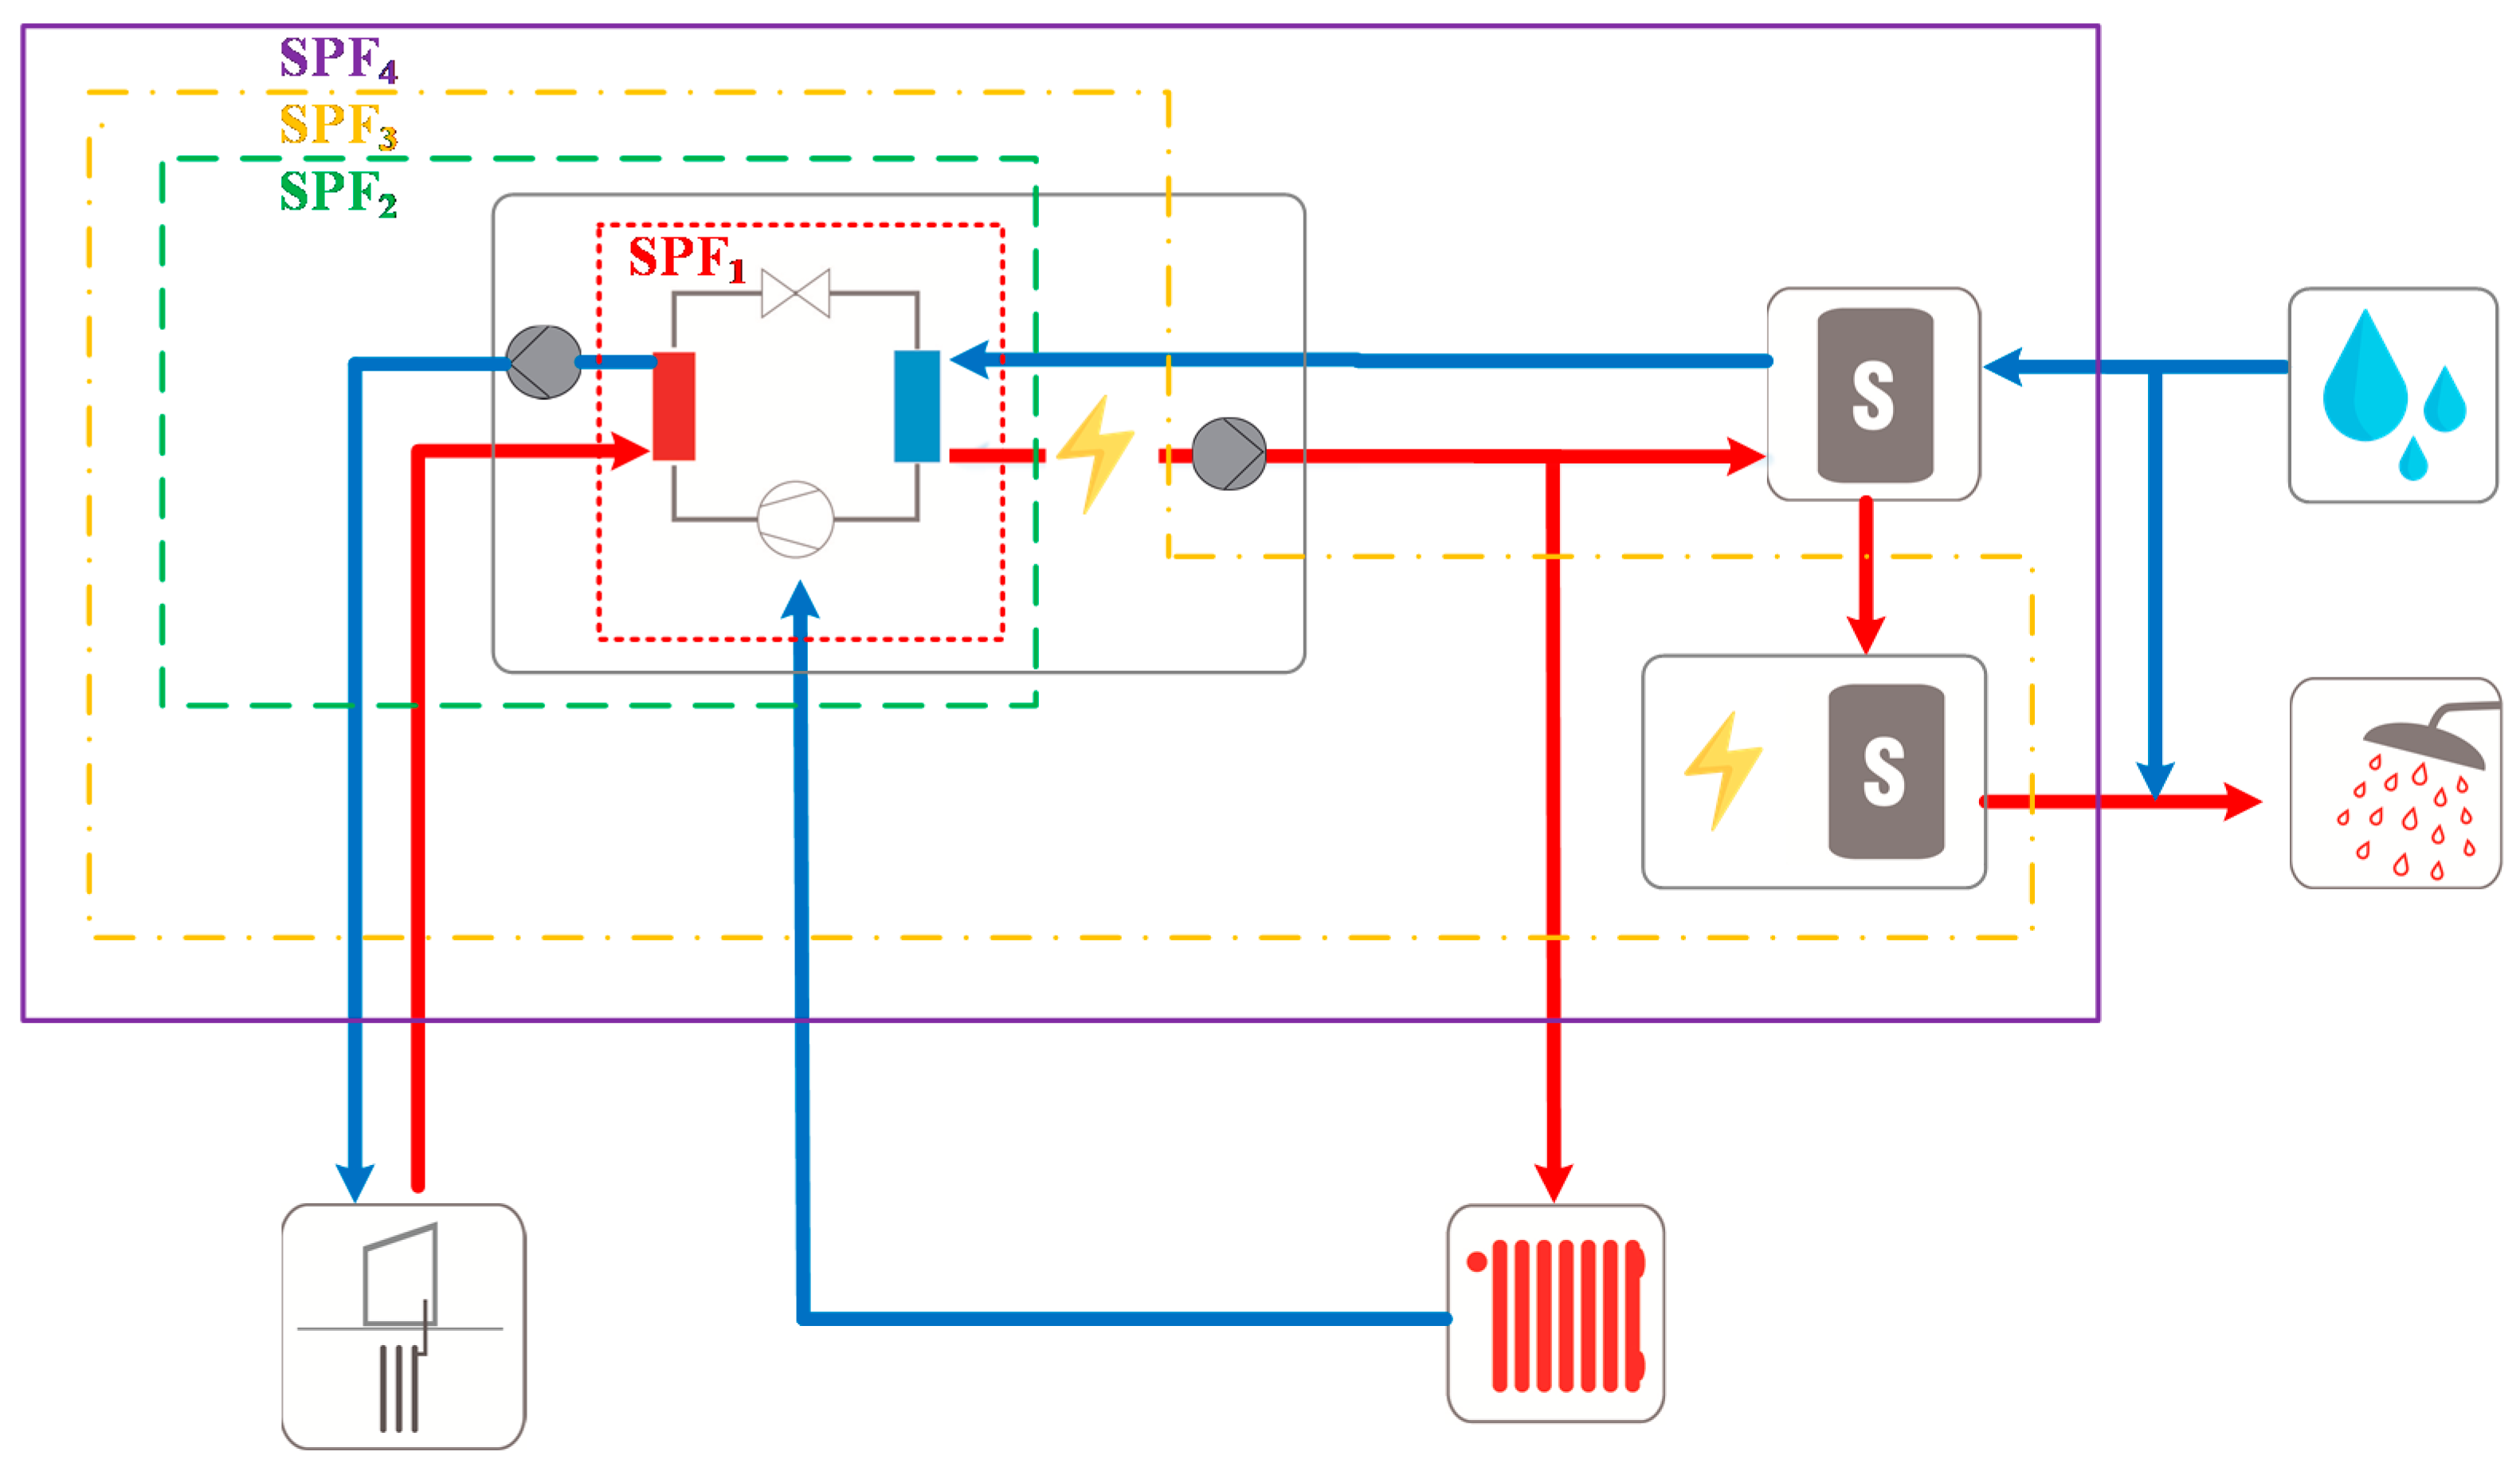
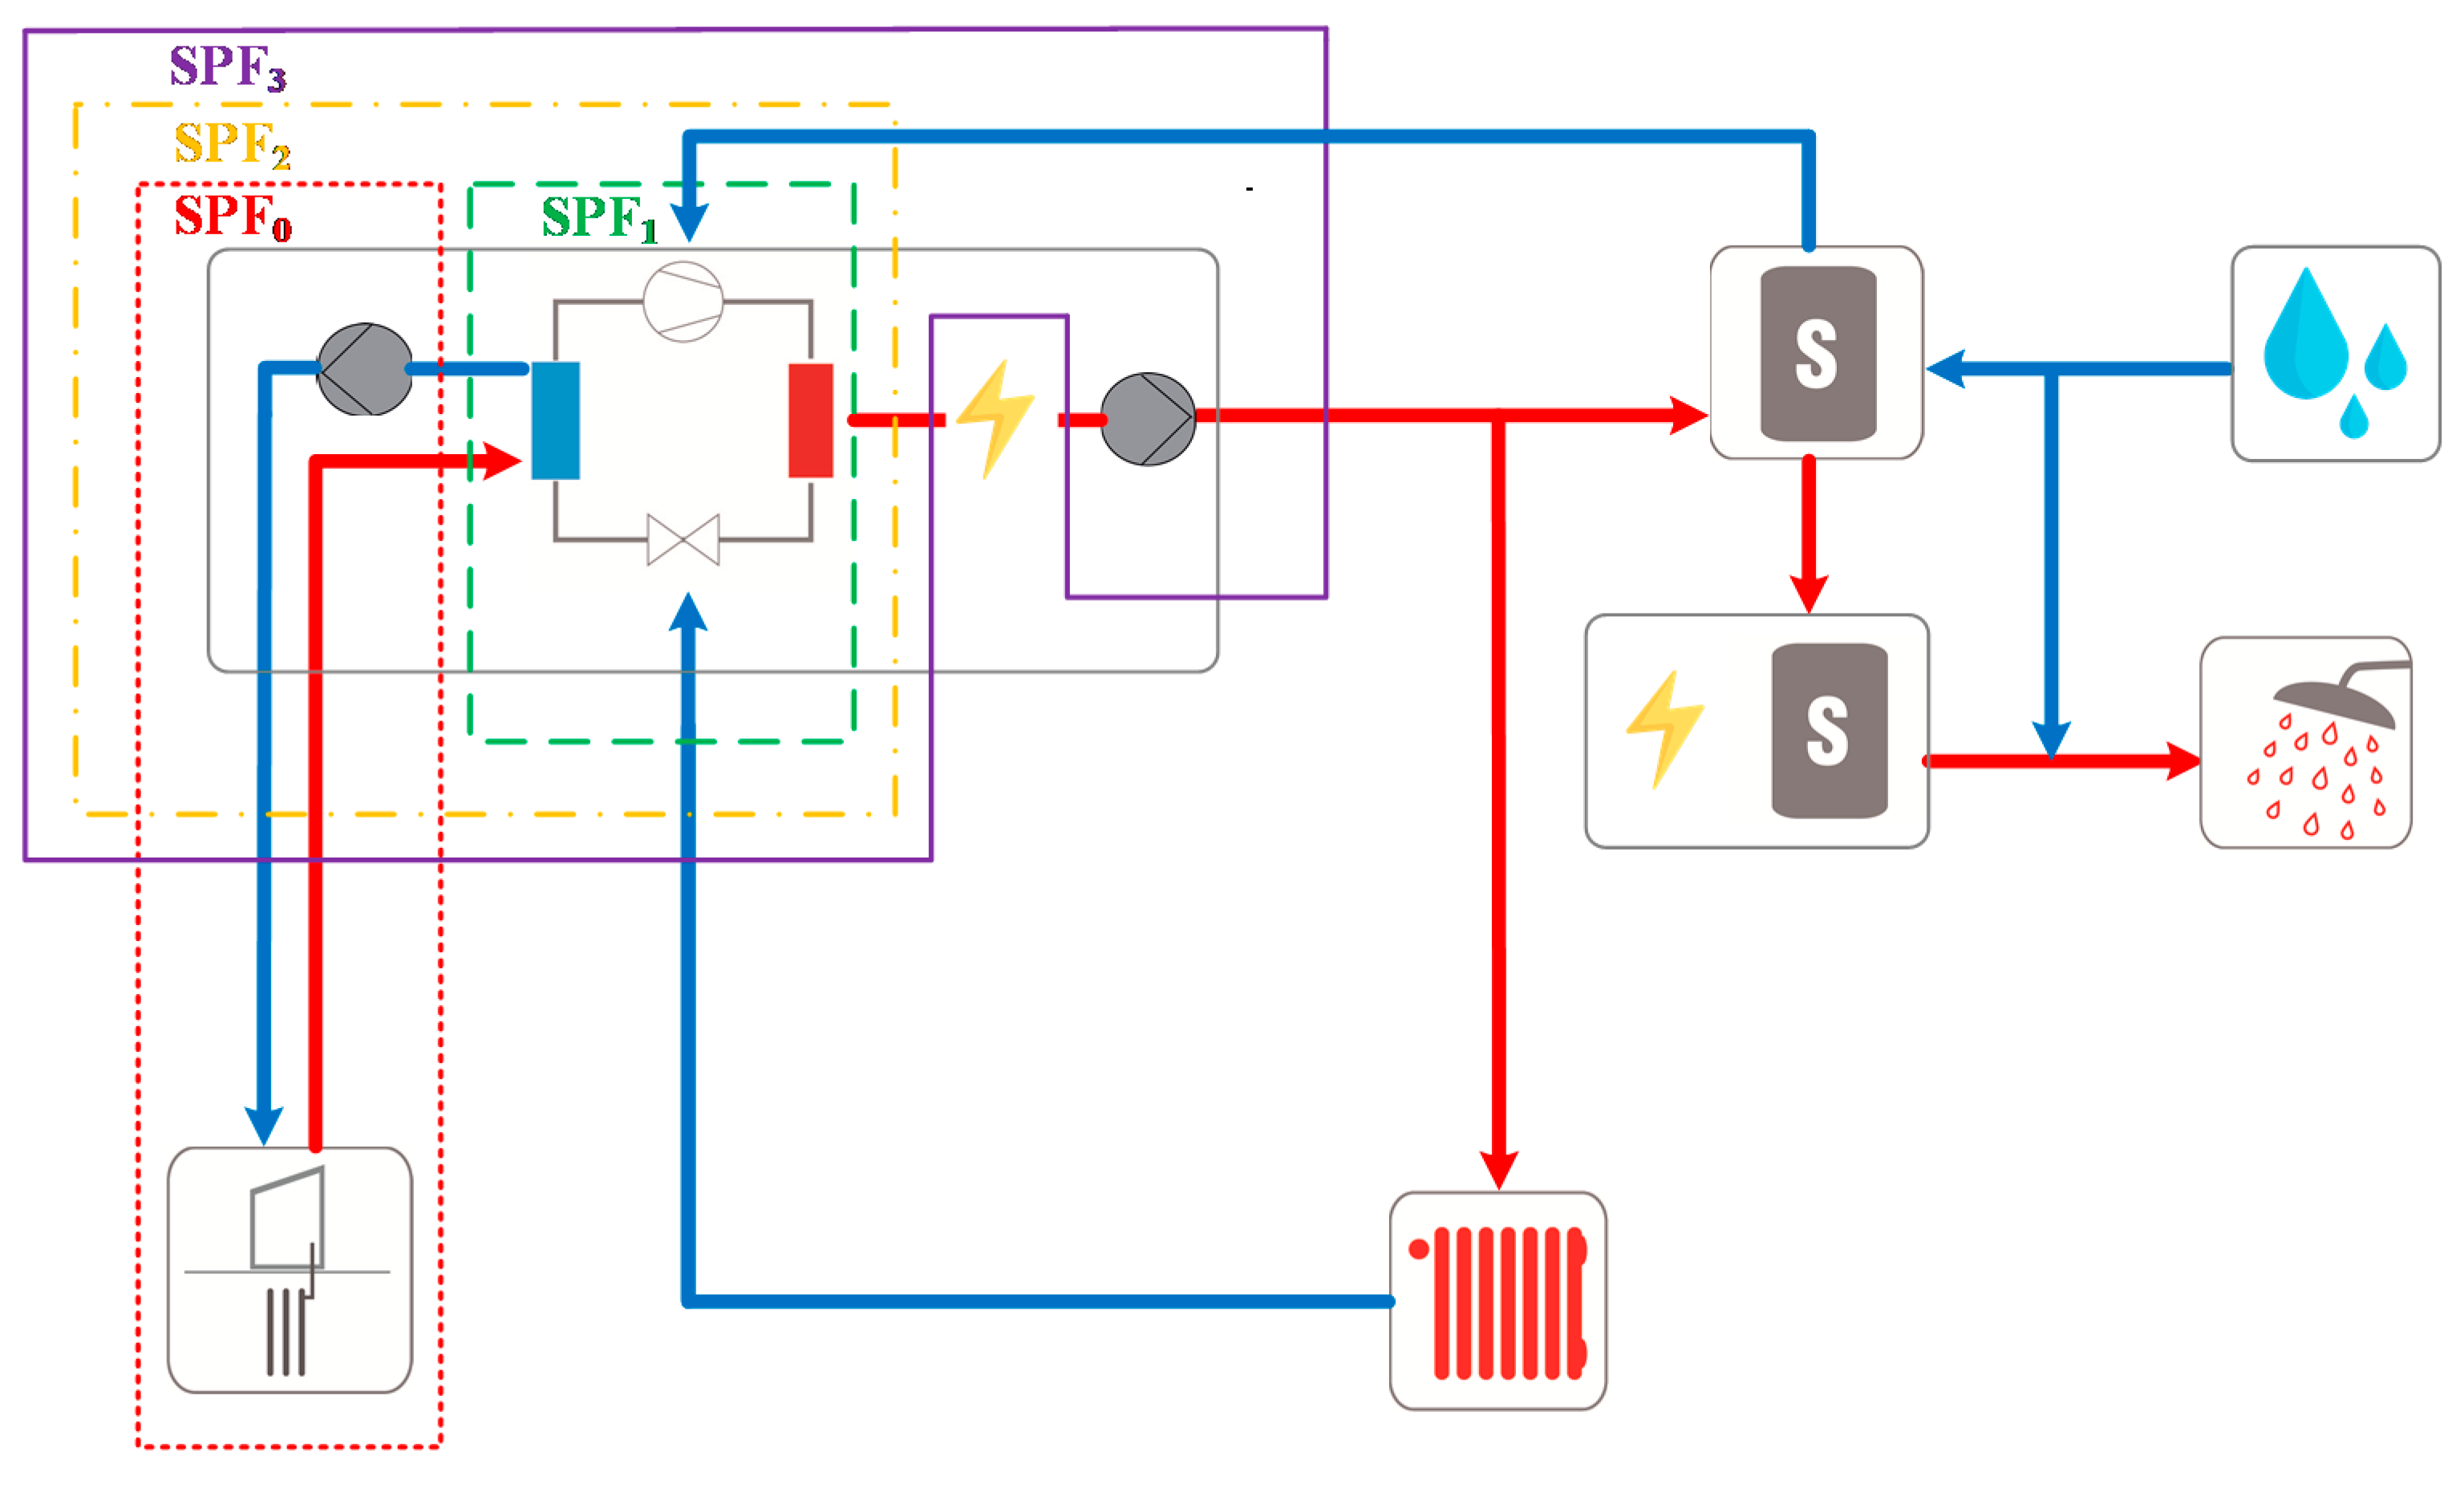
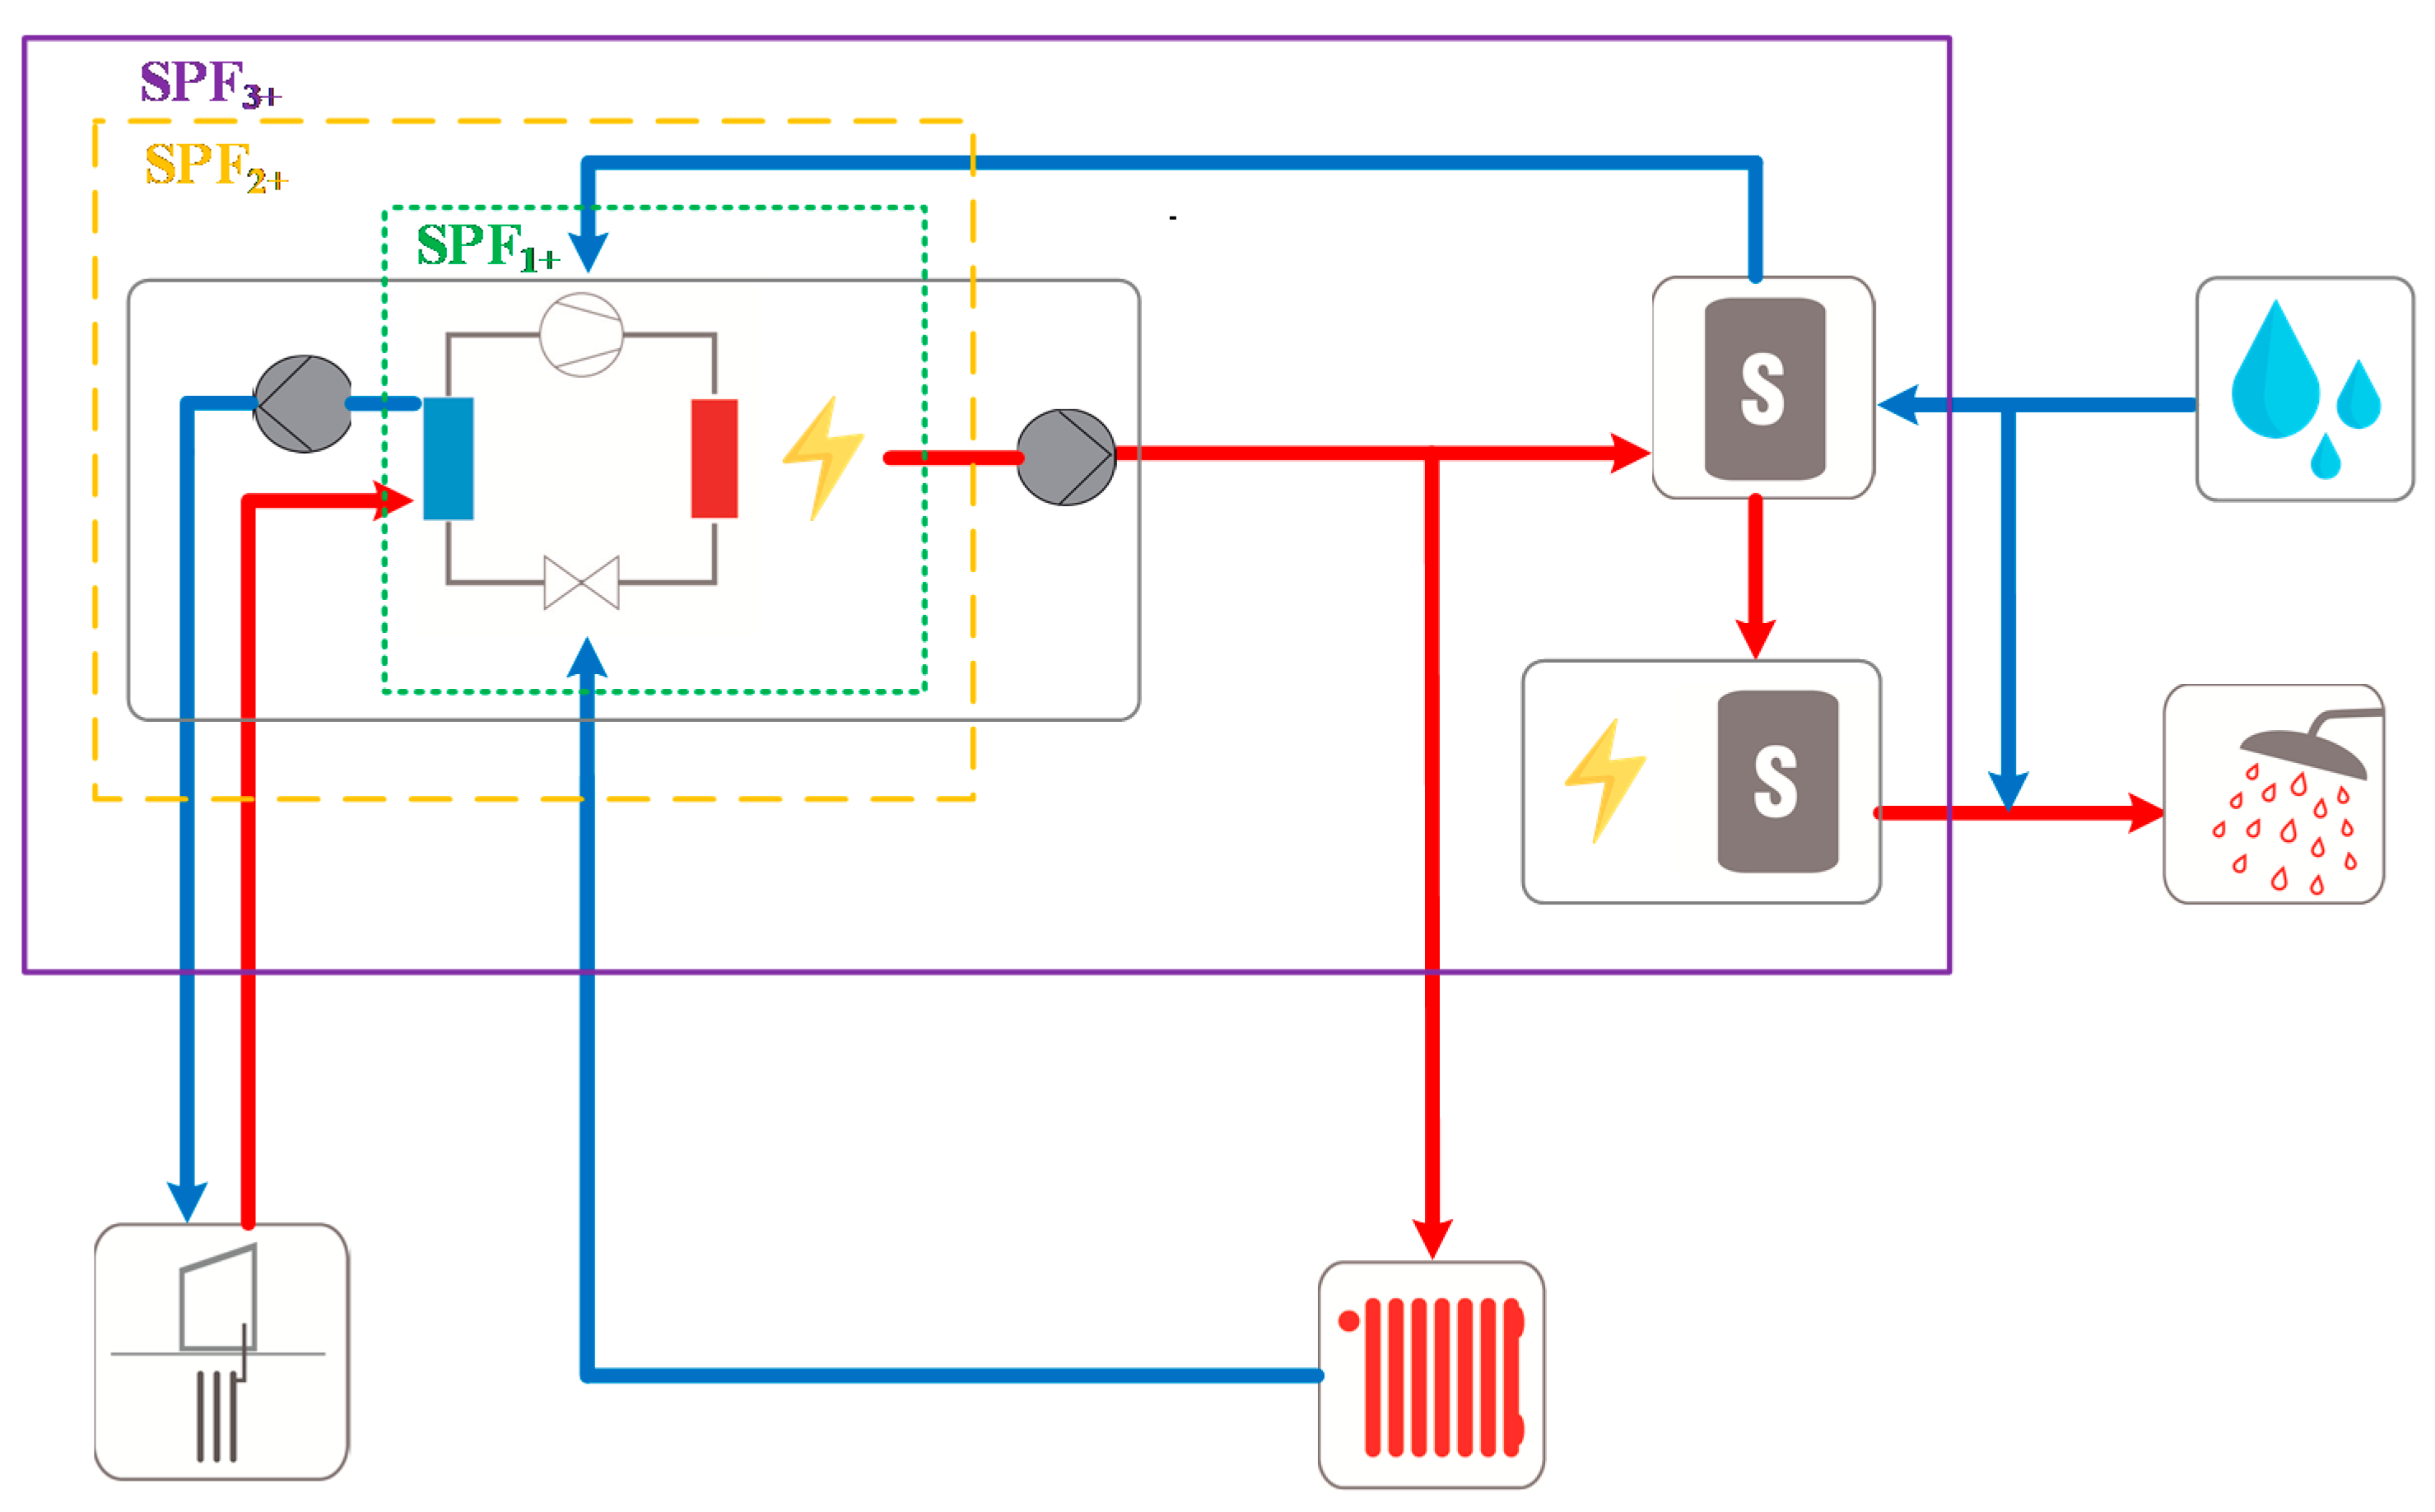
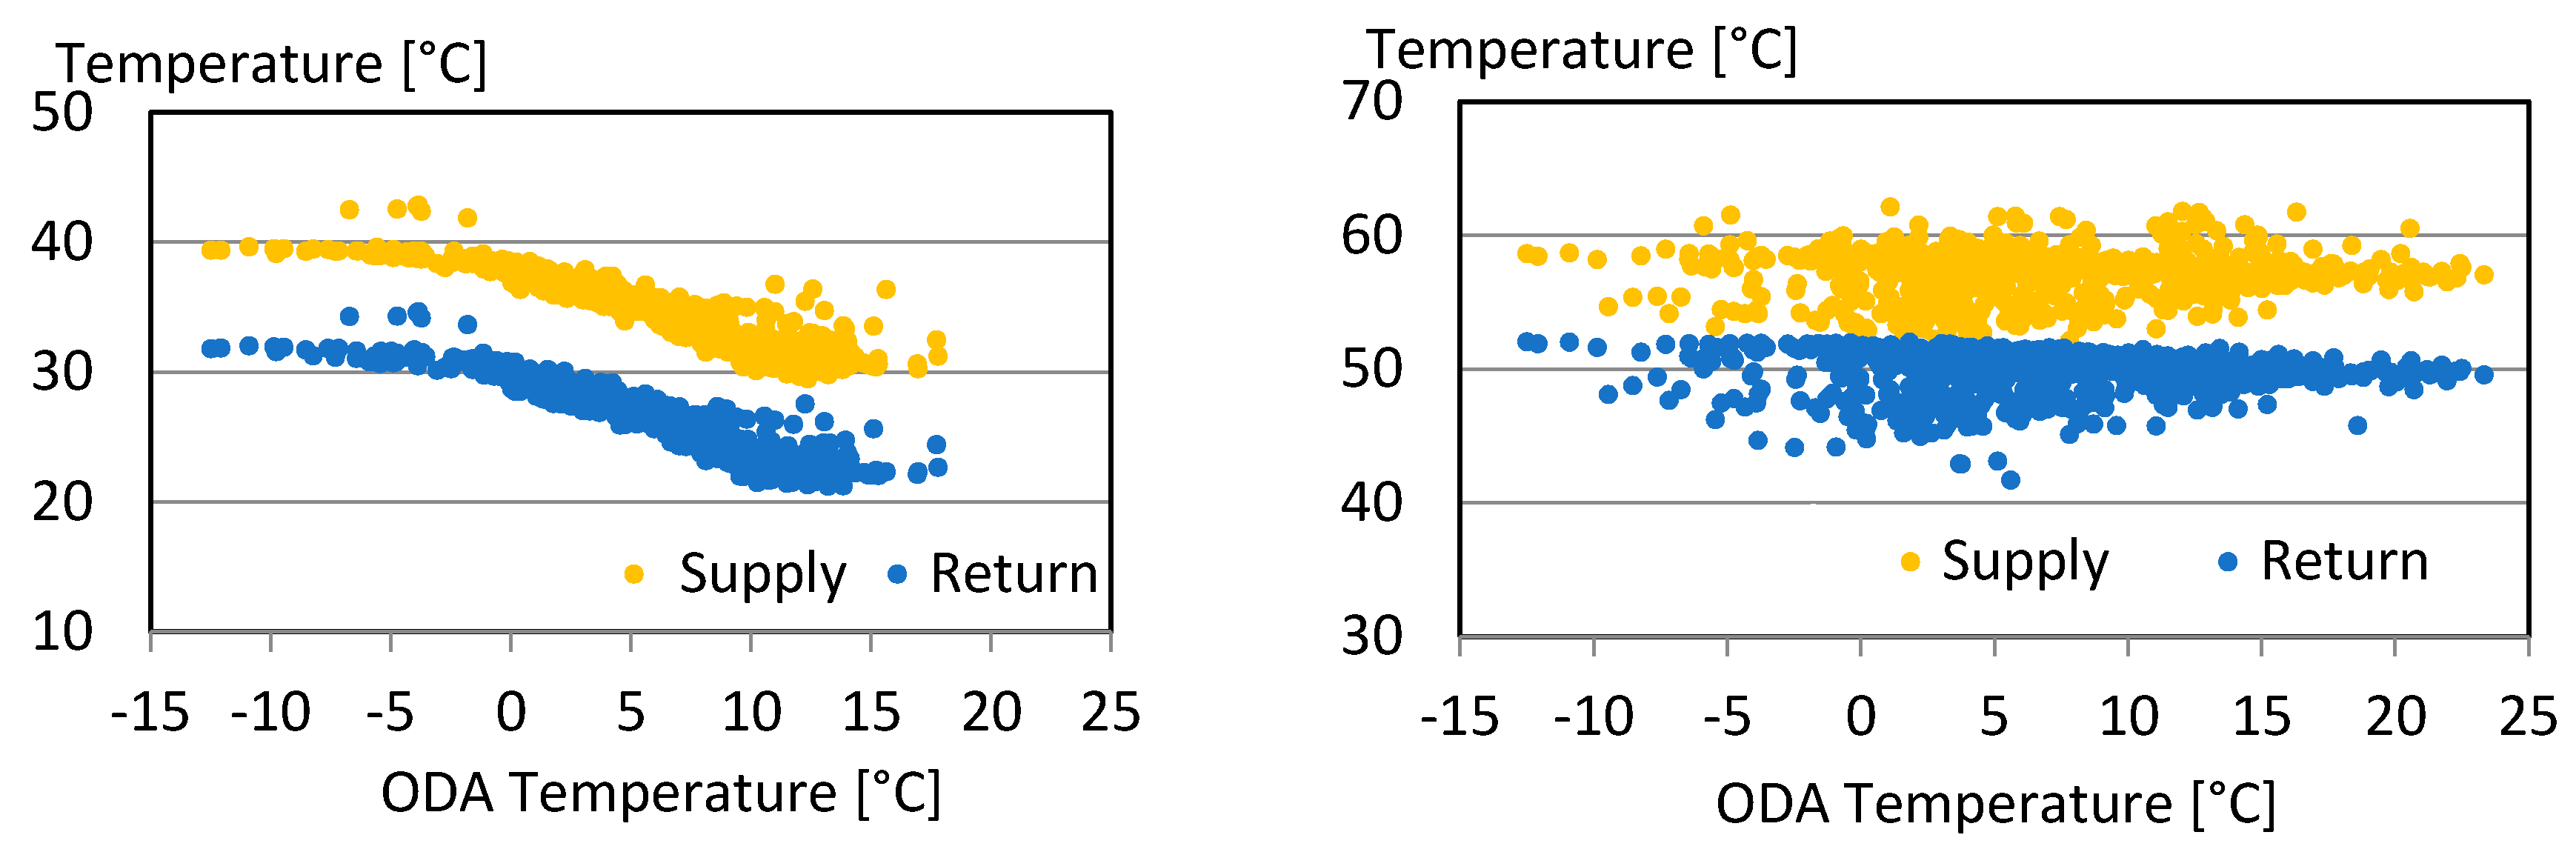
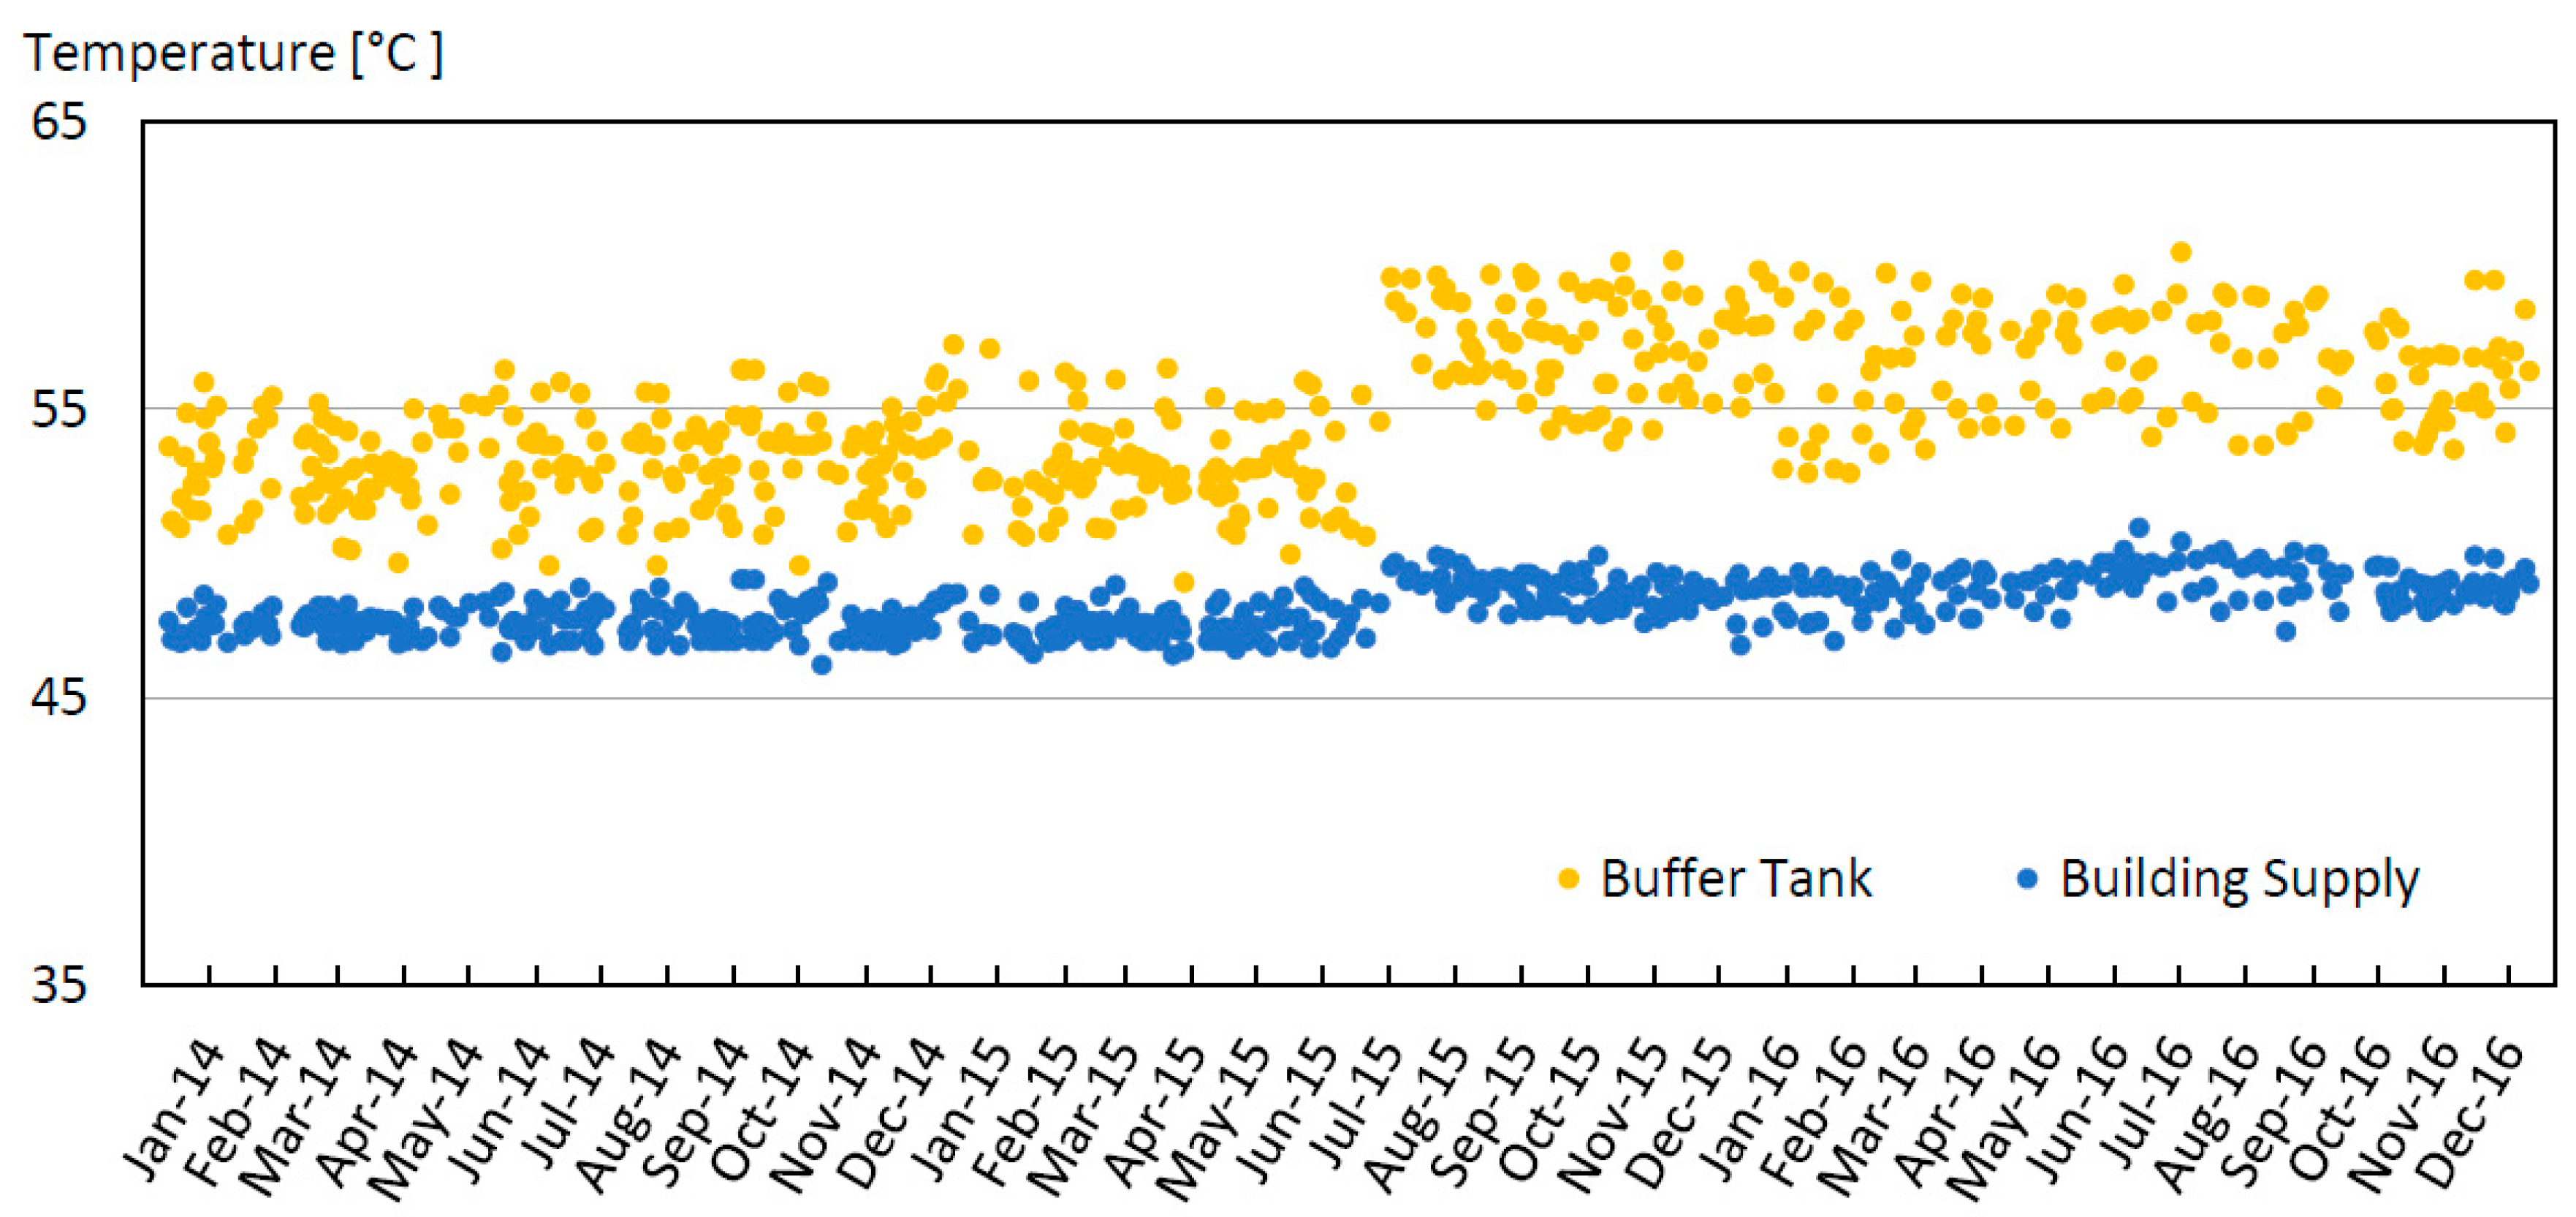
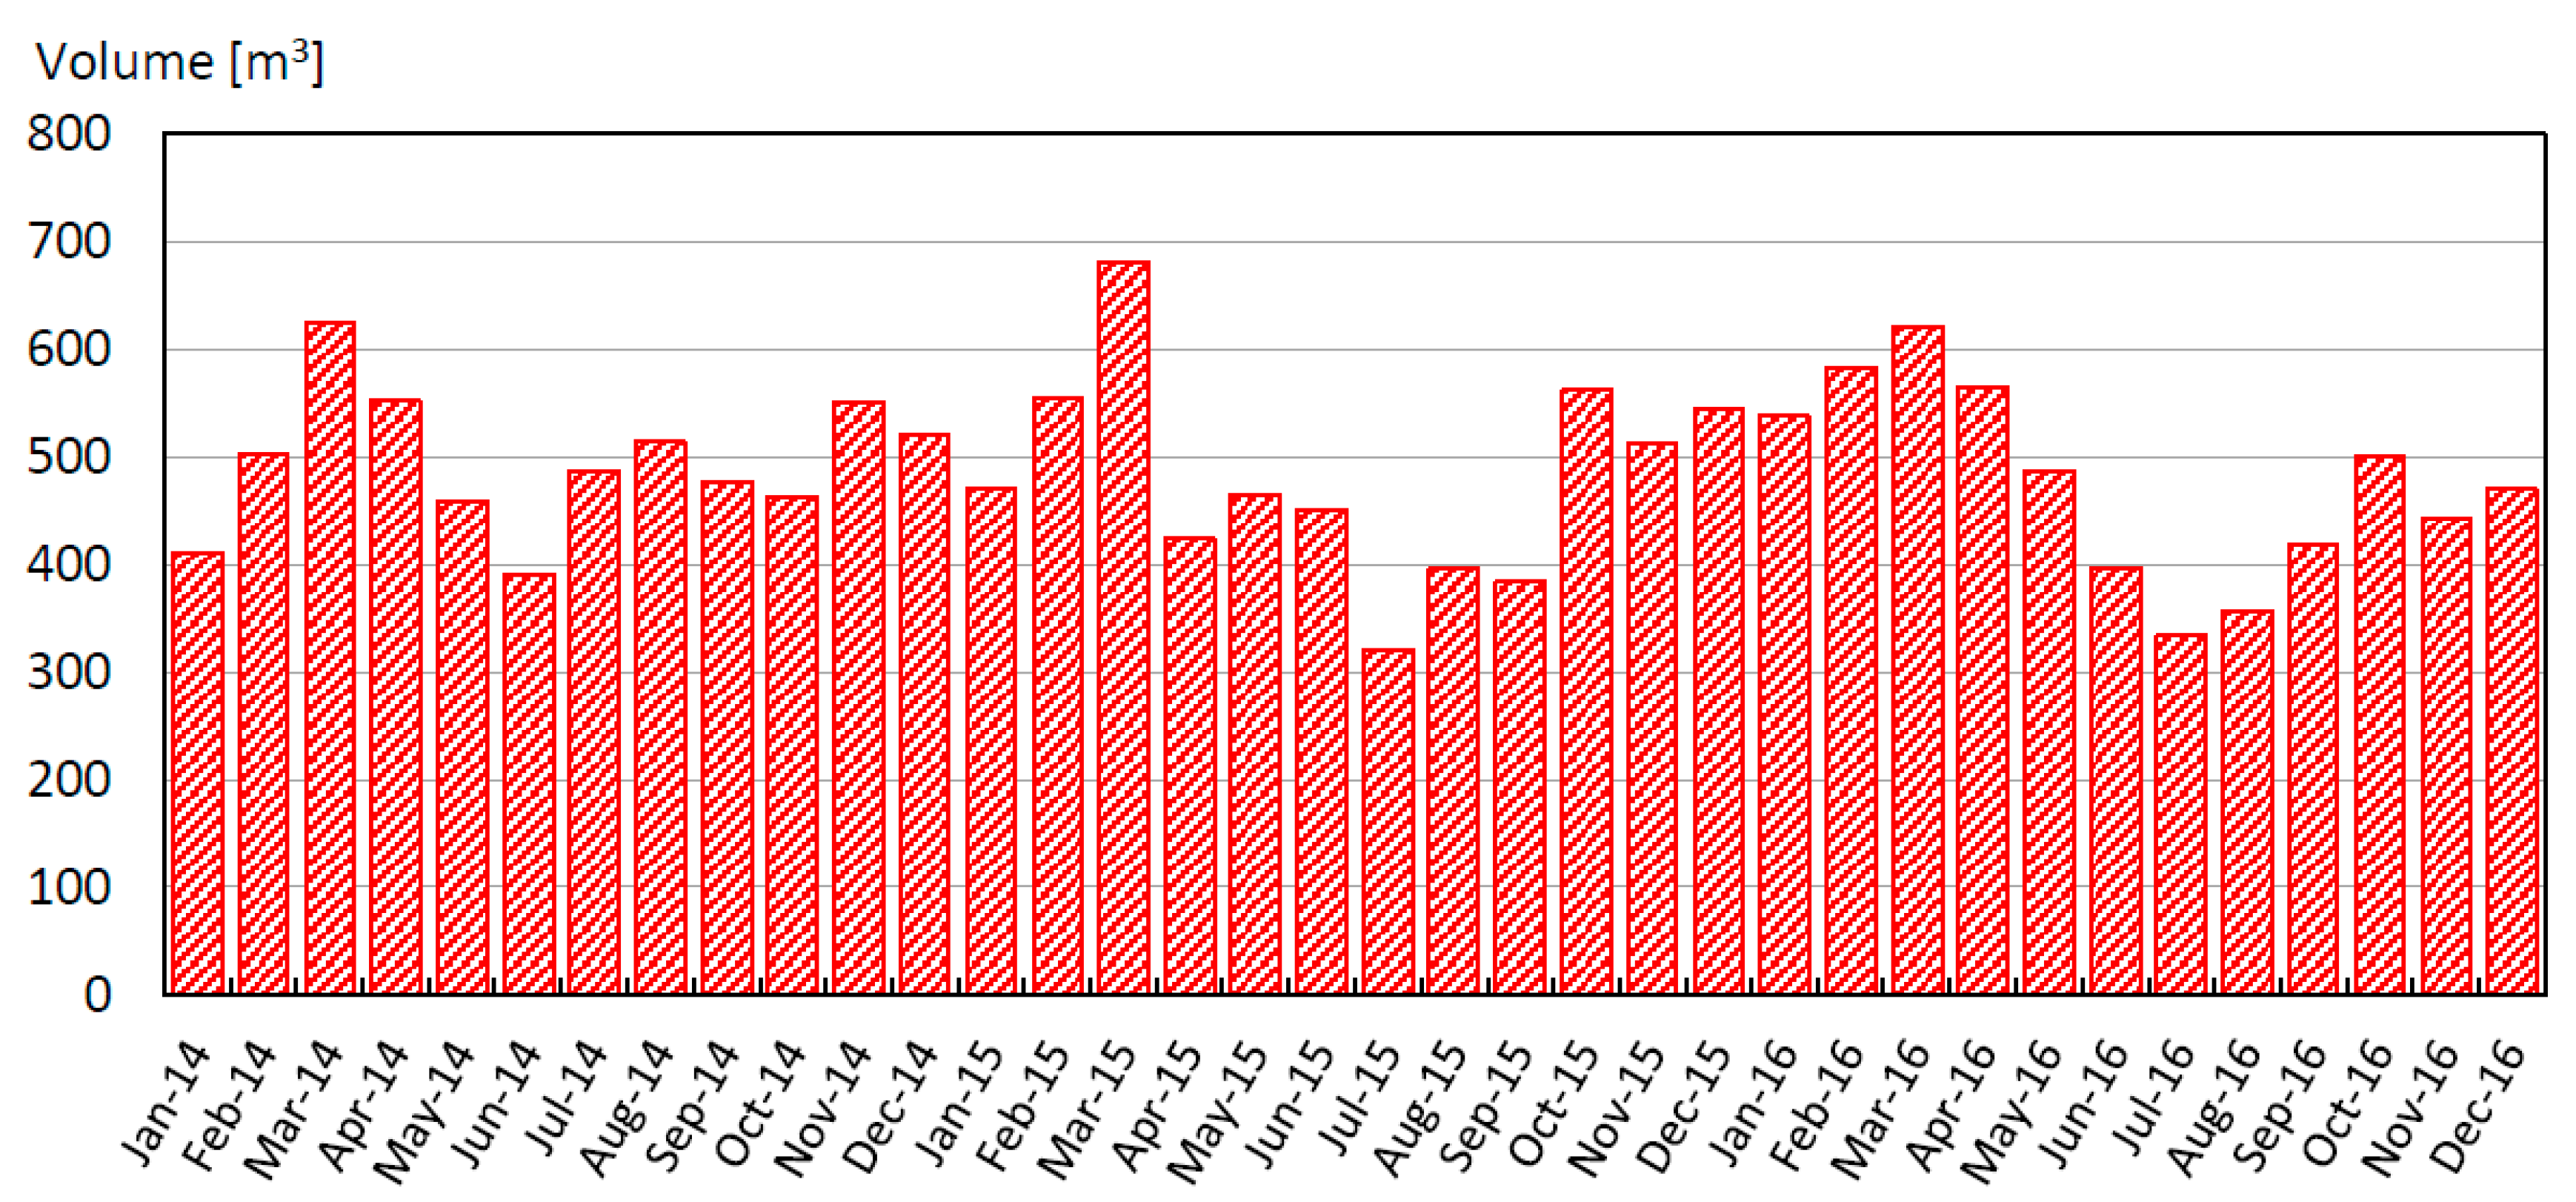
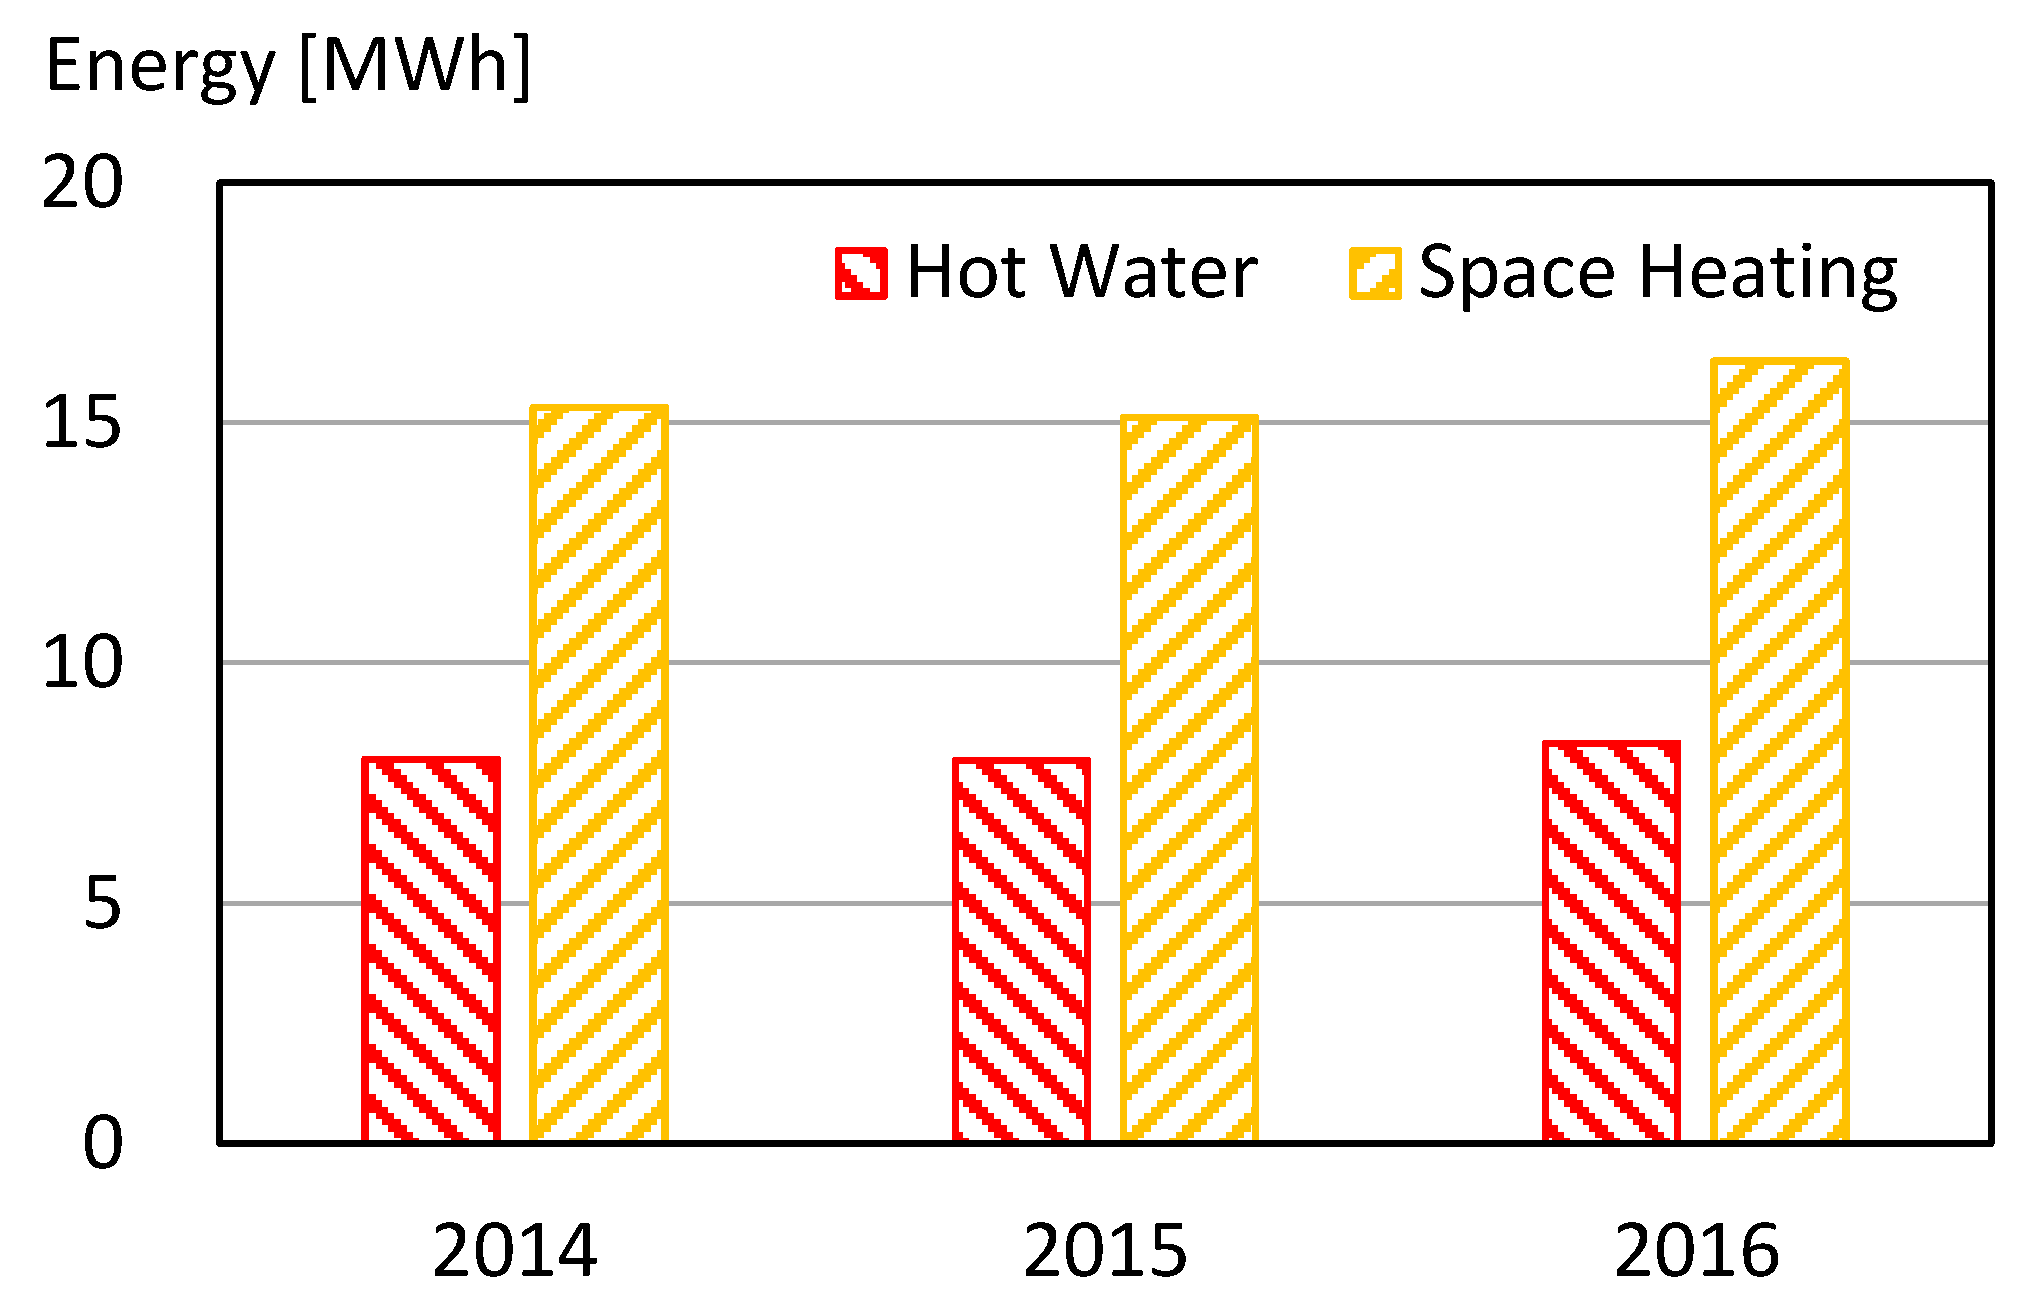
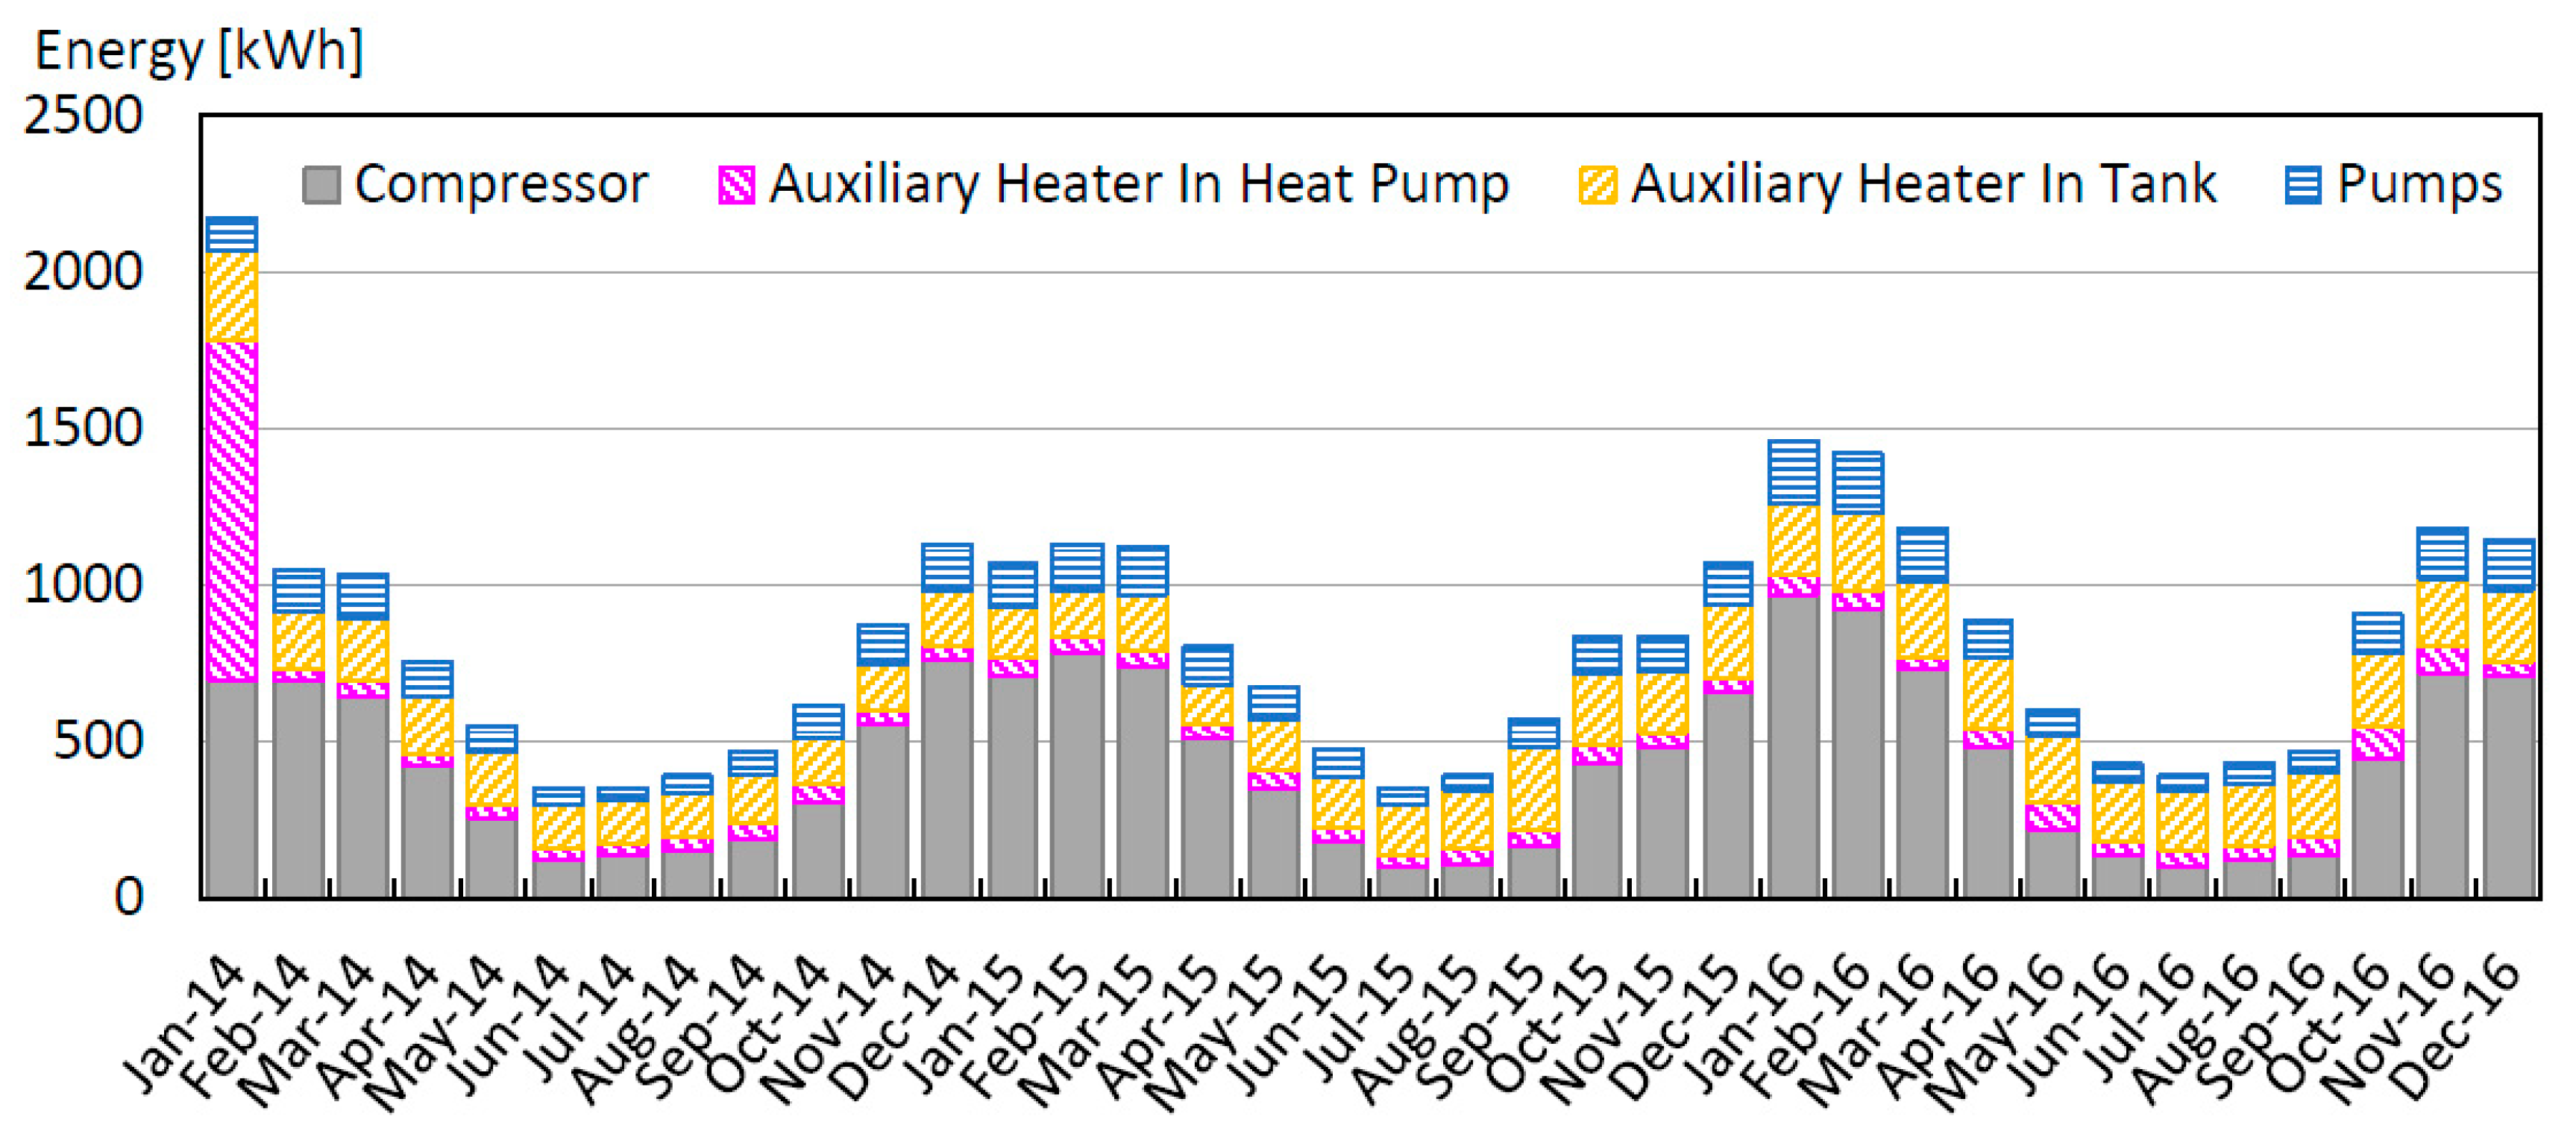
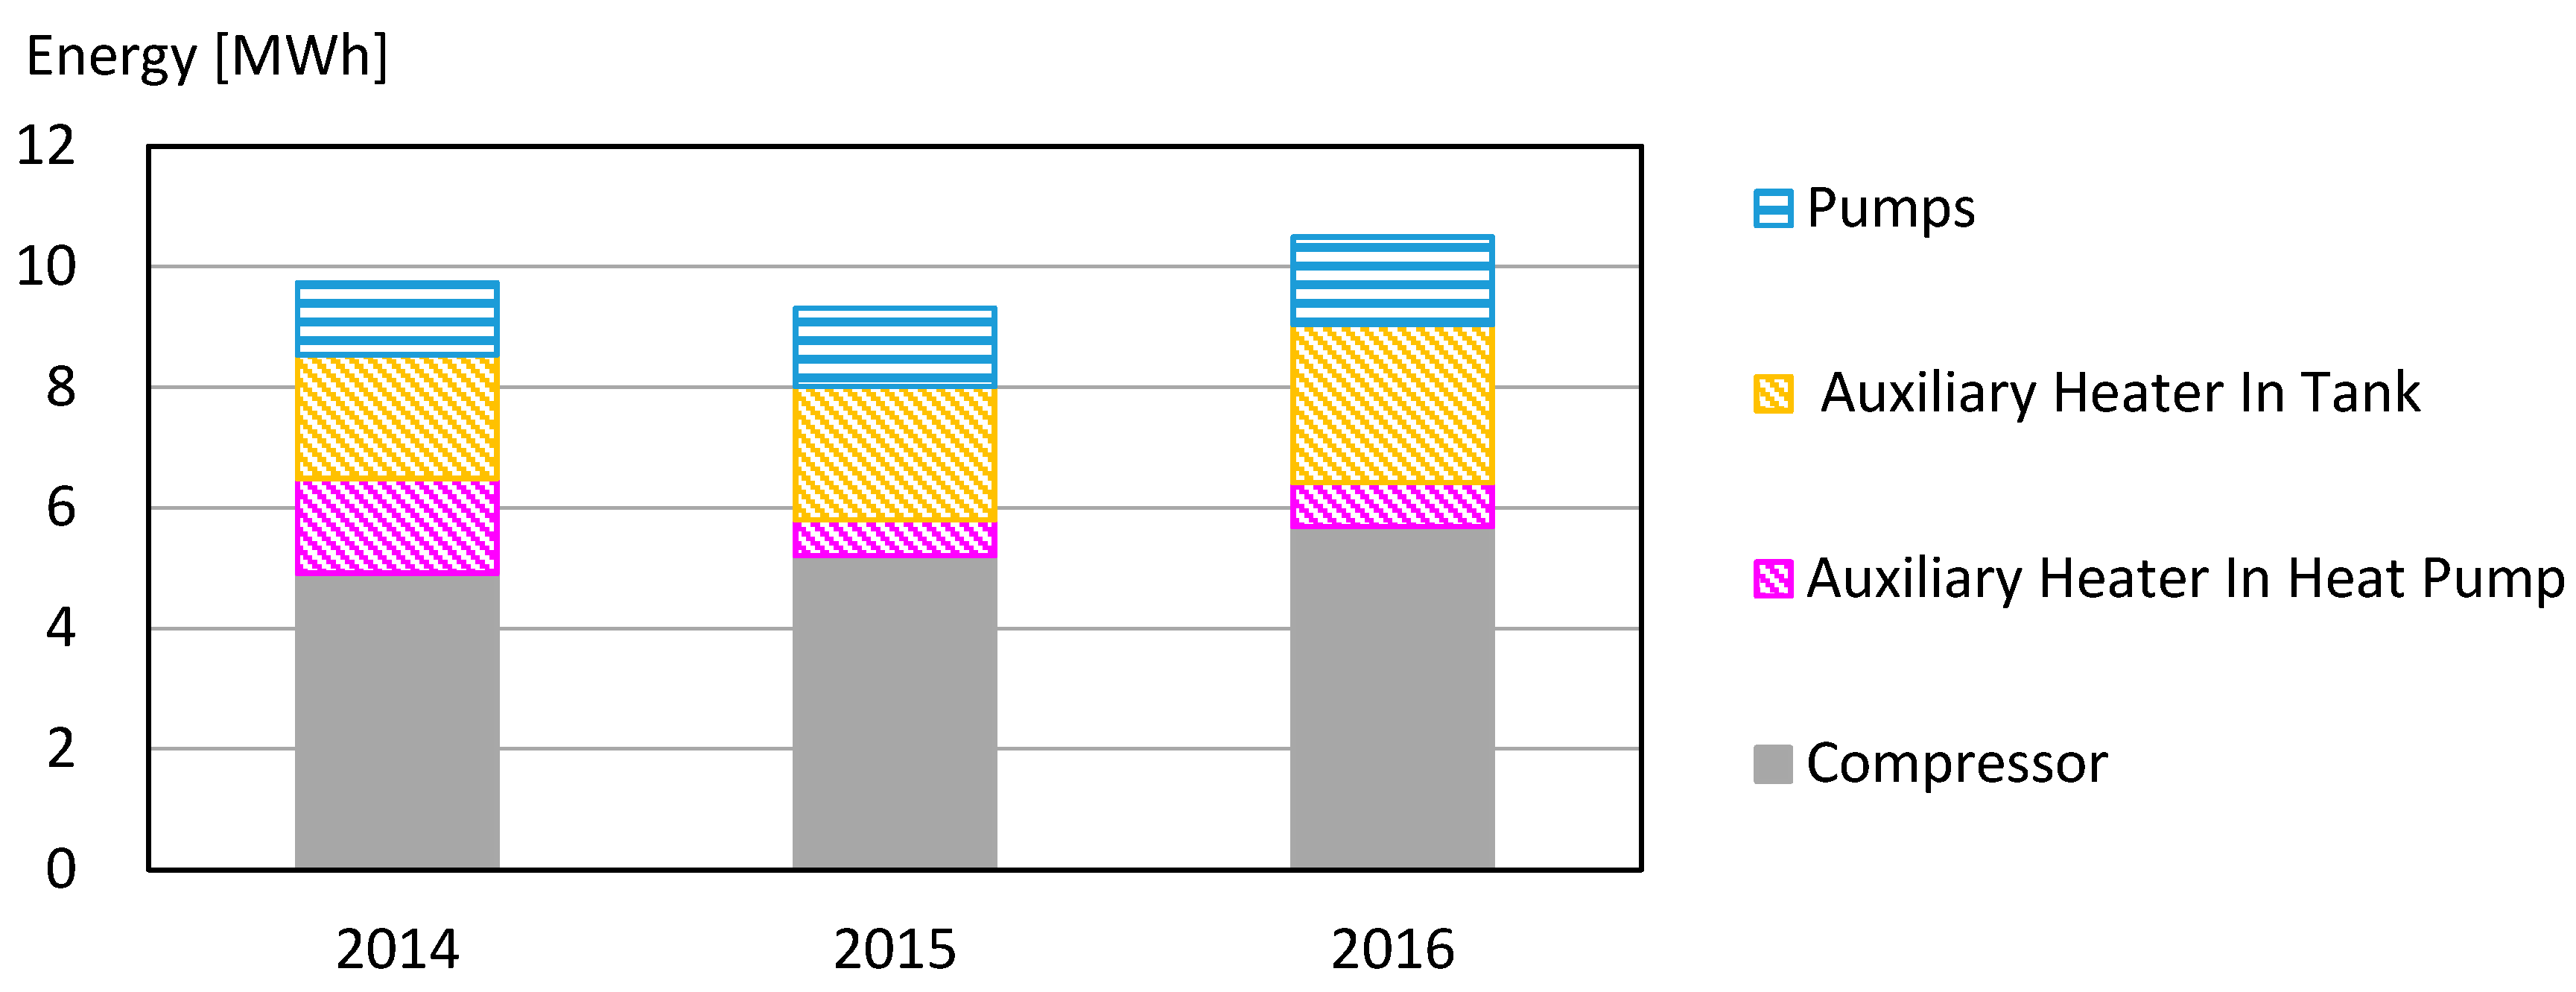
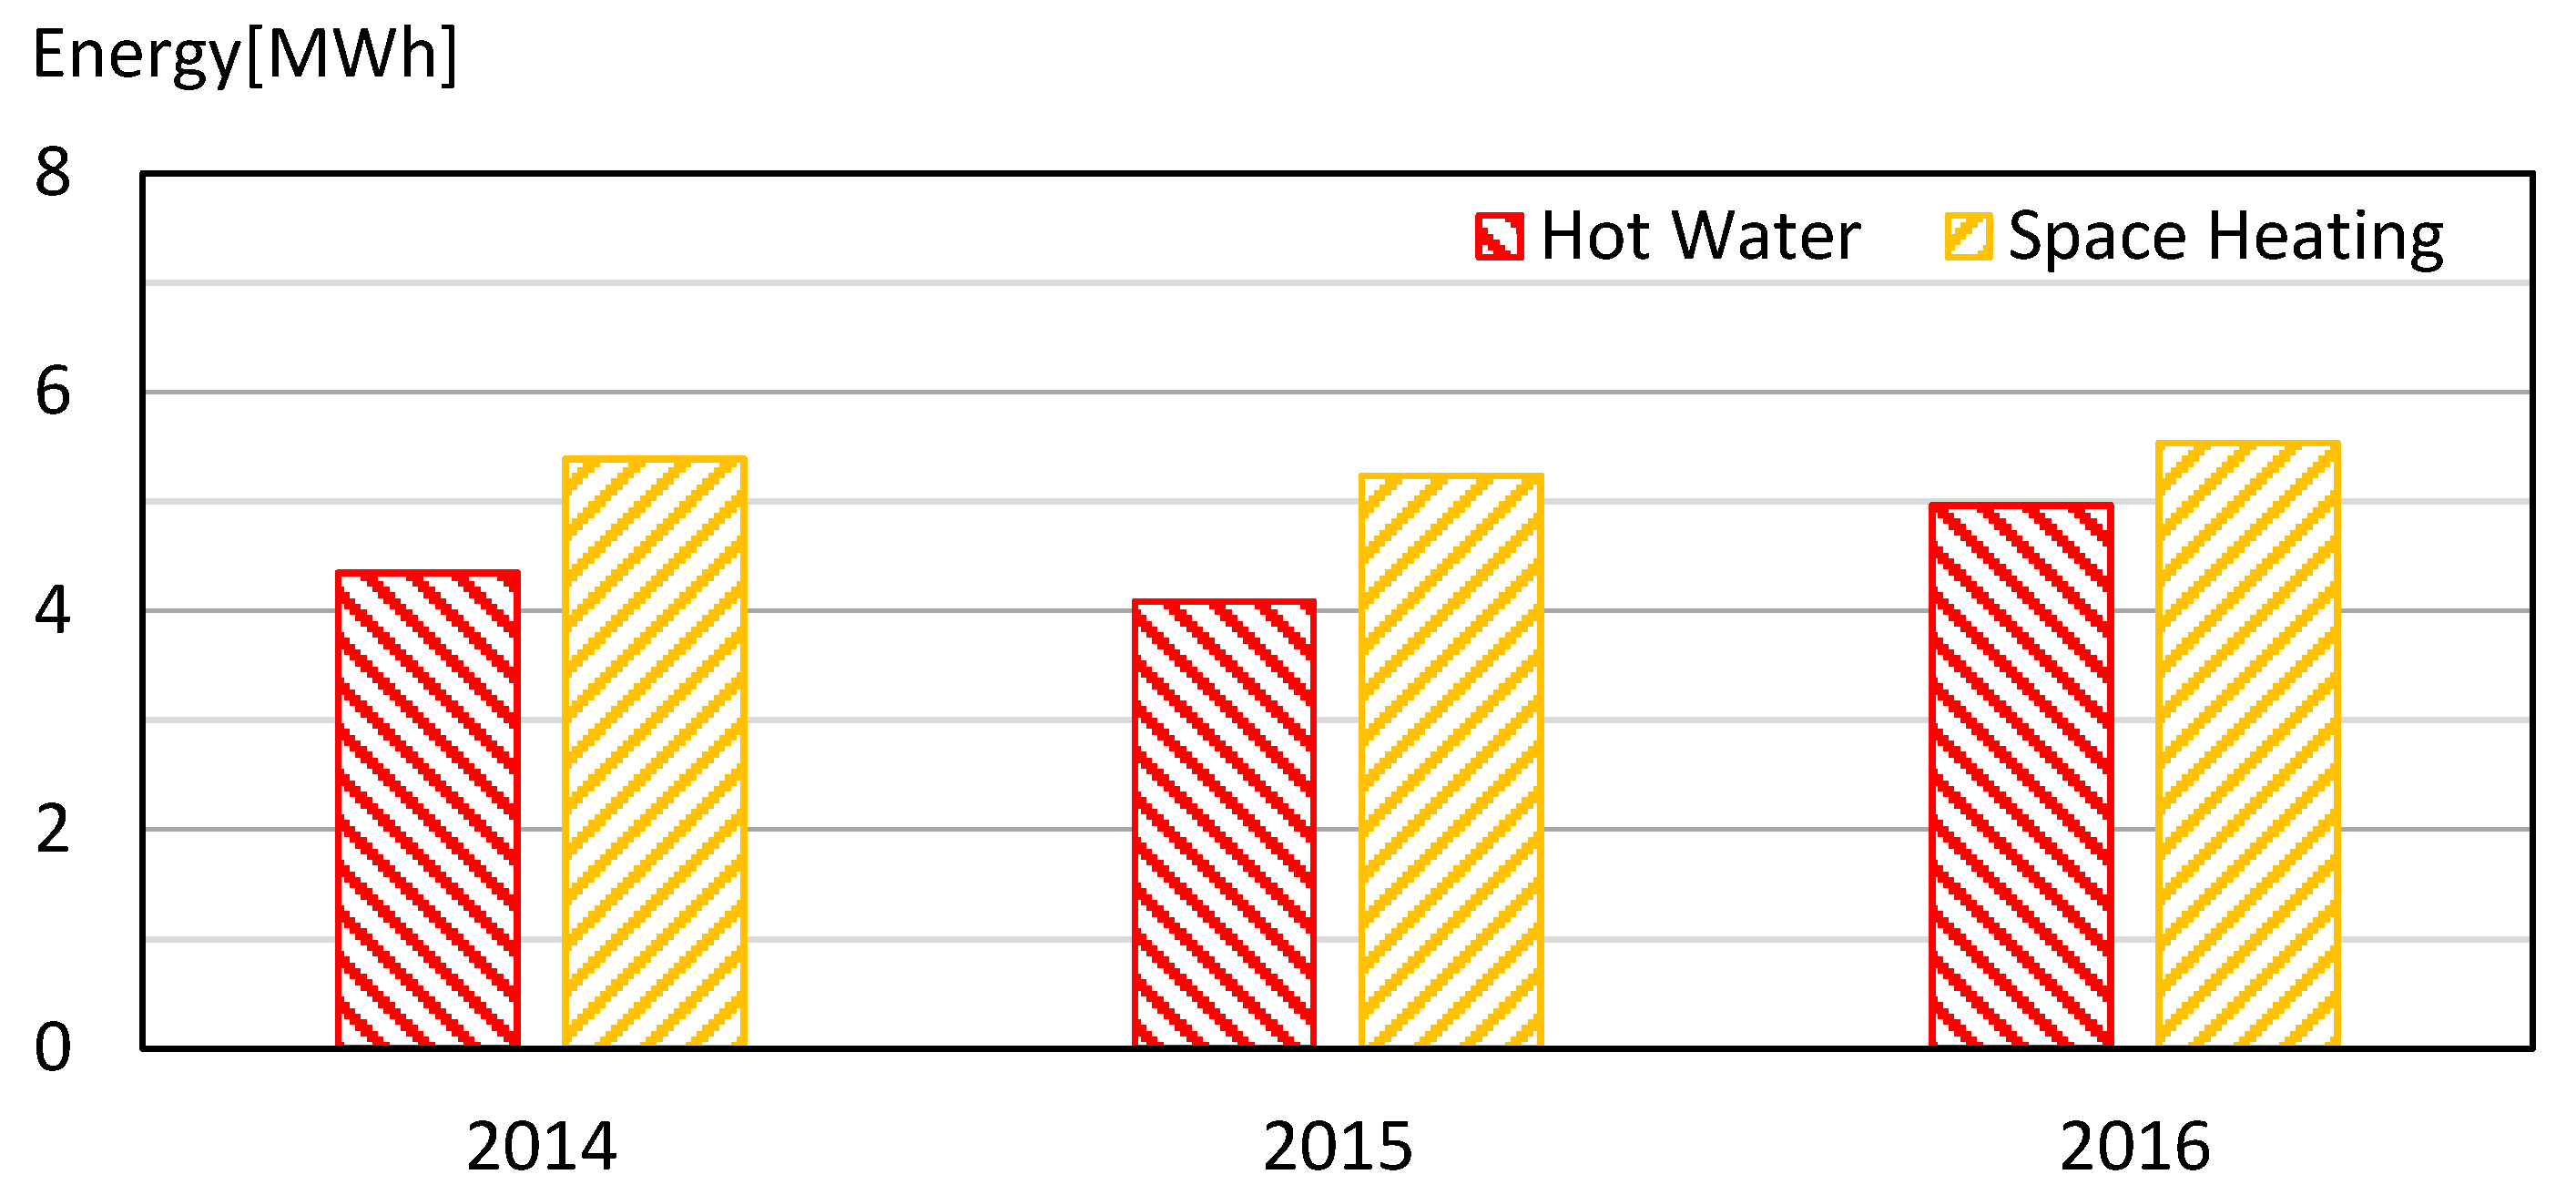
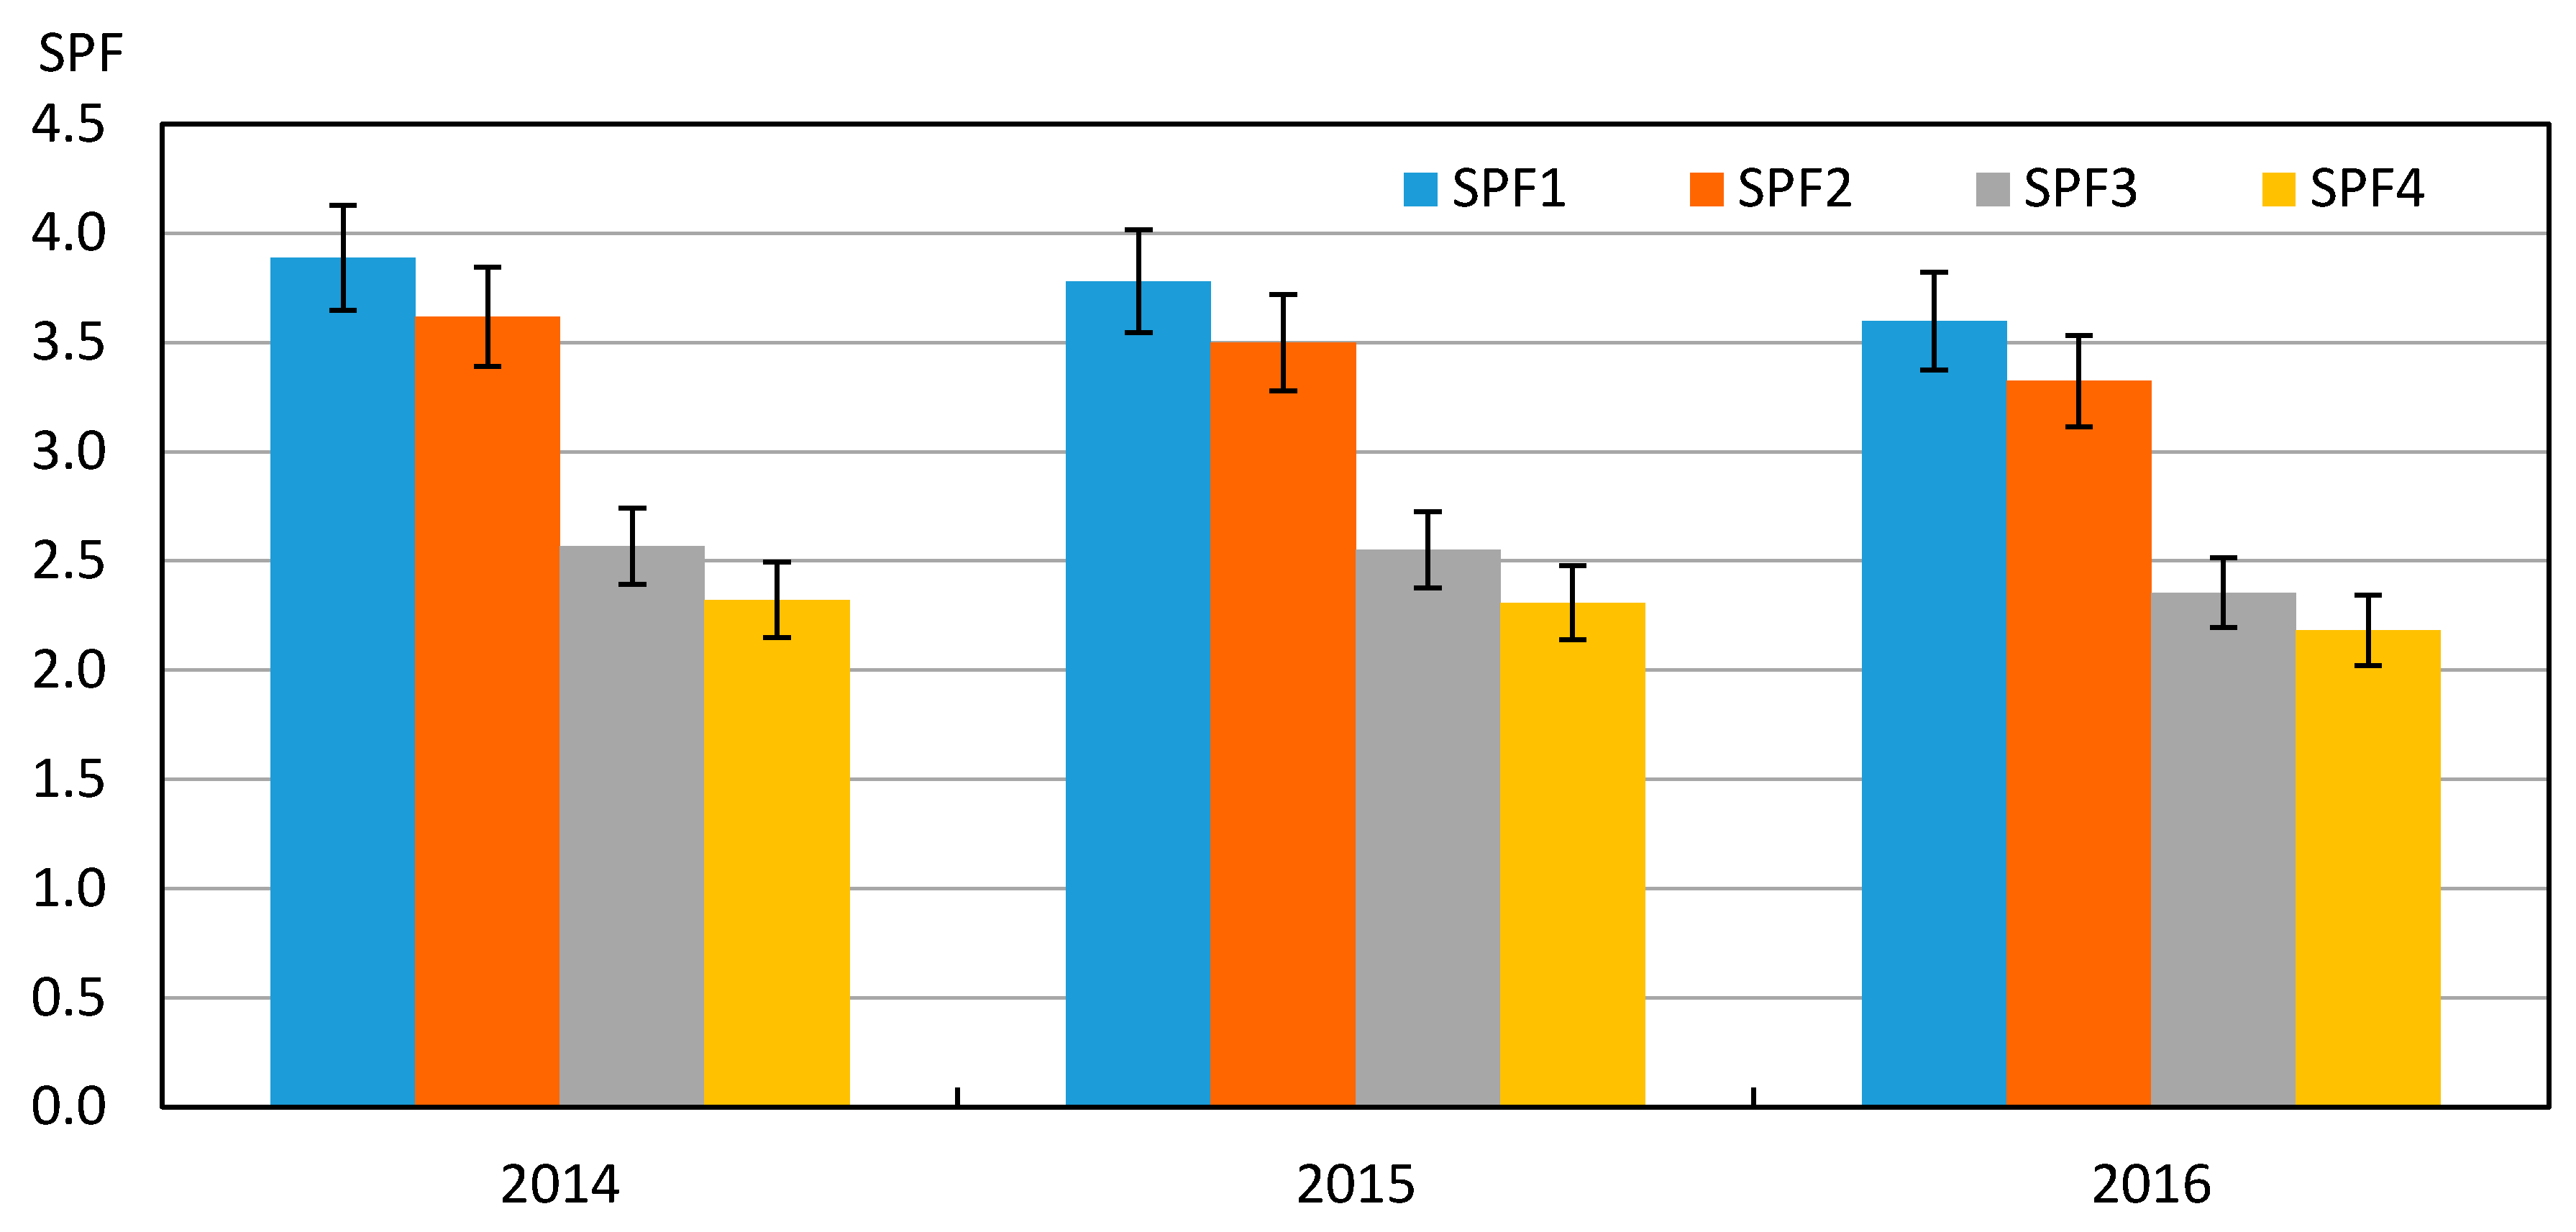
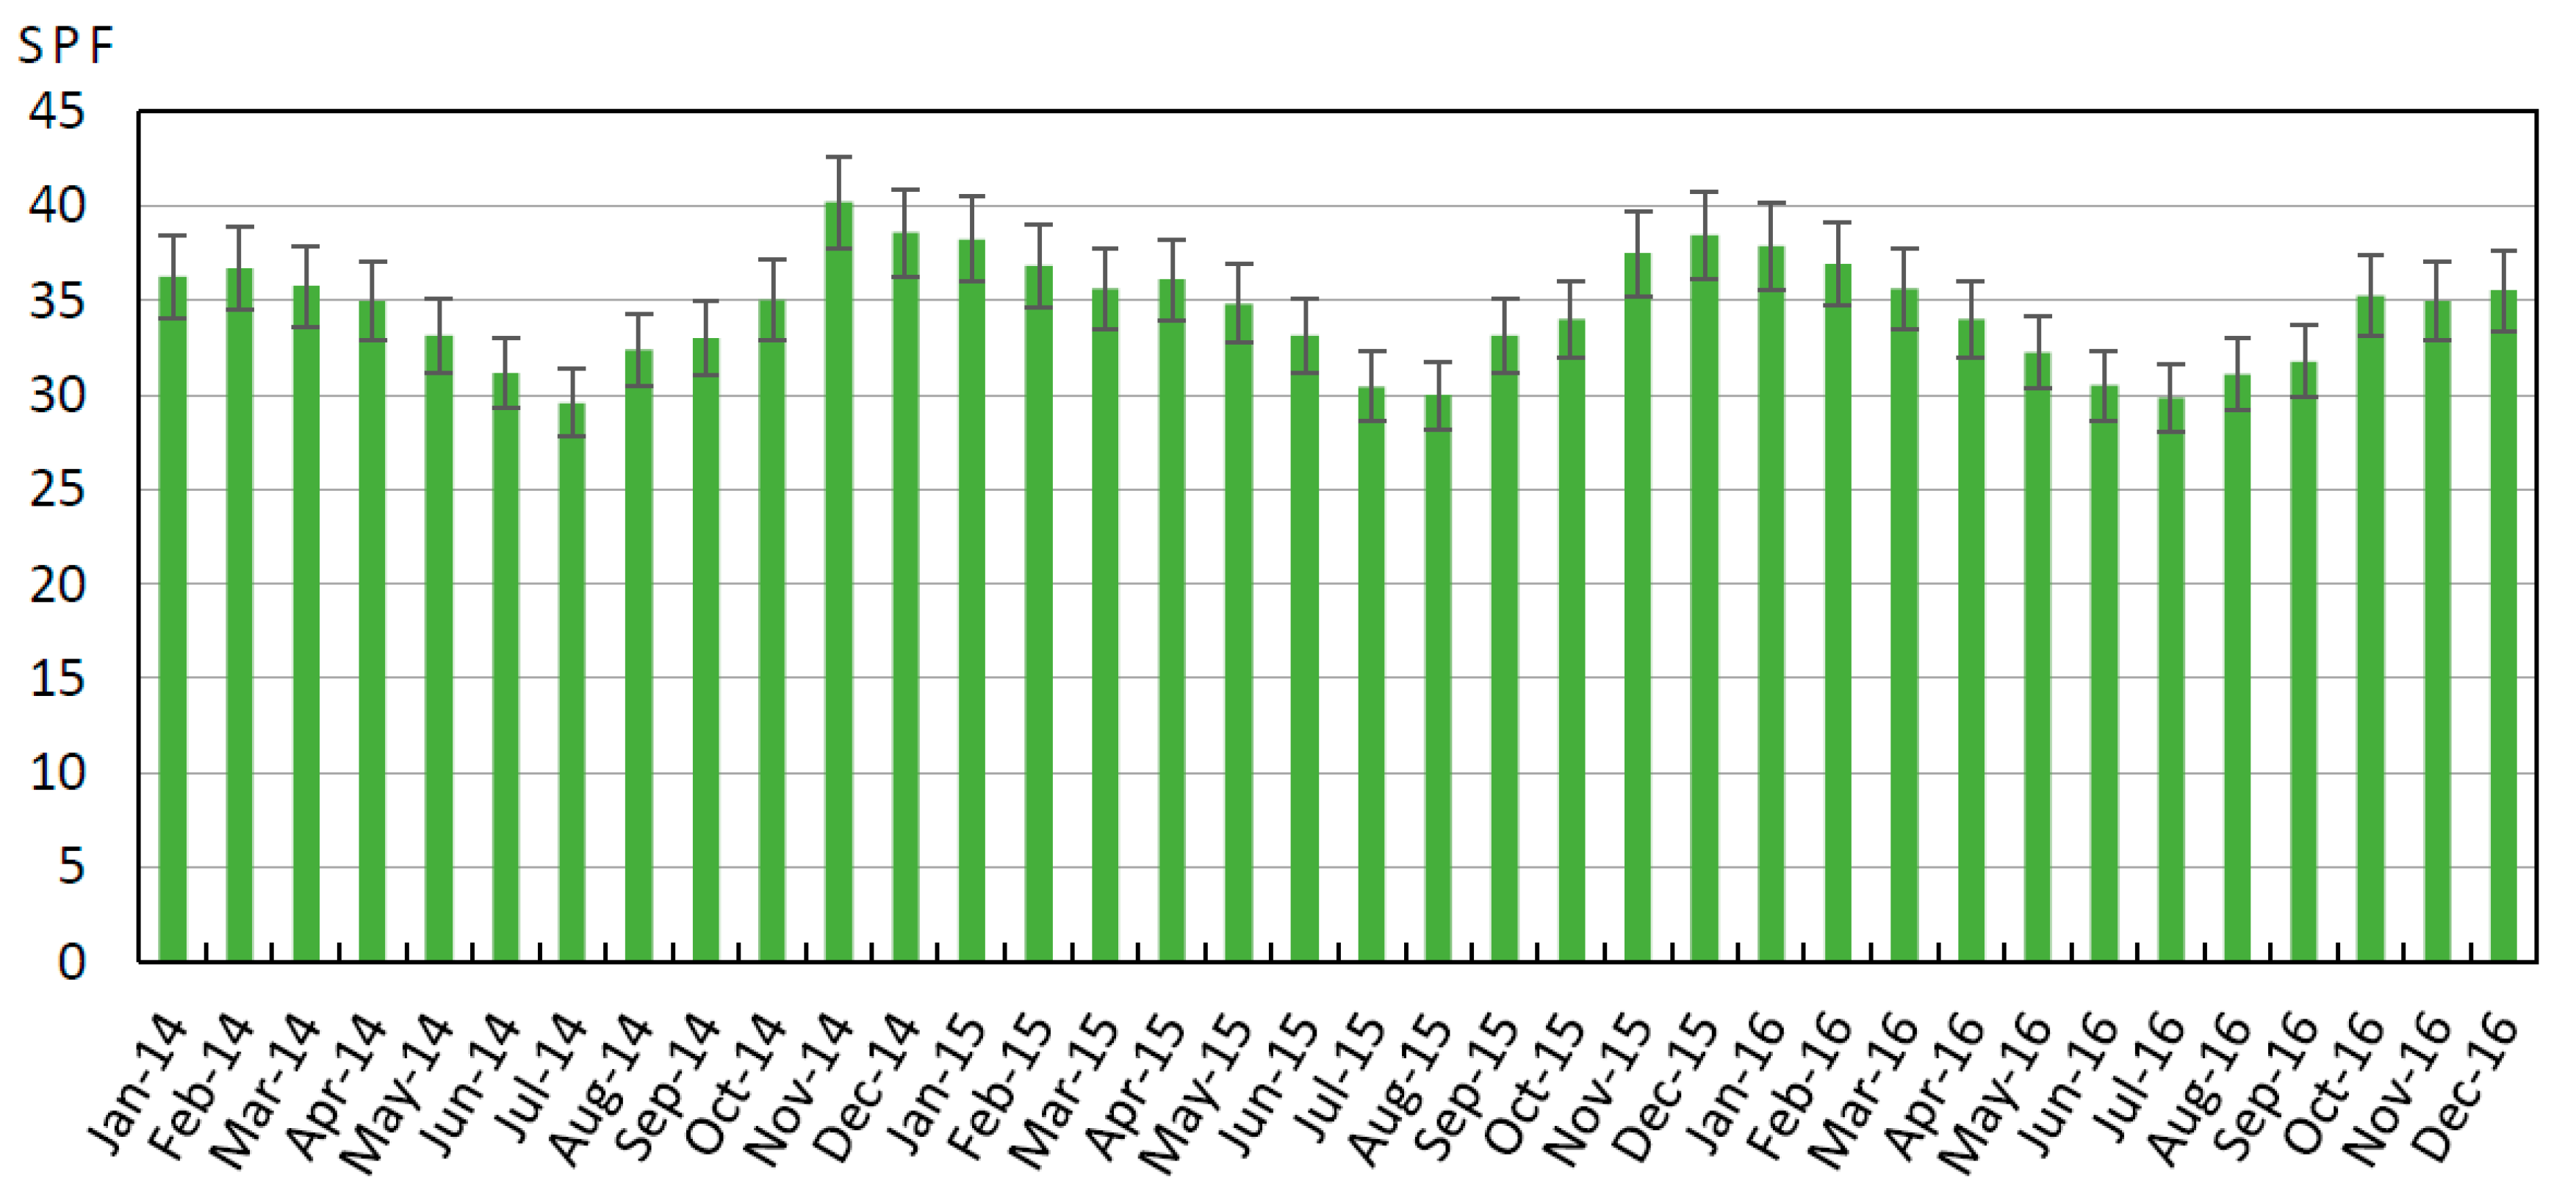
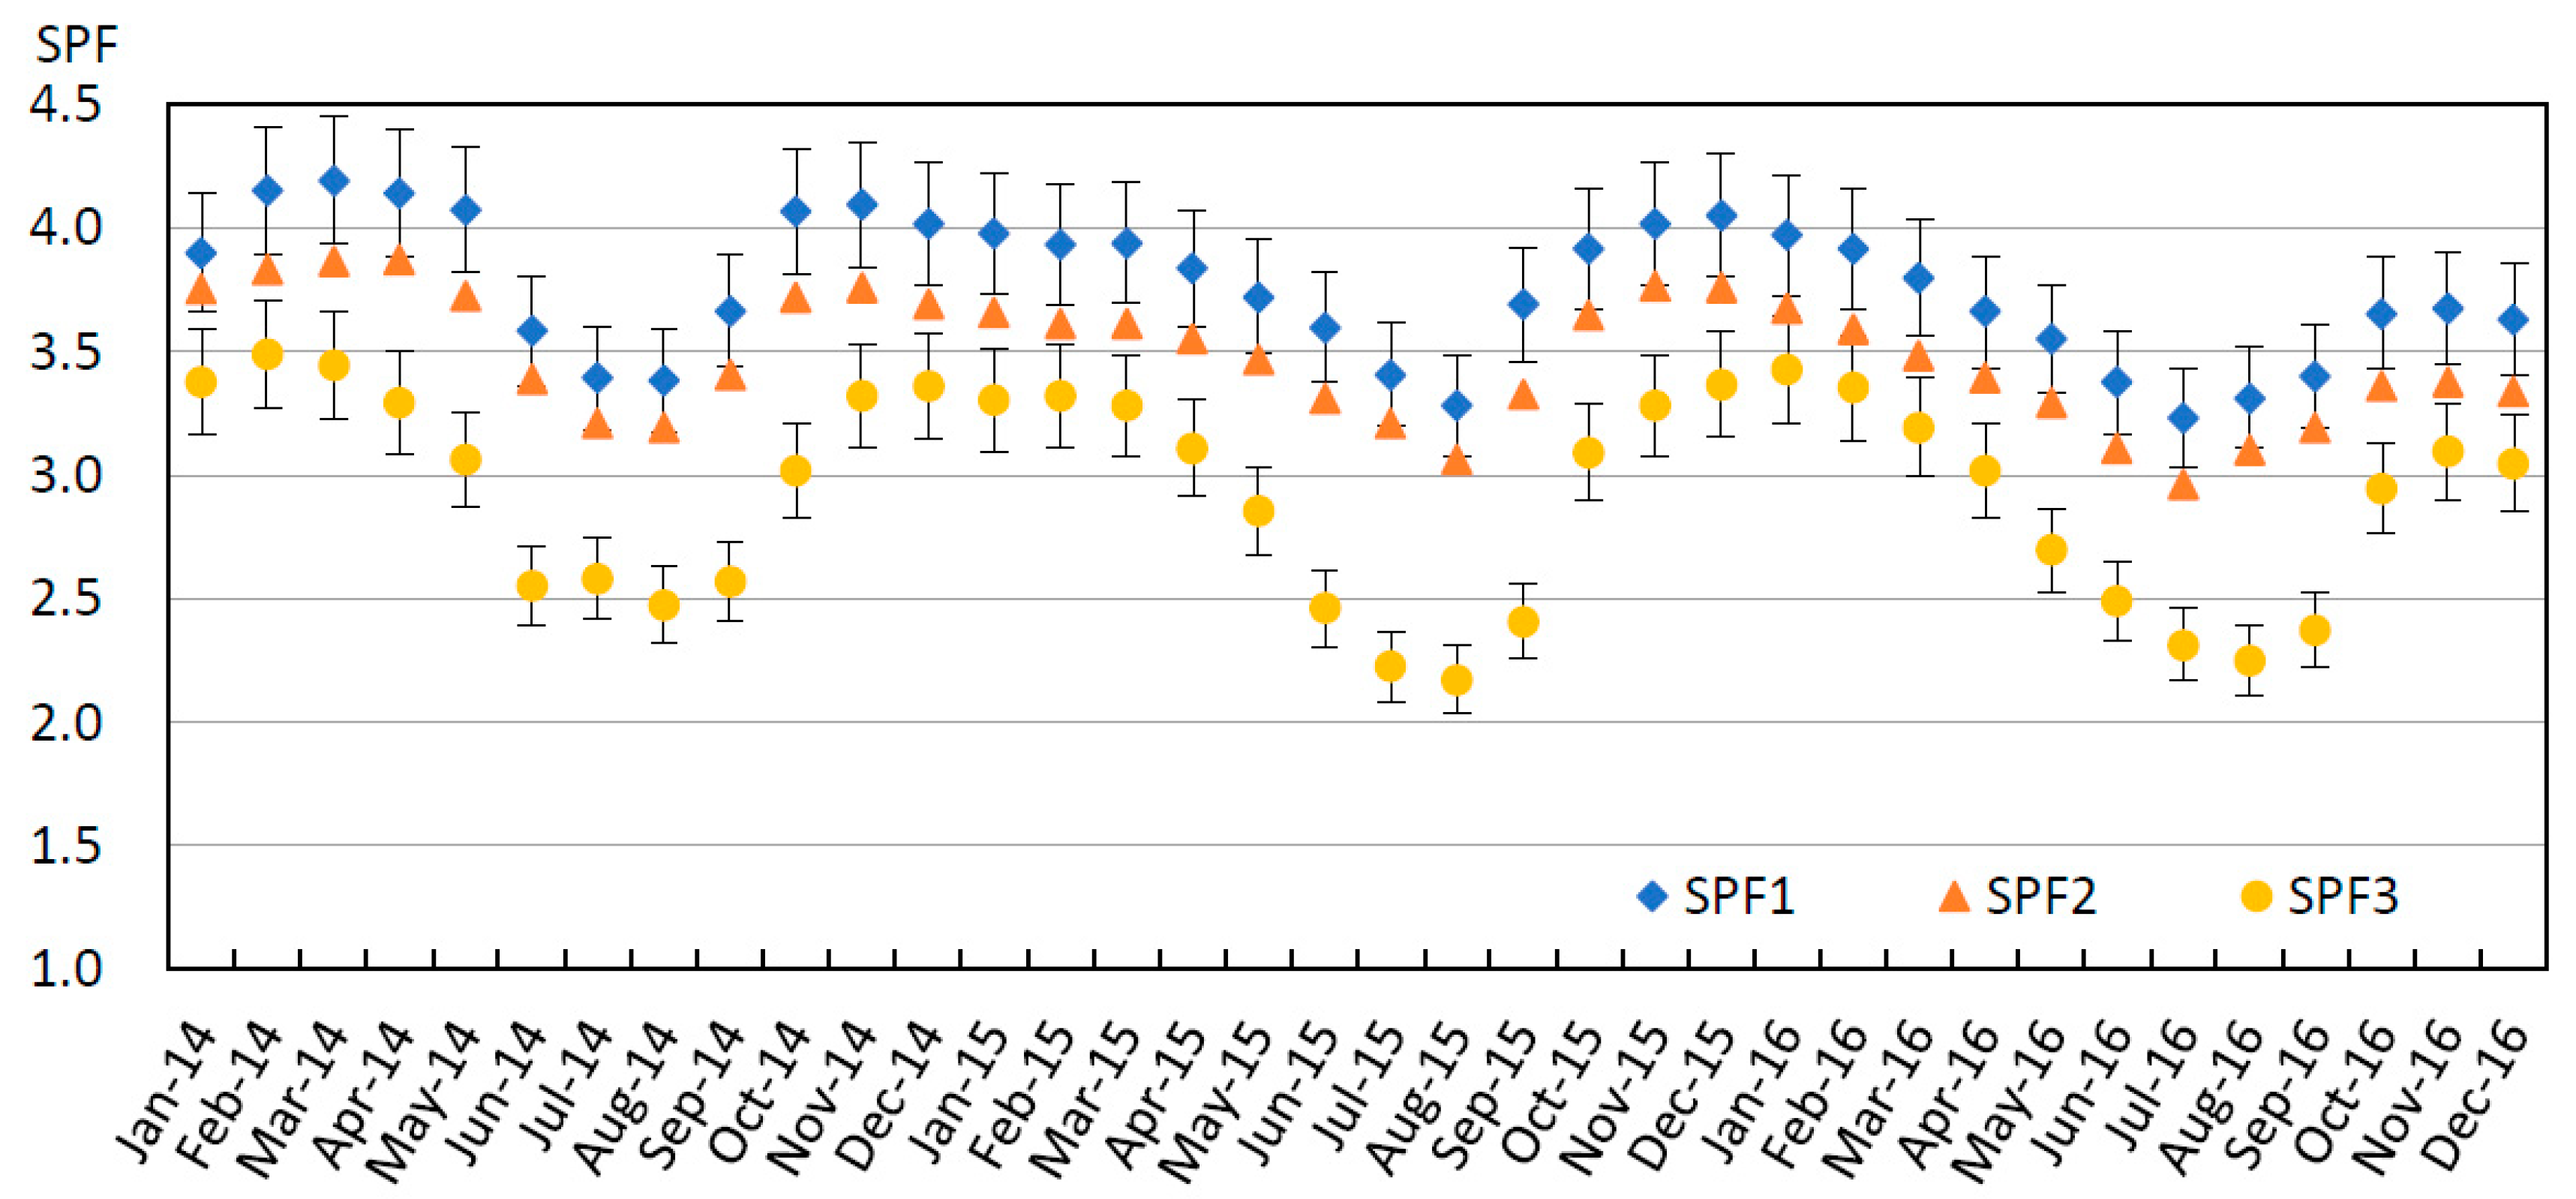
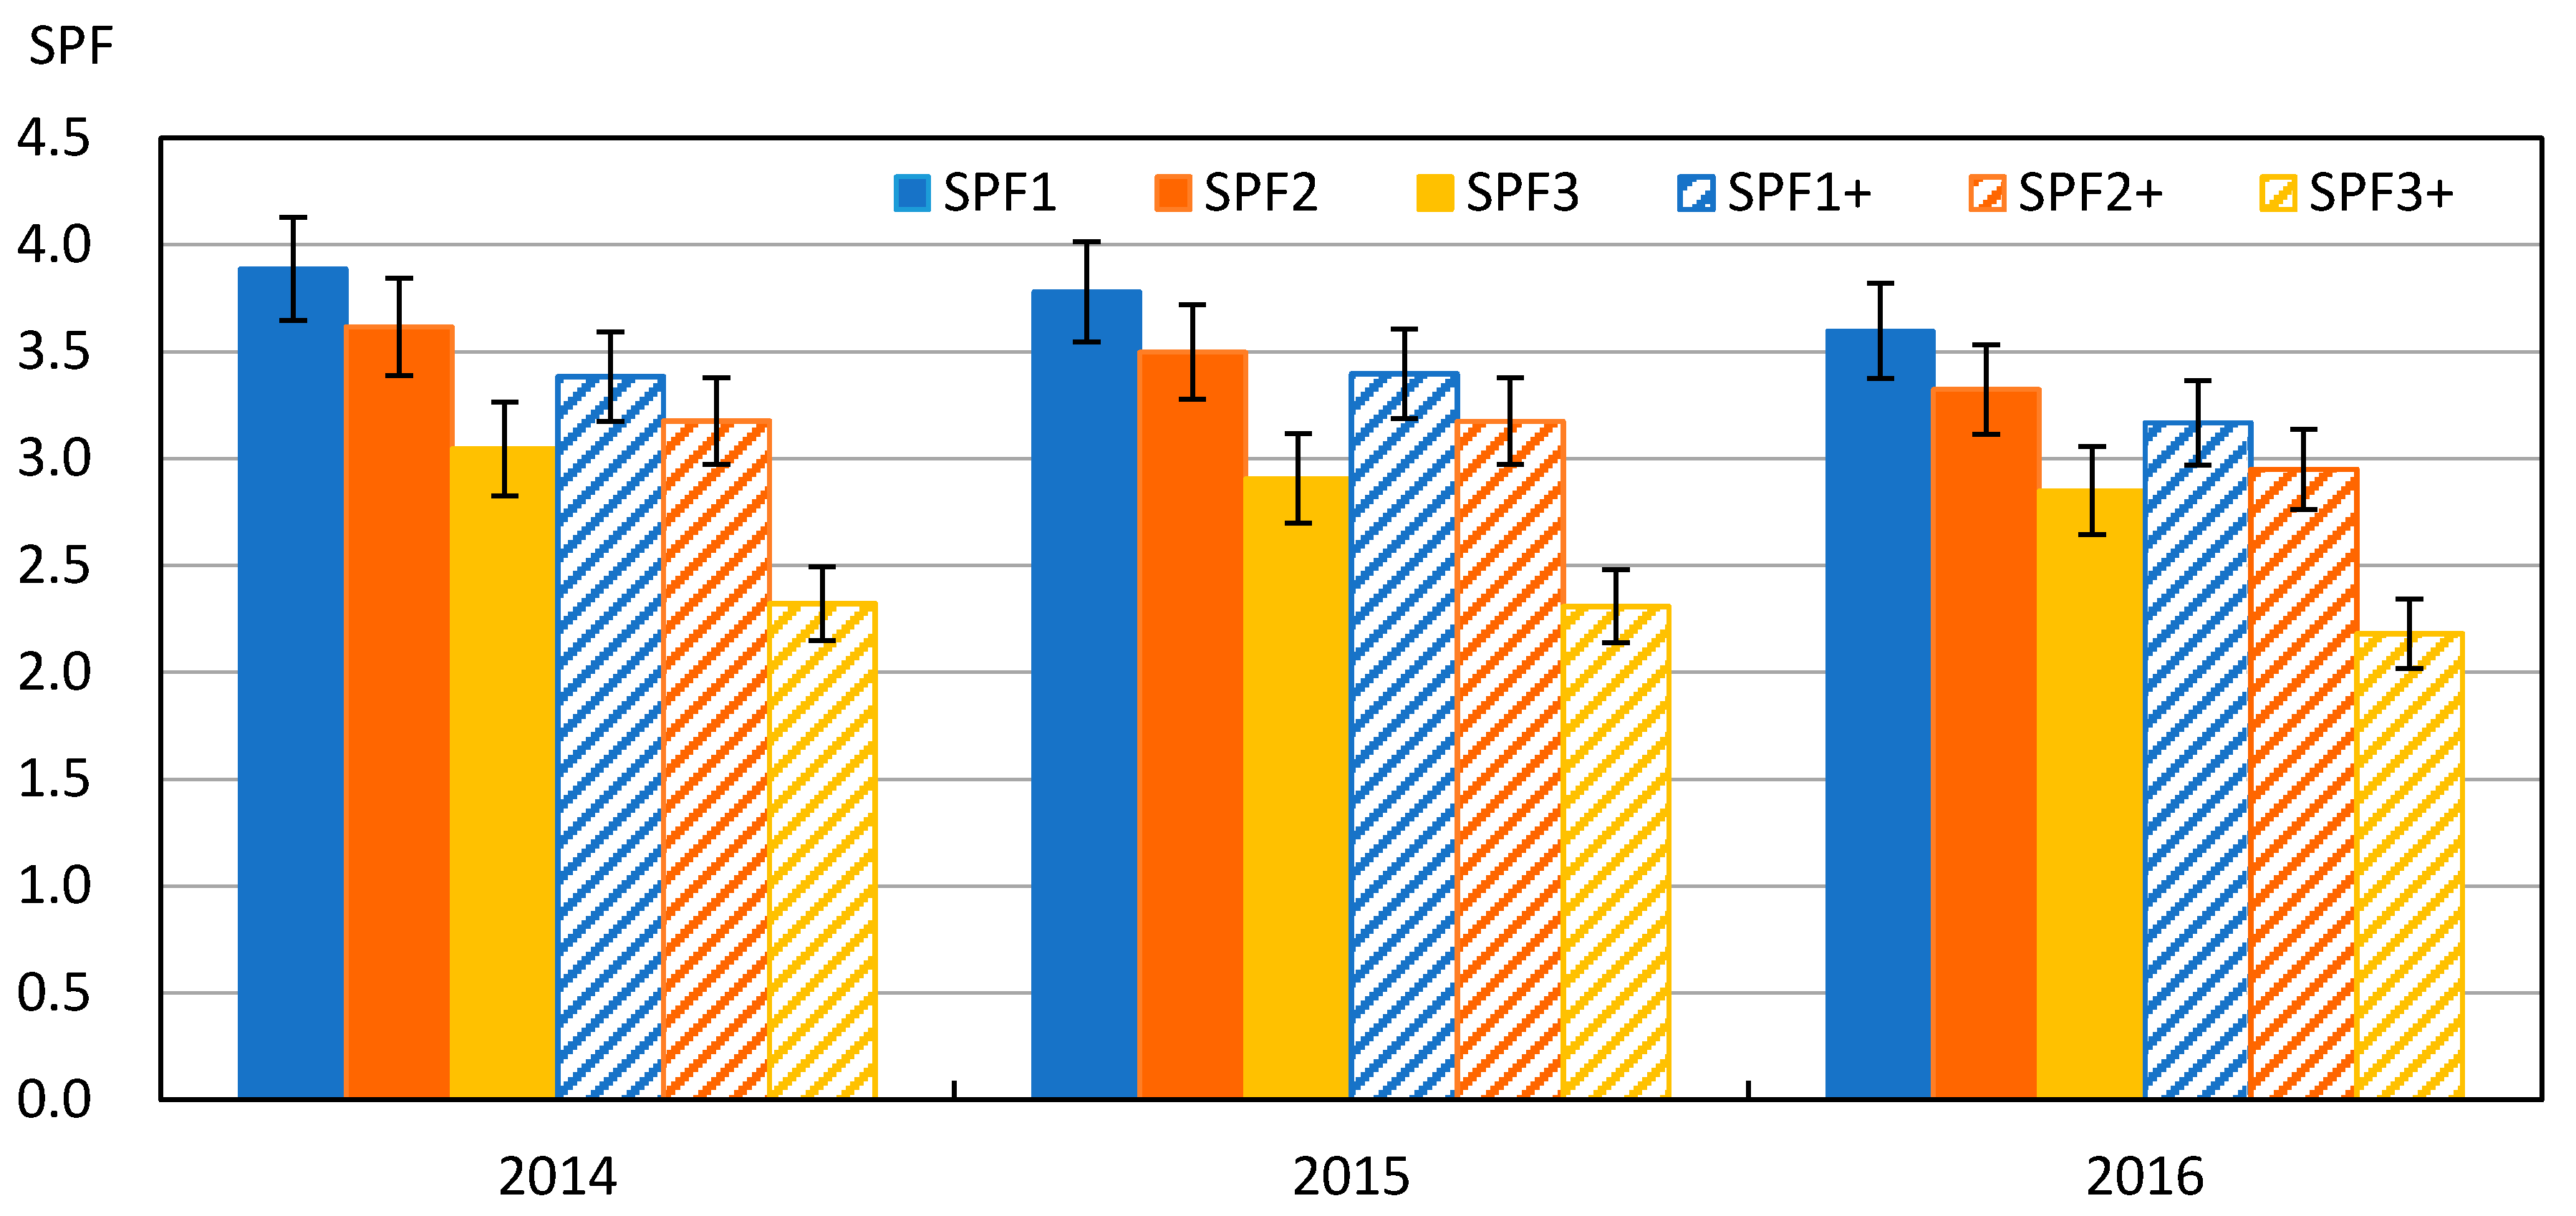
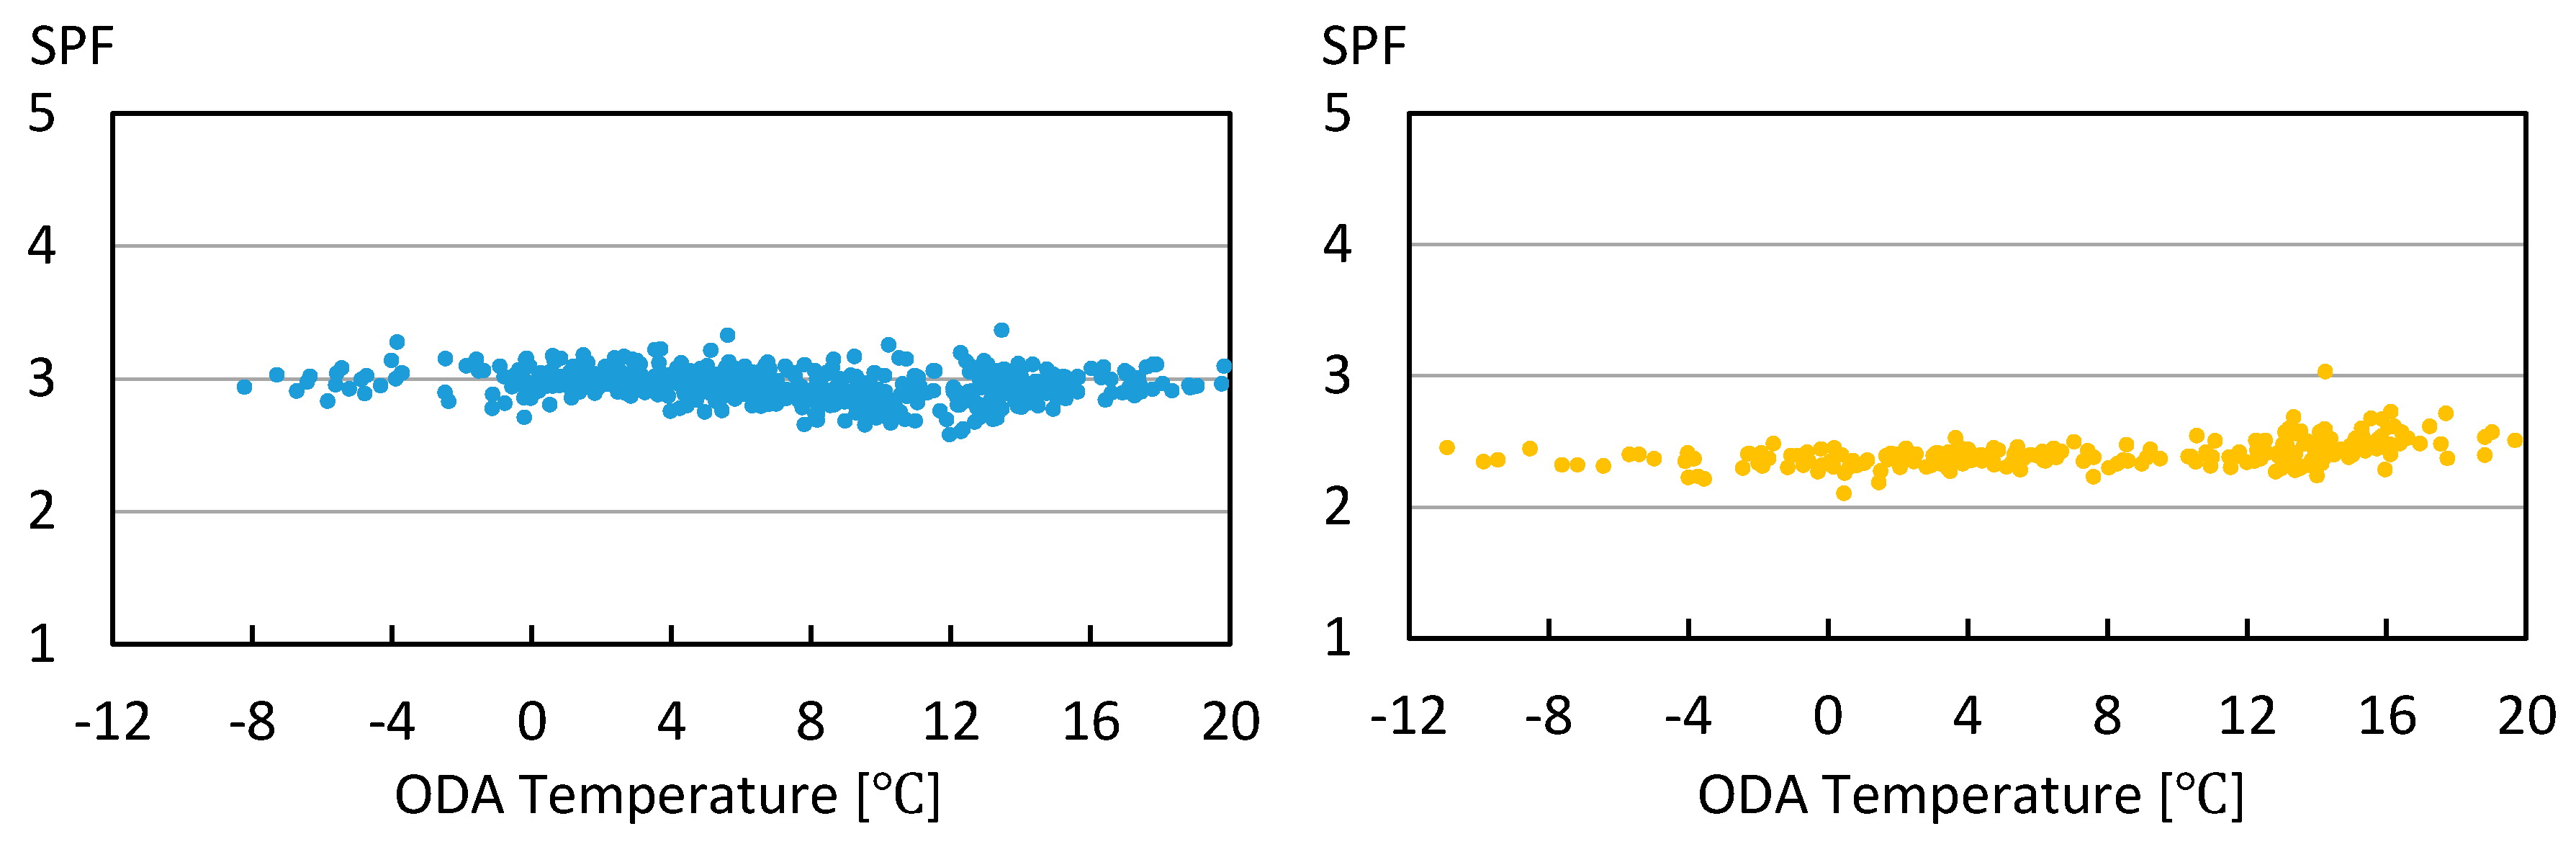
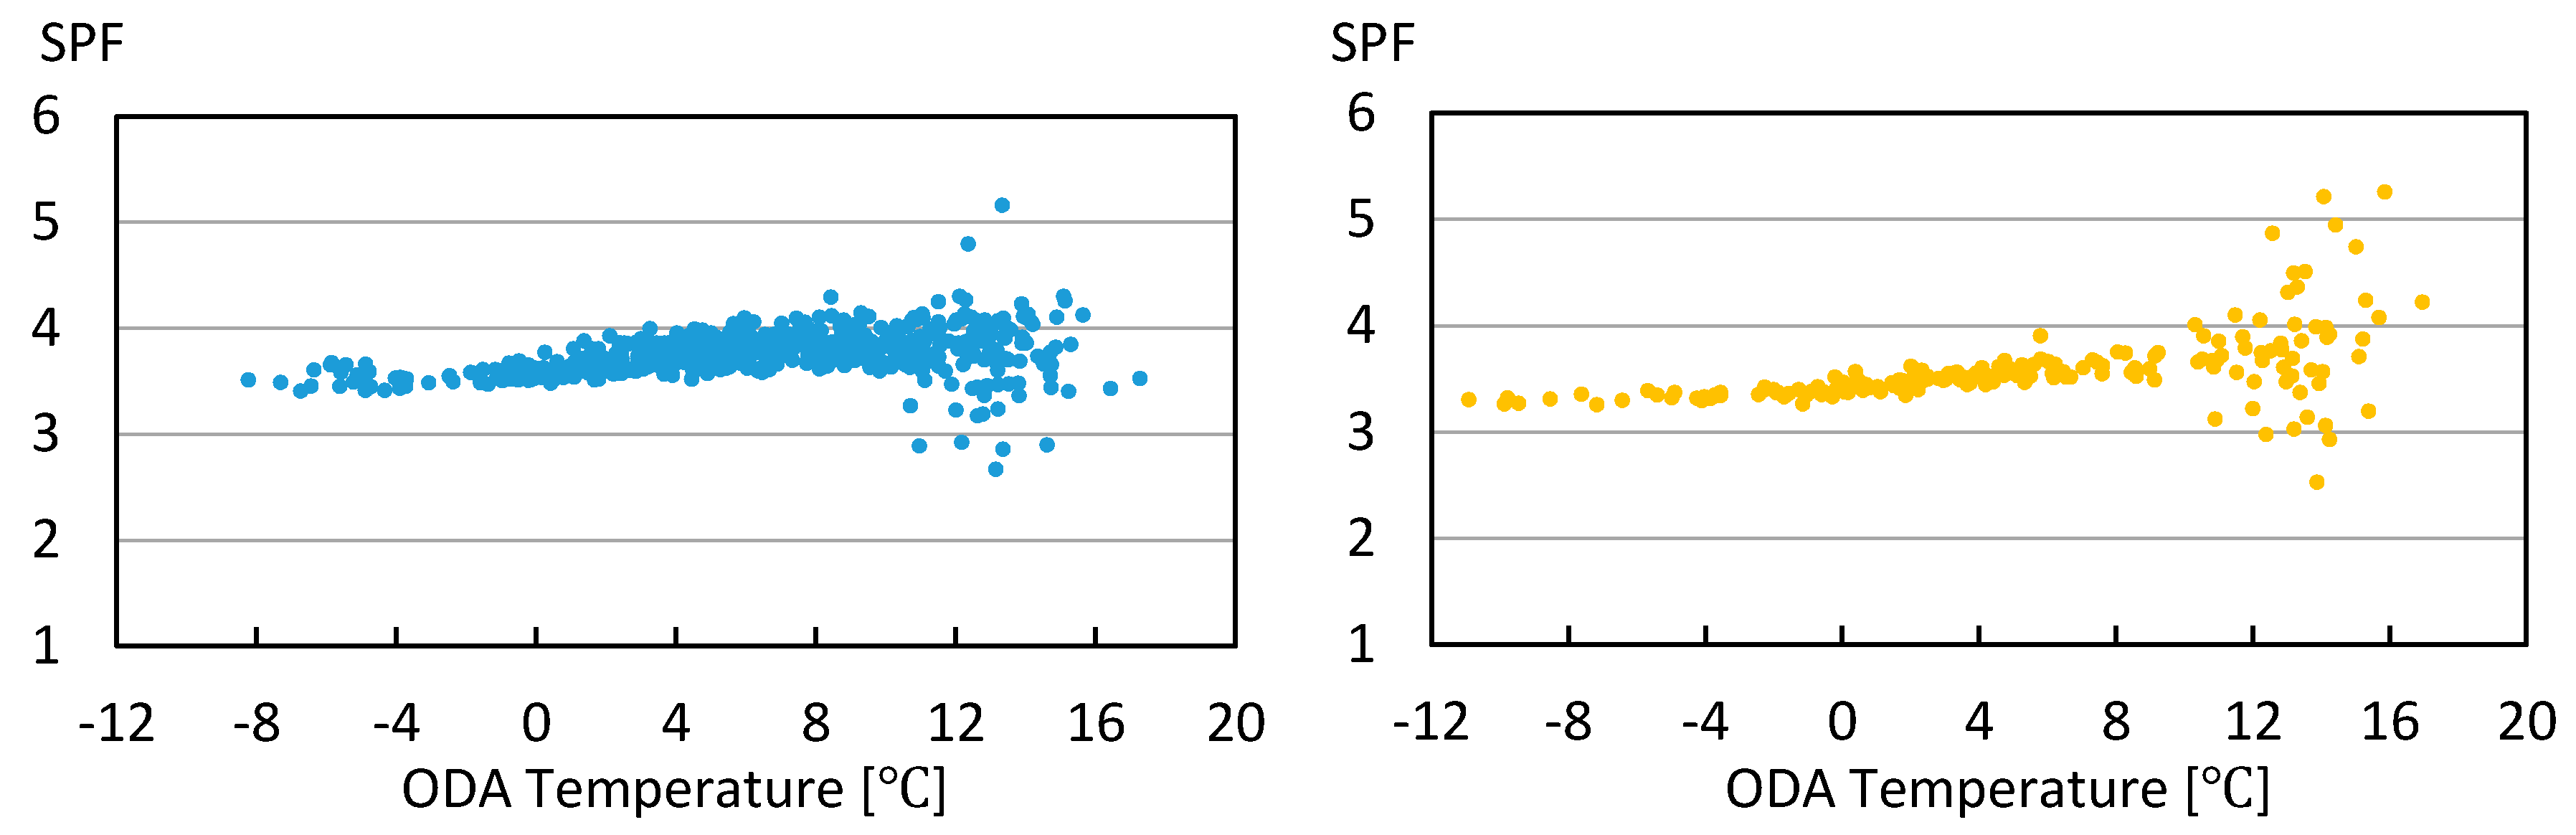
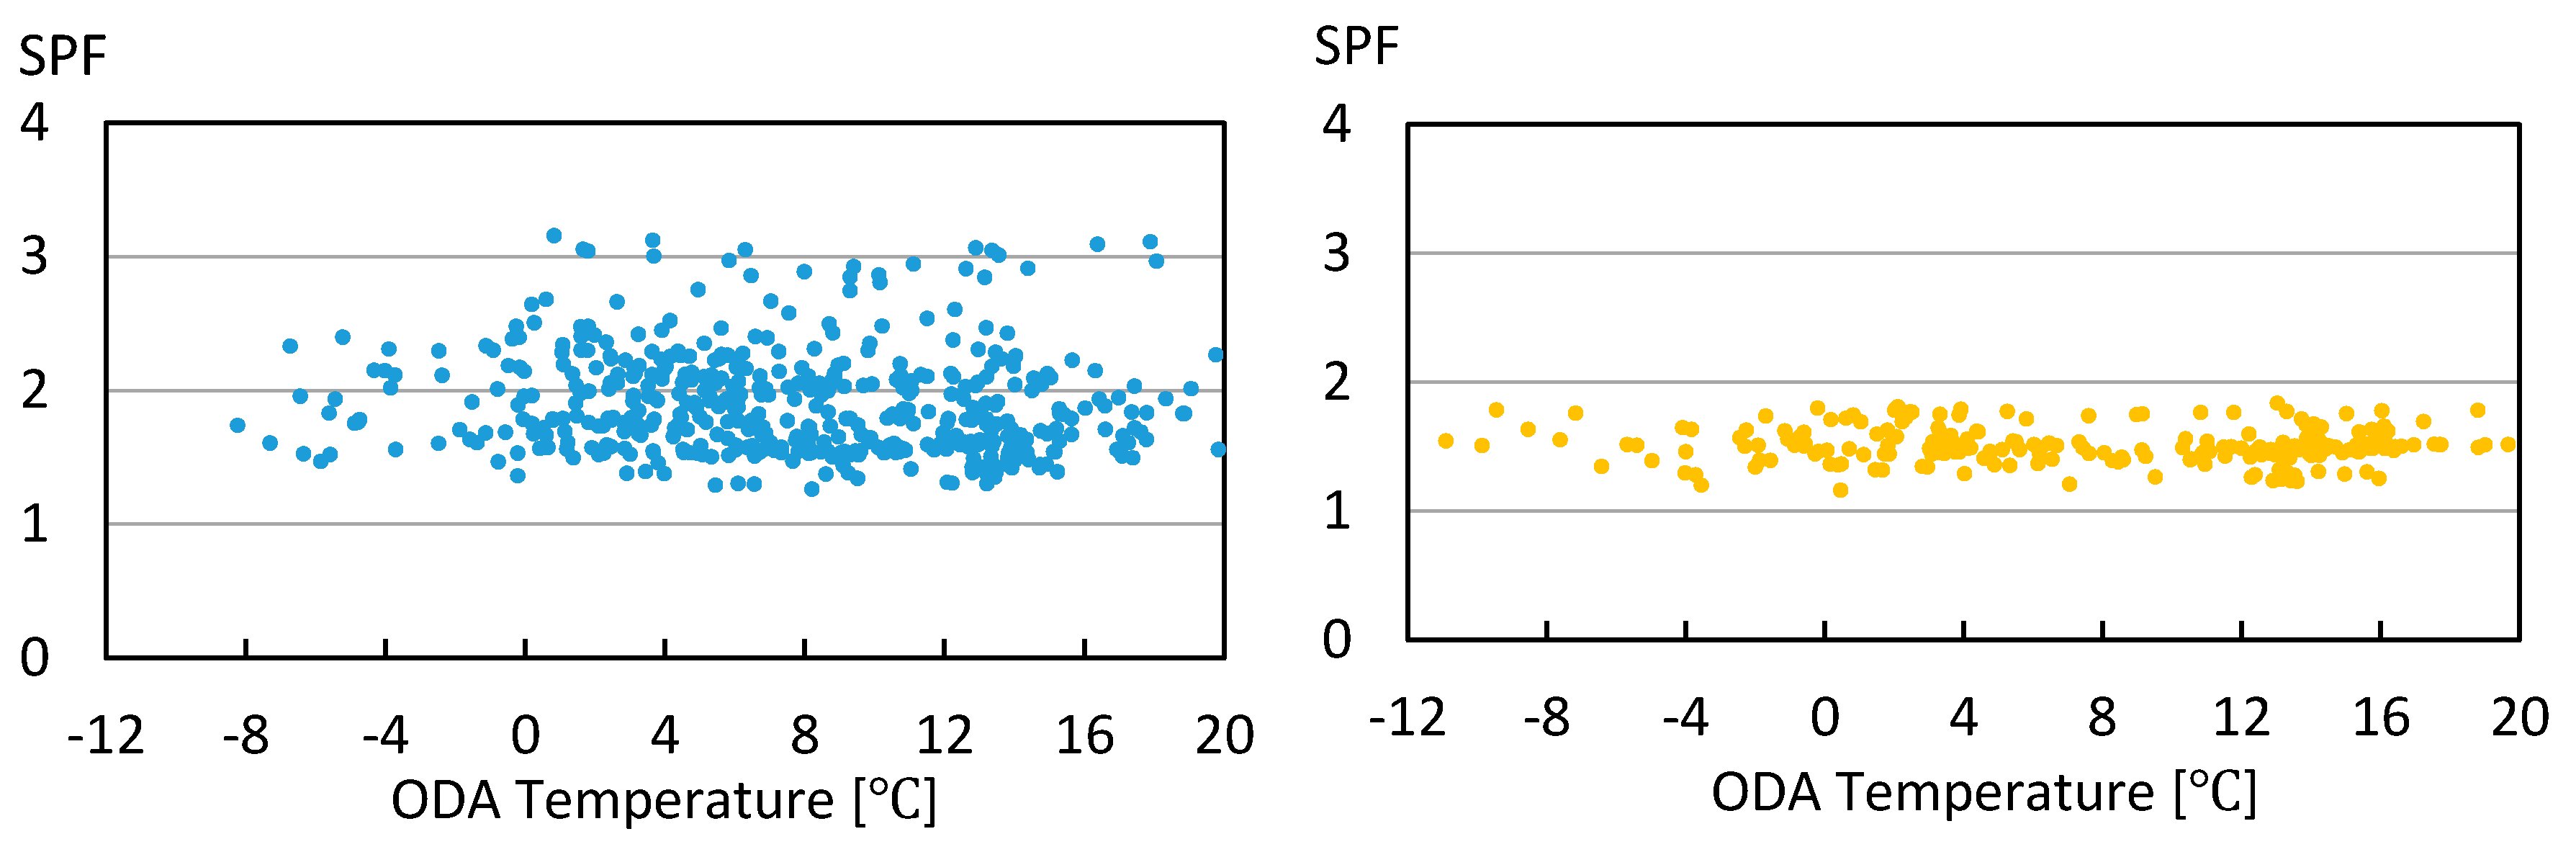
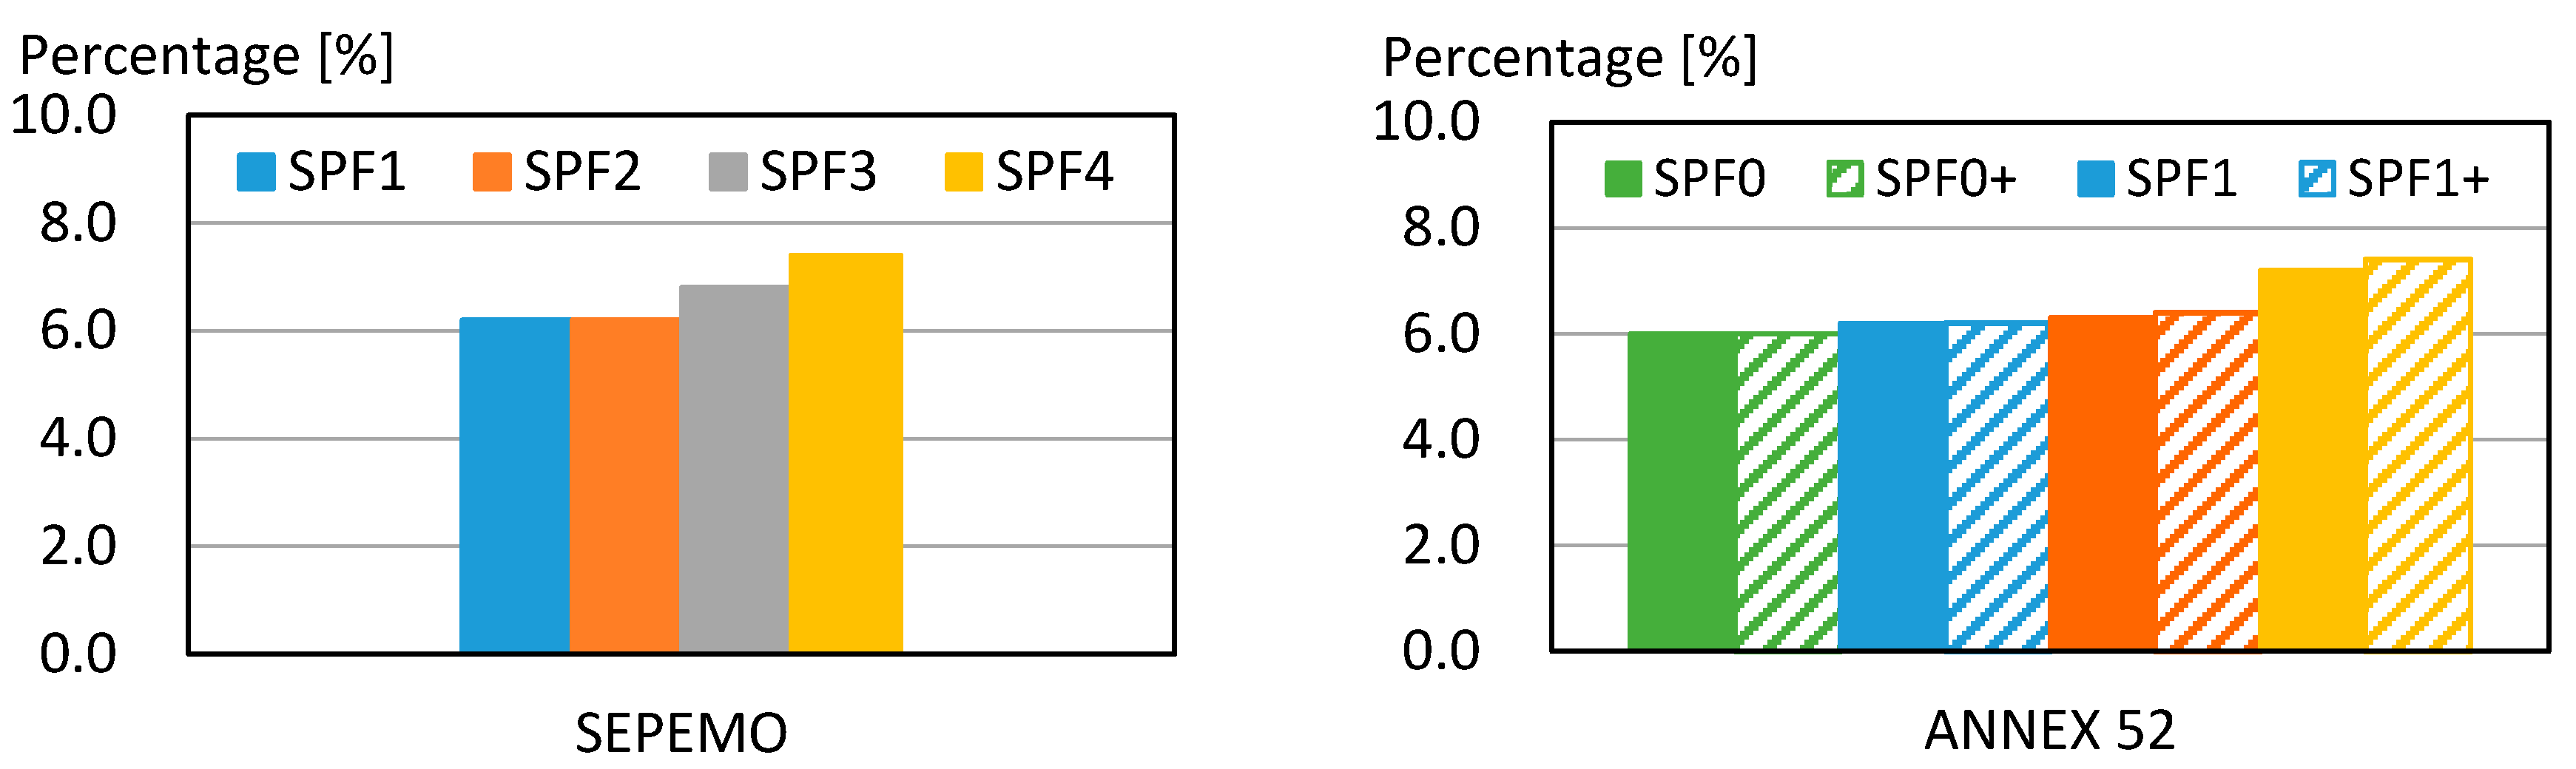
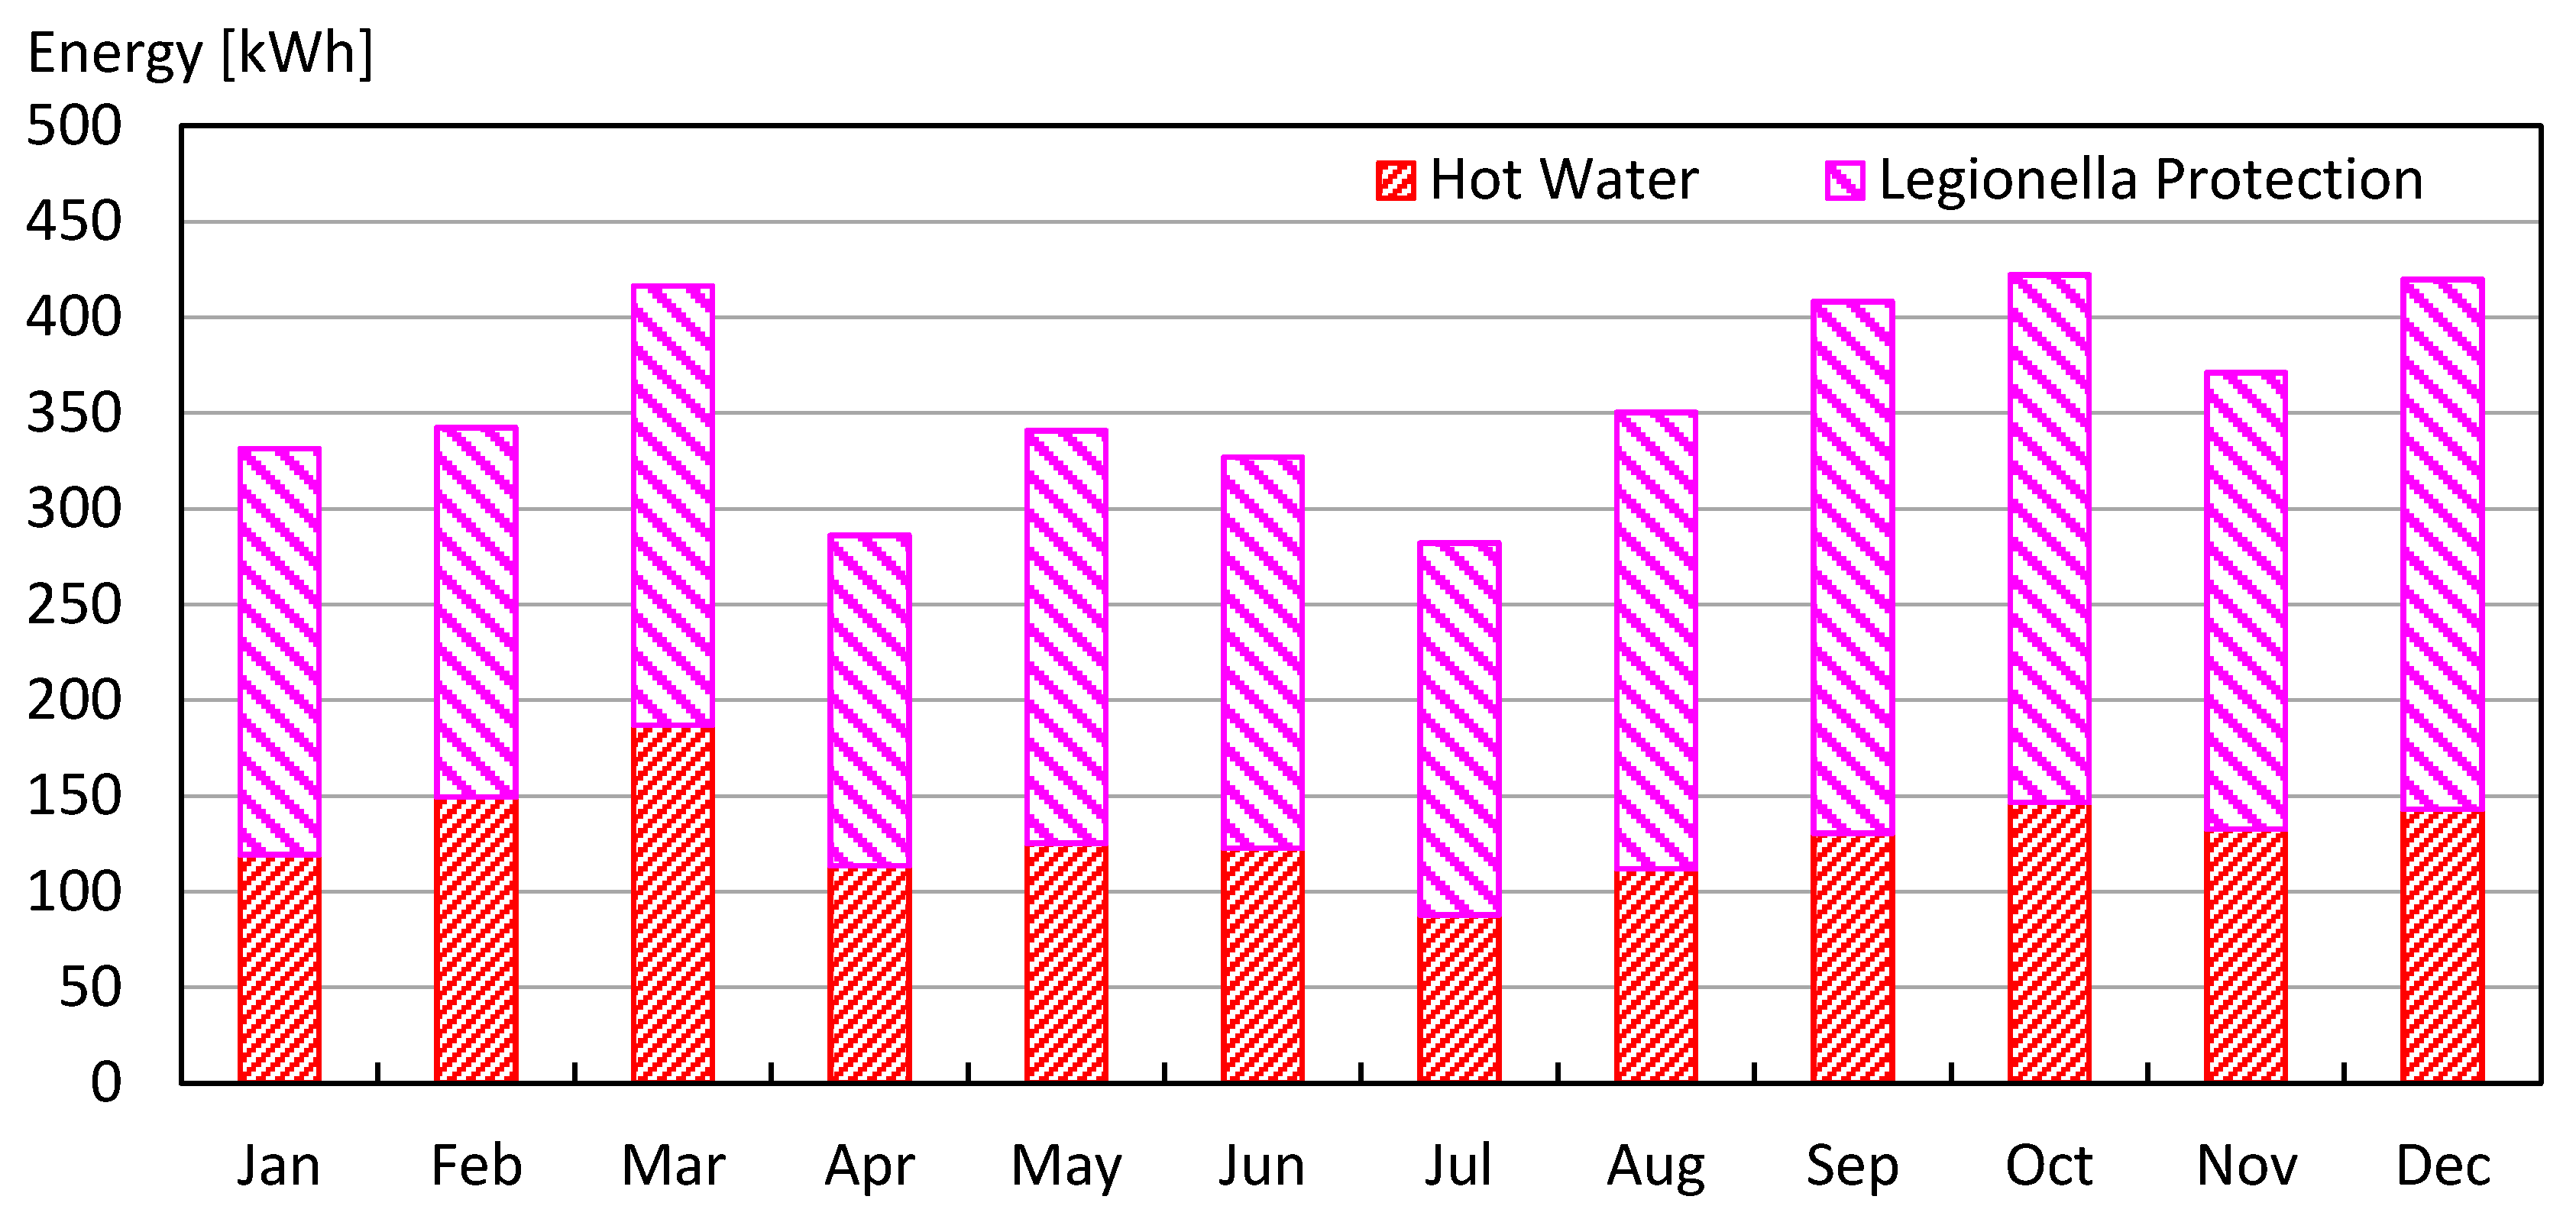
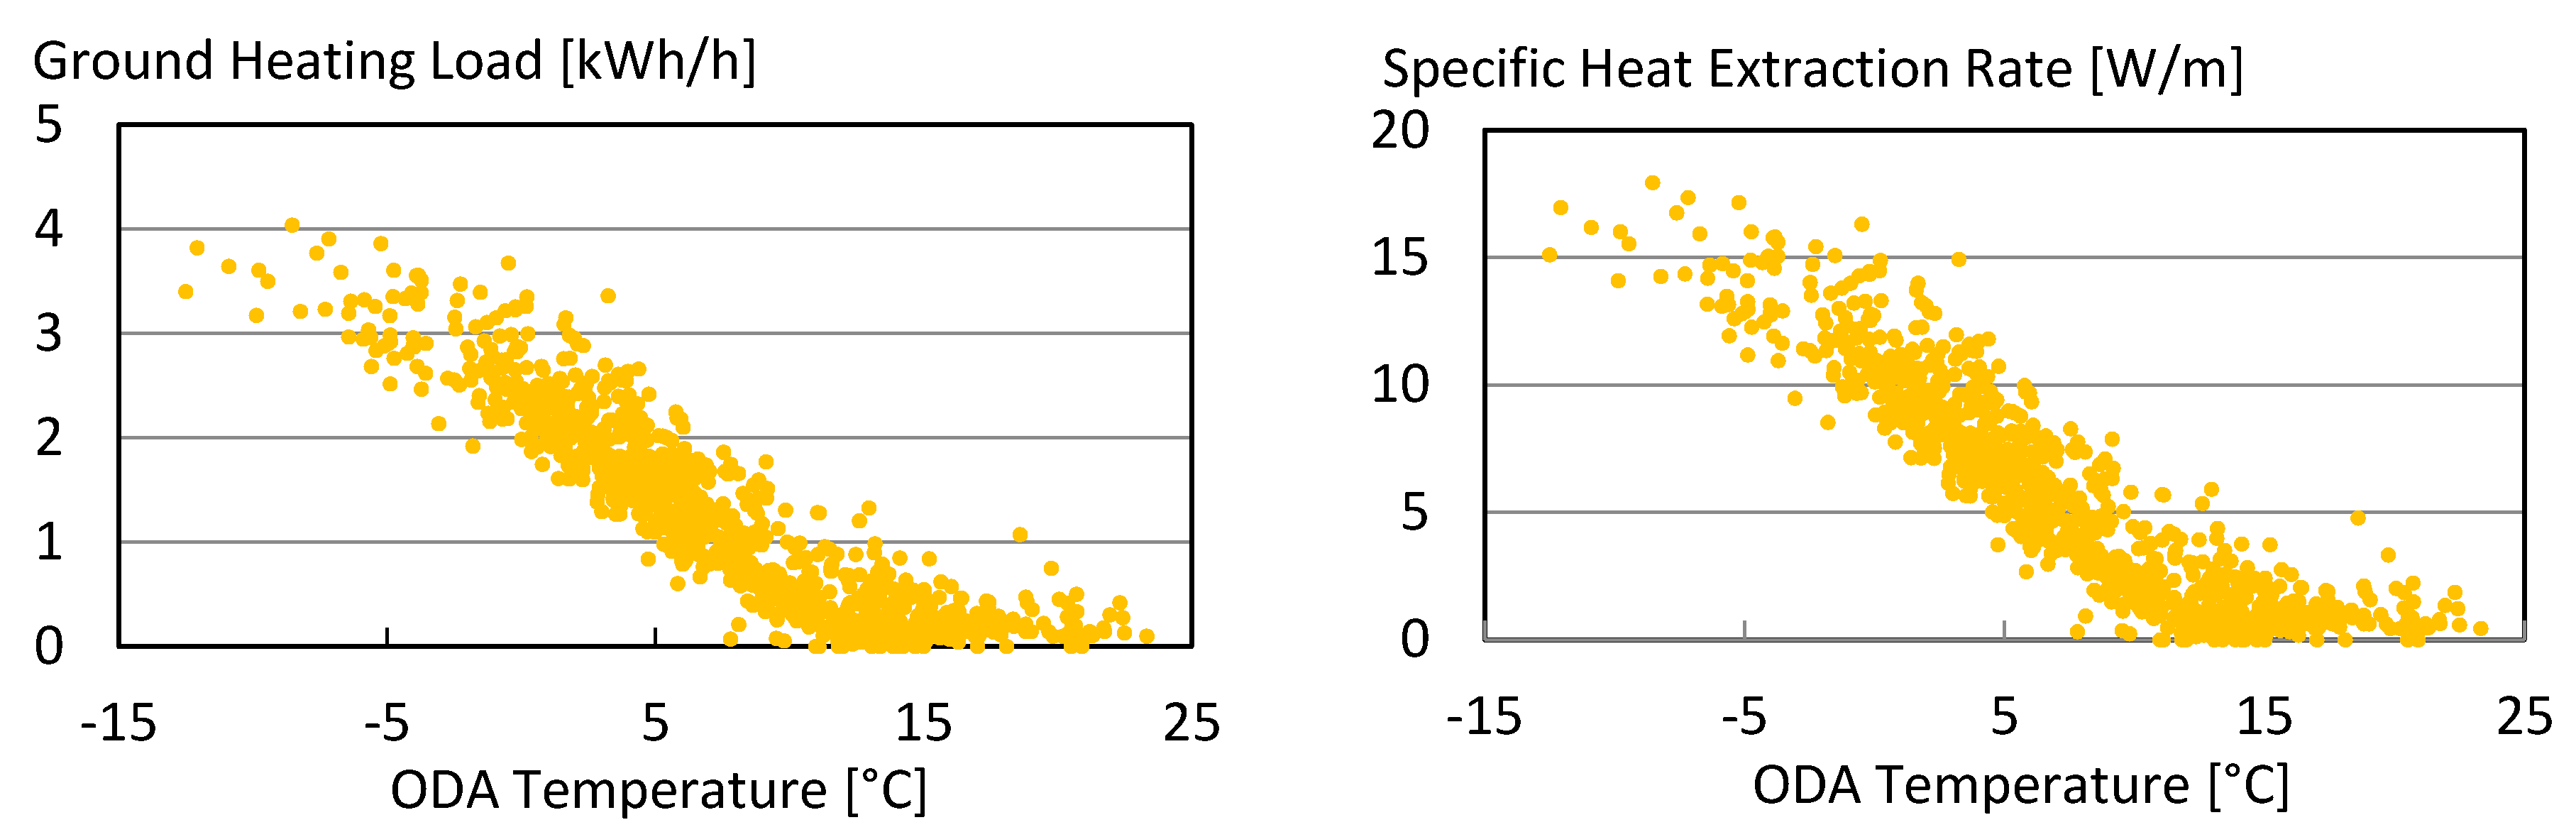
Table 1.
SEPEMO system boundary scheme.
| Boundary Description | Boundary Levels | |||
|---|---|---|---|---|
| 1 | 2 | 3 | 4 | |
| Refrigeration cycle | X | X | X | X |
| Source-side circulation pump | X | X | X | |
| Auxiliary heating or cooling | X | X | ||
| Distribution-side circulation pump | X | |||
Table 2.
Annex 52 system boundary scheme.
| Boundary Description | Boundary Levels | |||||||||||
|---|---|---|---|---|---|---|---|---|---|---|---|---|
| 0 | 0+ | 1 | 1+ | 2 | 2+ | 3 | 3+ | 4 | 4+ | 5 | 5+ | |
| Ground source and source-side circulation pumps | X | X | X | X | X | X | X | X | X | X | ||
| Refrigeration cycle | X | X | X | X | X | X | X | X | X | X | ||
| Buffer tank including circulation pumps between heat pump and buffer tank | X | X | X | X | X | X | ||||||
| Circulation pumps between buffer tank and distribution system | X | X | X | X | ||||||||
| Distribution system | X | X | ||||||||||
| Auxiliary heating or cooling | X | X | X | X | X | X | ||||||
Table 3.
Formulas to calculate the seasonal performance factors based on the SEPEMO boundary scheme.
Table 3.
Formulas to calculate the seasonal performance factors based on the SEPEMO boundary scheme.
Table 4.
Formulas to calculate seasonal performance factors based on the Annex 52 boundary scheme.
© 2020 by the authors. Licensee MDPI, Basel, Switzerland. This article is an open access article distributed under the terms and conditions of the Creative Commons Attribution (CC BY) license (http://creativecommons.org/licenses/by/4.0/).
Share and Cite
MDPI and ACS Style
Liu, H.; Zhang, H.; Javed, S. Long-Term Performance Measurement and Analysis of a Small-Scale Ground Source Heat Pump System. Energies 2020, 13, 4527. https://doi.org/10.3390/en13174527
AMA Style
Liu H, Zhang H, Javed S. Long-Term Performance Measurement and Analysis of a Small-Scale Ground Source Heat Pump System. Energies. 2020; 13(17):4527. https://doi.org/10.3390/en13174527
Chicago/Turabian StyleLiu, Hao, Hongyi Zhang, and Saqib Javed. 2020. "Long-Term Performance Measurement and Analysis of a Small-Scale Ground Source Heat Pump System" Energies 13, no. 17: 4527. https://doi.org/10.3390/en13174527
Note that from the first issue of 2016, this journal uses article numbers instead of page numbers. See further details here.