Electrical Response of Mechanically Damaged Lithium-Ion Batteries
by

Damoon Soudbakhsh
1,6, 
Mehdi Gilaki
2,
William Lynch
3,
Peilin Zhang
4,
Taeyoung Choi
5 and
Elham Sahraei
2,6,* 1
Dynamical Systems Laboratory (DSLab), Temple University, Philadelphia, PA 19122, USA
2
Electric Vehicle Safety Lab (EVSL), Temple University, Philadelphia, PA 19122, USA
3
Research Laboratory of Electronics (RLE), Massachusetts Institute of Technology, Cambridge, MA 02139, USA
4
State Key Laboratory of Automotive Safety and Energy, Tsinghua University, Beijing 100084, China
5
Korea Aerospace Industries (KAI), Sacheon-si 52529, Korea
6
Department of Mechanical Engineering, Massachusetts Institute of Technology, Cambridge, MA 02139, USA
*
Author to whom correspondence should be addressed.
Energies 2020, 13(17), 4284; https://doi.org/10.3390/en13174284
Submission received: 16 June 2020
/
Revised: 28 July 2020
/
Accepted: 30 July 2020
/
Published: 19 August 2020
(This article belongs to the Special Issue Crash Safety of Lithium-Ion Batteries)
Abstract
:Lithium-ion batteries have found various modern applications due to their high energy density, long cycle life, and low self-discharge. However, increased use of these batteries has been accompanied by an increase in safety concerns, such as spontaneous fires or explosions due to impact or indentation. Mechanical damage to a battery cell is often enough reason to discard it. However, if an Electric Vehicle is involved in a crash, there is no means to visually inspect all the cells inside a pack, sometimes consisting of thousands of cells. Furthermore, there is no documented report on how mechanical damage may change the electrical response of a cell, which in turn can be used to detect damaged cells by the battery management system (BMS). In this research, we investigated the effects of mechanical deformation on electrical responses of Lithium-ion cells to understand what parameters in electrical response can be used to detect damage where cells cannot be visually inspected. We used charge-discharge cycling data, capacity fade measurement, and Electrochemical Impedance Spectroscopy (EIS) in combination with advanced modeling techniques. Our results indicate that many cell parameters may remain unchanged under moderate indentation, which makes detection of a damaged cell a challenging task for the battery pack and BMS designers.
1. Introduction
Lithium-ion Batteries (LIB) have high power/energy density, long cycle life, and low self-discharge rate [1,2], which make them the preferred power source in a wide range of applications such as in cell phones, electric vehicles, marine vessels, and airplanes. However, the uncontrolled release of a significant amount of energy in abuse conditions makes the safety of these batteries an important concern [3,4]. Accidental or abusive mechanical loading of these batteries become an issue when they are used in high-speed mobile applications such as vehicles. In the case of a vehicle crash, damage to the battery may cause a potential thermal runaway [5]. Researchers have studied the extent of mechanical damage that can create an internal short circuit in pouch and cylindrical batteries [6,7,8,9,10,11,12,13,14,15,16,17,18,19]. Mechanical failures in cell components have also been studied in several recent publications [20,21,22]. There is a critical depth of deformation that can cause a battery cell to reach its mechanical failure criteria where the principal strains in the components exceed their fracture limit [23,24]. Sahraei et al. performed the first set of extensive mechanical characterization tests on Lithium-ion batteries where voltage and temperature of the cell were monitored during the tests to investigate the correlation between mechanical and electrical failure [9,13,25]. Their tests on several pouch and cylindrical cells showed the voltage and temperature of cells remain relatively constant during mechanical deformation until the point of fracture is detected with a drop in mechanical force. Simultaneous with the drop of force, a drop in voltage and a rise in temperature confirmed an internal electric short circuit in the cells. On the other hand, experiments reported by Kalnaus et al. [26] showed that the force drop and short circuit are not necessarily simultaneous in the case of stack of cells and battery modules. These observations showed that a battery cell involved in a mechanical abuse scenario may sustain considerable deformation before it can lead to an electrical short circuit that can be detected by a drop in voltage. In most battery packs used in electric vehicles, there is no way to visually inspect the cells inside a pack for mechanical damage after an accident or mechanical abusive loading, and if no change in voltage or temperature is observed in a dented cell, such damage may remain undetected.
On the other hand, researchers have shown that micro-cracks can be observed in electrode coatings and significant thinning can be observed in battery separators, long before a full fracture happens in the components [20,27,28,29]. What is completely missing from the current state of the art is how mechanical deformations that do not lead to immediate failure and short circuits can affect the electrochemical performance of a battery cell. In the current study, the authors investigate whether by measuring the electrical response of a cell, one can provide a tool to detect mechanical damage, after a vehicle sustains accidental abusive loading or impact. The goal is to shed light on the extent of mechanical damage in which a battery can be categorized as safe or potentially dangerous. The state of the current practice in battery pack manufacturing is to discard any cell suspected of mechanical damage (such as accidental drop) even if no visual damage is observed to avoid any risks associated with latent failure [30,31]. The current study will assist in evaluating such cells for potential future use.
The electrical response is often used to identify parameters of the LIB, with a focus to estimate the State of Charge (SoC) and State of Health (SoH) of the batteries. In this research, we aim at identifying the effects of mechanical damage on these parameters. In the following, we review some of the relevant work on estimating parameters of LIBs. Several studies have concentrated on estimating the state of charge of LIBs for battery management systems, largely to control charge and discharge cycles. Most recent studies aim at the real-time estimation of SoC, which is typically done using simple electrical components and in particular using a Thevenin model of the battery [32,33,34]. However, modeling failures in batteries require a more detailed analysis of their response, and nonlinear models with more complex components are more suited for fault detection.
Another goal for estimating parameters of LIB has been on estimating their State of Health SoH to quantify aging of the batteries after going through electrical cycling in different environments [1,35,36,37]. State of health of batteries is usually defined as the degradation of battery parameters such as capacity over time. While some studies [38] use simple models such as Thevenin model to connect capacity fade to internal resistance for SoH estimates, most studies look for dynamical methods possibly with nonlinear elements to quantify battery parameters. Dynamical methods to estimate SoH can be divided into—(1) pulse tests followed by DC voltage measurement, and (2) Electrochemical Impedance Spectroscopy (EIS) [35,39]. As EIS provides more data in an extended frequency range, it is a method of choice for many advanced studies on Lithium-ion batteries. However, it should be noted that EIS measurements can be very sensitive to test conditions [35,40]. In recent literature [35,40], the influence of temperature and SoC on EIS measurements was investigated and shown that reducing temperature results in more spread out (wider) EIS plots. EIS measurements are also sensitive to other parameters including relaxation time of batteries after electrical loading [2]. While there is a rich literature on the degradation and characterization of intact batteries over time, to the best of our knowledge, there have not been any studies to characterize the effects of mechanical damage on the trend of changes in electrical parameters of battery cells.
In this research, we applied controlled mechanical forces on LIB cells and cycled them to compare performance and capacity fade of the physically damaged batteries compared to intact ones that underwent the same cycling profile. We use EIS to measure the health of the battery and monitor the changes in parameters of an equivalent circuit model, to draw conclusions about the effects of mechanical damage on the electrical response of the batteries.
The main contributions of the current study compared to state of the art can be summarized as follows:
- Investigate the effects of mechanical deformation that does not lead to immediate failure of cells on the electrical performance of battery cells.
- Collect data on charge-discharge cycling, capacity fade rate, and Electrochemical Impedance Spectroscopy to track potential changes in the response of the cell.
- Use nonlinear modeling with distributed CPE elements to achieve very small fitting error to accurately represent impedance spectra of the cells and interpret the results.
- Show trend of changes in cell parameters for mechanically damaged versus intact cells over low and high rate cycling.
The rest of the paper is organized as follows—Electrochemical Impedance Spectroscopy and the Equivalent Circuit Model (ECM) are described in Section 2. In Section 3, the experimental procedure is described. In Section 3.1 setup and procedure for the mechanical abuse procedure are described. Test procedure and apparatus for charging and discharging Lithium-ion cells as well as measuring their impedance spectra via Electrochemical Impedance Spectroscopy are described in Section 3.2 and Section 3.3. Results of the cycling and EIS tests and verification are presented in Section 4. Summary and concluding remarks are given in Section 5.
2. Modeling Using Impedance Spectra
In this study, we used equivalent circuit models with distributed elements to represent the dynamics of Li-ion cells. These models are motivated by electrochemical processes inside the cells as opposed to the simple equivalent circuit models used mostly in simulating the power or energy generation of the Li-ion cells. These models can represent the battery response in a wide range of frequencies and still have dependencies on the physical parameters of the batteries. We use impedance spectra as described in Section 2.1 to develop the model as described in Section 2.2.
2.1. Electrochemical Impedance Spectroscopy
Electrochemical Impedance Spectroscopy (EIS) is a test based on applying sinusoidal inputs (: potential) with frequency to the cells and measure current as a function of frequency, [39]. The ratio of the input to output and the phase shift between the two results in a frequency-dependent complex number called impedance:
EIS analysis involves plotting the Imaginary part of the impedance versus its real part , which is also known as Nyquist diagram. Typically, EIS is shown as the negative of the imaginary values versus the real parts.
Kramers-Kronig relations state that if four conditions of causality, stability, linearity, and finiteness of the response are satisfied for a system, then the imaginary component and real component of the impedance are interdependent [39,41]. Therefore, one can compute imaginary (or real part) with information from frequency and the real component (imaginary component) of the impedance. Here we use Kramers-Kronig (K-K) transforms to validate the EIS results. We note that conditions such as linearity are good approximations for Lithium-ion cells only if the applied voltage is very small, as was the case for our experiments (<20 mV). K-K relations in the frequency domain can be described as follows [39,41]
In (2) and (3), and are the expected values of measured parameters and based on K-K transforms, respectively.
2.2. Equivalent Circuit Model
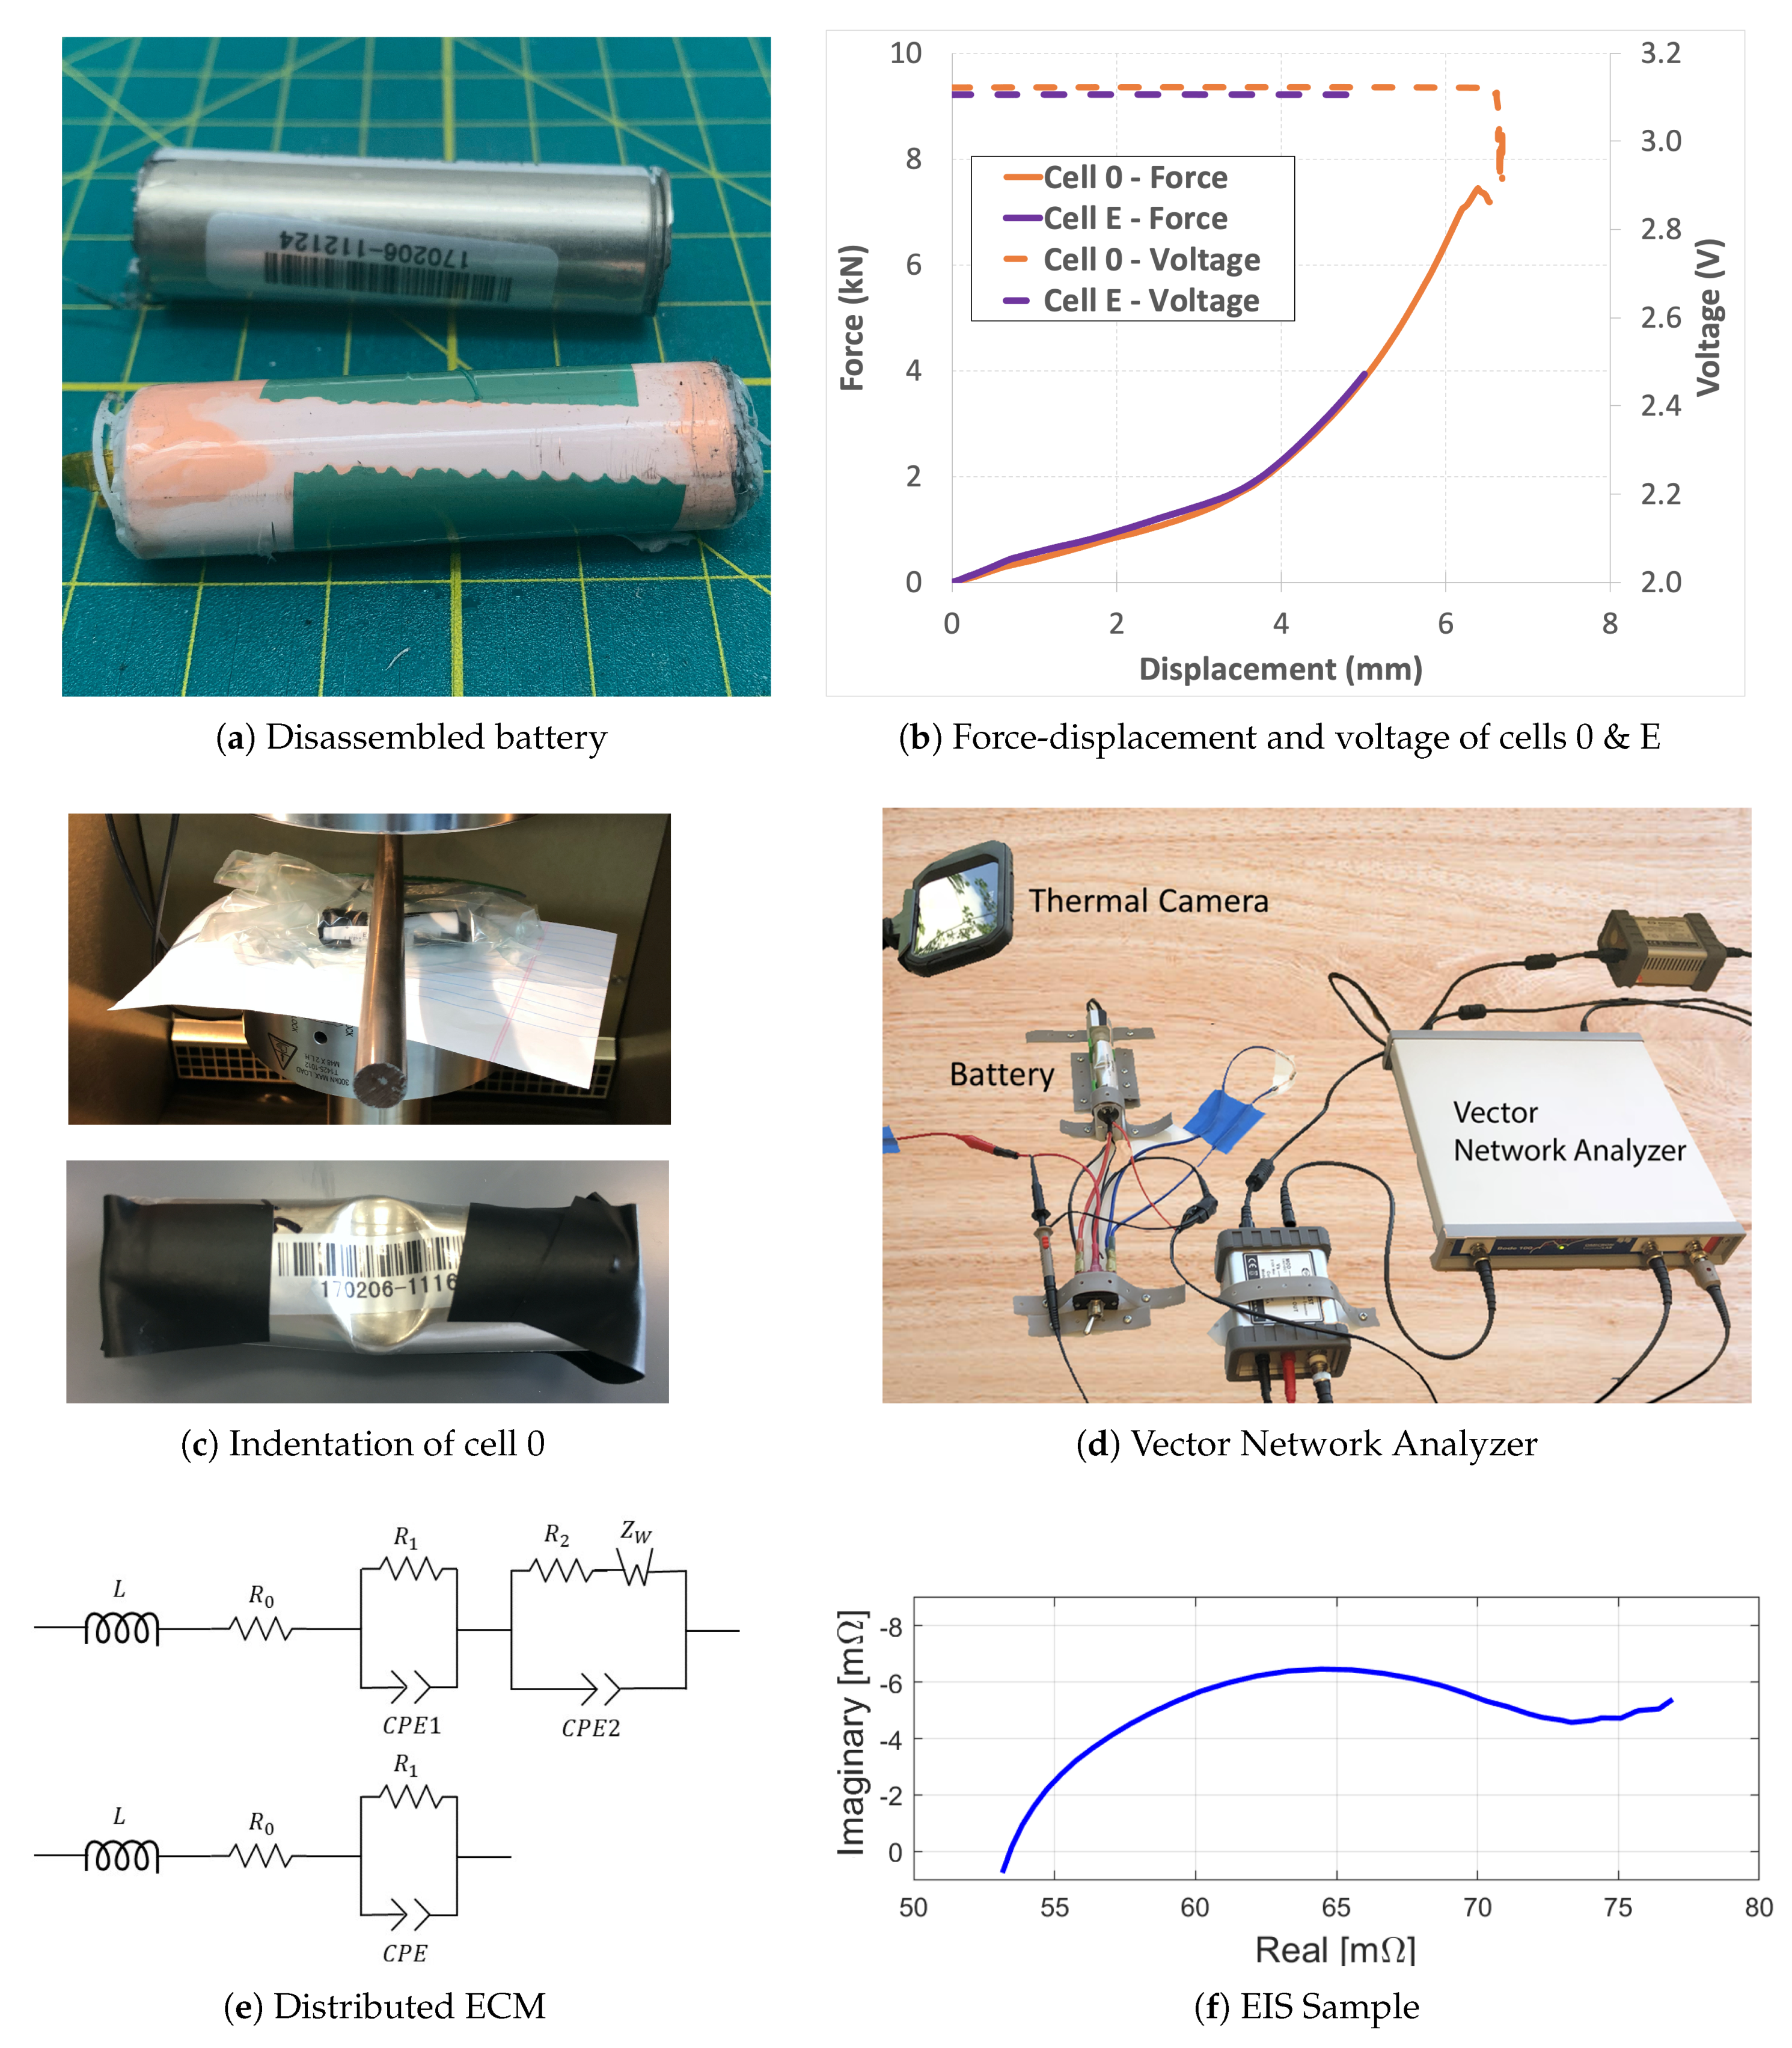
To quantify responses of the cells over time, we used distributed Equivalent Circuit Models (dECM) that have the same impedance over the entire measured frequency spectra [42,43]. The model parameters are used to quantify the degradation of the cells over time and to compare the trends of changes in the indented cell parameters versus those of the intact control group. We used an adapted version of the widely used Randles circuit [42,43,44] that has a connection to the physics and does not have ambiguity in its parameters [39,43]. This circuit usually has seven components as shown on top of Figure 1e. For this study, a reduced version of the model is used as a voltage source connected to an inductor in series with a resistor , and a CPE (Constant Phase Element) in parallel with a resistor as shown in Figure 1e. The model offers a very good fit as shown in the results without introducing over-fitting.
Using distributed elements such as CPE in the ECM is essential in understanding and interpreting frequency spectra [39]. CPE elements arise from the distributed nature of the microscopic material properties of the cells. To find the model parameters, we derive the analytical impedance of the ECM. In the model of Figure 1e, L is the inductance, is the internal resistance of the cell, and is the dipole resistance. CPE is a non-physical distributed element, with the equivalent impedance of in the frequency domain with n being its condition number or depression factor, the frequency in rad/s, and Q is a scaling factor that depends on the internal battery parameters such as dielectric constants, mean relaxation time, and the condition number n. Therefore, the model has 5 unknown parameters, namely and n. Using relations for CPE and using relations for parallel and series components, we arrive at (4) for the impedance of the equivalent circuit model:
To ensure an accurate representation of the experimental data with the ECM of Figure 1e, we used the weighted error in (5) as a measure for goodness of the fit, and required this parameter to be less than . is defined as the weighted error of the fit parameters relative to the measured impedance [39].
In (5), and are the estimated values of the real and imaginary impedance of the ith measurement using the model parameters (calculated using (4)), and are the components of the ith measured impedance.
3. Experimental Procedure
The batteries used for this study were 18,650 energy cells with the chemistry of Lithium iron phosphate, a nominal capacity of 1500 mAh, and operating temperature of −20 to 60 . The battery had an Aluminum casing with a thickness of 0.25 mm. Experiments and measurements throughout this study were planned so that all cells undergo similar environmental and cycling conditions. Hence, any possible difference in the electrical response of indented and intact cells could be only attributed to the mechanical damage caused by indentation.
Six new batteries were picked for this study. Cells A-D were chosen to go through low-rate (0.5 C and 1 C) cycling, while cells E and F were cycled at higher rates of up to 10 A (6.7 C).
3.1. Mechanical Loading
The battery used for this study consists of a 17 mm (dia) jellyroll which is made of rolled layers of anode, cathode and separator (see Figure 1a). This battery does not include a central mandrel. Therefore, under indentation, the majority of load is carried by jellyroll layers which are being compressed under the indentor. These layers can also undergo tension in axial direction which causes higher stresses in current collectors due to their higher stiffness. To understand the critical limit in the mechanical indentation of batteries, two cells were tested under indentation loading until reaching the short circuit. An Instron 5985 universal load frame with a 250 kN load cell was used to apply the mechanical deformation. The testing was performed at room temperature with a displacement rate of 1 mm/min. A 15.8 mm steel rod was placed across the center of the cell to apply the indentation. Force, displacement, and voltage of the cell were recorded during testing. It was observed that the cells’ voltage remained constant while the depth of indentation and the force applied to the cells were increasing until the indentation reached a maximum value of 6.2–6.4 mm, where suddenly the force and the voltage started to drop, indicating short circuit in the cells. Figure 1b shows the change in force and voltage for one of the two batteries (labeled cell 0). Indentation test of cell 0 is shown in Figure 1c. The constant voltage before the short circuit showed that the mechanical indentation may not cause an immediate change in the electrical response of the cell until reaching the critical depth of the short circuit. However, to understand how the mechanical damage affects the cycling response of the cell, 6 additional cells were used for a controlled experiment.
The cells went under 5 charge/discharge cycles (at 0.5C rate) simultaneously. Two cells (Cells A and B) were indented to a depth of 4.7 mm, and were used for subsequent low rate charge-discharge cycling along with two control group cells (intact Cells C and D). Battery cycling continued for these cells up to 84 more cycles to determine if mechanical damage affected the electrical response of the indented cells compared to the intact control group.
An additional cell (Cell E) was indented to 5 mm depth and used along with a control (intact Cell F) for high rate cycling until the end of life. Variation of force and voltage for this cell is also plotted in Figure 1b. It can be observed that no change in voltage was recorded during the indentation.
3.2. Cycling Procedure
An MTI BST8-30A-CDS four-channel battery analyzer was used for low-rate battery cycling. Electrical data (voltage, current, capacity) were recorded every 60 s, 0.05 V, or 0.05 A changes. Surface temperature of each cell was also recorded using thermocouples attached to the middle of the cells. During the cycling process, cells were kept in a VWR 1500 EM incubator within a temperature range of 23.5 to .
The charge/discharge cycling procedures followed for cells A-D are described in Table 1. For the first 63 cycles, the batteries were charged at a constant current value of 750 mA (0.5C) until they reached a voltage of 3.65 V. Charging was then continued at a constant voltage of 3.65 V until current dropped to below 0.01C. Discharge was also performed under constant current of 750 mA until the cells’ voltage reached a cut-off level of 2.5 V. After cycle 63, charge/discharge currents were increased to 1500 mA (1C) to accelerate degradation and study the effects of higher rates on performance of damaged and intact cells with fewer EIS measurements.
3.3. EIS Measurements
To measure the frequency response of the batteries, we used Bode 100, a vector network analyzer by Omicron [45]. The measured frequencies in our experiments were 1 Hz to 2 MHz. The cells underwent two sets of EIS after each charge and discharge during life cycling. All cells had a rest time of at least one hour before the first EIS, and the time between two consecutive EIS of each cell was one hour. The EIS test setup is shown in Figure 1d. The EIS responses were measured frequently by inserting and removing cells. To ensure consistency across the measurements, the EIS setup was fixed using straps and screws, and the cables were taped to the table. Therefore, only the cells were taken out and in of the holder without touching/changing the location of any of the other components or the battery holder. In addition, the battery holder was modified by adding a 3D printed part to ensure consistent placement of the cells. We ensured the angle of insertion of the cells inside the holder by marking a line on each cell and keeping it on the top. Additional tests were done with GAMRY Interface 1000E to confirm the validity of the results measured by Bode 100. This device was capable of testing EIS in frequencies ranging from 0.1 Hz to 2 MHz. An EIS measurement of cell B is shown in Figure 1f.
EIS measurements are shown to be sensitive to changes in temperature [35]; therefore, the temperature was kept constant in our study. EIS tests were done at , and the excitation voltage was set to 10 mV. To verify the validity of the EIS measurements, Kramers-Kronig (K-K) Transforms as discussed in Section 2.1 were utilized.
4. Results
In what follows, we present the response of four Lithium-ion cells that underwent 89 charge/discharge cycles. Two of the cells were the controls and the other two were indented. In Section 4.1, the cycling response of the cells and the changes in the overall capacity are presented. In Section 4.2, frequency response and trend of changes in the equivalent circuit model are presented.
4.1. Battery Cycling Data
Figure 2a compares voltage vs. discharge capacity curves for all cells during cycle 5, before indentation. All curves follow similar trends, and the maximum capacity of all cells are very close to 1500 mA, as expected. After indentation of cells A and B and extensive cycling at 0.5 C and 1 C rates, similar comparison during cycle 89 shows no significant difference between the indented and intact cells (see Figure 2b). However, the capacity of all the cells had dropped to 1439–1458 mAh.
Voltage vs. discharge capacity is also plotted for various cycles. The plot for cell B (Figure 3a) shows how increasing the discharge current from 750 mA to 1500 mA causes slightly lower voltages for a given capacity. Increasing charge and discharge rates also significantly affected cell surface temperatures (Figure 3b). During discharge, the change in temperature increased from about 3 C to 6 C when the current was raised from 750 mA to 1500 mA. The maximum temperature occurred at the end of discharge time (120 min for 750 mA and 60 min for 1500 mA discharge rates). The temperature curves include a 60 min relaxation period during which they dropped to the room temperature. In all of the cases the surface temperature was slightly lower during charge, 2 C for 750 mA and 5 C for 1500 mA charge current.
Figure 3c plots the change in charge capacity of cells for all cycles. For all of the cells, capacities dropped about 5% after 89 cycles. The cycling was paused at certain cycle numbers at 0% SoC and 100% SoC to perform EIS tests which caused changes in voltages and capacities of the cells. The performance of EIS causes relaxation with some minor changes in voltage and capacity, hence, observed unsmooth points on the capacity curves of Figure 3c. Comparison of the curves for various cells shows that the capacities of the damaged cells were slightly higher than the intact cells from the beginning (before indentation) and followed the same trend after indentation. Overall, it can be concluded from the cycling data that there were no significant changes in the cells’ electrical data that can be attributed to the damage induced by indentation in cells A and B.
4.2. EIS Results
The experimental data were used to identify model parameters based on complex nonlinear regression least square fitting [39]. Figure 4a shows the comparison of the measured data to the expected values from the K-K transforms and the fitted model. K-K transform tests were performed to test validity of the experimental data, as discussed in Section 2.1. Figure 4a shows a comparison of the expected values from the K-K transform from (2) to (3) and the measured data, which proves validity of the measured EIS.
A Nyquist plot of measured impedance and model’s impedance are shown in Figure 4b. Figure 4c,d show the comparison of magnitude plot and plot of imaginary and real part of the impedance versus frequency on semi-log plots. It can be seen from these figures that the model predicts the measured impedance from EIS tests very well. More importantly, the weighted error as defined in (5) was less than for all tests using electric circuit equivalent model of Figure 1e, which shows an acceptable estimation of the response. Therefore, this model with 5 parameters and n as in (4) was selected to analyze the data.
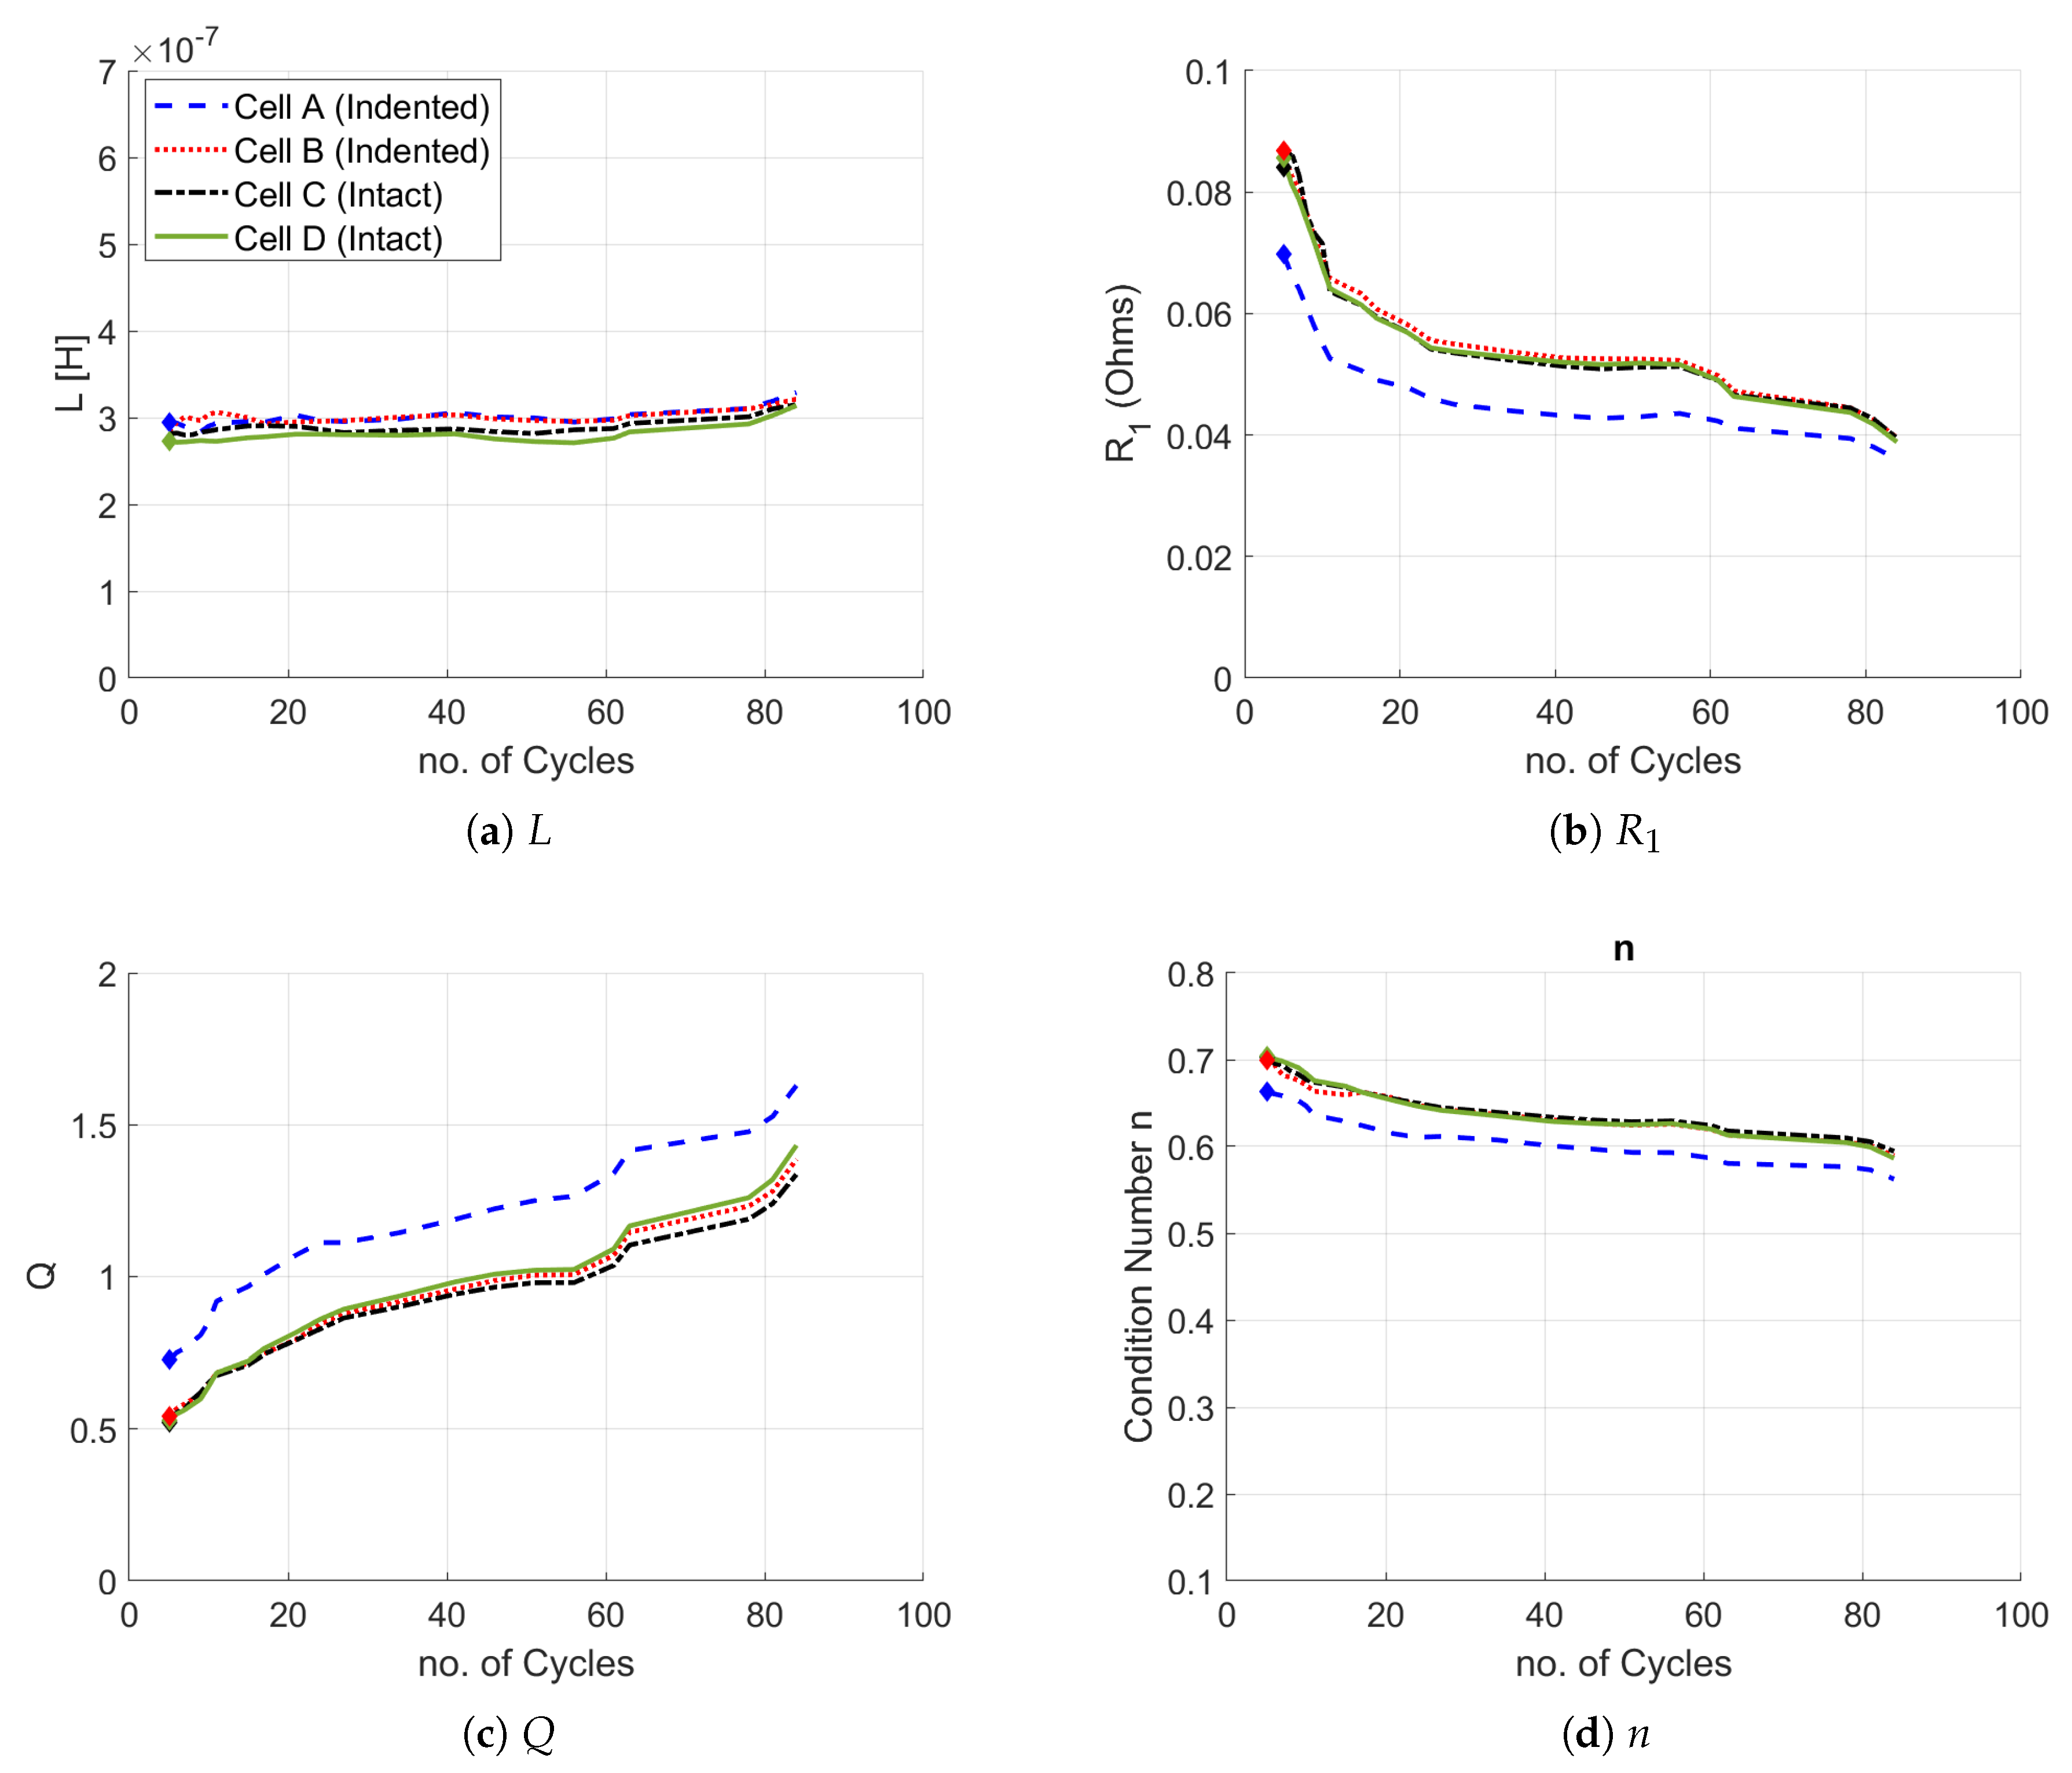
Figure 5 shows the evolution of ECM parameters with increased cycling when the cells are fully charged. The shown parameters are L, , Q, and n. The estimated values for these parameters for the cells when fully discharged are shown in Figure 6. The batteries did not show any changes in the ECM parameters before and after the indentation in either charge or discharge states.
Figure 5a and Figure 6a show that the estimated inductance, L, does not indicate significant difference between the intact and mechanically damaged cells. Estimates for cell A were always greater than the other cells in the charged tests.
Figure 5b and Figure 6b show that , the charge transfer resistance, becomes smaller with time. Cell A had a smaller than the other cells; however, the trend remained the same for all batteries. can be related to formation of Solid Electrolyte Interface (SEI). Our results corroborate other studies on aging of cells where this resistance reduces over time especially during the first 50–100 cycles [44].
Figure 5c and Figure 6c show that the estimated scaling factor, Q, increases with cycling, but the intact and indented cells show the same trend in the increased values. Figure 5d and Figure 6d show that the condition number, n, becomes smaller with increased cycling, and there is no significant difference between the intact and indented cells. Q and n define the shape of the compressed circle in the EIS plots, and represents a perfect semi-circle which is an ideal capacitor. Decrease in n results in more compressed circles and combined with increasing Q, it means that the CPE element loses capacity during cycling. Therefore, this element acts more like a resistor than a capacitor with increasing cycles. In electrochemistry, the reduced value of n is caused by the nonconformity of the surface roughness and porous structure. The loss of capacity was shown in our cycling study in Section 4.1 as well.
4.3. High-Rate Testing
In order to understand whether the trends that were observed at 0.5C and 1C can be translated to other C-rates, we performed a validation set of experiments using cells E and F, one indented and one intact as explained in Section 3.1. These cells were cycled continuously using another equipment setup, which included a BK precision power supply and electronic load with cycling software. The cells were tested inside a thermo-electric test chamber maintained at . Temperature sensors were placed on top surface and insulated from ambient air. The cycling rates included 20 cycles for each of the following rates—0.5, 1, 2, 5 and 10 amps. Cells were out of useful life at the end of these set of cycling experiments.
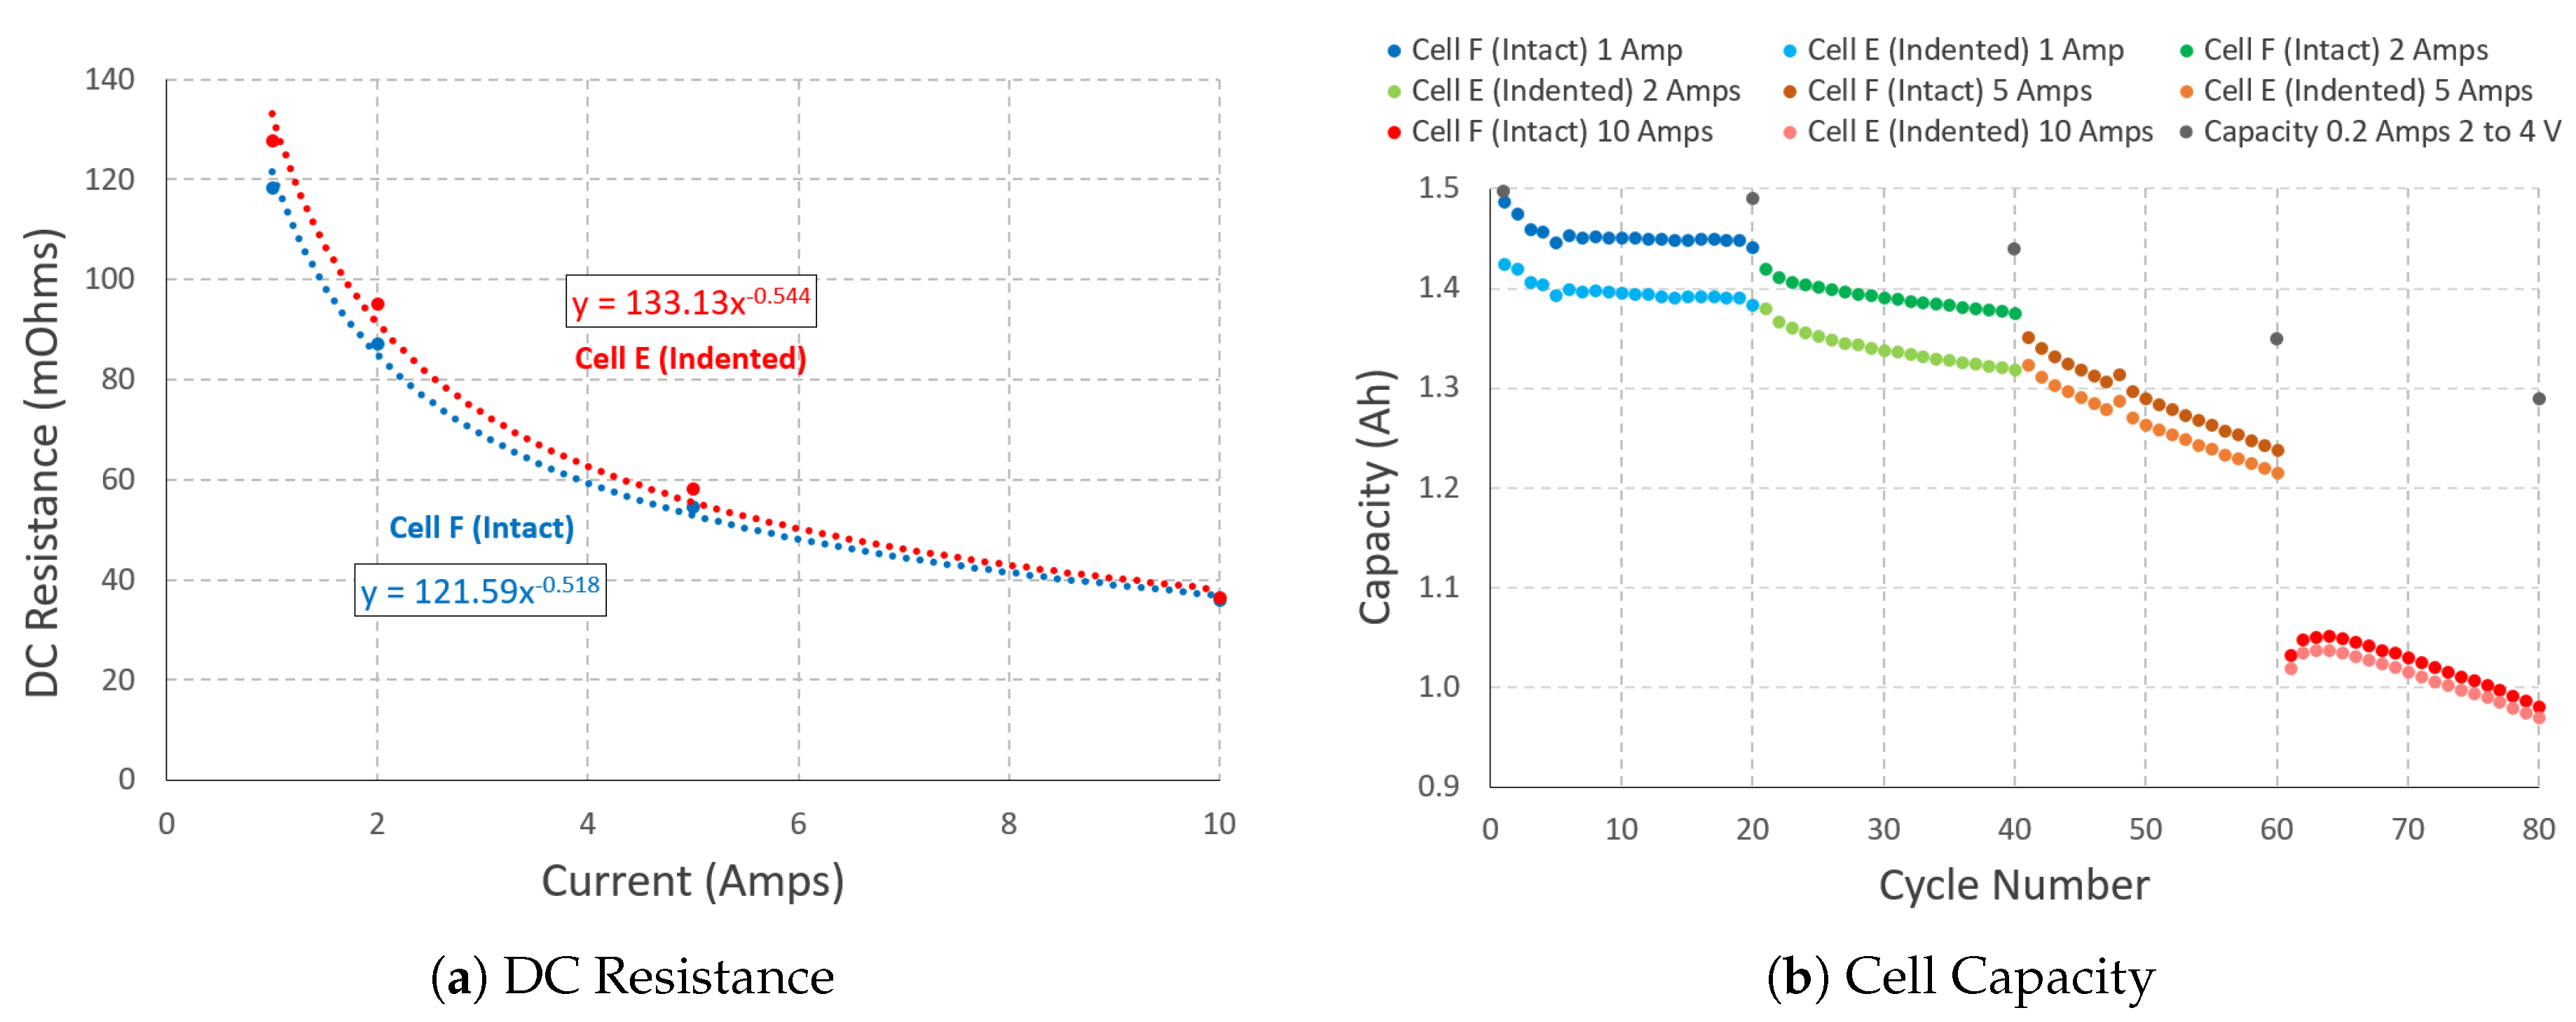
The high rate experiments followed the same trends that were observed in Section 4.1. No substantial difference was detected between indented and intact cells in these rounds of testings (see Figure 7 and Figure 8). The voltage and temperature data for these two cells at all rates were identical. Additionally, we looked into the changes in DC resistance of the cells at the end of each rate of cycling (see Figure 7a). While the DC resistance significantly decreases with the increase in the cycling rate, there was no significant difference between the DC resistance of the intact and indented cells. Figure 7b shows the capacity changes for the two cells during high rate cycling. Again, as expected, the capacity decreases at higher cycle rates; however, the two cells E (indented) and F (intact) show very similar trends.
The last investigation performed on these high rate tested cells at the end of life was an EIS measurement in the range of 10 mHz to 100 KHz (see Figure 8a). It can be observed that the two cells have the same ohmic resistance () and resistance. The EIS plots are similar until reaching Warburg tail. There is a slight difference in the slope of the Warburg tail of the two cells. In order to see if this difference existed in the previous cells tested in Section 4.1 as well, new EIS tests were performed on cells and D and plotted in the Figure 8b. It can be seen that the Warburg tail for those cells show no significant difference between indented and intact ones.
5. Discussion and Conclusions
After initial evaluation of four 18,650 Lithium-ion battery cells, two of the cells were mechanically damaged by a rigid rod indentor of 6 mm diameter. Then, all four cells underwent 89 charge/discharge cycles. Besides the parameters such as temperature, voltage, and current that are typically measured during cycling, we measured their frequency responses frequently during the experiments. We used nonlinear regression to find parameters of an Equivalent Circuit Model (ECM) that included a resistance series with an inductance and a parallel block consisted of a resistor and a constant phase element to estimate the frequency response of the cells. The validity of the results and the model were shown using K-K theorem and normalized least square error. Then the ECM components were used to infer information about the internal parameters of the batteries. All of the cells showed signs of aging both in the capacity measurements by the battery tester and with the ECM parameters. It was notable that the degradations in the parameters had very similar trends for all cells regardless of the applied mechanical indentation. There was no difference in terms of safety or capacity of the cells that were intact versus those indented. There were slight differences in the initial capacities of the cells; these differences remained unchanged during the indentation and the cycling as shown in Figure 3c and Figure 7b. Therefore, it can be concluded that the indentation did not change the cell capacity in a substantial way. With the same token there were slight difference in the initial ECM parameters of cells. Especially cell A had initial values that were higher than the other ones. However, its parameters followed the same trend as the others (see Figure 5 and Figure 6) and the difference between this cell and the others can be attributed to its initial conditions than the mechanical damage. A validation set of experiments performed with another set of cells of the same type with different equipment verified the trends even at very high rates of cycling up to the end of life of cells. Results from Section 4.3 and the deviation of the low frequency EIS plots from 45 degree Warburg tail for the indented cell underwent high-rate cycling suggest a direction for future research on the detection of mechanical indentation of LIB cells.
These results have significant positive and negative implications in terms of battery pack design and battery diagnostics—(i) a battery pack that has gone through abusive accidental loading cannot be pronounced undamaged just by measuring electrical and frequency responses; therefore, other detection methods might be necessary to find out whether deformations happened in the cells. Otherwise, an undetected indentation may remain in the cell, and cause a failure when a small additional load moves the deformation to short circuit limits, and (ii) a battery pack that has been subjected to mechanical damage as observed in this paper may not pose an immediate safety concern to first responders, and may be suitable for use until reaching a repair station, (iii) there is a potential for weight reduction of protective structure of the batteries, since a controlled deformation in extreme scenarios seen in the current study may not have drastic consequences as long as the battery is not short-circuited. Therefore, a zero deformation design policy leading to extremely heavy battery packs may prove to be an overdesign, and (iv) it should be noted that the results reported in this paper are limited to this specific type of cell and this specific type of loading until further investigation verifies validity of these results for other types of cells and other loading scenarios. There is still an open question on what type of mechanical damage should necessitate an immediate safety intervention.
Author Contributions
Conceptualization, E.S.; methodology, D.S.; software, D.S.; formal analysis, D.S. and W.L.; resources, D.S. and E.S.; data curation, D.S., M.G., W.L., P.Z., and T.C.; writing—original draft preparation, D.S., M.G., and W.L.; writing–review and editing, D.S., M.G., E.S.; visualization, M.G. and W.L.; supervision, D.S. and E.S.; project administration, E.S.; funding acquisition, D.S. and E.S. All authors have read and agreed to the published version of the manuscript.
Funding
This research was funded by the Office of Naval Research grant numbers N000141712869 and N000141912351.
Conflicts of Interest
The authors declare no conflict of interest.
References
- Wei, Z.; Zou, C.; Leng, F.; Soong, B.H.; Tseng, K. Online Model Identification and State-of-Charge Estimate for Lithium-Ion Battery With a Recursive Total Least Squares-Based Observer. IEEE Trans. Ind. Electron. 2018, 65, 1336–1346. [Google Scholar] [CrossRef]
- Barai, A.; Chouchelamane, G.H.; Guo, Y.; McGordon, A.; Jennings, P. A Study on the Impact of Lithium-Ion Cell Relaxation on Electrochemical Impedance Spectroscopy. J. Power Sources 2015, 280, 74–80. [Google Scholar] [CrossRef]
- Willard, N.; He, W.; Hendricks, C.; Pecht, M. Lessons Learned from the 787 Dreamliner Issue on Lithium-Ion Battery Reliability. Energies 2013, 6, 4682–4695. [Google Scholar] [CrossRef] [Green Version]
- Feng, X.; Sun, J.; Ouyang, M.; Wang, F.; He, X.; Lu, L.; Peng, H. Characterization of penetration induced thermal runaway propagation process within a large format lithium ion battery module. J. Power Sources 2015, 275, 261–273. [Google Scholar] [CrossRef]
- Smith, B. Chevrolet Volt Battery Incident Overview Report; Technical Report; DOT HS 811 573; NHTSA: Washington, DC, USA, 2012.
- Kermani, G.; Sahraei, E. Review: Characterization and Modeling of the Mechanical Properties of Lithium-Ion Batteries. Energies 2017, 10, 1730. [Google Scholar] [CrossRef] [Green Version]
- Kermani, G.; Sahraei, E. Dynamic impact response of lithium-ion batteries, constitutive properties and failure model. RSC Adv. 2019, 9, 2464–2473. [Google Scholar] [CrossRef] [Green Version]
- Sahraei, E.; Campbell, J.; Wierzbicki, T. Modeling and short circuit detection of 18650 Li-ion cells under mechanical abuse conditions. J. Power Sources 2012, 220, 360–372. [Google Scholar] [CrossRef]
- Sahraei, E.; Hill, R.; Wierzbicki, T. Calibration and finite element simulation of pouch lithium-ion batteries for mechanical integrity. J. Power Sources 2012, 201, 307–321. [Google Scholar] [CrossRef]
- Greve, L.; Fehrenbach, C. Mechanical testing and macro-mechanical finite element simulation of the deformation, fracture, and short circuit initiation of cylindrical Lithium ion battery cells. J. Power Sources 2012, 214, 377–385. [Google Scholar] [CrossRef]
- Ali, M.Y.; Lai, W.J.; Pan, J. Computational Models for Simulations of Lithium-Ion Battery Cells under Constrained Compression Tests. J. Power Sources 2013, 242, 325–340. [Google Scholar] [CrossRef]
- Avdeev, I.; Gilaki, M. Structural Analysis and Experimental Characterization of Cylindrical Lithium-Ion Battery Cells Subject to Lateral Impact. J. Power Sources 2014, 271, 382–391. [Google Scholar] [CrossRef]
- Sahraei, E.; Meier, J.; Wierzbicki, T. Characterizing and modeling mechanical properties and onset of short circuit for three types of lithium-ion pouch cells. J. Power Sources 2014, 247, 503–516. [Google Scholar] [CrossRef]
- Gilaki, M.; Avdeev, I. Impact modeling of cylindrical lithium-ion battery cells: A heterogeneous approach. J. Power Sources 2016, 328, 443–451. [Google Scholar] [CrossRef]
- Xu, J.; Liu, B.; Hu, D. State of Charge Dependent Mechanical Integrity Behavior of 18650 Lithium-Ion Batteries. Sci. Rep. 2016, 6, 21829. [Google Scholar] [CrossRef] [Green Version]
- Kisters, T.; Sahraei, E.; Wierzbicki, T. Dynamic Impact Tests on Lithium-Ion Cells. Int. J. Impact Eng. 2017, 108, 205–216. [Google Scholar] [CrossRef]
- Dixon, B.; Mason, A.; Sahraei, E. Effects of Electrolyte, Loading Rate and Location of Indentation on Mechanical Integrity of Li-Ion Pouch Cells. J. Power Sources 2018, 396, 412–420. [Google Scholar] [CrossRef]
- Kermani, G.; Dixon, B.; Sahraei, E. Elliptical lithium-ion batteries: Transverse and axial loadings under wet/dry conditions. Energy Sci. Eng. 2019, 7, 890–898. [Google Scholar] [CrossRef] [Green Version]
- Gilaki, M.; Sahraei, E. Effects of Temperature on Mechanical Response of Lithium Ion Batteries to External Abusive Loads. In Proceedings of the SAE World Congress, Detroit, MI, USA, 9–11 April 2009. SAE Technical Paper. [Google Scholar]
- Zhang, X.; Zhu, J.; Sahraei, E. Degradation of Battery Separators under Charge–Discharge Cycles. RSC Adv. 2017, 7, 56099–56107. [Google Scholar] [CrossRef] [Green Version]
- Luo, H.; Zhu, J.; Sahraei, E.; Xia, Y. Adhesion Strength of the Cathode in Lithium-Ion Batteries under Combined Tension/Shear Loadings. RSC Adv. 2018, 8, 3996–4005. [Google Scholar] [CrossRef] [Green Version]
- Zhu, J.; Li, W.; Xia, Y.; Sahraei, E. Testing and Modeling the Mechanical Properties of the Granular Materials of Graphite Anode. J. Electrochem. Soc. 2018, 165, A1160. [Google Scholar] [CrossRef]
- Sahraei, E.; Kahn, M.; Meier, J.; Wierzbicki, T. Modelling of Cracks Developed in Lithium-Ion Cells under Mechanical Loading. RSC Adv. 2015, 5, 80369–80380. [Google Scholar] [CrossRef]
- Sahraei, E.; Bosco, E.; Dixon, B.; Lai, B. Microscale Failure Mechanisms Leading to Internal Short Circuit in Li-Ion Batteries under Complex Loading Scenarios. J. Power Sources 2016, 319, 56–65. [Google Scholar] [CrossRef]
- Sahraei, E.; Hill, R.L.; Wierzbicki, T. Modeling of Lithium-Ion Cylindrical Batteries for Mechanical Integrity: Experiments, Calibrations, and Validation. In Proceedings of the Battery Congress, Detroit MI, USA, 11–12 April 2011. [Google Scholar]
- Kalnaus, S.; Wang, H.; Watkins, T.R.; Kumar, A.; Simunovic, S.; Turner, J.A.; Gorney, P. Effect of packaging and cooling plates on mechanical response and failure characteristics of automotive Li-ion battery modules. J. Power Sources 2018, 403, 20–26. [Google Scholar] [CrossRef]
- Zhang, X.; Sahraei, E.; Wang, K. Li-Ion Battery Separators, Mechanical Integrity and Failure Mechanisms Leading to Soft and Hard Internal Shorts. Sci. Rep. 2016, 6, 32578. [Google Scholar] [CrossRef] [Green Version]
- Zhang, X.; Sahraei, E.; Wang, K. Deformation and Failure Characteristics of Four Types of Lithium-Ion Battery Separators. J. Power Sources 2016, 327, 693–701. [Google Scholar] [CrossRef]
- Zhu, J.; Zhang, X.; Luo, H.; Sahraei, E. Investigation of the Deformation Mechanisms of Lithium-Ion Battery Components Using in-Situ Micro Tests. Appl. Energy 2018, 224, 251–266. [Google Scholar] [CrossRef]
- Mikolajczak, C.; Kahn, M.; White, K.; Long, R.T. Lithium-Ion Batteries Hazard and Use Assessment; SpringerBriefs in Fire; Springer: Boston, MA, USA, 2011. [Google Scholar]
- Stephens, D.; Shawcross, P.; Stout, G.; Sullivan, E.; Saunders, J.; Risser, S.; Sayre, J. Lithium-Ion Battery Safety Issues for Electric and Plug-in Hybrid Vehicles; Technical Report DOT HS 812 418; National Highway Traffic Safety Administration: Washington, DC, USA, 2017.
- Li, Z.; Xiong, R.; Mu, H.; He, H.; Wang, C. A Novel Parameter and State-of-Charge Determining Method of Lithium-Ion Battery for Electric Vehicles. Appl. Energy 2017, 207, 363–371. [Google Scholar] [CrossRef]
- Zeng, Z.; Tian, J.; Li, D.; Tian, Y. An Online State of Charge Estimation Algorithm for Lithium-Ion Batteries Using an Improved Adaptive Cubature Kalman Filter. Energies 2018, 11, 59. [Google Scholar] [CrossRef] [Green Version]
- Xia, B.; Lao, Z.; Zhang, R.; Tian, Y.; Chen, G.; Sun, Z.; Wang, W.; Sun, W.; Lai, Y.; Wang, M.; et al. Online Parameter Identification and State of Charge Estimation of Lithium-Ion Batteries Based on Forgetting Factor Recursive Least Squares and Nonlinear Kalman Filter. Energies 2017, 11, 3. [Google Scholar] [CrossRef] [Green Version]
- Andre, D.; Meiler, M.; Steiner, K.; Wimmer, C.; Soczka-Guth, T.; Sauer, D. Characterization of High-Power Lithium-Ion Batteries by Electrochemical Impedance Spectroscopy. I. Experimental Investigation. J. Power Sources 2011, 196, 5334–5341. [Google Scholar] [CrossRef]
- Lohmann, N.; Weßkamp, P.; Haußmann, P.; Melbert, J.; Musch, T. Electrochemical Impedance Spectroscopy for Lithium-Ion Cells: Test Equipment and Procedures for Aging and Fast Characterization in Time and Frequency Domain. J. Power Sources 2015, 273, 613–623. [Google Scholar] [CrossRef]
- Cui, Y.; Zuo, P.; Du, C.; Gao, Y.; Yang, J.; Cheng, X.; Ma, Y.; Yin, G. State of Health Diagnosis Model for Lithium Ion Batteries Based on Real-Time Impedance and Open Circuit Voltage Parameters Identification Method. Energy 2018, 144, 647–656. [Google Scholar] [CrossRef]
- Chen, L.; Lü, Z.; Lin, W.; Li, J.; Pan, H. A New State-of-Health Estimation Method for Lithium-Ion Batteries through the Intrinsic Relationship between Ohmic Internal Resistance and Capacity. Measurement 2018, 116, 586–595. [Google Scholar] [CrossRef]
- Barsoukov, E.; Macdonald, J.R. (Eds.) Impedance Spectroscopy: Theory, Experiment, and Applications, 2nd ed.; Wiley-Interscience: Hoboken, NJ, USA, 2005. [Google Scholar]
- Samadani, E.; Farhad, S.; Scott, W.; Mastali, M.; Gimenez, L.E.; Fowler, M.; Fraser, R.A. Empirical Modeling of Lithium-Ion Batteries Based on Electrochemical Impedance Spectroscopy Tests. Electrochim. Acta 2015, 160, 169–177. [Google Scholar] [CrossRef]
- Boukamp, B.A. A Linear Kronig-Kramers Transform Test for Immittance Data Validation. J. Electrochem. Soc. 1995, 142, 1885–1894. [Google Scholar] [CrossRef]
- Stacy, A.; Gilaki, M.; Sahraei, E.; Soudbakhsh, D. Investigating the Effects of Mechanical Damage on Electrical Response of Li-ion Pouch Cells. In Proceedings of the 2020 American Control Conference, Denver, CO, USA, 1–3 July 2020; pp. 1715–1720. [Google Scholar]
- Derakhshan, M.; Gilaki, M.; Stacy, A.; Sahraei, E.; Soudbakhsh, D. Bending Detection of Li-Ion Pouch Cells Using Impedance Spectra. In Proceedings of the DSCC-Dynamic Systems & Control Conference 2020, Pittsburgh, PA, USA, 7–9 October 2020. to appear. [Google Scholar]
- Pastor-Fernández, C.; Uddin, K.; Chouchelamane, G.H.; Widanage, W.D.; Marco, J. A Comparison between Electrochemical Impedance Spectroscopy and Incremental Capacity-Differential Voltage as Li-Ion Diagnostic Techniques to Identify and Quantify the Effects of Degradation Modes within Battery Management Systems. J. Power Sources 2017, 360, 301–318. [Google Scholar] [CrossRef]
- Vector Network Analyzer-Bode 100. Available online: https://www.omicron-lab.com (accessed on 19 August 2020).
Figure 1.
(a) Disassembled battery showing jellyroll and casing, (b) Force-displacement and voltage of cell 0 and cell E, (c) Indentation test of cell 0, (d) Experimental Setup shows the Vector Network Analyzer, the battery cell, and a thermal camera, (e) The equivalent electrical circuit including an inductor, resistors, and constant phase elements (CPEs) (see text), (f) An example of the EIS plot (cell B).

Figure 2.
(a) Voltage-capacity curves for cells A-D during discharge, cycle 05, (b) Voltage-capacity curves for cells A-D during discharge, cycle 89.
Figure 2.
(a) Voltage-capacity curves for cells A-D during discharge, cycle 05, (b) Voltage-capacity curves for cells A-D during discharge, cycle 89.

Figure 3.
(a) Voltage-discharge capacity for various cycles, cell B, (b) Temperature change during discharge for various cycles, cell B (Temperature reaches maximum at the end of discharge time, i.e., 120 min for 750 mA and 60 min for 1500 mA discharge rates), (c) Variation of charge capacity during cell cycling.

Figure 4.
Measured impedance spectra versus expected values, (a) Electrochemical Impedance Spectroscopy (EIS) plot, versus Expected values using K-K transforms, (b) EIS plot, versus the ECM model, (c) Bode diagram, versus the Equivalent Circuit Model (ECM) model, (d) Real and Imaginary parts of impedance versus the ECM model.

Figure 5.
Trend of changes in parameters for all cells with cycling, (a) L, (b) , (c) Q, (d) n, charged.
Figure 5.
Trend of changes in parameters for all cells with cycling, (a) L, (b) , (c) Q, (d) n, charged.

Figure 6.
Trend of changes in parameters for all cells with cycling, (a) L, (b) , (c) Q, (d) n, discharged.
Figure 6.
Trend of changes in parameters for all cells with cycling, (a) L, (b) , (c) Q, (d) n, discharged.

Figure 7.
Testing batteries at high C-rates: (a) DC Resistance, (b) Capacity change over cycle number.
Figure 7.
Testing batteries at high C-rates: (a) DC Resistance, (b) Capacity change over cycle number.

Figure 8.
EIS plots of high-rate tested cells as described in Section 4.3.
Figure 8.
EIS plots of high-rate tested cells as described in Section 4.3.


Table 1.
Cycling procedure.
| Charge Procedure | Discharge Procedure | |
|---|---|---|
| Cycle 1–63 | CC charge at 750 mA | CC discharge at 750 mA |
| CV charge at 3.65 V | cut-off voltage: 2.5 V | |
| Cycle 64–89 | CC charge at 1500 mA | CC discharge at 1500 mA |
| CV charge at 3.65 V | cut-off voltage: 2.5 V |
© 2020 by the authors. Licensee MDPI, Basel, Switzerland. This article is an open access article distributed under the terms and conditions of the Creative Commons Attribution (CC BY) license (http://creativecommons.org/licenses/by/4.0/).
Share and Cite
MDPI and ACS Style
Soudbakhsh, D.; Gilaki, M.; Lynch, W.; Zhang, P.; Choi, T.; Sahraei, E. Electrical Response of Mechanically Damaged Lithium-Ion Batteries. Energies 2020, 13, 4284. https://doi.org/10.3390/en13174284
AMA Style
Soudbakhsh D, Gilaki M, Lynch W, Zhang P, Choi T, Sahraei E. Electrical Response of Mechanically Damaged Lithium-Ion Batteries. Energies. 2020; 13(17):4284. https://doi.org/10.3390/en13174284
Chicago/Turabian StyleSoudbakhsh, Damoon, Mehdi Gilaki, William Lynch, Peilin Zhang, Taeyoung Choi, and Elham Sahraei. 2020. "Electrical Response of Mechanically Damaged Lithium-Ion Batteries" Energies 13, no. 17: 4284. https://doi.org/10.3390/en13174284
Note that from the first issue of 2016, this journal uses article numbers instead of page numbers. See further details here.