Degradation of Hydrophobic, Anti-Soiling Coatings for Solar Module Cover Glass
by
 , and
, and
Fabiana Lisco
1,*, 
Farwah Bukhari
1,
Soňa Uličná
1,
Kenan Isbilir
1,
Kurt L. Barth
2,
Alan Taylor
3 and
John M. Walls
1,* 1
Centre for Renewable Energy Systems Technology (CREST), Wolfson School of Mechanical, Electrical and Manufacturing Engineering, Loughborough University, Loughborough, Leicestershire LE11 3TU, UK
2
Department of Mechanical Engineering, Colorado State University, Fort Collins, CO 80523, USA
3
TWI, Granta Park, Great Abington, Cambridge CB21 6AL, UK
*
Authors to whom correspondence should be addressed.
Energies 2020, 13(15), 3811; https://doi.org/10.3390/en13153811
Submission received: 22 June 2020
/
Revised: 20 July 2020
/
Accepted: 21 July 2020
/
Published: 24 July 2020
(This article belongs to the Section A2: Solar Energy and Photovoltaic Systems)
Abstract
:Soiling of solar module cover glass is a serious problem for solar asset managers. It causes a reduction in power output due to attenuation of the incident light, and reduces the return on investment. Regular cleaning is required to mitigate the effect but this is a costly procedure. The application of transparent hydrophobic, anti-soiling coatings to the cover glass is a promising solution. These coatings have low surface energy and contaminants do not adhere well. Even if soiling does remain on the coated surface, it is much more easily removed during cleaning. The performance of the coatings is determined using the water contact angle and roll-off angle measurements. However, although hydrophobic coatings hold out great promise, outdoor testing revealed degradation that occurs surprisingly quickly. In this study, we report on results using laboratory-based damp heat and UV exposure environmental tests. We used SEM surface imaging and XPS surface chemical analysis to study the mechanisms that lead to coating degradation. Loss of surface fluorine from the coatings was observed and this appeared to be a major issue. Loss of nanoparticles was also observed. Blistering of surfaces also occurs, leading to loss of coating material. This was probably due to the movement of retained solvents and was caused by insufficient curing. This mechanism is avoidable if care is taken for providing and carrying out carefully specified curing conditions. All these symptoms correlate well with observations taken from parallel outdoor testing. Identification of the mechanisms involved will inform the development of more durable anti-soiling, hydrophobic coatings for solar application.
1. Introduction
The deployment of photovoltaics (PV) has grown at an extraordinary rate over the last decade. The manufacturing output of solar modules was reported to be 102 GW in 2018 and there is now over 500 GW of cumulative installed capacity worldwide [1]. With increasing deployment in solar utilities, asset managers are becoming aware of operational issues that can significantly reduce the return on investment. Soiling is the accumulation of dust, sand, bird droppings, and salts from rain or cleaning water on the surface of solar modules. Soiling of the cover glass and the cost of cleaning is recognized as a major issue by the industry. Soiling attenuates the light and reduces transmission to the absorber. This can cause the electrical power output from a module to be reduced by typically 10% in northern temperate latitudes and by up to 50% in arid, dusty regions [2]. Soiling was studied for over 50 years and numerous studies were conducted to analyze the soiling effect [3,4]. Reduction in PV energy generation due to the accumulation of soiling varies according to local climate and environmental conditions. Paradoxically, the problem is often most acute in those regions of the world with the best solar resource, such as India, the MENA (Middle-East and North Africa) region, and sub-Saharan Africa, as modules in these near equatorial regions are held close to horizontal, and cleaning with water is expensive.
Operation and Maintenance (O&M) contracts often stipulate that solar utilities must be cleaned twice per year. This is arbitrary and might be too frequent or infrequent, depending on the local conditions. Module cover glass surfaces are usually cleaned manually using clean water or sometimes automatically using robotic systems. In many regions, clean water is a precious commodity and its use to clean solar panels is wasteful. The installation of expensive robotic systems increases cost and requires power. Repetitive cleaning can also cause damage to the cover glass surface or the active module, where micro-cracks can occur in silicon, due to mechanical stress. Clearly, the industry would choose to move away from manual or robotic cleaning and prefer the modules to be “self-cleaning”. Research activity towards this goal has increased, but an effective long-term solution has not yet been found [5].
Hydrophobic coatings are employed in related fields like displays or on spectacle lenses, to create a low energy surface that is less easy to soil and more easy to clean. Use of these coatings for module cover glass would have obvious benefits if their durability was sufficient. Displays and lenses are mostly used indoors and their life cycle is relatively short. For example, the lifetime of a spectacle lens is typically only 2 years, due to changes in the prescription, fashion, or simply wear and tear. In contrast, a solar module is mounted outdoors for 24 h per day and is warranted for 25 years. The module is angled to face the sun and is exposed to high fluxes of UV light as well as rain, hail, and snow. This is combined with exposure to temperature and humidity fluctuations. The environmental stresses experienced by a coating on a module cover glass are comparatively extreme [6,7,8,9].
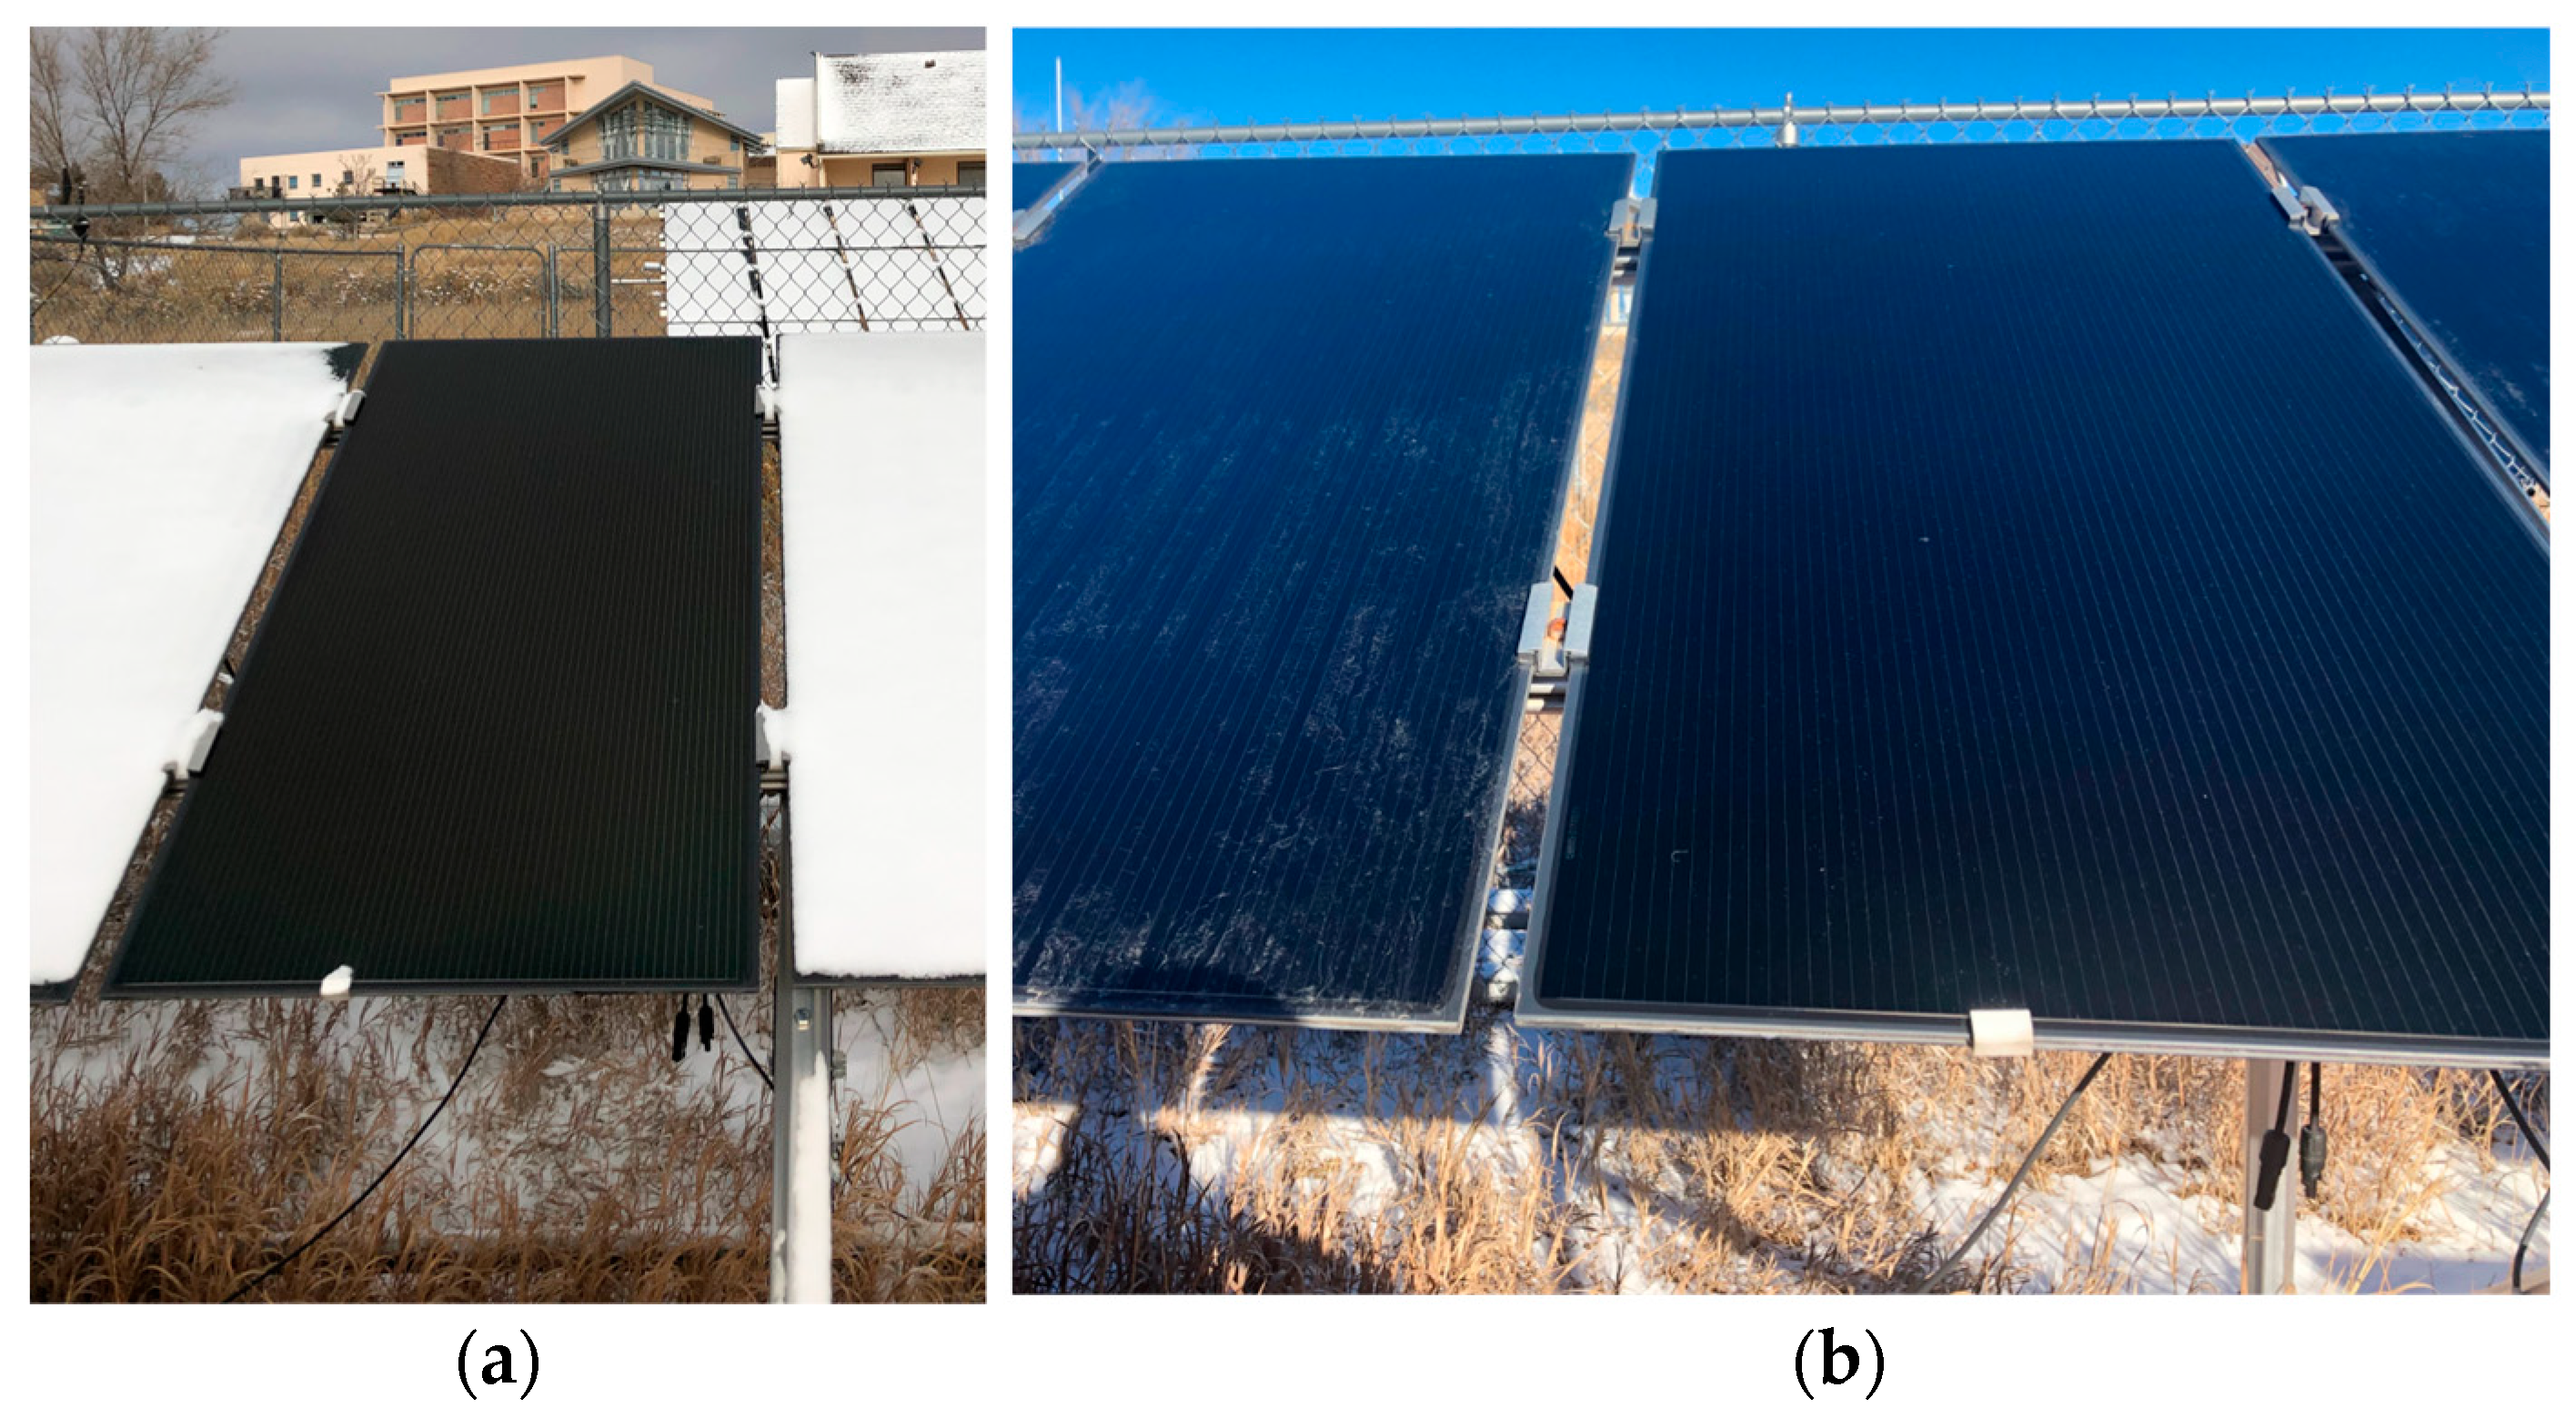
In this study, we report on tests carried out on a range of commercially available hydrophobic coatings. However, none of the other applications expose the coating continuously to outdoor conditions. The aim of the study was to identify potential candidate coatings for the PV module cover glass application. In particular, our objective was to identify the types and causes of degradation that needs to be addressed if this type of coating is to be used by the solar industry. Solar panels with a hydrophobic coating were shown to outperform panels with no coating [10]. The effect of applying a hydrophobic coating on a solar module is demonstrated in Figure 1. This shows an outdoor solar field maintained at Colorado State University in Fort Collins, Colorado. After snowfall, the coated module was fully operational, while the other panels retained snow coverage and produced no power (see Figure 1a). After the snow melt, soiling residues were clearly visible on the uncoated adjacent panels, while the coated panel remained clean (see Figure 1b), [7]. These results confirmed the exciting potential of hydrophobic coatings for anti-soiling.
2. Background
Hydrophilic coatings typically used to coat windows and mirrors are designed to allow water drops to merge and form a film of water. These coatings were applied on module cover glass so that water will ‘sheet’ across the glass surface and as it drops to the bottom of the module, photo-catalytically remove contamination [11,12,13]. These coatings are high surface energy and can lead to increased soiling in the absence of water. They tend not to have long lifetimes and might also contribute to the occurrence of potential induced degradation (PID) of the PV module, by promoting sodium ion migration from the cover glass [14].
The use of hydrophobic and super-hydrophobic coatings is becoming of greater interest for application in the PV industry, to mitigate the effects of soiling of module surfaces. The hydrophobicity of a coating is determined by measuring the water contact angle (WCA) of a water droplet resting on the surface. A surface is considered hydrophobic if the WCA > 90° or super-hydrophobic if it demonstrates WCA > 150° [15]. Hydrophobic coatings have low surface energy and reduce the adhesion of dust particles to the glass surface, thereby, reducing the level of soiling and enhancing the cleaning effect of rain and wind [5]. Such highly-repellent surface properties, which are inherent to many natural surfaces, derive from either specific surface texture or chemical composition. The most popular example is the lotus leaf naturally exhibiting WCA’s of ~ 160° and roll off angle (RoA) below 5° [16,17]. Many materials were developed in recent years to produce self-cleaning hydrophobic surfaces similar to those observed in nature.
Usually organic molecules like stearic acid, fluoroalkyl-silane molecules on the coating surface are used to enhance hydrophobicity. A selection of resins, acrylates, silanes, and siloxanes polymeric structures can be used in the coating formulation. For example, trimethylethoxysilane (TMES) and tetraethylorthosilicates (TEOS) were used to obtain thermally stable, highly durable, and optically transparent hydrophobic coatings [7]. These formulations can be combined with nanoparticle technology to achieve increased hydrophobic properties.
In addition to hydrophobicity, coatings designed for PV module cover glass have to possess properties such as transparency, UV resistance, hardness, and durability. Durability is a significant challenge for solar applications since the hydrophobic properties of existing coatings tend to deteriorate early in the module service life [17]. Consequently, it is necessary to identify and understand the degradation of coating materials to make possible the development of a long service, self-cleaning, and durable transparent hydrophobic coating for solar module cover glass.
3. Testing Protocols and Analysis Techniques
Methods to test the performance and durability of hydrophobic coatings for PV cover glass were described previously [1,18]. Tests used to assess the performance of hydrophobic coatings include optical transmission and reflection, water contact angle, and roll-off angle. Methods used to determine durability are based on IEC 61646:2008 tests for photovoltaic modules and include damp heat (DH), ultraviolet (UV) exposure, thermal cycling, adhesion, and water solubility. In addition, tests such as sand erosion and rain drop simulation were specifically designed for this application. Abrasion tests are also required to simulate exposure to cleaning methods. In this study, we have restricted the environmental testing to DH and UV exposure since these two tests caused degradation to of all of the tested coatings.
Glass substrates used for this study varied from soda-lime glass, with 1 mm or 3 mm thickness to toughened glass typically used for display applications. Durability tests were performed on a variety of hydrophobic coatings supplied by the coating manufacturers or developers. The coatings tested were either vacuum evaporated or solution processed. Solution processing was performed by dipping or spraying. The results presented are from different coatings and are intended to show the types of degradation that were observed. For simplicity, the coatings are as follows—vacuum deposited (Coating A) and solution processed, either spray- (Coating B) or dip-coated (Coating C)), as set out in Table 1.
3.1. Damp Heat Test
The hydrophobic coatings were exposed to a damp heat test at 85 °C and 85% relative humidity (RH). The surfaces were exposed for a total of 1000 h with intermediate optical, water contact, and roll-off angle measurements and observations of surface morphology, at 250 h and 500 h.
3.2. UV Exposure Test
The UV exposure test was applied to hydrophobic coated surfaces for up to 2000 h, with intermediate checks to monitor the effects of UV, and identify the starting point of coating degradation. The test was conducted with wavelengths between 280 nm and 400 nm, and a minimum of 15 kWh/m2 of UV light, with a 3% to 10% of the total energy in the UVB light range (according to the BS EN 61215-2 [19]).
3.3. Analysis Methods
The hydrophobic performance, optical quality, morphology, and chemical composition of the coatings were tested prior to and after exposure to the environmental stress tests. Intermediate checks were performed to monitor the onset of degradation. Optical performance was assessed using a Varian Cary® UV-VIS 5000 spectrophotometer measuring direct transmittance and reflectance in the wavelength range of 200–1200 nm. The hydrophobic performance of the coatings was measured using WCA and RoA of the droplets on the coated surface. A Dataphysics OCA 20 contact angle measurement system was used for WCA measurements using 2 μL of DI water droplets. A bespoke system was used to measure RoA of droplets formed from 30 μL of DI water.
Changes to surface morphology were monitored using a scanning electron microscope (SEM-Joel® 7100F and Leo 1530 VP FEG-SEM). A transmission electron microscope (TEM-Tecnai F20) was used to detect the presence of nanoparticles (NPs) incorporated in some of the coatings. Changes to surface chemistry were monitored using a Thermo Scientific, K-alpha X-ray photoelectron spectrometer (XPS).
4. Results
The durability of a coating was determined by its ability to withstand mechanical and environmental stresses that simulated various weather patterns, cleaning methods, and handling of the modules. The coatings would be exposed to similar stresses during real outdoor PV module operation. Coating degradation was characterized by physical and chemical changes taking place at the surface and across the bulk of the coating. In this work, we identified the common failure modes on a range of hydrophobic coatings, after being subjected to prolonged UV and DH exposure. Identifying these degradation modes would be useful for the future development of second-generation hydrophobic anti-soiling coatings suitable for the PV application [20,21].
4.1. Degradation Mode: Fluorine Loss from the Coating Surface
Most commercially available hydrophobic coatings achieve high water contact angles by incorporating fluorinated alkyl groups. Our studies showed that fluorinated hydrophobic coatings are susceptible to damage under UV radiation, where exposure leads to loss of fluorine, and an associated rapid deterioration in the WCA and RoA [20].
Test coupons coated with a hydrophobic coating used to coat ophthalmic lenses and smartphones were subject to the UV exposure test. Coating A was deposited in vacuum using thermal evaporation and contained silica nanoparticles dispersed in a polymer matrix. The effect of UV exposure on the WCA and RoA was measured; shown in Figure 2. The WCA and RoA both degraded with increasing UV exposure. The WCA reduced from ~118° to ~87° and the RoA increased from ~15° to ~60°, after 500 h of exposure. However, no optical degradation was observed, and the coupons maintained their original transparency across the measured wavelength range (200 nm–1500 nm).
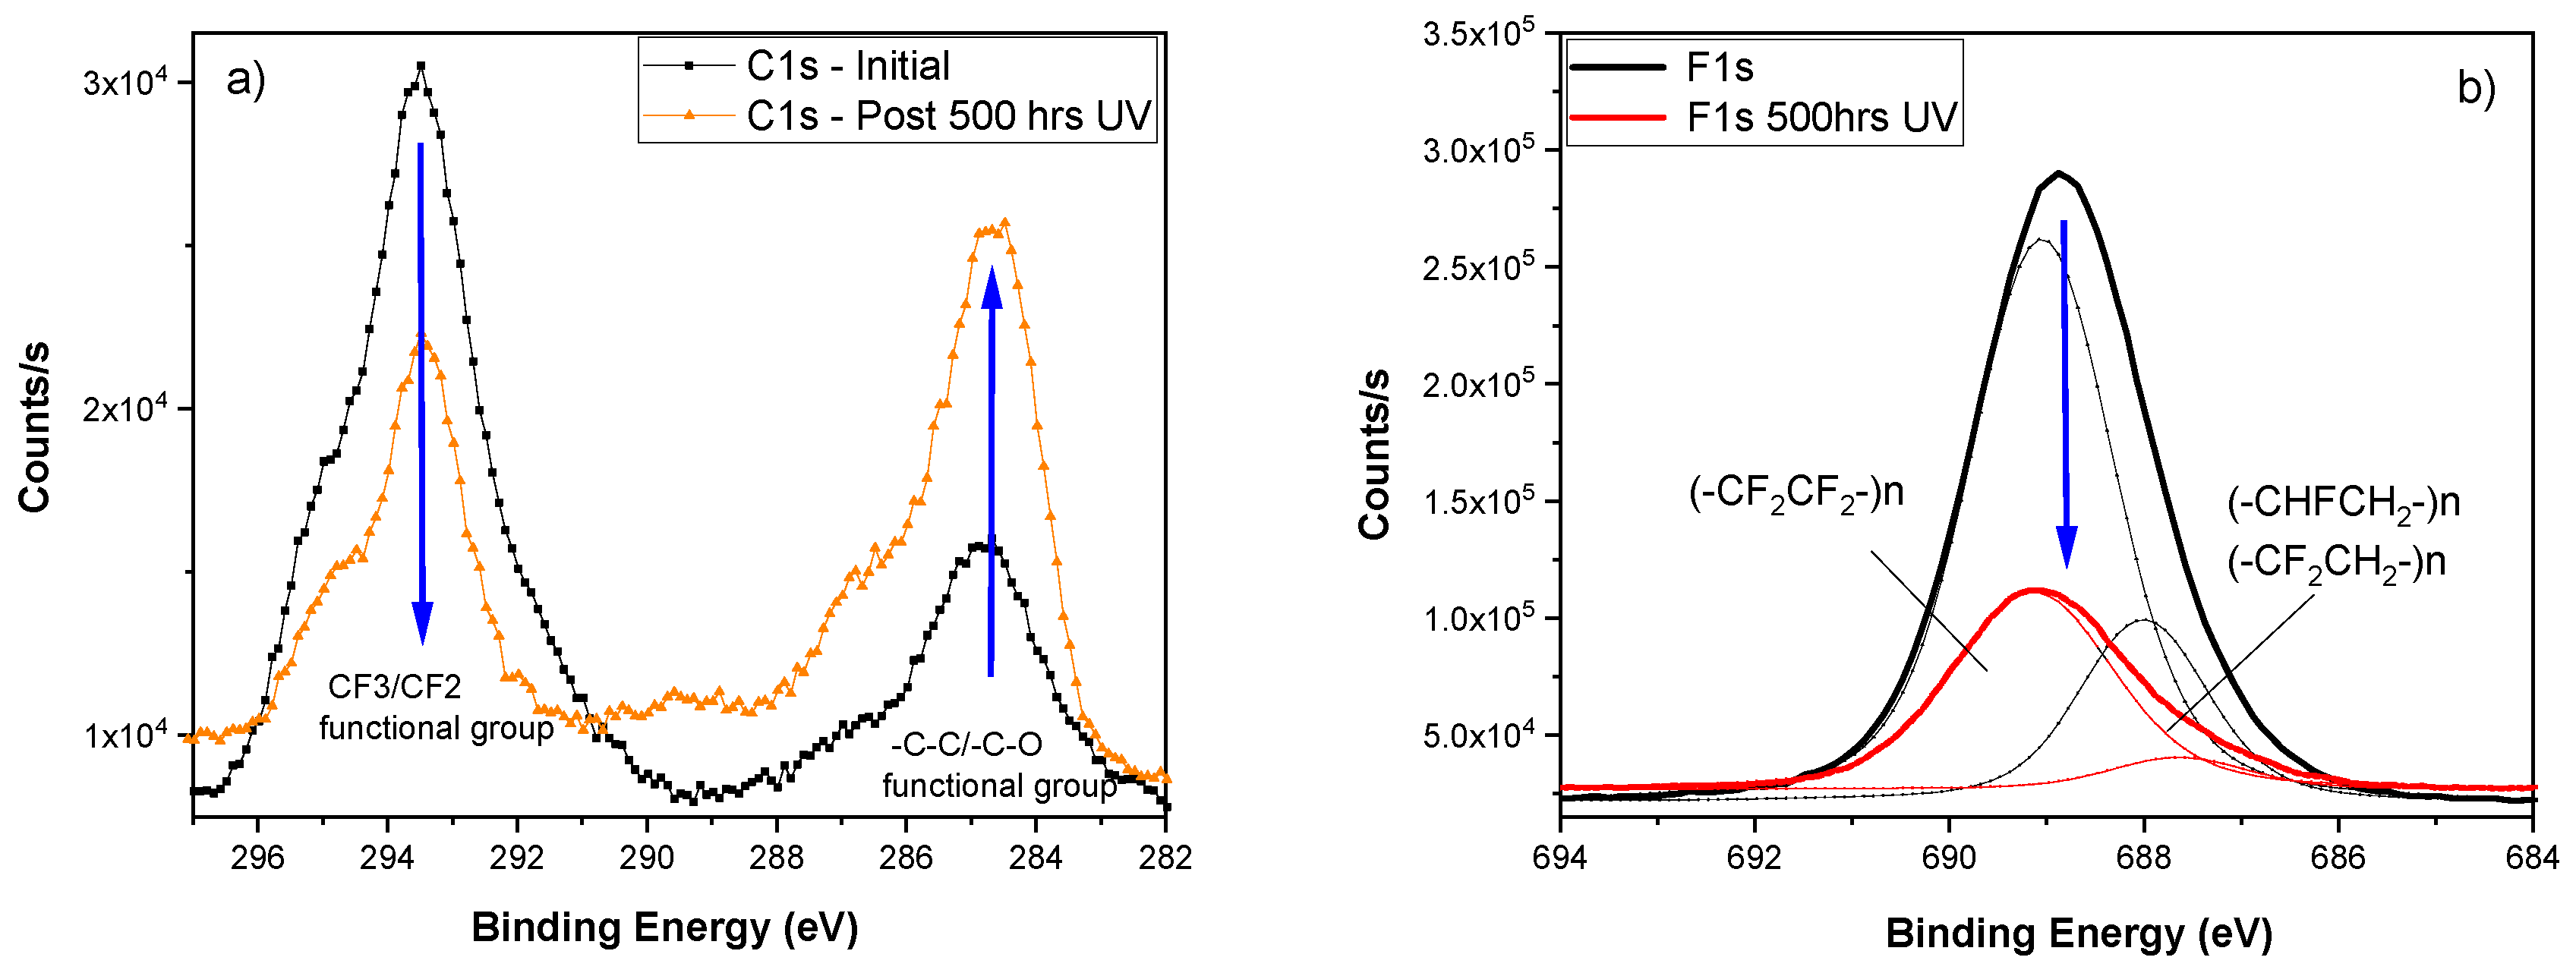
Surface chemical analysis using XPS was used to monitor the C1s and F1s peaks of these hydrophobic coatings, before and after UV exposure. Figure 3 shows high resolution XPS spectra at 0 and 500 h of UV exposure. The analysis reveals a significant decrease in the fluorine concentration at the surface of the coating, with approximately 34% loss. As shown in Figure 2, the CF3/CF2 contribution (~294–292 eV) decreased in favor of the C-C/-C-O functional groups (~286–284.8 eV). After 500 h of UV exposure, the F/O ratio decreased from approximately 2 to 0.3, as the F/C ratio decreased from approximately 1.7 to 0.3. The loss of fluorine was caused by breaking of the C-C polymer chain. The UV radiation at 340 nm wavelength had sufficient energy to break the C-C bonds, with the consequent loss of CFx functional groups. After 2000 h of UV exposure, the fluorine concentration was further reduced with an overall loss of 57%. These coatings were also subjected separately to DH, which also resulted in a loss of fluorine from the coating surface. A 37% decrease in F occurred after 1000 h of DH (as shown in Figure 3a). The loss of fluorine correlated with the decrease in hydrophobicity. The oxygen concentration increased following UV exposure. XPS analysis showed the O/C ratio increasing from 0.6 to 0.9, following 2000 h of UV exposure.
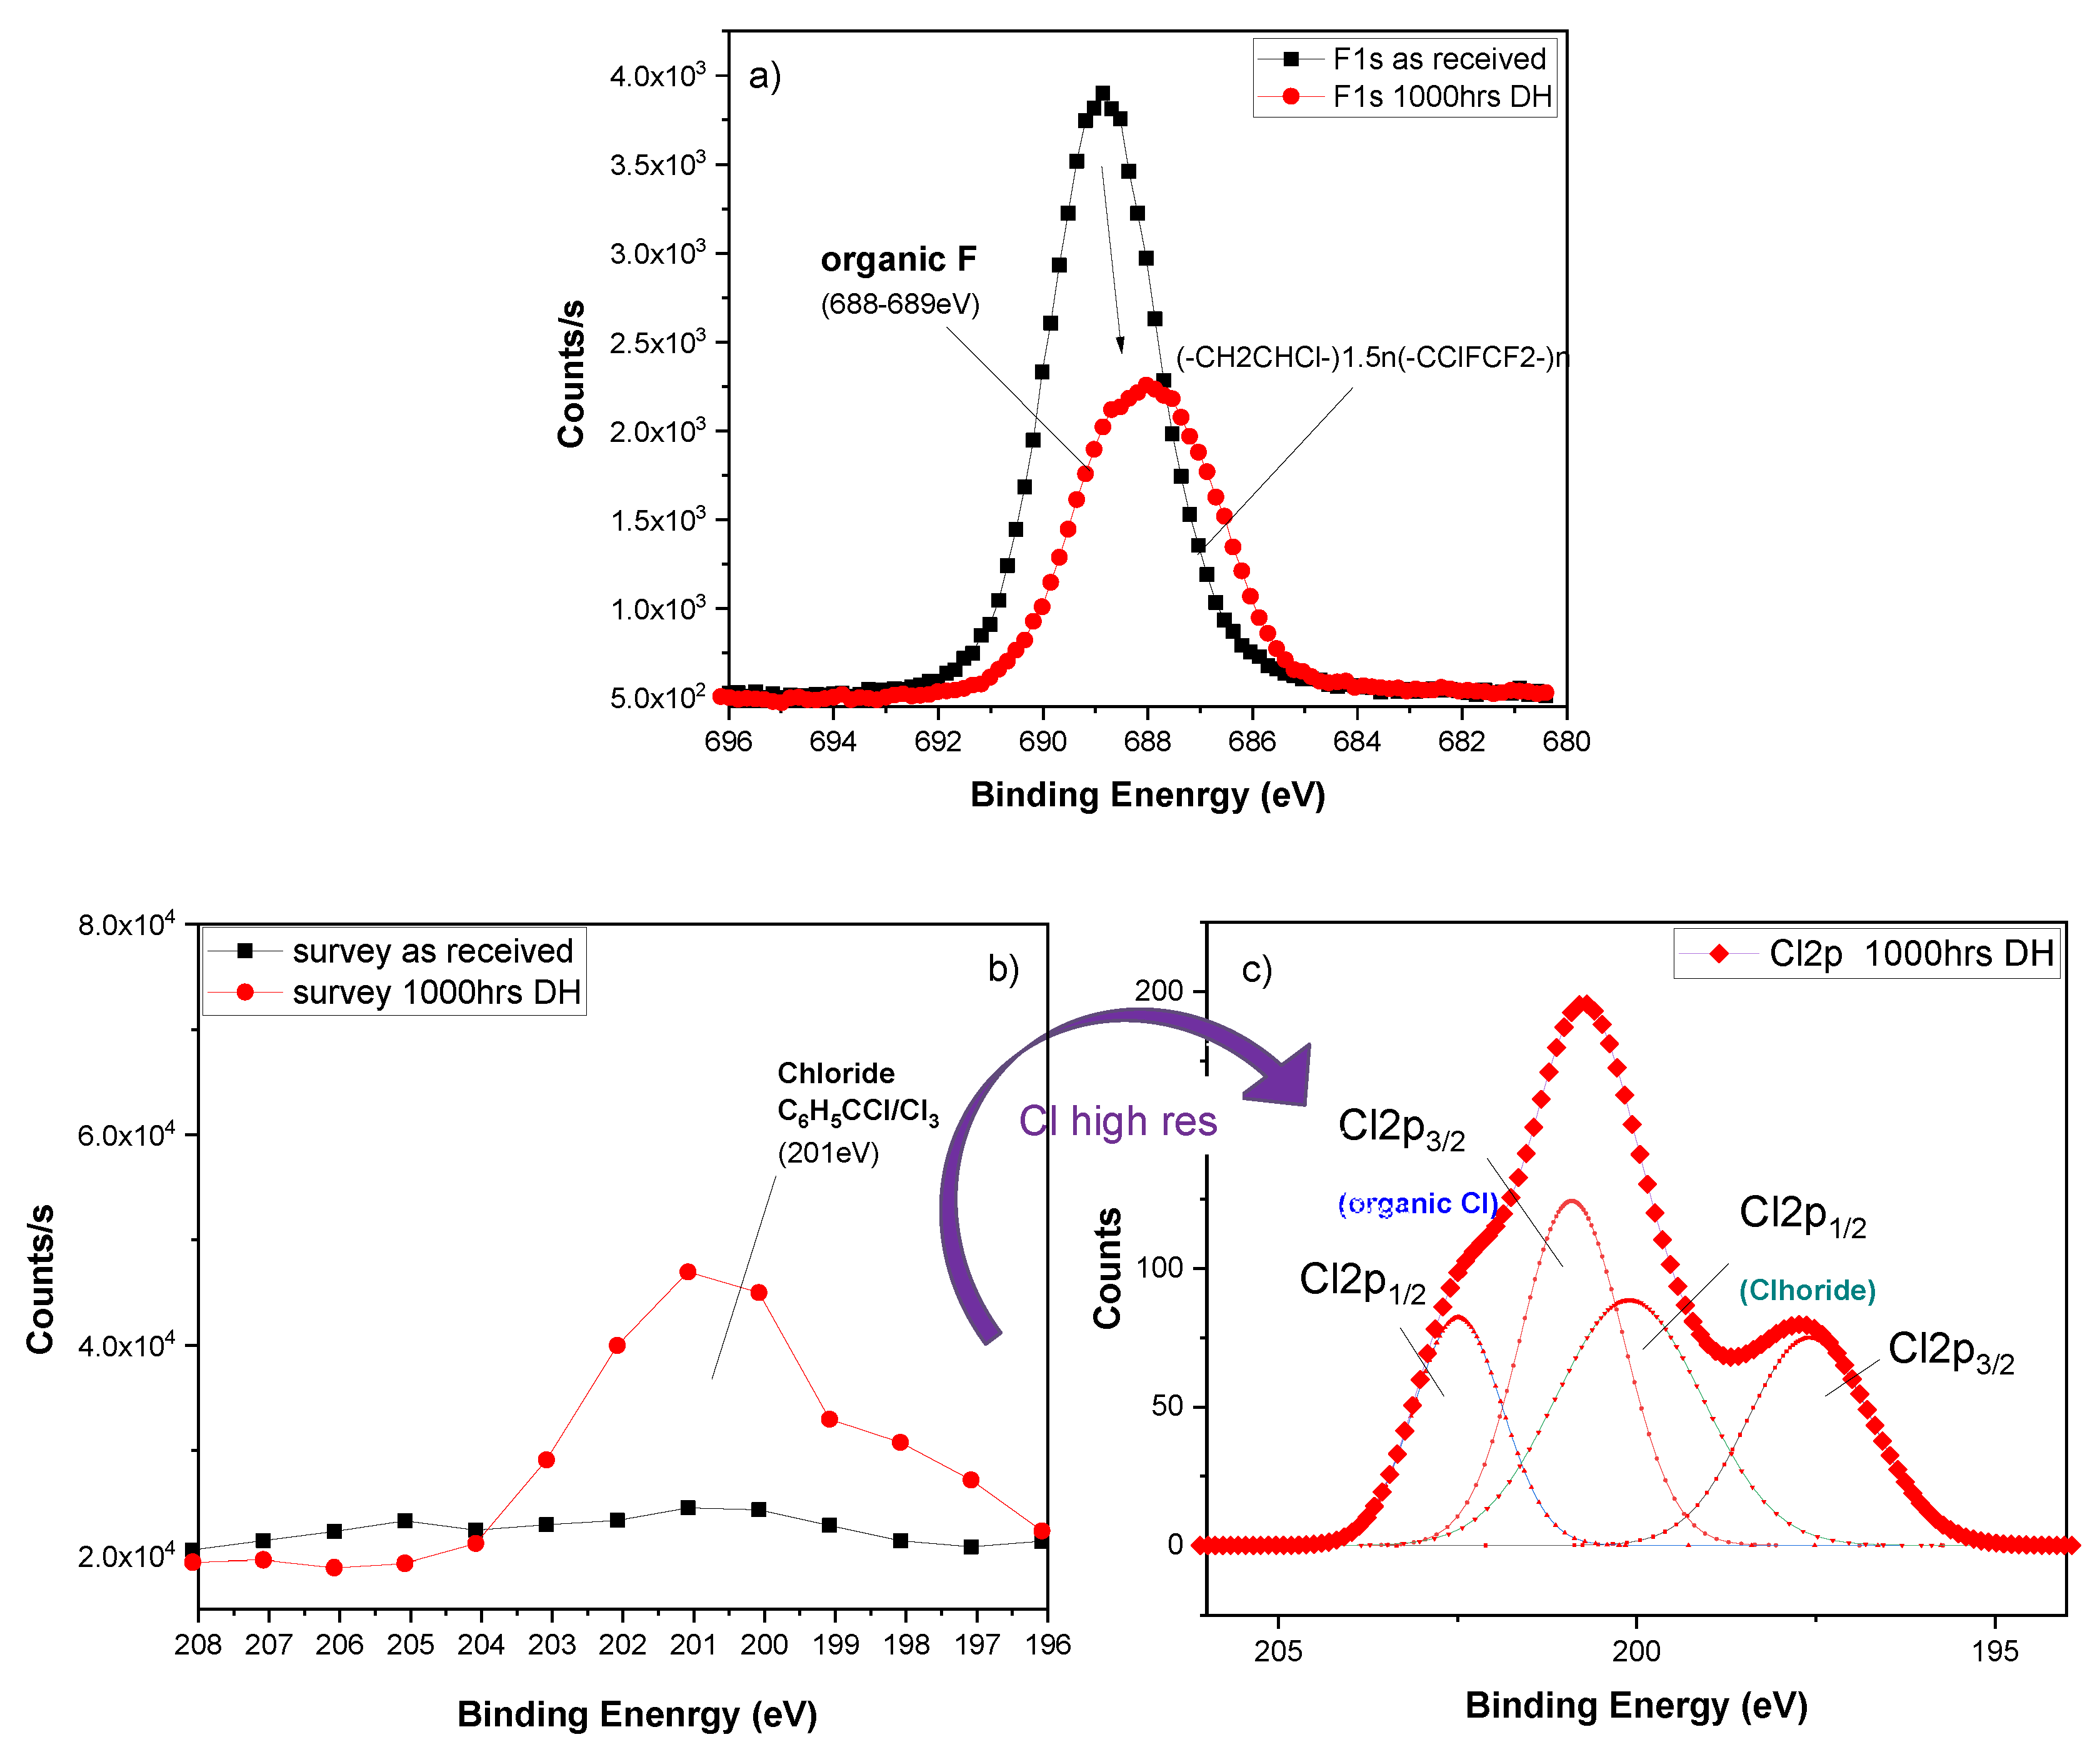
Similar results were obtained with another commercial hydrophobic coating (B), which was also vulnerable to both UV and DH exposures. This type of coating was deposited by solution processing and the coating formulation did not contain fluorinated NPs, but fluorine was part of the polymer matrix. In addition, this coating showed the presence of chlorine after 1000 h of DH exposure. Chlorine detected on the surface was likely due to the solvent remaining after the post-deposition curing step. This explained the shift observed for the F1s peak in the XPS high-resolution spectrum shown in Figure 4a. Figure 4b shows a portion of the XPS survey scan, where the chlorine peak was detected after 1000 h of DH exposure. No trace of chlorine was detected prior to the DH treatment. Figure 4c shows the Cl2p XPS high resolution after 1000 h of DH exposure. The high resolution Cl2p peak also shows the contribution of the chloride ions (~197 eV), which might be due to external factors like handling. This effect of contamination can be distinguished from the chloride contribution at ~201 eV.
4.2. Degradation Mode: Blister Formation
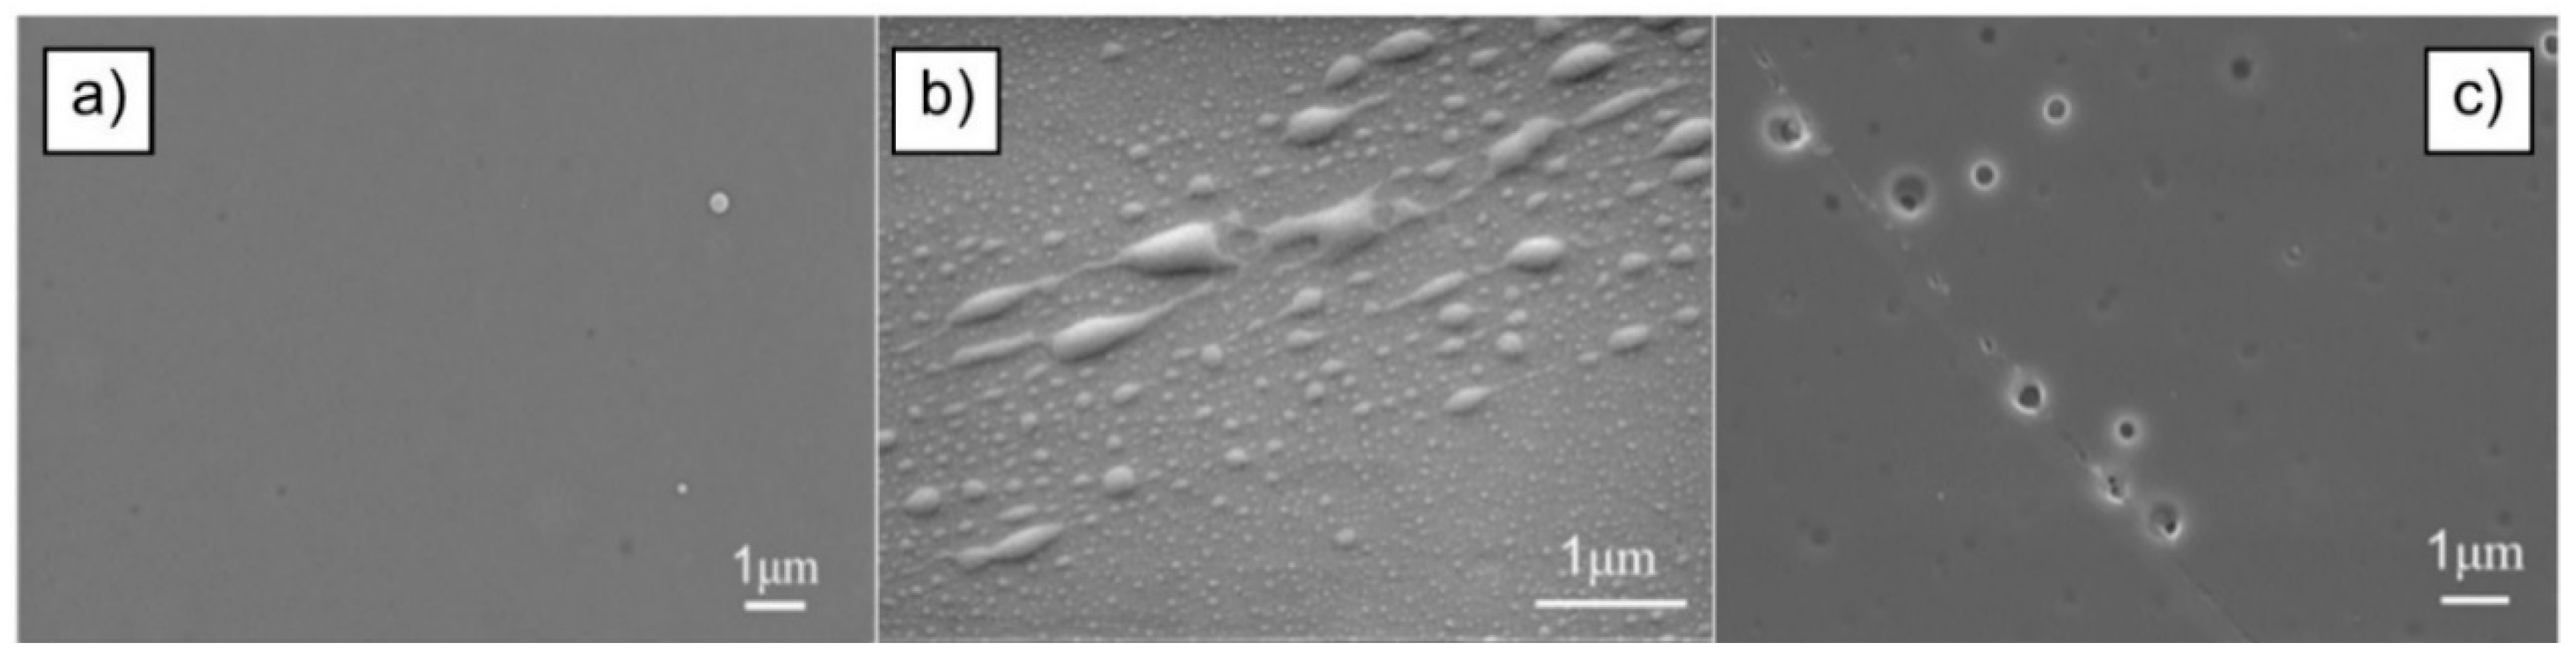
In addition to the compositional changes of the coatings, exposure of hydrophobic coatings to UV and DH for prolonged periods of time also resulted in progressive changes to the coating surface morphology. The changes in surface morphology were observed on various solution-processed (dip-(Coating C) and spray-coated (Coating B)) coatings, which were silane-based, without the presence of NPs in the coating formulation. Figure 5 shows the morphology of the as-deposited hydrophobic coating (spray-coated (Coating B)), as compared to the same coating following exposure to UV radiation for 600 h and 1000 h. From these images, it is clear that UV exposure led to the formation of distinct features resembling blisters, which appeared as localized swellings on the surface of the coating, after 600 h of exposure. After 1000 h of exposure, these swellings developed into pits with material being exfoliated from the surface. The pits on the surface are shown in Figure 5c.
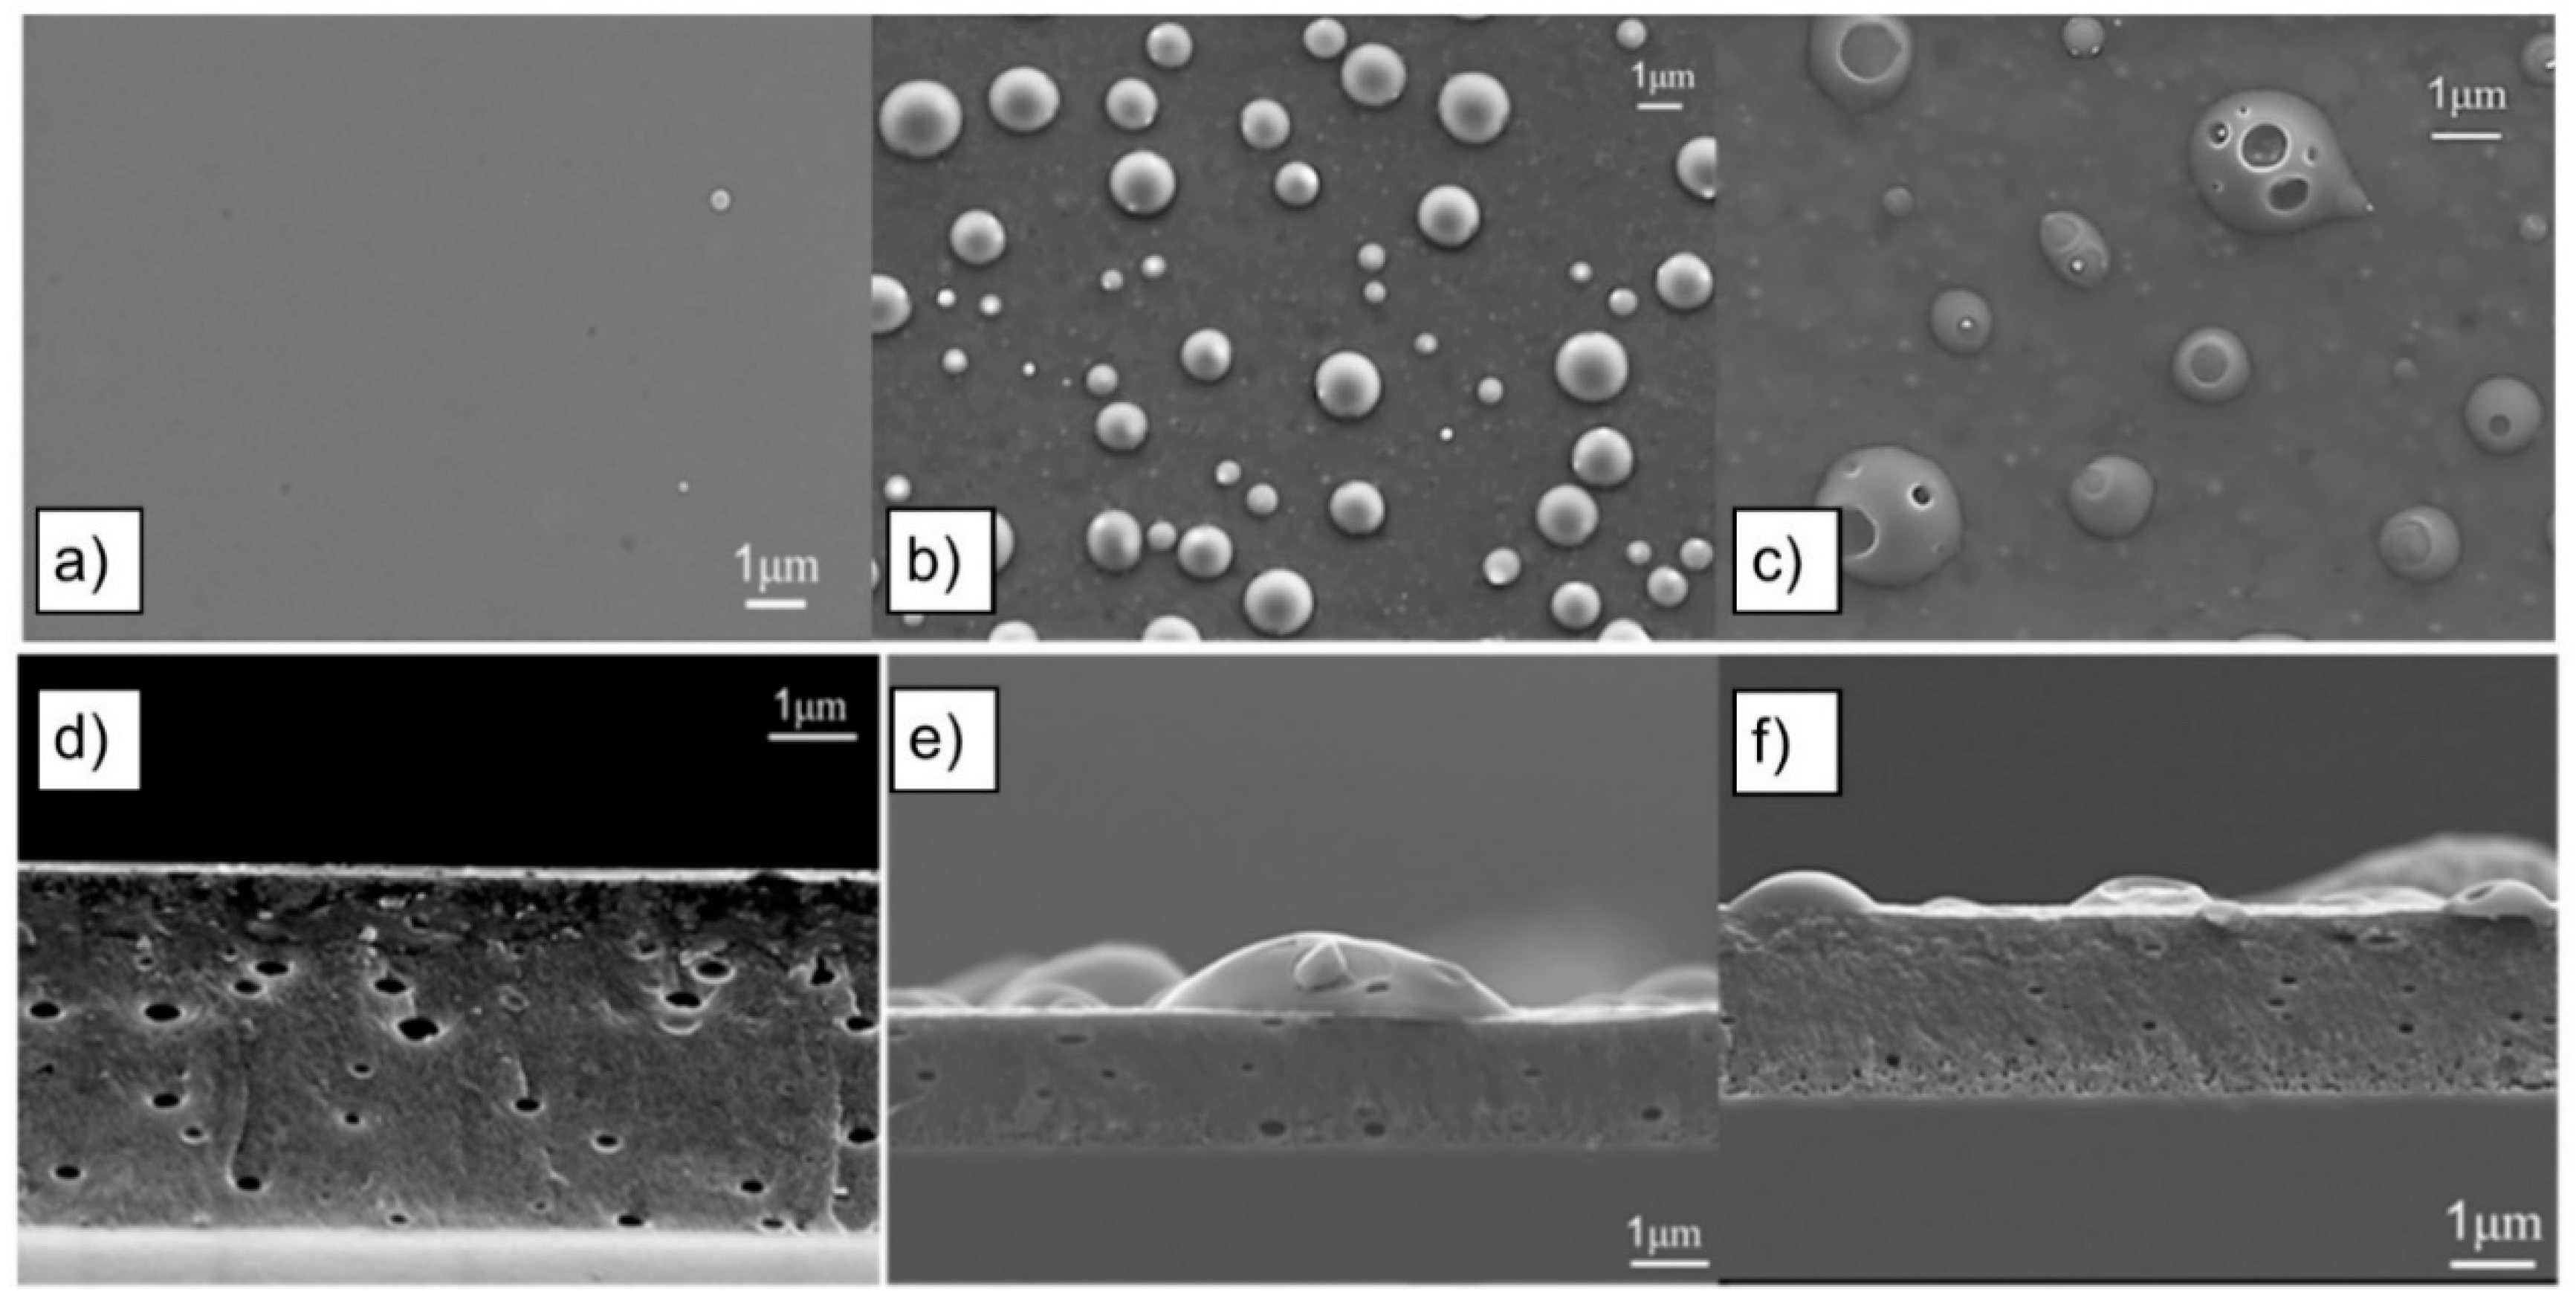
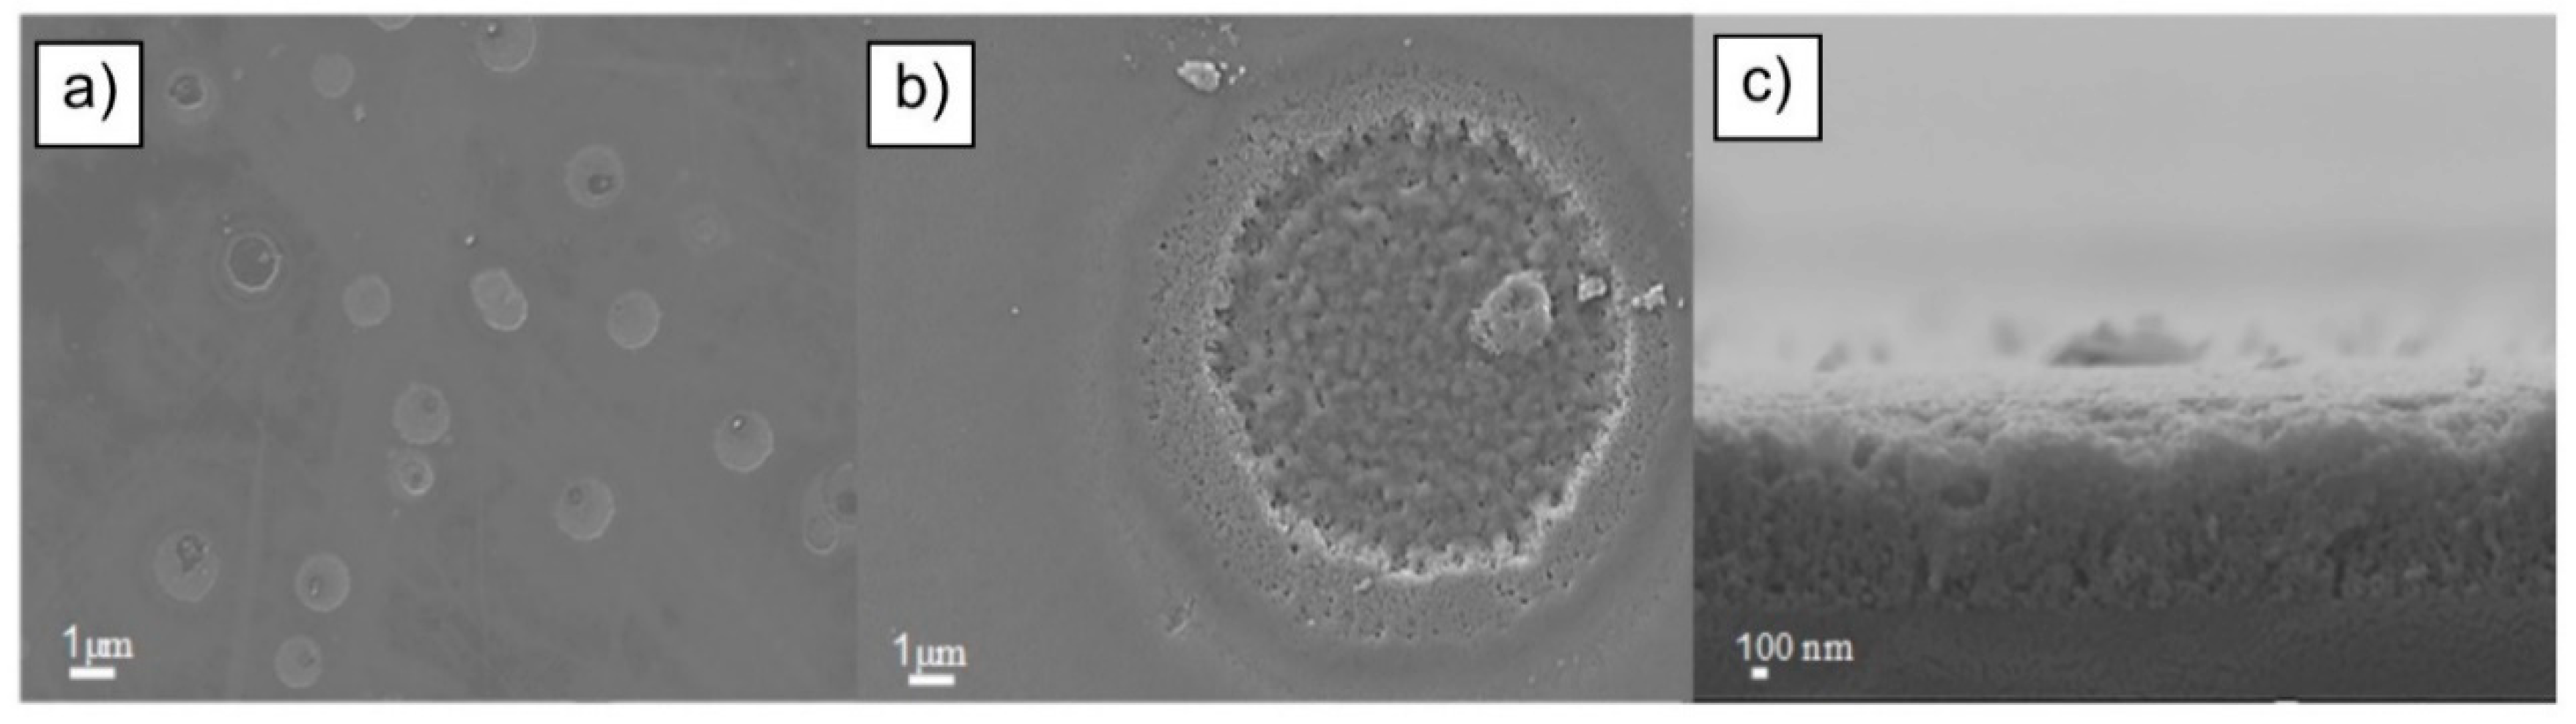
Figure 6 shows planar and cross-sectional views of a spray-coated coating B, subjected to DH. The as-deposited coating was characterized by the presence of air-pockets in the bulk (Figure 6a). Similar to those observations made following UV exposure, blisters formed on the coating surface at about 500 h of DH exposure. The blisters were spherical in shape and the size varied from a few nanometers to several micrometers in diameter. The cross-sectional analysis showed that these blisters were formed exclusively at the coating surface and the bulk of the coating remained mostly unaffected. After longer exposure periods (1000 h of DH), the blisters were observed to erupt, causing surface pitting (Figure 6c). A continuous process of blister formation, eruption, and formation of pits resulted in changes in surface morphology, which affected the hydrophobicity of the coatings (Figure 7). It also resulted in reducing the thickness of the coating.
The cause of blistering is not certain, but it is generally associated with the chemistry of the matrix, the type and amount of solvent and the curing conditions. It is possible that the DH accelerates the movement of unevaporated solvent towards coating surface and the excess solvent leads to the formation of blisters. This type of degradation could be avoided by optimizing the curing process.
Similar hydrophobic coatings deposited by dip-coating (Coating C) were also observed to be vulnerable to UV and DH. Blister formation and exfoliation occurred after the coatings were exposed to both stressors. The blisters observed in Figure 6 are different in shape from those observed on the sprayed coatings B, in Figure 5. This might be due to the different deposition method used and different levels of residual solvent trapped in the bulk of the coating. This coating became too thin after 1000 h of DH exposure and consequently no cross-section is shown for this coating after long exposure (Figure 7).
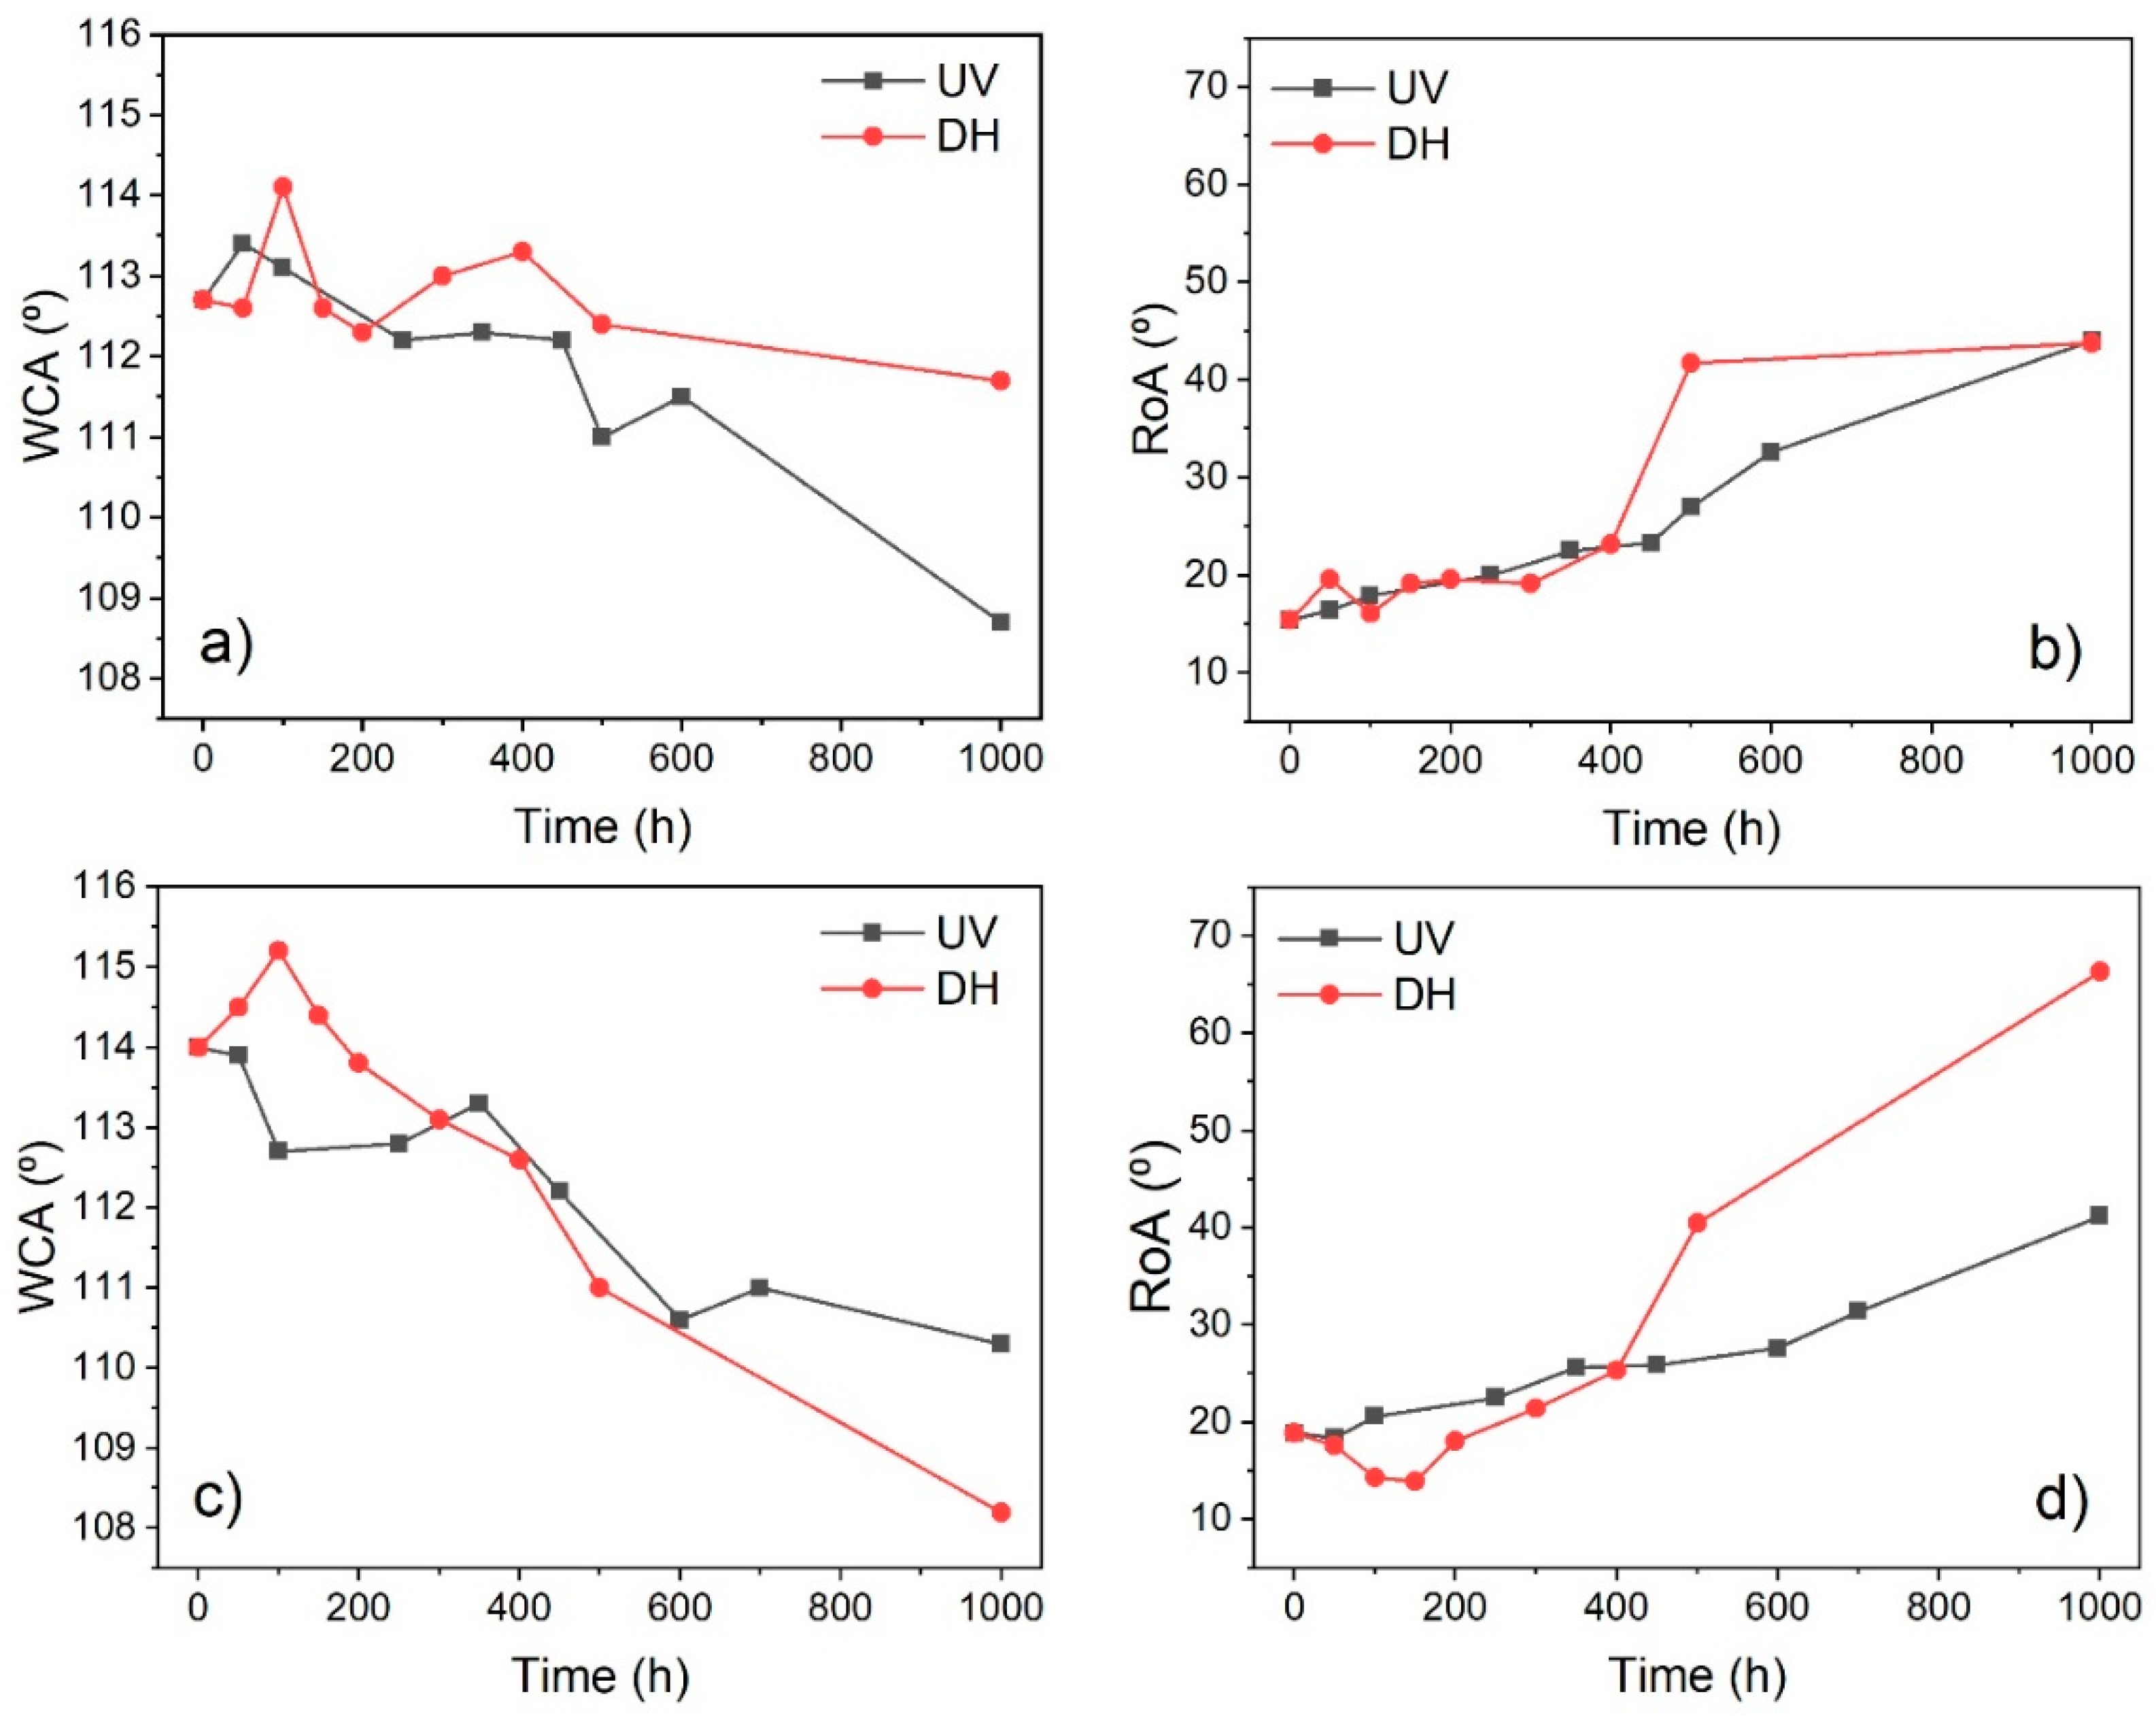
To study the effects of the blister formation and exfoliation on the hydrophobicity of the coatings, WCA and RoA measurements were performed, following exposure to UV and DH. The hydrophobic parameters are summarized in Figure 8. Similar trends in WCA and RoA are observed for both sprayed (Coating B) and dip-coated (Coating C) films. WCA tended to decrease, from an initial ~114° to the minimum of 108°, after 1000 h of exposure to either UV or DH. This meant that after 1000 h of exposure, the coating remained hydrophobic. The variation of RoA was more dramatic. RoA increased from an initial 15° (19° for dip-coated C) to ≥40°, after 1000 h of UV or DH exposure, which was above the module tilt angle in many regions. The formation of blisters caused an increase in surface roughness and this effect shifted the coating wetting regime to the combined Cassie-Baxter/Wenzel intermediate state [22,23]. This caused the WCA to decrease only slowly and remain in the hydrophobic range, while the RoA rapidly deteriorated.
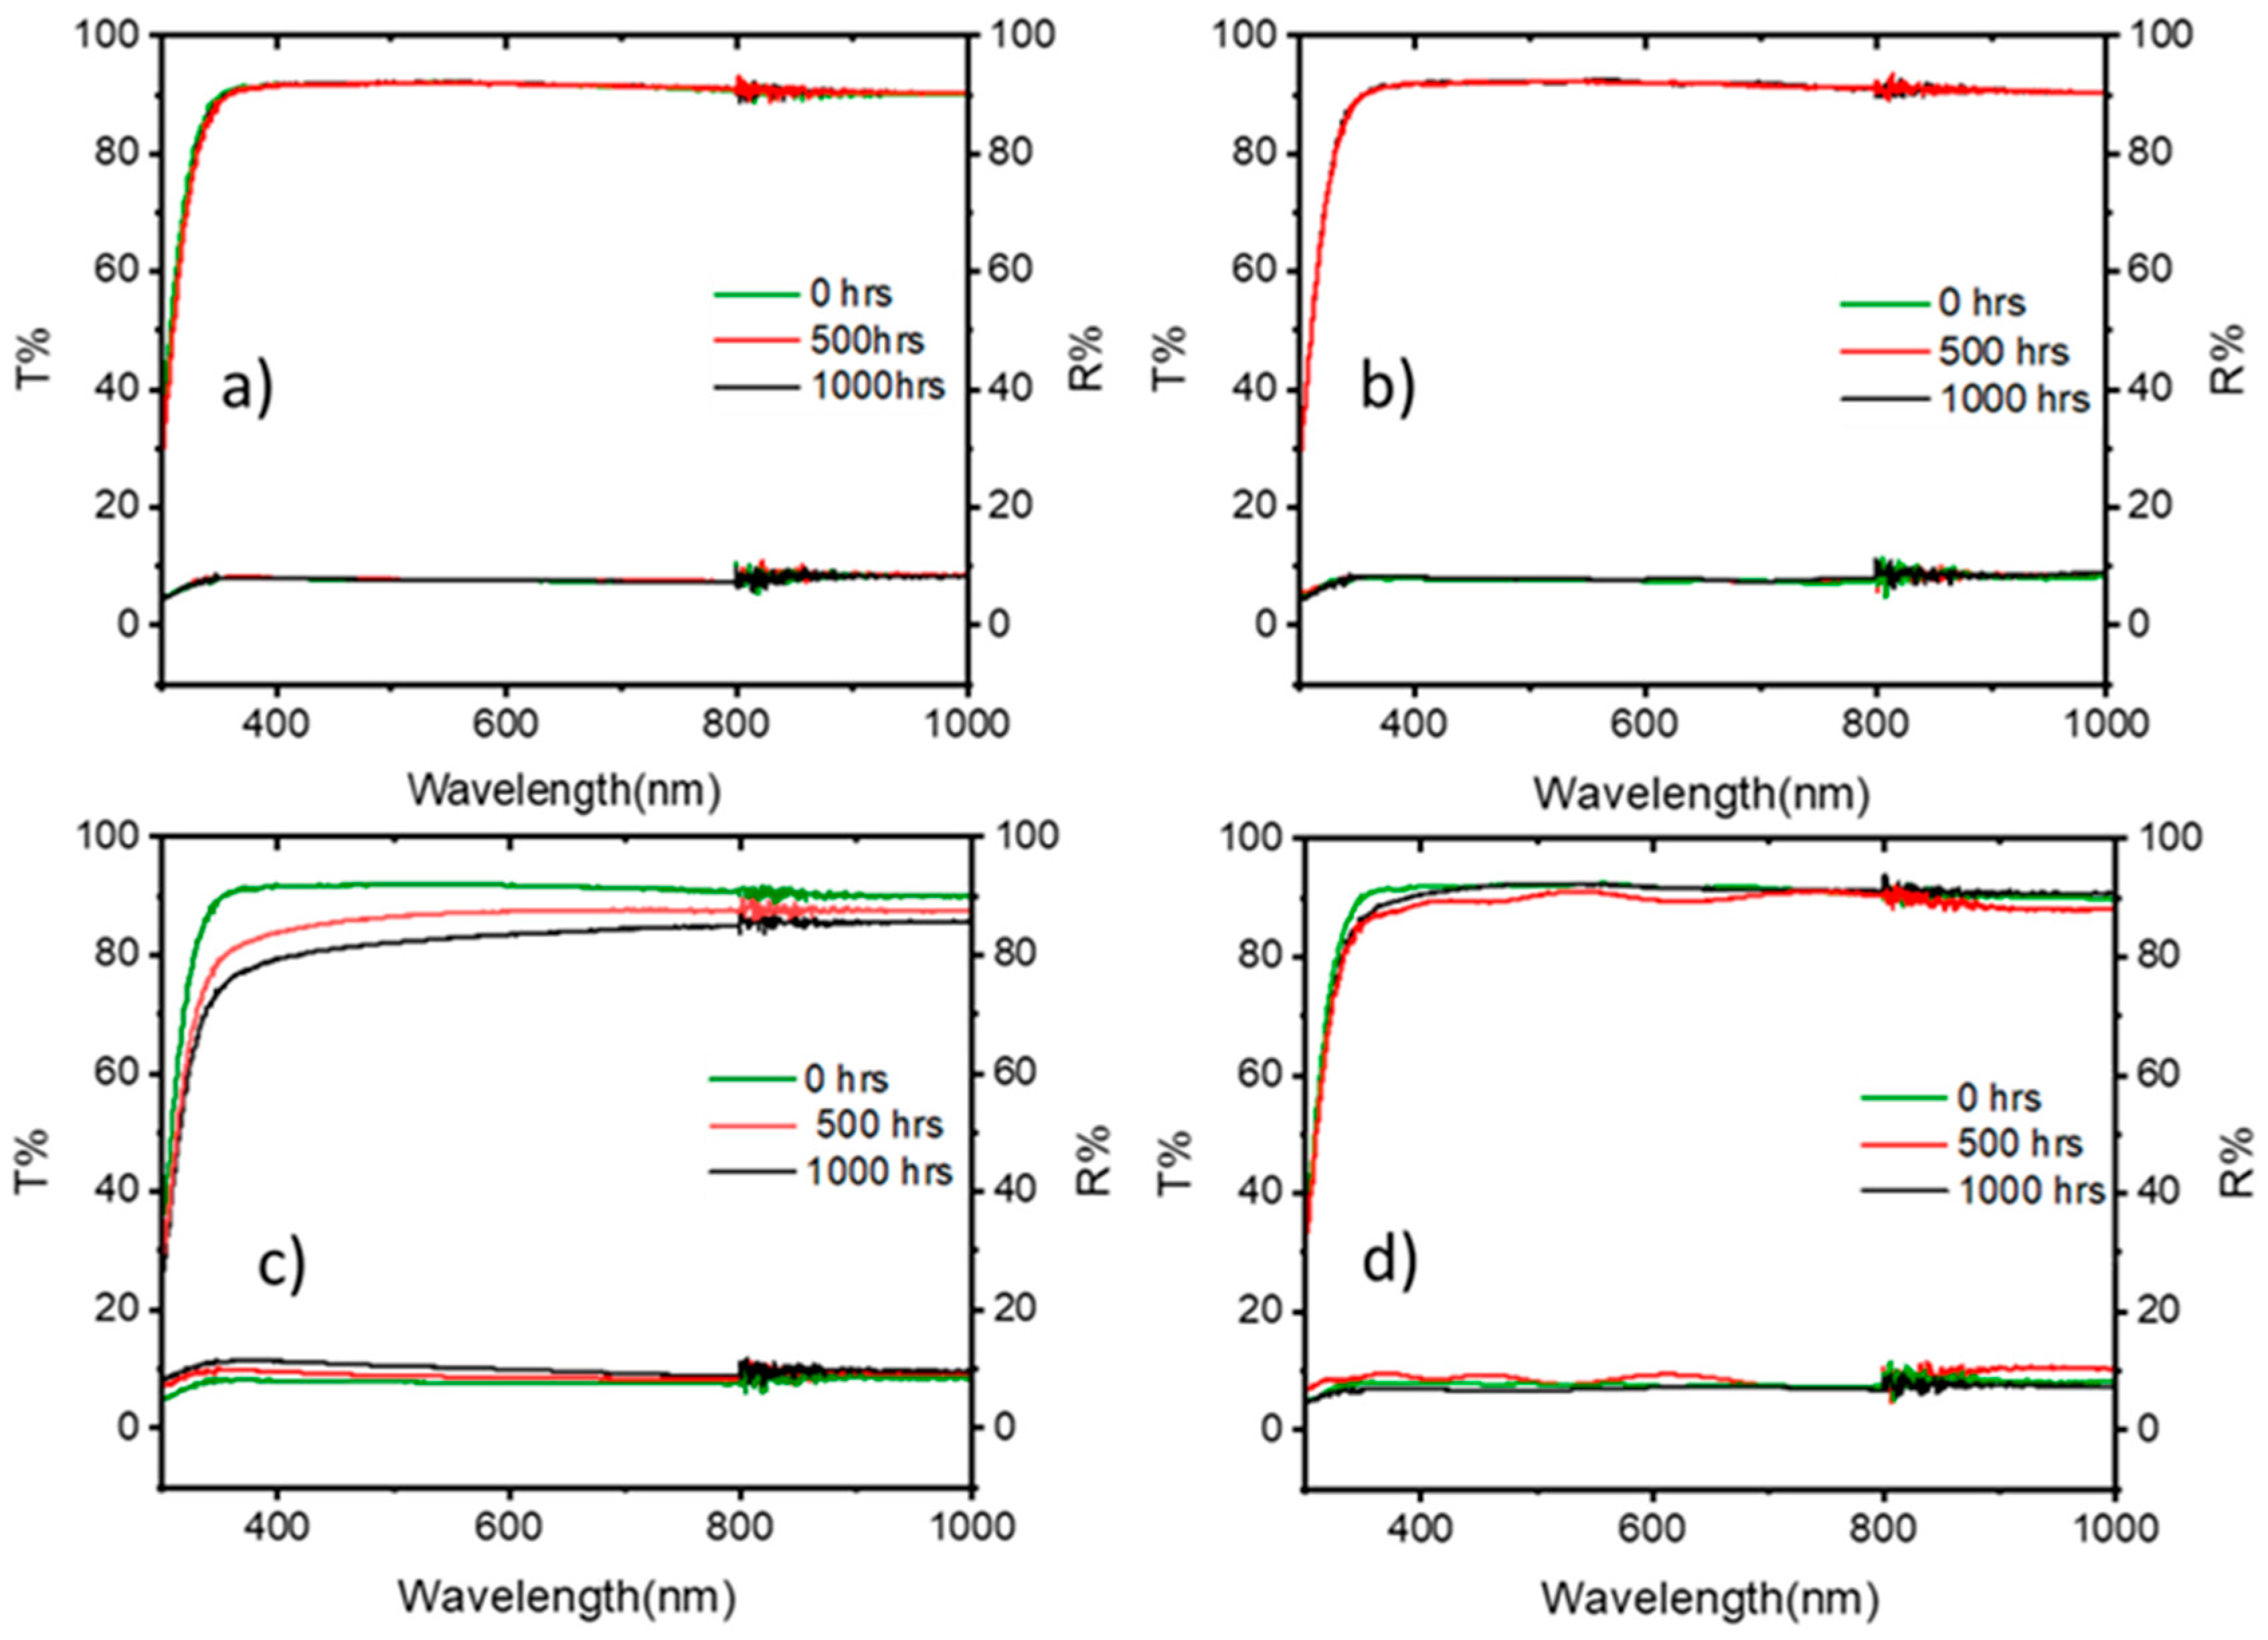
The optical measurements of the spray (coating B)- and dip-coated (coating C) films did not reveal any significant changes in the transmittance and reflectance of the coatings, after being exposed to UV radiation (Figure 9a,b). These results indicate that where chemical degradation of these coatings affected the anti-soiling properties, the light transmission through these coatings was not affected. Exposure to DH had more impact on the transmittance through the coatings, especially in the case of the spray-coated film (coating B) (Figure 9c,d). At 550 nm wavelength, the transmittance (%T) of film B decreased by 9% and the reflectance (%R) increased by 2.4%. The change for the dip-coated samples (coating C) was less detrimental and only a 0.5% decrease in %T and 0.85% increase in %R was observed. The changes in the optical and hydrophobic properties of these coatings, post DH exposure, indicate their vulnerability to hot and humid environments.
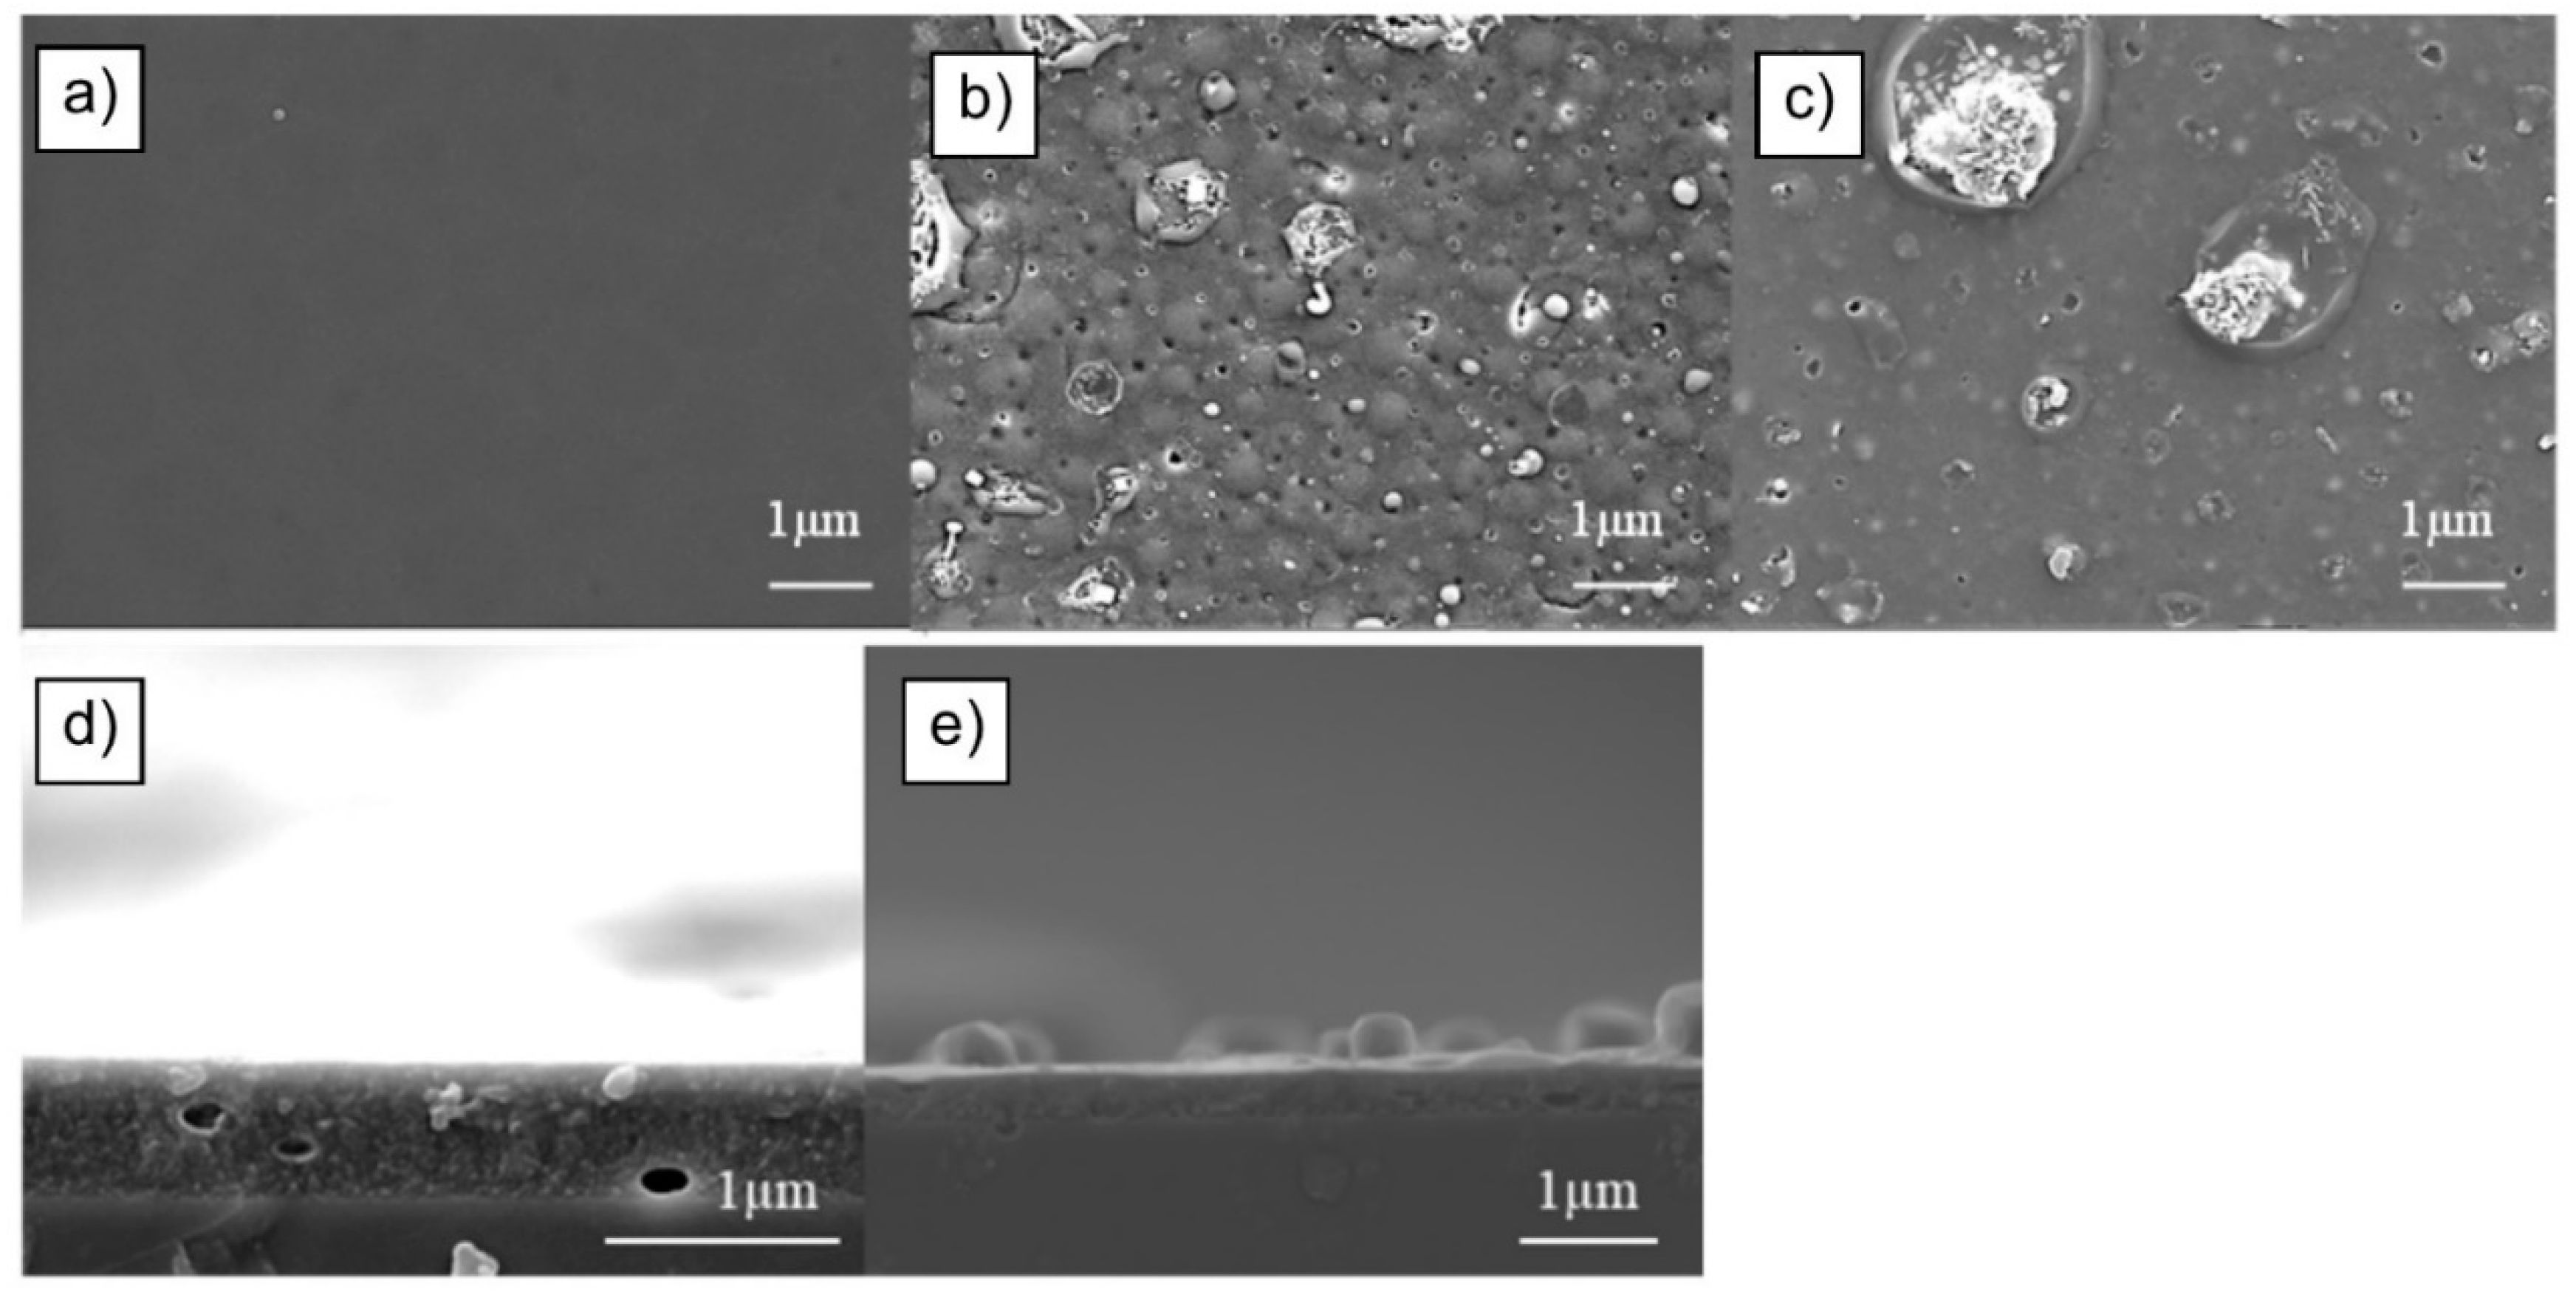
The formation of blisters was also observed on other types of hydrophobic coatings, deposited by dip-coating, using a chemical formulation based on siloxanes, without the incorporation of NPs in the polymeric matrix (coatings C). The appearance of such a coating (C) is shown in Figure 10. After 1000 h of DH exposure, blisters, cracks, and coating loss was observed.
After UV and DH exposures of several hydrophobic coatings, it was concluded that blister formation occurred on solution-processed coatings, B and C. It was not observed in vacuum evaporated coatings A. The blister formation was confined as a surface feature, and the bulk of the coating appeared to remain mostly unaffected. No distinct pattern was observed in the shape and position of the blisters. It is likely that the root cause of blistering was insufficient curing of the coating.
4.3. Degradation Mode: Thinning of the Coating
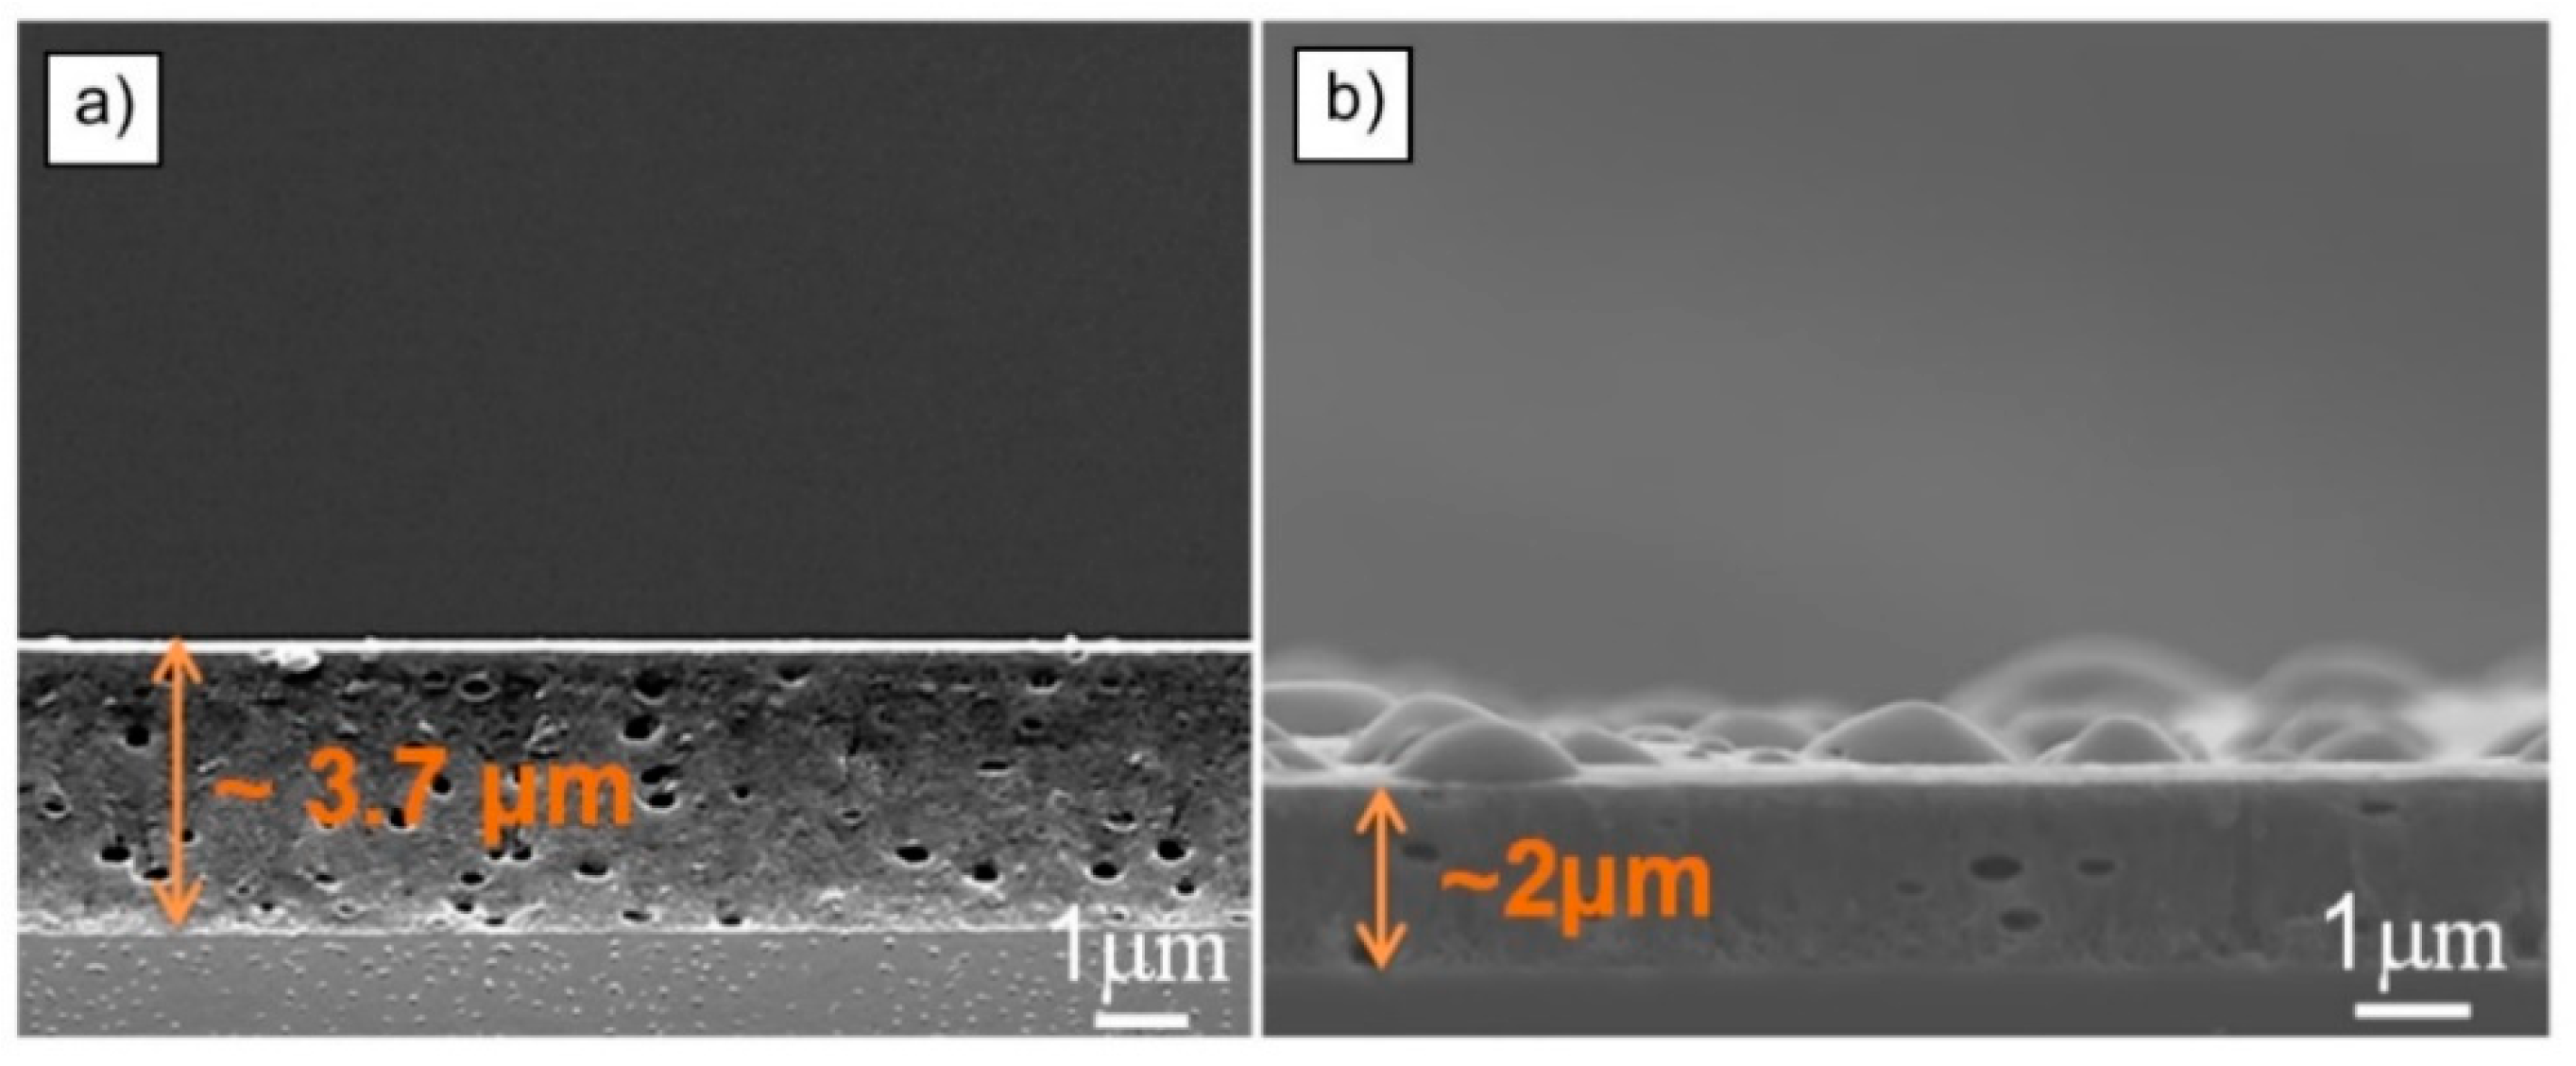
Another degradation mechanism observed was the steady loss of coating material, resulting in reduced coating thickness. SEM analysis of coating cross-sections showed that the thickness of the coating reduced under both UV and DH exposure. An example is shown in Figure 11, where the thickness of a spray-coated hydrophobic coating B, reduced from 3.7 µm for the as-deposited material, to 2 µm after 1000 h of DH exposure. This loss of material occurred from the surface and was linked to the exfoliation of blisters.
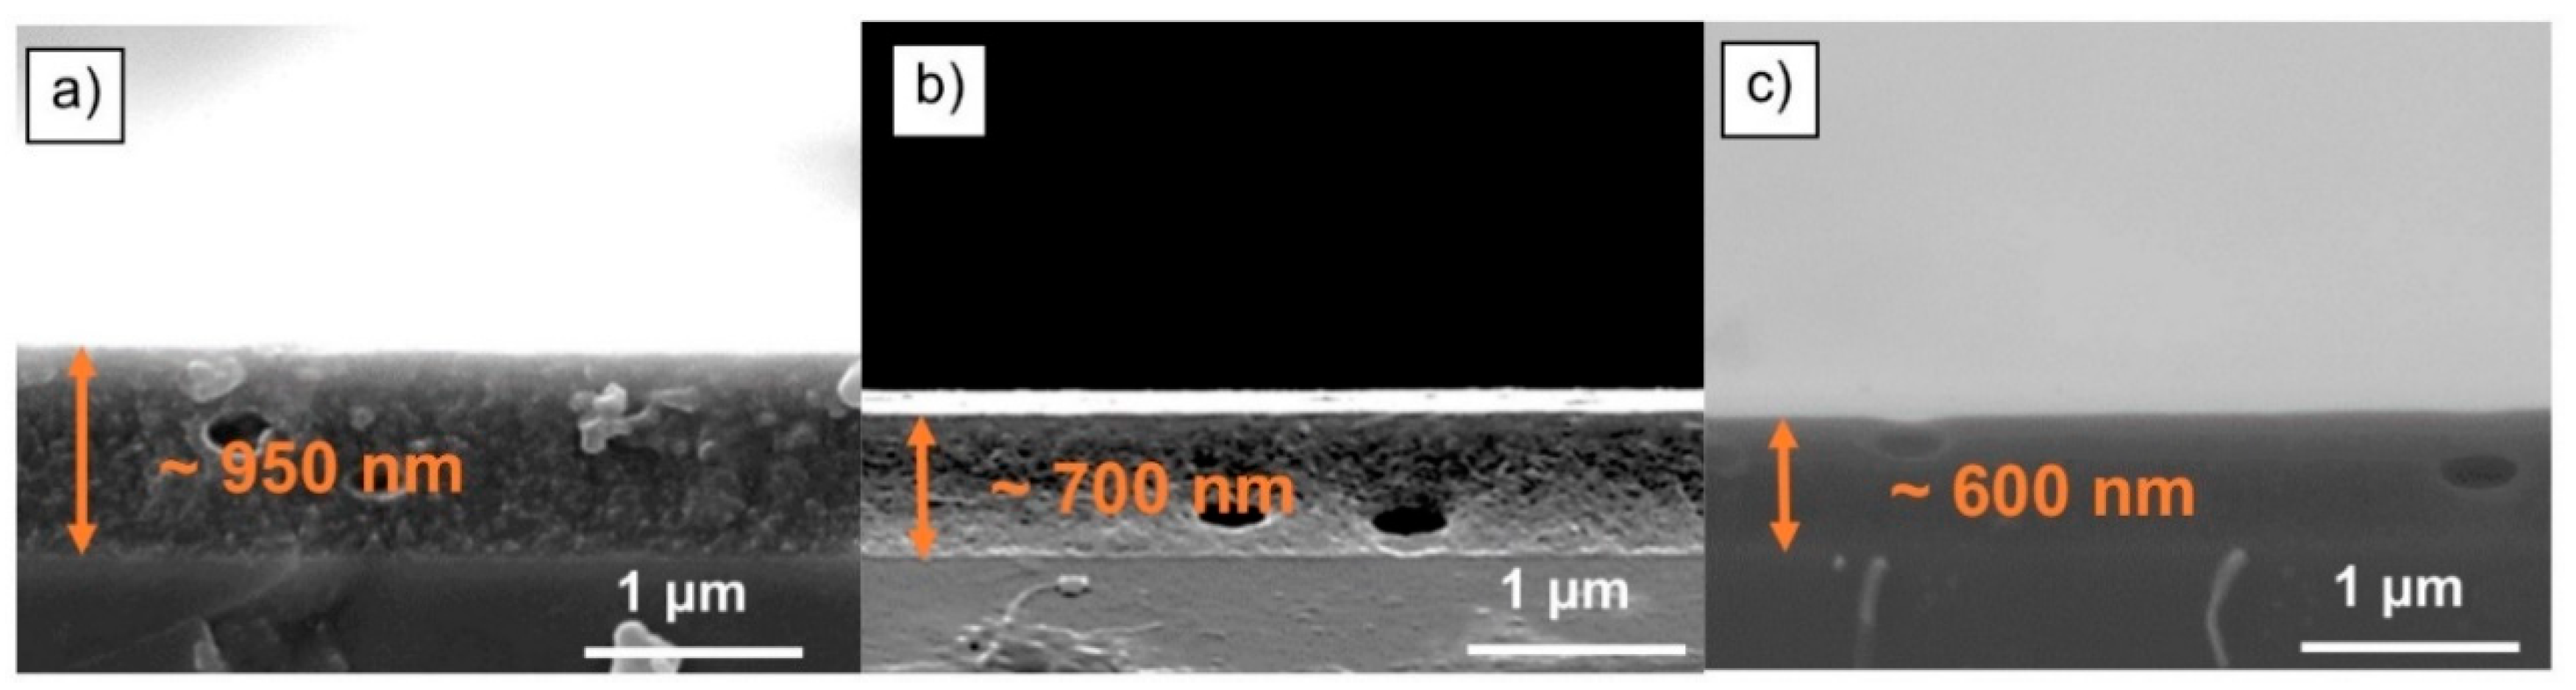
The thinning of the coating is also visible in Figure 12 on a dip-coated coating C, following exposure to UV. This coating decreased in thickness from an initial ~1 µm to ~600 nm, after 1000 h of exposure to UV.
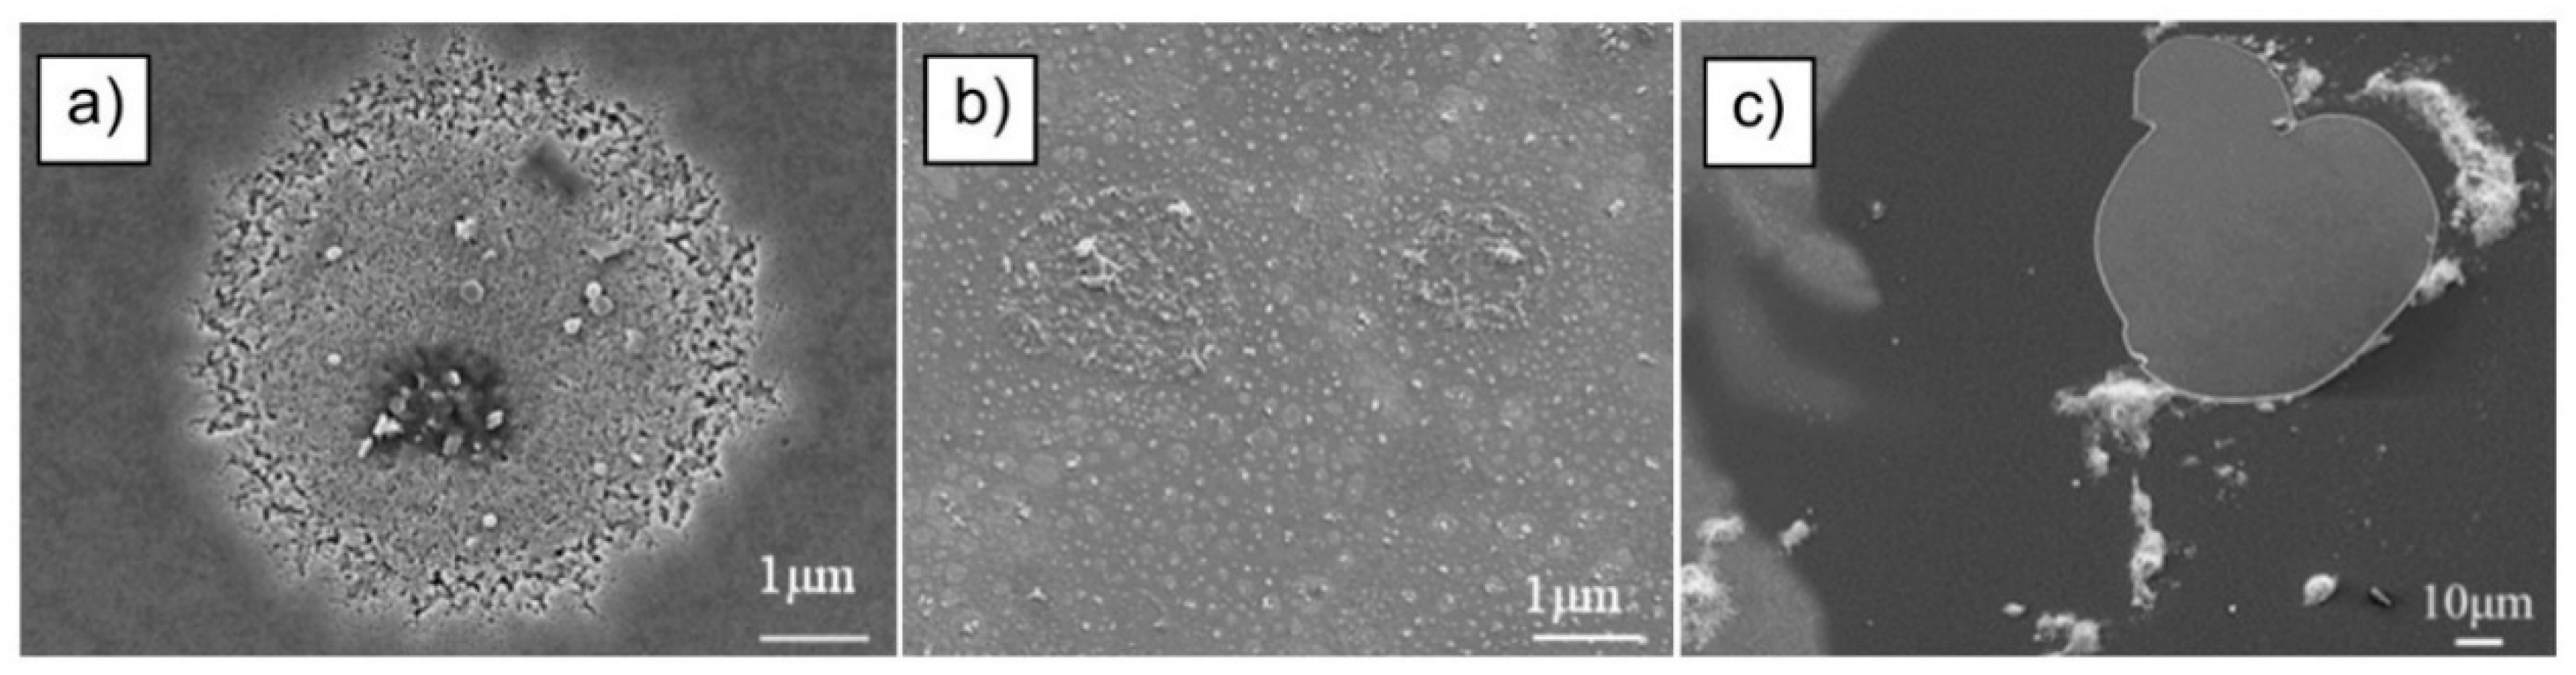
Further examples of material loss from the surface of hydrophobic coatings undergoing UV or DH exposure are shown in Figure 13. Here, the coatings are based on various chemical formulations, all deposited by solution processing (B and C). Damage on the surface of the coatings was observed after 1000 h of UV exposure (Figure 13c) and appeared as round features in the SEM images. The underlying glass substrate was revealed, following complete coating delamination. After DH exposure of the coatings, round features associated with blisters, surface damage, and material loss were observed (Figure 13a,b). These might be related to the continuous condensation and evaporation of water drops from the surface, by interacting with the porous coating resulting in solvolitic or hydrolytic degradation [24].
4.4. Degradation Mode: Loss of Nanoparticles
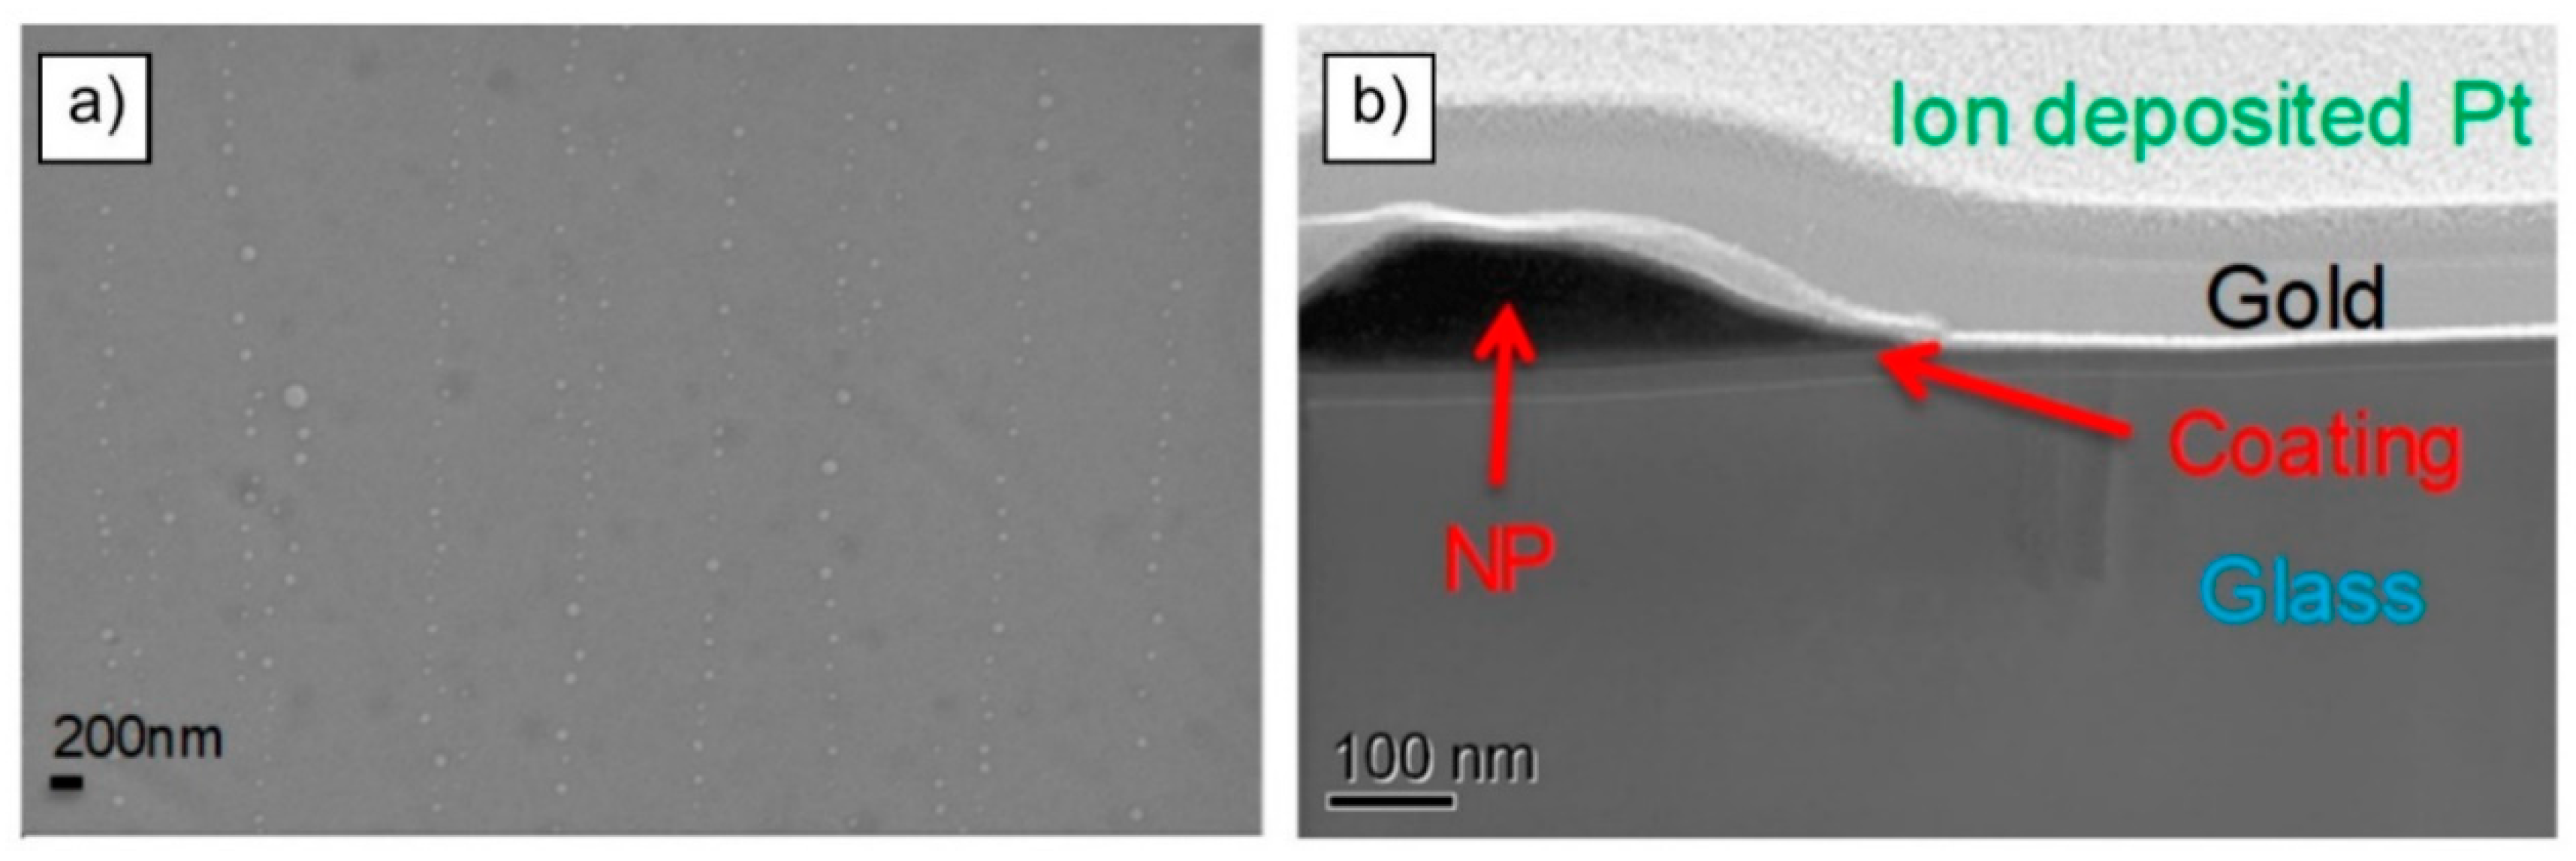
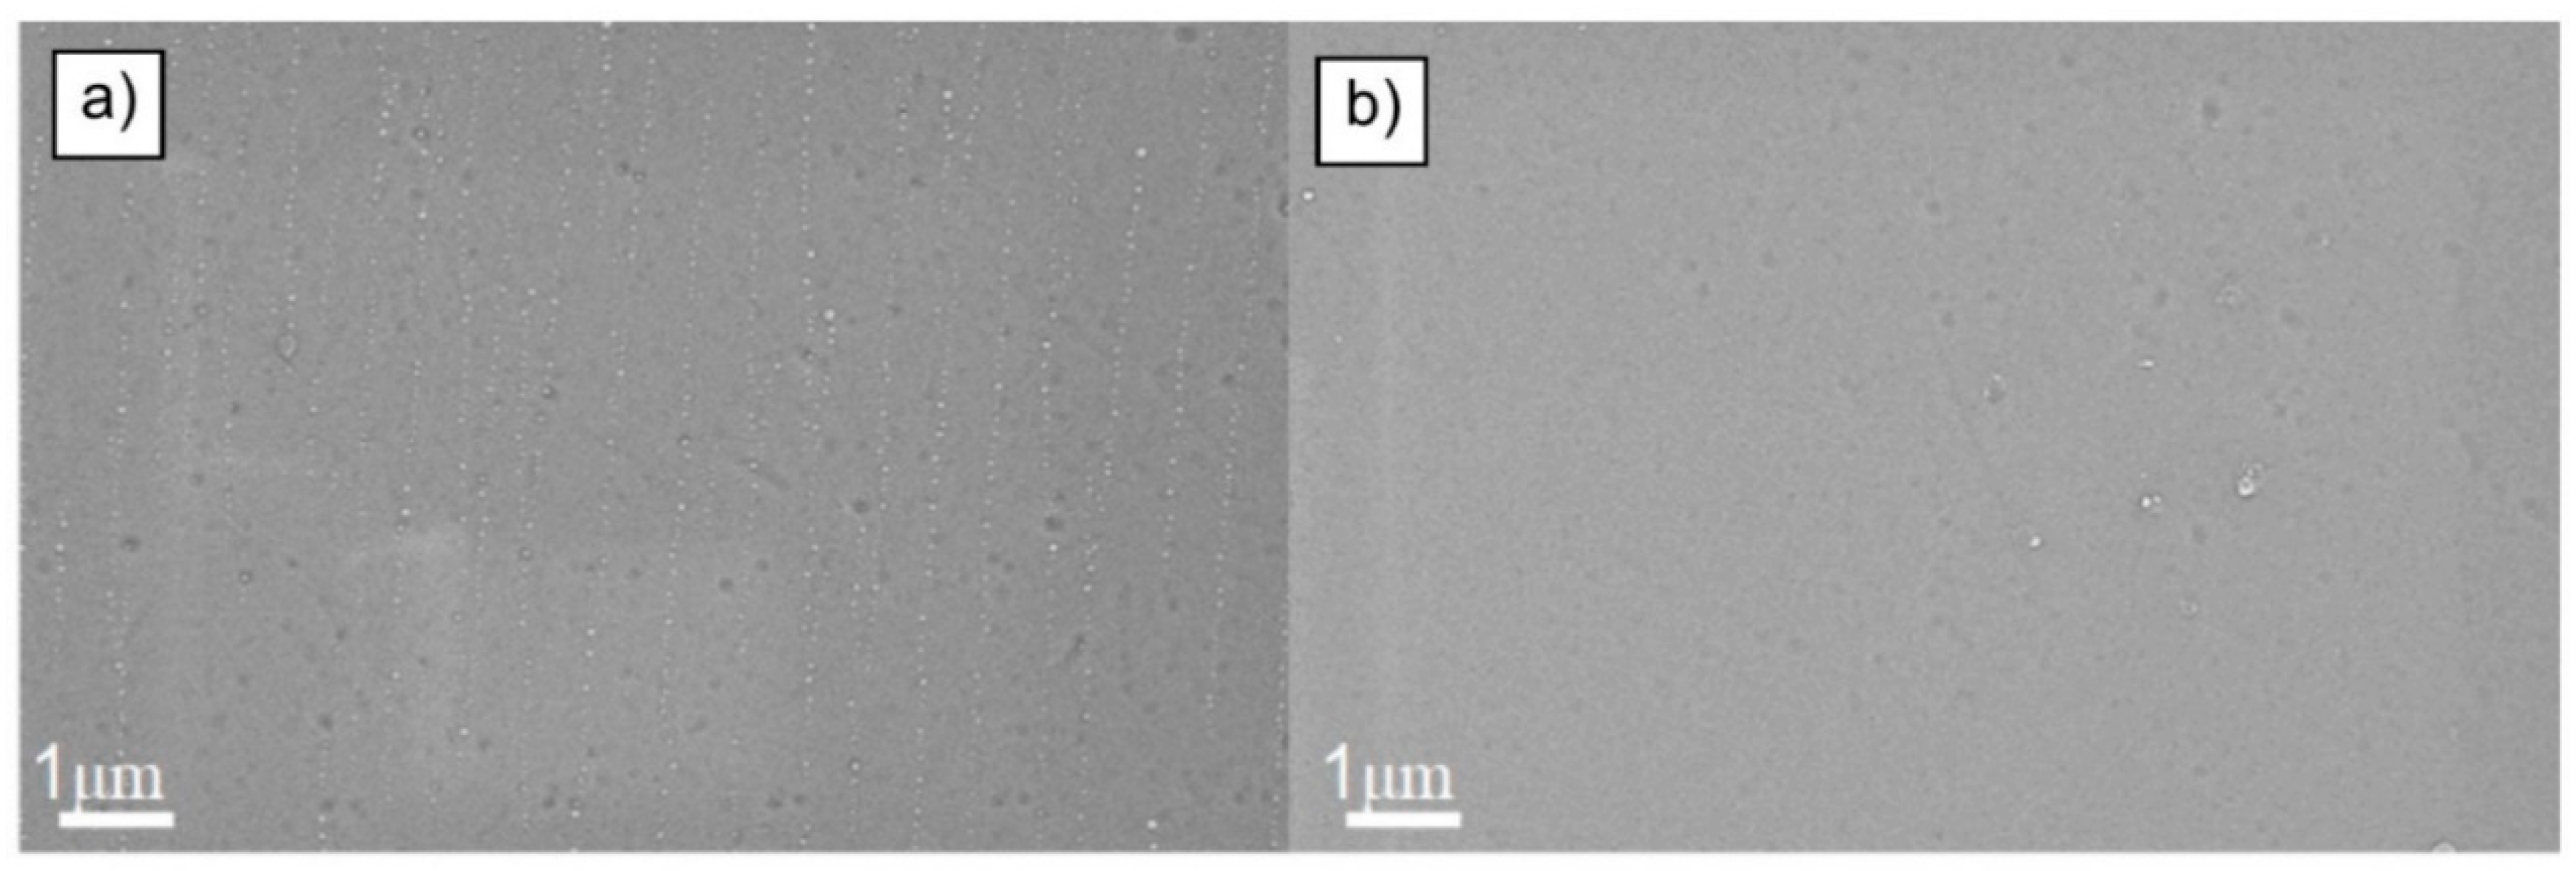
Silica NPs, often functionalized with fluorine, are incorporated into a certain type of hydrophobic coatings, to increase the water contact angle through the Cassie-Baxter effect [25]. Loss of the NPs from the coating surface reduced the hydrophobicity and caused a reduction in the WCA measurement. Figure 14a shows an SEM surface image of a thin hydrophobic coating A, deposited in vacuum by evaporation on to a glass coupon. Functionalized NPs were included in the formulation of the coating and they appeared as small round white features on the surface of the coating, as shown in Figure 14a. A STEM cross-sectional analysis confirmed the presence of NPs dispersed on the surface, as shown in Figure 14b. These coupons were exposed to UV for 500 h. The coupons were then re-examined, and it was observed that the density of the NPs was reduced. The round white NPs were no longer visible on the surface, as shown in the SEM image in Figure 15b.
5. Discussion and Conclusions
With global PV deployment exceeding 0.5 TW, the solar industry is starting to focus on issues relevant to O&M, including the performance and financial optimization of solar assets, especially at utility scale. In this study, we address the significant problem of accumulation of soling on solar modules. Soiling of the cover glass on solar photovoltaics is a major issue, resulting in significant losses in the solar irradiance absorbed by the module, and consequent reduction in power output. This lowers the financial return on solar PV investments and disincentivizes further deployment. Although this problem is acute, it is only now beginning to attract research effort.
Hydrophobic coatings are a potential solution to the soiling problem. These coatings typically demonstrate water contact angles of about 120°, have low surface energy and reduce the adhesion of dust particles to the glass surface, reducing the level of soiling. Hydrophobic coatings enhance the cleaning effect of wind and rain, as the modules are held at an angle to the vertical, depending on latitude, and water on an inclined hydrophobic surface will roll off, carrying away dust particles. The efficacy of hydrophobic coatings to shed snow was demonstrated previously [20].
Coatings on module cover glass are exposed to the outdoor environment 24/7. This is very challenging and we have already reported on the effects of exposing hydrophobic coatings in an inland location the UK [18] and in a coastal location in Denmark [26]. In both cases, the hydrophobicity of the coatings degraded more quickly than anticipated. In this study we used specific laboratory tests to identify the more important degradation mechanisms at work. This would inform coating development of the improvements needed to achieve acceptable standards of durability.
Hydrophobic coatings with high water contact angles are usually polymers containing fluorine and might also carry nanoparticles functionalized with fluorine. The fluorine was strongly bonded and reduced surface energy and increased hydrophobicity. Using XPS, we observed that fluorine was removed from the surface in both damp heat and UV exposure. It is likely that the C-F bond remained intact, but the removal was connected with bond breaking in the polymer chain. This effect was observed in indoor and in outdoor testing. This mechanism was probably responsible for the fast degradation observed in outdoor testing. Overcoming this mechanism would require a new approach to the coating chemistry.
We also observed heavy blistering on the surface of the thicker hydrophobic coatings during damp heat and UV exposure. This was also observed in outdoor testing [26]. There was evidence that the blistering was caused by retention of solvents within the bulk of the coating and inefficient curing after deposition. We also observed that blistering led to exfoliation of material and to a progressive reduction in coating thickness. The movement of solvent appeared to be accelerated by exposure to UV and damp heat. This might occur slowly for indoor applications but is much more rapid on outdoor exposure, due to the more extreme conditions. This mechanism of degradation could be mitigated by a careful and thorough curing of the coating, following deposition. It is the duty of manufacturers to specify the exact conditions required for complete curing. This issue might be more challenging for applying or re-applying hydrophobic coatings in the field where curing conditions are more difficult to control.
Some hydrophobic coatings contain nanoparticles to enhance hydrophobicity. In this study, we observed that the concentration of nanoparticles was reduced on UV exposure. This led to the formation of small holes in the coating surface. We also observed a loss of fluorine functionalization. These effects were previously observed in outdoor tests [18,26].
In this study, we used laboratory tests to identify important failure modes that correlated well with degradation observed in outdoor testing. Hydrophobic coatings hold out great promise to reduce soiling, by presenting a low energy, non-adhering surface to the environment. Even if soiling did occur, the hydrophobic coating would make the surface easier to clean. Ideally, this should enable compressed air to be used instead of clean water. This study has identified the degradation mechanisms that must be overcome if hydrophobic coatings are to provide the performance and durability required.
Author Contributions
F.L. performed SEM and XPS analysis and wrote the initial draft; F.B. and K.I. conducted DH and UV exposure laboratory tests and performed WCA, RoA, and UV-vis measurements; S.U. wrote, reviewed and edited; A.T. and K.L.B. deposited coatings on glass substrates and J.M.W. supervised, reviewed, and edited. All authors have read and agreed to the published version of the manuscript.
Funding
The authors are grateful to EPSRC for funding part of this work through the SOLplus project, (EP/N510014/1). Funding from Innovate UK for the ‘Always Clean’ project is also acknowledged.
Acknowledgments
Conflicts of Interest
The authors declare no conflict of interest.
References
- Feldman, D.J.; Margolis, R.M. NREL/PR-6A20-73992, Q4 2018/Q1 2019 Solar Ndustry Update. Web 2019. Available online: https://www.nrel.gov/ (accessed on 24 July 2020). [CrossRef] [Green Version]
- Maghami, M.R.; Hizam, H.; Gomes, C.; Radzi, M.A.; Rezadad, M.I.; Hajighorbani, A. Power loss due to soiling on solar panel: A review. Renew. Sustain. Energy Rev. 2016, 59, 1307–1316. [Google Scholar] [CrossRef] [Green Version]
- Dahlioui, D.; Laarbi, B.; Sebbar, M.A.; Barhdadi, A.; Dambrine, G.; Menard, E.; Boardman, J. Soiling effect on photovoltaic modules performance: New experimental results. In Proceedings of the 2016 International Renewable and Suatainable Energy Conferencews, Marrakech, Morocco, 5–7 April 2016; pp. 111–114. [Google Scholar]
- Ilse, K.; Micheli, L.; Figgis, B.W.; Lange, K.; Daßler, D.; Hanifi, H.; Wolfertstetter, F.; Naumann, V.; Hagendorf, C.; Gottschalg, R.; et al. Techno-economic assessment of soiling losses and mitigation strategies for solar power generation. Joule 2019, 3, 2303–2321. [Google Scholar] [CrossRef] [Green Version]
- Syafiq, A.; Pandey, A.K.; Adzman, N.N.; Rahim, N.A. Advances in approaches and methods for self-cleaning if solar photovoltaic panels. Sol. Energy 2018, 162, 597–619. [Google Scholar] [CrossRef]
- Sarver, T.; Al-Qaraghuli, A.; Kazmerski, L.L. A comprehensive review of the impact of dust on the use of solar energy: History, investigations, results, literature, and mitigation approaches. Renew. Sustain. Energy Rev. 2013, 22, 698–733. [Google Scholar] [CrossRef]
- Brophy, B.; Abrams, Z.; Gonsalves, P.; Christy, K. Field performance and persistence of anti-soiling coatings on photovoltaic glass. In Proceedings of the 31st European Photovoltaic Solar Energy Conference and Exhibition (EU PVSEC 2015), Hamburg, Germany, 14–18 September 2015; pp. 2598–2602. [Google Scholar]
- Quan, Y.Y.; Zhang, L.Z. Experimental investigation of the anti-dust effect of transparent hydrophobic coatings applied for solar cell covering glass. Sol. Energy Mater. Sol. Cells 2017, 160, 382–389. [Google Scholar] [CrossRef]
- Ilse, K.K.; Figgis, B.W.; Naumann, V.; Hagendorf, C.; Bagdahn, J. Fundamentals of soiling processes on photovoltaic modules. Renew. Sustain. Energy Rev. 2018, 98, 239–254. [Google Scholar] [CrossRef]
- Piliougine, M.; Cañete, C.; Moreno, R.; Carretero, J.; Hirose, J.; Ogawa, S.; Sidrach-de-Cardona, M. Comparative analysis of energy produced by photovoltaic modules with anti-soiling coated surface in arid climates. Appl. Energy 2013, 112, 626–634. [Google Scholar] [CrossRef]
- Venkateswara Rao, A.; Kalesh, R.R.; Amalnerkar, D.P.; Seth, T. Synthesis and characterization of hydrophobic TMES/TEOS based silica aerogels. J. Porous Mater. 2003, 10, 23–29. [Google Scholar]
- Ganesh, V.A.; Raut, H.K.; Nair, A.S.; Ramakrishna, S. A review of self-cleaning coatings. J. Mater. Chem. 2011, 21, 16304–16322. [Google Scholar] [CrossRef]
- Nundy, S.; Ghosh, A.; Mallick, T.K. Hydrophilic and superhydrophilic self-cleaning coatings by morphologically varying ZnO microstructures for photovoltaic and glazing applications. ACS Omega 2020, 5, 1033–1039. [Google Scholar] [CrossRef] [PubMed] [Green Version]
- Lorenz, T.; Klimm, E.; Weiss, K.-A. Soiling and anti-soiling coatings on surfaces of solar thermal systems—Featuring an economic feasibility analysis. Energy Procedia 2014, 48, 749–756. [Google Scholar] [CrossRef]
- Pop, S.C.; Schulze, R.; Brophy, B.; Maghsoodi, S.; Sam Yang, Y.; Abrams, Z.R.; Gonsalves, P. Development of an ion-barrier film on solar panel glass. In Proceedings of the 2015 IEEE 42nd Photovoltaic Specialist Conference (PVSC), New Orleans, LA, USA, 14–19 June 2015; pp. 1–6. [Google Scholar]
- Bhushan, B.; Jung, Y.C.; Koch, K. Micro-, nano- and hierarchical structures for superhydrophobicity, self-cleaning and low adhesion. Philos. Trans. R. Soc. A 2009, 367, 1631–1672. [Google Scholar] [CrossRef] [PubMed]
- Barthlott, W.; Neinhuis, C. Purity of the sacred lotus, or escape from contamination in biological surfaces. Planta 1997, 202, 1–8. [Google Scholar] [CrossRef]
- Isbilir, K.; Lisco, F.; Womack, G.; Abbas, A.; Walls, J.M. Testing of an anti-soiling coating for PV module cover glass. In Proceedings of the 2018 IEEE 7th World Conference on Photovoltaic Energy Conversion (WCPEC), Waikoloa Village, HI, USA, 10–15 June 2018; pp. 3426–3431. [Google Scholar]
- Standard: BSI. BS EN 61215-1-4:2017. Terrestrial Photovoltaic (PV) Modules—Design Qualification and Type Approval Part 1–4: Special Requirements for Tsting of Thin-Film Cu(In,Ga)(S,Se)2 Based Photovoltaic (PV) Modules; BSI: London, UK, 2017. [Google Scholar]
- Bukhari, S.F.; Lisco, F.; Bozorgzad Moghim, T.; Taylor, A.; Walls, J.M. Development of a hydrophobic, anti-soiling coating for PV module cover glass. In Proceedings of the 2019 IEEE 46th Photovoltaic Specialists Conference (PVSC), Chicago, IL, USA, 16–21 June 2019; pp. 2849–2853. [Google Scholar]
- Strauss, B.; Lisco, F.; Bukhari, S.F.; Walls, J.M.; Barth, K.L. Novel hydrophobic coatings for soiling mitigation in the PV industry: Durability and anti-soiling demonstrations. In Proceedings of the 2019 IEEE 46th Photovoltaic Specialists Conference (PVSC), Chicago, IL, USA, 16–21 June 2019; pp. 2899–2903. [Google Scholar]
- Cassie, A.B.D.; Baxter, S. Wettability of porous surfaces. Trans. Faraday Soc. 1944, 40, 546–551. [Google Scholar] [CrossRef]
- Nagayama, G.; Zhang, D. Intermediate wetting state at nano/microstructured surfaces. Soft Matter 2020, 16, 3514. [Google Scholar] [CrossRef] [PubMed]
- Orkan Uçar, I.; Erbil, H.I. Droplet condensation on polymer surfaces: A review. Turk. J. Chem. 2013, 37, 643–674. [Google Scholar] [CrossRef]
- Bhaduri, S.; Alath, A.; Mallick, S.; Shiradkar, N.S.; Kottantharayil, A. Identification of stressors leading to degradation of anti-soiling coating in warm and humid climate zones. IEEE J. Photovolt. 2020, 10, 166–172. [Google Scholar] [CrossRef]
- Oehler, G.C.; Lisco, F.; Bukhari, F.; Uličná, S.; Strauss, B.; Barth, K.L.; Walls, J.M. Testing the durability of anti-soiling coatings for solar cover glass by outdoor exposure in Denmark. Energies 2020, 13, 299. [Google Scholar] [CrossRef] [Green Version]
Figure 1.
(a) A comparison of modules coated and uncoated and exposed to snowfall in Colorado. Snow did not accumulate on the black thin film CdTe panel with a hydrophobic coating. This panel continued to produce power after snowfall. All other panels were covered in snow; (b) following the snowmelt, residues were deposited on the uncoated panel (left), while the coated panel (right) remained clean. The anti-soiling effect gradually degraded over a few weeks [7].

Figure 2.
Transmittance (%T) and reflectance (%R) and corresponding water contact angle (WCA) and roll off Angle (RoA) measurements up to 500 h of UV exposure of a vacuum deposited hydrophobic coating (A). Transmittance and reflectance values were collected at 550 nm.
Figure 2.
Transmittance (%T) and reflectance (%R) and corresponding water contact angle (WCA) and roll off Angle (RoA) measurements up to 500 h of UV exposure of a vacuum deposited hydrophobic coating (A). Transmittance and reflectance values were collected at 550 nm.

Figure 3.
XPS analysis performed on hydrophobic coating A shows the change in (a) C1s and (b) F1s high resolution peaks for as-deposited coupons and after 500 h of UV exposure.
Figure 3.
XPS analysis performed on hydrophobic coating A shows the change in (a) C1s and (b) F1s high resolution peaks for as-deposited coupons and after 500 h of UV exposure.

Figure 4.
(a) XPS high resolution F1s peak before and after 1000 h of DH exposure; (b) zoomed-in XPS spectrum detecting the presence of chlorine after 1000 h of DH exposure and (c) high-resolution Cl2p peak with the appearance of chlorine likely due to contamination. (Coatings B).
Figure 4.
(a) XPS high resolution F1s peak before and after 1000 h of DH exposure; (b) zoomed-in XPS spectrum detecting the presence of chlorine after 1000 h of DH exposure and (c) high-resolution Cl2p peak with the appearance of chlorine likely due to contamination. (Coatings B).

Figure 5.
Planar view SEM images of hydrophobic coatings deposited by solution processing (coating B) (a) as-deposited; (b) after 600 h of UV exposure, and (c) after 1000 h of UV exposure, revealing blister formation, which later developed into pits on the surface.
Figure 5.
Planar view SEM images of hydrophobic coatings deposited by solution processing (coating B) (a) as-deposited; (b) after 600 h of UV exposure, and (c) after 1000 h of UV exposure, revealing blister formation, which later developed into pits on the surface.

Figure 6.
Planar and cross-sectional view SEM images of the hydrophobic coating B deposited by solution processing (spray-coating): (a,d), as-deposited; (b,e), after 500 h of DH exposure showing blister formation and (c,f), after 1000 h of DH exposure revealing the appearance blisters and subsequent exfoliation.

Figure 7.
Planar and cross-sectional SEM images of a hydrophobic coating C deposited by dip-coating—(a,d) as-deposited; (b,e) after 500 h; and (c) after 1000 h of DH showing blister formation.
Figure 7.
Planar and cross-sectional SEM images of a hydrophobic coating C deposited by dip-coating—(a,d) as-deposited; (b,e) after 500 h; and (c) after 1000 h of DH showing blister formation.

Figure 8.
(a) WCA and (b) RoA measurements for up to 1000 h of UV and DH exposure of hydrophobic coatings prepared by spray-coating; (c) WCA and (d) RoA after UV and DH exposure of hydrophobic coatings prepared by dip-coating. Each data point is an average of 7 measurements at different points on the 5 cm × 5 cm coated coupon surface for WCA and an average of 5 measurements for RoA.

Figure 9.
Transmittance (%T) and reflectance (%R) measurements for UV-exposed, (a) spray-coated, and (b) dip-coated hydrophobic coatings; transmittance (%T) and (d) reflectance (%R) of DH-exposed (c) spray-coated, and (d) dip-coated hydrophobic coatings.
Figure 9.
Transmittance (%T) and reflectance (%R) measurements for UV-exposed, (a) spray-coated, and (b) dip-coated hydrophobic coatings; transmittance (%T) and (d) reflectance (%R) of DH-exposed (c) spray-coated, and (d) dip-coated hydrophobic coatings.

Figure 10.
(a,b) Planar views and (c) cross-sectional view of a siloxane-based hydrophobic coating C (deposited by dip-coating) after 1000 h of DH exposure.
Figure 10.
(a,b) Planar views and (c) cross-sectional view of a siloxane-based hydrophobic coating C (deposited by dip-coating) after 1000 h of DH exposure.

Figure 11.
SEM cross-sectional images of hydrophobic coating B (deposited by solution processing), (a) as-deposited, and (b) after 1000 h of DH exposure. The thickness was substantially reduced.
Figure 11.
SEM cross-sectional images of hydrophobic coating B (deposited by solution processing), (a) as-deposited, and (b) after 1000 h of DH exposure. The thickness was substantially reduced.

Figure 12.
SEM cross-sectional images of hydrophobic coating C deposited by dip-coating, (a) as-deposited, and (b) after 500 h of UV exposure and (c) after 1000 h of UV exposure. The coating C reduced in thickness.
Figure 12.
SEM cross-sectional images of hydrophobic coating C deposited by dip-coating, (a) as-deposited, and (b) after 500 h of UV exposure and (c) after 1000 h of UV exposure. The coating C reduced in thickness.

Figure 13.
SEM planar view images of the coating surface showing (a) localized blistering and blister eruption after 400 h of DH; (b) blistering after 1000 h of DH, and (c) delamination of a coating after 1000 h of UV exposure observed on various tested coatings B and C.
Figure 13.
SEM planar view images of the coating surface showing (a) localized blistering and blister eruption after 400 h of DH; (b) blistering after 1000 h of DH, and (c) delamination of a coating after 1000 h of UV exposure observed on various tested coatings B and C.

Figure 14.
(a) Planar SEM and (b) cross-sectional STEM images show the hydrophobic coating A, with the presence of nanoparticles on the coating surface. Note that the gold film is deposited on the surface to prevent charging during SEM imaging.
Figure 14.
(a) Planar SEM and (b) cross-sectional STEM images show the hydrophobic coating A, with the presence of nanoparticles on the coating surface. Note that the gold film is deposited on the surface to prevent charging during SEM imaging.

Figure 15.
Planar view SEM images of the hydrophobic coating A, with nanoparticles (a) as-deposited and (b) after 500 h of UV exposure. The nanoparticles are no longer visible.
Figure 15.
Planar view SEM images of the hydrophobic coating A, with nanoparticles (a) as-deposited and (b) after 500 h of UV exposure. The nanoparticles are no longer visible.


Table 1.
A summary of the types of hydrophobic coatings tested.
| Coating | A | B | C |
|---|---|---|---|
| Deposition Methodology | Vacuum process (Thermal evaporation) | Solution process (Spray) | Solution process (Dip) |
| Thickness (as received) | ~15 nm | ~4 µm | ~1 µm |
| Chlorine used during deposition | No | Yes | Yes |
| Formulation with Fluorine | Yes | Yes | No |
| Chemical Formulation | Fluoropolymer matrix with nanoparticles | Fluoropolymer matrix without nanoparticles | Polysiloxane matrix with and without nanoparticles |
© 2020 by the authors. Licensee MDPI, Basel, Switzerland. This article is an open access article distributed under the terms and conditions of the Creative Commons Attribution (CC BY) license (http://creativecommons.org/licenses/by/4.0/).
Share and Cite
MDPI and ACS Style
Lisco, F.; Bukhari, F.; Uličná, S.; Isbilir, K.; Barth, K.L.; Taylor, A.; Walls, J.M. Degradation of Hydrophobic, Anti-Soiling Coatings for Solar Module Cover Glass. Energies 2020, 13, 3811. https://doi.org/10.3390/en13153811
AMA Style
Lisco F, Bukhari F, Uličná S, Isbilir K, Barth KL, Taylor A, Walls JM. Degradation of Hydrophobic, Anti-Soiling Coatings for Solar Module Cover Glass. Energies. 2020; 13(15):3811. https://doi.org/10.3390/en13153811
Chicago/Turabian StyleLisco, Fabiana, Farwah Bukhari, Soňa Uličná, Kenan Isbilir, Kurt L. Barth, Alan Taylor, and John M. Walls. 2020. "Degradation of Hydrophobic, Anti-Soiling Coatings for Solar Module Cover Glass" Energies 13, no. 15: 3811. https://doi.org/10.3390/en13153811
Note that from the first issue of 2016, this journal uses article numbers instead of page numbers. See further details here.