Marginal Effect of R&D Investment and Impact of Market Reforms—An Empirical Analysis of Japanese Electric Power Companies

1
School of Environment and Society, Tokyo Institute of Technology, 3-3-6, Shibaura, Minato-ku, Tokyo 108-0023, Japan
2
Department of Management, New Mexico Institute of Mining & Technology, 801, Leroy Place, Socorro, NM 87801, USA
3
Tokyo Tech World Research Hub Initiative, School of Environment and Society, Tokyo Institute of Technology, 3-3-6, Shibaura, Minato-ku, Tokyo 108-0023, Japan
*
Author to whom correspondence should be addressed.
Energies 2020, 13(13), 3354; https://doi.org/10.3390/en13133354
Submission received: 29 April 2020
/
Revised: 14 June 2020
/
Accepted: 18 June 2020
/
Published: 1 July 2020
(This article belongs to the Section C: Energy Economics and Policy)
Abstract
:This study examines the marginal effect of Research and Development (R&D) investment and impacts of market liberalization on patenting activities of Japan’s nine incumbent electric power companies. We apply the negative binomial panel data regression model to a data set, comprising of companies from 1999 to 2018 and estimate four models. We find the following significant outcomes. First, retail market liberalization for high voltage consumers proves effective to increase patent applications. Second, R&D investment produces patent applications or a positive marginal effect of R&D on patenting is indicated. These results are consistent with previous findings in a way that deregulation to a certain extent facilitates innovation of firms but it may reverse the effect and decrease inventive activities after a threshold point. In addition, the results show a positive marginal effect of R&D investment on innovations; but the degree of the marginal effect declines with retail market liberalization for high-voltage consumers. This finding implies that innovation efficiency decreases due to the progress of deregulation. This result has critical policy implications; government policies for stimulating inventive activities of electric power companies are necessary and these should ultimately benefit consumers with advanced technology and reasonable prices for energy services.
1. Introduction
Japan’s electricity market reform started in 1995 when the Electricity Business Act was amended after 31 years of enactment, aligning with the global trend of industrial deregulation. Competition was partially introduced in the generation sector in the form of competitive bidding for new generation capacity. Thereafter, market reform has gradually advanced, shifting its focus from generation to retail. The retail market was first liberalized in 2000 for extra-high voltage industrial consumers of over 20,000 V and 2000 kW demand and then extended in 2004 to high voltage industrial consumers of over 6000 V and 500 kW demand. In 2005, all high voltage consumers of over 50 kW demand were liberalized and a wholesale power market (Japan Electric Power Exchange, JEPX) was established and began operations. However, household consumers were not liberalized and switching rates of industrial and commercial consumers remained at low levels. Furthermore, the JEPX did not increase liquidity. The volume of electricity traded in the market was less than 1% of total electricity demand over a long period.
The ineffective competition policy has changed since the March, 2011 Great East Japan Earthquake (GEJE) and Fukushima nuclear power plant disaster. These events accelerated market reform and after continuous and intensive discussions through various government committees for promoting market reform of electricity, the Cabinet approved and announced the “electricity system reform” in April, 2013. The strategy comprises three-step policy tasks—(a) to promote cross-regional operation of the transmission grid system, (b) to realize fully liberalized markets in retail and generation sectors and (c) to make progress in unbundling transmission/distribution network sector using a framework of legal separation. The three phases of improvement were implemented in 2015, 2016 and 2020, respectively.
As of December 2019, there are over 600 new electric power companies conducting retail business and the share of electricity sold by those companies rose to 15.8% in total demand for all consumers. In particular, the share for low voltage consumers, including residential consumers, rose to 16.7% from zero in April 2016 [1]. Under the market reform, business environment for electric power companies has been drastically changing along with consumers’ awareness. They are free to choose electricity suppliers and enjoy a variety of prices and menus reflecting preferences, for example, renewable energy sources and time-of-use prices. These changes are influenced by SDGs (Sustainable Development Goals) of United Nations and diffusions of smart technologies such as smart meters and energy-use visualization tools at homes and offices.
To reform the market further, hard and soft technology innovation is essential in all functions of electric power industry, from generation to retail. It is generally known that new technology innovation and its introduction in the industry is supported by manufacturing companies that supply equipment and operating system to electric power companies. These contributions from outside incumbent electric power companies include high efficiency gas turbine combined cycle (GTCC) power generation and high voltage power line with fewer transmission losses. Superconducting power transmission is expected to be diffused in the near future. To promote these technology innovations, Japan’s incumbent electric power companies often cooperate with equipment manufacturing companies in joint research that would lead to joint application of patents. This is because they are major users and buyers of the equipment and the system and accumulate specialized knowledge for further improvement from the users’ perspectives. Thus, although we acknowledge the importance of power sector innovations from these equipment manufacturing companies, this study focuses on innovation activities in incumbent electric power companies, because they still play important roles in power sector innovations in Japan. Indeed, even after full retail market liberalization through a series of market reforms after the GEJE and the nuclear power accident, approximately 85% of electricity is still supplied by the incumbent electric power companies (our sample includes all nine incumbent electric power companies except the smallest company, Okinawa Electric Power Company, because it is too small to compare with the other incumbent companies and the deregulation process of Okinawa was different from that of the other nine incumbent power companies. Each incumbent power company was a regional monopoly before 2000 with almost 100% share of Japan’s electricity supply. Up until March 2020, the structure of these incumbents was vertically INTEGRATED from generation to retail. Only Tokyo Electric Power Company conducted transmission/distribution unbundling a little earlier than the others due to the Fukushima nuclear accident. As Japan’s electricity market liberalization has been implemented gradually, the nine incumbent electric power companies still supply almost 85% of the total load of electricity in Japan). Therefore, examining R&D (Research and Development) investment and innovation activities of incumbent electric power companies are effective in discussing policy implications, thereby facilitating the future development of the electricity market.
To evaluate the efficiency of R&D investment, this study measures marginal effects of R&D expenses on the number of published unexamined patent applications by nine electric power companies in Japan. In addition, we examine the influence of market reform on patent applications. We consider the number of patent applications as an alternative measure of a holistic outcome of R&D activities. In particular, we examine whether (a) R&D investment effectively produces patent applications, (b) the level of marginal effects of R&D investment has changed due to the gradual progress in electricity market reforms and (c) the market reform itself influenced the patent applications. For this purpose, we apply negative binomial regression to a panel data set of Japan’s nine incumbent electric power companies from 1999 to 2018.
2. Literature Review
Energy R&D has become increasingly important around the globe. Bointner et al. [2] examined public expenditures for energy R&D in Europe and the resulting energy knowledge stock based on two different scenarios. In particular, the study compared the energy R&D expenditures and the knowledge stock of the EU member states and the European Commission employing a newly proposed scheme for a period over 3 decades, claiming the growing importance of research on energy efficiency and renewable energy sources. Zafar et al. [3] examined the relationship between non-renewable and renewable energy consumption and economic growth in Asia-Pacific Economic Cooperation countries through the performance of several econometric approaches. The results showed the stimulating role of energy consumption in economic growth. They also indicated that R&D expenditures, although not limited to energy sector R&D, had a positive influence on economic growth of the countries. Popp [4] examined the marginal effect of government R&D for alternative energy research on new scientific publications using econometric estimations. The study found that US$ 1 million of additional government funding leads to one to two additional publications but also indicated that the effects were associated with lags as long as 10 years between initial funding and publication.
The relationship between deregulation and energy R&D was first discussed in Dooley [5]. The study examined trend in energy related R&D investment in selected OECD nations using a time series data set over the 1980s and 1990s. The research found a decreasing trend of energy R&D in public and private sectors after market deregulation. In addition, the study found that deregulation influenced utility-sponsored R&D to focus on short-term, low risk projects and the consumers may receive benefit in the short run from lower energy prices but in the long run, it could have negative impact on national energy sectors, economies and environmental wellbeing.
The same issue was highlighted by Jamasb et al. [6] and Sterlacchini [7]. Jamasb et al. [6] analyzed expected causes for the decline in R&D spending on electricity sector. They claimed that R&D productivity and innovative output by utilities and equipment suppliers appeared to have improved after liberalization; however, a continuing decrease in R&D expenditure had a negative long-term impact on technological progress and innovation in the sector. Sterlacchini [7] indicated that the most advanced economies in the world saw a drastic reduction in R&D expenditures devoted to energy or electricity from 1990 to 2004. The study analyzed data from 2000 to 2007, focused on 10 major electric companies of the world and revealed that the decrease in research expenditures was particularly strong among private or newly privatized companies. On the contrary, those companies that remained under government regulation did not dramatically reduce their R&D efforts.
A more rigorous empirical relationship via performing an econometric analysis between innovation and regulation was analyzed in a few studies. For example, Cambini et al. [8] examined the influence of deregulation policy on energy technology innovation of the European Union (EU) electric power industry from 1990 to 2009; by using data of R&D expenditure budgets, patent applications and indicators of electricity regulation that were published by the Organization for Economic Co-operation and Development (OECD). Their analysis revealed that the number of patent applications increased after the progress of deregulation, which indicated the contribution of market liberalization to innovation of electric power industry.
Meanwhile, Kim et al. [9] claimed the opposite results. They examined effects of various types of market liberalization on R&D investment. They used an unbalanced panel data set consisting of 70 electricity-generating firms from fifteen OECD countries. They revealed that market liberalization reduced R&D investment and that it might be harmful to the electricity system by way of less reliability and efficiency and to the creation and maintenance of innovation capabilities that are necessary to cope with demand and environmental problems.
Marino et al. [10] is a recent study on the effect of deregulation of innovation in the electricity sector. The study used patent and regulation data from a sample of 31 OECD countries and performed a difference-in-difference regression analysis to examine the relationship between regulation and innovation. They revealed an inverted U-shaped relationship between regulation and innovation. This implies that the progress of market liberalization contributed to an increase in the number of patents initially but further progress of liberalization led to a decrease in the patents. The authors concluded that a drastic liberalization process may produce positive impacts on production efficiency and price reduction but may have the unexpected result of possible stagnation in innovation. From this result, Marino et al. [10] also claimed it was necessary to provide firms operating in the sector with sufficient incentives for innovation efforts.
As observed in previous studies, the relationship between deregulation and innovation can have either a negative or positive outcome. The aforementioned studies are based on sample data from multiple countries and attempt to draw general information and policy implications, since such generality is important for assessing a broader trend of the issue. However, country-specific research is also important to reinforce findings from previous studies and examine whether those findings are applicable to a specific case; industry structure and policies that may vary across countries, with diverse aspects and insights on the issue. According to the regulatory intensity index used in Marino et al. [10], Japan is one of the lowest (advanced deregulation) five countries as well as UK, Spain, Norway and Germany. However, market reform was not implemented at once, it has been conducted gradually since 1995. Therefore, studies on the Japanese electric power industry focused on the deregulation process, newly introduced system in liberalized market and impacts on deregulation on productive efficiency of firms [11,12,13,14,15]. To fill the gap between critical role of inventive activities of firms for sustainable development and scarcity of previous research on Japan’s electric power industry, this study provides another perspective on the relationship between innovation and deregulation in the Japanese electric power industry. In addition, this study examines the influence of R&D investment on patenting activities by measuring the marginal effect of R&D investment. To the best of our knowledge, there are few studies that analyze the marginal effect of R&D investment on the number of patents. Thus, by examining the marginal effect, this study contributes to the sparse literature on this topic. Furthermore, one of the major contributions of this study is its use of a novel dataset to analyze R&D activity, R&D investment and the number of patents in the Japanese electricity sector in the period 1999–2018.
3. Method and Data
3.1. Model
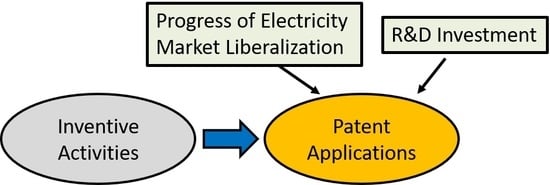
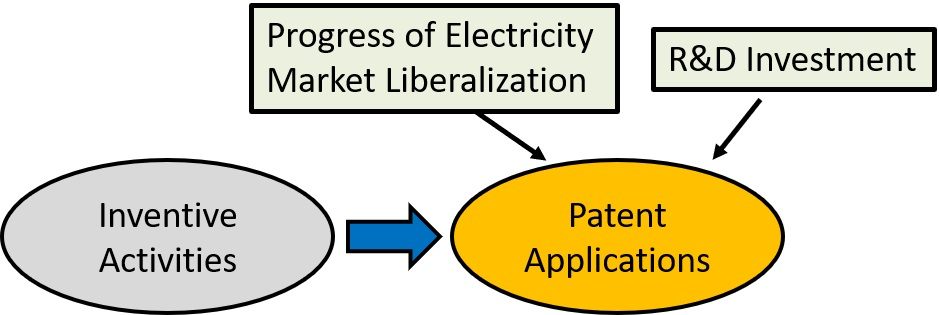
This study focuses on the number of published unexamined patent applications to represent a holistic outcome of R&D activities of firms. According to Figure 3 in Griliches [16], the number of patents is a good indicator of “inventive output,” which is an unobservable variable of net accretion of economically valuable knowledge. The knowledge-creation process starts from firms’ inventive activity, usually R&D expenditures and/or the number of research scientists that are directed towards the production of unobserved economically valuable knowledge. In the process, visible outputs from the accretion of economically valuable knowledge are firms’ growth, productivity, profitability and the stock market value of a firm or industry, although they are also influenced by other observed variables and random variables.
Historically, knowledge and patent production functions were analyzed; for example, R&D investment was an input and the number of patents was an output. Following the same concept, this study considers a basic model in which R&D investment is an input and the number of published unexamined patent applications is an output. Thus, our empirical model is described as the following equation.
where is the number of published unexamined patent applications of the i th company in the t th period. Equation (1) uses the following variables—(a) is a constant term for the i th company, (b) is a logarithm of R&D expenditure of the i th company in the th period, (c) is a logarithm of the number of employees on the i th company in the th period, (d) is a logarithm of the operating expenses of the i th company in the th period and (e) is a ratio of joint application to total application of patents of the i th company in the th period. The last variable is added to independent variables to examine whether joint application of patents with other electric power companies or the other companies in different industrial sectors facilitate inventive activities and (f) is a random error term.
It should be noted that we use a two-period lag in independent variables to reflect the time lag in publication, publicly announcing the application and concrete contents of the invention because unexamined patent publication bulletin is published after one and a half years from the date of the patent application (on 1 January 2002, an early publication system of unexamined applications was introduced so that the application would be announced before 1.5 years to catch up with the recent high speed of technological development. If the early publication system were applied, the application would be announced before 1.5 years but this study assumes that the 1.5-year rule is applied to all applications and uses a 2-year time lag for independent variables).
Furthermore, DEREG1, DEREG2 and DEREG3 are dummy variables that express different impacts of market liberalization on inventive activities in electric power companies. Concretely, DEREG1 represents retail market liberalization for extra-high voltage consumers whose contract is over 2000 kW. The variable takes 1 from 2000 to 2018 and 0 otherwise. DEREG2 represents the retail market liberalization for high voltage consumers whose contract is over 50 kW. The variable takes 1 from 2005 to 2018 and 0 otherwise. Finally, DEREG3 represents a series of electricity system reforms after the occurrence of the GEJE and the Fukushima Daiichi nuclear power plant disaster. The variable takes 1 from 2011 to 2018 and 0 otherwise. Since this study is interested in the marginal effect of R&D investment on patents to measure innovation productivity and impacts of market reform, (), (DEREG1), (DEREG2), (DEREG3) are the parameters of interest and the other variables are control variables.
The study examines four models in terms of the dependent variable—
Model-1—The number of published unexamined patent applications that include all the supply chains of electric power companies consisting of generation, transmission/distribution network and retail business.
Model-2—Those for generation technology.
Model-3—Those for transmission/distribution network technology.
Model-4—Those for retail business technology.
This study applies a panel data negative binomial regression analysis to the data set of nine incumbent electric power companies as the dependent variable is a count data with non-negative integer values. It is known that the basic model applicable to this type of discontinuous data is a Poisson distribution model. The negative binomial regression model is further developed to cope with over dispersion including zero data; therefore, this study uses the latter model. In addition, the use of panel data estimation is expected to alleviate a possible endogeneity problem between the dependent variable (number of patents in this study) and independent variable (R&D investment), because correlation factors can be captured in a fixed effect component in the estimation.
3.2. Data
This study uses panel data pertaining to nine incumbent electric power companies (they consist of Hokkaido Electric Power Company (EPCo), Tohoku EPCo, Tokyo EPCo, Chubu EPCo, Hokuriku EPCo, Kansai EPCo, Chugoku EPCo, Shikoku EPCo and Kyushu EPCo) from 1999 to 2018. The information of unexamined patent applications is obtained from the PATENTSCOPE database, which is prepared and made available by World Intellectual Property Organization (WIPO). This database provides us with patent documents of approximately 60 countries/regions and we can access Japan’s patent documents after 8 January 1993. The study selected patents from the database that satisfied at least two criteria—(a) the patents were published between 1999 and 2018 and (b) an applicant or a principal applicant in a joint application is an incumbent electric power company.
We have collected total patents for each company that cover all sections from A to H (In IPC classification, A is basic goods, B is treating operation and transportation, C is chemistry and metallurgy, D is fiber and paper, E is fixed structure, F is machine engineering, lighting, heating, weapon, explosion, G is physics and H is electricity. Sterlacchini [7] uses IPC section H (electricity) for their outcome variable of patents granted by the European Patent Office) of the International Patent Classification (IPC). The IPC is an internationally standardized uniform classification system of patents by technologies and it is used as a tool to search patents documents. The classification codes are described in the unexamined patent publication bulletin. They are hierarchically structured from the first to the fifth ranks. In particular, the first rank is a section, second rank is a class, third rank is a sub-class, fourth rank is a group and the fifth or lesser rank is a sub-group. For example, H02S10/12 identifies section H (electricity), class H02 (electricity generation, transformation, distribution), sub-class H02S (electricity generation by transformation of infrared light, visible light or ultraviolet light), group H02S10 (electricity generation facility of photovoltaic), sub-group H02S10/12 (hybrid energy system of wind and photovoltaic).
Furthermore, to assess the total patents for each company, this study has collected patents in the limited area of sub-classes related to H (electricity) and G (physics) as they are highly relevant functions in the operation of electric power companies. The functions or sectors analyzed in this study are generation, transmission/distribution network and retail. Table 1 describes those sub-classes used for the collection of patent applications in the study.
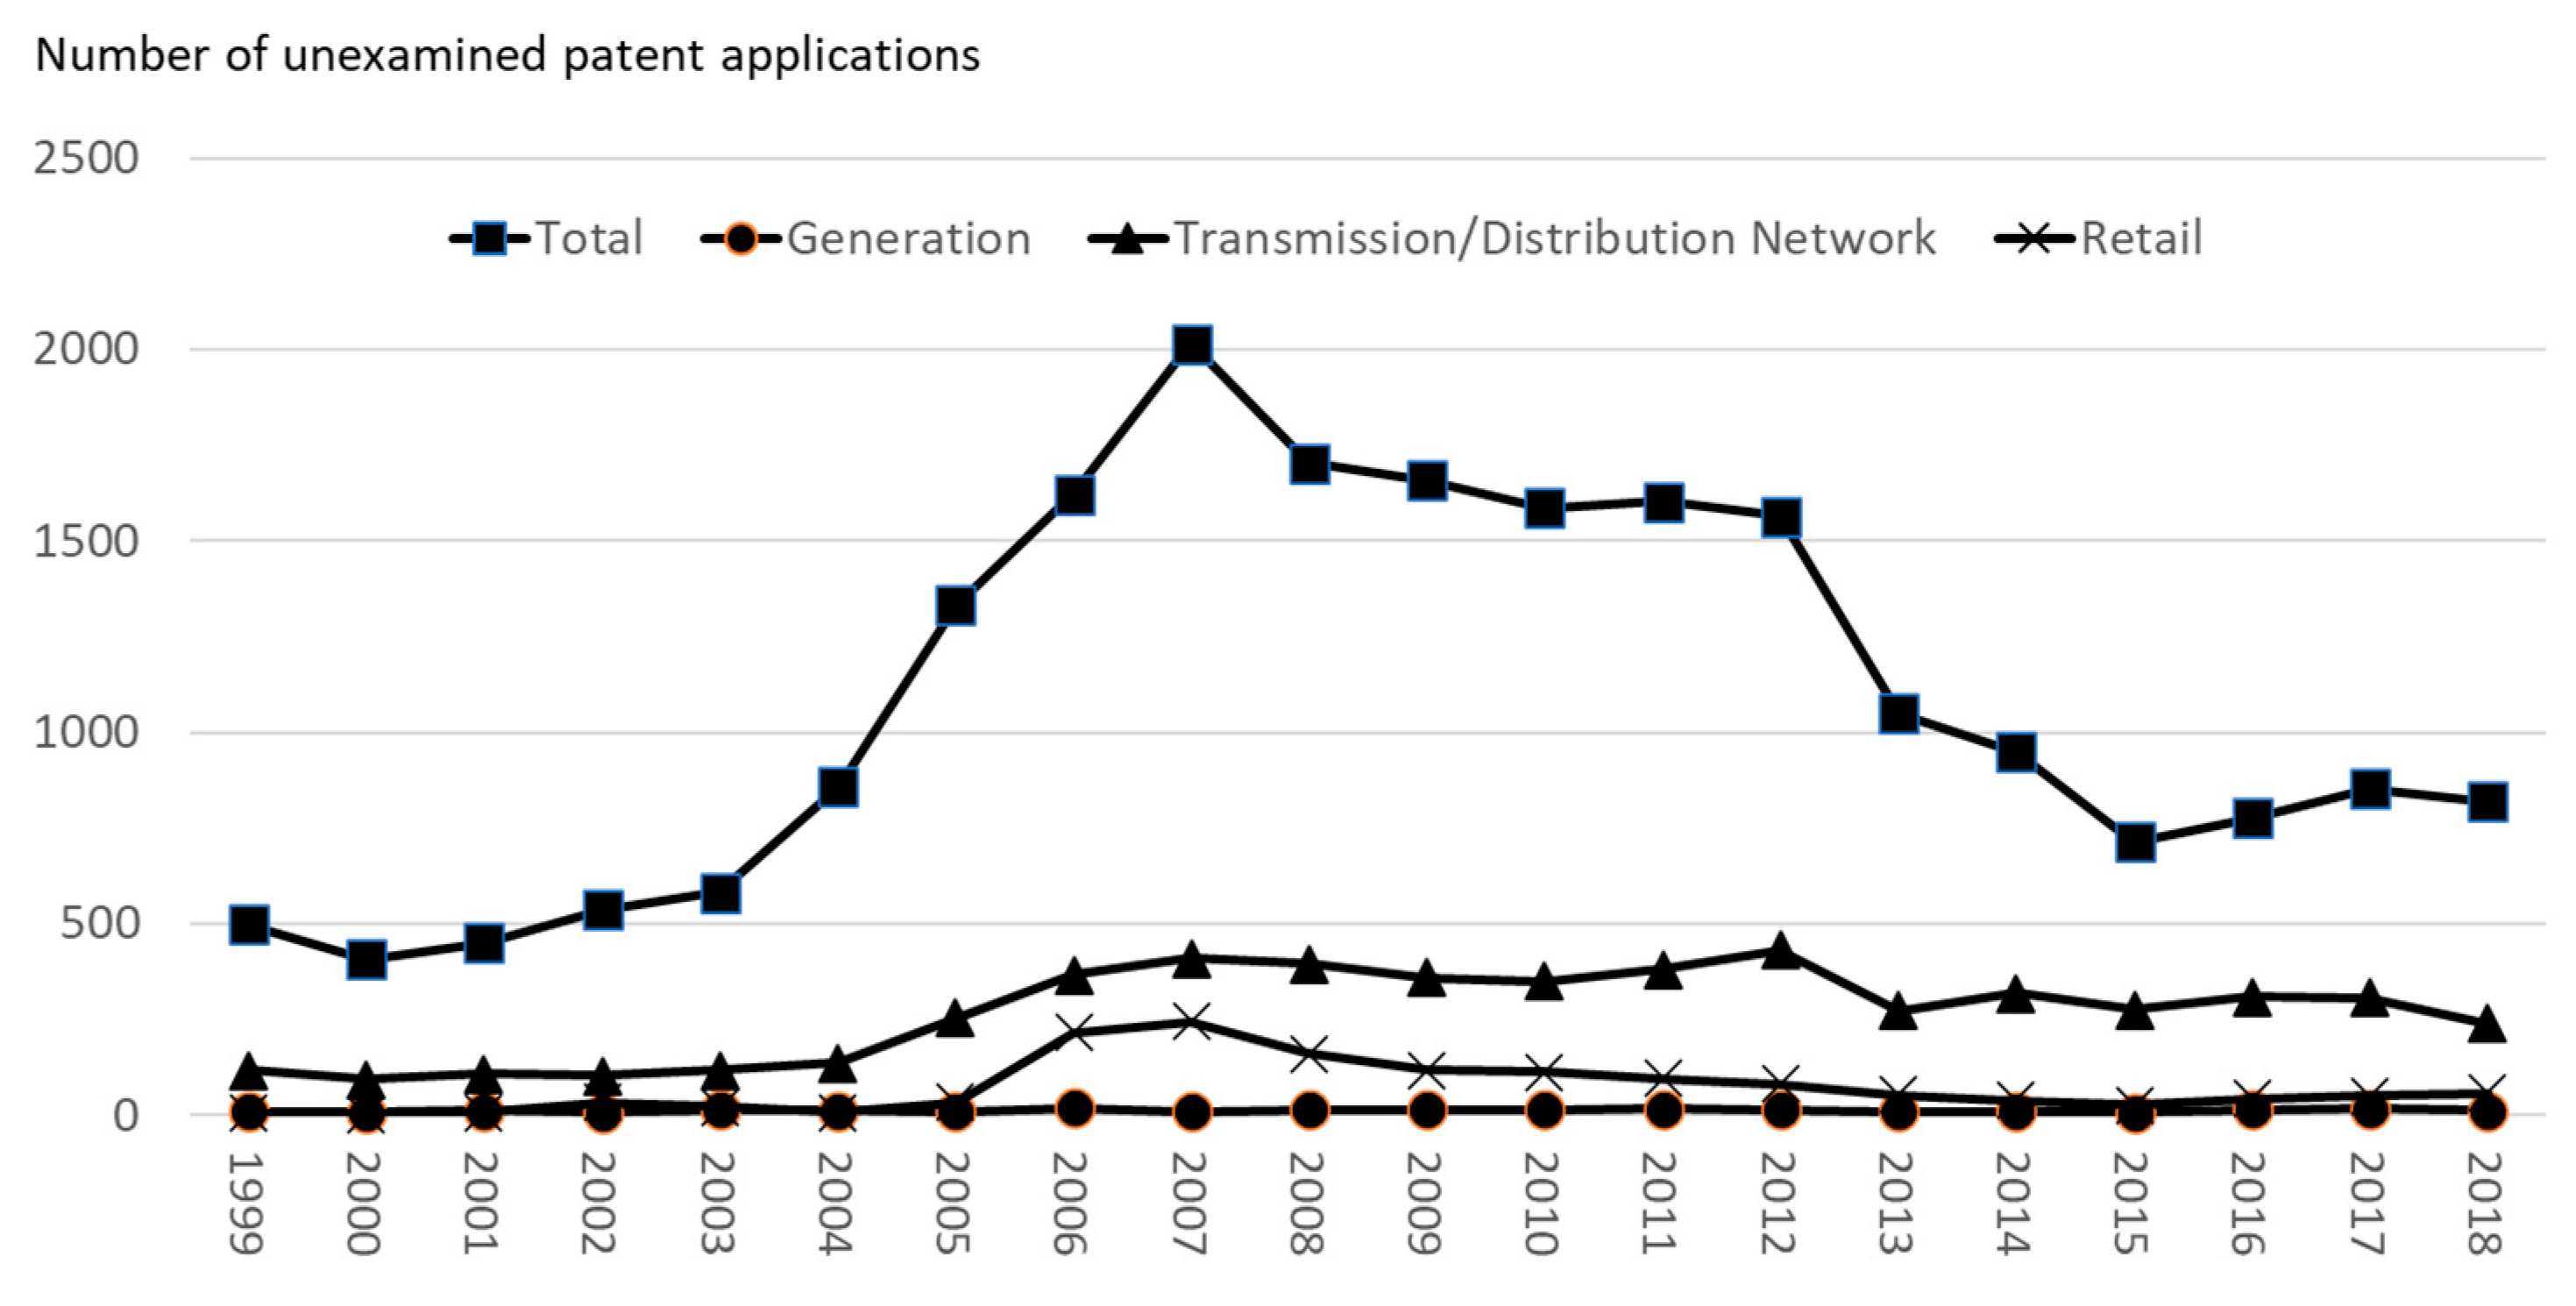
Figure 1 presents trend of the number of patent applications for total of the company, generation, transmission/distribution and retail functions. Here, the value of “total” is not equal to a simple sum of numbers of each function, because the total of a company includes wide range of sub-classes that are not listed in Table 1. As depicted in Figure 1, the total number of patent applications peak in 2007 and then it gradually declines by 2015. A similar trend is observed in retail but the number of patents is minor compared to the total, hence the changes are ambiguous in the study. The trend of transmission/distribution is different from the total, which increased from 2004 and plateaued after 2006.
Supplementary data was obtained from the financial statements of each company. Descriptive statistics of the data are summarized in Table 2.
4. Empirical Results
This study applied negative binomial panel data regression models to a data set consisting of Japan’s nine incumbent electric power companies from 1999 to 2018 (we performed the regression using STATA Ver.15). Under government regulation, they have been allowed to monopolize the market over their stipulated supply area before starting gradual retail market liberalization in 2000. They are still the major players in electricity market, retaining a complete range of business licenses from generation to retail, even after legal unbundling of transmission/distribution network undertaken in April 2020.
As a result of the Hausman test, fixed-effects model was selected for all the models (Models 1–4 and Models 1a–4a) as an appropriate model for estimation. Table 3 shows estimation results of Models 1–4.
Model-1: Total patents
First, the estimated coefficient of is 0.829 and significant at the 1% level. This indicates the marginal effect of R&D investment is 0.829, that is, 1% increase in R&D investment produces 0.829 additional patents in Japan’s incumbent electric power companies. Second, the impact of market liberalization; DEREG1 and DEREG2 are positive and significant at least at the 5% level but DEREG3 is negative and significant at the 10% level. This seems to indicate that a certain level of market liberalization positively influences the inventive activities of electric power companies. In particular, after retail market liberalization of DEREG1 and DEREG2, corporate managers in incumbent electric power companies sensed competitive pressure and made efforts to retain business with these large-scale customers by negotiating with them for better tariffs and other supply conditions. We consider such preemptive actions of incumbent power companies were the result of competitive pressure under deregulation and the pressure also influenced behavior of incumbent companies to increase their competitive capabilities. Meanwhile, more advanced liberalization seems to reverse the effect and negatively impacts innovation, probably due to strong competitive pressure and cost-saving policies of the management. This is consistent with the results of Marino et al. [10], which show an inverse U-shaped relationship between the progress of liberalization and patent production.
Model-2: Patents for Generation Technologies
There are no statistically significant coefficients for variables of interest above the horizontal line in Table 3. R&D and market liberalization do not influence innovation of inventive activities for generation technologies. Given that generation sector was first liberalized in the early stages of market reform, unlike retail market with gradual introduction of liberalization, the deregulation policy of the generation sector has been relatively stable. Conversely, deregulation dummies are linked to retail market and therefore, the generation sector is not largely influenced by DEREG dummies.
Model-3: Patents for Transmission/Distribution Network Technologies
The estimated coefficient of is 0.657 and significant at the 5% level. This indicates that the marginal effect of R&D investment is 0.657. In other words, a 1% increase in R&D investment generates 0.657 additional patents in Japan’s incumbent electric power companies. The numbers are lower than that of Model-1, the speed of inventive activities is relatively slower in network sector, compared to the “total” of sectors. In terms of the impact of market liberalization, DEREG2 is positive and significant at the 5% level but DEREG1 and DEREG3 are not significant at the 10% level, although the former is positive and the latter is negative. This indicates that at least a certain level of market liberalization can have a positive influence on innovation of electric power companies.
It is interesting to note that Model-3 does not show decreasing trend in patents after the series of market reforms initiated following the GEJE and the Fukushima Daiichi nuclear power accidents. This result is interesting because the transmission/distribution network sector is generally considered as a natural monopoly, thereby regulation is continuously applied and should not be directly influenced by market liberalization. In addition, higher network capacity is increasingly necessary as strong infrastructure is essential to incorporate large volume of intermittent renewable and distributed generations. These factors may explain the underlying rationale behind the stability of patenting activity of transmission/distribution network sector and not be influenced by deregulation policy even during the period of market reform after the GEJE.
Model-4: Patents for Retail Technologies
The estimated coefficient for is not significant but that of DEREG2 is positive and significant at the 1% level. DEREG1 is positive and DEREG3 is negative but they are not significant. It implies that retail market liberalization for high voltage consumers has spurred a momentum of competition for electricity supply and prompted the management of electric power companies to recognize competitive advantage. The said changes in consciousness have influenced the increase in patenting of retail sector.
The estimation results of Models 1–4 indicate that DEREG2 or retail market liberalization for high voltage consumers are effective to increase inventive activities and patent applications except Model-2 for generation sector. It reveals that market liberalization to a certain degree would positively influence innovation in electric power companies.
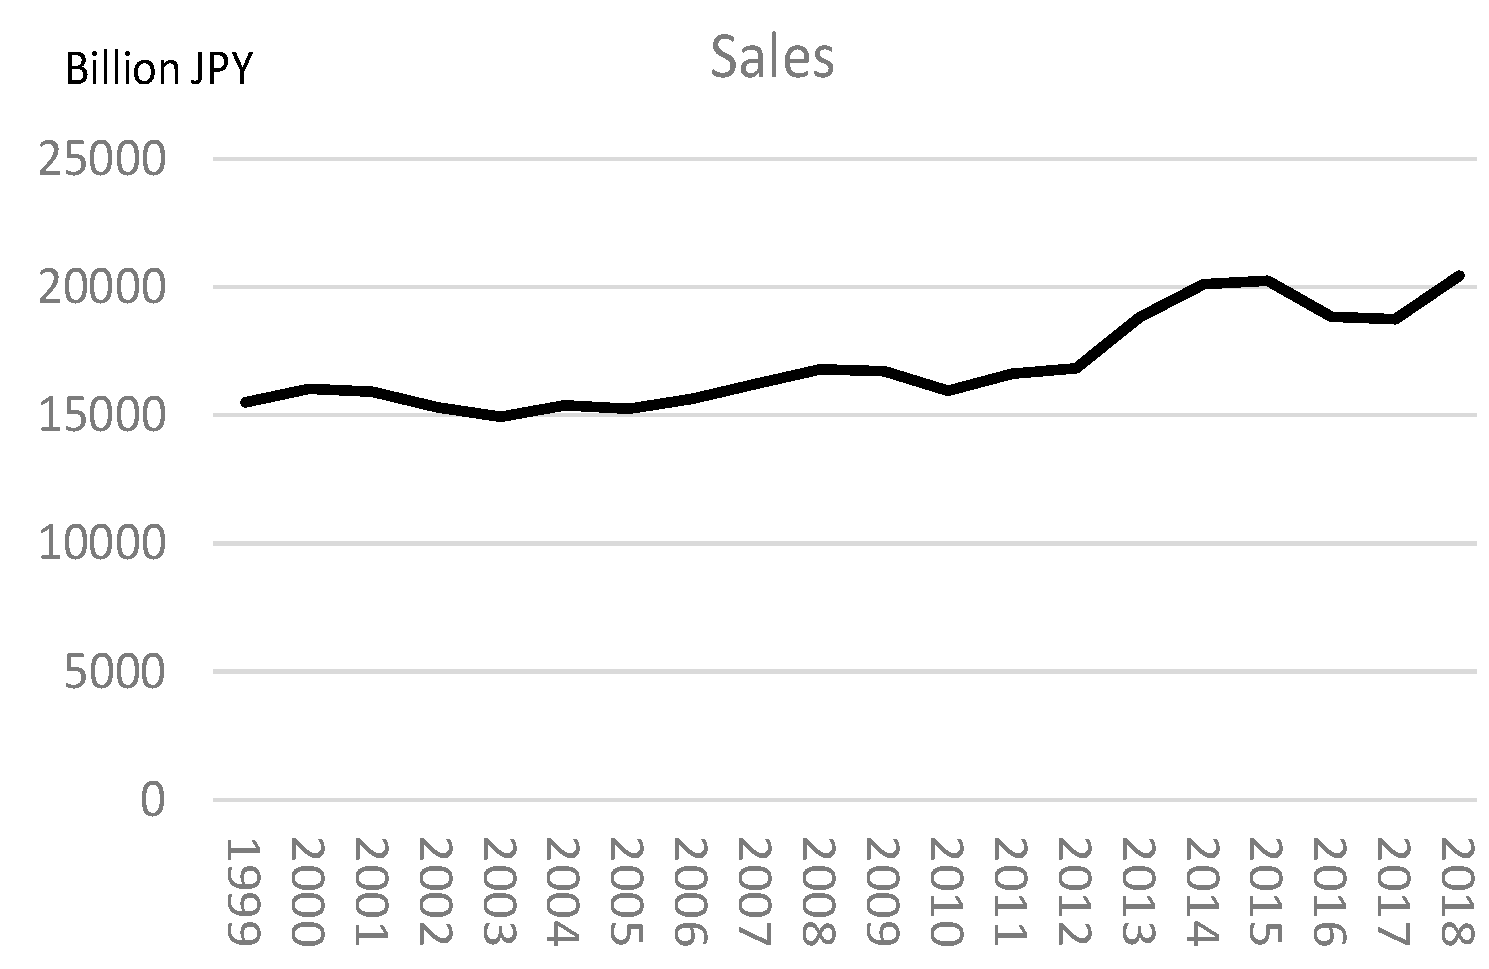
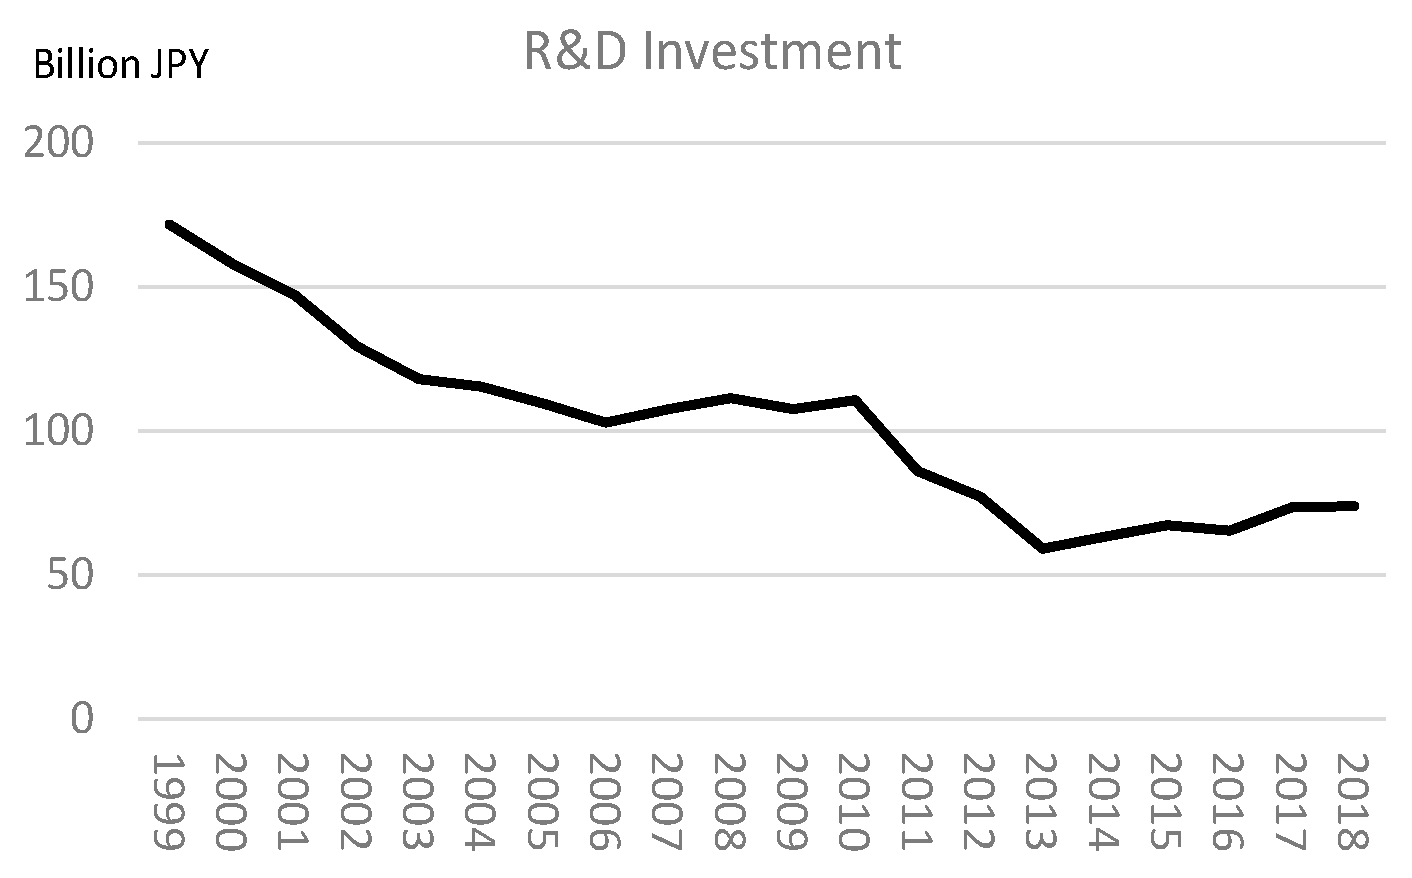
To discuss the possible influence of economic conditions in Japan on R&D investment and patenting activities of electric power companies over the period of this study, we present Figure 2 and Figure 3. Figure 2 shows the trend of the total sum of sales of the nine incumbent electric power companies and Figure 3 shows the trend for R&D investment.
As shown in the two figures, total sales show an increasing trend over the period even after the gradual implementation of deregulation, while R&D investment shows a dramatic decreasing trend, although both have individual fluctuations over time. The increasing trend of total sales in electric power companies comes from Japan’s economic growth over the period. The growth rate of Japan’s gross domestic product (GDP) in nominal terms from 1999 to 2018 is approximately 0.27% per annual. The growth rate is relatively modest and is temporarily influenced by such events as the global financial crisis of 2007–2008 and the Fukushima nuclear power disaster in 2011, around which time the increasing trend turned to stagnation. Meanwhile, a decreasing trend of R&D investment is evident and thus, we can point out there is no strong influence from the overall economy on R&D investment in electric power companies and the number of patents in the study period. These different trends among variables are partly due to the characteristic of electricity consumption, which is a typical essential commodity and sales are not sensitive to government regulatory policy changes. Meanwhile, companies’ R&D can be influenced by the progress of deregulation and competitive pressure in the market. Therefore, this study attributes changes in patenting activities of electric power companies to the progress of electricity market liberalization.
In addition, it is interesting to note that estimated coefficients of JOINT are negative and significant at the 5% level for all models except Model-4, although the variable is not a central focus of this study. It indicates that a cooperative R&D with other companies does not necessarily increase patent applications.
To further examine the effect of market reform on firms’ inventive activities, this study performs supplementary estimations that introduce a cross term between and deregulation dummy, DEREG2. Estimation results are similar between with and without the cross term. Newly estimated coefficients of the cross term are negative for all four models and significant in two models, showing a decreasing marginal effect of R&D investment on patenting activities after the deregulation. See Appendix A.
5. Conclusions
This study examined the marginal effect of R&D investment and impacts of market liberalization on patenting activities of Japan’s incumbent electric power companies. For this purpose, we performed a negative binomial regression model analysis applied to the companies over the period of 1999 to 2018. Previous literature varies on views regarding the basis for influence on inventive activities of electric power companies due to deregulation. This study adds to the research outcomes on the relationship between market liberalization and R&D from the perspective of Japan’s electric power industry.
In applying a negative binomial regression model to a panel data set consisting of Japan’s nine incumbent electric power companies, we have estimated four models. The results indicate (a) DEREG2 or retail market liberalization for high voltage consumers has been effective for increasing patent applications except Model-2 for generation. (b) A positive and significant influence from R&D investment to produce patent applications or a positive marginal effect of R&D on patenting, is observed in all models except Model-2 (generation) and Model-4 (retail).
These results are consistent with Marino et al. [10] in the sense that deregulation to a certain extent can facilitate innovation of firms but it seems to reverse the effect and decrease inventive activities after a threshold point. In addition, the results show a positive marginal effect of R&D investment on innovations but the degree of the marginal effect declines with retail market liberalization for high voltage consumers. This implies that innovation efficiency decreases due to the progress of deregulation. This raises critical policy implications. Since innovation is one of most important factors for sustainable economic growth and improvement of electricity service in our society, government policy for stimulating inventive activities of electric power companies may be necessary but it needs to be balanced between cost efficiency and innovation efficiency. If companies obtain competitive edge from innovation and diffuse new technology over the industry, end-users can receive benefits with high quality and reasonably priced energy services. In particular, after a series of market liberalization measures in the electricity system reform that started in 2013, transmission/distribution network sectors remain under government regulation, in which the incentive for innovation may become weaker than that of other deregulated sectors. A distribution network price control and incentive funding for innovation, such as the Low Carbon Networks Fund in the UK, would be an interesting challenge for other countries.
As future tasks, we set forth a path as an extension to this study. First, it is interesting to examine a more rigorous measure of inventive activities than just the number of patent applications used in this study. This is a limitation of this study and thus, it would be useful to construct sophisticated outcome measures of R&D investment, for example, by classifying patents depending on certain standards related to values created from patents. Second, it would be a major challenge but interesting research to use companies’ press releases of invention to construct quantitative measures of inventive activities via text analysis and to integrate this information in econometric analysis. This would provide the latest information on invention. Third, further analysis on the effect of joint applications would yield deep implications, although the negative effects are measured in this study. This may depend on R&D in varying scales, members and technologies. Finally, a promising research direction would be to examine power sector innovations brought by outside the incumbent electric power companies, including venture/startup companies. This includes not only state-of-the-art equipment applying digital technologies but also a blockchain-based peer-to-peer power trading system and related prosumer business opportunities. These four tasks are intriguing future challenges for research in this field.
Author Contributions
Conceptualization, M.G. and K.F.; methodology, M.G.; software, K.F.; validation, M.G.; formal analysis, M.G. and K.F.; investigation, M.G.; resources, K.F.; data curation, K.F.; writing—original draft preparation, M.G. and K.F.; writing—review and editing, M.G. and T.S.; visualization, M.G.; supervision, M.G. and T.S.; project administration, M.G.; funding acquisition, M.G. All authors have read and agreed to the published version of the manuscript.
Funding
This research was funded by Japan Society for the Promotion of Science (JSPS) Grant-in-Aid for Scientific Research (KAKENHI) 19K04878.
Conflicts of Interest
The authors declare no conflict of interest.
Appendix A
To further examine the effect of market reform on firms’ inventive activities, the study performs supplementary estimations that introduce a cross term between and deregulation dummies. For example, if we add a cross term of with DEREG1 in the models, then they are specified as follows.
Variables and subscripts are the same as in Equation (1). The only difference between Equations (1) and (A1) is the introduction of the cross term. A specific deregulation dummy used for the cross term is selected via examining significance in the estimation results of Models 1–4 of Equation (1). Models 1–4, which are formulated by Equation (A1), are referred to as Models 1a–4a in this study.
The estimated coefficient of the cross term () expresses the difference in the marginal effect of R&D investment on patents, which is associated with retail market liberalization. Using the estimated coefficients, we examine changes in marginal effects of R&D investment by comparing and . If or is negative, then the marginal effect of R&D investment decreases after the market reform and the efficiency of inventive activity deteriorates. Meanwhile, if or is positive, then the marginal effect of R&D investment increases after the market reform and the efficiency of inventive activity improves. We now examine the estimation results of Models 1a–4a with a cross term between and DEREG2. DEREG2 is selected for the cross term, because the coefficients of the variable are significant in almost all the models in Table 3. Table A1 summarizes the estimation results.

Table A1.
Estimation results (with cross term).
| Models | Model-1a (Total) | Model-2a (Generation) | ||||||
| Variables | Coefficient | S.D. | t-ratio | Coefficient | S.D. | t-ratio | ||
| ln(RD) | 0.846 | 0.242 | 3.49 | *** | 0.851 | 0.573 | 1.48 | |
| DEREG1 | 0.427 | 0.195 | 2.19 | ** | −0.185 | 0.484 | −0.38 | |
| DEREG2 | 0.831 | 0.944 | 0.88 | 10.529 | 3.087 | 3.41 | *** | |
| DEREG3 | −0.346 | 0.179 | −1.93 | * | −0.145 | 0.355 | −0.41 | |
| ln(RD) × DEREG2 | −0.049 | 0.101 | −0.48 | −1.080 | 0.314 | −3.43 | *** | |
| ln(EMP) | 0.628 | 0.488 | 1.29 | 0.977 | 1.467 | 0.67 | ||
| ln(OE) | −1.073 | 0.454 | −2.37 | ** | −1.859 | 1.207 | −1.54 | |
| JOINT | −0.012 | 0.003 | −4.57 | *** | −0.016 | 0.007 | −2.36 | ** |
| constant | 3.087 | 2.891 | 1.07 | 11.132 | 9.286 | 1.2 | ||
| Log likelihood | −681.007 | −151.655 | ||||||
| Models | Model-3a (Transmission/Distribution) | Model-4a (Retail) | ||||||
| Variables | Coefficient | S.D. | t-ratio | Coefficient | S.D. | t-ratio | ||
| ln(RD) | 0.749 | 0.331 | 2.26 | ** | 1.180 | 0.588 | 2.01 | ** |
| DEREG1 | 0.306 | 0.290 | 1.06 | 0.934 | 0.595 | 1.57 | ||
| DEREG2 | 2.754 | 1.430 | 1.93 | * | 5.143 | 2.977 | 1.73 | * |
| DEREG3 | −0.262 | 0.243 | −1.08 | −0.192 | 0.370 | −0.52 | ||
| ln(RD) × DEREG2 | −0.250 | 0.151 | −1.66 | * | −0.395 | 0.302 | −1.31 | |
| ln(EMP) | 0.899 | 0.702 | 1.28 | 1.090 | 1.292 | 0.84 | ||
| ln(OE) | −0.987 | 0.616 | −1.60 | −1.769 | 1.015 | −1.74 | * | |
| JOINT | −0.013 | 0.004 | −3.40 | *** | −0.002 | 0.005 | −0.31 | |
| constant | −0.436 | 3.665 | −0.12 | 2.275 | 5.528 | 0.41 | ||
| Log likelihood | −487.117 | −259.938 | ||||||
Note: ***, ** and * indicate significance at the level of 1%, 5% and 10%, respectively. Variables with t-ratios marked in grey shadow are significant at least at the 10% level. Variables below the horizontal line are control variables.
Model-1a: Total Patents
First, the estimated coefficient of is 0.846 and significant at the 1% level. This result is similar to the outcome in Table 3 without a cross term. It indicates that the marginal effect of R&D investment is 0.846 and 1% increase in R&D investment produces 0.846 additional patents in Japan’s incumbent electric power companies. In terms of the market liberalization impact, DEREG1 is positive and significant at the 5% level and DEREG3 is negative and significant at the 10% level but DEREG2 is not significant at the 10% level with a positive coefficient. These results are almost identical to those in Table 3, indicating that a certain level of market liberalization can have a positive influence on patenting of electric power companies but more advanced liberalization reverses the effect and has a negative impact on innovation. The cross term between and DEREG2 is not significant and does not influence the marginal effect of R&D investment.
Model-2a: Patents for Generation Technology
The estimated coefficient of is 0.851 but not significant at the 10% level. Meanwhile, that for the cross term between and DEREG2 is significant at the 1% level with a negative coefficient of -1.080. The coefficient of DEREG2 is positive and significant and hence, different from Model-2 in Table 3. The results indicate that retail market liberalization for high voltage consumers influences the increase in the number of patents in the generation sector; but due to liberalization, the marginal effect of R&D investment on the number of patents decreased from 0.851 to −0.229 (=0.851−1.080). Although the estimated coefficient of is not significant at the 10% level, the change in the marginal effect after the liberalization is large enough to shift from positive to negative values.
Model-3a: Patents for Transmission/Distribution Network Technology
The estimated coefficient of is 0.749 and significant at the 5% level. This indicates the marginal effect of R&D investment is 0.749. In other words, a 1% increase in R&D investment produces 0.749 additional patents in Japan’s incumbent electric power companies. In terms of market liberalization impact, DEREG2 is positive and significant at the 10% level but DEREG1 and DEREG3 are not significant at the 10% level. These results are identical to those in Table 3 without a cross term of DEREG2 with . This shows that a certain level of market liberalization can have a positive influence on the innovation of electric power companies. In addition, the estimated coefficient for the cross term is negative at −0.250 and significant at the 10% level. This displays a decreasing marginal effect of R&D investment on patenting from 0.749 to 0.499 (=0.749−0.250).
Model-4a: Patents for Retail Technology
The estimated coefficient for is 1.180 and significant at the 5% level, which is different from Table 3. This indicates that a 1% increase in R&D investment leads to 1.180 additional applications of patents. Meanwhile, the estimated coefficient for DEREG2 is identical to Table 3, which is positive and significant at the 10% level. This implies that market liberalization for high voltage consumers has spurred the momentum for competition and has prompted the management of electric power companies to recognize the importance of taking competitive advantage in technology. The changes in consciousness have influenced the increase in inventive activities of the retail sector.
The estimation results of Models 1a–4a reveal that there is a similar trend among the models. First, DEREG2 or retail market liberalization for high voltage consumers has been effective in increasing patent applications except Model-1a (total). Second, the positive influence of R&D investment to produce patent applications is observed in all models except Model-2a (generation). The two are primarily the same as those in Table 3. Third, the cross term between and DEREG2 is negative for all models, and it is significant in Model-2a at the 1% level and Model-3a at the 10% level. In addition, it is interesting to note that the estimated coefficients of JOINT are negative and significant at least at the 5% level for all models except Model-4a, which is similar to the observation in Table 3. It is confirmed that cooperative R&D with other companies does not necessarily increase patent applications even in models with a cross term.
References
- Agency for Natural Resources and Energy. Available online: https://www.meti.go.jp/shingikai/enecho/denryoku_gas/denryoku_gas/pdf/022_03_00.pdf (accessed on 25 March 2020).
- Bointner, R.; Pezzutto, S.; Sparber, W. Scenarios of public energy research and development expenditures: Financing energy innovation in Europe. Wires Energy Env. 2016, 5, 470–488. [Google Scholar] [CrossRef]
- Zafar, M.W.; Shahbaz, M.; Hou, F.; Sinha, A. From nonrenewable to renewable energy and its impact on economic growth: The role of research & development expenditures in Asia-Pacific Economic Cooperation countries. J. Clean. Prod. 2019, 212, 1166–1178. [Google Scholar]
- Popp, D. Economic analysis of scientific publications and implications for energy research and development. Nat. Energy 2016, 1, 1–8. [Google Scholar] [CrossRef]
- Dooley, J.J. Unintended consequences: Energy R&D in a deregulated energy market. Energy Policy 1998, 26, 547–555. [Google Scholar]
- Jamasb, T.; Pollitt, M. Liberalisation and R&D in network industries: The case of the electricity industry. Res. Policy 2008, 37, 995–1008. [Google Scholar]
- Sterlacchini, A. Energy R&D in private and state-owned utilities: An analysis of the major world electric companies. Energy Policy 2012, 41, 494–506. [Google Scholar]
- Cambini, C.; Caviggioli, F.; Scellato, G. Innovation and market regulation: Evidence from the European electricity industry. Ind. Innov. 2016, 23, 734–752. [Google Scholar] [CrossRef]
- Kim, J.; Kim, Y.; Flacher, D. R&D investment of electricity-generating firms following industry restructuring. Energy Policy 2012, 48, 103–117. [Google Scholar]
- Marino, M.; Parrotta, P.; Valletta, G. Electricity (de)regulation and innovation. Res. Policy 2019, 48, 748–758. [Google Scholar] [CrossRef] [Green Version]
- Goto, M.; Sueyoshi, T. Electricity market reform in Japan after Fukushima. Econ. Energy Environ. Policy 2016, 5, 15–30. [Google Scholar] [CrossRef]
- Maekawa, J.; Hai, B.H.; Shinkuma, S.; Shimada, K. The effect of renewable energy generation on the electric power spot price of the Japan Electric Power Exchange. Energies 2018, 11, 2215. [Google Scholar] [CrossRef] [Green Version]
- Sueyoshi, T.; Goto, M. Efficiency-based rank assessment for electric power industry: A combined use of data envelopment analysis (DEA) and DEA-discriminant analysis (DA). Energy Econ. 2012, 34, 634–644. [Google Scholar] [CrossRef]
- Sueyoshi, T.; Goto, M. Performance Assessment of Japanese Electric Power Industry: DEA Measurement with Future Impreciseness. Energies 2020, 13, 490. [Google Scholar] [CrossRef] [Green Version]
- Sueyoshi, T.; Goto, M. DEA approach for unified efficiency measurement: Assessment of Japanese fossil fuel power generation. Energy Econ. 2011, 33, 292–303. [Google Scholar] [CrossRef]
- Griliches, Z. Patent Statistic as Economic Indicators: A Survey. J. Econ. Lit. 1990, 28, 1661–1707. [Google Scholar]
Figure 1.
Trend of patent applications for total, generation, transmission/distribution network and retail. Note: The number for total is not equal to a simple sum of numbers of each function, because total of a company includes a wide range of sub-classes that are not listed in Table 1.
Figure 1.
Trend of patent applications for total, generation, transmission/distribution network and retail. Note: The number for total is not equal to a simple sum of numbers of each function, because total of a company includes a wide range of sub-classes that are not listed in Table 1.

Figure 2.
Trend of total sales.

Figure 3.
Trend of Research and Development (R&D) investment.

Table 1.
A list of sub-classes of patents analyzed in this study.
| Function | Sub-Class | Sub-Class Contents |
|---|---|---|
| Generation | H02K | Electrical power generator, Electrical motor |
| H02P | Electrical power generator, Electrical motor, Control and arrangement of dynamo-electric converter, Control of reactor or choke coil | |
| H02S | Electricity generation by transformation of infrared light, visible light or ultraviolet light | |
| G21B | Fusion reactor | |
| G21C | Nuclear power reactor | |
| G21D | Nuclear plant | |
| Transmission/Distribution | H02B | Board for electricity supply or distribution, electric power substation or Switchgear |
| H02G | Electrical cable or electrical wire, Composite cable for light and electricity, Electrical installation | |
| H02J | Rotary equipment or method for electricity supply or electricity distribution, Method for accumulation of electrical energy | |
| H02M | Apparatus used with major or similar electricity supply system of AC-AC, AC-DC, DC-DC transformation equipment | |
| Retail | G06Q | Data processing system or method for control purpose, business purpose, financing purpose, management purpose, supervision purpose or forecast purpose or that for the other purposes |
Table 2.
Descriptive statistics.
| Period | Statistics | Number of Published Unexamined Patent Applications | R&D Expenditure (Mio. JPY) | Number of Employees | Operating Expenses (Mio. JPY) | Ratio of Joint Application (%) | |||
|---|---|---|---|---|---|---|---|---|---|
| Total | Generation | Transmission/Distribution | Retail | ||||||
| 1999–2001 | Avg. | 50 | 1 | 12 | 0 | 17,665 | 20,369 | 1,512,540 | 85.7 |
| S.D. | 42 | 2 | 12 | 1 | 16,997 | 13,482 | 1,212,493 | 14.5 | |
| Min. | 3 | 0 | 0 | 0 | 2900 | 6766 | 410,458 | 33.3 | |
| Max. | 138 | 6 | 44 | 5 | 71,430 | 53,704 | 4,561,645 | 100.0 | |
| 2002–2004 | Avg. | 73 | 1 | 13 | 2 | 13,433 | 20,779 | 1,481,630 | 79.7 |
| S.D. | 70 | 2 | 14 | 4 | 10,635 | 14,101 | 1,198,353 | 13.1 | |
| Min. | 10 | 0 | 0 | 0 | 2700 | 6343 | 393,071 | 48.0 | |
| Max. | 280 | 7 | 52 | 16 | 40,344 | 53,380 | 4,480,906 | 100.0 | |
| 2005–2007 | Avg. | 184 | 1 | 38 | 18 | 11,853 | 20,761 | 1,628,396 | 72.0 |
| S.D. | 258 | 2 | 60 | 48 | 9983 | 13,766 | 1,337,520 | 24.4 | |
| Min. | 12 | 0 | 0 | 0 | 2406 | 6148 | 425,647 | 13.7 | |
| Max. | 1204 | 9 | 271 | 209 | 38,100 | 52,584 | 5,342,975 | 100.0 | |
| 2008–2010 | Avg. | 183 | 2 | 41 | 14 | 12,218 | 21,343 | 1,728,325 | 66.1 |
| S.D. | 276 | 3 | 64 | 33 | 11,000 | 14,073 | 1,414,615 | 28.3 | |
| Min. | 5 | 0 | 0 | 0 | 2523 | 6258 | 430,428 | 11.4 | |
| Max. | 966 | 10 | 223 | 135 | 41,600 | 52,970 | 5,820,640 | 100.0 | |
| 2011–2013 | Avg. | 156 | 1 | 40 | 8 | 8233 | 21,981 | 2,069,804 | 66.8 |
| S.D. | 246 | 3 | 75 | 19 | 5778 | 13,150 | 1,680,991 | 27.3 | |
| Min. | 8 | 0 | 0 | 0 | 1388 | 6711 | 480,729 | 7.6 | |
| Max. | 863 | 13 | 277 | 83 | 24,600 | 52,046 | 6,440,042 | 100.0 | |
| 2014–2016 | Avg. | 90 | 1 | 33 | 4 | 7264 | 21,478 | 2,027,323 | 62.6 |
| S.D. | 180 | 2 | 75 | 9 | 4950 | 11,548 | 1,590,517 | 26.0 | |
| Min. | 1 | 0 | 0 | 0 | 1405 | 8169 | 492,801 | 10.1 | |
| Max. | 687 | 8 | 267 | 38 | 20,000 | 43,330 | 6,485,929 | 100.0 | |
| 2017–2018 | Avg. | 93 | 2 | 30 | 6 | 8182 | 21,270 | 2,099,086 | 61.2 |
| S.D. | 165 | 2 | 58 | 10 | 5255 | 11,206 | 1,558,781 | 26.4 | |
| Min. | 0 | 0 | 0 | 0 | 1640 | 8156 | 581,457 | 6.4 | |
| Max. | 565 | 7 | 221 | 32 | 19,800 | 41,525 | 6,026,233 | 100.0 | |
| All | Avg. | 120 | 1 | 30 | 8 | 11,418 | 21,134 | 1,777,111 | 71.1 |
| S.D. | 204 | 2 | 58 | 25 | 10,798 | 13,190 | 1,452,798 | 24.9 | |
| Min. | 0 | 0 | 0 | 0 | 1388 | 6148 | 393,071 | 6.4 | |
| Max. | 1204 | 13 | 277 | 209 | 71,430 | 53,704 | 6,485,929 | 100.0 | |
Table 3.
Estimation results.
| Models | Model-1 (Total) | Model-2 (Generation) | ||||||
| Variables | Coefficient | S.D. | t-ratio | Coefficient | S.D. | t-ratio | ||
| ln(RD) | 0.829 | 0.240 | 3.46 | *** | 0.533 | 0.622 | 0.86 | |
| DEREG1 | 0.423 | 0.195 | 2.17 | ** | −0.411 | 0.497 | −0.83 | |
| DEREG2 | 0.378 | 0.123 | 3.06 | *** | 0.174 | 0.398 | 0.44 | |
| DEREG3 | −0.330 | 0.176 | −1.87 | * | 0.174 | 0.395 | 0.44 | |
| ln(EMP) | 0.614 | 0.491 | 1.25 | 0.957 | 1.604 | 0.60 | ||
| ln(OE) | −1.079 | 0.456 | −2.37 | ** | −1855 | 1.301 | −1.43 | |
| JOINT | −0.011 | 0.002 | −4.59 | *** | −0.018 | 0.007 | −2.65 | ** |
| constant | 3.451 | 2.823 | 1.22 | 14.220 | 8.499 | 1.67 | ||
| Log likelihood | −681.123 | −157.798 | ||||||
| Models | Model-3 (Transmission/Distribution) | Model-4 (Retail) | ||||||
| Variables | Coefficient | S.D. | t-ratio | Coefficient | S.D. | t-ratio | ||
| ln(RD) | 0.657 | 0.328 | 2.00 | ** | 0.949 | 0.580 | 1.64 | |
| DEREG1 | 0.302 | 0.291 | 1.04 | 0.840 | 0.593 | 1.42 | ||
| DEREG2 | 0.401 | 0.175 | 2.29 | ** | 1.297 | 0.315 | 4.12 | *** |
| DEREG3 | −0.231 | 0.246 | −0.94 | −0.095 | 0.377 | −0.25 | ||
| ln(EMP) | 0.795 | 0.718 | 1.11 | 1.026 | 1.322 | 0.78 | ||
| ln(OE) | −0.894 | 0.622 | −1.44 | −1.685 | 1.022 | −1.65 | * | |
| JOINT | −0.011 | 0.004 | −2.90 | *** | −0.001 | 0.006 | −0.20 | |
| constant | −0.021 | 3.720 | −0.01 | 3.924 | 5.494 | 0.71 | ||
| Log likelihood | −488.483 | −260.781 | ||||||
Note: ***, ** and * indicate significance at the level of 1%, 5% and 10%, respectively. Variables with t-ratios marked in grey shadow are significant at least at the 10% level. Variables below the horizontal line are control variables.
© 2020 by the authors. Licensee MDPI, Basel, Switzerland. This article is an open access article distributed under the terms and conditions of the Creative Commons Attribution (CC BY) license (http://creativecommons.org/licenses/by/4.0/).
Share and Cite
MDPI and ACS Style
Goto, M.; Fujita, K.; Sueyoshi, T. Marginal Effect of R&D Investment and Impact of Market Reforms—An Empirical Analysis of Japanese Electric Power Companies. Energies 2020, 13, 3354. https://doi.org/10.3390/en13133354
AMA Style
Goto M, Fujita K, Sueyoshi T. Marginal Effect of R&D Investment and Impact of Market Reforms—An Empirical Analysis of Japanese Electric Power Companies. Energies. 2020; 13(13):3354. https://doi.org/10.3390/en13133354
Chicago/Turabian StyleGoto, Mika, Kohei Fujita, and Toshiyuki Sueyoshi. 2020. "Marginal Effect of R&D Investment and Impact of Market Reforms—An Empirical Analysis of Japanese Electric Power Companies" Energies 13, no. 13: 3354. https://doi.org/10.3390/en13133354
Note that from the first issue of 2016, this journal uses article numbers instead of page numbers. See further details here.