Detailed Office Building Energy Information Based on In Situ Measurements
by
 ,
,
Seung-Yeong Song
, 
Hye-Sun Jin
*,
Soo-Yeon Ha
,
Sung-Im Kim
,
You-Jeong Kim
,
Soo-Jin Lee
and
In-Ae Suh
Department of Architectural & Urban Systems Engineering, Ewha Womans University, 52 Ewhayeodae-gil, Seodaemun-gu, Seoul 03760, Korea
*
Author to whom correspondence should be addressed.
Energies 2020, 13(12), 3050; https://doi.org/10.3390/en13123050
Submission received: 23 March 2020
/
Revised: 24 May 2020
/
Accepted: 8 June 2020
/
Published: 12 June 2020
(This article belongs to the Special Issue Modeling, Control, and Optimization of Hybrid Energy Systems in Buildings)
Abstract
:Energy consumption in the building sector has been continuously increasing, and energy conservation in this sector has become critical for achieving the national goal of reducing greenhouse gas emissions. In South Korea, information on energy sources (electricity, gas, district heating, etc.) is provided, but detailed energy use information, such as space heating, space cooling, domestic hot water (DHW) and lighting, is insufficient to establish a specific action plan for energy savings. Energy use information by end-use can be acquired through actual measurements in close proximity to actual energy use. This information reflects the effects of complex elements such as building operations and residential characteristics, but it is also insufficient. This study presents statistical data on energy use intensities (EUIs) and greenhouse-gas-emission intensities by end-use, derived by measured data collected from 48 sample office buildings in representative city from May 2017 to April 2018, and compares those with the U.S. commercial building energy consumption survey (CBECS) 2012 report. The average site EUIs by end-use were in the following order: space heating > electric appliances (typical floors) > space cooling > lighting > air movement > DHW > vertical transportation > city water supply. With regard to the average primary EUIs by end-use, the magnitude relationship between electric appliances (typical floors) and space heating was opposite that of the average site EUIs. Vertical transportation and DHW exhibited almost the same average greenhouse-gas-emission intensities as those of the average annual primary EUIs. The average site EUIs in the CBECS 2012 data were slightly different from those in this study: electric appliances, etc. > space heating > air movement > lighting > space cooling > DHW. The number of office buildings monitored in this study increased until 2019 (the number of total samples: 85), and the intensity data by end-use will be brought up to date through continuous measurement.
1. Introduction
1.1. Background and Purpose of Study
With rising awareness of the need to conserve energy in buildings in order to achieve greenhouse gas reduction targets, it is necessary to provide building sector’s energy use information that building officials and policy makers can easily access to comprehend the characteristics of energy use. In particular, it is important to provide information on the energy use intensities (EUIs) by end-use, such as space heating, space cooling, domestic hot water (DHW) and lighting. These detailed planning units are effective for energy conservation because they involve different technical systems in buildings. Moreover, these end-use categories are familiar to people because they can play a significant role in inducing voluntary energy performance improvement among building officials and in encouraging the establishment of concrete policies.
Many countries now operate energy information systems in the building sector; the main examples include the U.S. commercial building energy consumption survey (CBECS) [1], residential energy consumption survey (RECS) [2] and building energy efficiency survey (BEES) [3]. Energy information systems give an energy consumption and EUIs information according to building type (residential and commercial), building characteristics and fuel type (electricity, gas, etc.) through surveys of sample buildings and data collection given by energy suppliers. Additionally, they provide information on energy consumption and EUIs by end-use, calculated through statistical processing and modeling of collected data, for establishing concrete energy-saving plans.
South Korea operates the energy statistics system, called Korea energy statistics information system (KESIS), which gives the details of energy consumption according to building type (residential, commercial, public and large buildings), building characteristics and energy sources. In addition, an online portal, Green Together, issues energy assessments of individual buildings based on billing data given by energy suppliers. It provides information on energy consumption by energy sources in each of buildings and compares the data with those of similar buildings. Nevertheless, the information from these systems is mainly energy consumption by energy sources. The provision of energy consumption and EUIs information by end-use that is effective for concrete planning of energy savings, remains insufficient.
To expand the knowledge of building energy information, which is mainly limited to energy use by energy sources, a national research project is underway to build an information system that will provide information on energy use and greenhouse-gas-emission intensities by end-use through the installation of continuous measurement systems in sample buildings for six years starting in 2014 and the processing of measurement data. This study summarizes the sample design, classification, definition and measurement and data acquisition methodologies of energy use by end-use for office buildings in South Korea. So that the installation of measurement systems was completed, this study also analyses the available building characteristics based on survey data from 2014 to 2016 for 48 sample office buildings in Seoul. Furthermore, this study provides statistics based on the site, primary EUIs and greenhouse-gas-emission intensities by end-use collected from May 2017 to April 2018 from the sample office buildings and the monthly distribution of site EUIs.
The derived results are significant in that they capture EUI information by end-use in actual office buildings that are adequate for domestic conditions in South Korea. A comparative evaluation of building energy performance can determine vulnerable parts of office buildings and voluntary improvement by building officials, and the effectiveness of strengthening building energy-related policies can be ascertained by obtaining information on building energy use through continuous measurement.
1.2. Method of Study
Section 2 reviews existing studies on commercial building energy consumption by end-use. Additionally, it describes the generic method that can be extracted from this study. Next, Section 3 summarizes the sample design of office buildings selected for measurement, the classification and definition and the measurement and data collection method, as in previous works [4,5,6] by the authors. In Section 4, statistical calculations and analyses of energy use and greenhouse-gas-emission intensities by end-use are presented. Specifically, onsite surveys were conducted on 48 sample office buildings in Seoul to identify characteristics of the buildings. In addition, installation of measurement systems was conducted in these buildings from 2014 to 2016 to monitor their energy usage and collect energy consumption measured data for each end-use. The energy consumption for each end-use at each sample office building was calculated for a year from May 2017 to April 2018. The primary energy consumption and greenhouse gas emissions by end-use were calculated by applying the primary energy conversion factors and greenhouse-gas-emission conversion factors by fuel. The values were then divided by the floor area of the sample space to identify the energy use and greenhouse-gas-emission intensities. Statistics like average, percentile, and standard deviation were presented to comprehend the distribution patterns for the 48 office buildings. In addition, the monthly average distributions of the EUIs by end-use were identified, and finally, the result of this study was compared with the CBECS 2012 report, in Section 5.
2. Review of Existing Studies on Commercial Building Energy Consumption by End-Use
Jing et al. [7] studied the energy performance of 30 existing commercial office buildings in Hong Kong by end-use. Energy audits were conducted; data obtained from utility bills, design documents, and onsite measurements were thoroughly assessed; and the energy utilization index and carbon emissions of each building were calculated. Wang et al. [8] analyzed the significant impact of building energy consumption on energy efficiency. Using the methodology of integrating building information modeling (BIM) and submetering, energy consumption by end-use was analyzed for a luminous environment and air conditioning environment based on simulated data and actual collected data. Howard et al. [9] built a model to estimate the building sector energy EUIs (kWh/m2 floor area) for space heating, DHW, electricity for space cooling applications and electricity for non–space-cooling applications in New York City. These results can be used to determine the cost-effectiveness of energy-consuming systems and to design policies for implementing energy efficiency and renewable energy programs. Li et al. [10] conducted an energy audit and expounded on the average energy consumption by end-use. They identified the main factors contributing to the energy consumption in 24 office buildings in Tianjin and proposed feasible technologies and energy management measures to conserve energy and reduce carbon emissions. Zhu and Li [11] analyzed and researched issues related to end-use energy consumption in large public buildings. They proposed control measures and solutions to address very high-energy consumption in large public buildings from the aspects of technical and energy management measures by analyzing the reasons for the high-energy consumption. Saidur [12] analyzed the energy usage of office equipment to propose potential energy-saving measures. The study compared the energy intensity (EI) and energy usage of office equipment in Malaysia with those in other countries to benchmark the energy usage of office equipment. The study estimated the energy savings, associated cost savings, and emission reductions with the application of different energy-saving measures for office equipment and calculated the associated payback period. Perez et al. [13] analyzed available information concerning end-use energy consumption in buildings, particularly data related to HVAC systems in commercial buildings, and compared the data among different countries. Jaber et al. [14] described the Jordanian commercial and public service sector (CAPSS) and presented an overview of its energy consumption and ways to improve the energy utilization efficiency. The analysis was based on a survey on energy consumption in the CAPSS, and the survey was designed and conducted in close cooperation with the Ministry of Energy and Mineral Resources (MEMR) in 1998.
This previous research mainly included studies based on surveys, existing statistics and simulations. Surveys are limited because surveyors often investigate rough information rather than accurate information. Simulations are limited because it is difficult to reflect the usage patterns in actual buildings, as standard values are mainly used as input values. Even if energy usage is analyzed through actual measurement, such an analysis is limited in representing an entire building group because it targets a single or small building group. This study is different from previous studies in that the number of samples representing the building group was obtained through the sample design, and energy usage was obtained by establishing principles for defining and measuring energy use suitable for domestic conditions. The study is meaningful because it identifies energy use patterns in actual buildings by obtaining energy usage information through measurement. Its approach can be used for comparative analysis and benchmarking of performance levels by stratification variables such as completion year and floor area in the future.
3. Total Sample Design, Measurement and Data Collection Methods for Energy Consumption by End-Use
3.1. Total Sample Design
Table 1 shows the results of the total sample design of office [15]. Because the installation for measuring detailed system took a long time and expensive, the site of these office buildings were selected to ensure a meaningful sample design within the limited budget. The regions of Korea are classified into the central, southern and Jeju region, based on climatic conditions. According to government statistics [16], the gross area of commercial buildings in Korea is much larger in the central region than in the southern and Jeju regions. As a result, Seoul—as the central region’s typical city—was selected as the sample office buildings’ location. After the research project is completed, the decision about expanding the study to other regions will be made through utilization-focused evaluation.
Buildings whose main purpose was listed in the building register as an office building were selected as sample office buildings. For buildings with other purposes, such as a commercial facility, listed in the building register, only buildings in which the combined floor area for non-business purposes was 20% or less of the total floor area were selected to minimize the non-business space. Officetels used for residential purposes were excluded. Moreover, the top and bottom 10% of the total annual site EUIs (kWh/m2·year) of all office buildings in Seoul were calculated according to the completion year and gross area based on the Green Together data. Buildings falling into those ranges were excluded during the selection of the sample office buildings.
The sample design was conducted according to the stratification level including completion year and gross area. The stratification levels of the completion year were 1992 or earlier, 2002 or earlier, and 2002 or later based on periods when insulation design criteria were significantly strengthened. The stratification levels of gross area were small (smaller than 3000 m2), medium (smaller than 10,000 m2) and large (10,000 m2 or larger) based on differences in the buildings’ main electrical systems, such as air conditioning sources, air conditioning methods and elevators. The sample was designed by applying the Neyman allocation method to satisfy the above stratification variables and levels within a 95% confidence level and 20% tolerance. The measurement systems’ installation in all sample office buildings was performed for 6 years starting in 2014. Table 2 shows the measurement system’s installation schedule.
3.2. Classification and Definition
In the previous studies [4,5,6], energy consumption by end-use was classified and defined. The details are shown in Table 3, where the energy consumption to be measured is the energy input to the technical system, that is, the energy consumption to be charged. Considering the cost efficiency of the measurement system installation, electric appliance energy consumption was calculated by adding the values of representative floors (floors with similar plans and multiple spaces marked for general business) instead of the entire building. Floors with spaces marked for purposes other than general business, such as non-office buildings including commercial facilities, cafeterias and large data processing rooms with separate distribution boards, were not selected as typical floors.
3.3. Measurement and Data Collection Methods
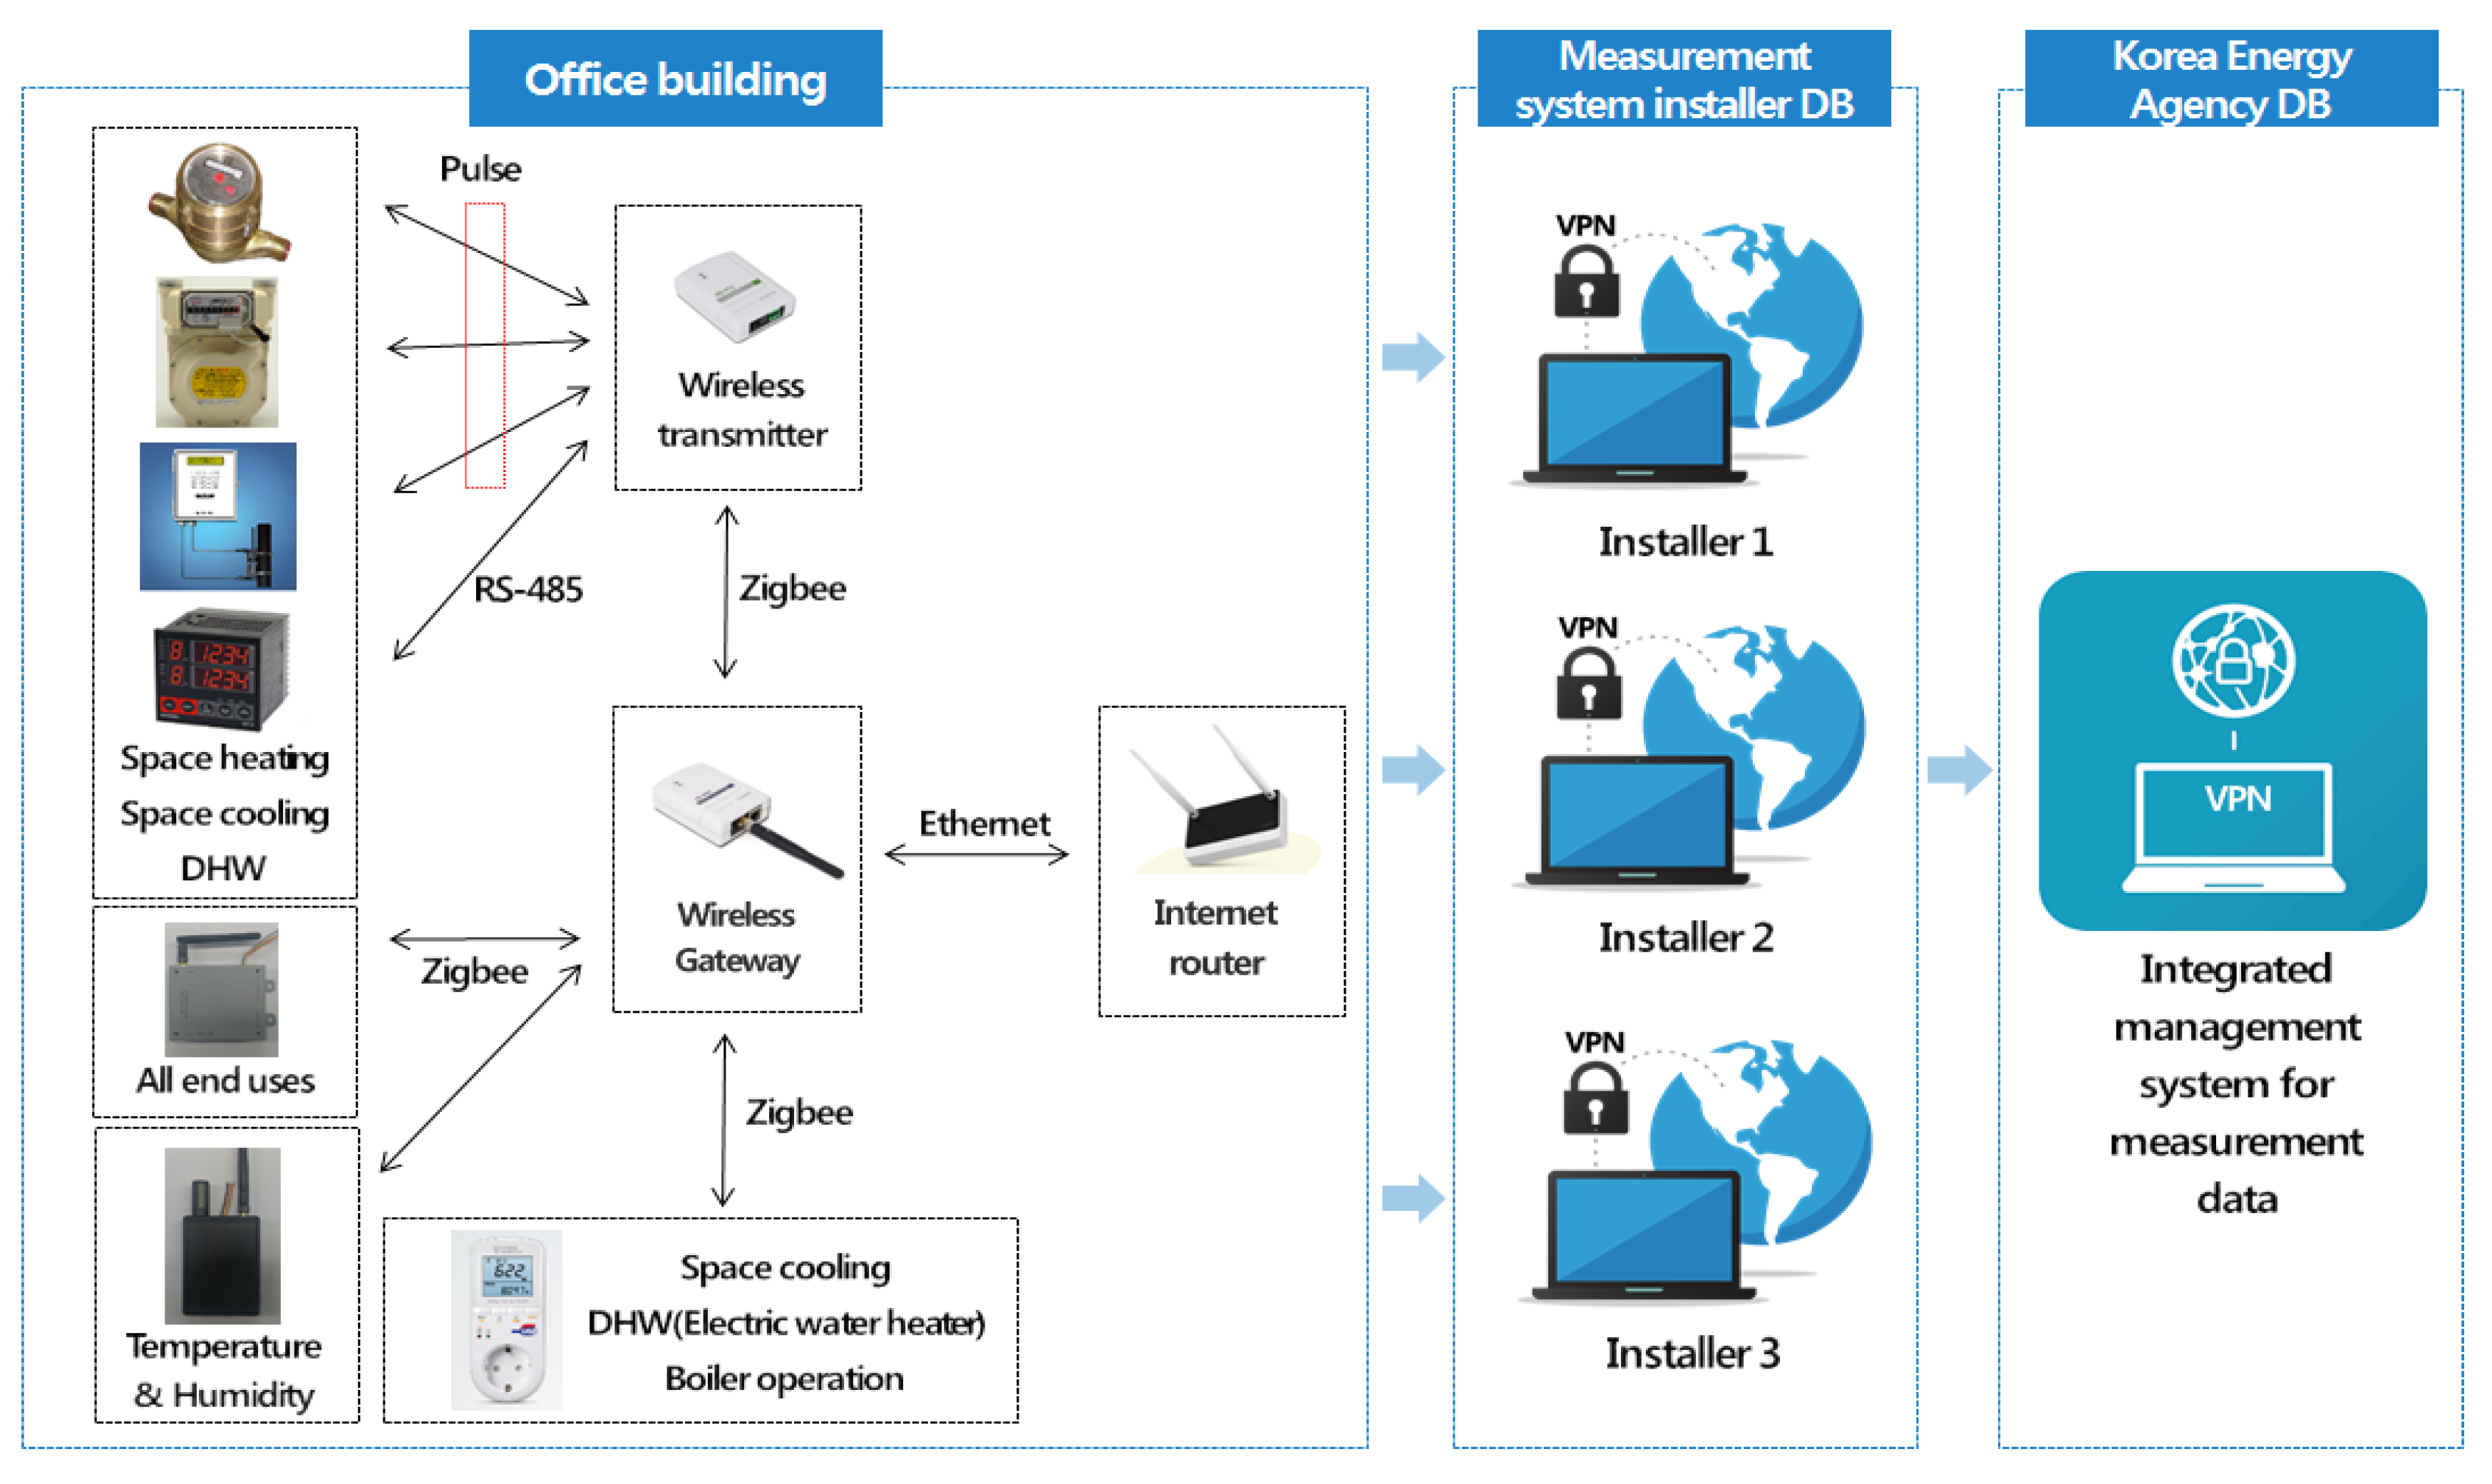
The previous studies [4,5,6] presented the methods used in the current study about detailed energy measurement. The examples of main detailed energy systems are shown in Appendix A. The Korea Energy Agency announced the measurement system installation project, evaluated the bidding companies, and selected the operators for the measurement system installation. The selected operators recruited sample office buildings and installed the measurement systems according to the systems in Appendix A. The specifications of the measurement instruments and examples of measuring the detailed energy are described in Appendix B & Appendix C, respectively. Table 4 shows photographs of the sample office buildings. For safety assurance and convenience of management, the measured data were saved in each operator’s server for primary storage and then transferred to the integrated server of the Korea Energy Agency for secondary storage, as shown in Figure 1. The measured data in the secondary storage were continuously monitored, and correction principles were established and applied for missing and abnormal values.
4. Statistical Calculations and Analyses of EUIs
4.1. Building Characteristics
An on-site survey was conducted from 2014 to 2016 on 48 sample office buildings in Seoul. A measurement system was installed in these buildings to identify their available building characteristics. The office buildings’ distribution by completion year and gross area is shown in Table 5; their specific building characteristics are listed as Table 6, Table 7 and Table 8.
As shown in Table 6, 65% of the structures were made of reinforced concrete (RC) and 88% of the cores were side cores. Most of the buildings faced southeast or south (33% and 21%, respectively). The average aspect ratio of typical floors, ratio of effective floor area and a typical floor height were 1:1.6, 76.8% and 3.6 m, respectively. For reference, for the type of structure, SRC stands for steel frame-reinforced concrete.
As shown in Table 7, the most common energy carrier was the combination of electricity and gas (63%), and the heating and cooling systems were direct-fired heating and cooling units and electric heat pumps. The most common DHW systems were gas hot water boilers and steam boilers. In office buildings with a central cooling system, the air conditioning systems used in the internal and perimeter zones were mostly constant air volume (CAV) systems and fan coil units (FCUs), respectively. For reference, the average capacity of the main heat source for central heating and individual heating of the sample buildings was 809.5 kW/ea and 37.1 kW/ea, respectively, and the average capacity of the main heat source for central cooling and individual cooling was 718.0 kW/ea and 30.6 kW/ea, respectively. The most commonly used lighting systems were fluorescent lamps based on the lighting devices installed in the offices of typical floors. The American Society of Heating, Refrigerating and Air-Conditioning Engineers (ASHRAE) [17,18,19] recommends a lighting power density in an office space of 12 W/m2 and an electric appliance power density of 35 W/m2 based on the rated power consumption. On the same basis, the typical floor lighting power density of the sample office buildings mostly ranged from 5 W/m2 to less than 10 W/m2 (46%), and the typical floor electric appliance power density was mostly less than 10 W/m2 (33%). Here, the electric appliance density was calculated based on the office equipment on typical floors, such as computers, monitors, laptops, multifunction printers and single-function printers. The city water supply systems were mostly elevated water tanks and booster pumps.
As shown in Table 8, the operating periods of space heating and space cooling were mostly more than 4 months and less than 5 months, at 46% and 40%, respectively. The operating period of DHW was mostly 5 months (40%), and there were several cases of whole–year operation (27%). The typical floor occupancy density based on the number of residents mostly ranged from 0.04 persons/m2 to less than 0.06 persons/m2 (38%).
4.2. Calculation Methods and Statistical Process
The classification according to the heat source shown in Table 4 and the systems and measurement instruments shown in Table 5, Table 6, Table 7 were put in to measure the office buildings’ end-use energy consumption. By using measurement data, each sample office building’s end-use energy consumption was calculated for one year (May 2017 to April 2018). The primary end-use energy consumption and greenhouse gas emissions were calculated by applying the conversion factors for fuel, as shown in Table 9 [20] and Table 10 [21,22]. The calculated results were then divided by each sample office building’s floor area to acquire the intensity values. As shown in Table 11, the floor area [4] refers to the area exposed to space heating, space cooling, lighting and air movement the measured energy is the energy consumed by these facilities. The floor area of the air conditioned space is considered for DHW, electric appliances (typical floors), vertical transportation and the city water supply. The air conditioned space refers to the heated or cooled space. A larger value was applied if the floor areas of the heated and cooled spaces were different.
Related statistics were deduced to identify all 48 office buildings’ intensity distribution characteristics. To decrease the excessive intensity values’ influence in a particular sample, the statistics were calculated by excluding the intensity values within the top and bottom 10% of each sample. The average, median, and mode were used as statistical values representing the distribution. Because this study’s sample design aimed to estimate the population’s average with a certain tolerance level, the average was taken as a representative value. In addition, the maximum, minimum, percentile, and standard deviation value were calculated because it was difficult to identify the intensity distribution characteristics using only the average value.
4.3. Statistical Calculation and Analysis of EUIs
4.3.1. Site EUIs
The statistics of the annual site end-use EUIs in the sample office buildings are shown in Table 12 and a corresponding graph is shown in Appendix D. The average values of the annual site end-use EUIs were in the order of space heating > electric appliances (typical floors) > space cooling > lighting > air movement > DHW > vertical transportation > city water supply. The average annual site EUIs of space heating and electric appliances (typical floors) were high, at 54.6 and 49.1 kWh/m2·year, respectively, whereas those values of space cooling, lighting, air movement and DHW were 32.7, 19.8, 7.9 and 5.5 kWh/m2·year, each. The corresponding values of vertical transportation and city water supply were low (under 3.2 kWh/m2·year). The average annual site end-use EUIs’ percentages were 31.5, 28.3, 18.8% and 11.4% for space heating, electric appliances (typical floors), space cooling and lighting, respectively. Space heating and electric appliances (typical floors) exhibited similarly large annual site EUIs. The EUI for space cooling was approximately 60% of the EUI for space heating, whereas that for lighting was approximately 60% of the EUI for space cooling. Air movement, DHW, vertical transportation, and the city water supply consumed less energy than the other end-uses. Therefore, with regard to reducing the annual site energy consumption, space heating was the most important, followed by electric appliances (typical floors), space cooling and lighting.
4.3.2. Primary EUIs
The statistics of the annual primary end-use EUIs in the sample office buildings are shown in Table 13. A corresponding graph is shown in Appendix D. The average values of the annual primary end-use EUIs were in the order of electric appliances (typical floors) > space heating > space cooling > lighting > air movement > DHW > vertical transportation > city water supply. The average annual primary EUI of electric appliances (typical floors) was the highest, at 135.0 kWh/m2·year, whereas those values of space heating, space cooling, and lighting were 88.8, 64.2, and 54.5 kWh/m2·year, each. The corresponding values of air movement, DHW and vertical transportation were 21.8, 9.1 and 8.9 kWh/m2·year, each. The average annual primary EUI of the city water supply was the lowest, at 2.0 kWh/m2·year. The average annual primary end-use EUIs’ percentages were 35.1%, 23.1%, 16.7% and 14.2% for electric appliances (typical floors), space heating, space cooling and lighting, respectively. Therefore, in terms of reducing the annual primary energy consumption, electric appliances (typical floors) were the most important because they had the highest energy consumption, followed by space heating, space cooling and lighting. Regarding the average annual primary end-use EUIs, the magnitude relationship between electric appliances (typical floors) and space heating was reversed compared with that of the average annual site EUIs. This result could be attributed to the fact that the electricity’s primary energy conversion coefficient is much larger than the other energy sources.
4.3.3. Greenhouse-Gas-Emission Intensities
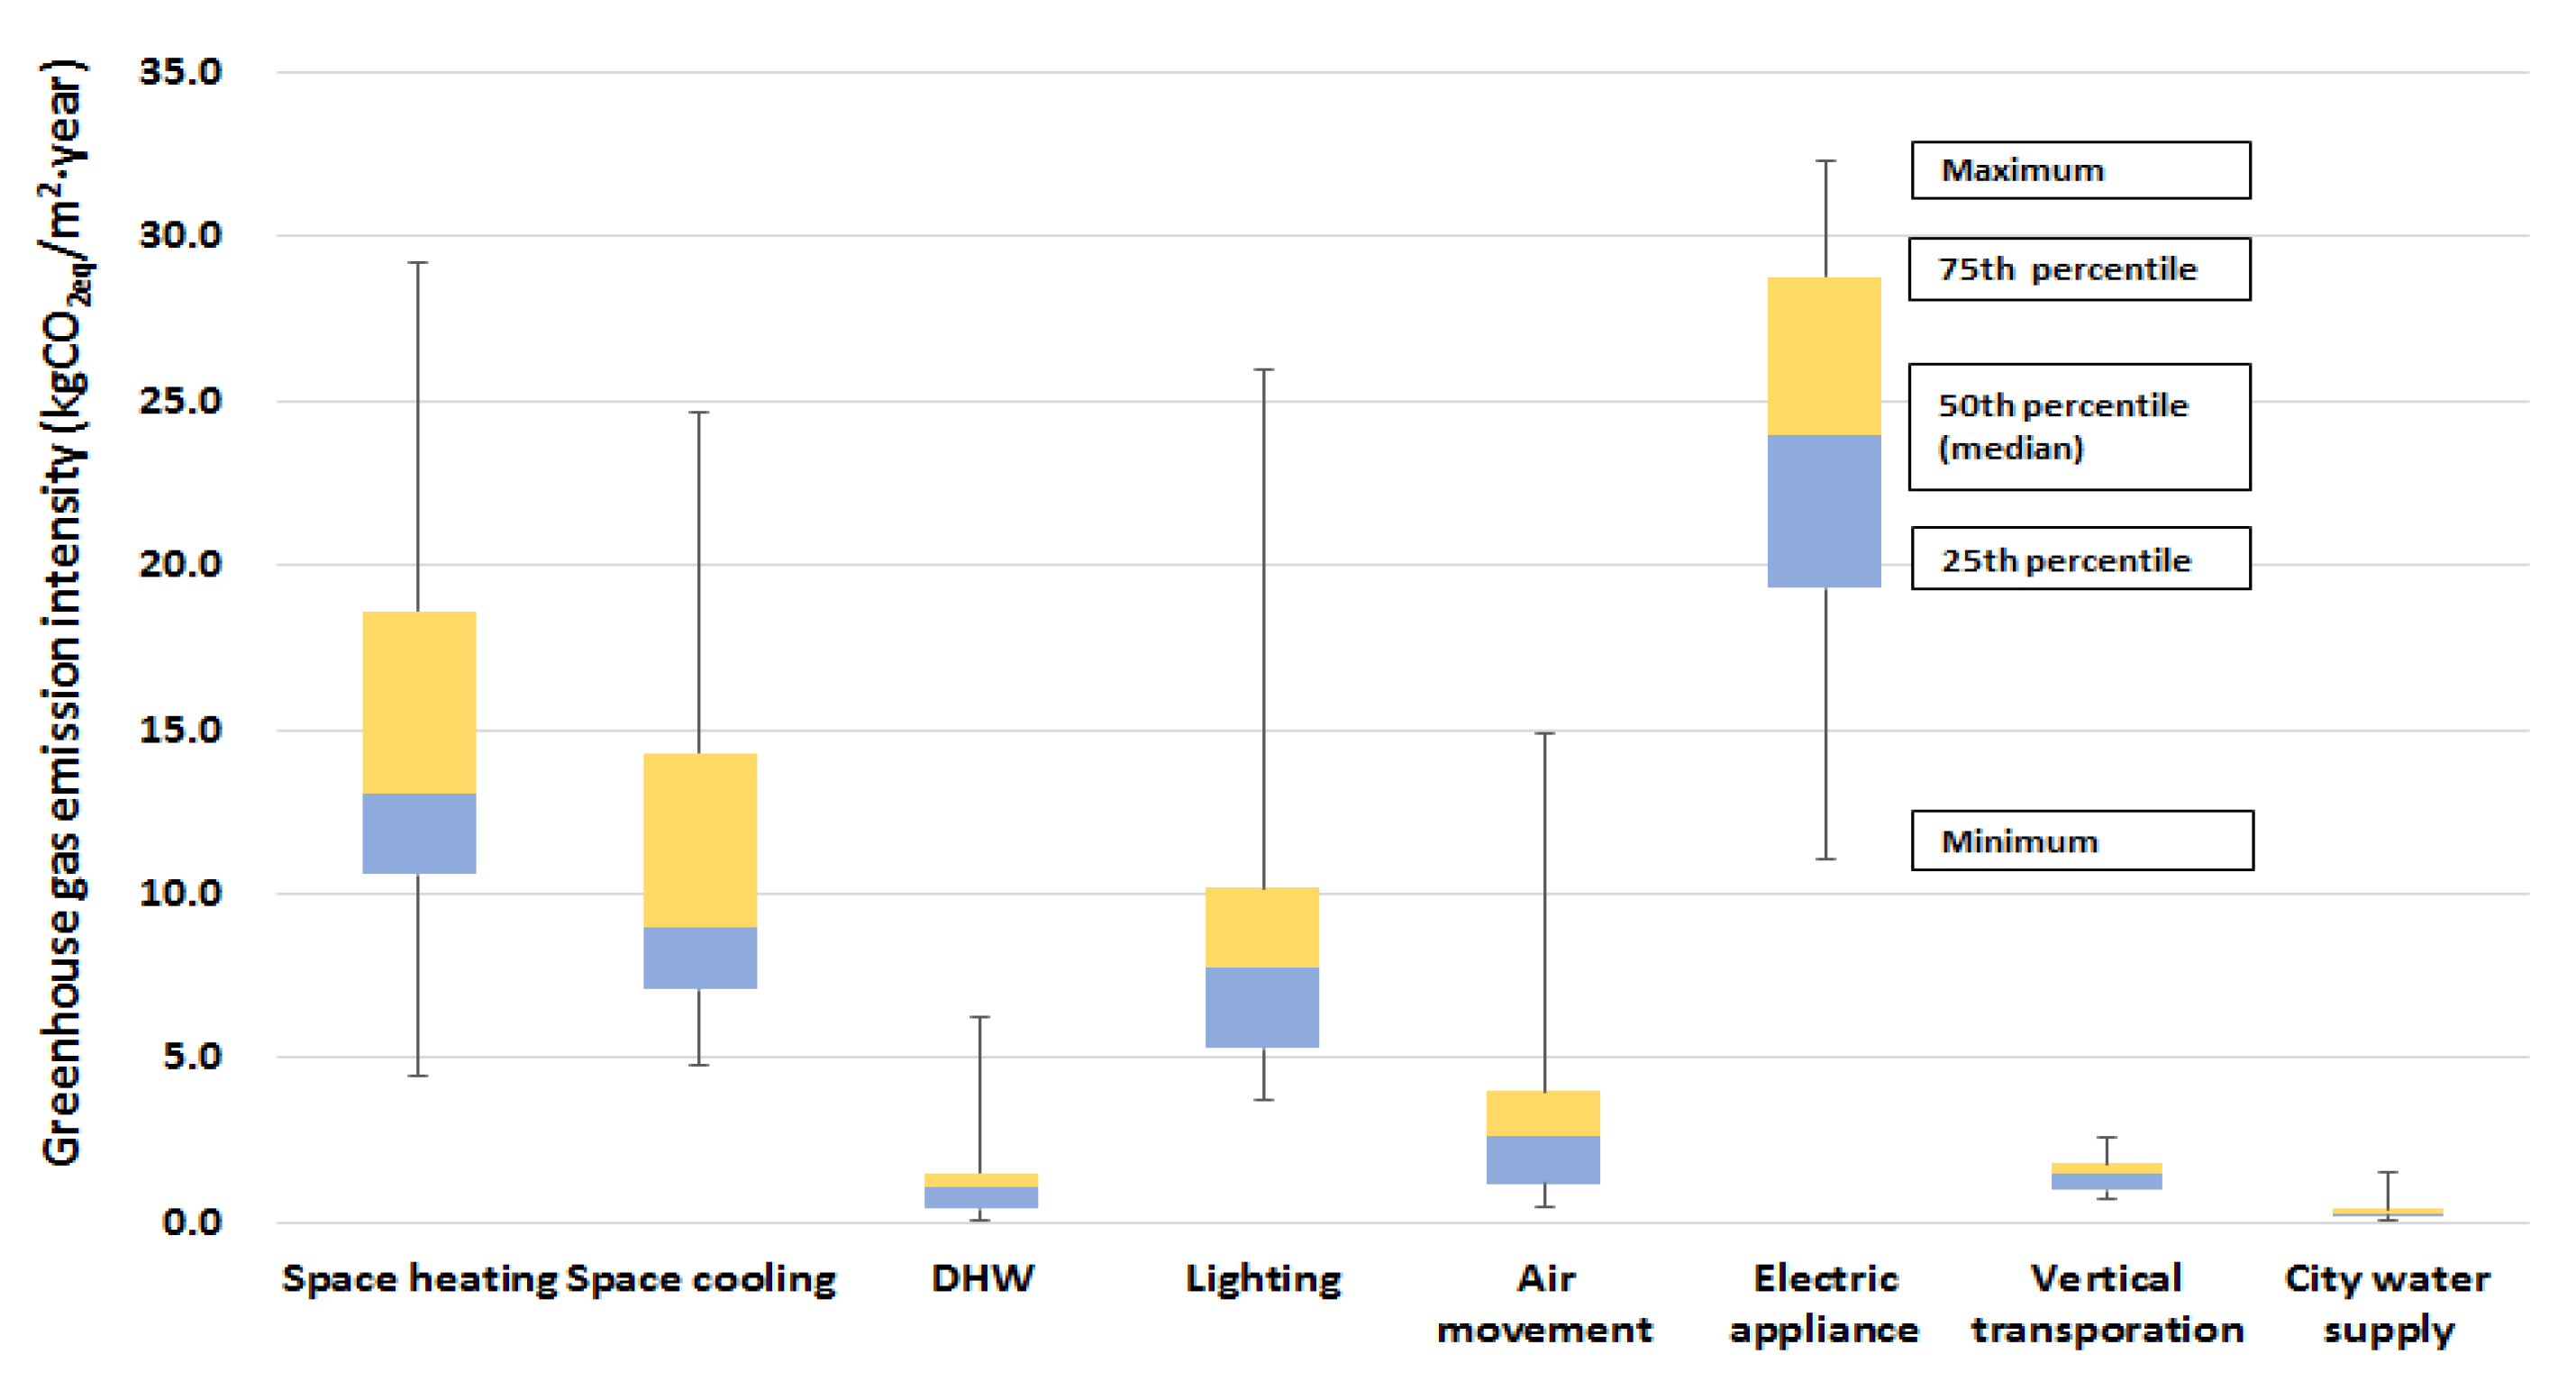
The statistics of the annual end-use greenhouse gas emission intensities in the sample office buildings are shown in Table 14, and a corresponding graph is shown in Appendix D. The average values of the end-use greenhouse-gas-emission intensities were in the order of electric appliances (typical floors) > space heating > space cooling > lighting > air movement > DHW > vertical transportation > city water supply. The average annual greenhouse-gas-emission intensity of electric appliances (typical floors) was the highest, at 22.9 kgCO2eq/m2·year, whereas those of space heating, space cooling and lighting were 15.1, 11.1 and 9.2 kgCO2eq/m2·year, each. The corresponding values for air movement, DHW and vertical transportation were 3.7, 1.5 and 1.5 kgCO2eq/m2·year, each. The average annual greenhouse-gas-emission intensity of the city water supply was the lowest, at 0.3 kgCO2eq/m2·year. The average annual end-use greenhouse-gas-emission intensity percentages were 35.1%, 23.1%, 17.0% and 14.1% for electric appliances (typical floors), space heating, space cooling and lighting, respectively. Therefore, in terms of reducing greenhouse gas emissions, electric appliances (typical floors) were the most significant, followed by space heating, space cooling and lighting. The average annual greenhouse-gas-emission intensities of vertical transportation and DHW were nearly the same as those of the average annual primary EUIs. This result appears to be due to the differences between the primary energy conversion factors by energy source and the greenhouse-gas-emission conversion factors.
Consequently, space heating can be considered the most significant factor for site energy consumption reduction and electric appliances (typical floors) represent the most significant for reducing primary energy consumption and greenhouse gas emissions.
4.4. Distribution of Monthly EUIs
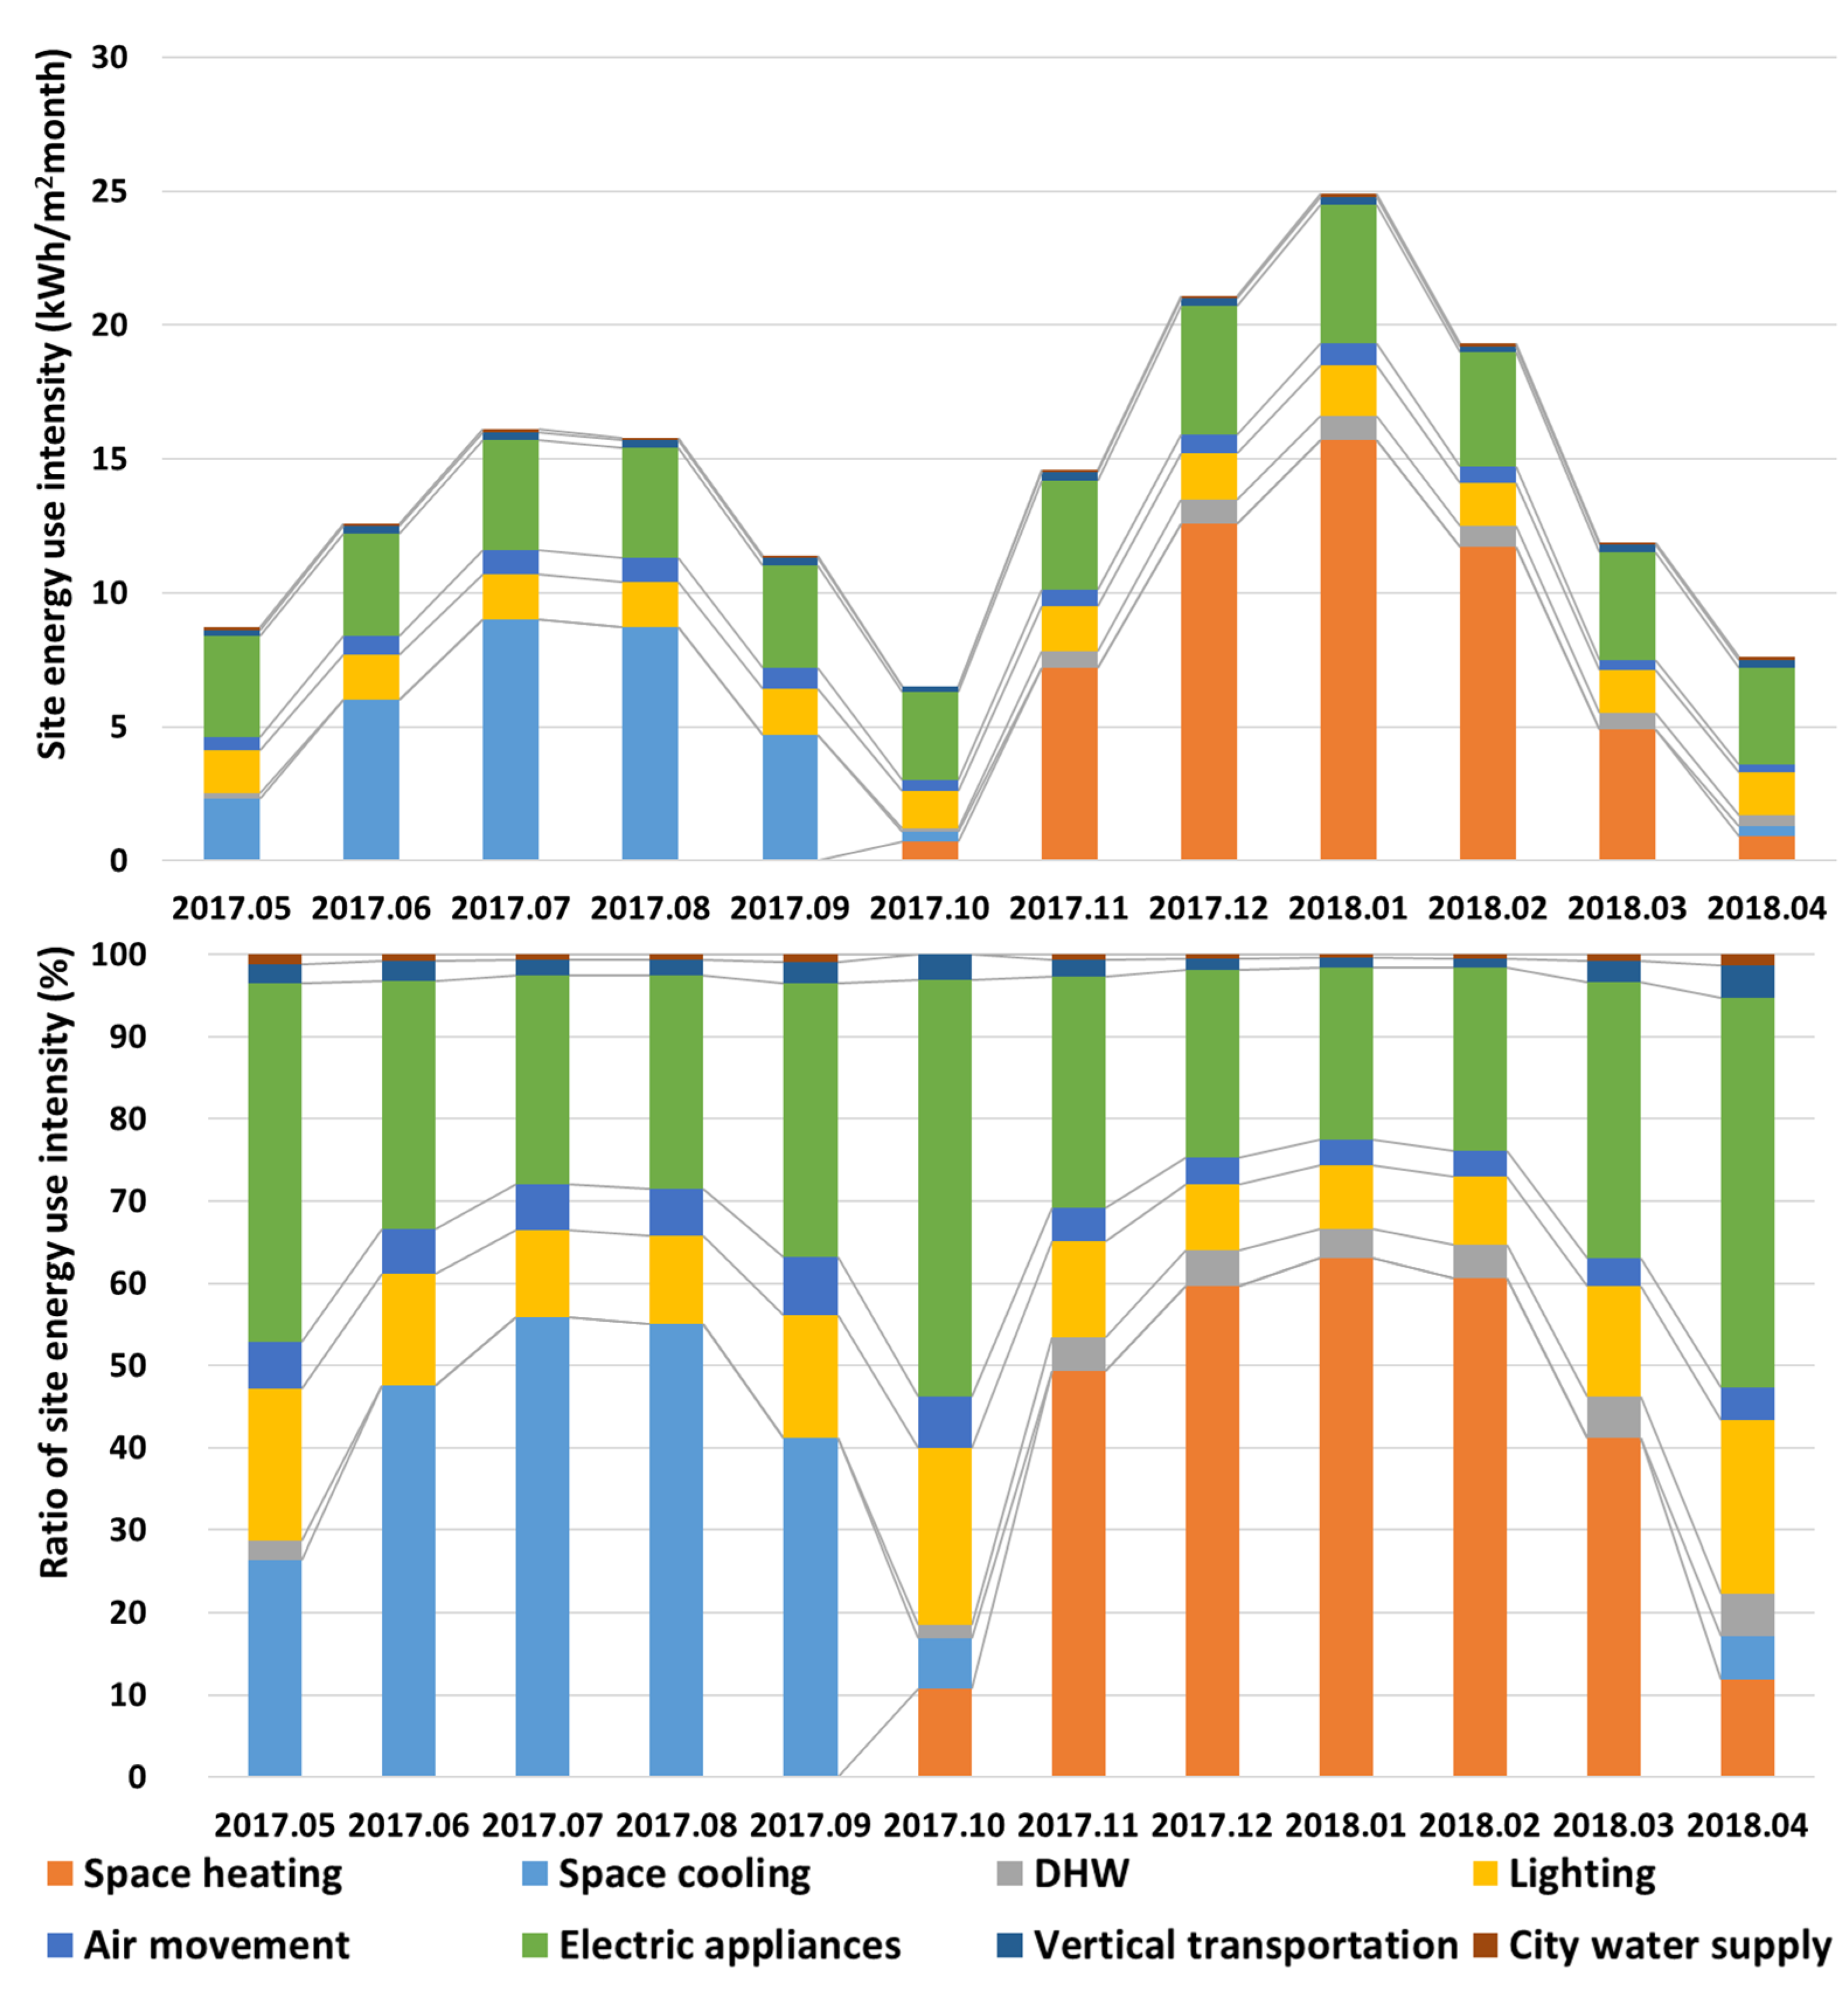
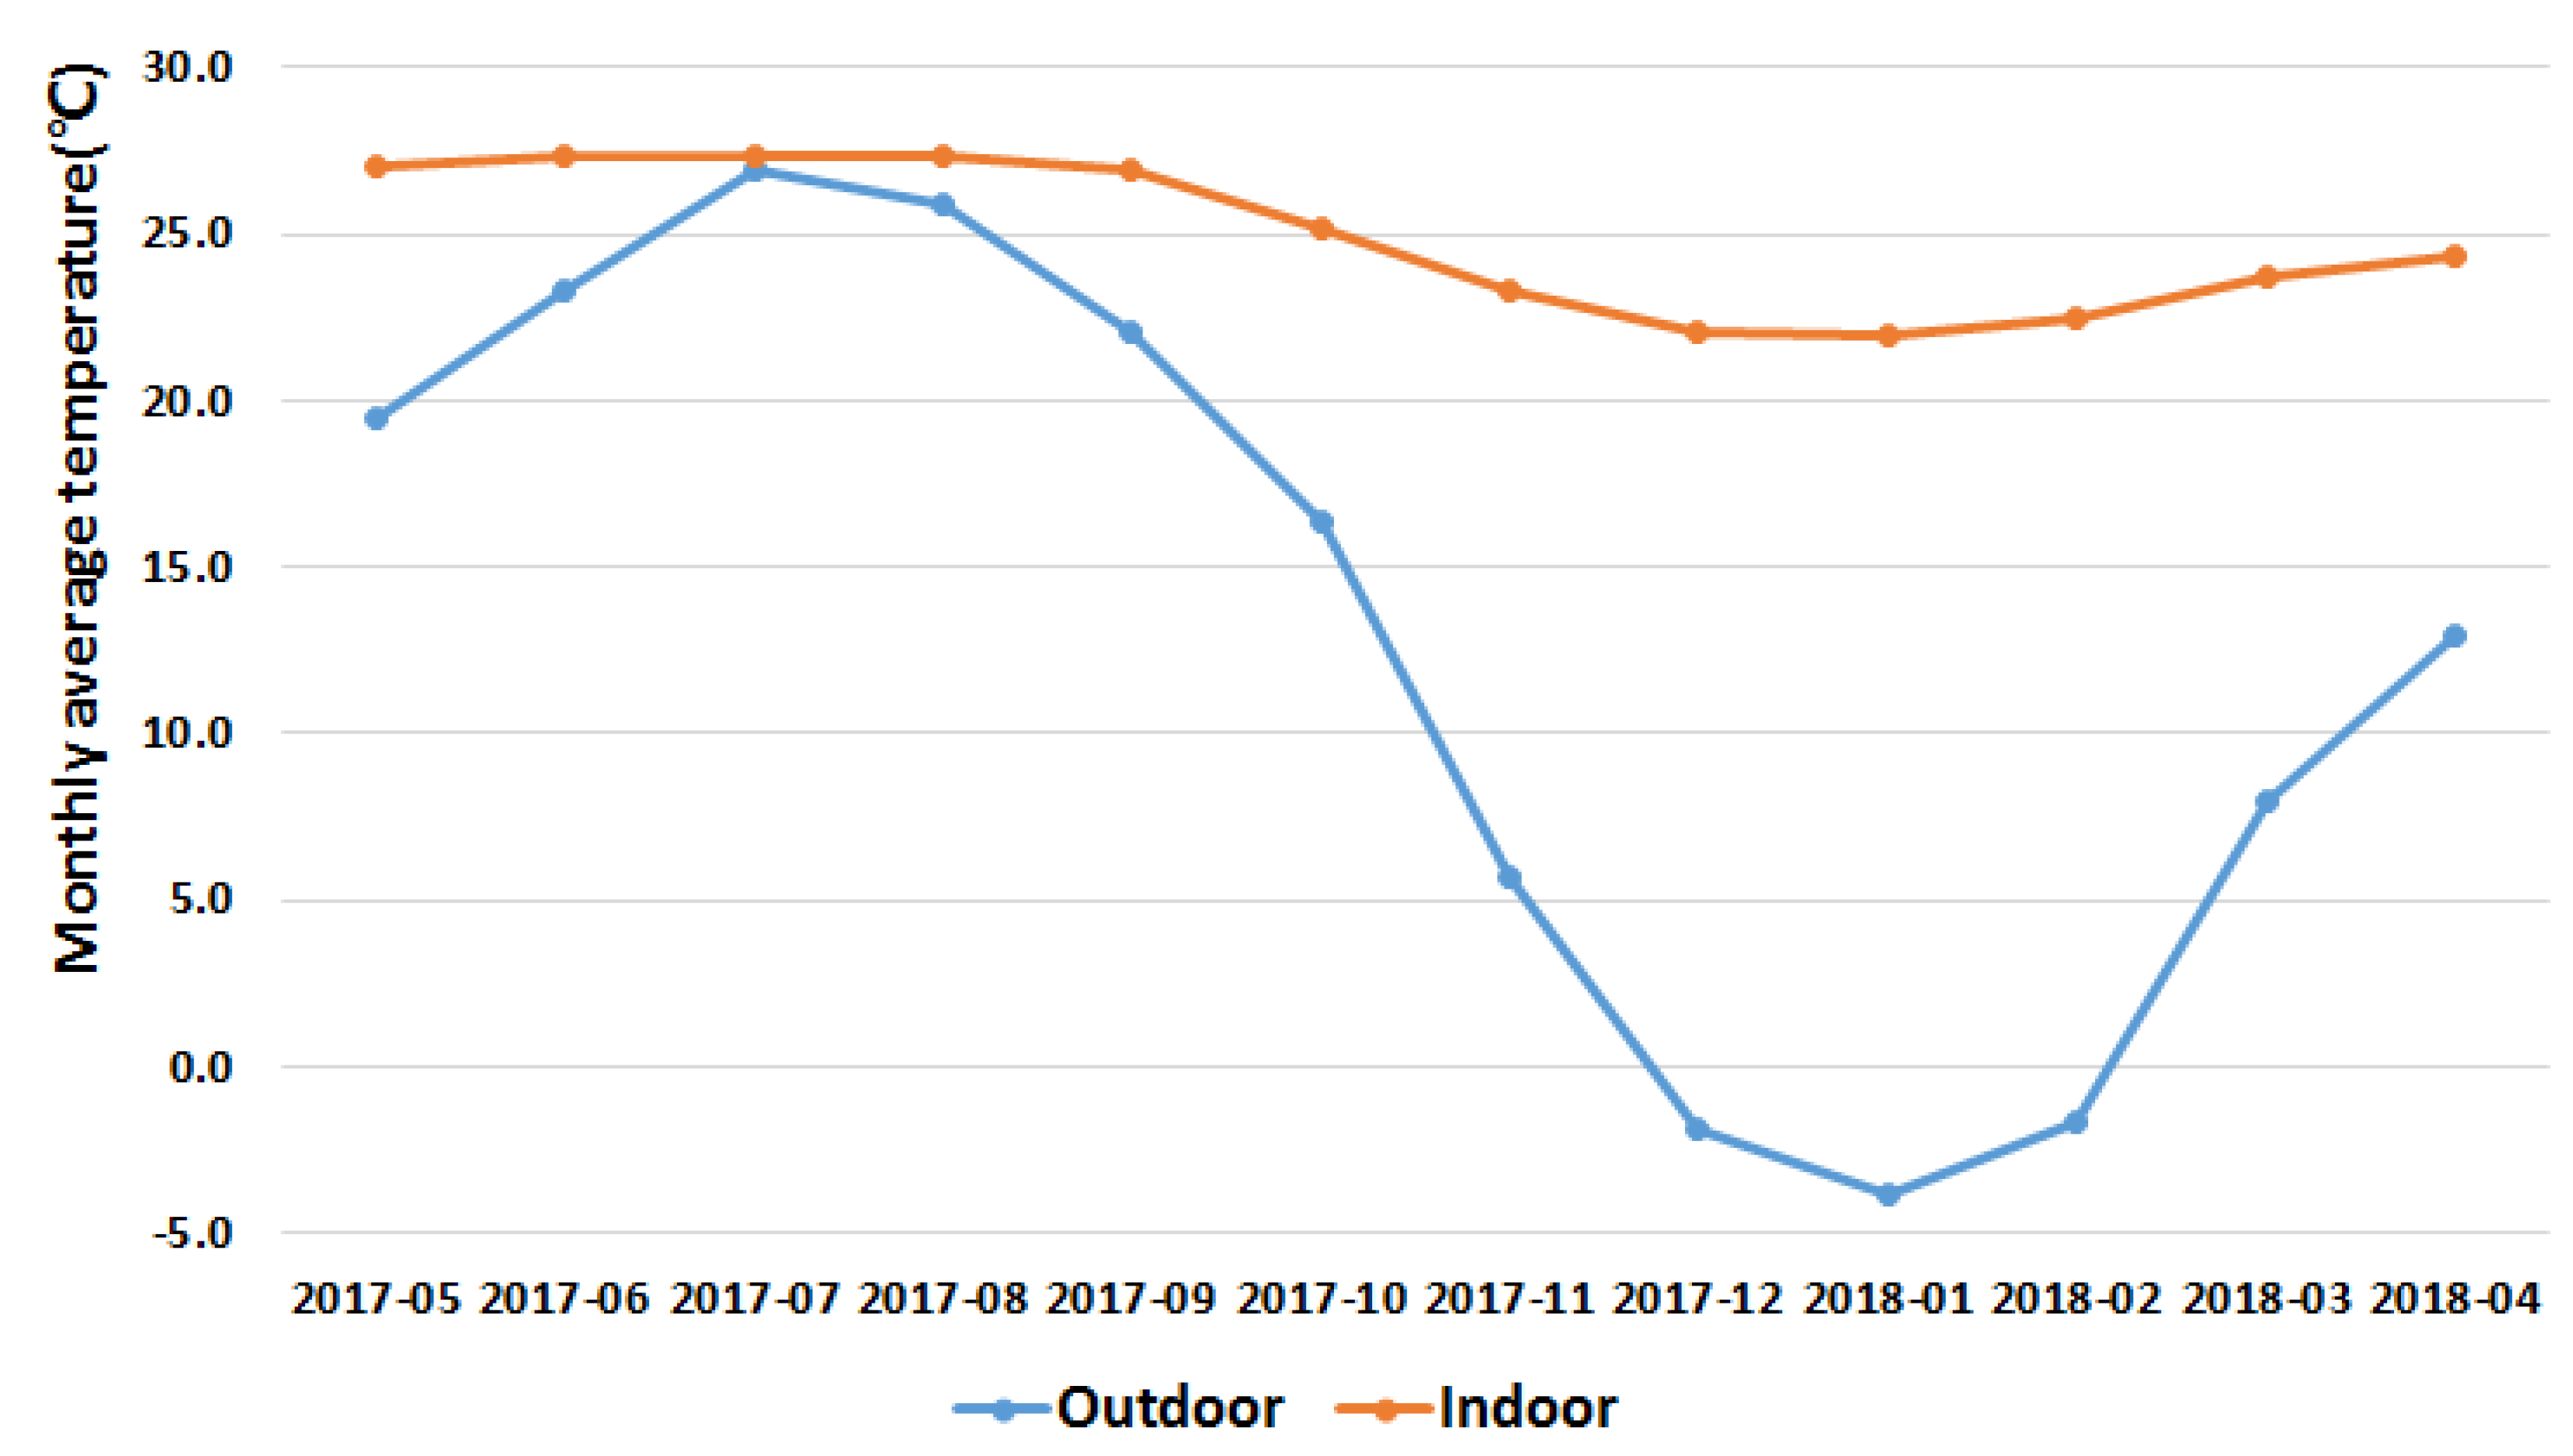
The statistics of monthly site end-use EUIs are shown in Table 15. Their distribution is presented in Figure 2. Figure 3 presents the average indoor and outdoor monthly temperature distributions for the sample office buildings. The indoor temperatures were measured by attaching an instrument to a wall at 1.2-m-high from the office floor. For the convenience of the occupants, the measurements were taken during weekday business hours (09:00 to 18:00). The outdoor temperatures were those of Seoul and were obtained from the weather data open portal [23].
The space heating’s monthly average site EUIs were high from December to February, with a peak of 15.7 kWh/m2·month in January, when the outdoor temperature was the lowest. The average outdoor and indoor temperatures were −2.5 °C and 22.1 °C, each, from December to February. The space cooling’s monthly average site EUIs were high from July to August, with a peak of 9.0 kWh/m2·month in July, when the outdoor temperature was the highest. Nevertheless, this value was lower than that of space heating in January.
The average value of indoor temperature from July to August was 27.4 °C that was 1.0 °C higher than the average outdoor temperature of 26.4 °C during the same period. The DHW’s monthly average site EUIs were high from November to March and low from June to October. The values of air movement were high in the air conditioning periods of June to September and December to January. Here, the air movement’s energy consumption refers to the fan’s power consumption in the main air conditioning equipment for the air movement associated with space heating, space cooling, ventilation, air circulation, etc. In the cases of lighting, vertical transportation and the city water supply, where the seasonal effects are not significant, the values were comparatively constant all year around. The values of electric appliances (typical floors) increased slightly from July to August and November to February owing to fans in the summer and portable heaters in the winter. However, the differences were not great month-by-month.
5. Magnitudes of the Average Site End-Use EUIs in this Study and the CBECS 2012
This section aims to compare the magnitudes of the average site end-use EUIs and their trends presented in Table 12. As described in the introduction, the information of building energy provided in South Korea is mostly about energy consumption by energy source (electricity, gas, etc.). Owing to the lack of energy consumption information by end-use, it was difficult to review and compare the information with the domestic data. Therefore, the result of this study was compared with the corresponding values [24] of the most recent CBECS report, CBECS 2012, as shown in Table 16. Because CBECS 2012 does not provide the site EUIs by end-use classified by climate zones, the compared data are for office buildings across the United States.
The classification of end-uses in this study is different from that in CBECS 2012, except for space heating, space cooling, DHW, lighting and air movement. Therefore, the sum of the site EUIs of electric appliances (typical floors), vertical transportation. The city water supply was used as the site EUI of electric appliances, etc., in this study. The corresponding value in CBECS 2012 was the sum of the site EUIs of refrigeration, office equipment, computing and other energy consumption. The results of comparing the result of this study and CBECS 2012 are shown in Table 17 and Figure 4.
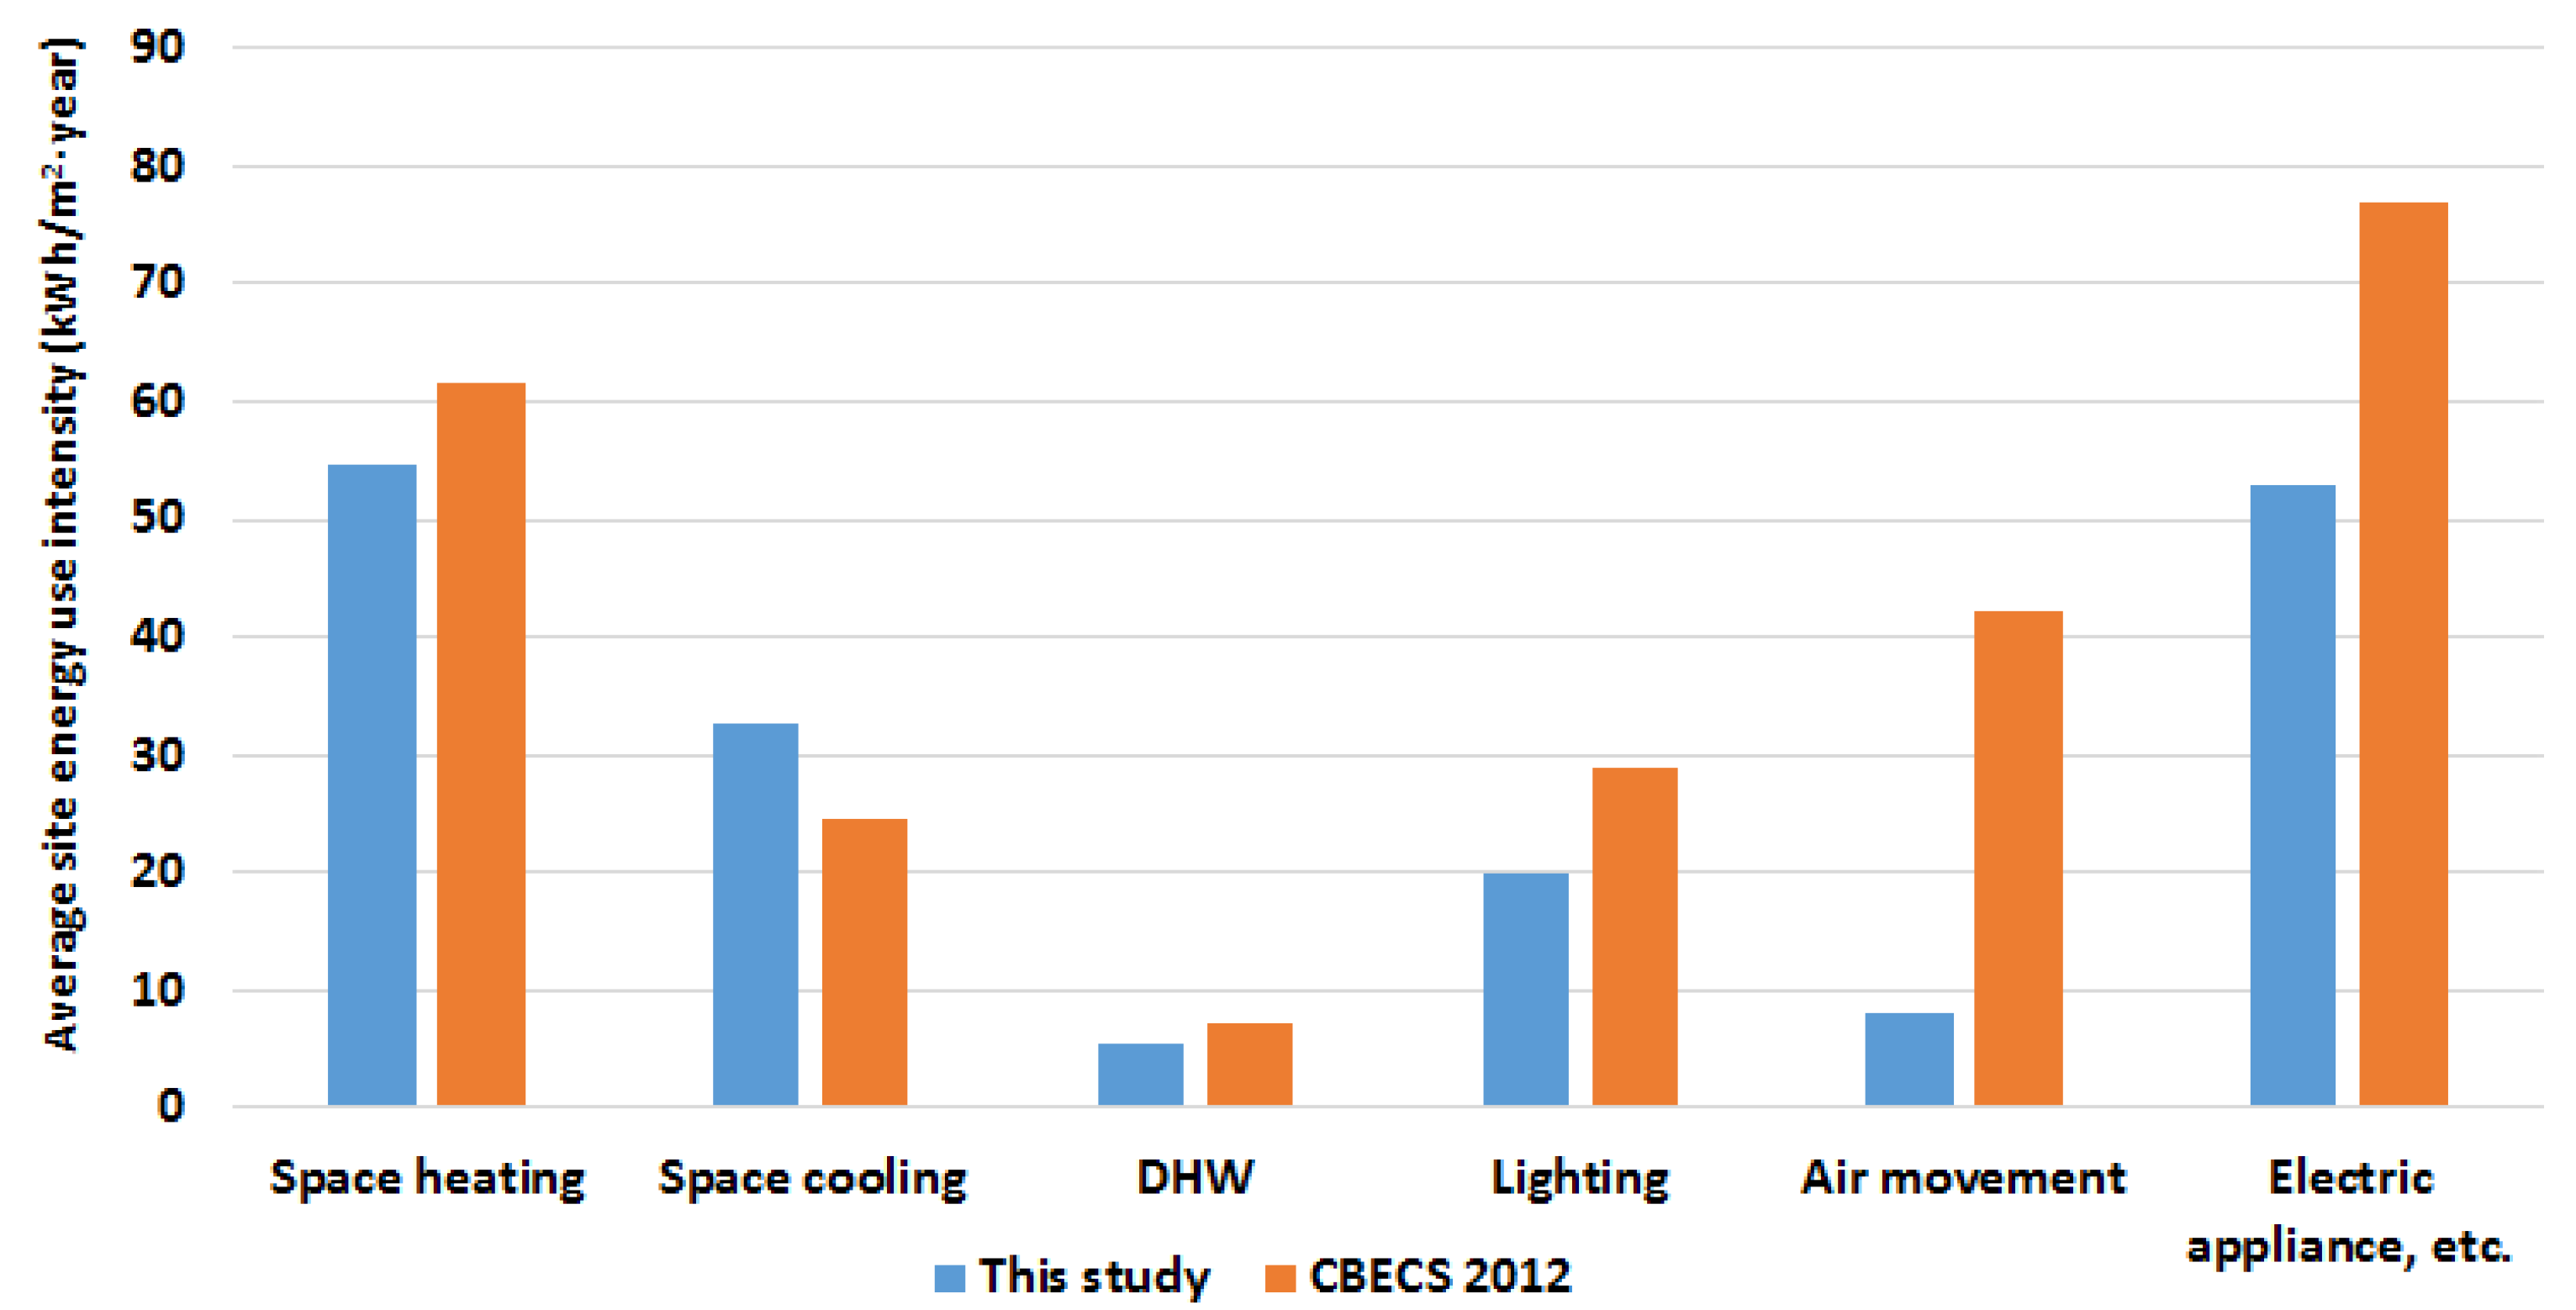
From the comparison, the magnitudes of the site end-use EUIs were found to be in the order of space heating > electric appliances, etc. > space cooling > lighting > air movement > DHW in this study. The corresponding order in CBECS 2012 was electric appliances, etc. > space heating > air movement > lighting > space cooling > DHW. The magnitude relationships between the site EUIs of space cooling and electric appliances, etc., and between air movement and space cooling were different. All site EUIs except for space cooling were lower than the corresponding values in CBECS 2012. The absolute values of the deviations among the result were relatively similar with space heating, space cooling, DHW and lighting (up to 9.2 kWh/m2·year). The absolute values of air movement and electric appliances, etc., were as high as 34.4 kWh/m2·year. In particular, the reason for the large differences in the EUI for air movement is that the definitions of air movement in this study and the CBECS may differ; additionally, this study was conducted in the mixed humid climate zone in Seoul, while the CBECS data are the result of targeting all parts of the United States.
Because the CBECS 2012 data used in the comparison were for office buildings across the United States as of 2012, there may be differences originating from the climate characteristics applied to the results of this study. Moreover, the usage patterns, operating methods, technical systems and aging of office buildings in the United States may differ from those in South Korea. It is also necessary to consider that the calculation methods and statistical processing procedure for end-use energy consumption in this study are different from those followed for CBECS 2012.
6. Conclusions
This study aimed to present the statistical values of site EUIs by end-use based on measured data collected from 48 office buildings in Seoul for one year (May 2017 to April 2018), and to identify the magnitudes with the CBECS 2012 data. The key conclusions can be summarized as follows:
- (1)
- The average values of the annual site end-use EUIs were in the order of space heating > electric appliances (typical floors) > space cooling > lighting > air movement > DHW > vertical transportation > city water supply. The average annual site EUIs of space heating and electric appliances (typical floors) were high, at 54.6 and 49.1 kWh/m2·year, each, whereas those values of space cooling, lighting, air movement and DHW were 32.7, 19.8, 7.9 and 5.5 kWh/m2·year, each. The corresponding values for vertical transportation and the city water supply were low (under 3.2 kWh/m2·year). The average annual site EUI of space cooling was approximately 60% of that of space heating, whereas that of lighting was approximately 60% of that of space cooling. Air movement, DHW, vertical transportation, and the city water supply consumed less energy than the other end-uses. Therefore, space heating was the greatest importance to reduce the annual site energy consumption, followed by electric appliances (typical floors), space cooling and lighting.
- (2)
- The average values of the annual primary end-use EUIs were in the order of electric appliances (typical floors) > space heating > space cooling > lighting > air movement > DHW > vertical transportation > city water supply. The average annual primary EUI of electric appliances (typical floors) was the highest, at 135.0 kWh/m2·year, whereas that of the city water supply was the lowest, at 2.0 kWh/m2·year. The corresponding values for space heating, space cooling, lighting, air movement, DHW and vertical transportation were 88.8, 64.2, 54.5, 21.8, 9.1 and 8.9 kWh/m2·year, each. The average annual primary end-use EUIs’ percentages were 35.1%, 23.1%, 16.7% and 14.2% for electric appliances (typical floors), space heating, space cooling and lighting, each. Therefore, electric appliances (typical floors), which had the highest energy consumption, were the most important for the annual primary energy consumption reduction, followed by space heating, space cooling and lighting.
- (3)
- The average values of the end-use greenhouse-gas-emission intensities were in the order of electric appliances (typical floors) > space heating > space cooling > lighting > air movement > DHW > vertical transportation > city water supply. The average annual greenhouse-gas-emission intensity of electric appliances (typical floors) was the highest, at 22.9 kg CO2eq/m2·year, whereas that of the city water supply was the lowest, at 0.3 kgCO2eq/m2·year. The corresponding values for space heating, space cooling, lighting, air movement, DHW and vertical transportation were 15.1, 11.1, 9.2, 3.7, 1.5 and 1.5 kgCO2eq/m2·year, each. The average annual end-use greenhouse gas-emission intensity percentages were 35.1%, 23.1%, 17.0% and 14.1% for electric appliances (typical floors), space heating, space cooling and lighting, respectively. Therefore, electric appliances (typical floors), which had the highest greenhouse-gas-emission intensity, were the most important in terms of reducing greenhouse gas emissions, followed by space heating, space cooling and lighting.
- (4)
- The space heating’s monthly average site EUIs were high from December to February, with a peak of 15.7 kWh/m2·month in January. The values of space cooling were high from July to August, with a peak of 9.0 kWh/m2·month in July, but this value was lower than that of space heating in January. The values of DHW were high from November to March and low from June to October. The values of air movement were high in the air conditioning periods of June to September and December to January. The values of lighting, vertical transportation and the city water supply, where the seasonal effects are not significant, were relatively constant throughout the year. The values of electric appliances (typical floors) increased slightly in July to August and November to February owing to fans in the summer and portable heaters in the winter. However, the differences were not great month-by-month.
- (5)
- The magnitudes of the average site end-use EUIs in the office buildings in this study with those in CBECS 2012 showed that the magnitude relationships between the site EUIs of space cooling and electric appliances, etc., and between air movement and space cooling were different. All site EUIs except for space cooling were lower than the corresponding values in CBECS 2012. The absolute values of the deviations among the site EUIs were relatively similar with space heating, space cooling, DHW and lighting (up to 9.2 kWh/m2·year). The absolute values for air movement and electric appliances, etc., were rather high. However, it needs to be considered that the climate characteristics, office building characteristics, methods of calculation and statistical processing methods followed in this study may differ from those used for the CBECS 2012 data.
The number of sample office buildings for measuring end-use energy consumption increased in 2019 (85 samples in total). The data on the EUIs and greenhouse-gas-emission intensities by end-use classified by stratification variables will be updated through continuous measurement.
Author Contributions
Conceptualization, S.-Y.S.; Data curation, H.-S.J.; Formal analysis, H.-S.J.; Funding acquisition, S.-Y.S.; Investigation, S.-Y.H. and S.-I.K.; Project administration, S.-Y.S.; Software, Y.-J.K., S.-J.L. and I.-A.S.; Validation, H.-S.J.; Visualization, H.-S.J.; Writing—original draft, H.-S.J.; Writing—review & editing, S.-Y.S. All authors have read and agreed to the published version of the manuscript.
Funding
This research was supported by a grant (19AUDP-B0790104-06) from the Architecture & Urban Development Research Program funded by the Ministry of Land, Infrastructure and Transport of the Korean government.
Conflicts of Interest
The authors declare no conflicts of interest.
Appendix A. The Main Examples of Space Heating, Space Cooling and DHW Systems
The main examples of space heating, space cooling and DHW systems are shown in Table A1, Table A2, Table A3. The Korea Energy Agency—a public organization—announced the measurement system installation project, evaluated the bidding companies and selected operators for the measurement system installation. The selected operators recruited sample office buildings and installed the measurement systems according to the systems shown in Table A1, Table A2, Table A3.

Table A1.
Examples of space heating systems.
| Heat Source | System Configuration |
|---|---|
| Individual heat source | Air heater |
| Electric heater, Electric radiator, Electric radiant heating | |
| Electric heat pump (EHP) (+ ventilation unit) | |
| Gas heat pump (GHP) (+ ventilation unit) | |
| Air handling unit (AHU)-type heat pump air conditioner—outdoor unit combined type | |
| AHU-type heat pump air conditioner—outdoor unit separated type | |
| Central heat source | Hot water boiler + Radiator or convector |
| Steam boiler + Radiator or convector | |
| Water source heat pump (unitary type) | |
| Cooling and heating unit + FCU | |
| Hot water boiler + FCU | |
| Steam boiler + FCU | |
| District heating heat exchanger + FCU | |
| Ground source heat pump + FCU | |
| Cooling and heating unit + Constant air volume (CAV) AHU + FCU | |
| District heating heat exchanger + CAV AHU + FCU | |
| Hot water boiler + Variable air volume (VAV) AHU + FPU | |
| Cooling and heating unit + Steam humidifier + CAV AHU + FCU | |
| Cooling and heating unit + Steam humidifier + VAV AHU + Convector | |
| Steam boiler + VAV AHU + Convector | |
| Cooling and heating unit + Underfloor air distribution (UFAD) | |
| Cooling and heating unit + CAV AHU + Radiant cooling and heating |
Table A2.
Examples of space cooling systems.
| Heat Source | System Configuration |
|---|---|
| Individual heat source | Cooling-only air conditioner (PAC) |
| Water-cooled air conditioner (cooling only) | |
| EHP (+ ventilation unit) | |
| GHP (+ ventilation unit) | |
| AHU-type heat pump air conditioner—outdoor unit combined type | |
| AHU-type heat pump air conditioner—outdoor unit separated type | |
| Central heat source | Water source heat pump (unitary type) |
| Cooling and heating unit + FCU | |
| Compression chiller + FCU | |
| District heating absorption chiller + FCU | |
| Ground source heat pump + FCU | |
| Cooling and heating unit + CAV AHU + FCU | |
| District heating absorption chiller + CAV AHU + FCU | |
| Ice storage system + VAV AHU + FPU | |
| Cooling and heating unit + VAV AHU + Convector | |
| Steam boiler absorption chiller + VAV AHU + Convector | |
| Cooling and heating unit + UFAD | |
| Cooling and heating unit + CAV AHU + Radiant cooling and heating |
Table A3.
Examples of DHW systems.
| Heat Source | System Configuration | Energy Source |
|---|---|---|
| Individual heat source | Electric water heater (boiler) | Electricity |
| Gas water heater (boiler) | Gas | |
| Central heat source | DHW-only boiler | Gas, oil |
| Heating and DHW boiler | Gas, oil | |
| District heating DHW heat exchanger | District heating |
Appendix B. Details of the Measurement Instruments
Table A4 presents the details of the measurement instruments used to measure the energy consumption by end-use.
Table A4.
Details of the measurement instruments.
| Instrument | Model Name | Specifications | Website | Photograph |
|---|---|---|---|---|
| Hot water calorimeter | TFM100 |
| taehung.co.kr |  |
| Gas flowmeter | G1.6, G2.5 |
| wzit.co.kr |  |
| Diesel flowmeter | FD-OR15P |
| Flowdigital.co.kr |  |
| Watt-hour meter | ANYPA-Multi100 |
| cncinst.co.kr |  |
| Smart plug | ANYPA-SPG100 |
| cncinst.co.kr |  |
| Thermohygrometer | ANYPA-STH100 |
| cncinst.co.kr |  |
Appendix C. Examples of Measuring Energy Consumption by End-Use
Figure A1 presents examples of measuring energy consumption by end-use.
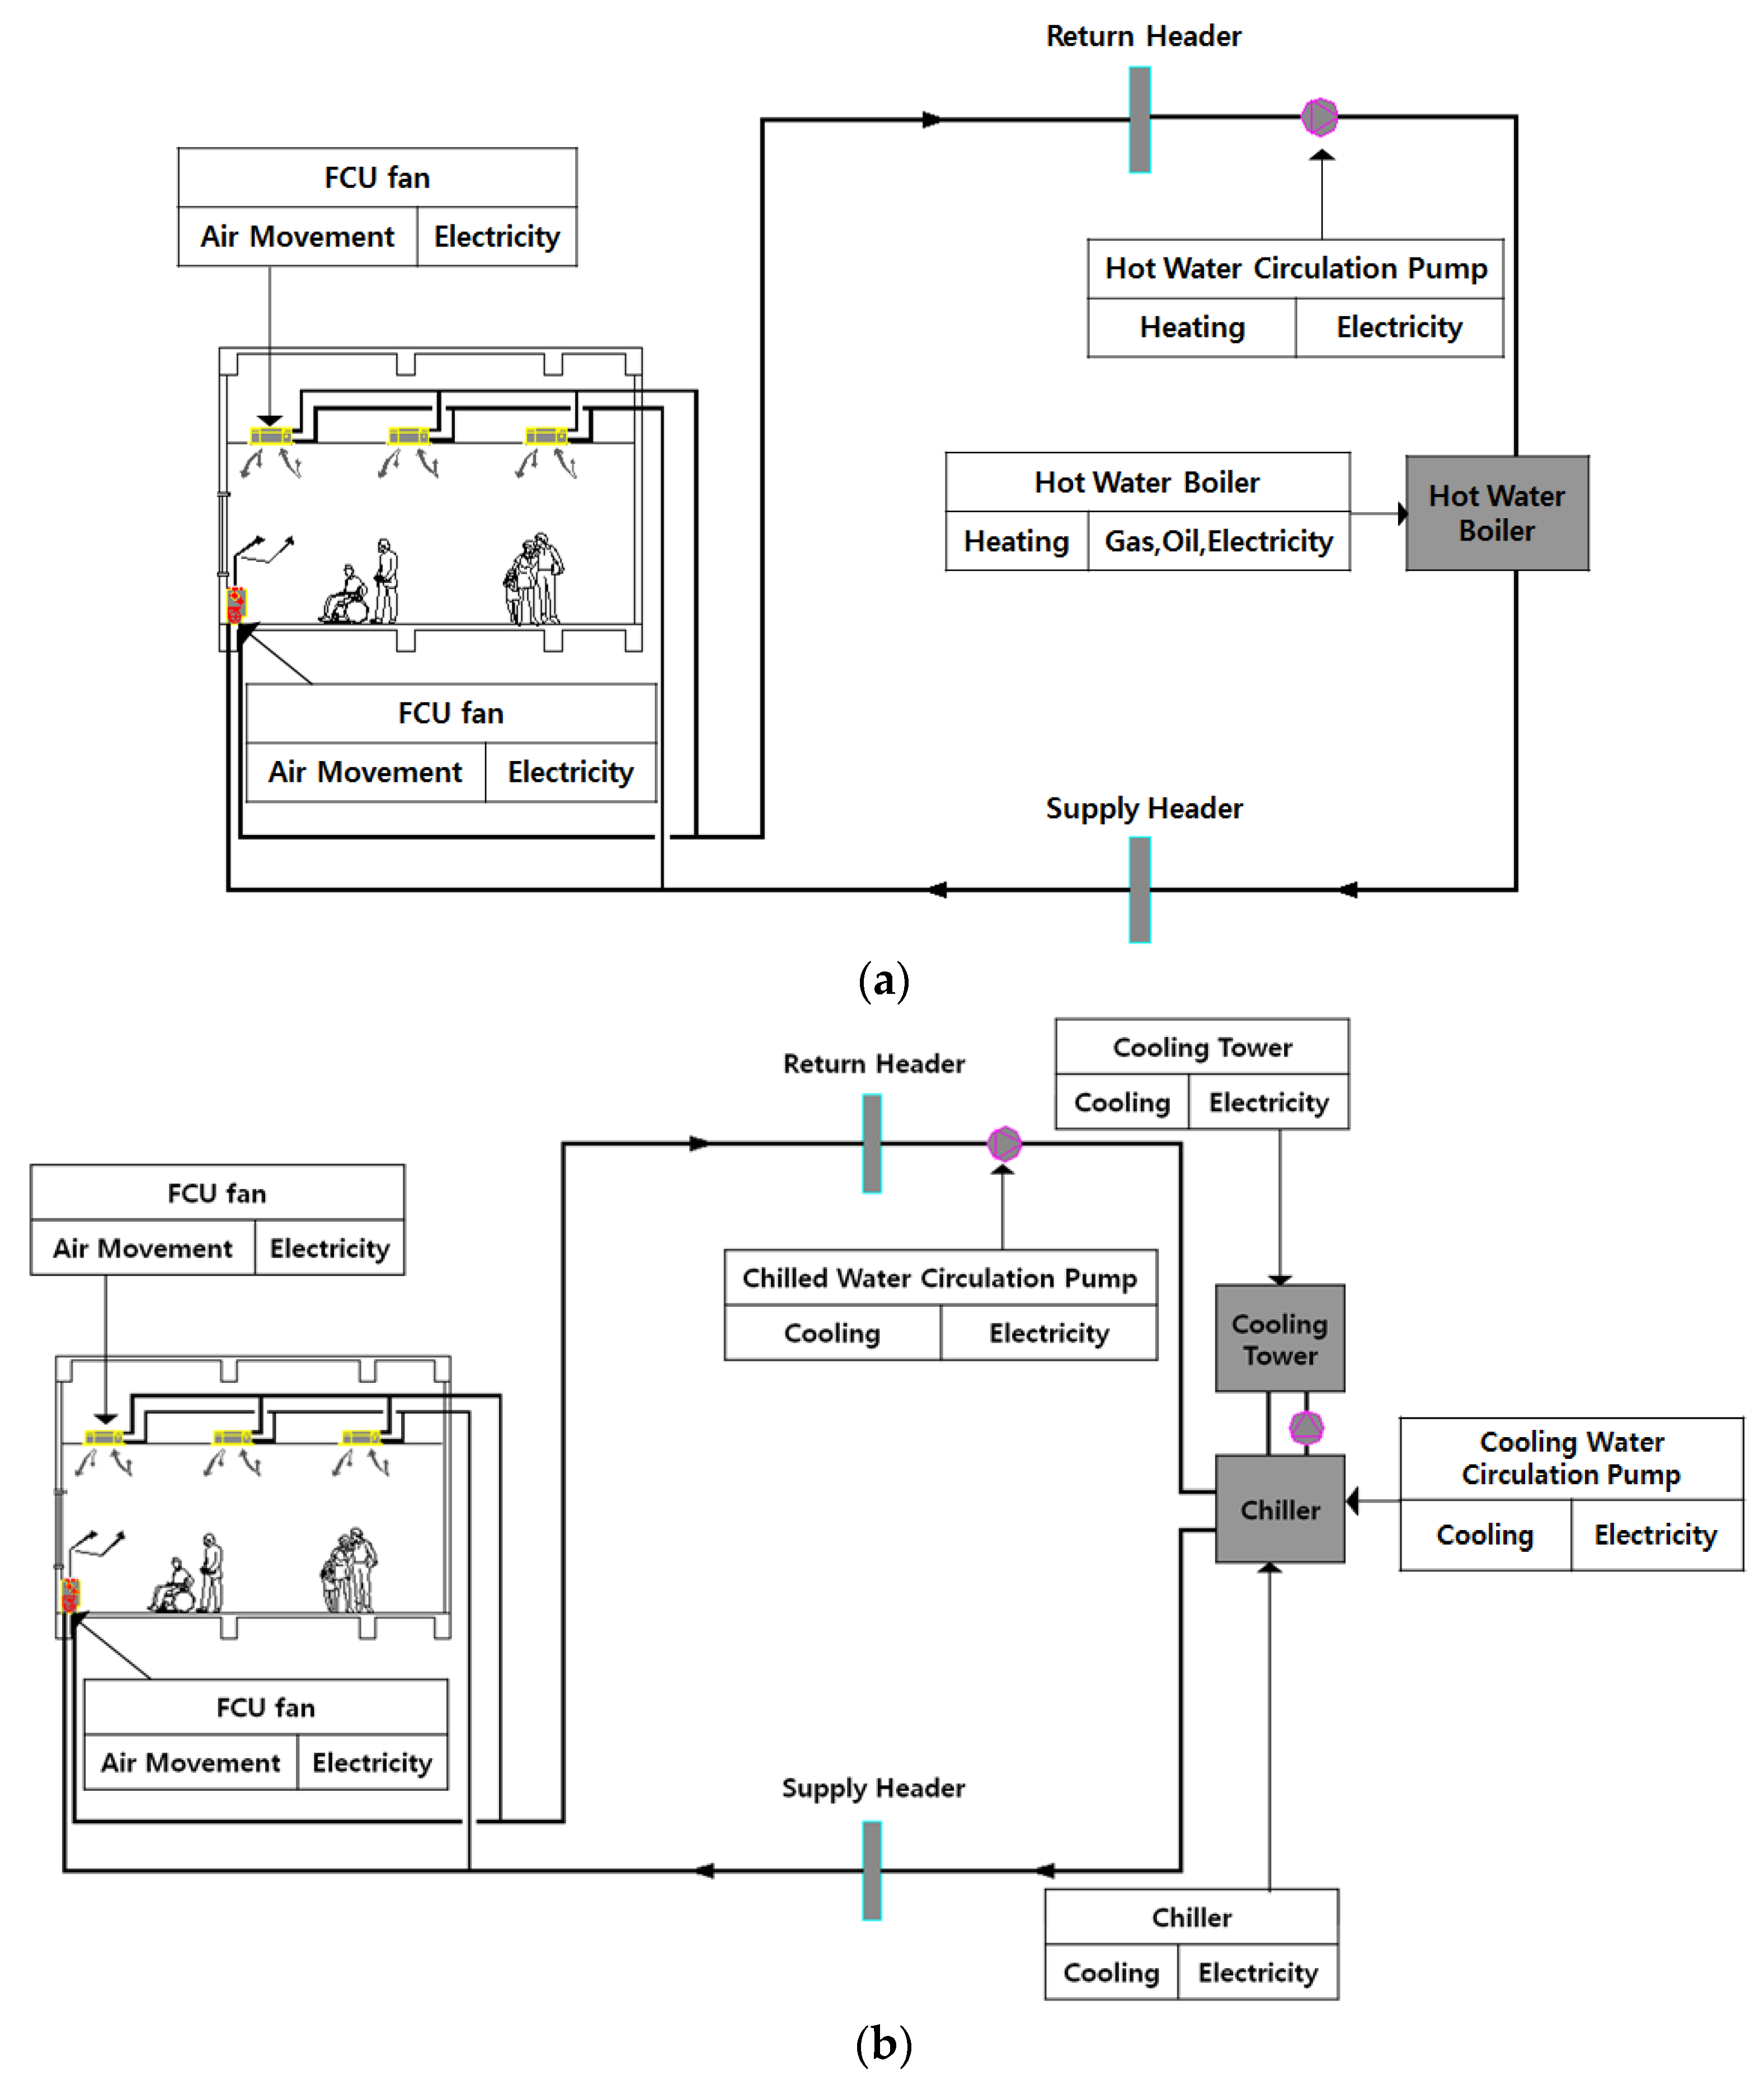
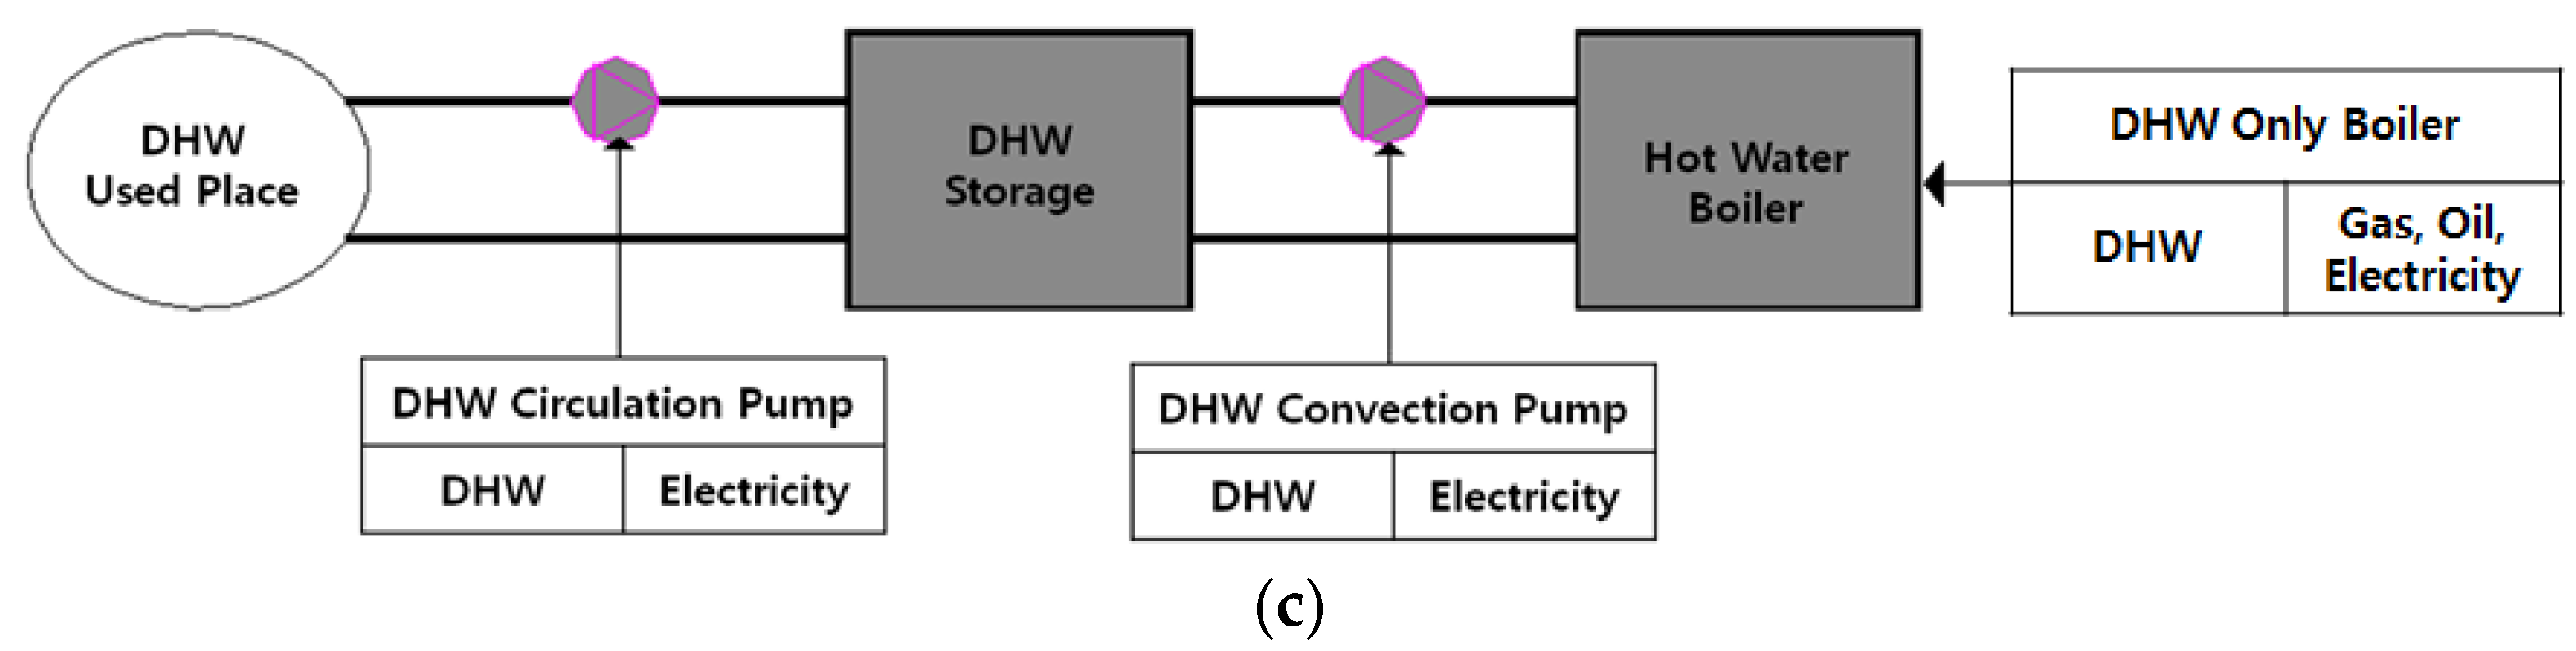
Figure A1.
Illustrations of energy consumption measurements by end-use. (a) Heating energy consumption of hot water boiler + fan coil unit (FCU); (b) Cooling energy consumption of compression chiller + FCU; (c) Energy consumption of domestic hot water (DHW)-only central boiler.
Figure A1.
Illustrations of energy consumption measurements by end-use. (a) Heating energy consumption of hot water boiler + fan coil unit (FCU); (b) Cooling energy consumption of compression chiller + FCU; (c) Energy consumption of domestic hot water (DHW)-only central boiler.


Appendix D. Box Plots of Site EUIs, Primary EUIs and Greenhouse-Gas-Emission Intensities by End-Use
Box plots of site EUIs, primary EUIs and greenhouse-gas-emission intensities by end-use are shown in Figure A2, Figure A3 and Figure A4.
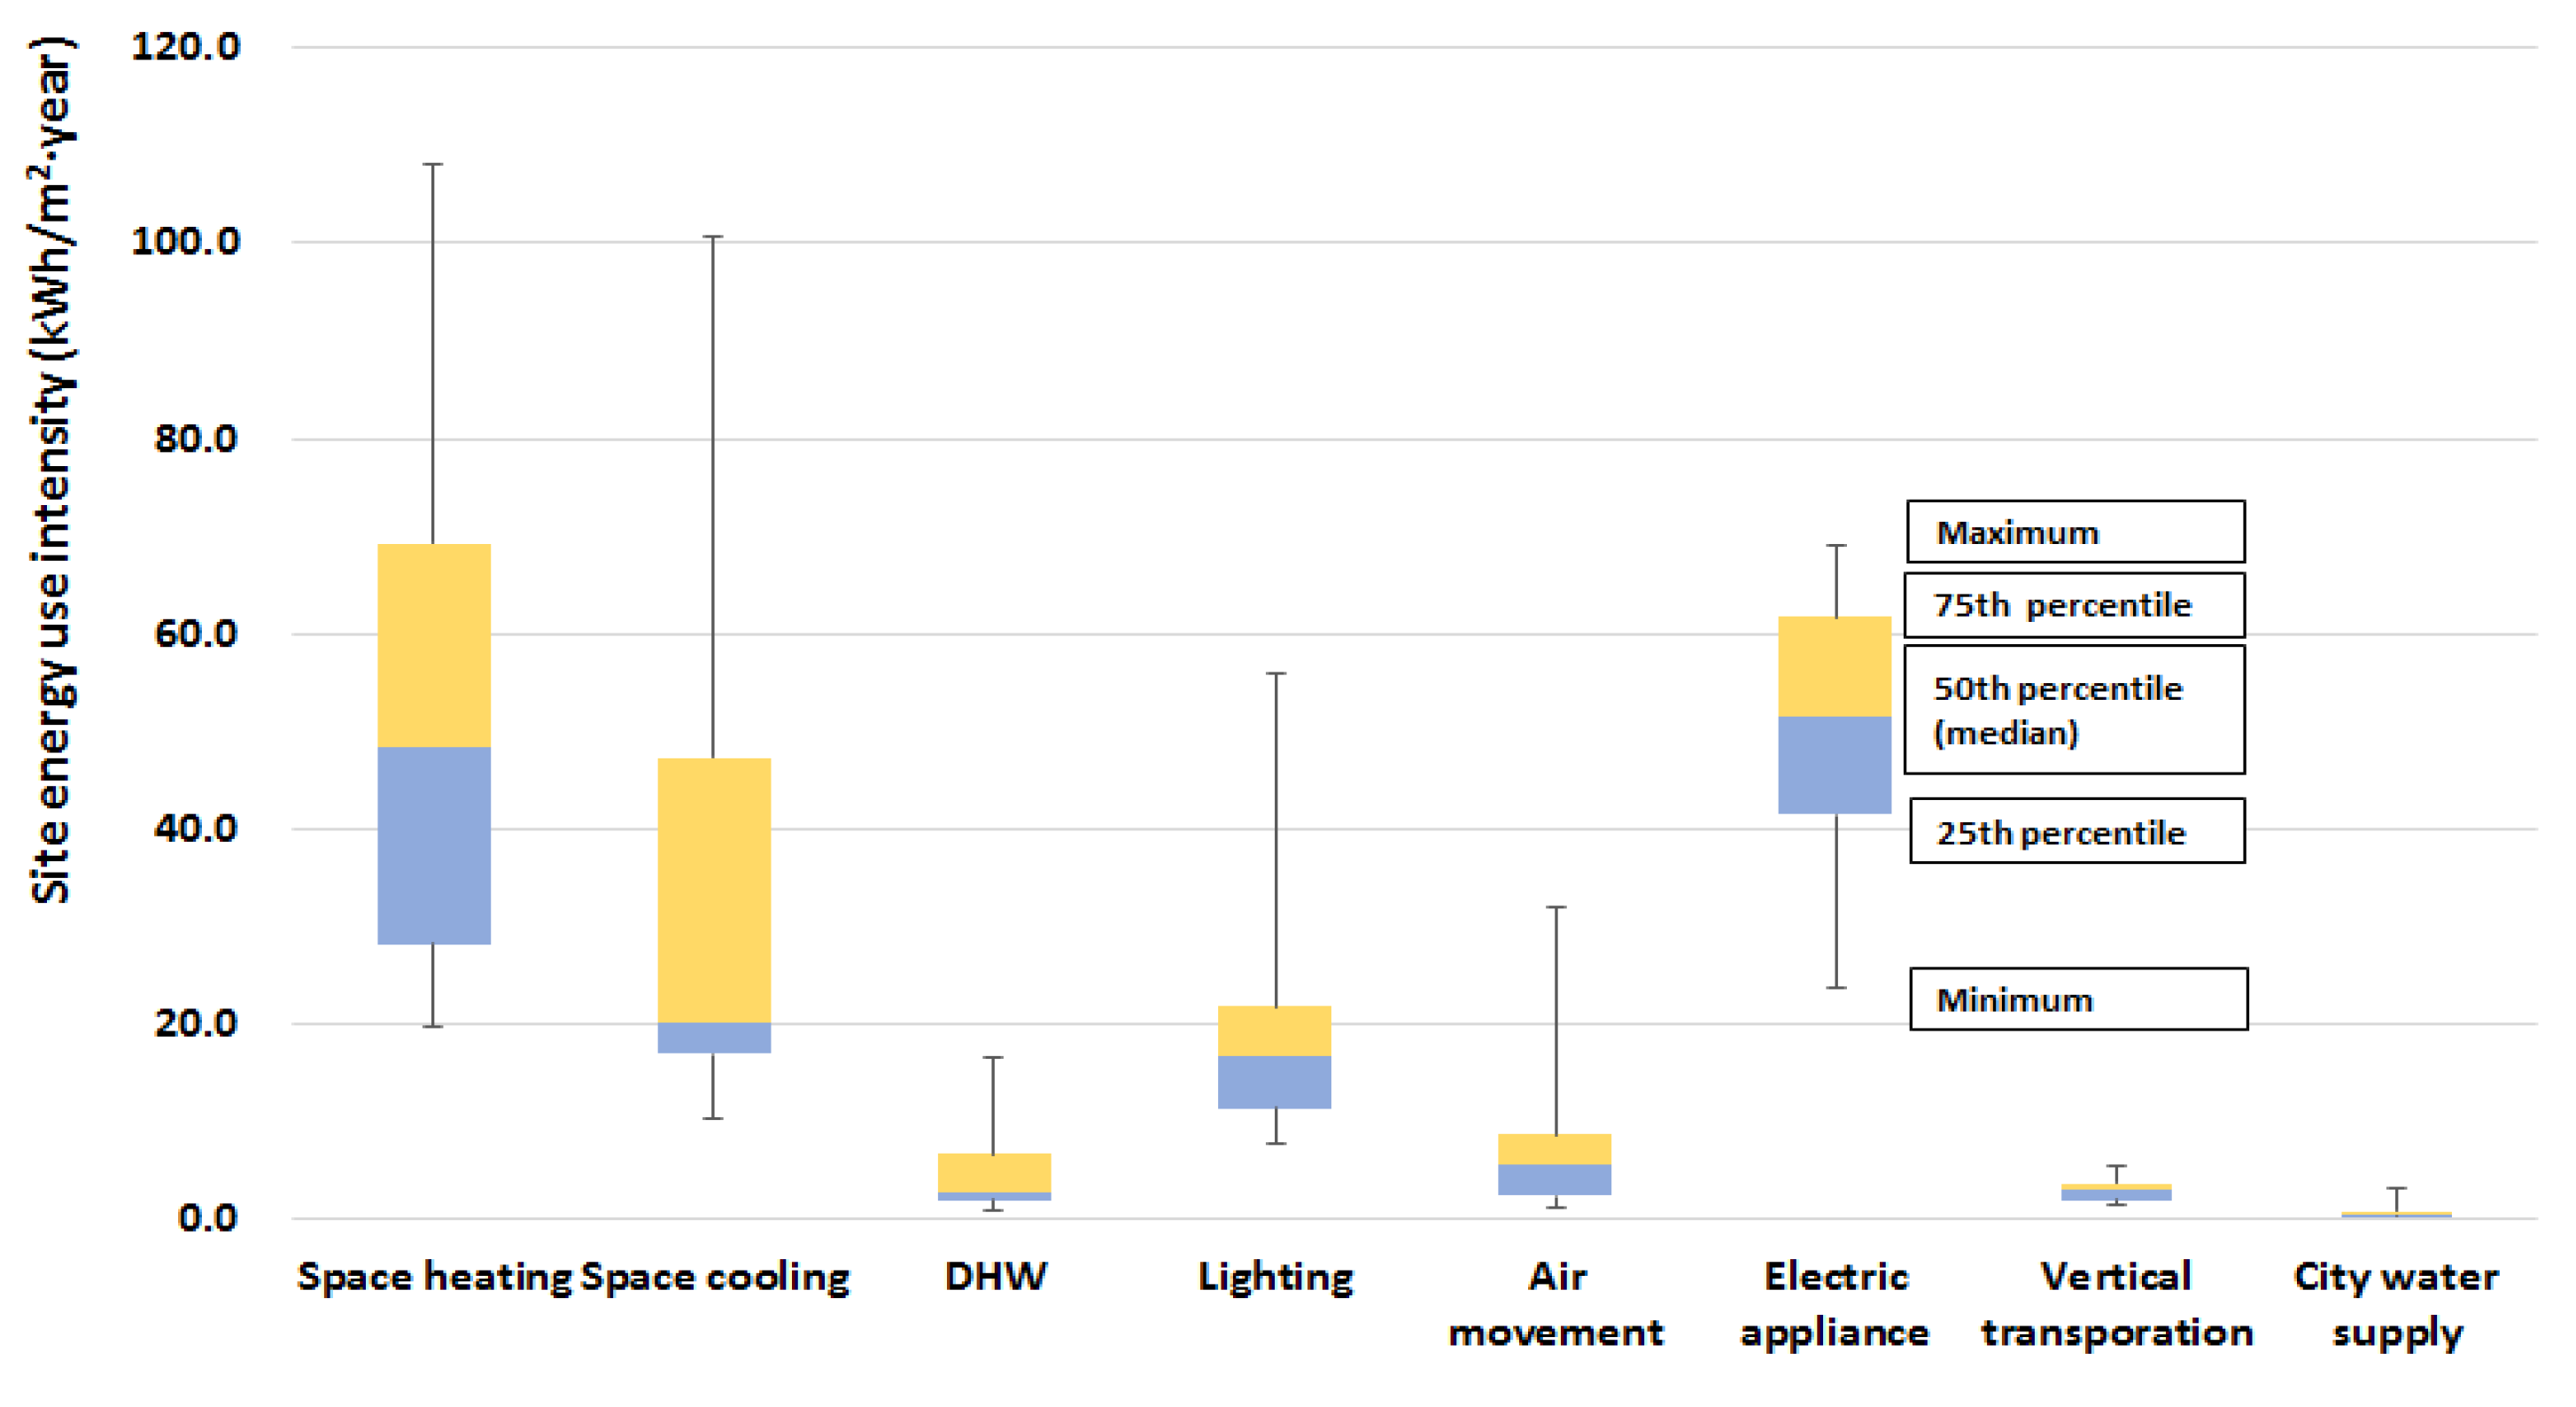
Figure A2.
Box plot of site EUIs by end-use (kWh/m2·year).

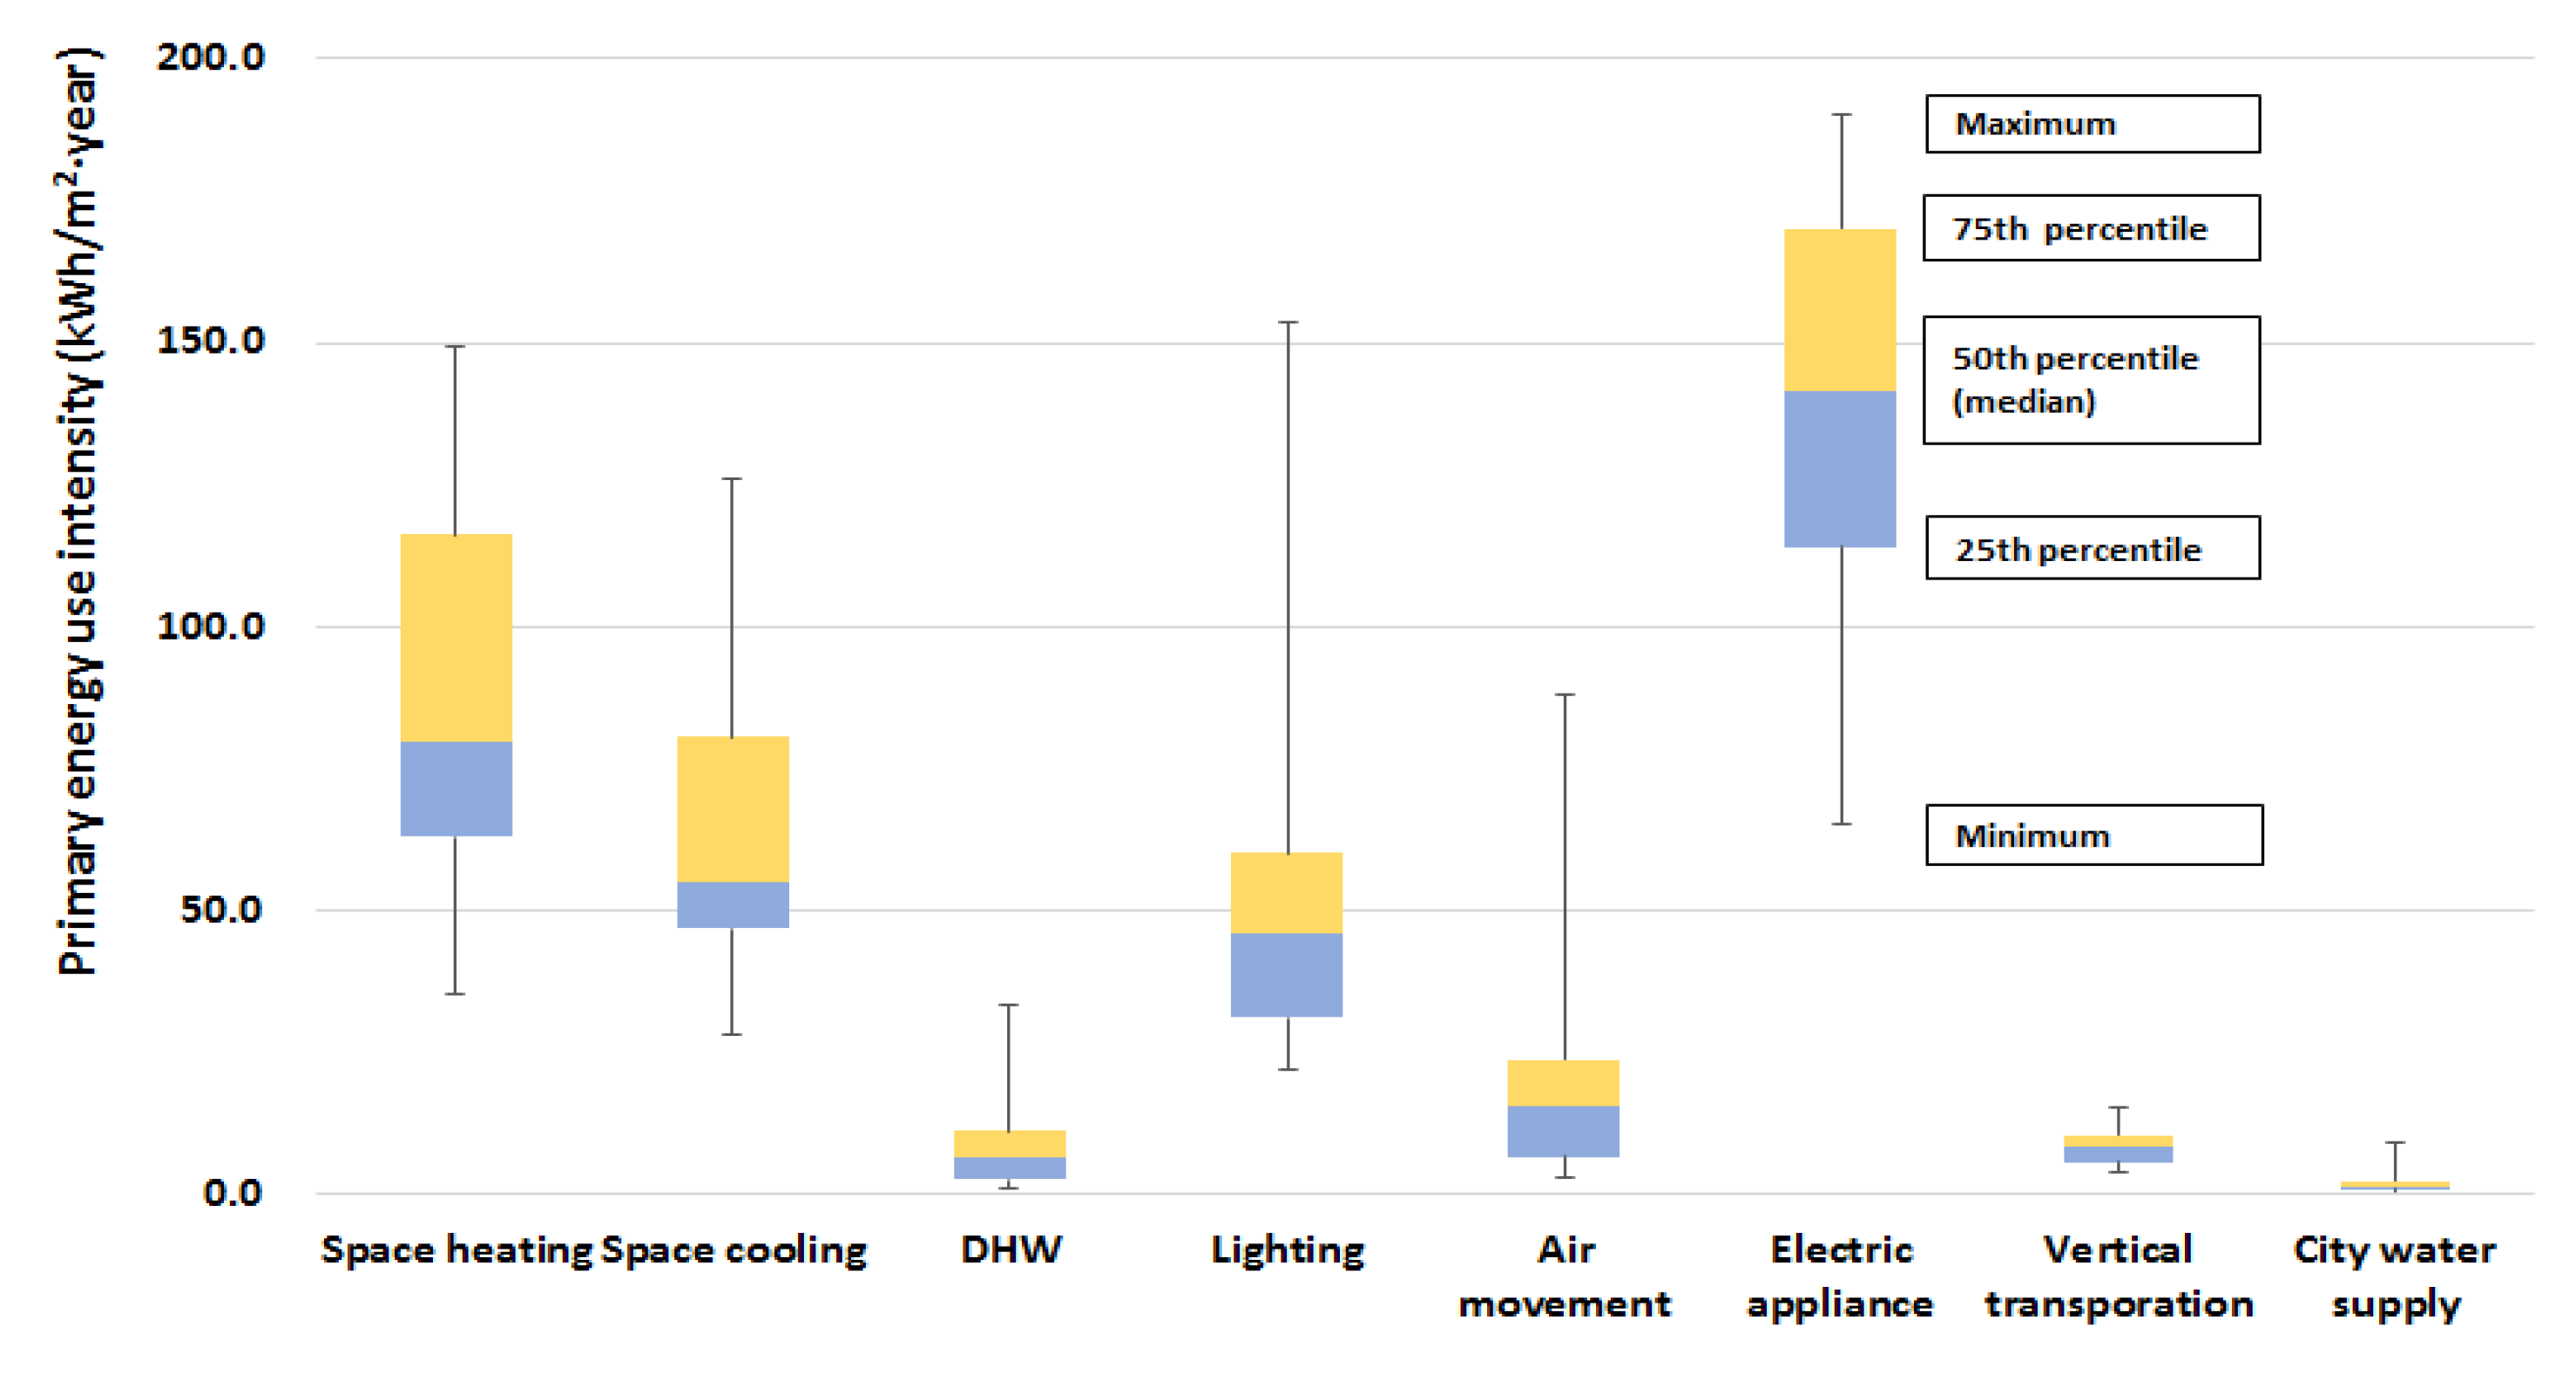
Figure A3.
Box plot of primary EUIs by end-use (kWh/m2·year).

Figure A4.
Box plot of greenhouse-gas-emission intensities by end-use (kgCO2eq/m2·year).

References
- Commercial Building Energy Consumption Survey (CBECS), U.S. Energy Information Administration. Available online: https://www.eia.gov/consumption/commercial/ (accessed on 10 January 2019).
- Residential Energy Consumption Survey (RECS), U.S. Energy Information Administration. Available online: https://www.eia.gov/consumption/residential/ (accessed on 10 January 2019).
- U.K. Department of Business, Energy and Industrial Strategy (2014–2015), Building Energy Efficiency Survey (BEES). Available online: https://www.gov.uk/government/publications/building-energy-efficiency-survey-bees (accessed on 16 January 2020).
- Jin, H.S.; Lim, S.H.; Kang, J.K.; Kim, S.I.; Lim, J.H.; Kim, Y.D.; Song, S.Y. Examples of measurement methods for providing detailed information on energy consumption by end-use in office buildings. J. Archit. Inst. Korea Struct. Constr. 2017, 33, 41–52. [Google Scholar]
- KIAEBS S-7: 2016. Methods for Classification, Measurement and Normalization of Energy Consumption by End-Use in Office Buildings; Korean Institute of Architectural Sustainable Environment and Building Systems: Seoul, Korea, 2016. [Google Scholar]
- Lim, H.Y.; Lim, S.H.; Jin, H.S.; Kim, S.I.; Lee, S.J.; Lim, J.H.; Song, S.Y. Annual intensities (2016–2017) analysis of energy use and CO2 emission by end use based on measurements of sample office building. J. Archit. Inst. Korea Struct. Constr. 2018, 34, 19–27. [Google Scholar]
- Jing, R.; Wang, M.; Zhang, R.; Li, N.; Zhao, Y. A study on energy performance of 30 commercial office buildings in Hong Kong. Energy Build. 2017, 144, 117–128. [Google Scholar] [CrossRef]
- Wang, C.; Shi, J.; Chen, Z.; Zha, X. Study on energy consumption of large public building based on sub-metering technology. Procedia Eng. 2017, 205, 3056–3060. [Google Scholar] [CrossRef]
- Howard, B.; Parshall, L.; Thompson, J.; Hammer, S.; Dickinson, J.; Modi, V. Spatial distribution of urban building energy consumption by end use. Energy Build. 2012, 45, 141–151. [Google Scholar] [CrossRef]
- Li, J.; Zhang, H.; You, S.; Xie, Z. Survey and analysis of energy consumption in office buildings in Tianjin. Front. Energy 2013, 7, 69–74. [Google Scholar] [CrossRef]
- Zhu, J.; Li, D. Current situation of energy consumption and energy saving analysis of large public building. Procedia Eng. 2015, 121, 1208–1214. [Google Scholar] [CrossRef] [Green Version]
- Saidur, R. Energy consumption, energy savings, and emission analysis in Malaysian office buildings. Energy Policy 2009, 37, 4104–4113. [Google Scholar] [CrossRef]
- Pérez-Lombard, L.; Ortiz, J.; Pout, C. A review on buildings energy consumption information. Energy Build. 2008, 40, 394–398. [Google Scholar] [CrossRef]
- Jaber, J.O.; Mohsen, M.S.; Al-Sarkhi, A.; Akash, B. Energy analysis of Jordan’s commercial sector. Energy Policy 2003, 31, 887–894. [Google Scholar] [CrossRef]
- Ewha Womans University. Sample Design Report of Measured Buildings: Development of Building Energy Integrated Support System for the Spread of Low-Energy Building, Annual Report D-1-①. Available online: https://ewha.ac.kr/ewhaen/index.do.
- Statistics for Korean Ministry of Land, Infrastructure, and Transport, 2013 Building Statistics. Available online: https://stat.molit.go.kr/portal/main/portalMain.do (accessed on 1 October 2019).
- ASHRAE. Fundamental, F18 SI: Nonresidential Cooling and Heating Load Calculation; American Society of Heating, Refrigerating and Air-Conditioning Engineers: Atlanta, GA, USA, 2009. [Google Scholar]
- ASHRAE. Standard 90.1, Lighting Power Densities Using Space-by-Space Method; American Society of Heating, Refrigerating and Air-Conditioning Engineers: Atlanta, GA, USA, 2007. [Google Scholar]
- Wilkins, C.K.; McGaffin, N. Measuring computer equipment loads in office buildings. ASHRAE J. 1994, 36, 21–24. [Google Scholar]
- Korea Energy Agency. Operational Regulations for Building Energy Efficiency Rating System; Korea Energy Agency: Ulsan, Korea, 2013.
- Ministry of Environment. Guidelines for Operating Greenhouse Gas Energy Target Management in Public Sector, Mark 7. In Notification from Ministry of Environment; Korea Environment institute: Sejong, Korea, 2017. [Google Scholar]
- Integrated Information Center for Greenhouse Gas under Ministry of Environment. 2013 Korean National Greenhouse Gas Emissions Absorption Factor. Available online: https://eng.me.go.kr/eng/web/index.do?menuId=464.
- The Korea Meteorological Administration Data Center, Average Outdor Temperature. Available online: https://data.kma.go.kr/data/grnd/selectAsosRltmList.do?pgmNo=36 (accessed on 16 January 2020).
- Table E2. Major Fuel Consumption Intensities (Btu) by End Use. 2012. Available online: https://www.eia.gov/consumption/commercial/data/2012/c&e/cfm/e2.php (accessed on 16 April 2019).
Figure 1.
Measurement data collection system.

Figure 2.
Monthly average site EUI distribution (kWh/m2·month) and ratios (%).

Figure 3.
Monthly average outdoor and indoor temperatures distribution (°C).

Figure 4.
Magnitudes of average site end-use EUIs in this study and CBECS 2012.

Table 1.
Total sample design of office buildings.
| Completion Year | Gross Area | Number of Sample Buildings |
|---|---|---|
| 1992 or earlier | Smaller than 3000 m2 | 10 |
| Smaller than 10,000 m2 | 9 | |
| 10,000 m2 or larger | 9 | |
| 2002 or earlier | Smaller than 3000 m2 | 10 |
| Smaller than 10,000 m2 | 9 | |
| 10,000 m2 or larger | 9 | |
| 2002 or later | Smaller than 3000 m2 | 10 |
| Smaller than 10,000 m2 | 10 | |
| 10,000 m2 or larger | 9 | |
| Sum | – | 85 |
Table 2.
Measurement system installation schedule in sample office buildings.
| Year | 2014 | 2015 | 2016 | 2017 | 2018 | 2019 | Sum |
|---|---|---|---|---|---|---|---|
| Number of office buildings | 1 | 18 | 29 | 10 | 16 | 11 | 85 |
Table 3.
Classifications and definitions of energy consumption by end-use in office buildings.
| Classification | Definition |
|---|---|
| Space heating | Energy consumption for space heating and operation of main space heating systems including central heating sources (boiler, etc.), hot water circulation pumps and individual heating systems (electric heat pump, gas engine-driven heat pump, fan heater, electric heating panel, etc.) |
| Space cooling | Energy consumption for space cooling and operation of main space cooling systems including central cooling sources (chiller, cooling tower, cooling water circulation pump, etc.), chilled water circulation pumps and individual cooling systems (electric heat pump, gas engine-driven heat pump, packaged air conditioner, etc.) |
| Domestic hot water (DHW) | Energy consumption for producing hot water and operation of main DHW systems including central DHW sources (boiler, etc.), DHW circulation pumps and individual DHW systems (electric or gas water heater, etc.) |
| Lighting | Electricity consumption of main lighting systems with separate branch circuits |
| Air movement | Electricity consumption for air movement (space heating, space cooling, ventilation, air circulation, etc.) of main air conditioning systems including air handling unit, the external unit of an air conditioning system, fan coil unit (FCU), electric heat pump, gas engine-driven heat pump, etc. |
| Electrical appliances (typical floors) | • Remaining electricity consumption obtained by subtracting electricity consumption for other uses from total electricity consumption in typical floors • Corresponds to unclassified total electricity consumption via power outlets in typical floors |
| Vertical transportation | Electricity consumption of elevators and escalators |
| City water supply | Electricity consumption of city water supply pumps |
Table 4.
Photographs of sample office buildings.
| G Building (Smaller than 3000 m2) | S Building (Smaller than 10,000 m2) | G building (10,000 m2 or Larger) |
|---|---|---|
 |  |  |
Table 5.
Distribution of the sample office buildings.
| Completion year | Classification | Number of Sample Buildings | Gross area (m2) | Classification | Number of Sample Buildings |
| 1992 or earlier | 18 (38%) | Less than 3000 | 10 (21%) | ||
| 2002 or earlier | 15 (31%) | Less than 10,000 | 20 (42%) | ||
| 2002 or later | 15 (31%) | 10,000 or more | 18 (37%) | ||
| Sum | 48 (100%) | Sum | 48 (100%) | ||
| Max. (year) | 2012 | Max (m2) | 51,567.3 | ||
| Min. (year) | 1967 | Min. (m2) | 899.4 | ||
| Avg. (year) | 1995.3 | Avg. (m2) | 11,589.7 |
Table 6.
Construction characteristics.
| Structure Type | Classification | Number of Sample Buildings | Core Type | Classification | Number of Sample Buildings |
| RC | 31 (65%) | Side core | 42 (88%) | ||
| SRC | 17 (35%) | Central core | 4 (8%) | ||
| – | – | Double-side core | 2 (4%) | ||
| Sum | 48 (100%) | Sum | 48 (100%) | ||
| Orientation | Classification | Number of sample buildings | Aspect ratio of typical floor (1:X) | Classification | Number of sample buildings |
| Northeast | 4 (8%) | X < 1.5 | 25 (52%) | ||
| East | 3 (6%) | 1.5 ≤ X < 2.0 | 16 (33%) | ||
| Southeast | 16 (33%) | 2.0 ≤ X < 2.5 | 3 (6%) | ||
| South | 10 (21%) | 2.5 ≤ X < 3.0 | 1 (2%) | ||
| Southwest | 6 (13%) | 3.0 ≤ X | 3 (6%) | ||
| West | 6 (13%) | – | – | ||
| Northwest | 3 (6%) | – | – | ||
| Sum | 48 (100%) | Sum | 48 (100%) | ||
| – | – | Max. | 3.9 | ||
| – | – | Min. | 1.0 | ||
| – | – | Avg. | 1.6 | ||
| Effective floor area ratio of typical floor (R,%) | Classification | Number of sample buildings | Floor height of typical floor(H, m) | Classification | Number of sample buildings |
| R < 70 | 6 (13%) | H < 3.4 | 11 (23%) | ||
| 70 ≤ R < 75 | 11 (23%) | 3.4 ≤ H < 3.7 | 18 (38%) | ||
| 75 ≤ R < 80 | 14 (29%) | 3.7 ≤ H < 4.0 | 12 (25%) | ||
| 80 ≤ R < 85 | 14 (29%) | 4.0 ≤ H | 4 (8%) | ||
| 85 ≤ R | 3 (6%) | Unverified | 3 (6%) | ||
| Sum | 48 (100%) | Sum | 48 (100%) | ||
| Max. (%) | 86.6 | Max; (m2) | 4.2 | ||
| Min. (%) | 58.1 | Min. (m2) | 2.7 | ||
| Avg. (%) | 76.8 | Avg. (m2) | 3.6 |
Table 7.
Technical system characteristics.
| Energy Carrier | Classification | Number of Sample Buildings | Heating System | Classification | Number of Sample Buildings |
| Electricity | 11 (23%) | Electric heat pump | 14 (29%) | ||
| Electricity + Gas | 30 (63%) | Direct-fired heating & cooling unit | 15 (31%) | ||
| Electricity + Oil | 2 (4%) | Steam boiler | 6 (13%) | ||
| Electricity + District heating | 3 (6%) | District heating | 5 (10%) | ||
| Other | 2 (4%) | Hot water boiler | 3 (6%) | ||
| Gas engine-driven heat pump | 3 (6%) | ||||
| – | – | Other | 2 (4%) | ||
| Sum | 48 (100%) | Sum | 48 (100%) | ||
| Cooling system | Classification | Number of sample buildings | DHW system | Classification | Number of sample buildings |
| Electric heat pump | 17 (35%) | Gas hot water boiler | 12 (25%) | ||
| Direct-fired heating & cooling unit | 15 (31%) | Electric hot water boiler | 6 (13%) | ||
| Compression chiller | 8 (17%) | Electric heating unit | 10 (21%) | ||
| Gas engine-driven heat pump | 3 (6%) | Steam boiler | 12 (25%) | ||
| Other | 5 (10%) | District heating | 5 (10%) | ||
| – | – | Other | 3 (6%) | ||
| Sum | 48 (100%) | Sum | 48 (100%) | ||
| Internal zone air conditioning system | Classification | Number of sample buildings | Perimeter zone air conditioning system | Classification | Number of sample buildings |
| Fluorescent lamp | 33 (69%) | L < 5 | 1 (2%) | ||
| Light-emitting diode | 8 (17%) | 5 ≤ L < 10 | 22 (46%) | ||
| Other | 3 (6%) | 10 ≤ L < 15 | 14 (29%) | ||
| Unverified | 4 (8%) | 15 ≤ L < 20 | 4 (8%) | ||
| - | - | 20 ≤ L | 3 (6%) | ||
| – | – | Unverified | 4 (8%) | ||
| Sum | 48 (100%) | Sum | 48 (100%) | ||
| – | – | Max. (W/m2) | 29.0 | ||
| – | – | Min. (W/m2) | 3.8 | ||
| – | – | Avg. (W/m2) | 11.1 | ||
| Power density of electric appliance (E, W/m2) | Classification | Number of sample buildings | City water supply system | Classification | Number of sample buildings |
| E < 10 | 16 (33%) | Elevated water tank | 27 (56%) | ||
| 10 ≤ E < 20 | 15 (31%) | Booster pump | 16 (33%) | ||
| 20 ≤ E < 30 | 11 (23%) | Directly connected to city water pipes | 5 (10%) | ||
| 30 ≤ E < 40 | 3 (6%) | ||||
| 40 ≤ E | 2 (4%) | – | – | ||
| Unverified | 1 (2%) | – | – | ||
| Sum | 48 (100%) | Sum | 48 (100%) | ||
| Max. (W/m2) | 135.0 | – | – | ||
| Min. (W/m2) | 1.7 | – | – | ||
| Avg. (W/m2) | 18.1 | – | – |
Table 8.
Usage characteristics.
| Operating Period of Heating System (PH, Months) | Classification | Number of Sample Buildings | Operating Period of Cooling System (PC Months) | Classification | Number of Sample Buildings |
| PH ≤ 3 | 2 (4%) | PC ≤ 3 | 2 (4%) | ||
| 3 < PH ≤ 4 | 9 (19%) | 3 < PC ≤ 4 | 18 (38%) | ||
| 4 < PH ≤ 5 | 22 (46%) | 4 < PC ≤ 5 | 19 (40%) | ||
| 5 < PH | 14 (29%) | 5 < PC | 8 (17%) | ||
| Unverified | 1 (2%) | Unverified | 1 (2%) | ||
| Sum | 48 (100%) | Sum | 48 (100%) | ||
| Max. (months) | 7 | Max. (months) | 7 | ||
| Min. (months) | 3 | Min. (months) | 3 | ||
| Avg. (months) | 5.0 | Avg. (months) | 4.8 | ||
| Operating period of DHW system (PD, months) | Classification | Number of sample buildings | Occupancy density (O, persons/m2) | Classification | Number of sample buildings |
| PD = 4 | 7 (15%) | O < 0.04 | 7 (15%) | ||
| PD = 5 | 19 (40%) | 0.04 ≤ O < 0.06 | 18 (38%) | ||
| 6 ≤ PD | 9 (19%) | 0.06 ≤ O < 0.08 | 13 (27%) | ||
| Whole year | 13 (27%) | 0.08 ≤ O < 0.10 | 4 (8%) | ||
| – | – | 0.10 ≤ O | 5 (10%) | ||
| – | – | Unverified | 1 (2%) | ||
| Sum | 48 (100%) | Sum | 48 (100%) | ||
| Max. (months) | 12 | Max. (persons/m2) | 0.19 | ||
| Min. (months) | 4 | Min. (persons/m2) | 0.02 | ||
| Avg. (months) | 7.0 | Avg. (persons/m2) | 0.07 |
Table 9.
Primary energy conversion factors by fuel type.
| Classification | Primary Energy Conversion Factor |
|---|---|
| Fuel | 1.10 |
| Electricity | 2.75 |
| District heating | 0.728 |
| District cooling | 0.937 |
Table 10.
Greenhouse-gas-emission conversion factors by fuel type.
| Classification | Greenhouse-Gas-Emission Conversion Factor * | Remark |
|---|---|---|
| LNG | 56,236 kgCO2eq/TJ | – |
| Diesel | 72,296 kgCO2eq/TJ | – |
| Byproduct fuel oil | 72,296 kgCO2eq/TJ | – |
| Electricity | 466,250 kgCO2eq/GWh | Average of 2 years (2007 to 2008) |
| District-heating | 59,685 kgCO2eq/TJ | Heating-only and cogeneration systems’ average |
* Total emissions of each greenhouse gas (CO2, CH4 and N2O) calculated in terms of CO2 equivalent. CO2-equivalents of the CH4 and N2O emissions were obtained by applying the global warming potential, which indexes the effect of each greenhouse gas on global warming in comparison with CO2 (CO2: 1, CH4: 21, N2O: 310).
Table 11.
Energy use intensities (EUIs) factors.
| Classification | Factor |
|---|---|
| Space heating | Floor area (m2) of heated space where the measured energy is consumed |
| Space cooling | Floor area (m2) of cooled space where the measured energy is consumed |
| Domestic Hot Water (DHW) | Floor area (m2) of air conditioned space * where the measured energy is consumed |
| Lighting | Floor area (m2) of lighting space where the measured energy is consumed |
| Air movement | Floor area (m2) of air conditioned space * where the measured energy is consumed |
| Electric appliances (typical floors) | Floor area (m2) of air conditioned space * where the measured energy is consumed |
| Vertical transportation | Floor area (m2) of air conditioned space * where the measured energy is consumed |
| City water supply | Floor area (m2) of air conditioned space * where the measured energy is consumed |
* air conditioned space is a heated or cooled space; a larger value is applied if the floor areas of the heated and cooled spaces are different.
Table 12.
Statistics of site EUIs (kWh/m2·year).
| Classification | Space Heating | Space Cooling | DHW | Lighting | Air Movement | Electrical Appliances (Typical Floors) | Vertical Transportation | City Water Supply | |
|---|---|---|---|---|---|---|---|---|---|
| Average (representative value) | 54.6 | 32.7 | 5.5 | 19.8 | 7.9 | 49.1 | 3.2 | 0.7 | |
| Maximum | 108.1 | 100.8 | 16.6 | 55.9 | 32.0 | 69.2 | 5.5 | 3.3 | |
| Minimum | 19.7 | 10.3 | 0.9 | 7.9 | 1.2 | 23.8 | 1.5 | 0.1 | |
| Percentile | 10th | 24.2 | 13.2 | 1.1 | 9.6 | 2.0 | 25.3 | 1.9 | 0.2 |
| 25th | 28.2 | 17.0 | 2.0 | 11.4 | 2.5 | 41.5 | 2.1 | 0.3 | |
| 50th | 48.5 | 20.1 | 2.7 | 16.7 | 5.6 | 51.5 | 3.2 | 0.6 | |
| 75th | 69.3 | 47.3 | 6.7 | 21.9 | 8.7 | 61.8 | 3.8 | 0.9 | |
| 90th | 101.6 | 67.4 | 13.5 | 39.3 | 15.9 | 64.6 | 5.0 | 1.1 | |
| Standard deviation | 29.8 | 25.3 | 4.9 | 12.0 | 7.5 | 14.6 | 1.1 | 0.7 | |
| Average-based ratio | 31.5% | 18.8% | 3.2% | 11.4% | 4.6% | 28.3% | 1.9% | 0.4% | |
Table 13.
Statistics of primary EUIs (kWh/m2·year).
| Classification | Space Heating | Space Cooling | DHW | Lighting | Air Movement | Electrical Appliances (Typical Floors) | Vertical Transportation | City Water Supply | |
|---|---|---|---|---|---|---|---|---|---|
| Average (representative value) | 88.8 | 64.2 | 9.1 | 54.5 | 21.8 | 135.0 | 8.9 | 2.0 | |
| Maximum | 149.5 | 126.1 | 33.5 | 153.6 | 88.0 | 190.2 | 15.2 | 9.0 | |
| Minimum | 35.4 | 28.4 | 1.1 | 21.8 | 3.2 | 65.4 | 4.1 | 0.3 | |
| Percentile | 10th | 48.2 | 36.4 | 2.1 | 26.5 | 5.5 | 69.6 | 5.3 | 0.6 |
| 25th | 62.9 | 46.8 | 2.7 | 31.2 | 6.8 | 114.1 | 5.8 | 0.9 | |
| 50th | 79.6 | 55.2 | 6.8 | 46.0 | 15.4 | 141.6 | 8.7 | 1.6 | |
| 75th | 116.3 | 80.5 | 11.3 | 60.2 | 23.8 | 170.0 | 10.4 | 2.4 | |
| 90th | 147.8 | 95.5 | 18.0 | 108.0 | 43.9 | 177.7 | 13.8 | 3.1 | |
| Standard deviation | 37.6 | 27.4 | 8.6 | 32.9 | 20.6 | 40.3 | 3.1 | 1.9 | |
| Average-based ratio | 23.1% | 16.7% | 2.4% | 14.2% | 5.7% | 35.1% | 2.3% | 0.5% | |
Table 14.
Statistics of greenhouse-gas-emission intensities (kgCO2eq/m2·year).
| Classification | Space Heating | Space Cooling | DHW | Lighting | Air Movement | Electrical Appliances (Typical Floors) | Vertical Transportation | City Water Supply | |
|---|---|---|---|---|---|---|---|---|---|
| Average (representative value) | 15.1 | 11.1 | 1.5 | 9.2 | 3.7 | 22.9 | 1.5 | 0.3 | |
| Maximum | 29.2 | 24.7 | 6.3 | 26.0 | 14.9 | 32.3 | 2.6 | 1.5 | |
| Minimum | 4.5 | 4.8 | 0.1 | 3.7 | 0.5 | 11.1 | 0.7 | 0.1 | |
| Percentile | 10th | 6.9 | 5.1 | 0.2 | 4.5 | 0.9 | 11.8 | 0.9 | 0.1 |
| 25th | 10.6 | 7.1 | 0.4 | 5.3 | 1.2 | 19.3 | 1.0 | 0.2 | |
| 50th | 13.1 | 9.0 | 1.1 | 7.8 | 2.6 | 24.0 | 1.5 | 0.3 | |
| 75th | 18.6 | 14.3 | 1.5 | 10.2 | 4.0 | 28.8 | 1.8 | 0.4 | |
| 90th | 27.1 | 18.6 | 3.2 | 18.3 | 7.4 | 30.1 | 2.3 | 0.5 | |
| Standard deviation | 7.6 | 5.8 | 1.6 | 5.6 | 3.5 | 6.8 | 0.5 | 0.3 | |
| Average-based ratio | 23.1% | 17.0% | 2.3% | 14.1% | 5.7% | 35.0% | 2.3% | 0.5% | |
Table 15.
Statistics of monthly site EUIs (kWh/m2·month).
| Classification | Space Heating | Space Cooling | DHW | Lighting | Air Movement | Electrical Appliances (Typical Floors) | Vertical Transportation | City Water Supply |
|---|---|---|---|---|---|---|---|---|
| 2017.05 | 0.0 | 2.3 | 0.2 | 1.6 | 0.5 | 3.8 | 0.2 | 0.1 |
| 2017.06 | 0.0 | 6.0 | 0.0 | 1.7 | 0.7 | 3.9 | 0.3 | 0.1 |
| 2017.07 | 0.0 | 9.0 | 0.0 | 1.7 | 0.9 | 4.1 | 0.3 | 0.1 |
| 2017.08 | 0.0 | 8.7 | 0.0 | 1.7 | 0.9 | 4.1 | 0.3 | 0.1 |
| 2017.09 | 0.0 | 4.7 | 0.0 | 1.7 | 0.8 | 3.8 | 0.3 | 0.1 |
| 2017.10 | 0.7 | 0.4 | 0.1 | 1.4 | 0.4 | 3.3 | 0.2 | 0.0 |
| 2017.11 | 7.2 | 0.0 | 0.6 | 1.7 | 0.6 | 4.1 | 0.3 | 0.1 |
| 2017.12 | 12.6 | 0.0 | 0.9 | 1.7 | 0.7 | 4.8 | 0.3 | 0.1 |
| 2018.01 | 15.7 | 0.0 | 0.9 | 1.9 | 0.8 | 5.2 | 0.3 | 0.1 |
| 2018.02 | 11.7 | 0.0 | 0.8 | 1.6 | 0.6 | 4.3 | 0.2 | 0.1 |
| 2018.03 | 4.9 | 0.0 | 0.6 | 1.6 | 0.4 | 4.0 | 0.3 | 0.1 |
| 2018.04 | 0.9 | 0.4 | 0.4 | 1.6 | 0.3 | 3.6 | 0.3 | 0.1 |
Table 16.
Major energy (electricity, natural gas, fuel oil and district heating) consumption intensities by end-use in office buildings according to U.S. commercial building energy consumption survey (CBECS) 2012 (kWh/m2·year).
Table 16.
Major energy (electricity, natural gas, fuel oil and district heating) consumption intensities by end-use in office buildings according to U.S. commercial building energy consumption survey (CBECS) 2012 (kWh/m2·year).
| Space Heating | Space Cooling | DHW | Lighting | Ventilation |
|---|---|---|---|---|
| 61.5 | 24.6 | 7.3 | 29.0 | 42.3 |
| Refrigeration | Office equipment | Computing | Other | – |
| 6.3 | 7.3 | 33.1 | 30.3 |
Table 17.
Magnitudes of the average site end-use EUIs in this study and CBECS 2012 (kWh/m2·year).
| Classification | Space Heating | Space Cooling | DHW | Lighting | Air Movement | Electrical Appliances, etc. |
|---|---|---|---|---|---|---|
| This study | 54.6 | 32.7 | 5.5 | 19.8 | 7.9 | 53.0 |
| CBECS 2012 | 61.5 | 24.6 | 7.3 | 29.0 | 42.3 | 77.0 |
| Difference | −6.9 | 8.1 | −1.8 | −9.2 | −34.4 | −24.0 |
| Difference ratio | −11.2% | 32.9% | −24.7% | −31.7% | −81.3% | −31.2% |
© 2020 by the authors. Licensee MDPI, Basel, Switzerland. This article is an open access article distributed under the terms and conditions of the Creative Commons Attribution (CC BY) license (http://creativecommons.org/licenses/by/4.0/).
Share and Cite
MDPI and ACS Style
Song, S.-Y.; Jin, H.-S.; Ha, S.-Y.; Kim, S.-I.; Kim, Y.-J.; Lee, S.-J.; Suh, I.-A. Detailed Office Building Energy Information Based on In Situ Measurements. Energies 2020, 13, 3050. https://doi.org/10.3390/en13123050
AMA Style
Song S-Y, Jin H-S, Ha S-Y, Kim S-I, Kim Y-J, Lee S-J, Suh I-A. Detailed Office Building Energy Information Based on In Situ Measurements. Energies. 2020; 13(12):3050. https://doi.org/10.3390/en13123050
Chicago/Turabian StyleSong, Seung-Yeong, Hye-Sun Jin, Soo-Yeon Ha, Sung-Im Kim, You-Jeong Kim, Soo-Jin Lee, and In-Ae Suh. 2020. "Detailed Office Building Energy Information Based on In Situ Measurements" Energies 13, no. 12: 3050. https://doi.org/10.3390/en13123050
Note that from the first issue of 2016, this journal uses article numbers instead of page numbers. See further details here.