A Sophisticated Method of the Mechanical Design of Cable Accessories Focusing on Interface Contact Pressure


1
Global Energy Interconnection Research Institute Europe GmbH, Kantstraße 162, 10623 Berlin, Germany
2
Department of Energy, Polytechnic of Turin, Corso Duca degli Abruzzi, 24, 10129 Turin, Italy
*
Author to whom correspondence should be addressed.
Energies 2020, 13(11), 2976; https://doi.org/10.3390/en13112976
Submission received: 18 April 2020
/
Revised: 1 June 2020
/
Accepted: 4 June 2020
/
Published: 9 June 2020
(This article belongs to the Special Issue Modelling and Numerical Simulation of HVDC Cable Systems)
Abstract
:The most critical positions of a prefabricated cable accessory, from the electrical point of view, are the interfaces between the stress cone and its surroundings. Accordingly, the contact pressure on those interfaces needs to be carefully designed to assure both good dielectric strength and smooth installation of the stress cone. Nevertheless, since stress cones made from rubber are under large deformation after installation, their internal stress distribution is neither practical to measure directly by planting sensors, nor feasible to compute accurately with the conventional theory of linear structural mechanics. This paper presents one sophisticated method for computing the mechanical stress distribution in rubber stress cones of cable accessories by employing hyperelastic models in a computation model based on the finite element method. This method offers accurate results for rubber bodies of complex geometries and large deformations. Based on the method, a case study of a composite prefabricated termination for extruded cables is presented, and the sensitivity analysis is given as well.
1. Introduction
Global electricity production is transiting towards decarbonization by increasing renewable penetration [1,2]. Since a large part of renewable energy sources, like wind farms, are located far away from the load centers, there is an increasing need to enhance the transmission network in order to dispatch those remote renewables effectively [3,4].
Under this background, high voltage power cable systems are playing an increasingly important role in network enhancing due to their lower impacts on the landscape compared to overhead lines. For example, the latest Ten Year Network Development Plan (hereafter TYNDP) plans for power lines with a total length of 19,159 km to be built or refurbished with cables in Europe by 2030 [5]. Moreover, Germany established the cable priority principle in the form of a law in 2015, which requires the future planned power transmission lines to preferentially use cables, in order to reduce resistance from residents to the construction of new High Voltage Direct Current (hereafter HVDC) transmission corridors [6].
Cable accessories, including joints and terminations, are critical for cable systems. On the one hand, cable accessories are essential for cable systems to function. Due to transport restrictions, the length of a single segment of underground cable is limited. Therefore, cable joints are used for connecting cable segments together in a land cable project. Besides, cable terminations need to be installed at both ends of cable systems at the interface of the cable system and other facilities (e.g., overhead lines, gas-insulated switchgear, and transformers). On the other hand, cable accessories are the vulnerable parts of the whole system. According to the statistics, 70% of cable failures occur in cable accessories [7] for underground cable systems, while the ratio drops to 18% for submarine cable systems [8,9].
One popular form of cable accessories is the prefabricated accessory, which uses stress cones (often made of rubber) produced in factories in a controllable environment. This kind of accessory has comparatively higher reliability and lower vulnerability to workmanship due to its high level of prefabrication in factories. Figure 1 shows five typical types of prefabricated cable accessories with rubber insulation for high voltage extruded cables [10]. In these prefabricated accessories, stress cones are the key components with two main functions: (1) providing insulation for the accessories and (2) relieving the internal electric stress, especially at the edge of the semi-conductive cable insulation screen. For the sake of simplicity, cable accessories hereafter refers to prefabricated accessories.
The use of stress cones in prefabricated accessories introduces interfaces into the whole insulation system. Given that the tangential dielectric strength of interfaces is lower than the bulk dielectric strength of the insulation materials, stress cones are prone to breakdown in the entire cable system. Researchers have worked on two aspects to improve interface strength. Firstly, higher smoothness leads to higher breakdown strength [11]. A proper surface treatment of cable cores using sandpaper with different grit sizes can guarantee the smoothness of the cable insulation surface. Ying suggests that the final polishing should use sandpaper with 600 grit and above for high voltage cable accessories to produce a sufficient smoothness on the cable core surface [12], yet the authors’ experience is to polish at the final step with 3000 grit to produce a finishing arithmetic mean deviation of the profile (Ra) [13] below 1 μm. The second factor is the contact pressure. The relationship between the contact pressure and tangential dielectric strength of interfaces has been studied and published in multiple articles [10,11,14,15]. At the microscopic level, the surface of the material is not smooth (Figure 2). There are air-filled voids on the interface between the two components. As the interface pressure increases, the number and the size of voids gradually decrease, and accordingly, the air pressure in those voids increases. Consequently, the tangential dielectric strength of interfaces increases with increasing contact pressure [10,11,14,15]. Although the above research was mainly done under AC, we expect the conclusion can be extrapolated to DC. The testing results during the development phase of our HVDC cable accessories can confirm this conclusion.
Although enhanced contact pressure can increase the dielectric strength of interfaces, the subsequent difficulties in installation can reduce the consistency of the products. An excessively high mechanical stress on cable accessories significantly increases the cyclic tensile force, and under extreme cases, will lead to some internal damage to the dielectric material of the stress cone, thereby triggering electrical trees under a lower electrical field [7]. Wang points out that a contact pressure in the range of 0.1 to 0.3 MPa can ensure good dielectric strength and meanwhile promises a smooth installation [16].
Since the interface pressure is critical, a variety of methods have been developed to calculate and measure it. The use of different kinds of pressure sensors has been mentioned in several articles [17,18,19]. However, their application is limited due to the following reasons. First, the installation of such sensors can be very complicated, especially on some irregular and inaccessible surfaces. Second, the precision and accuracy of such measurements are not ideal. Third, to obtain the pressure distribution information with sufficient resolution, a large number of sensors need to be planted, which is not practical in most cases. Some other researchers use the theoretical method to calculate interface pressure [19,20]. An analytic expression of the contact pressure between a pipe-shaped stress cone and a cable is deduced by presuming a constant Young’s modulus and Poisson’s ratio of the rubber material. However, the presumptions significantly weaken the scope of this formula, and are thereby inapplicable for the actual cable accessories, where the geometry is complex and the mechanical behavior is nonlinear. The method mentioned above can only get a single value of the interface pressure. However, the fact is that the interfaces in cable accessories do have different pressures at different positions. Therefore, some researchers have used the finite element method (hereafter FEM) for pressure computation [20,21]. However, their papers use linear material models, the characteristics of the material of which are described by two constants (Young’s modulus and Poisson’s ratio). Stress cones are normally made of liquid silicone rubber (hereafter LSR) or ethylene propylene diene monomer rubber (hereafter EPDM). Both are typical hyperelastic materials whose behaviors cannot be accurately described using the linear material model.
This paper presents a sophisticated method for the mechanical stress analysis for the rubber cones of cable accessories by employing hyperelastic models in a simulation based on a commercial FEM software. This method offers accurate results for rubber bodies of complex geometries and large deformations. Based on this method, a case study of a composite prefabricated termination for extruded cables is presented and a sensitivity study is conducted. Considering the similarity, the conclusion in this article can be extrapolated for other terminations and joints of a plug-in type.
2. Method
This section presents the method for computing mechanical stress in the stress cones of cable accessories. It includes two parts. The first part introduces the hyperelastic model of the stress cone material used and the corresponding fitting method. The second part introduces the formulation of the FEM simulation model, based on the fitted material model, for mechanic stress computation.
2.1. Hyperelastic Material Models
Rubbers like LSR and EPDM, which have been widely used in cable accessories, can be stretched significantly under relatively low tensile force due to their special long molecule structure. After the force is removed, they can return to their original shape. The stress–strain behavior of rubbers is strongly nonlinear, which cannot be accurately described through its Young’s modulus and Poisson’s ratio.
In prefabricated cable accessories, the deformation of stress cones, especially their inner part, can reach 10% to 30% after installation. In this range of rubber deformation, the strain energy density function is often used [22]. It has a form of
where
where is the strain energy density; and are the strain invariants; , and represent the principal stretch ratios.
The bulk modulus of rubber is usually up to 1 GPa [22], meaning that it is resistant to bulk variation against stresses. Accordingly, it is often described as incompressible by hyperelastic models with . Assuming that is infinitely differentiable, the partial derivatives have no dependence on the differential order. Thus, the density function of a hyperelastic material, , can be rewritten in the form of Maclaurin series expansion:
where
This expression is also called the Mooney–Rivlin model (hereafter MR model) [22]. Depending on the terms of series, the MR model has two parameter, five parameter, nine parameter (hereafter 2P, 5P, and 9P), etc. forms. By defining , the equations of ,, and can be written in the form of a matrix:
The above formula shows that the MR models with more parameters consider terms of higher orders. Table 1 compares the strain invariants of different orders against the uniaxial tensile strain. According to the data, for a 10% strain, the second-order term is less than 2.8% of the first-order term, while the third-order term is negligible. Thus, the 2P MR model is applicable to this case. However, as the strain increases, the influence of high-order terms begins to increase. For 30% strain, the third order reaches 5% of the first-order term and an MR model with more parameters should therefore be chosen.
The strain energy density function can be fitted based on the stress–strain data from a uniaxial or biaxial tensile test on the material specimens [23,24,25]. Figure 3 presents the tested data of an LSR from the uniaxial tensile test and the three MR models fitted by the least square method. The data show that the 9P MR model has a better fit to the tested data and is therefore selected to model the stress cone in this application.
2.2. FEM Simulation Model
For contact pressure simulation, the geometry of the model is simplified first, keeping only contact pressure-relevant structures. In the case of a plug-in type or composite prefabricated cable termination, they are cable core, socket, and supporting ring. In the cable systems, most components are rotationally axisymmetric. The use of rotational axisymmetry in the simulation model significantly improved simulation convergence and shortened the simulation time.
The most relevant physical module for contact pressure analysis is solid mechanics. If thermal expansion needs to be considered, the heat transfer module and thermal expansion module can be added to the model.
In the domain of the stress cone, a hyperelastic material model is chosen. The material coefficients are fitted using the data of tensile tests on material samples. In other domains, the linear elastic material model with a proper Young’s modulus and Poisson’s ratio is used.
The boundary conditions are set as follows. Contact pairs are defined on those interfaces where contact pressure needs to be analyzed. The fixed constraints are used to fix the cable and socket. Gravity is only applied to the stress cone. The prescribed displacement is used to control the upward movement of the supporting ring. For better convergency, a spring foundation with a gradually decreasing spring constant is applied to the stress cone. Besides, an auxiliary sweep in the study extensions setting is used on the prescribed displacement of the supporting ring.
This modeling method can also be used on other types of cable accessories. The simulation model of one-piece prefabricated cable accessories is much easier, since no supporting ring with spring force is involved [25].
3. Case Study
In order to verify the effectiveness of the method, this section selected a cable terminal prototype for case analysis.
3.1. Background
The prototype of a composite prefabricated cable termination was selected for a case study. The termination is an outdoor termination designed for a ±500 kV HVDC cable system. Figure 4 shows the structure of the termination. In the termination, an epoxy socket is fixed to the bottom flange. Inside the socket, a stress cone is inserted. The deflector, made of a semi-conductive rubber and produced without sharp edges, covers the edge of the cable insulation screen, thereby significantly reducing the local electrical field strength. It is the most frequently used field control method on polymer cable accessories [27]. Below the cone, a supporting ring, together with the spring set, is in place to push the cone against the socket. The thrust of the spring group generates a certain pressure on the interfaces in Figure 4, thereby enhancing the dielectric properties of those interfaces.
The tests of this prototype observed several breakdowns, from the deflector and through the cable insulation to the cable conductor, as shown in Figure 5. In this place, the deflector covers the insulation of the cables as a recovered screen extended from the screen edge. Since both the deflector and the insulation were smooth, there was no sign of over-concentrated stress here to explain the failure. Nevertheless, the edge of the cable screen introduced a transition slope on the cable surface, and is therefore likely to lead to a decreased pressure here. Moreover, engineers noticed that one clear creepage trace developed along with the interface once on the cable surface, as shown in Figure 5c, leaving a sign of a weakened interface. Consequently, it was decided to investigate the interface pressure distribution of the cable here.
3.2. Model Formulation
One simulation model was built with the method introduced in Section 2 of this article.
3.2.1. Axial System
The geometric dimensions of the model are consistent with the actual prototype shown in Figure 4. For the sake of simplicity, a rotational axisymmetric geometry was chosen. It significantly improved simulation convergence and shortened the simulation time.
3.2.2. Main Parts and Their Material, Geometry
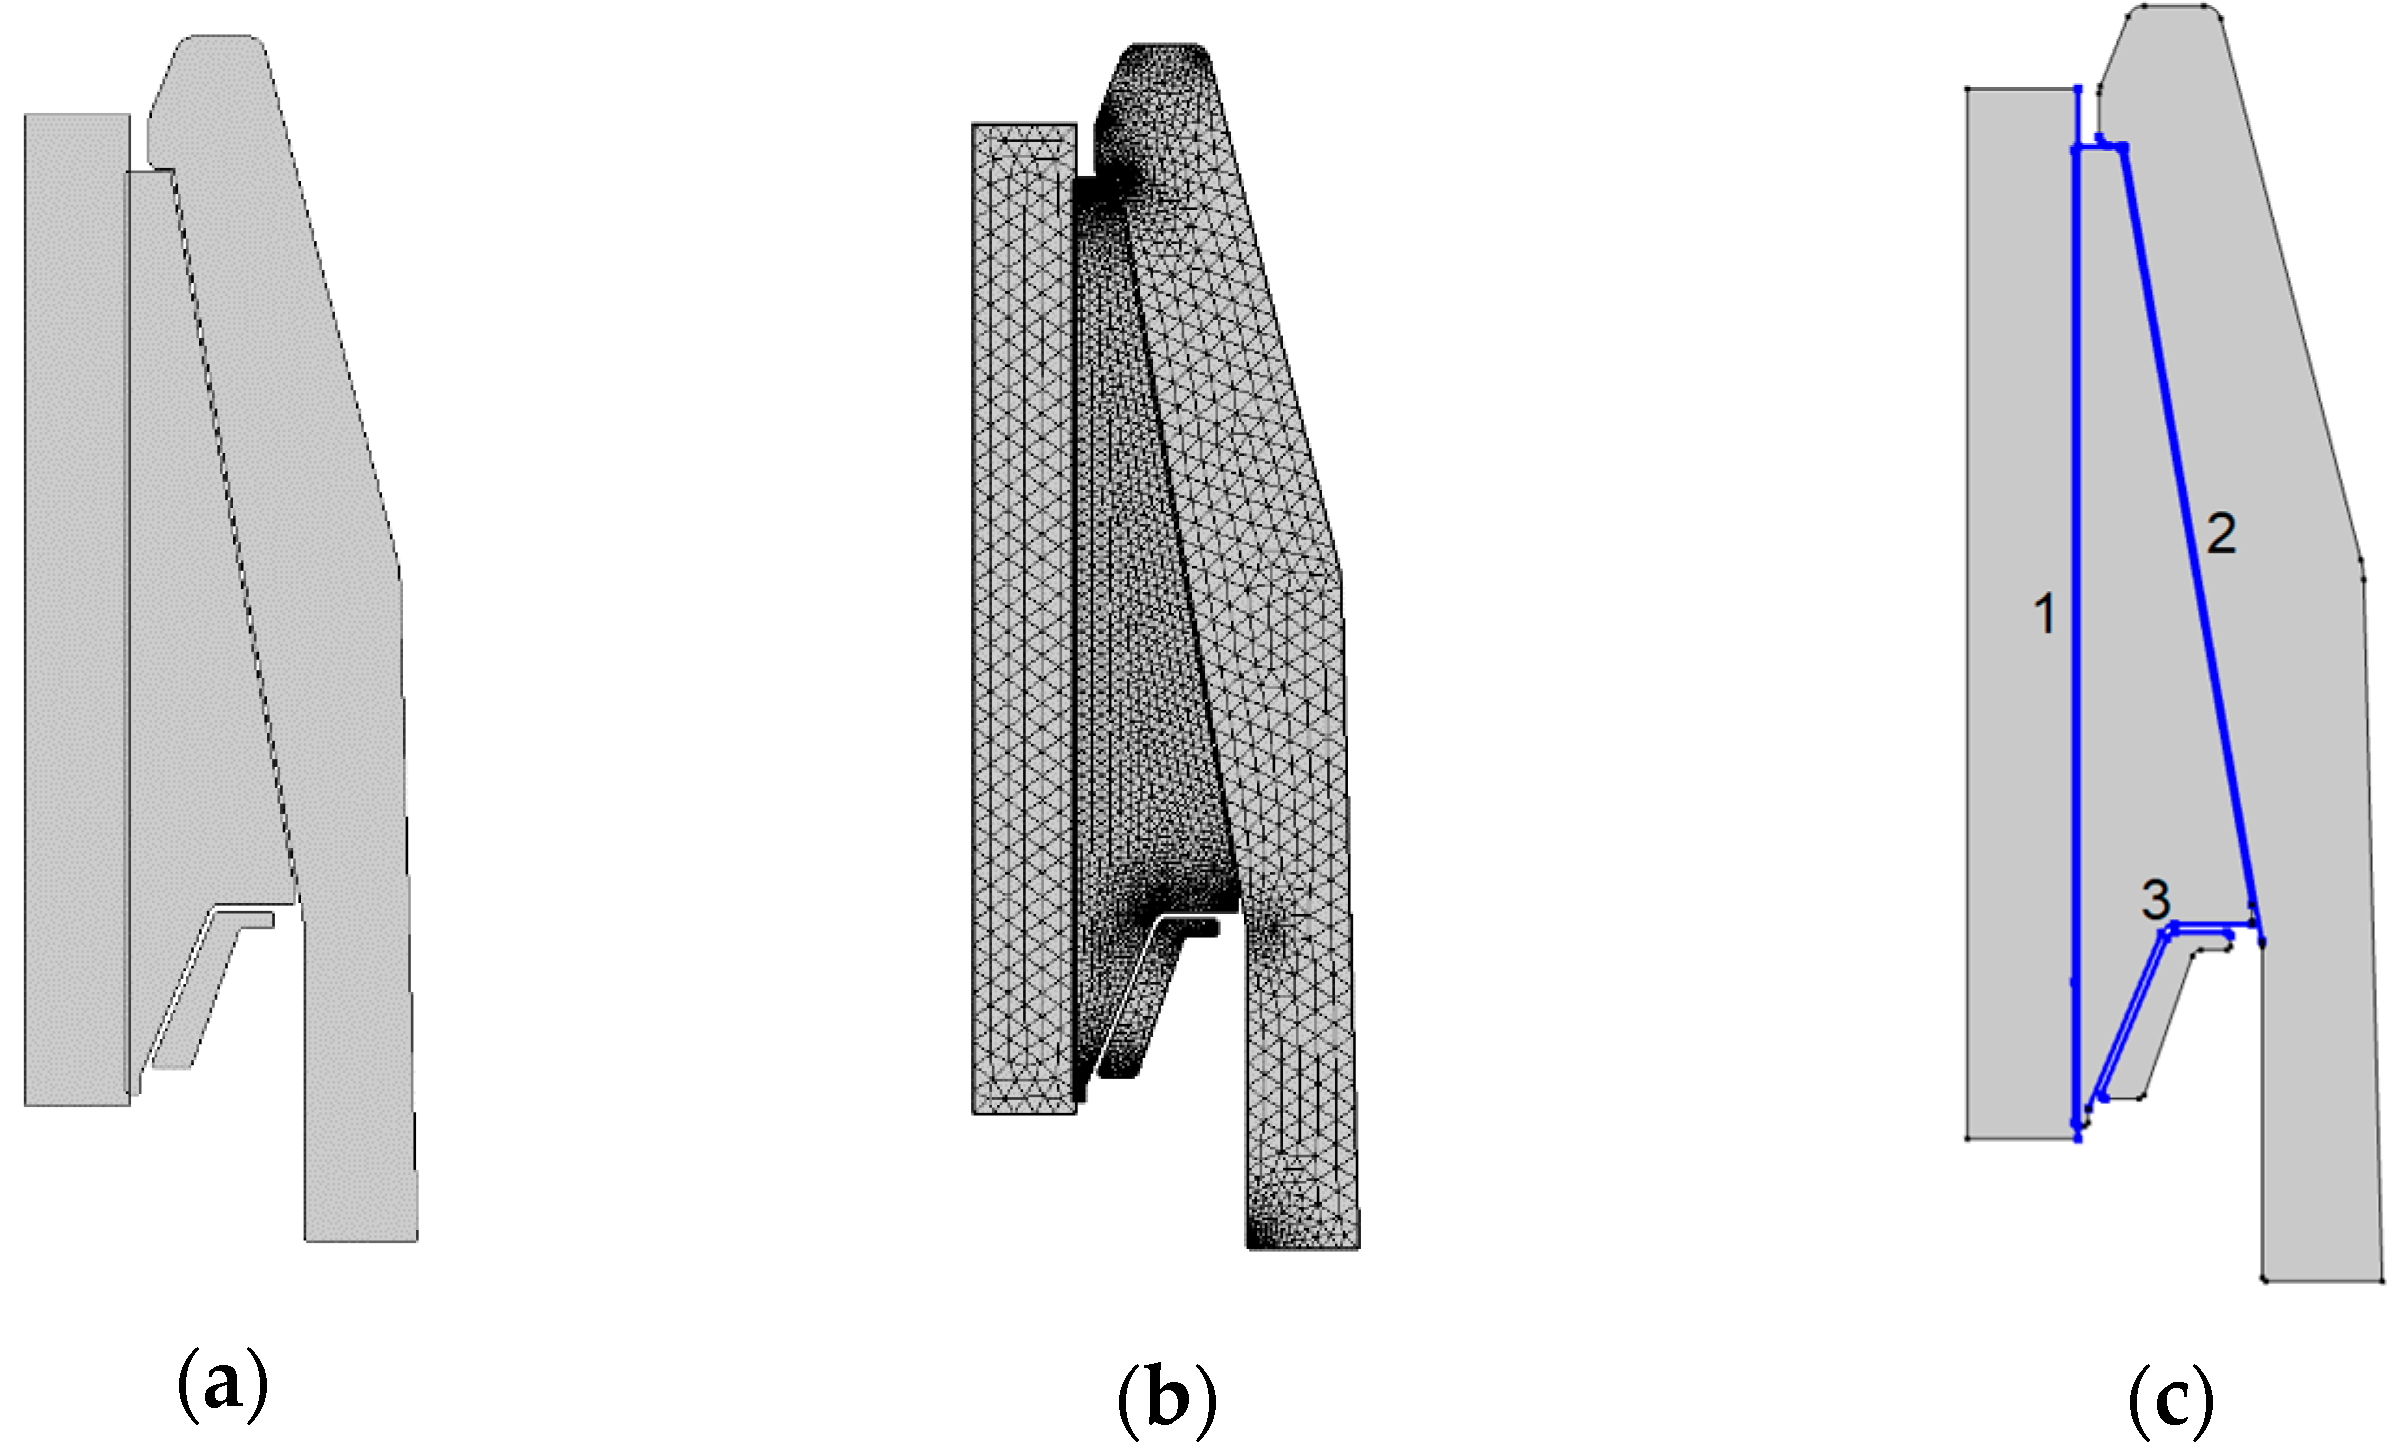
Given that this study is about the mechanical stress of the cone, the geometry only comprised the cable, cone, socket, and support ring, as shown in Figure 6. The materials are chosen for all the domains accordingly. The linear model is used for the cable, socket, and supporting ring, while the hyperelastic model, with the parameters in Appendix A Table A1, is used for the stress cone.
3.2.3. Restrictions and Boundary Conditions
In the model, the cable and the socket are fixed parts, while the stress cone is a free one. The supporting ring is a moving part that moves upwards with prescribed displacement D. Three contact pairs were defined in the model (Figure 6), which are the interfaces between the stress cone and its surrounding components (cable core, socket, and supporting ring). For each contact pair, it is possible to define the friction and adhesion properties.
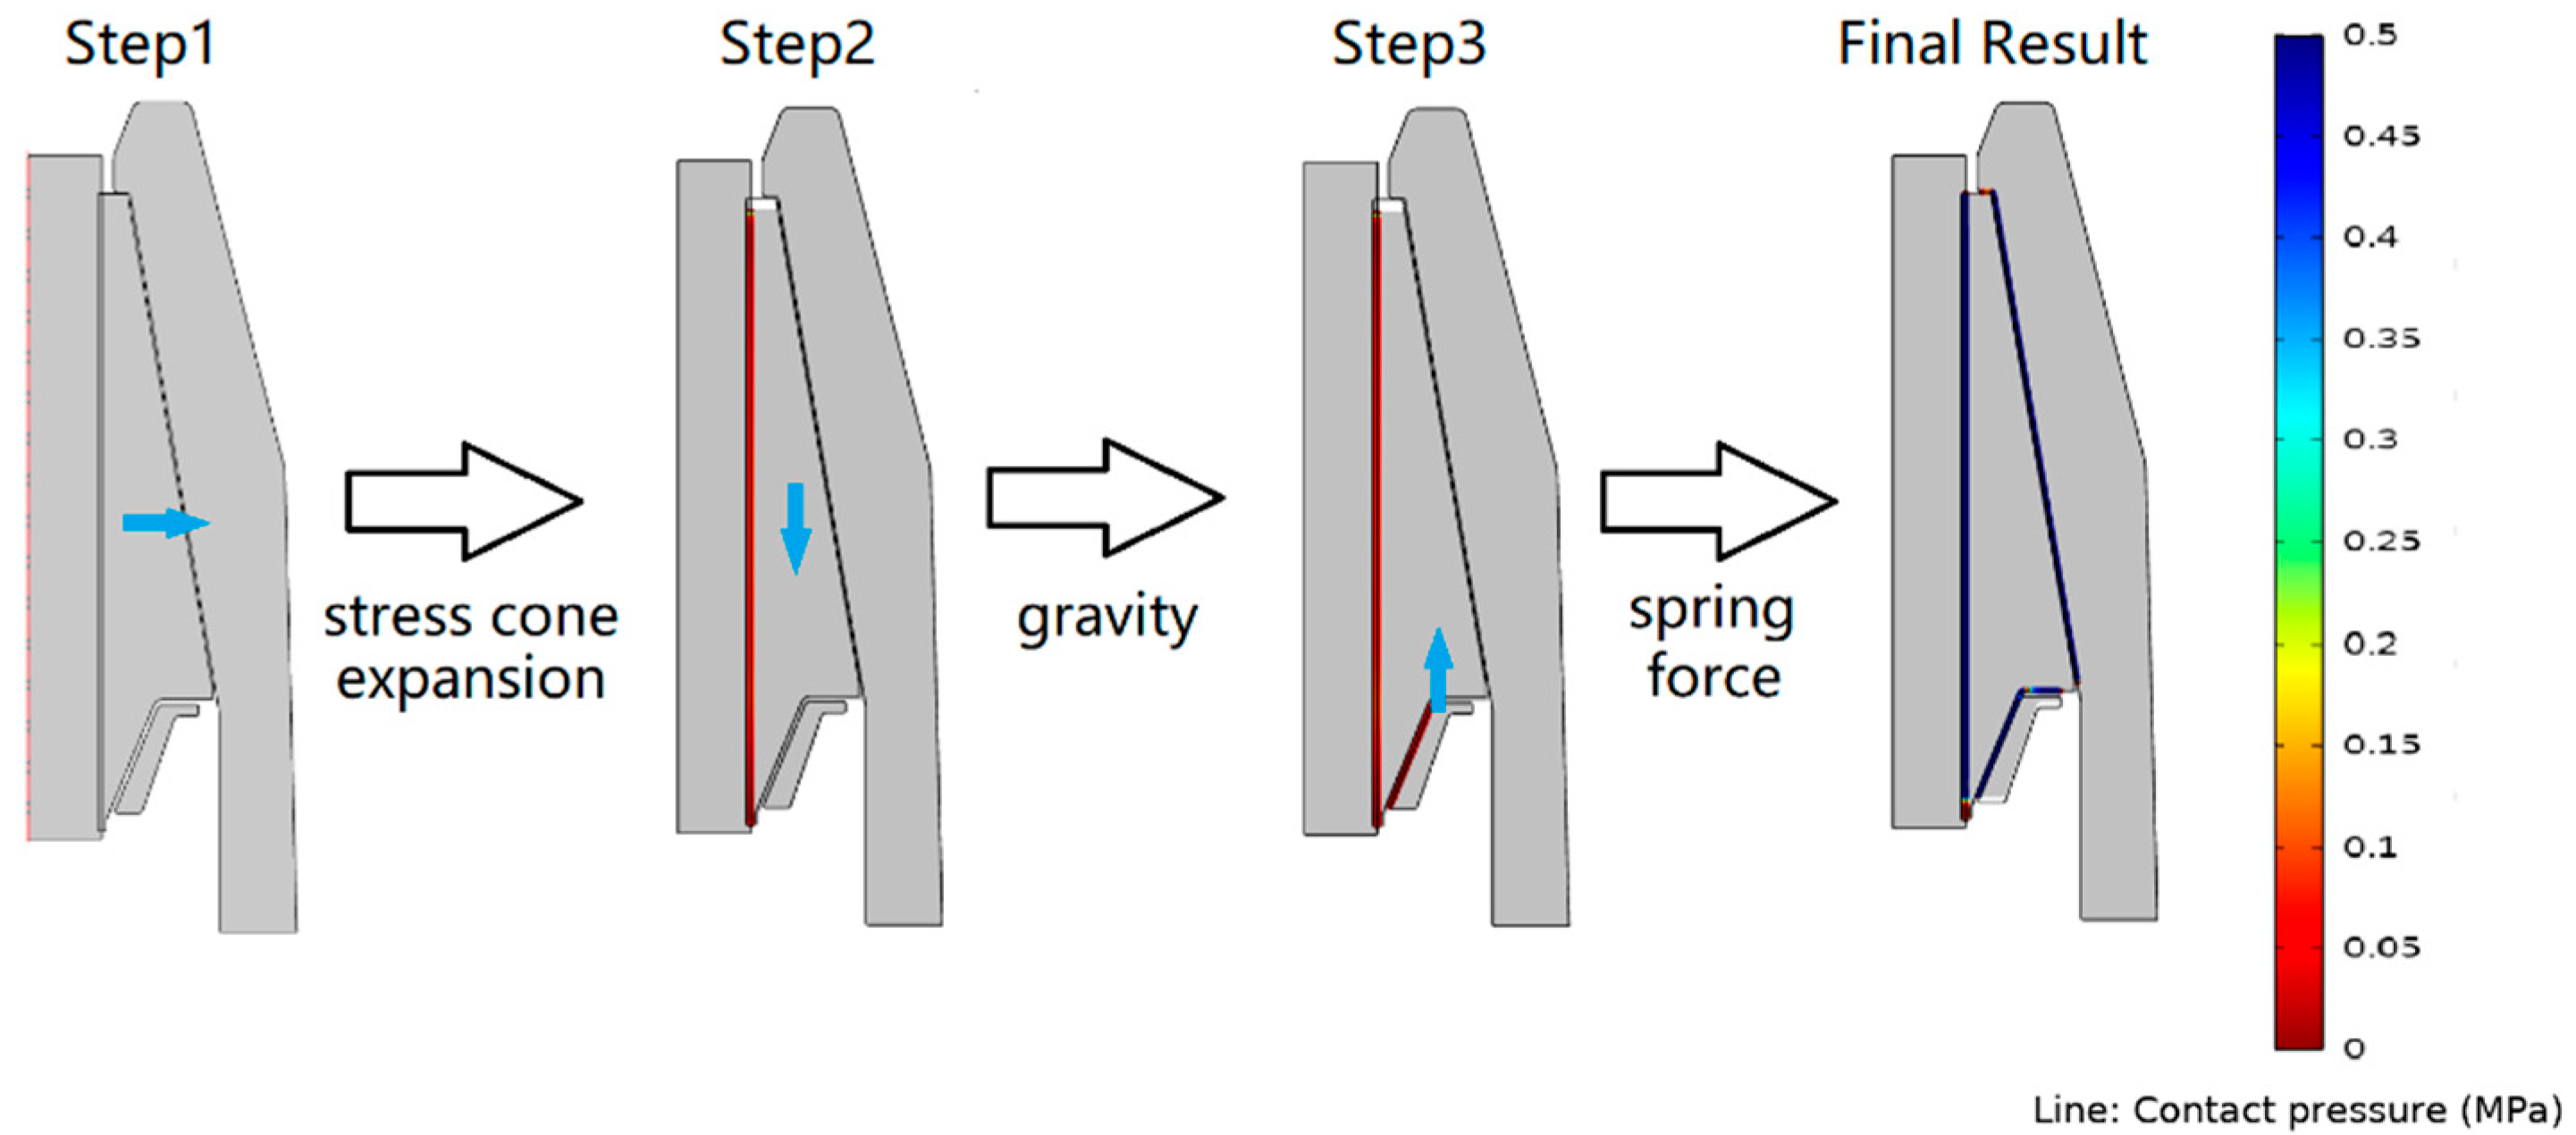
3.2.4. Studies
The simulation was divided into three study steps (Figure 7). The first step simulated the stress cone expansion against the interface, fitting between the cable and the stress cone. The second step simulated the downward displacement of the stress cone under the influence of gravity, which led to contact between the stress cone and the supporting ring. The third step simulated the upward movement of the supporting ring, after which the stress cone moved to its final position.
The total force of the springs under the specified displacement of the supporting ring can be interpreted from the results. Consequently, both the contraction force generated by the expansion of the stress cone and the spring support forces are considered.
3.3. Result
This section describes the computation, based on the ideal condition, which presumes that (1) the dimensions of each part are strictly consistent with the drawings, thereby ignoring the possible inconsistencies from the production and installation processes, (2) each contact pair is ideally smooth, without any friction and adhesion, and (3) the mechanical behavior of the rubber is stable, regardless of its internal creeping phenomenon and its dependence on temperature.
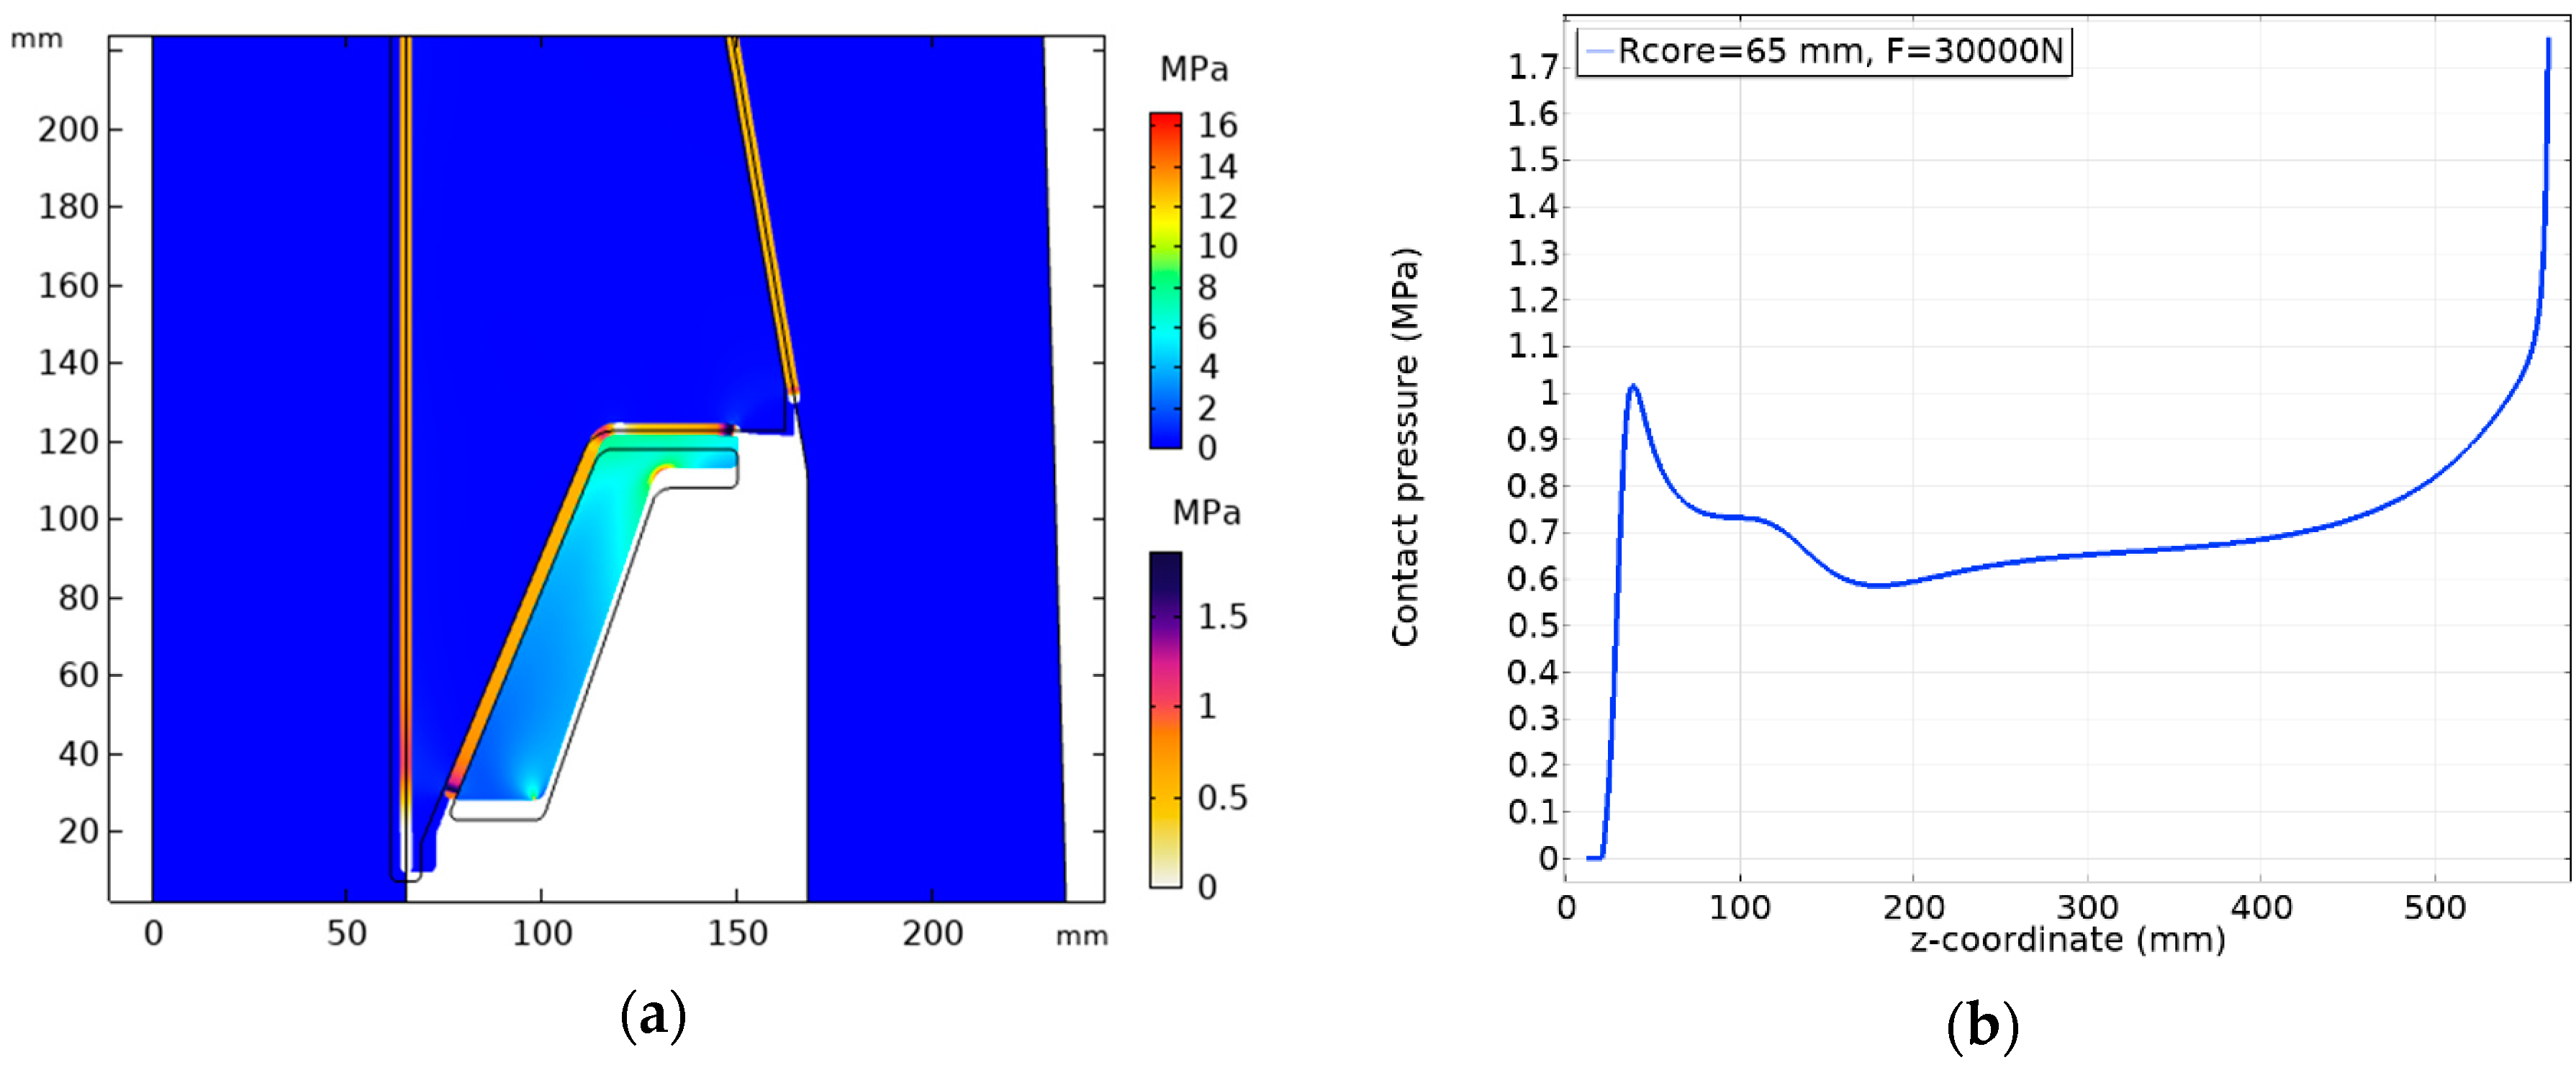
Figure 8 shows the results of the stress distribution when the total spring force reaches the target of 30 kN. When the supporting ring reaches its final position, the contact pressure in the whole critical area is above 0.6 MPa, which is, from the electrical point of view, adequate, according to other published research [16] and our previous experience.
The result of the prototype in the ideal condition cannot explain the failures during the factory tests. The next section is to further investigate the prototype’s performance by running a sensitivity study based on controlled variables against the ideal condition.
4. Discussion and Optimization
4.1. Sensitivity Analysis
This section investigates the impacts of spring force, cable core dimension, friction on interfaces, and the straightness of cable cores on the stress distribution in the prototype.
4.1.1. Spring Force
The first factor is the spring force. The spring set is in place between the socket and ring to maintain a certain contact pressure on the interfaces. During the installation of the prototype and other accessories of similar kinds, the compression of the springs is usually used to control the total spring force. In operation, the system temperature distribution keeps varying, along with the load current and the environment. Due to the thermal expansion effect, the deformation of the stress cone and other parts will affect the compression of the spring assembly, and thus the interface pressure distribution. Accordingly, the initial spring pressure should be reasonably selected so that the cable system can provide the required interface pressure in the worst case during operation.
As mentioned earlier, the supporting ring uses a boundary condition of the prescribed displacement D in the upward direction, instead of spring force, aiming for better convergence. Although not included in this model, the spring force can be interpreted from the total contact force between the stress cone and the ring.
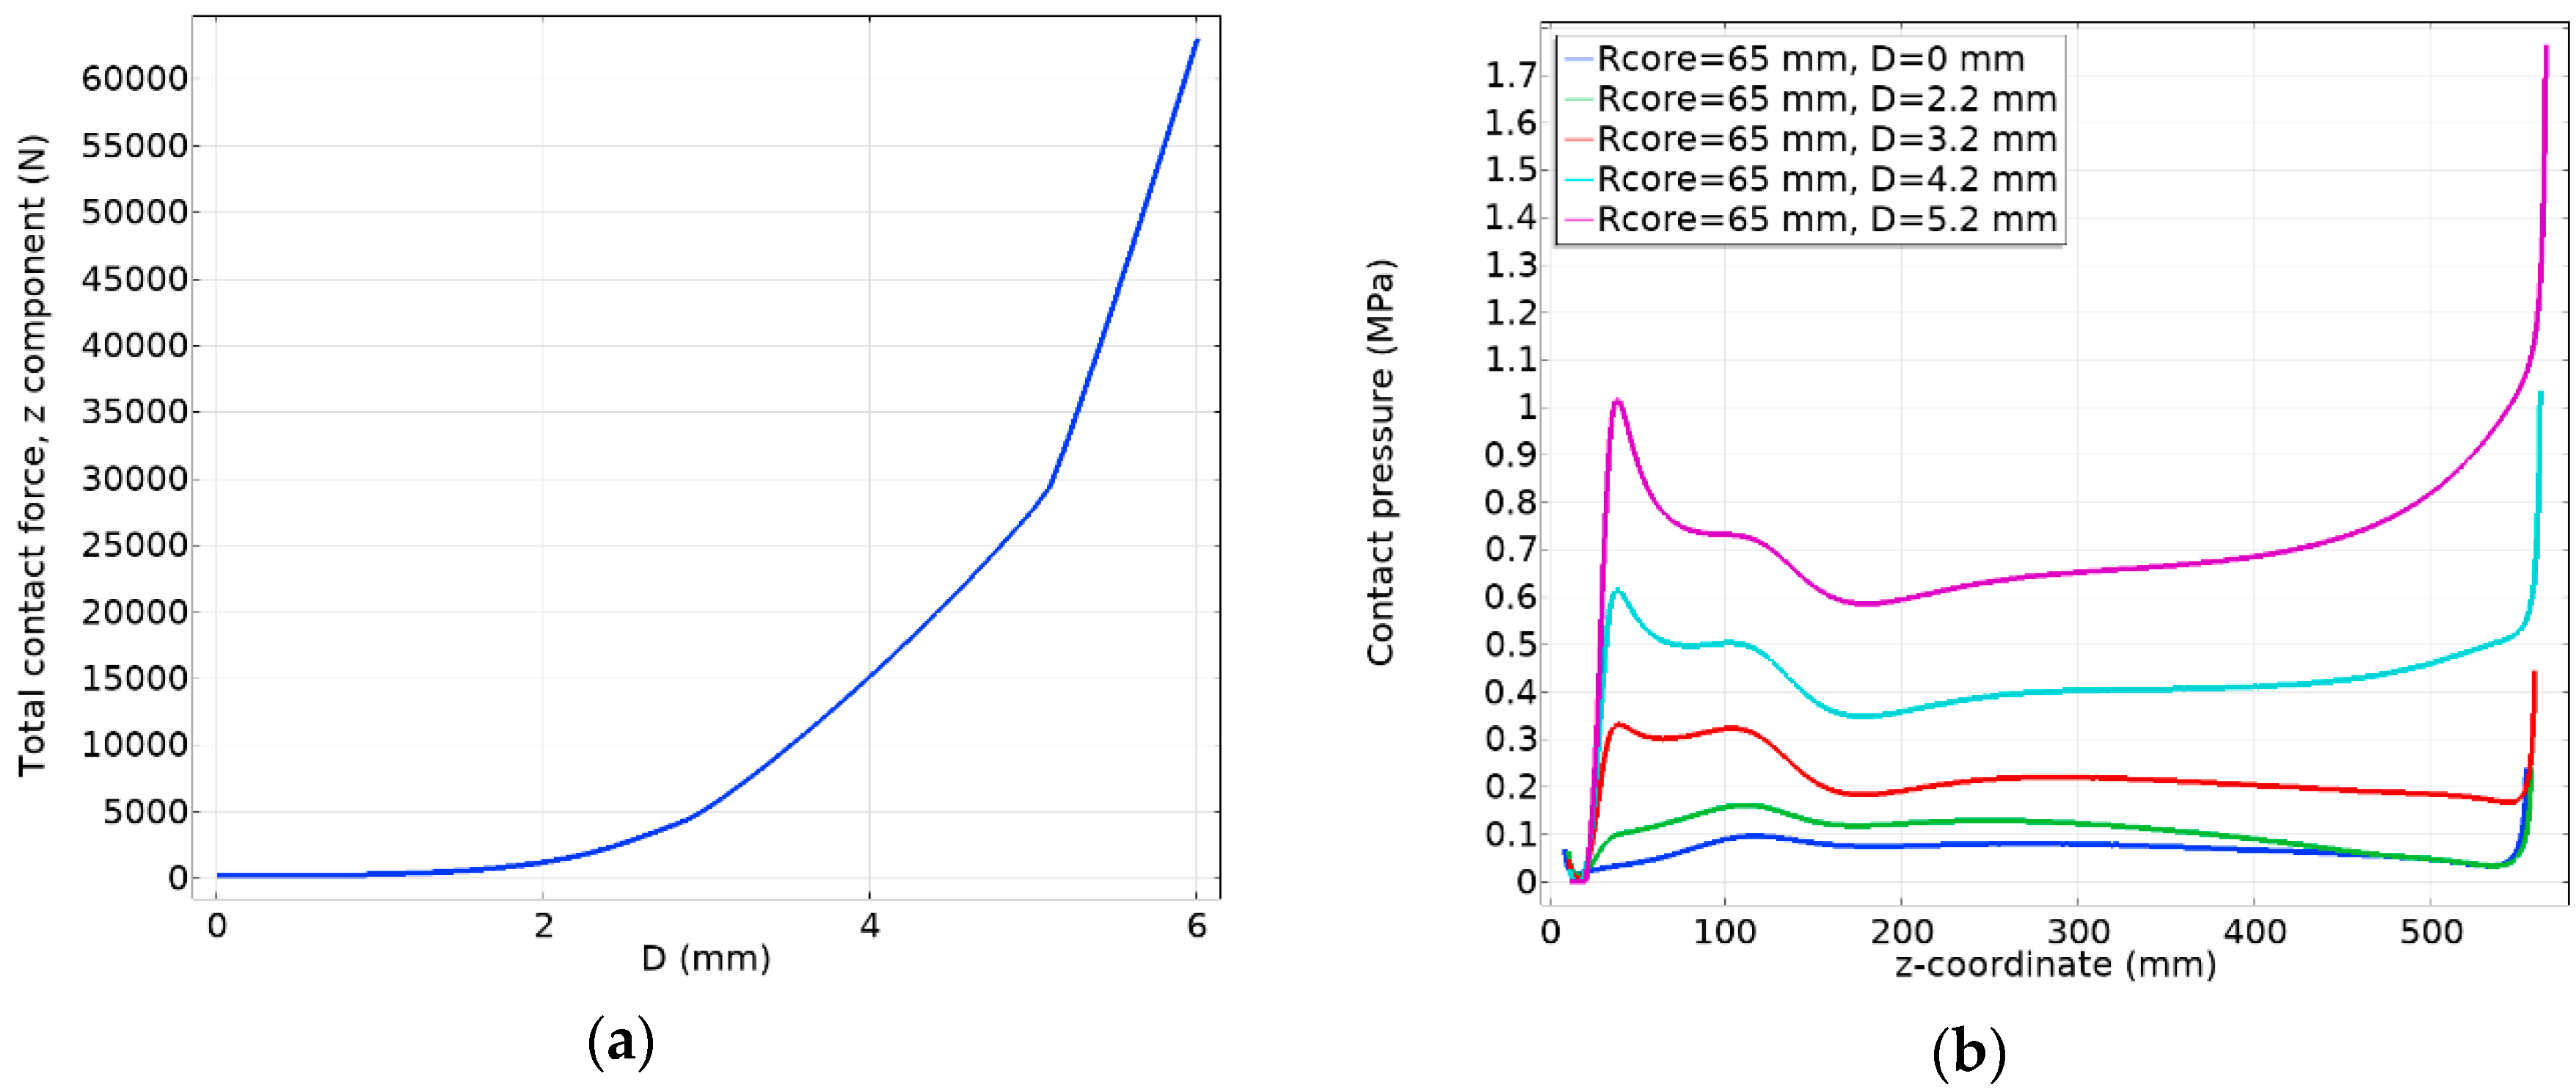
Figure 9a presents the correlation between the spring force and D, showing that the spring force increases exponentially with D. Additionally, Figure 9b presents the pressure distributions against different spring forces. At D = 0 mm, the spring force is weak, and the contact pressure at this time is generated from the interface fitting between the stress cone and the cable. The corresponding pressure distribution shows a convex curve, which mainly corresponds to the geometric thickness of the stress cone. As D increases to 5.2 mm, the spring force reaches 30 kN, and the pressure distribution increases over all of the interface.
The results show that, with a cable radius of 65 mm, the interface contact pressure distribution is relatively evenly distributed. As the spring pressure increases, the contact pressure rises across the whole interface. More specifically, the pressure at both ends changes more with the spring force than in the middle region. In general, a reasonably selected spring force is able to provide sufficient contact pressures across the interface.
4.1.2. Cable Outer Radius
Another factor influencing the contact pressure between the cable and the stress cone is the outer radius of the cable (hereafter Rcore). There are two reasons for variations in cable core dimensions. First, cable accessories are designed to match cables with a series of conductor sizes, meaning that the cable core radius varies in a range. Second, the radius is also subject to the inconsistencies in cable production and accessory installation. Consequently, the compatibility of the prototype with cable radii requests an investigation.
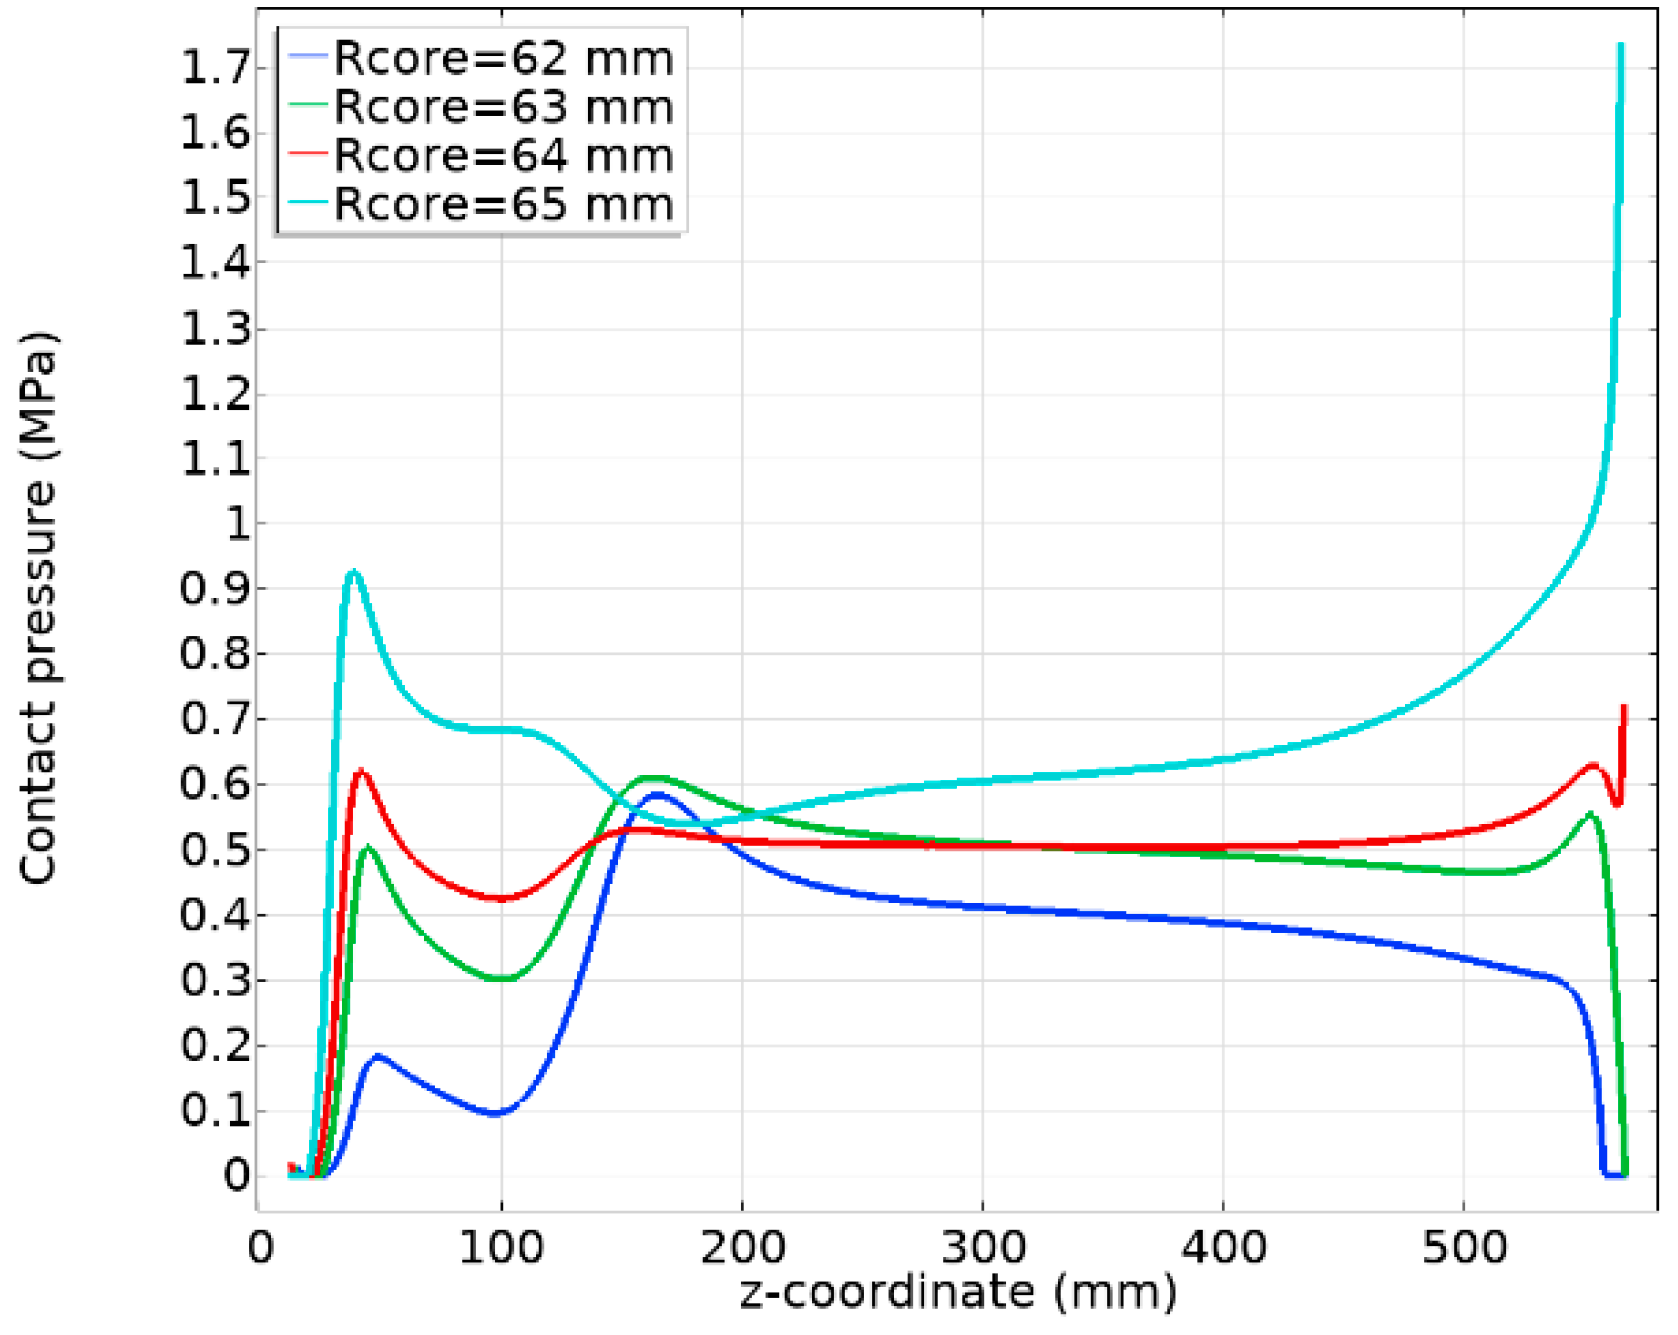
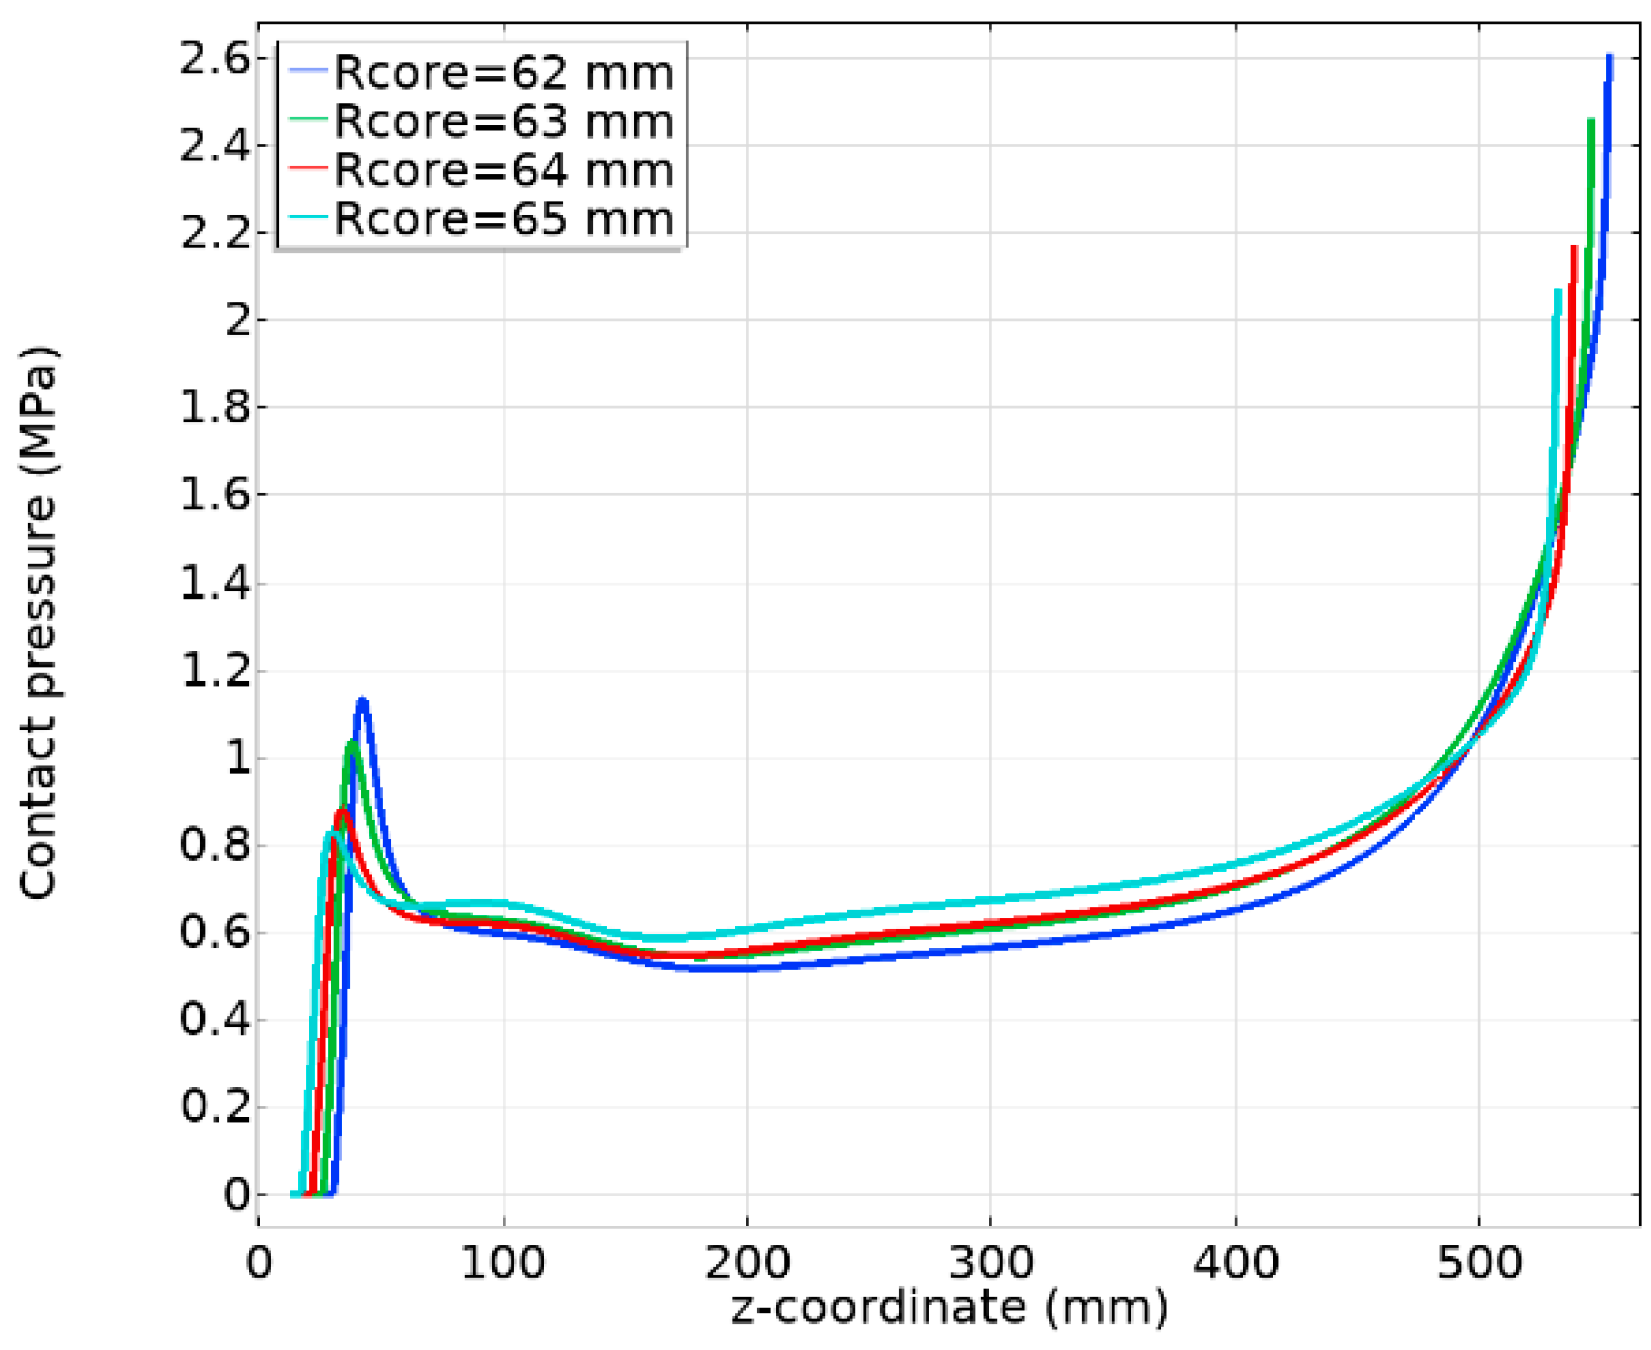
In this section, the sensitivity of the prototype to the outer radius of the cable core is analyzed with a controlled total spring force of 30 kN. The outer radius of the cable insulation is 65 mm in the drawing. Accordingly, a range of radii, from 62 mm to 65 mm, was chosen for the analysis. Figure 10 shows the results with a cable core radius from 62 mm to 65 mm. When Rcore = 65 mm, the pressure distribution is in a saddle shape. As D decreases, the pressure at both ends drops quickly, while the middle part retains the pressure level. When Rcore reaches 62 mm, the contact pressure at the two ends suffers a significant drop to 0.1 MPa and below, leaving the interface in a dangerous condition.
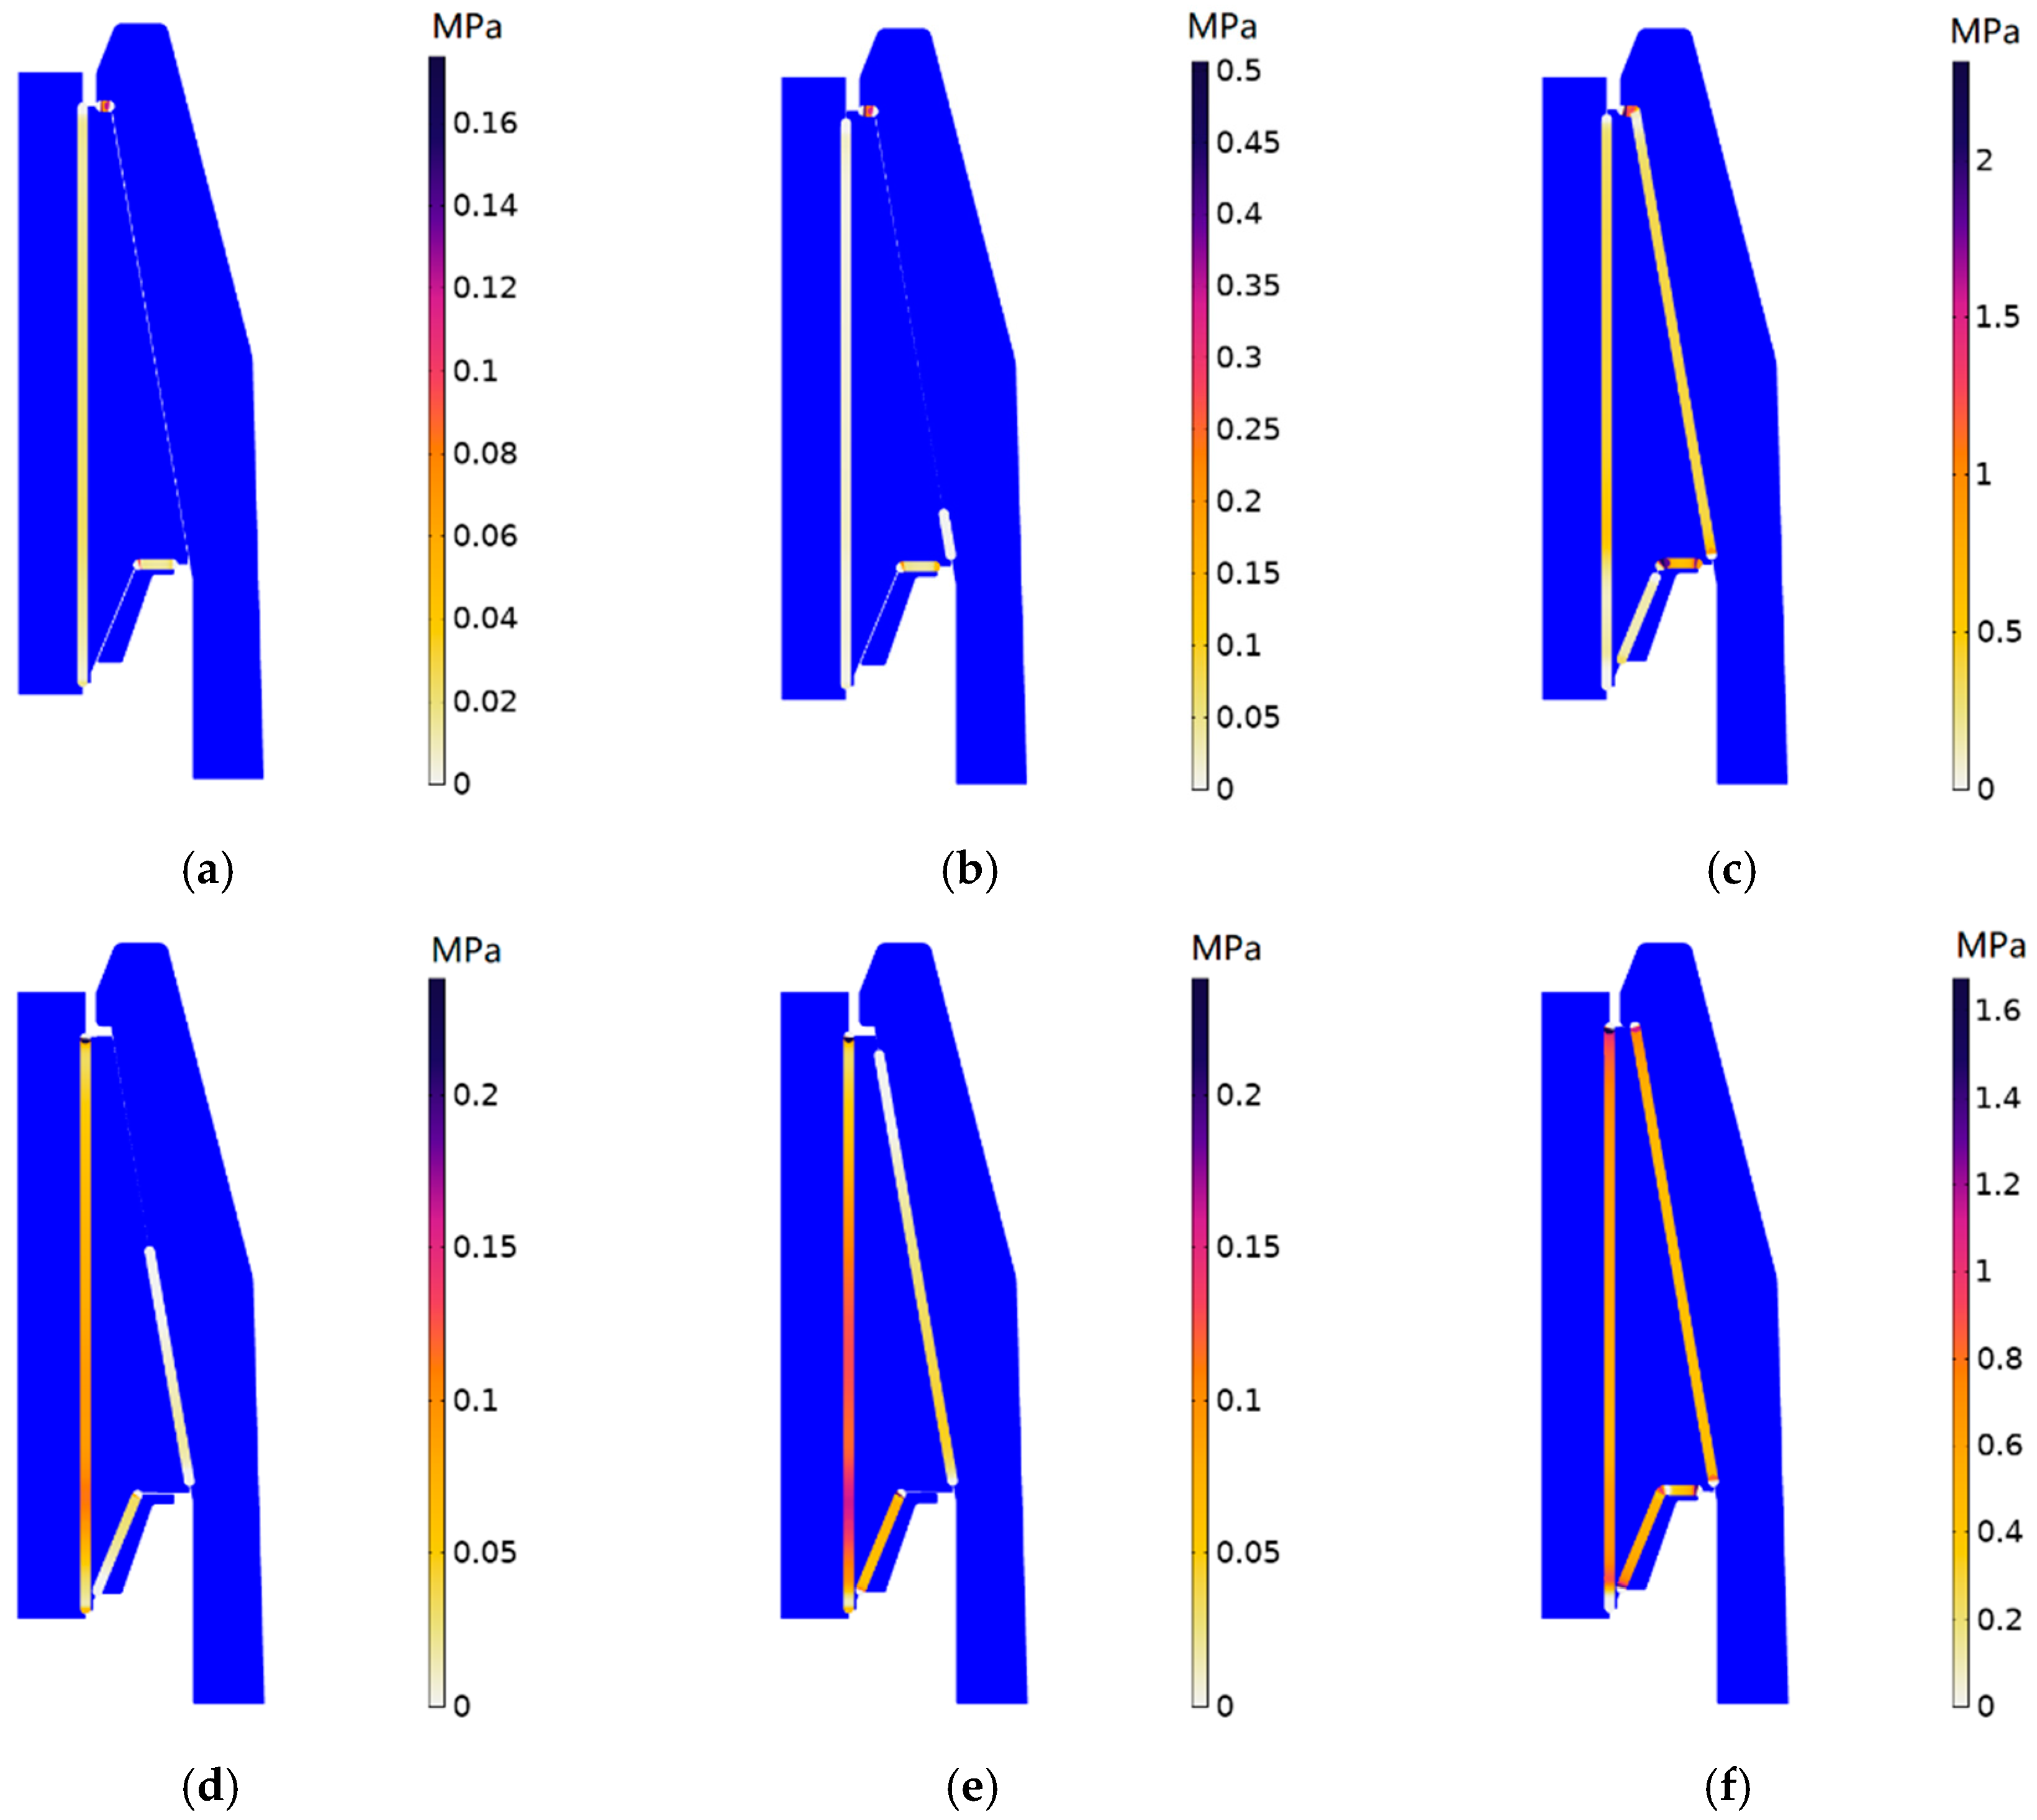
In addition, the installation processes of two cable core sizes (Rcore = 62 mm and 65 mm) are compared in Figure 11. The result shows the contact pressure development and the movement of the stress cone during the installation with the two radii of 62 and 65 mm. There is an apparent difference between the two scenarios. When Rcore = 62 mm, the top of the stress cone contacts the socket first in contact pair 2 and the horizontal part of the supporting ring contacts the stress cone first in contact pair 3. The unexpected early contact of these two positions prevents the stress cone from moving further under the movement of the supporting ring. It prevents an efficient conversion from the spring force to the interface contact pressure in critical areas.
The above results show that, by the current design, the interface contact pressure distribution is highly sensitive to the cable radius; when the cable radius is slightly smaller, some interfaces will lose pressure, which may cause breakdown failure. This conclusion is coherent with the unstable performance of the current design during the tests.
4.1.3. Friction
Although applying lubricants, in terms of silicone oils or silicone greases, can significantly increase the lubrication of the interfaces during cable accessory assembly, the impact of friction on the installation quality is yet to be discussed. This section investigates the sensitivity of the prototype to the friction on the interfaces by computing the stress distribution under different friction conditions.
From the mechanical aspect, the mechanism of the prototype is similar to that of a hydraulic system—the rubber cone converts the contact pressure from the supporting ring into its internal stress, which then interacts with the other interfaces in the form of contact pressure. The friction on the interface prevents the free distribution of the rubber, thereby increasing the uneven distribution of its internal stress, which further leads to the uneven distribution of the interface pressure.
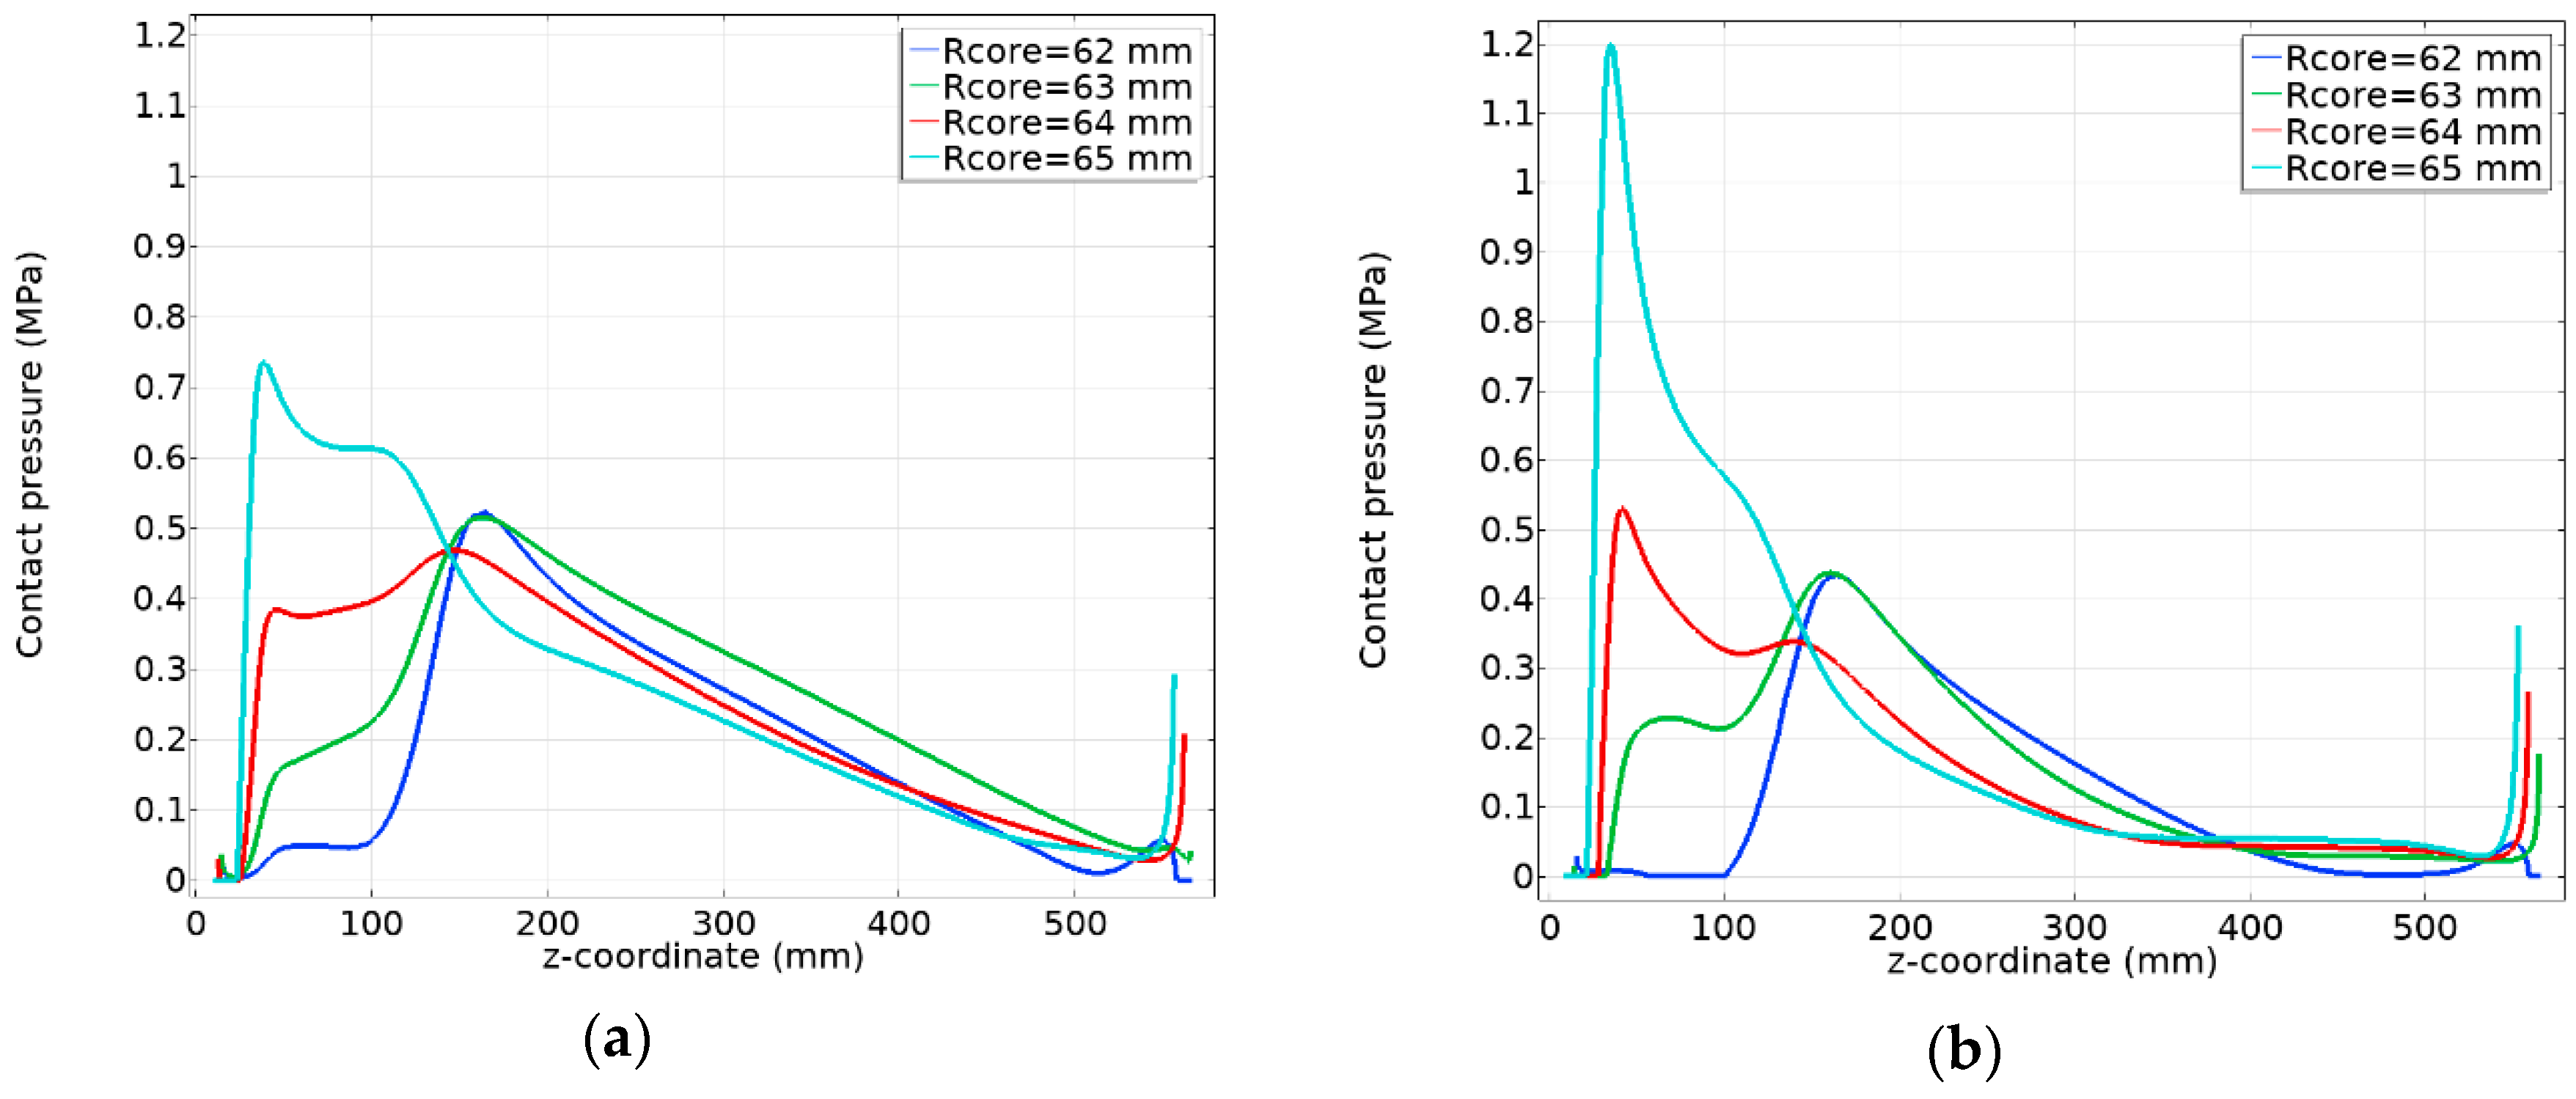
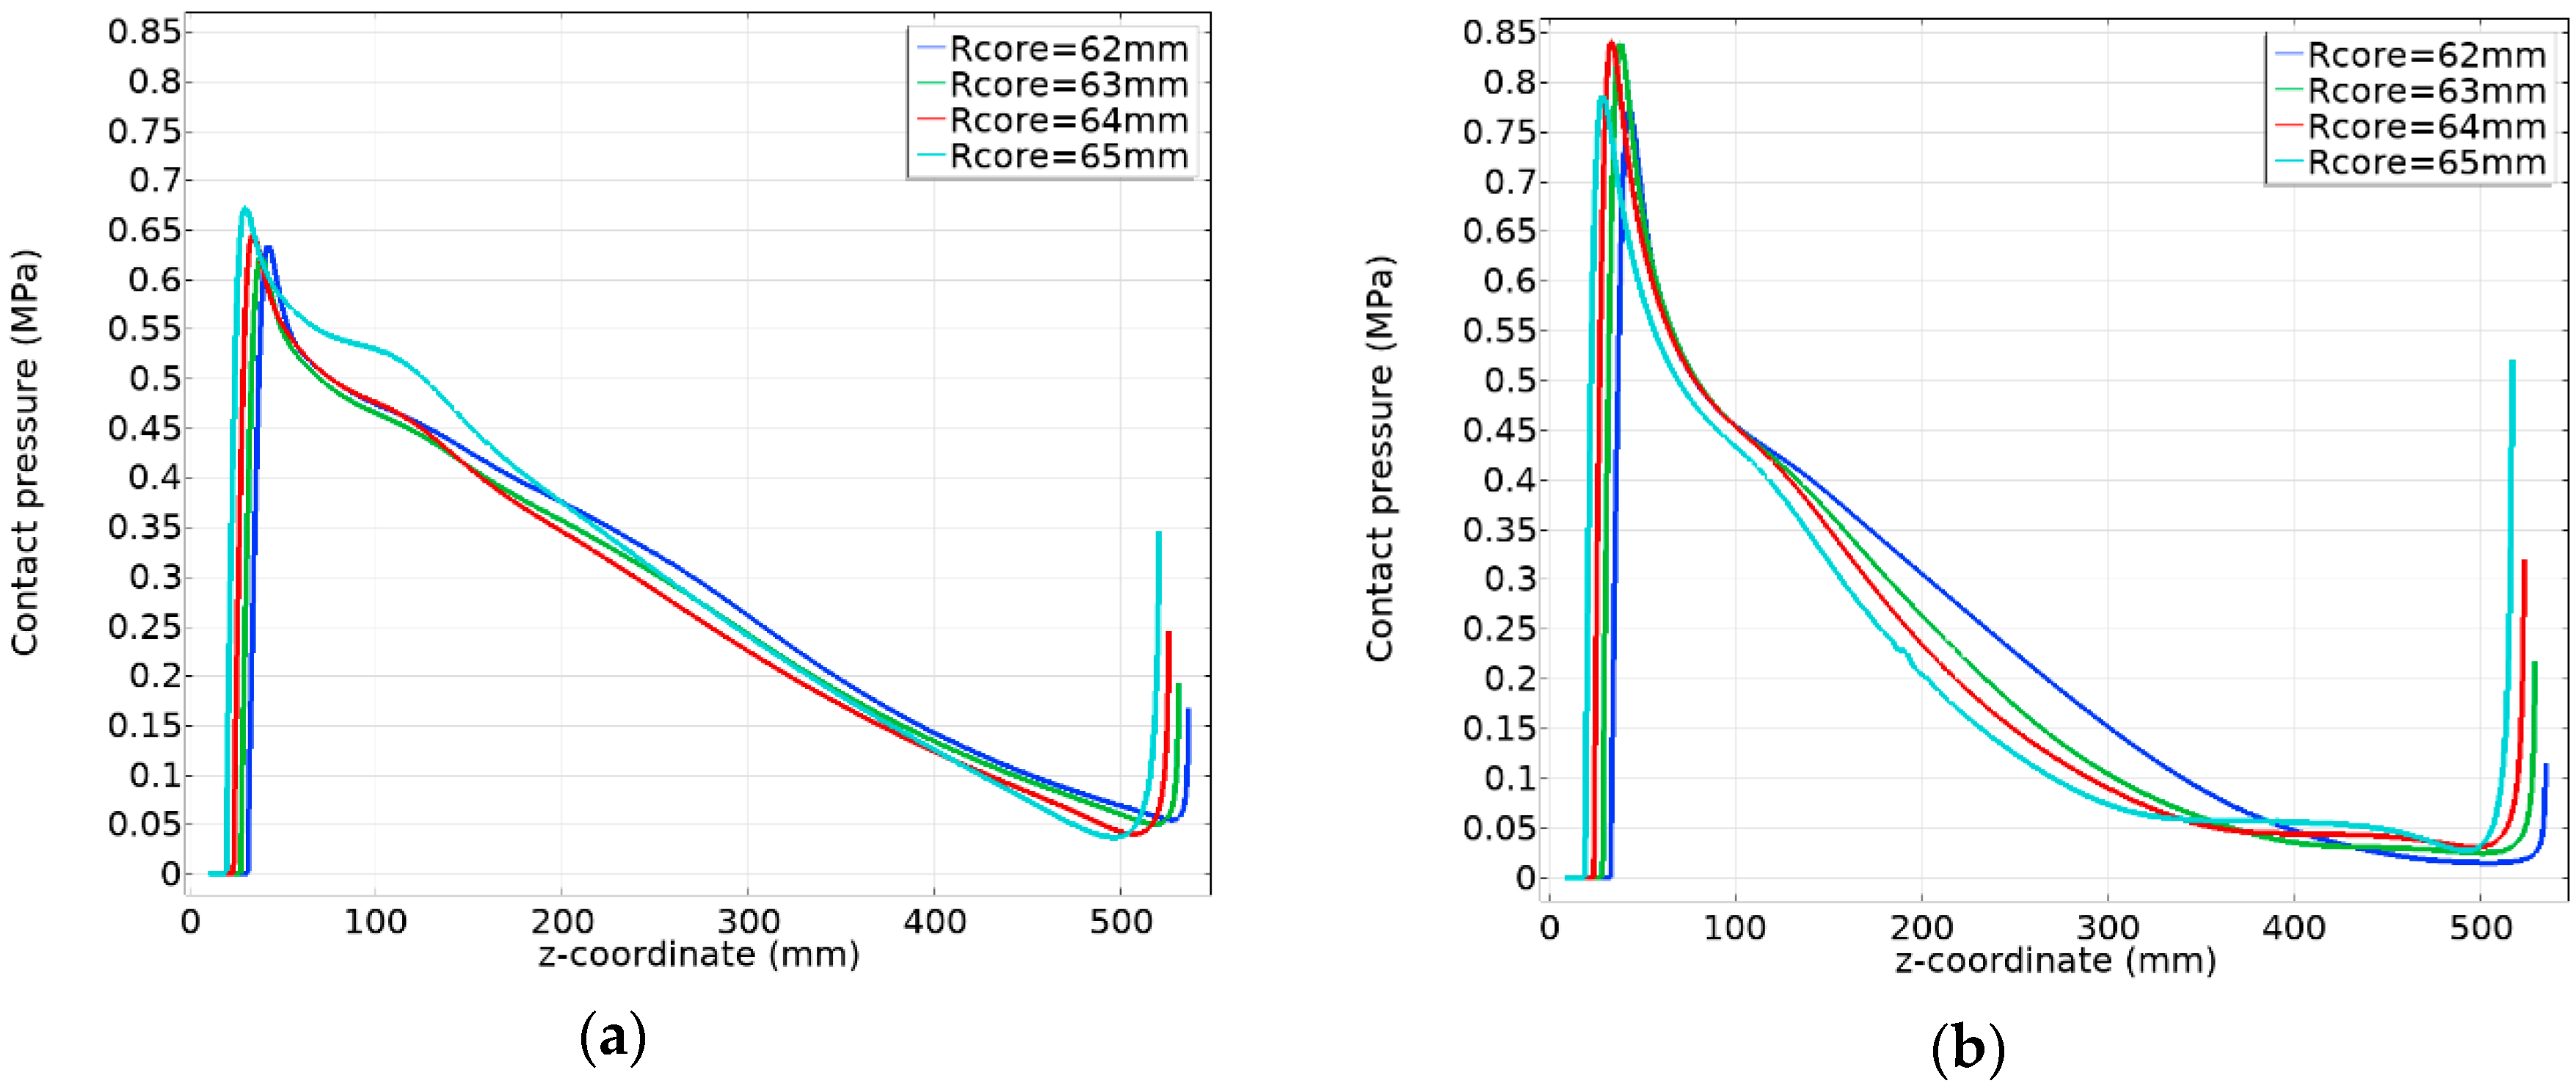
Figure 12 shows the contact pressure on the interface between the cable core and the stress cone with uniform friction coefficients of 0.2 and 0.4. The result confirms, once again, that the current design is vulnerable to variations in cable core radius. Furthermore, a comparison of the results in Figure 10 and Figure 12 suggests that the friction on the interfaces of a cable accessory tends to introduce the uneven distribution of the interface pressure—a decrease in high places and an increase in low places. This phenomenon becomes more significant as the friction force increases.
The reason for the deviated pressure distribution is as follows. The result in Figure 12 represents the stationary state of the rubber cone at a total spring force of 30 kN after progressively increasing compression from the supporting ring, and thus the frictions are expected to be pointing down along interfaces 1 and 2. It is those interface frictions that contribute to the incremental distribution of the internal stress downwards in the rubber cone, thereby leading to an unevenly distributed contact pressure.
The above result shows that, by the current design, the contact pressure distribution is dependent on interface friction levels. Increases in friction during installation are expected to deteriorate the imbalance of the stress distribution.
It should also be noted that the case in this section only presents the friction impact in a simplified condition. Moreover, there are other factors that can increase the complexity of friction impacts. Firstly, when frictions are involved, the result is highly dependent on history. During the operation, time-varying load currents introduce a time-dependent temperature gradient in cable systems, and the consequent continuous relative displacement between the cable core, stress cone, socket, and supporting ring adds to the uncertainty of the friction distribution. Secondly, the amount of lubricant left on the interface directly determines the degree of lubrication, meaning that the friction coefficient and adhesion can vary (1) against its pressure distribution across the interface and (2) against the operating time due to the absorption of the lubricant by the rubber cone.
4.1.4. Straightness of Cable
Due to the internal stresses generated from production and storage, cable cones tend to bend after being released from the drums. In order to ensure consistent installation quality, cable cores should be straightened by releasing their internal stresses. One commonly used method is to heat the cable first with electrical heating belts, keep the temperature constant for several hours and then let it cool down to room temperature with angle steel fixed on it. However, due to the gravity of the cable and the friction forces during stress cone installation, the straightness of the cable after installation cannot be guaranteed. This phenomenon is even more apparent in the case of terminations, which have longer internal cables.
Although the existing simulation model, which is based on an axisymmetric geometry, is not able to reproduce this asymmetric condition, the simulation results from the previous section can be used as a reference. Cables with poor straightness can roughly be seen as an increase in radius on one side and a decrease in radius on the other side. This can lead to a breakdown on the weaker side of the cable when the contact pressure there is not enough. In order to more accurately simulate the interface pressure in such cases, a normal 3D model is needed. However, it requires much higher computing power and a much longer simulating time. Further work should be done in this direction.
4.2. Optimization
According to the sensitivity analysis in the previous section, with the current stress cone structure, the interface pressure at the top and bottom part of the interface between the cable and the stress cone is highly sensitive to the cable radius. In order to improve the adaptability to the cable core radius, the optimization has been considered in two motivations. Firstly, the upper part of the stress cone is shortened to avoid contact between the socket and cone on the top surface. Secondly, the bottom of the stress cone has been altered into one inclined plane. This simple geometry helps to maintain an evenly distributed contact pressure on the interface between the rubber cone and the supporting ring against a wide range of Rcore.
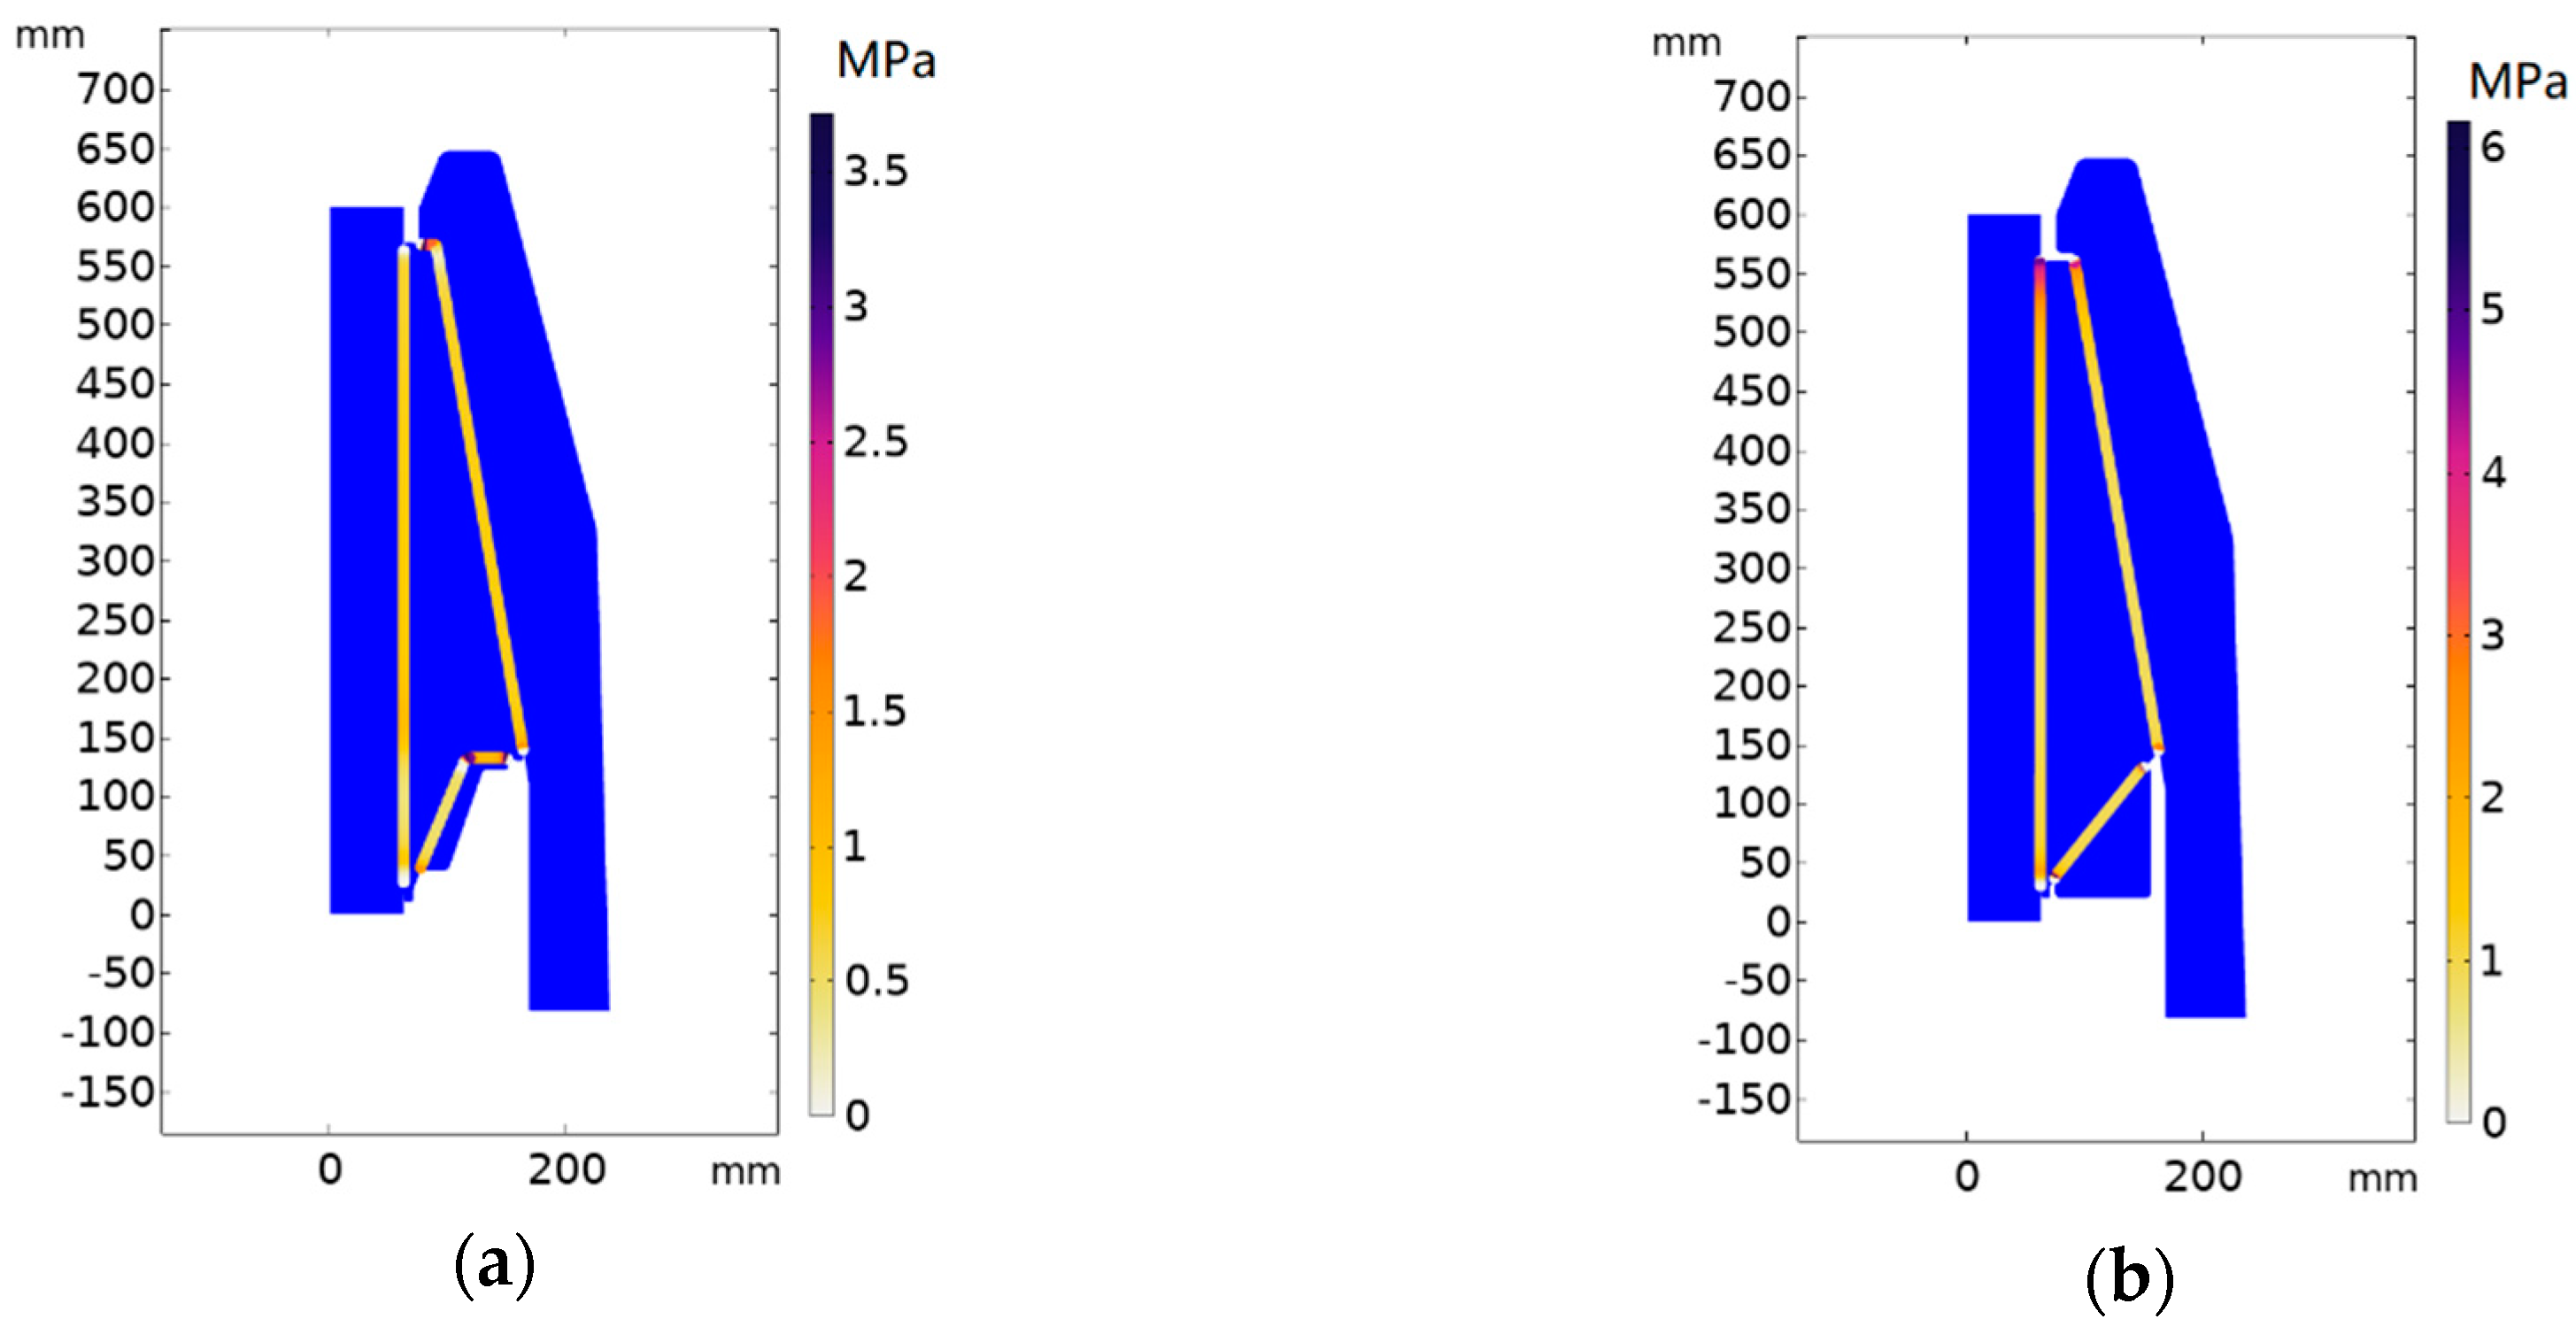
A preliminary computation is conducted for the ideal scenario without friction and adhesion. Figure 13 compares the stress distribution in (a) the original prototype and (b) the optimized design with a total spring force of 30 kN; Figure 14 further presents the contact pressure distribution on the interface between the cable core and the rubber cone. The results show that with the optimization in the stress cone and the supporting ring, the contact pressure is evenly distributed on the interface between the stress cone and the cable core when Rcore is between 62–65 mm, thereby ensuring a good dielectric strength.
Furthermore, the impact of frictions on the optimized design was investigated. Figure 15 presents the contact pressure distribution with friction coefficients of (a) 0.2 and (b) 0.4. The result reconfirms the adaptability against the cable core radius when friction is involved. Nevertheless, it also suggests that the contact pressure at the upper part of the stress cone stays vulnerable to friction in the optimized design. This indicates that the use of lubricant on the interface is very important. According to our installation experience, friction coefficients much lower than 0.2 can be achieved.
5. Conclusions
This paper presents one sophisticated method for computing the mechanical stress distribution in the rubber stress cones of cable accessories. This method offers accurate results for rubber bodies of complex geometries and large deformations by employing hyperelastic models in a computation model based on the finite element method. A case study on a ±500 kV HVDC cable termination using this method is presented. Based on the results of sensitivity analysis, the prototype was optimized for enhanced compatibility with cable core radius variation. The method introduced in this article can be used for the mechanical stress and deformation analysis of all types of cable accessories, which include stress cones made of elastic material.
Author Contributions
Conceptualization, Y.L. and Z.H.; methodology, Y.L. and Z.H.; software, Y.L. and Z.H.; validation, Z.H.; formal analysis, Y.L. and Z.H.; investigation, Y.L.; resources, M.Z. and H.W.; data curation, Y.L.; writing—original draft preparation, Y.L.; writing—review and editing, Z.H., M.Z., and H.W.; visualization, Y.L.; supervision, M.Z.; project administration, M.Z. and H.W.; funding acquisition, M.Z. All authors have read and agreed to the published version of the manuscript.
Funding
This research was funded by the National Key Research and Development Program of China in its project entitled “Critical Technologies for Designing and Manufacturing ±500 kV DC Cables and their Accessories” (No. 2016YFB0900703) and the Science and Technology Project of SGCC entitled “Research on Key Technologies for ±500 kV Direct Current Cable: Research on Key Technologies for the Preparation of DC Cable Accessories” (No. SGRIZLKJ[2016]1190).
Conflicts of Interest
To our best knowledge, the named authors have no conflict of interest, financial or otherwise.
Abbreviations
| HVDC | High Voltage Direct Current |
| TYNDP | Ten Year Network Development Plan |
| GIS | Gas Insulated System |
| FEM | Finite Element Method |
| EPDM | Ethylene Propylene Diene Monomer Rubber |
| LSR | Liquid Silicone Rubber |
| MR | Mooney–Rivlin |
| 2P | 2 Parameter |
| 5P | 5 Parameter |
| 9P | 9 Parameter |
Appendix A. Material Parameters
This section presents the mechanical parameters of silicone rubber which are necessary for the computation model. Table A1 involves the 9P MR model parameters and initial bulk modulus.

Table A1.
Model parameters of the silicone rubber used in the model.
| Parameter | Value | Unit |
|---|---|---|
| C10 | −8.308 | MPa |
| C01 | 8.844 | MPa |
| C11 | 0.000 | MPa |
| C20 | −75.412 | MPa |
| C02 | 94.890 | MPa |
| C21 | 864.054 | MPa |
| C12 | −1384.360 | MPa |
| C30 | −182.676 | MPa |
| C03 | 832.450 | MPa |
| Initial Bulk Modulus | 1500.000 | MPa |
References
- IRENA. Renewable Capacity Statistics 2019; International Renewable Energy Agency (IRENA): Abu Dhabi, UAE, 2019; ISBN 978-92-9260-123-2. [Google Scholar]
- IRENA. Transforming the Energy System; International Renewable Energy Agency: Abu Dhabi, UAE, 2019; ISBN 9789292601492. [Google Scholar]
- 50Hertz; Amprion; TenneT; TransnetBW. Netzentwicklungsplan Strom 2025 Offshore-Netzentwicklungsplan 2025 Version 2015, 2. Entwurf. Available online: https://www.netzentwicklungsplan.de/sites/default/files/paragraphs-files/ONEP_2025_2_Entwurf_Teil1.pdf (accessed on 22 May 2020).
- CNREC. China Renewable Energy Outlook 2019; China National Renewable Energy Centre: Beijing, China, 2019.
- ENTSO-E; Europacable. Forecast Demand and Manufacturing Capacity for HVAC and HVDC Underground and Submarine Cables; European Network of Transmission System Operators for Electricity: Brussels, Belgium, 2018. [Google Scholar]
- Bundesnetzagentur begrüßt Erdkabelvorrang für neue Gleichstromtrassen. Available online: https://www.bundesnetzagentur.de/SharedDocs/Pressemitteilungen/DE/2015/151203_edkabelgesetz.html (accessed on 26 March 2020).
- Liu, C.; Hui, B.J.; Fu, M.L.; Liu, T.; Hou, S.; Wang, X.Y. Influence of Mechanical Stress on the Operation Reliability of Silicone Rubber High Voltage Cable Accessories. High Volt. Eng. 2018, 44, 518–526. [Google Scholar]
- Reda, A.M.; Al-Yafei, A.M.S.; Howard, I.M.; Forbes, G.L.; McKee, K.K. Simulated in-line deployment of offshore rigid field joint—A testing concept. Ocean Eng. 2016, 112, 153–172. [Google Scholar] [CrossRef]
- Reda, A.; Abu-Siada, A.; Howard, I.M.; McKee, K.K. A testing platform for subsea power cable deployment. Eng. Fail. Anal. 2019, 96, 142–157. [Google Scholar] [CrossRef]
- CIGRE. Technical Brochure 210 Interfaces in Accessories for Extruded HV and EHV Cables; CIGRE: Paris, France, 2002. [Google Scholar]
- Kantar, E.; Hvidsten, S.; Mauseth, F.; Ildstad, E. A stochastic model for contact surfaces at polymer interfaces subjected to an electrical field. Tribol. Int. 2018, 127, 361–371. [Google Scholar] [CrossRef]
- Qiliang, Y. Technical progress of the accessories for high and extra high voltage XLPE cables. Electr. Wire Cable 2000, 1, 3–11. [Google Scholar]
- ISO 4287:1997—Geometrical Product Specifications (GPS)—Surface Texture: Profile Method—Terms, Definitions and Surface Texture Parameters; International Organization for Standardization: Geneva, Switzerland, 1997.
- Klein, T.; Zierhut, S.; Wendt, E. Specific Requirements and Techniques for Designing Dry-Type Cable Terminations. In Proceedings of the INMR World Congress 2017, Barcelona-Sitges, Spain, 5–8 November 2017. [Google Scholar]
- Lambrecht, J.; Pilling, J.; Barsh, R. On the Behaviour of Insulations with Interfaces Voltage Cable Accessories-Model Investigations. In Proceedings of the 1999 Eleventh International Symposium on High Voltage Engineering, London, UK, 23–27 August 1999; Volume 4, pp. 14–17. [Google Scholar]
- Wang, P. Electrical Field and Interface Pressure Control in HV Cable Accessories Design. Electr. Wire Cable 2011, 5, 1–10. [Google Scholar]
- Eigner, A.; Semino, S. Ermittlung des Anpressdrucks von Silikonisolierungen und Dessen Einfluss auf das Isoliervermögen von Grenzflächen. In Grenzflächen in Elektrischen Isoliersystemen—3. ETG-Fachtagung; VDE Verlag: Berlin, Germany, 2008. [Google Scholar]
- Dang, C.; Fournier, D. Dielectric performance of interfaces in premolded cable joints. IEEE Trans. Power Deliv. 1997, 12, 29–32. [Google Scholar] [CrossRef]
- Amyot, N.; David, E. A Study of Interfacial Pressure Behavior for Two Types of Thermally Cycled Coldshrinkable Joints. In Proceedings of the Conference Record of the the 2002 IEEE International Symposium on Electrical Insulation (Cat. No. 02CH37316), Boston, MA, USA, 7–10 April 2002; pp. 476–480. [Google Scholar]
- Song, M.; Jia, Z. Calculation and Simulation of Mechanical Pressure of XLPE-SR Surface in Cable Joints. In Proceedings of the 2018 12th International Conference on the Properties and Applications of Dielectric Materials (ICPADM) 2018, Xi’an, China, 20–24 May 2018; pp. 1001–1005. [Google Scholar]
- Wang, X.; Wang, C.; Wu, K.; Tu, D.; Liu, S.; Jia, P. An improved optimal design scheme for high voltage cable accessories. IEEE Trans. Dielectr. Electr. Insul. 2014, 21, 5–15. [Google Scholar] [CrossRef]
- Gent, A.N. Engineering with Rubber: How to Design Rubber Components; Carl Hanser Verlag: München, Germany, 2012; ISBN 978-3-446-42764-8. [Google Scholar]
- ASTM. International Standard Test Methods for Vulcanized Rubber and Thermoplastic Elastomers—Tension (D 412-06). In Annual Book of ASTM Standards; ASTM International: Philadelphia, PA, USA, 2012; pp. 1–14. [Google Scholar]
- Kumar, C. Fitting Measured Data to Different Hyperelastic Material Models | COMSOL Blog. Available online: https://www.comsol.de/blogs/fitting-measured-data-to-different-hyperelastic-material-models/ (accessed on 22 May 2020).
- Luo, Y.; Han, Z.; Lei, X.; Zhou, M.; Ye, H.; Wang, H.; Liu, Y. Techniques for Designing Prefabricated Cable Accessories Based on Hyperelastic Material Model. In Proceedings of the IEEE International Conference on Properties and Applications of Dielectric Materials 2018, Xi’an, China, 20–24 May 2018; pp. 987–991. [Google Scholar]
- ISO 37:2017-11 Rubber, Vulcanized or Thermoplastic—Determination of Tensile Stress-Strain Properties; International Organization for Standardization: Geneva, Switzerland, 2017.
- Ye, H.; Fechner, T.; Lei, X.; Luo, Y.; Zhou, M.; Han, Z. Review on HVDC Cable Terminations. High Volt. 2018, 3, 79–89. [Google Scholar] [CrossRef]
Figure 1.
Prefabricated cable accessories for high voltage extruded cables have the following forms: (a) one-piece termination; (b) composite termination; (c) composite joint; (d) one-piece joint; (e) three-piece joint [10].
Figure 1.
Prefabricated cable accessories for high voltage extruded cables have the following forms: (a) one-piece termination; (b) composite termination; (c) composite joint; (d) one-piece joint; (e) three-piece joint [10].


Figure 3.
The tested data (blue dots) are from a uniaxial tensile test of an liquid silicone rubber (hereafter LSR) specimen in a dumbbell shape by the method in [26]; the red, black, and yellow lines represent the fitted curves based on the Mooney-Rivlin (hereafter MR) model of 2P, 5P, and 9P, respectively. By considering the designed deformation of the stress cones, the data below 30% strain are used for fitting. The standard deviations of the 2-parameter, 5-parameter, and 9-parameter models from the tested data are 0.0223, 0.0071, and 0.0069 per unit (p.u.), respectively.

Figure 4.
The composite prefabricated termination was chosen for the case study. The components requiring pressure analysis are demonstrated in the cross-section view, where the critical interfaces have been highlighted with bold red lines.
Figure 4.
The composite prefabricated termination was chosen for the case study. The components requiring pressure analysis are demonstrated in the cross-section view, where the critical interfaces have been highlighted with bold red lines.

Figure 5.
The breakdown area was concentrated on the interface between the cable insulation and the semi-conductive deflector, as shown in (a). The pictures of the punctured cable surface are presented: (b) breakdown point on the cable side without visible creepage trace; (c) breakdown point with a short creepage trace to the right.

Figure 6.
The geometry of the model is presented with: (a) geometry, (b) mesh, and (c) contact pair definition.
Figure 6.
The geometry of the model is presented with: (a) geometry, (b) mesh, and (c) contact pair definition.

Figure 7.
The computation involves three steps.

Figure 8.
The von Mises stress and the contact pressure are shown in (a). The upper color legend is for the von Mises, and the lower one is for the contact pressure. The contact pressure between the stress cone and cable insulation is shown in (b). The outer radius of the cable insulation is 65 mm, and the total force of the spring is 30 kN.

Figure 9.
The figures show: (a) the correlation between total spring force and the supporting ring displacement; (b) the contact pressure distribution between the stress cone and the cable insulation against different supporting ring positions. The cable insulation radius is 65 mm.
Figure 9.
The figures show: (a) the correlation between total spring force and the supporting ring displacement; (b) the contact pressure distribution between the stress cone and the cable insulation against different supporting ring positions. The cable insulation radius is 65 mm.

Figure 10.
The contact pressure distribution between the stress cone and the cable core varies against different cable core radii. The total spring force is 30 kN for each curve.
Figure 10.
The contact pressure distribution between the stress cone and the cable core varies against different cable core radii. The total spring force is 30 kN for each curve.

Figure 11.
The contact pressure development with the cable core radius (Rcore) at 62 mm is presented in (a), (b), and (c) with spring forces of 0.5 kN, 1.5 kN, and 30 kN, respectively. The contact pressure development for Rcore = 65 mm is presented in (d), (e), and (f), with spring forces of 0.5 kN, 1.5 kN, and 30 kN, respectively. The color legend bar is for the contract pressure.

Figure 12.
The contact pressure distributions between the stress cone and the cable core with friction coefficients of 0.2 and 0.4 are presented in (a) and (b), respectively. For each curve, the total spring force is controlled at 30 kN.
Figure 12.
The contact pressure distributions between the stress cone and the cable core with friction coefficients of 0.2 and 0.4 are presented in (a) and (b), respectively. For each curve, the total spring force is controlled at 30 kN.

Figure 13.
The contact pressure distributions of the original prototype and its optimized design are presented in (a) and (b), respectively. The cable insulation radius is 62 mm and the total spring force is 30 kN. Friction and adhesion are ignored.
Figure 13.
The contact pressure distributions of the original prototype and its optimized design are presented in (a) and (b), respectively. The cable insulation radius is 62 mm and the total spring force is 30 kN. Friction and adhesion are ignored.

Figure 14.
Contact pressure distribution between the stress cone and the cable core in the optimized design. The total spring force is controlled at 30 kN for each curve.
Figure 14.
Contact pressure distribution between the stress cone and the cable core in the optimized design. The total spring force is controlled at 30 kN for each curve.

Figure 15.
Contact pressure distributions between the optimized stress cone and the cable core are presented in (a) and (b) considering friction coefficients of 0.2 and 0.4, respectively.
Figure 15.
Contact pressure distributions between the optimized stress cone and the cable core are presented in (a) and (b) considering friction coefficients of 0.2 and 0.4, respectively.

Table 1.
Values of the stain invariants of a hyperelastic material against uniaxial tensile strain.
| Variables | Strain | ||
|---|---|---|---|
| 10% | 20% | 30% | |
| 0.0282 | 0.1067 | 0.2285 | |
| 0.0264 | 0.0944 | 0.1917 | |
| 0.0008 | 0.0114 | 0.0522 | |
| 0.0007 | 0.0089 | 0.0368 | |
| 0.0000 | 0.0012 | 0.0119 | |
| 0.0000 | 0.0008 | 0.0070 | |
© 2020 by the authors. Licensee MDPI, Basel, Switzerland. This article is an open access article distributed under the terms and conditions of the Creative Commons Attribution (CC BY) license (http://creativecommons.org/licenses/by/4.0/).
Share and Cite
MDPI and ACS Style
Luo, Y.; Han, Z.; Zhou, M.; Wang, H. A Sophisticated Method of the Mechanical Design of Cable Accessories Focusing on Interface Contact Pressure. Energies 2020, 13, 2976. https://doi.org/10.3390/en13112976
AMA Style
Luo Y, Han Z, Zhou M, Wang H. A Sophisticated Method of the Mechanical Design of Cable Accessories Focusing on Interface Contact Pressure. Energies. 2020; 13(11):2976. https://doi.org/10.3390/en13112976
Chicago/Turabian StyleLuo, Yi, Zhengyi Han, Mingyu Zhou, and Haitian Wang. 2020. "A Sophisticated Method of the Mechanical Design of Cable Accessories Focusing on Interface Contact Pressure" Energies 13, no. 11: 2976. https://doi.org/10.3390/en13112976
Note that from the first issue of 2016, this journal uses article numbers instead of page numbers. See further details here.