What Attributes Do Passengers Value in Electrified Buses?


1
Mechanical Technology Research Center, Korea Advanced Institute of Science and Technology, Daejeon 34141, Korea
2
The Cho Chun Shik Graduate School of Green Transportation, Korea Advanced Institute of Science and Technology, Daejeon 34141, Korea
3
Gyeonggi Autonomous Driving Center, Advanced Institute of Convergence Technology, Seongnam-si 13449, Korea
4
Center for Eco-friendly Smart Vehicle, Korea Advanced Institute of Science and Technology, Daejeon 34141, Korea
*
Author to whom correspondence should be addressed.
Energies 2020, 13(10), 2646; https://doi.org/10.3390/en13102646
Submission received: 13 April 2020
/
Revised: 29 April 2020
/
Accepted: 21 May 2020
/
Published: 22 May 2020
(This article belongs to the Section E: Electric Vehicles)
Abstract
:The Korean government has announced plans to supply electrified buses to achieve decarbonization in the transportation sector and to create next-generation growth engines. Although a multitude of technical and political studies have been conducted to support the successful introduction of electrified buses, studies on the attitudes and perceptions of passengers toward electrified buses remain insufficient. To evaluate the perceptions and preferences of potential passengers toward the specific attributes of electrified buses, this study performed an online survey (N = 586) that includes people who had experienced travel on public buses. Values of the relative importance of eight different attributes—safety, ride comfort, environmental friendliness, exterior design, cleanliness, crowding, seat comfort, and convenience getting on/off—were evaluated using the best-worst scaling method. The results showed that safety (share of preference: 41.3%) was the most important attribute when using electrified buses. This was followed by eco-friendliness (14.3%) and ride comfort (13.6%). On the other hand, the least important attribute was exterior design (1.8%). Gender differences were also observed in the valuation of certain attributes among the passenger preferences toward electrified buses. The results of this study contribute to the development of strategies for the wide-spread adoption of electrified buses and provide a stepping-stone to a more sustainable public transportation system.
1. Introduction
The importance of electrified transportation is increasingly being emphasized to reduce CO2 emissions in the transportation sector and to prepare for the depletion of oil resources. In 2016, the CO2 emissions of Korea amounted to 589.20 million tons CO2 eq, and this amount was an increase of 23.5% from 1997 CO2 emissions, which were 402.13 million tons CO2 eq. For the same period, global CO2 emissions increased by 11.4%, and the CO2 emissions of OECD countries decreased by 9.5%. Also, in 2017, the transportation sector emitted 24% of global CO2 emissions [1]. In this aspect, experts expect that the transition to electrification will be accelerated away from a road transportation system based on internal combustion engines (ICE); this is an essential point to reduce the emission of pollutants and to enhance sustainable development.
Public transportation can play a key role in developing sustainable cities and societies because it can move mass numbers of users efficiently. The Korea Railroad Research Institute (2010) reported that the amount of greenhouse gas (GHG) emitted when one person moves 1 km by bus (55 g) is 68.2% lower than the amount emitted for the same movement by a passenger car (173 g), and 49.5% lower than that for airlines (109 g) [2]. In the near future, GHG emissions will diminish from the current level if private vehicle traffic and ICE transportation systems shift toward electrified public transportation. Therefore, to achieve successful sustainable development in the transport sector, governments should encourage the supply of next-generation electrified public transportation such as battery and fuel cell electric buses.
Representatively, the Korean government announced a ‘Developmental Strategy for Future Vehicle Industry: 2030 National Roadmap’ in October 2019 as one of several visions for Korea to become the world’s most competitive nation in the global future car market. This plan aims to introduce an electrified transit system, especially battery and fuel cell electric buses. These two are considered representative future transportation modes for a carbon-free society. A battery-electric bus is powered by an electric motor and uses electric energy from on-board batteries. The batteries are charged by fixed pantographs at bus stops and at the bus depot. Charging such batteries requires special caution, but the operational costs when using electricity are much lower than with conventional buses [3]. Fuel cell electric buses use a hydrogen fuel cell to generate electric power. This autonomously converts charged hydrogen to electricity when driving, whereas the battery-electric bus obtains power directly from the stored electricity. These two types of electric buses make very little emission (e.g., carbon dioxide and noise) compared to traditional buses. Particularly, the fuel cell electric buses emit only water when driving, which helps clean the air. To increase fuel cell electric bus demand, the South Korean government will offer up to 1.5 times more points to fuel cell electric bus companies than to ICE bus companies. The target amount of fuel cell electric buses is 2000 units by 2022, up from 37 units in 2019. In the case of battery-electric buses, the government plans to introduce 3000 battery-electric buses until 2022 via purchase subsidies of local governments, a discount of electric charging fees, and the reduction of battery-electric bus acquisition tax. Additionally, the government has included strategies to increase user convenience and enhance the safety of electrified transportation modes.
To this end, several studies have been conducted for the successful introduction and operation of electrified buses. Correa et al. (2017) compared the Well-to-Wheel efficiency of ICE, hybrid, fuel cell, and electric buses for the present (2018) and future (2030) [4]. They concluded that hybrid buses have a significant impact in the short term, but fuel cell and battery-electric buses have a more robust impact in the long term. Stempien and Chan (2017) suggested proper types of electrified buses for limited areas based on the features of individual regions [5]. They also suggested an expansion plan for battery-electric buses that include the supplementation of regulation, standard techniques of electric buses, additional installation of charging stations, and the expansion of subsidies. Britz (2018) performed a feasibility study for hydrogen-fueled internal combustion hybrid buses in Buenos Aires, Argentina, based on financial modeling [6]. Ally and Pryor (2016) performed scenario analysis and life cycle cost empirical study of various kinds of electrified buses to determine the visibility of long-term consequences for fleet-planning and policy decision-making processes [7]. Ko and Shim (2011) studied ways of introducing battery-electric buses in Seoul, Korea [8]. They mentioned the necessity of economic feasibility, convenience, and variety of vehicle types for the successful introduction and operation of battery-electric buses. Their study also emphasized the cooperation of the public and private sectors. Through these studies, there has been considerable progress in electrified bus introduction and expansion from the supplier aspect.
However, from the demand aspect, the research part considering users of electrified buses remains insufficient. Although several studies [9,10,11,12,13] have considered perceptions of electrified vehicles from the purchaser aspect, only a few studies exist on the demand side about preferences for electrified buses. Altmann et al. (2004) estimated perceptions of potential users of fuel cell electric buses. However, they asked responders about abstract factors of buses such as positive/negative image, support for or opposition to introduction, and willingness to pay [14]. Hickson et al. (2007) used a survey to determine perceptions of hydrogen hybrid internal combustion engine buses. They analyzed the ride comfort, smoothness of acceleration and stopping, noise, and temperature. Most of the attributes had positive perceptions compared to those of diesel buses. They also found that passengers assess the best benefit of hydrogen hybrid ICE buses as eco-friendly. However, the results of this study described only the positive impacts of hydrogen hybrid internal combustion engine buses; they did not explain which attributes had impacts on users and how much impact they had. Also, because the survey responders were users of buses during discounted fare periods, positive perceptions could be biased [15]. As such, research on users’ specific perceptions of electrified buses has not been effective.
We can expect improvements of user convenience and an increase in the transportation possession rate if preferences of potential users are reflected in production and service at the development and test-bed steps. Therefore, before electrified buses are introduced, it is necessary to evaluate the perception and preferences of potential users based on technical and social attributes. In this context, we established the aim of this study as examining the anticipated attributes and expectations about electrified bus services, using the survey responses that potential transit passengers gave. We expect that the result of this study will help derive the relative importance of the properties of electrified buses. Insights gained from the results will shed more light on public preferences related to electrified buses, which are to be introduced and in operation in the near future. This information will provide guidance to bus manufacturers and policymakers about eliciting knowledge that could be applied to bus design or to adoption/operation strategies. This study will also guide efforts to increase passenger satisfaction and service quality regarding electrified bus service.
The remainder of this study is organized as follows. The following section provides the service attributes of electrified buses. In Section 3, statistical analysis is used to evaluate the survey responses; the questionnaire designed by the best-worst scaling (BWS) method and the data collected by the survey are described in Section 4. Section 5 documents the outcomes of BWS analysis, and the last section summarizes findings and implications for introduction strategies for electrified buses and suggests directions that will make the electrified buses more attractive to potential passengers.
2. Identification of Potential Passengers’ Perceptions of Electrified Buses
There are various attributes used to measure consumer perceptions and attitudes toward a product. When a new product has a substitute material relationship with an existing product, those attributes used in consumer research on the existing product can be considered first [16]. It is also important to capture attitudes toward the differentiated attributes of the new product, such as consumers’ environmental attitudes to green products [17,18]. Through a literature review, we derived eight attributes related to the introduction and use of electrified buses. Four basic attributes commonly used in previous bus service satisfaction analyses—cleanliness, crowding, seat comfort, convenience of getting on/off—and four different attributes that characterize electrified transport as opposed to conventional buses—safety, ride comfort, environmental friendliness and exterior design— were analyzed. Definitions of these attributes are provided in Table 1.
Previous studies [19,20,21,22,23] about bus services have mainly considered cleanliness, crowding in the vehicle, seat comfort, convenience of getting on and off, reliability of travel time, fare, frequency, accessibility, and bus stop maintenance. Among these attributes, reliability of travel time, fare, frequency, accessibility, and bus stop maintenance are invariant when conventional buses are replaced by electrified buses. The present study, therefore, included cleanliness, crowding in-vehicle, seat comfort, and convenience of getting on and off as primary factors for bus service.
This study also considered the attributes that can constitute relative changes and differences when electrified buses are introduced. There are many attributes—safety, battery range, ride comfort, purchase price, environmental concerns, charging infrastructure, and exterior design—that potential consumers consider when using or purchasing electrified vehicles [24,25,26,27]. Most of these attributes are closely related to the characteristics of electrified vehicles, which involve propulsion by electric motors using rechargeable batteries. Among the attributes included are safety and ride comfort, which led us to consider these in relation to the new technology. Unlike in previous studies of conventional buses, safety does not only mean accidents between vehicles, or between vehicles and humans. The technology of the electrified bus differs from conventional buses, so there is user concern about malfunctions during a trip involving the failure or explosion of the batteries [28]. Therefore, safety in this study also includes these concerns, which are classified as a characteristic of electrified buses. Moreover, ‘ride comfort’ can be considered one of the characteristics of electrified vehicles, which is distinct from ICE vehicles because electrified vehicles have little vibration or noise while moving [29]. One significant advantage of battery-based transportation is zero emissions during use, which has a direct and positive effect on the quality of the local environment [30]; for this reason, the characteristic of zero-emissions was included in this study as an environmentally-friendly attribute. Finally, we considered the exterior design of the buses, which can increase vehicles’ attractiveness to people and improve a city’s eco-friendly image [31]. In addition, electrified vehicles have unique front and rear designs (e.g., there are no intake ports and exhaust pipes) due to having different structural components than those found in ICE vehicles [32,33]. Battery range, purchase price, and charging infrastructure were not included in the final attribute set because this study targets potential passengers of electrified buses, not drivers.
3. Methodology
The purpose of this study was to evaluate the relative importance of the properties of electrified buses. In general, two types of methods—the analytic hierarchy process (AHP) and best-worst scaling (BWS)—are widely used in factor priority studies. Unlike with the AHP analysis, which involves pairwise comparison using a Likert-scale, the BWS method is based on asking questions to select the best and the worst item in each choice set and has the following three advantages [34,35,36,37]. First, the BWS method is superior to ranking (such as used with Likert-scale questions) because that approach may suffer from scale bias, and respondents are not forced to make explicit tradeoffs between items. Second, the BWS method can reduce the burden of imposition upon respondents due to excessive questions by adopting an orthogonal design, even if the number of items increases. Third, it becomes possible to elicit respondents’ views of the relative importance of the target items, for which there exists an appropriate statistical test. These advantages of the BWS method make it suitable for this study because: (i) the survey targets of this study include ordinary people who may be unfamiliar with survey methods; these are not expert groups. Therefore, survey design should be easy and intuitive. (ii) To measure consumer preference for eight items, pairwise comparison requires more than 28 questions, but with BWS the number of survey questions can be reduced to around 10. (iii) BWS presents choices of items rather than evaluating the strength of preference, so there is no opportunity for scale bias. For these reasons, we designed our questionnaire using the BWS method.
There are two ways to analyze the answers to the BWS question, which include a counting approach and a modeling approach [37,38]. The results of both methods—estimated coefficients and rank of attributes—are generally similar. However, there are some papers that report subtle differences between the two results due to the two theoretical backgrounds’ differences [39]. Therefore, we used both methods to ensure the consistency and reliability of the results.
3.1. Counting Approach
The BWS counting approach calculates the relative importance among items based on the frequency with which item i is selected as the most important response ( and as the least important response ( in all the BWS questionnaires for all survey participants (N). The priority between items can be determined using a score derived from the following equation:
can be expressed as the difference between the frequency and the frequency . The standardized ( is calculated using and , which refer to the number of times is contained in all the BWS survey questionnaires. The score has a range from −1 (when item is selected as the least important in all survey questionnaires that include item) to +1 (when item is selected as the most important in all survey questionnaires that include item); these scores can determine the priorities among all items. We can also identify the relative importance among items through the following standardized ( equation:
where is the square root of the ratio of and . The score of the most important item is 1, and the other items have a score between 0 and 1.
3.2. Modeling Approach
The second method for analyzing responses to BWS questionnaires is a modeling approach that uses a choice experiment method. The choice experiment method is based on the utility function of individual respondents. The utility of the ith participant’s choice for the item out of items is, where is an input vector, is a coefficient vector, and is an error term. We assumed that is independent of respondents and items, and composed of identically distributed Gumbel variables. Under these assumptions, the conditional logit model is derived as follows:
In a BWS questionnaire with items, the possible number of pairs for which respondents choose items and as the most important and least important, respectively, is . For each item, it is assumed that each respondent has a utility and that the utility difference between and represents the respondent’s greatest utility difference. Based on these assumptions, the probability of choice as the most important and of as the least important item is expressed by the following conditional logit model:
The denominator consists of the sum of the utility differences of all items k and l. When estimating the coefficient of an item, the maximum likelihood method was used. In particular, when estimating Equation (4), the utility is normalized for one of items, and its coefficient is fixed at zero; this item is used as a reference item. As a result, the coefficients for the remaining items are estimated. This can be used to calculate a share of the preference that represents the relative importance among the items; this is because the remaining coefficients represent the difference in value from the normalized item’s coefficients. The share of preferences for item can be calculated as follows:
The denominator is the sum of the exponents of the total item’s coefficients; the numerator is the exponent of the particular item coefficient. As a result, the sum of preference shares for all items is 1. To analyze the BWS questionnaires, we used R software.
4. Descriptions of Survey Design and Data
4.1. Survey Design
This study used BWS analysis based on eight technology and service attributes about electrified buses. The questionnaire by the full factorial design, which considers all combinations of attributes, leads participants hard to respond because of the excessive number of questions. [40]. In this study, therefore, we reduced survey questions using a two-level orthogonal main-effect design to ensure that there is neither correlation nor interaction among the attributes. Table 2 provides the results of the orthogonal design suggested by Finn & Louviere [35]. The columns, from A to H, are evaluation attributes (or items) of the electrified bus, and the rows correspond to choice sets that comprise of the attributes of electrified buses. For example, choice set 1 includes B, E, G, and H attributes. Each attribute is included six times in the choice sets. Based on Table 2, twelve BWS questions were designed.
The survey questionnaires were composed of two parts. The first part contained gender, age, household income, job, experience of battery-electric buses, and other indexes of socioeconomic status. The second part contained 12 questions based on the BWS. For each BWS question, the respondents chose the most important (best) and the least important (worst) attribute among the suggested attributes of the electrified bus. The configuration of the survey is tabulated in Table 3.
4.2. Sample Characteristics
To measure potential passenger perceptions of the introduction and operation of electrified buses, online survey responses were collected from 7–11 October 2019. During this period, 690 participants took the pre-screening survey, in which they were asked about their bus riding experience. If the participants reported taking more than one bus ride, they were qualified to take the survey. Of the 690 participants, we received 684 valid responses. Among the responses, we also excluded 98 due to inconsistency and incompleteness; 586 responses were used in the final analysis. The responses collectively have the characteristics summarized in Table 4.
Male respondents made up 50.4% of participants, and the average age of respondents was 44.5 years. Office workers (37.7%) held the largest portion of respondents’ jobs. 40.6% of the respondents used buses as their primary transportation mode, and the average intra-city usage was 5.6 times per week. The household income and battery-electric bus experience of respondents were also collected.
5. Results
5.1. Results 1: Total Sample
The primary objective of this study was to derive the relative importance of attributes for passengers regarding the introduction and use of electrified public buses. To this end, the present study conducted a counting approach-based BWS analysis for eight attributes of electrified buses. Priority and relative importance among the attributes are shown in Table 5.
The standardized BW score, which is calculated as the difference between the frequencies of best and worst, is a priority indicator for attributes. On average, safety, environmental friendliness, and ride comfort have positive (+) standardized BW scores, meaning that these attributes were more frequently selected as most important, rather than as least important. On the other hand, cleanliness, crowding, exterior design, and seat comfort have negative (−) standardized BW scores, meaning that these attributes were more frequently selected as least important, rather than as most important. According to the standardized BW scores, the most important attribute of electrified buses is, on average, safety (0.635). This is followed by environmental friendliness as second-most important (0.222), and by ride quality as third-most important (0.179); these second two attributes were evaluated as important attributes. However, convenience of getting on/off (−0.012), seat comfort (−0.079), cleanliness (−0.084), and crowding (−0.200) were evaluated as less important attributes. Lastly, exterior design was selected as the least important attribute (−0.661).
A standardized sq.BW score was used as an indicator to compare the relative importance of attributes. The most important attribute of an electrified bus, safety (1.000), and the second-most important attribute of environmental friendliness (0.705) are approximately 17.5 and 12.4 times as important as exterior design (0.057), respectively.
Conditional logit analysis was conducted using the second BWS method to estimate the relative importance among the attributes. To develop the conditional logit model, among the eight attributes, exterior design was arbitrarily assumed to serve as a reference item, for which the coefficient was normalized to zero. The relative preference ratio was compared based on estimated coefficients, and the results indicate that the levels of importance of all other attributes are statistically different from zero (exterior design) at the 1% significance level (p < 0.01). The coefficient for each attribute and the relative preference ratio are provided in Table 6.
The preference share was derived from the estimated coefficient, and the total preference share for all attributes was set at 100%. Safety, which was evaluated as the most important attribute of electrified buses, accounts for 41.3% of total importances. It is followed by environmental friendliness and ride comfort at 14.3% and 13.6%, respectively. The exterior design occupies only 1.8%, adhering to the position of the least important attribute. We can interpret these results as follows: the resultant scale indicates that safety is approximately 22.7 times more important than exterior design (22.7 = 41.252/1.821). The fourth through seventh places were evaluated in this order: convenience of getting on/off, seat comfort, cleanliness, and in-vehicle crowding all reflect similar preference ratios between 5% and 8%.
To ensure consistent and reliable results from both the counting approach and the modeling approach, we compared the coefficient estimated by the conditional logit model with the standardized BW score. As a result, the relationship between the results of the two approaches had an extremely high correlation (0.9992), and there were no differences in preference ranking.
5.2. Results 2: Group Analysis by Gender
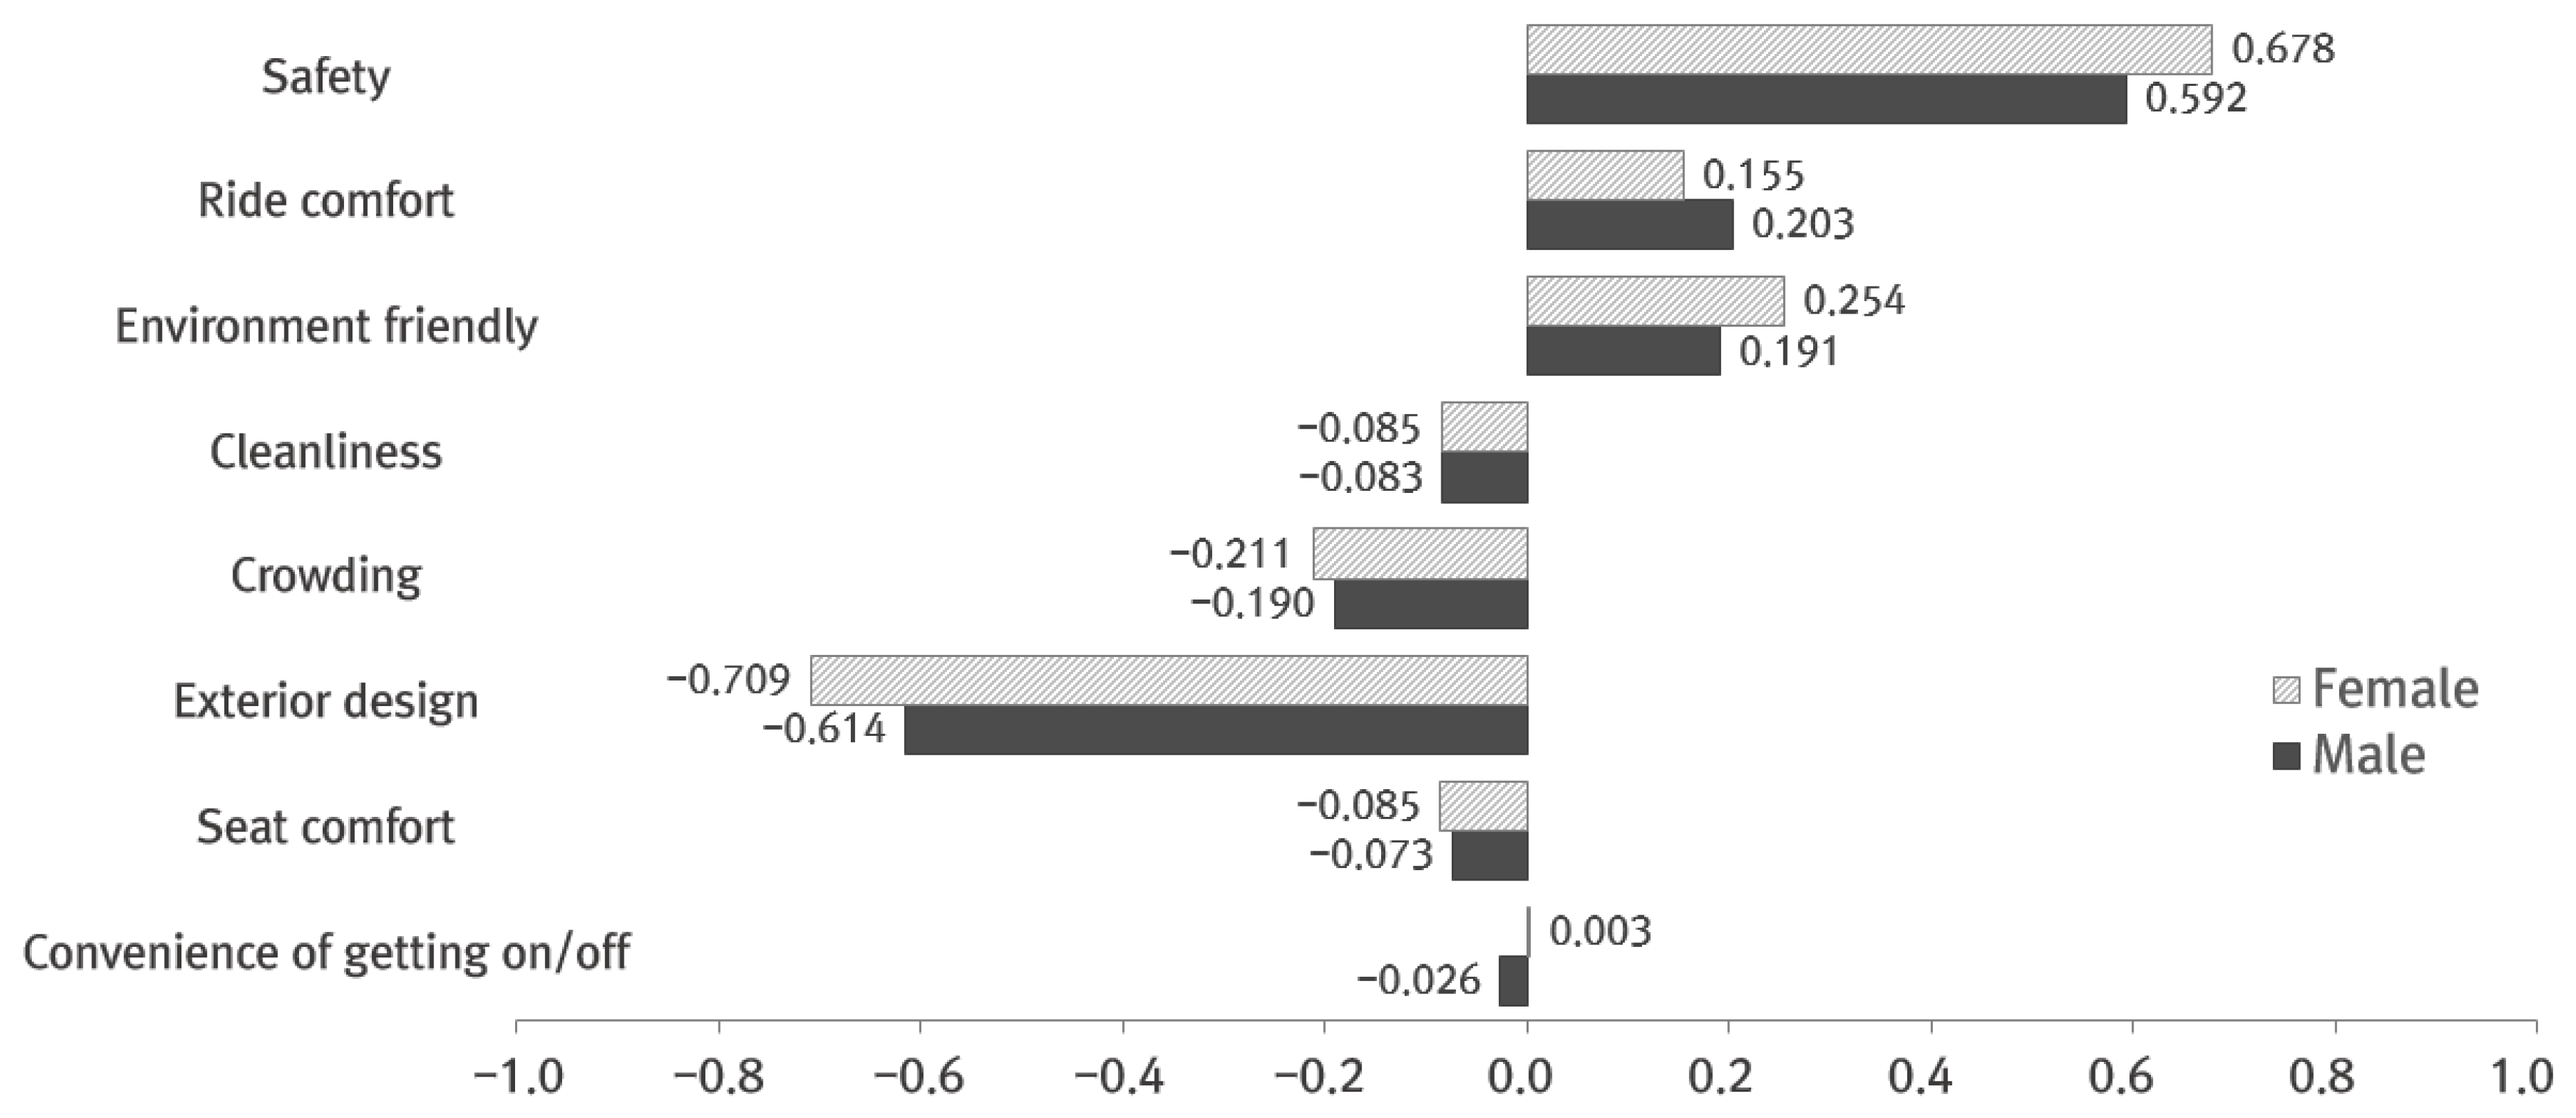
According to previous studies that analyzed the service quality of public transportation, gender has an important role in explaining the personal attitudes, preferences, and behaviors of passengers [41,42]. Thus, this study divided the sample into two groups based on gender (297 male and 289 female) and compared how differently each group evaluated the importance of the major attributes of electrified buses. The resultant standardized BW scores for each attribute in each group are shown in Table 7 and Figure 1. The results show that there is a relatively larger difference in the standardized BW scores between the two groups with respect to safety, environmental friendliness, ride comfort, and exterior design. In particular, females evaluated the safety and environmental friendliness as more critical than did males. On the other hand, compared with females, males gave higher value to ride comfort and exterior design attributes. For the remaining attributes, however, there are only small differences between gender groups regarding the attributes of cleanliness, crowding, seat comfort, and convenience of getting on/off.
6. Conclusions and Implications
To archive decarbonization in the transportation sector and to create next-generation new growth engines, the Korean government has a plan for the nation-wide introduction of electrified vehicles. For this goal, more than 5000 electrified buses will operate in South Korea until 2022. To support this policy, this study aims to suggest strategies for the successful operation of the technologies and services of electrified buses. For the purpose, the present study analyzed passenger preferences for the major attributes of electrified buses. As the analysis, a survey questionnaire was designed based on the BWS method, asking for evaluations of eight attributes related to electrified buses.
Analyzing the results of the BWS questions, ‘safety’, which accounted for 41.1% of total importance, was the most critical attribute for the introduction/use of electrified buses. The importance of safety was recognized as at least 2.9 times, and up to 22.7 times, higher than that of the other attributes. This shows that passenger confidence in the safety of a new transport mode is a prerequisite for the social acceptance of electrified buses. This is because safety is one of the top electrified vehicle concerns [43], and even communities of technology enthusiasts have an insufficient understanding about the safety of electrified vehicles [44]. However, this result is contrary to the results in some previous studies, in which convenience [45] and in-vehicle service conditions [46] were evaluated as more important factors than safety in the conventional transit mode. This is probably because rider confidence in the safety of the conventional transit mode has already been sufficiently informed than electrified vehicles. To overcome these biases, these days, various academic research and empirical driving tests have been implemented to improve the safety of electrified buses. Based on the results, bus companies need to use advertising, press releases, and other ways to make sure passengers understand that electrified buses are a safe mode of transportation, and to reduce the passengers’ psychological concerns about safety. Additionally, the government should endeavor to make more specific policies or strategies to reduce public skepticism of safety, which could negatively influence public opinion.
Eco-friendliness was analyzed as the second-most important attribute (14.3%). Zero emissions during driving are one of the biggest advantages of electrified buses and have a direct positive impact on passengers and on the local atmospheric environment [47]. Moreover, the previous study revealed that bus passengers in metropolitan areas have a willingness to pay more when they use battery-electric buses, to reduce greenhouse gas emissions [48]. Consequently, environmental friendliness is also an important attribute because most public transport passengers expect that the quality of the environment will improve with the replacement of ICE buses by electrified buses. This corresponds with previous studies of the behavior of consumers who use electrified products and hope to solve environmental problems [49,50].
The attributes that ranked third to seventh are, in order: ride comfort, the convenience of getting on/off, seat comfort, cleanliness, and crowding. All of these attributes were included in traditional bus service, and are directly related to the quality of transportation use. Among them, the importance of the ride comport was relatively high (13.6%). The reason for this result might be that the passengers of diesel buses suffer inconvenience due to frequent vibration and noise [51]. The vibration and noise levels of electrified vehicles are significantly lower than those of other types of vehicles [52]. This could be a positive feature that will make electrified buses more attractive to passengers. Respondents’ preferences for the remaining attributes ranged between 5% and 10%, indicating that passengers are more likely to use electrified buses in a better environment made possible by more frequent maintenance (including cleaning), or by installing comfortable seats.
Another notable finding of this study is that most passengers do not value the exterior design of electrified buses; only 1.8% preferred this attribute. While the introduction of electrified buses improves a city’s image [31], the exterior design of the buses is not important to potential passengers. This differs from previous studies that found that innovative exterior designs play important roles when individual consumers purchase an electrified vehicle [33,53]. This may be because passengers give more value to the original purpose of public transportation they use, which is to travel to their desired destination.
As a second topic, we analyzed gender differences in passengers’ preferences for electrified buses. There are differences in preference between males and females for several attributes, such as safety, ride comfort, environmental friendliness, and exterior design. Females attached greater importance to the safety and environmental friendliness of electrified buses than did males. According to a study by Egube (2012), females do not convince whether EVs are safe, compared to males [44]. From another aspect, females evaluated environmental consciousness as a more important attribute than did males [54]. With the results of previous studies, it can be assumed that gender differences in attitudes to and perceptions of electric-based vehicles have led to differences in preferences for the attributes of electrified buses.
This study has attempted to quantitatively evaluate the relative importance of various technical and service attributes that should be considered when introducing and using the electrified buses; it contributes to enhancing our understanding of passenger attitudes and perceptions toward electrified buses. We hope that this study’s results can be used to provide necessary information for improving strategies for electrified bus operation and high-quality passenger service.
Author Contributions
Y.K.: conceptualization, formal analysis, methodology, software, validation, visualization, writing-original draft; S.K.: data curation, resources, writing-reviewing; H.K.: resources, funding acquisition, project administration; J.B.: writing–reviewing, supervision. All authors have read and agreed to the published version of the manuscript.
Funding
This work was supported by the National Research Foundation of Korea(NRF) grant funded by the Korea government(MSIT) (No. 2020R1C1C1003296) and Advanced Institutes of Convergence Technology (No. AICT-2019-0024).
Conflicts of Interest
The authors declare no conflict of interest.
References
- IEA. CO2 Emissions from Fuel Combustion 2019: Overview; IEA: Paris, France, 2019. [Google Scholar]
- A Study on the GHG Reduction in the Railway Sector in Response to Climate Change, Korea Railroad Research Institute. Available online: Prism.go.kr/homepage/origin/retrieveOriginDetail.do?cond_organ_id=1613000&research_id=1611000-200900115&pageIndex=1&leftMenuLevel=120 (accessed on 12 February 2020).
- Varga, B.O.; Iclodean, C.; Mariașiu, F. Electric and Hybrid Buses for Urban Transport Energy Efficiency Strategies, 1st ed.; Springer International Publishing: Cham, Switzerland, 2016. [Google Scholar]
- Correa, G.; Muñoz, P.; Falaguerra, T.; Rodriguez, C.R. Performance comparison of conventional, hybrid, hydrogen and electric urban buses using well to wheel analysis. Energy 2017, 141, 537–549. [Google Scholar] [CrossRef]
- Stempien, J.P.; Chan, S.H. Comparative study of fuel cell, battery and hybrid buses for renewable energy constrained areas. J. Power Sources 2017, 340, 347–355. [Google Scholar] [CrossRef]
- Britz, S. Feasibility Study of Hydrogen Fueled Internal Combustion Hybrid Bus Operating under Real Traffic Urban Conditions in Buenos Aires, Argentina. 2018. Available online: https://ri.itba.edu.ar/handle/123456789/1532 (accessed on 21 May 2020).
- Ally, J.; Pryor, T. Life cycle costing of diesel, natural gas, hybrid and hydrogen fuel cell bus systems: An Australian case study. Energy Policy 2016, 94, 285–294. [Google Scholar] [CrossRef]
- Ko, J.H.; Shim, J.S. Strategies for Delivering Environmentally Friendly Buses in Seoul; Seoul Development Institute: Seoul, Korea, 2011. [Google Scholar]
- Zhang, Y.; Yu, Y.; Zou, B. Analyzing public awareness and acceptance of alternative fuel vehicles in China: The case of EV. Energy Policy 2011, 39, 7015–7024. [Google Scholar] [CrossRef]
- Roche, M.Y.; Mourato, S.; Fischedick, M.; Pietzner, K.; Viebahn, P. Public attitudes towards and demand for hydrogen and fuel cell vehicles: A review of the evidence and methodological implications. Energy Policy 2010, 38, 5301–5310. [Google Scholar] [CrossRef] [Green Version]
- Tamor, M.A.; Gearhart, C.; Soto, C. A statistical approach to estimating acceptance of electric vehicles and electrification of personal transportation. Transp. Res. Part C Emerg. Technol. 2013, 26, 125–134. [Google Scholar] [CrossRef]
- Glerum, A.; Stankovikj, L.; Thémans, M.; Bierlaire, M. Forecasting the demand for electric vehicles: Accounting for attitudes and perceptions. Transp. Sci. 2014, 48, 483–499. [Google Scholar] [CrossRef] [Green Version]
- Hoen, A.; Koetse, M.J. A choice experiment on alternative fuel vehicle preferences of private car owners in the Netherlands. Transp. Res. Part A Policy Pract. 2014, 61, 199–215. [Google Scholar] [CrossRef]
- Altmann, M.; Schmidt, P.; O’Garra, T.; Hart, D.; Mourato, S.; Rohr, C.; Whitehouse, S. Accept H2: Public Perception of Hydrogen Buses in Five Countries; International German Hydrogen Energy Congress: Essen, Germany, 2004. [Google Scholar]
- Hickson, A.; Phillips, A.; Morales, G. Public perception related to a hydrogen hybrid internal combustion engine transit bus demonstration and hydrogen fuel. Energy Policy 2007, 35, 2249–2255. [Google Scholar] [CrossRef]
- Schilling, M.A.; Hill, C.W. Managing the new product development process: Strategic imperatives. Acad. Manag. Perspect. 1998, 12, 67–81. [Google Scholar] [CrossRef]
- Mainieri, T.; Barnett, E.G.; Valdero, T.R.; Unipan, J.B.; Oskamp, S. Green buying: The influence of environmental concern on consumer behavior. J. Soc. Psychol. 1997, 137, 189–204. [Google Scholar] [CrossRef]
- Chen, T.B.; Chai, L.T. Attitude towards the environment and green products: Consumers’ perspective. Manag. Sci. Eng. 2010, 4, 27–39. [Google Scholar]
- Stradling, S.; Carreno, M.; Rye, T.; Noble, A. Passenger perceptions and the ideal urban bus journey experience. Transp. Policy 2007, 14, 283–292. [Google Scholar] [CrossRef]
- Eboli, L.; Mazzulla, G. Service quality attributes affecting customer satisfaction for bus transit. J. Public Transp. 2007, 10, 2. [Google Scholar] [CrossRef] [Green Version]
- Budiono, O. Customer Satisfaction in Public Bus Transport: A Study of Travelers’ Perception in Indonesia; Karlstad University: Karlstad, Sweden, 2009. [Google Scholar]
- Mahmoud, M.; Hine, J. Using AHP to measure the perception gap between current and potential users of bus services. Transp. Plan. Technol. 2013, 36, 4–23. [Google Scholar] [CrossRef]
- Noor, H.M.; Foo, J. Determinants of customer satisfaction of service quality: City bus service in Kota Kinabalu, Malaysia. Procedia-Soc. Behav. Sci. 2014, 153, 595–605. [Google Scholar] [CrossRef] [Green Version]
- Lin, B.; Wu, W. Why people want to buy electric vehicle: An empirical study in first-tier cities of China. Energy Policy 2018, 112, 233–241. [Google Scholar] [CrossRef]
- Lieven, T.; Mühlmeier, S.; Henkel, S.; Waller, J.F. Who will buy electric cars? An empirical study in Germany. Transp. Res. Part D Transp. Environ. 2011, 16, 236–243. [Google Scholar] [CrossRef]
- Hidrue, M.K.; Parsons, G.R.; Kempton, W.; Gardner, M.P. Willingness to pay for electric vehicles and their attributes. Resour. Energy Econ. 2011, 33, 686–705. [Google Scholar] [CrossRef] [Green Version]
- Liao, F.; Molin, E.; van Wee, B. Consumer preferences for electric vehicles: A literature review. Transp. Rev. 2017, 37, 252–275. [Google Scholar] [CrossRef] [Green Version]
- Kwon, Y.; Son, S.; Jang, K. User satisfaction with battery electric vehicles in South Korea. Transp. Res. Part D Transp. Environ. 2020, 82, 102306. [Google Scholar] [CrossRef]
- Adheesh, S.R.; Vasisht, M.S.; Ramasesha, S.K. Air-pollution and economics: Diesel bus versus electric bus. Curr. Sci. 2016, 110, 858–862. [Google Scholar]
- Li, X. Energy issue of pure electric vehicle in China. World Electr. Veh. J. 2010, 4, 91–97. [Google Scholar] [CrossRef] [Green Version]
- Kwon, Y.; Kim, S.; Byun, J. Cognitive Perception of an Eco-friendly Public Transportation: Using Principal Component Analysis. J. Korea Inst. Intell. Transp. Syst. 2020, 19, 71–82. [Google Scholar] [CrossRef]
- He, L.; Chen, W.; Conzelmann, G. Impact of vehicle usage on consumer choice of hybrid electric vehicles. Transp. Res. Part D Transp. Environ. 2012, 17, 208–214. [Google Scholar] [CrossRef]
- Button, Q.E. Influence of Exterior Design Attributes on Consumer Preference for Electric Vehicles. Ph.D. Thesis, Oklahoma State University, Stillwater, OK, USA, 2019. [Google Scholar]
- Campbell, D.; Erdem, S. Position bias in best–worst scaling surveys: A case study on trust in institutions. Am. J. Agric. Econ. 2015, 97, 526–545. [Google Scholar] [CrossRef] [Green Version]
- Finn, A.; Louviere, J.J. Determining the appropriate response to evidence of public concern: The case of food safety. J. Public Policy Mark. 1992, 11, 12–25. [Google Scholar] [CrossRef]
- Jaeger, S.R.; Jørgensen, A.S.; Aaslyng, M.D.; Bredie, W.L. Best–worst scaling: An introduction and initial comparison with monadic rating for preference elicitation with food products. Food Qual. Prefer. 2008, 19, 579–588. [Google Scholar] [CrossRef]
- Aizaki, H.; Nakatani, T.; Sato, K. Stated Preference Methods Using R; Chapman and Hall/CRC: Boca Raton, FL, USA, 2014. [Google Scholar]
- Mühlbacher, A.C.; Kaczynski, A.; Zweifel, P.; Johnson, F.R. Experimental measurement of preferences in health and healthcare using best–worst scaling: An overview. Health Econ. Rev. 2016, 6, 2. [Google Scholar] [CrossRef] [Green Version]
- Jeong, G. Public preferences regarding adoption of personal genomic testing based on best–worst scaling. Health Policy Technol. 2018, 7, 358–364. [Google Scholar] [CrossRef]
- Kwon, Y.; Son, S.; Jang, K. Evaluation of incentive policies for electric vehicles: An experimental study on Jeju Island. Transp. Res. Part A Policy Pract. 2018, 116, 404–412. [Google Scholar] [CrossRef]
- Beirão, G.; Cabral, J.S. Market segmentation analysis using attitudes toward transportation: Exploring the differences between men and women. Transp. Res. Rec. 2008, 2067, 56–64. [Google Scholar] [CrossRef]
- Namgung, M.; Akar, G. Role of gender and attitudes on public transportation use. Transp. Res. Rec. 2014, 2415, 136–144. [Google Scholar] [CrossRef]
- She, Z.Y.; Sun, Q.; Ma, J.J.; Xie, B.C. What are the barriers to wide-spread adoption of battery electric vehicles? A survey of public perception in Tianjin, China. Transp. Policy 2017, 56, 29–40. [Google Scholar] [CrossRef]
- Egbue, O.; Long, S. Barriers to wide-spread adoption of electric vehicles: An analysis of consumer attitudes and perceptions. Energy Policy 2012, 48, 717–729. [Google Scholar] [CrossRef]
- Cao, J.; Cao, X.; Zhang, C.; Huang, X. The gaps in satisfaction with transit services among BRT, metro, and bus riders: Evidence from Guangzhou. J. Transp. Land Use 2016, 9, 97–109. [Google Scholar] [CrossRef] [Green Version]
- Tyrinopoulos, Y.; Antoniou, C. Public transit user satisfaction: Variability and policy implications. Transp. Policy 2008, 15, 260–272. [Google Scholar] [CrossRef]
- Dixon, L.; Porche, I.; Kulick, J. Driving Emissions to Zero. Are the Benefits of California’s Zero Emission Vehicle Program Worth the Costs? Rand Corp Santa Monica Ca: Santa Monica, CA, USA, 2002. [Google Scholar]
- Kim, K.H.; Park, S.; Park, S.; Yun, I. Study of the WTP Estimation for Introduction of Medium-sized Low Floor Electric Bus. J. Korea Inst. Intell. Transp. Syst. 2018, 17, 17–30. [Google Scholar] [CrossRef]
- Van Hai, H.; Mai, N.P. Environmental Awareness and Attitude towards green purchasing of Vietnamese Consumers. VNU J. Econ. Bus. 2012, 29, 129–141. [Google Scholar]
- Kane, K.; Chiru, C.; Ciuchete, S.G. Exploring the eco-attitudes and buying behaviour of Facebook users. Amfiteatru Econ. 2012, 31, 157–171. [Google Scholar]
- Koushki, P.A.; Ali, M.A.; Chandrasekhar, B.P.; Al-Sarawi, M. Exposure to noise inside transit buses in Kuwait: Measurements and passenger attitudes. Transp. Rev. 2002, 22, 295–308. [Google Scholar] [CrossRef]
- Lennström, D.; Ågren, A.; Nykänen, A. Sound quality evaluation of electric cars–preferences and influence of the test environment. In Proceedings of the Aachen Acoustics Colloquium, Aachen, Germany, 24–25 November 2011; pp. 95–100. [Google Scholar]
- Knez, M.; Jereb, B.; Obrecht, M. Factors influencing the purchasing decisions of low emission cars: A study of Slovenia. Transp. Res. Part D Transp. Environ. 2014, 30, 53–61. [Google Scholar] [CrossRef]
- Ziefle, M.; Beul-Leusmann, S.; Kasugai, K.; Schwalm, M. Public perception and acceptance of electric vehicles: Exploring users’ perceived benefits and drawbacks. In International Conference of Design, User Experience, and Usability; Springer: Cham, Germany, 2014; pp. 628–639. [Google Scholar]
Figure 1.
Comparison of standardized BW score by gender.


Table 1.
Definitions of electrified bus attributes.
| Attributes | Definition | Reference | |
|---|---|---|---|
| Attributes characterizing electrified buses | Safety | Safety of travel (from getting on to off) | Hidrue et al., 2011 |
| Ride comfort | Comfort about vibration and noise during departure/drive/stop | Lin & Wu, 2018 | |
| Environmental friendliness | Diminishment of emission occurring by operation of electrified bus | Li, 2010 | |
| Exterior design | Exterior design of electrified bus as differentiated from that of conventional bus | Kwon et al., 2019 | |
| Basic bus service attributes | Cleanliness | Cleanliness of indoor of the electrified bus | Stradling et al., 2007; Eboli & Mazzulla, 2007; Budiono, 2009 |
| Crowding | Indoor-crowding caused by bus passengers | ||
| Seat Comfort | Seat comfort of bus | ||
| Convenience of getting on/off | Convenience during getting on and off process | Mahmoud & Hine, 2013 | |
Table 2.
Orthogonal main effect design for best-worst scaling survey.
| Item | A | B | C | D | E | F | G | H | |
|---|---|---|---|---|---|---|---|---|---|
| Choice Set | |||||||||
| 1 | ✓ | ✓ | ✓ | ✓ | |||||
| 2 | ✓ | ✓ | ✓ | ✓ | |||||
| 3 | ✓ | ✓ | ✓ | ✓ | |||||
| 4 | ✓ | ✓ | ✓ | ✓ | ✓ | ||||
| 5 | ✓ | ✓ | ✓ | ✓ | |||||
| 6 | ✓ | ✓ | |||||||
| 7 | ✓ | ✓ | ✓ | ✓ | ✓ | ✓ | ✓ | ✓ | |
| 8 | ✓ | ✓ | ✓ | ||||||
| 9 | ✓ | ✓ | ✓ | ✓ | |||||
| 10 | ✓ | ✓ | ✓ | ||||||
| 11 | ✓ | ✓ | ✓ | ✓ | |||||
| 12 | ✓ | ✓ | ✓ | ||||||
Table 3.
Summary of survey questionnaire.
| Part | Detail Items | ||
|---|---|---|---|
| [Part 1] Demographic | Gender, Age, Household Income, Job, Transit Mode, Etc. | ||
| [Part 2] BWS questions (12 items) | (Example) Please check from the following items those that you think are the most or the least important in the introduction of electrified buses:
| ||
| Most important | Items (Attributes) | Least important | |
| Ride comfort | |||
| Seat comfort | ✓ | ||
| Environment friendly | |||
| ✓ | Safety | ||
Table 4.
Characteristics of samples.
| Sample Attributes | (%) | Sample Attributes | (%) | ||
|---|---|---|---|---|---|
| Sample size | 586 | Electric Bus Experience | Yes | 31.5 | |
| Gender | Male | 50.4 | No | 68.5 | |
| Female | 49.6 | Mode | Bus | 40.6 | |
| Age | Under 30 | 19.2 | Passenger Vehicle | 29.4 | |
| 30–39 | 18.9 | Subway | 21.0 | ||
| 40–49 | 21.7 | Walking | 7.7 | ||
| 50–59 | 19.7 | Etc. | 1.3 | ||
| 60 and over | 20.4 | Job | Office work | 37.7 | |
| Monthly Household Income (USD) | Under 2000 | 9.8 | Service | 8.6 | |
| 2000~2999 | 18.6 | Self-employed | 8.3 | ||
| 3000~3999 | 15.0 | Specialized job | 9.8 | ||
| 4000~4999 | 17.8 | Housewife | 13.7 | ||
| Over 5000 | 38.8 | Etc. | 21.9 | ||
Table 5.
Best-worst scaling scores (counting approach).
| Attributes (N = 586) | Best (B) | Worst (W) | B-W | std.BW | std.sq.BW |
|---|---|---|---|---|---|
| 2618 | 387 | 2231 | 0.635 | 1.000 |
| 1277 | 647 | 630 | 0.179 | 0.540 |
| 1111 | 330 | 781 | 0.222 | 0.705 |
| 198 | 493 | −295 | −0.084 | 0.244 |
| 444 | 1149 | −705 | −0.200 | 0.239 |
| 52 | 2375 | −2323 | −0.661 | 0.057 |
| 266 | 544 | −278 | −0.079 | 0.269 |
| 487 | 528 | −41 | −0.012 | 0.369 |
Table 6.
Conditional logit model-based best-worst scaling scores (modeling approach).
| Attributes (N = 586) | Coefficient | Se(Coef) | p-Value | Rank | Shares |
|---|---|---|---|---|---|
| 3.121 | 0.048 | 0.000 *** | 1 | 41.252 |
| 2.008 | 0.043 | 0.000 *** | 3 | 13.558 |
| 2.059 | 0.044 | 0.000 *** | 2 | 14.274 |
| 1.359 | 0.044 | 0.000 *** | 6 | 7.087 |
| 1.168 | 0.041 | 0.000 *** | 7 | 5.855 |
| 0.000 | - | - | 8 | 1.821 |
| 1.387 | 0.044 | 0.000 *** | 5 | 7.286 |
| 1.583 | 0.042 | 0.000 *** | 4 | 8.867 |
Note: *** Significant at 0.01 level.
Table 7.
Comparison of best-worst scaling scores by gender.
| Attributes | Male (N = 297) | Female (N = 289) | ||||
|---|---|---|---|---|---|---|
| Std.BW | Shares | Rank | Std.BW | Shares | Rank | |
| 0.592 | 37.447 | 1 | 0.678 | 45.731 | 1 |
| 0.203 | 15.089 | 2 | 0.155 | 11.878 | 3 |
| 0.191 | 13.879 | 3 | 0.254 | 14.587 | 2 |
| −0.083 | 7.655 | 6 | −0.085 | 6.373 | 6 |
| −0.190 | 6.492 | 7 | −0.211 | 5.124 | 7 |
| −0.614 | 2.343 | 8 | −0.709 | 1.336 | 8 |
| −0.073 | 7.971 | 5 | −0.085 | 6.480 | 5 |
| −0.026 | 9.124 | 4 | 0.003 | 8.470 | 4 |
© 2020 by the authors. Licensee MDPI, Basel, Switzerland. This article is an open access article distributed under the terms and conditions of the Creative Commons Attribution (CC BY) license (http://creativecommons.org/licenses/by/4.0/).
Share and Cite
MDPI and ACS Style
Kwon, Y.; Kim, S.; Kim, H.; Byun, J. What Attributes Do Passengers Value in Electrified Buses? Energies 2020, 13, 2646. https://doi.org/10.3390/en13102646
AMA Style
Kwon Y, Kim S, Kim H, Byun J. What Attributes Do Passengers Value in Electrified Buses? Energies. 2020; 13(10):2646. https://doi.org/10.3390/en13102646
Chicago/Turabian StyleKwon, Yeongmin, Suji Kim, Hyungjoo Kim, and Jihye Byun. 2020. "What Attributes Do Passengers Value in Electrified Buses?" Energies 13, no. 10: 2646. https://doi.org/10.3390/en13102646
Note that from the first issue of 2016, this journal uses article numbers instead of page numbers. See further details here.