Sustainable Solutions for Green Financing and Investment in Renewable Energy Projects


1
Tokai University, Hiratsuka, Kanagawa 259-1292, Japan
2
Asian Development Bank Institute, Chiyoda-ku, Tokyo 100-6008, Japan
3
Faculty of Economics, Keio University, Minato-ku, Tokyo 108-8345, Japan
*
Author to whom correspondence should be addressed.
Energies 2020, 13(4), 788; https://doi.org/10.3390/en13040788
Submission received: 21 August 2019
/
Revised: 30 December 2019
/
Accepted: 6 February 2020
/
Published: 11 February 2020
(This article belongs to the Collection Energy Economics and Policy in Developed Countries)
Abstract
:The lack of long-term financing, the low rate of return, the existence of various risks, and the lack of capacity of market players are major challenges for the development of green energy projects. This paper aimed to highlight the challenges of green financing and investment in renewable energy projects and to provide practical solutions for filling the green financing gap. Practical solutions include increasing the role of public financial institutions and non-banking financial institutions (pension funds and insurance companies) in long-term green investments, utilizing the spillover tax to increase the rate of return of green projects, developing green credit guarantee schemes to reduce the credit risk, establishing community-based trust funds, and addressing green investment risks via financial and policy de-risking. The paper also provides a practical example of the implementation of the proposed tools.
1. Introduction
In 2017 and 2018, the global investments (net capital flows) in renewable energy and energy efficiency projects reduced by 1% and 3%, respectively, and there is a risk that they will decrease even more [1]. This could threaten the achievements of the Sustainable Development Goals (SDGs) and the Paris Agreement for climate change. One reason behind the slowed development of green projects is difficulties in accessing private finance. The future of clean energy no longer concerns science and technology; it is all about access to finance [2]. People consider green energy projects, like other energy projects, as infrastructural projects. Infrastructural projects are capital-intensive and long-term projects. According to the Asian Development Bank [3], in developing Asia alone, there is a gap of $26 trillion investment from 2016 to 2030, or $1.7 trillion per year, if the region is to maintain its growth momentum, eradicate poverty, and respond to climate change (climate-adjusted estimate). Of the total climate-adjusted investment needs over the period 2016–2030, the largest share, or $14.7 trillion, will be for energy (power).
There are two major barriers associated with green energy projects: (a) a lower rate of return compared to fossil fuel projects and (b) a higher risk of investment compared to fossil fuel projects (see [4]). Due to the associated risk and due to the Basel capital requirements, many banks are reluctant to finance green energy projects. Another reason why debt finance is hard to secure for new green energy projects is that, historically, regulated utility rates spread risks in utilities across consumers. However, the lack of purchasing power agreements (PPAs), especially in less developed countries, generates uncertainty about the tariff and increases the risk of investment. The third reason behind the uncertainty that has shrunk the new investment in the renewable energy sector is rapid technological progress and cost reduction. Thanks to the technological progress, costs of renewable energy technologies reduced drastically. For example, solar PV module prices have reduced by around 80% since the end of 2009 and wind turbine prices have dropped by 30–40%. Although this is good news on one side, it prompts investors to pause to see how much the prices will drop on the other side.
All in all, it is important to take the necessary steps for mitigating the risks of green financing to unlock the participation of financial institutions in these projects [4]. One solution is to incentivize non-banking financial institutions (NBFIs), such as pension funds or insurance companies, to engage in green energy projects. The advantages of pension funds and insurance companies over banks are that these institutions pursue asset-liability matching and their resources are long-term (10, 20, or 40 years). Insurance companies or pension funds can finance infrastructure projects, including large green energy projects such as large hydropower, as they are long-term projects (10–20 years). Therefore, it is very important to develop pension funds and insurance companies in developing countries to fill the financing gap of infrastructure projects, including energy and green energy projects [4].
A good example of the role of non-banking financial institutions in unlocking green investment comes from Australia. The Powering Australian Renewables Fund (PARF) is a financing initiative that AGL Energy of Australia created and has $2-3 billion funds targeting to unlock the investments in large-scale renewable energy projects by diversifying the risks and reducing the financing costs. A partnership with the Queensland Investment Corporation (QIC) established the fund in 2016 on behalf of its clients, the Future Fund and those investing in the QIC Global Infrastructure Fund. The target is to accelerate Australia’s transition to a low-carbon economy with the potential to meet 10% of the Federal Government’s Renewable Energy Target (RET).
One point that is important to consider is that public financial institutions, including green banks [5], need to crowd in private investment. This means that the government needs to be the investor of last resort, which involves investing in green projects when there is an urgent need for them and the private sector is not showing eagerness to invest. As for the role of the government, one important issue is political incentive when there is a conflict in terms of the election horizon and the maturity of green projects, which are often long-term. To overcome this problem, [6] proposed the establishment of a regional network, namely the European Sustainable Banking Network (EU SBN) for Europe. The [6] proposal consisted of three major actions: (1) green certification of private and public financial institutions, (2) sustainability rating of project proposals, and (3) systematic monitoring of the performance of banks and the financed investment projects. This means that, despite changing governments, this network will continue to carry out the activities and its mission.
A method that this paper will present is the introduction of green credit guarantee schemes (GCGSs), which [7] developed and introduced, to reduce the risk of financing. It is also important for banks to have specific programs for a precautionary approach to green lending, as well as compliance and risk management, which this paper will highlight.
Our paper contributes to the literature by providing innovative solutions for unlocking green finance and investment from banks and NBFIs. These solutions will help financial institutions to minimize and manage the risk of green financing. They include developing green credit guarantee schemes for reducing the financial risk, utilizing community-based trust funds, introducing insurance mechanisms and de-risking to cover non-financial risks, and using the spillover tax to increase the rate of return on green projects.
The structure of the paper is as follows. In Section 2, we highlight the challenges of developing green projects. Section 3 focuses on introducing and analyzing the enabling conditions for green financing. Section 4 provides an example of the implementation of the proposed tools and instruments, and Section 5 delivers concluding remarks and outlines the policy implications.
2. Challenges for Development of Green Projects
This section highlights the challenges for the development of green projects.
2.1. Lack of Long-Term Financing
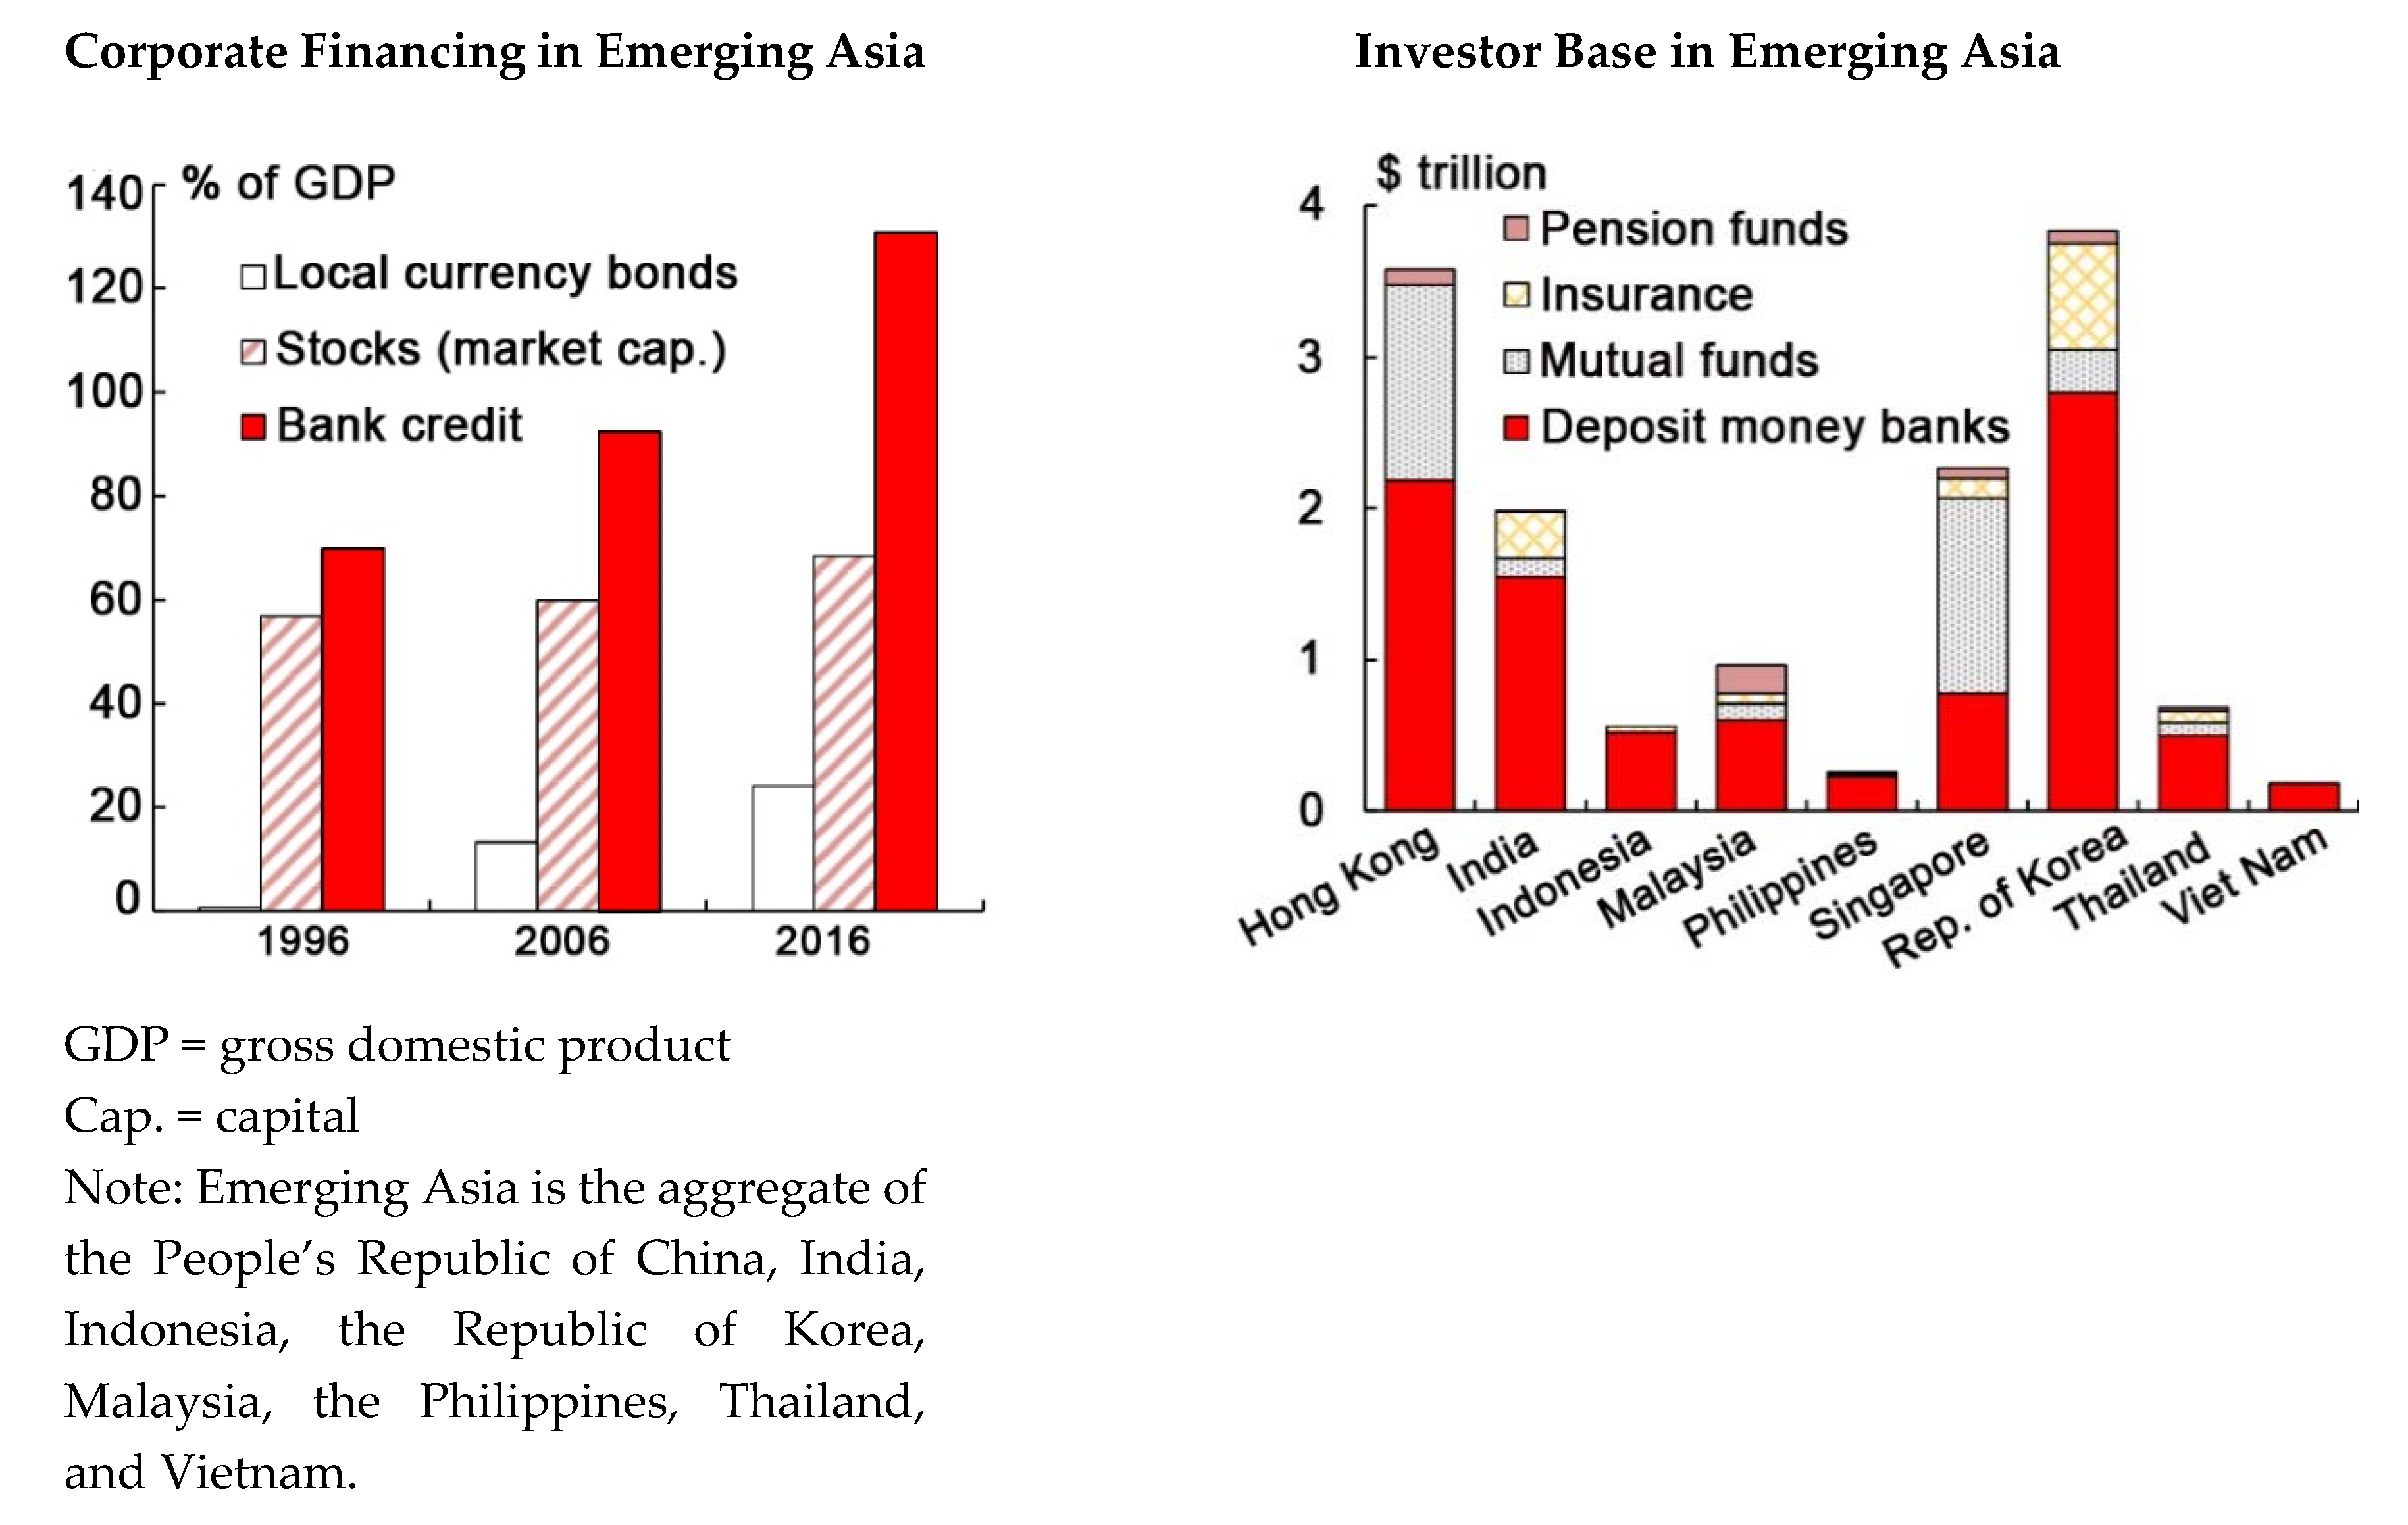
Large-scale green energy projects, such as hydro-power or large solar farms, are long-term projects; hence, they need long-term financing. A shortage of long-term financing hinders the progress of green development. Banks still dominate Asian economies, and the banking sector constrains long-term finance. The development of public financial institutions (PFIs) that provide long-term financing or the development of pension funds and insurance companies are major solutions for filling the long-term financing and investment gap. [8] by analyzing the state investment banks (SIBs) in Australia, the UK, and Germany, found that SIBs take a broader role than capital provision and de-risking to mobilize finance. SIBs have an educational role to enable financial sector learning. The authors showed that SIBs signal trust and produce track records to crowd in private finance.
Figure 1 shows the structure of financial markets in selected Asian countries. Banks dominate the financial systems in Asia. Banks’ resources are deposits, and deposits are short to medium term. On the other hand, infrastructure projects and energy projects are long-term. A maturity mismatch arises if banks’ resources are allocated to financing long-term projects.
2.2. Existence of Various Risks
As most green energy technologies are new, there are several associated risks [10]. From mechanical breakdowns of wind power generator gearboxes to breakages of the panels of photovoltaic projects, the potential losses can reach millions of dollars, with major damage interrupting projects and businesses. This is not the whole story, however, as other risks accompany these projects—especially the weather. Most green energy projects depend on the climate and sunlight. The unpredictability of the weather, such as clouds that reduce the sun’s irradiation or changes in wind strength, can have a significant negative impact on energy production and affect the feasibility of these projects. In addition, as many equipment for green projects are high-tech, it is expensive, creating risks regarding the feasibility. In order to identify and assess the diverse risks in green residential buildings that use green technologies, Ref. [11] conducted a survey of 30 construction companies in Singapore. Their survey results and study indicated that the top five critical risks in green residential building construction projects are: “complex procedures to obtain approvals”, “overlooked high initial cost”, “unclear requirements of owners”, “employment constraint”, and “lack of availability of green materials and equipment”.
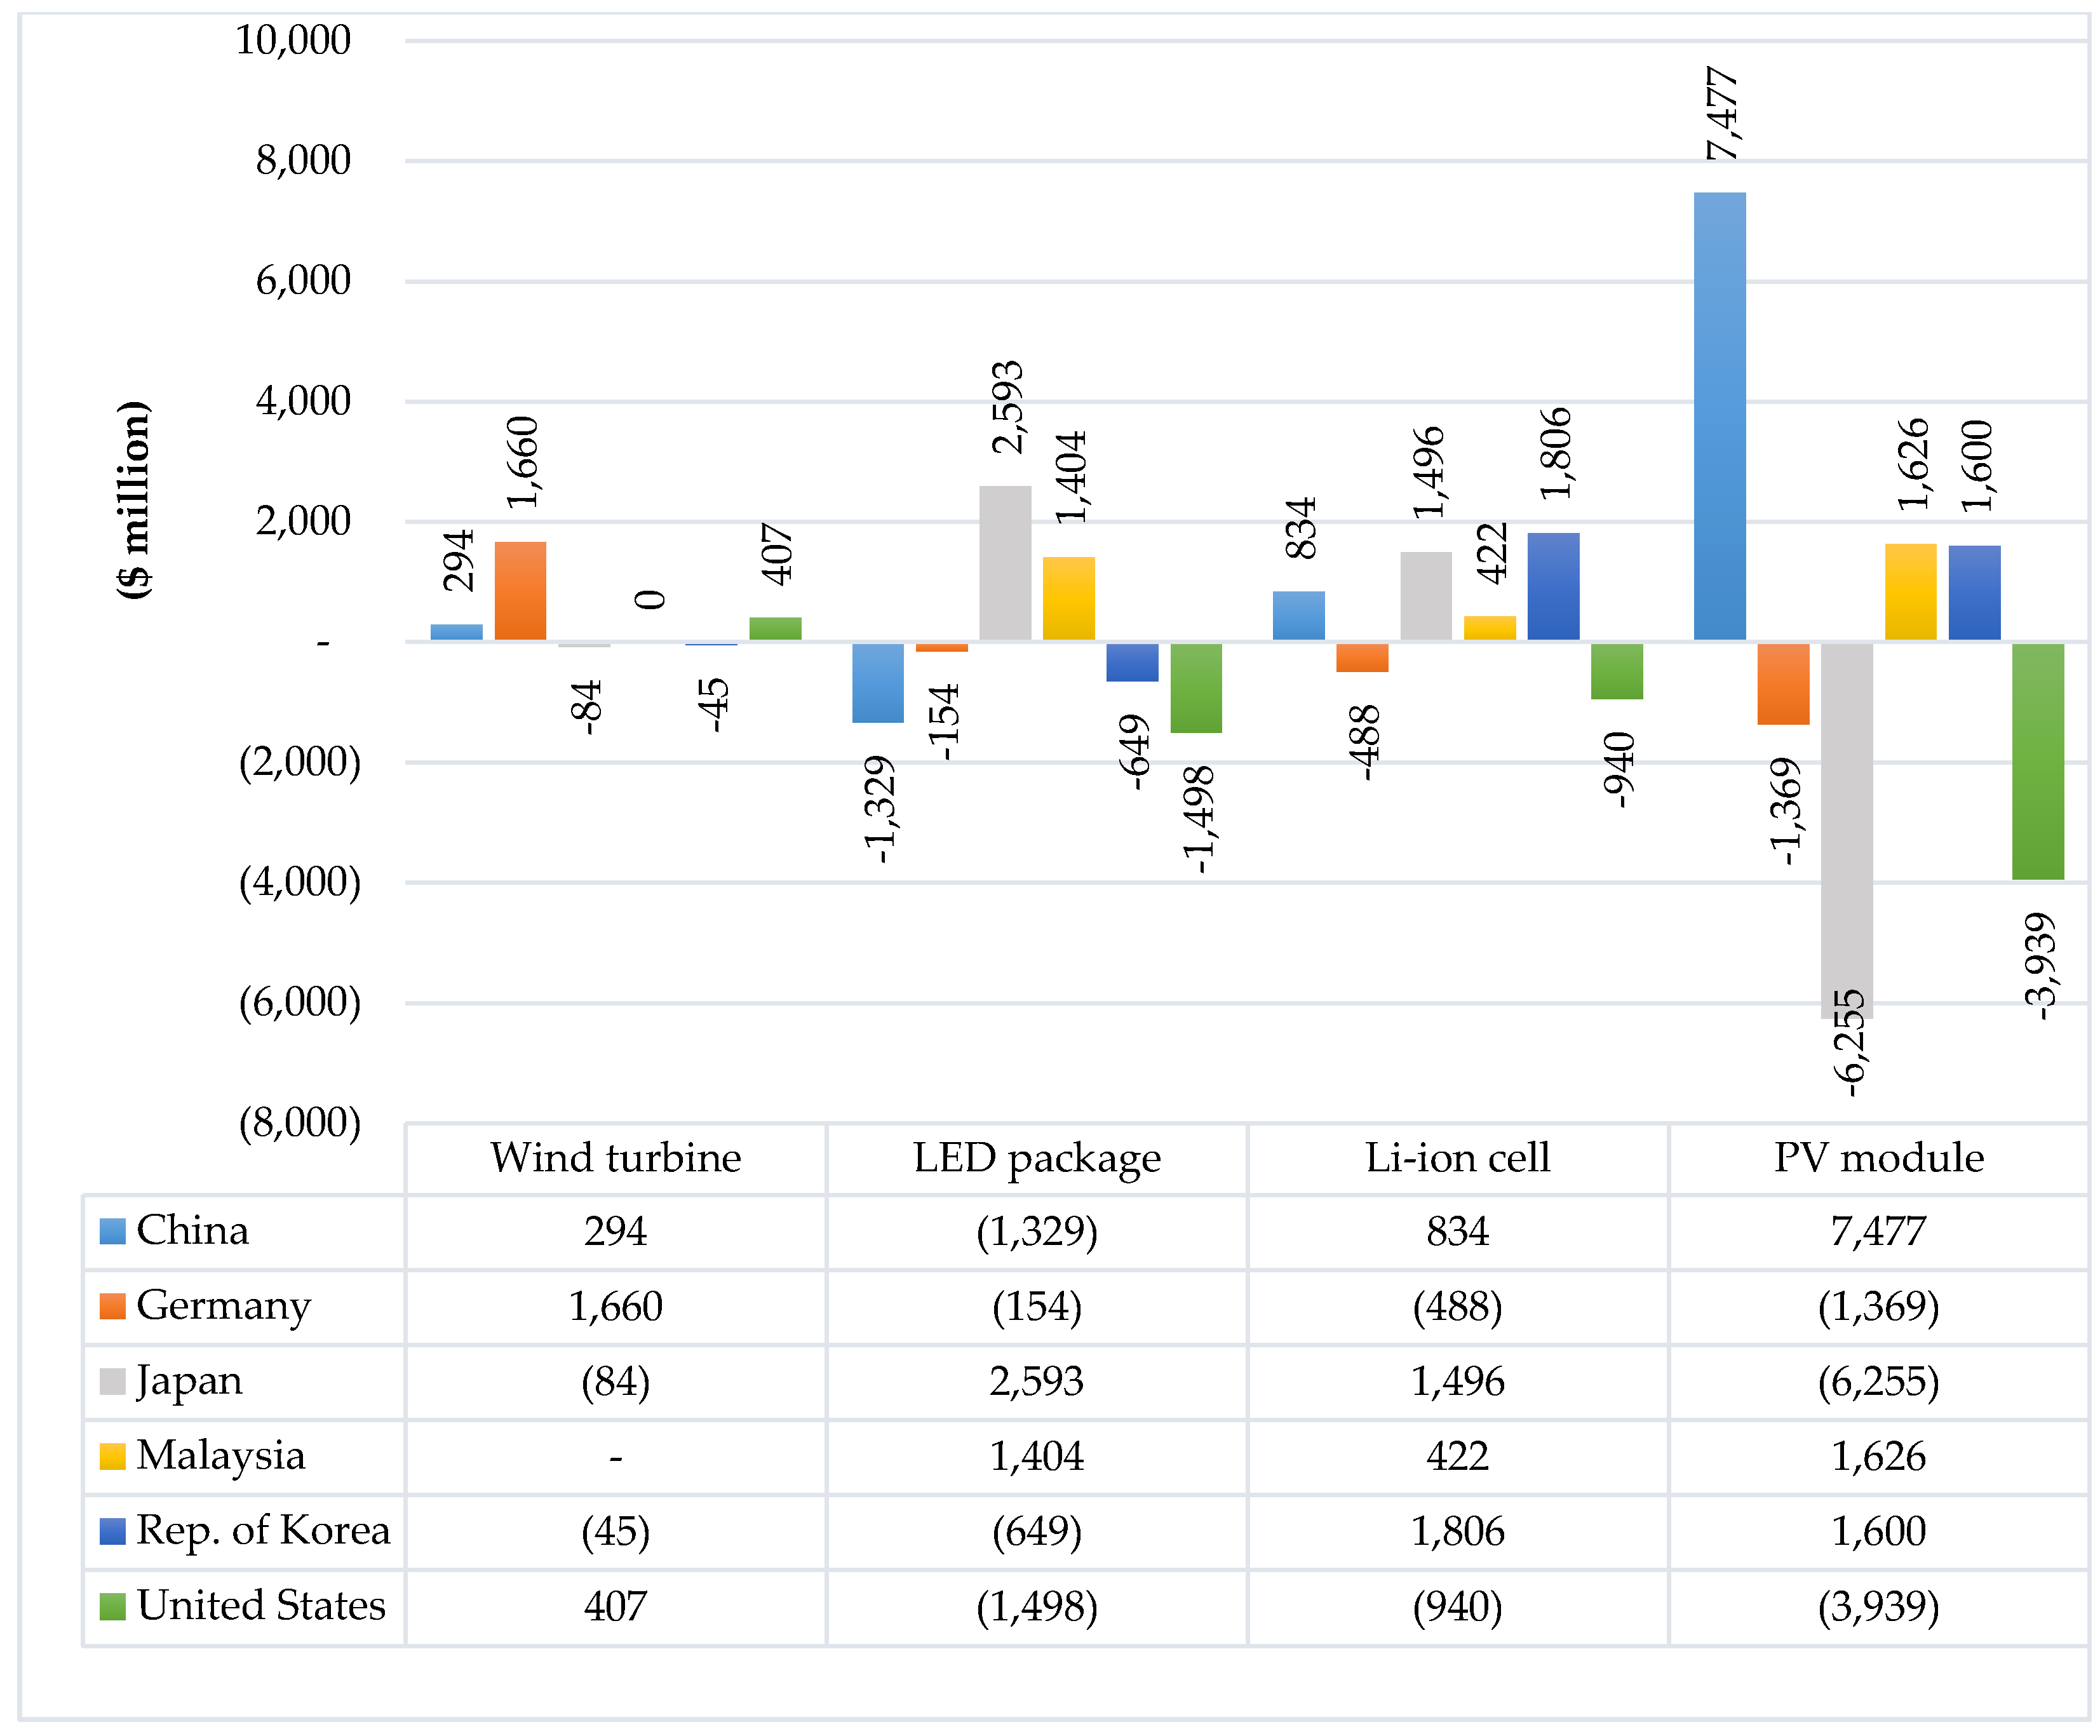
In addition to the aforementioned risks, the manufacturing of green technologies depends on cross-country supply chains and trade. Economies that are net importers of final products may be major exporters of materials or subcomponents for the same technologies. Hence, the exchange rate is another risk for green technologies.
Figure 2 shows the balance of trade for the four major clean energy technologies. Crystalline silicon (c-Si) photovoltaic (PV) and LED packages are the most heavily traded, perhaps because they are easier to ship than the other end products. The balance of trade is not the full story, however. While major PV deployment markets, such as the United States and Germany, are net importers of PV modules, they are also the largest exporters of polysilicon to make those modules, which Japan and the People’s Republic of China largely purchase.
Green projects also involve other associated risks. Some of them are project-specific (demand risk) and some are general (e.g., natural disaster and political risks).
2.3. Low Rate of Return and Lack of Capacity among Market Players
Green technologies are often earlier in the development stage and less commercially viable than technologies in the fossil fuel field, many of which date back 100 years. This makes green technologies more expensive and riskier. A lack of access to conventional financing sources increases the debt cost (borrowing interest rate). New and expensive green technologies and access to expensive debt markets reduce the rate of return in green projects compared with fossil fuel projects. On the other hand, the majority of energy subsidies globally supports fossil fuels rather than the green sector.
Longstanding subsidies for fossil fuels, combined with the lack of a price for carbon emissions, have favored fossil fuels, like oil and coal [13]. In 2015, both consumers and producers of fossil fuels received about $425 billion in subsidies globally—via direct payments, tax breaks, loan guarantees, cheap rental of public land, and research and development (R&D) grants [14]. According to the Organisation for Economic Co-operation and Development [15], almost 800 individual policies support the production or consumption of fossil fuels. According to [16], estimated fossil fuel subsidies were $4.9 trillion worldwide in 2013 and $5.3 trillion in 2015 (6.5% of global gross domestic product (GDP) in both years). Another form of subsidy, an indirect one, takes place when governments do not tax fossil fuel companies efficiently [16]. This means that the price that consumers pay for coal, gas, or oil does not consider the damage that these products cause, such as climate change or air pollution, making green projects less viable than fossil fuel energy projects. Targeting the subsidies and allocating them to the low-carbon sector will increase the rate of return of these projects and make them interesting to private investors.
On the other hand, another challenge is the lack of capacity for and information about green technologies among the market players (governments, investors, and financial institutions). Moreover, the lack of green data and green databases is an obstacle to the development of these projects. Lack of borrowers’ green and environmental information limits banks’ abilities to assess the environmental risks involved in project and corporate finance [17]. In this regard, establishment of a centralized database at the industry level would enable the lenders to assess the business and market risks related to the environment.
3. Enabling Conditions of Green Finance
To overcome the challenges mentioned in Section 2, this section provides practical solutions to create enabling conditions for green finance.
3.1. Increasing the Role of PFIs
The first and most important challenge for financing green projects is the lack of access to long-term finance and investment (Section 2.1). PFIs, or publicly created and/or mandated financial institutions, could be important entities for filling the financing gap in the green sector. For example, five PFIs in Europe—France’s Caisse des Dépôts Group, Germany’s KfW Bankengruppe, the United Kingdom’s Green Investment Bank, the European Bank for Reconstruction and Development for transition economies, and the European Investment Bank—provided more than €100 billion in equity investment and financing for energy efficiency, renewable energy, and sustainable transport projects during the period 2010–2012 [18].
It is important for PFIs to open a separate file for green financing. They also need to integrate environmental considerations into conventional project financing. For example, the Japan Bank for International Cooperation (JBIC) launched GREEN operations in 2010, using measurement, reporting, and verification (J-MRV) as a method to evaluate the greenhouse gas emission reductions of the projects that it finances. Along with the basic concept and procedures for quantifying the reductions, the J-MRV guidelines include individual methodologies for each sector of the project and/or technology, varying from renewable energy to transport. When the GREEN operations began, J-MRV had only three methodologies for the projects that were most in demand, including renewable energy and the installation of energy-efficient industrial equipment. However, the JBIC gradually developed new methodologies, increasing to 10 in 2016 [19].
Although the role of PFIs could be very important, some important points need to be considered regarding the involvement of PFIs in green financing. The first point is that they need to focus more on long-term financing (long-term loans) than commercial private banks, the resources (deposits) of which are short-term (one, two, or three years). Private banks are not able to provide long-term loans, so the maturity of PFI loans has to be longer than that of private banks. The second point is to set a stable and fixed interest rate that is lower than that of private banks, the interest rates of which often fluctuate, since green projects need a stable and fixed interest rate for steady growth. Private banks have to pay taxes and set up branch offices, so they have more costs than governments, which translate into higher interest rates than those of PFIs. The third point is to mitigate the negative effects of government lending through PFIs by limiting the government’s role as a lender. This implies offering PFI loans only when private banks cannot provide loans and avoiding the crowding-out effect on private banks. A successful case in this regard is the German KfW, in which the government funding with low interest rates passes through private banks to green projects, housing, small and medium-sized enterprises (SMEs), and so on rather than via direct lending from the government to projects. Accessing funds with lower interest rates is crucial for the development of the green sector. [20] examined 133 representative utility-scale photovoltaic and onshore wind projects in Germany over the last 18 years. Their empirical results revealed that the financing conditions have strongly improved. As drivers, they identified the macroeconomic conditions (the general interest rate) and experience effects within the renewable energy finance industry.
3.2. Increasing the Share of NBFIs in Long-Term Investments
Just in institutions in OECD countries, investors are managing more than $100 trillion of assets. An increasing number of institutional investors have adopted strategies to mitigate climate exposure. These include negative screening (the exclusion of non-green sectors/companies from portfolios), positive screening (the proactive identification of positive climate themes), active ownership (the exercising of statutory rights to promote green standards in portfolio companies), sustainability ratings (portfolio scoring based on green criteria), and the hedging of climate risks (through portfolio allocation or the use of derivatives). These strategies reflect specific fund manager mandates and the recognition that climate risks can have a tangible impact on corporate valuations and, as a result, institutional fund performance [21]. Most recently, it has become apparent that two major pressures from investors and regulators can also boost the participation of institutional investors in green projects. On the side of investors, environmentally friendly green concerns increasingly affect people’s saving and investment decisions. This trend is happening especially among the younger generations. Savers with NBFIs are asking for stricter compliance with environmental, social, and governance criteria.
On the side of regulators, some jurisdictions are debating whether financial institutions should have a mandate to integrate environmental, social, and governance issues into their investment decision policies. One example is the Financial Stability Board’s creation of the Task Force on Climate-Related Financial Disclosures, which has recommended that global organizations enhance their financial disclosures related to the potential effects of climate change [21].
However, when we look at the actual activities of institutional investors, their asset allocation to direct infrastructure investment in general remains small—less than 1% for OECD pension funds—and the “green” investment components are even more limited. These issues relate to the perception that green investments do not offer a sufficiently attractive risk-adjusted financial return and the fact that institutional investors still lack knowledge and expertise, as well as investment channels [22]. Using the spillover effect of the green energy supply and reducing the risk of their investment through GCGSs will increase their eagerness to engage in green projects (Section 3.3 and Section 3.4).
3.3. Using Spillover Tax to Increase the Rate of Return
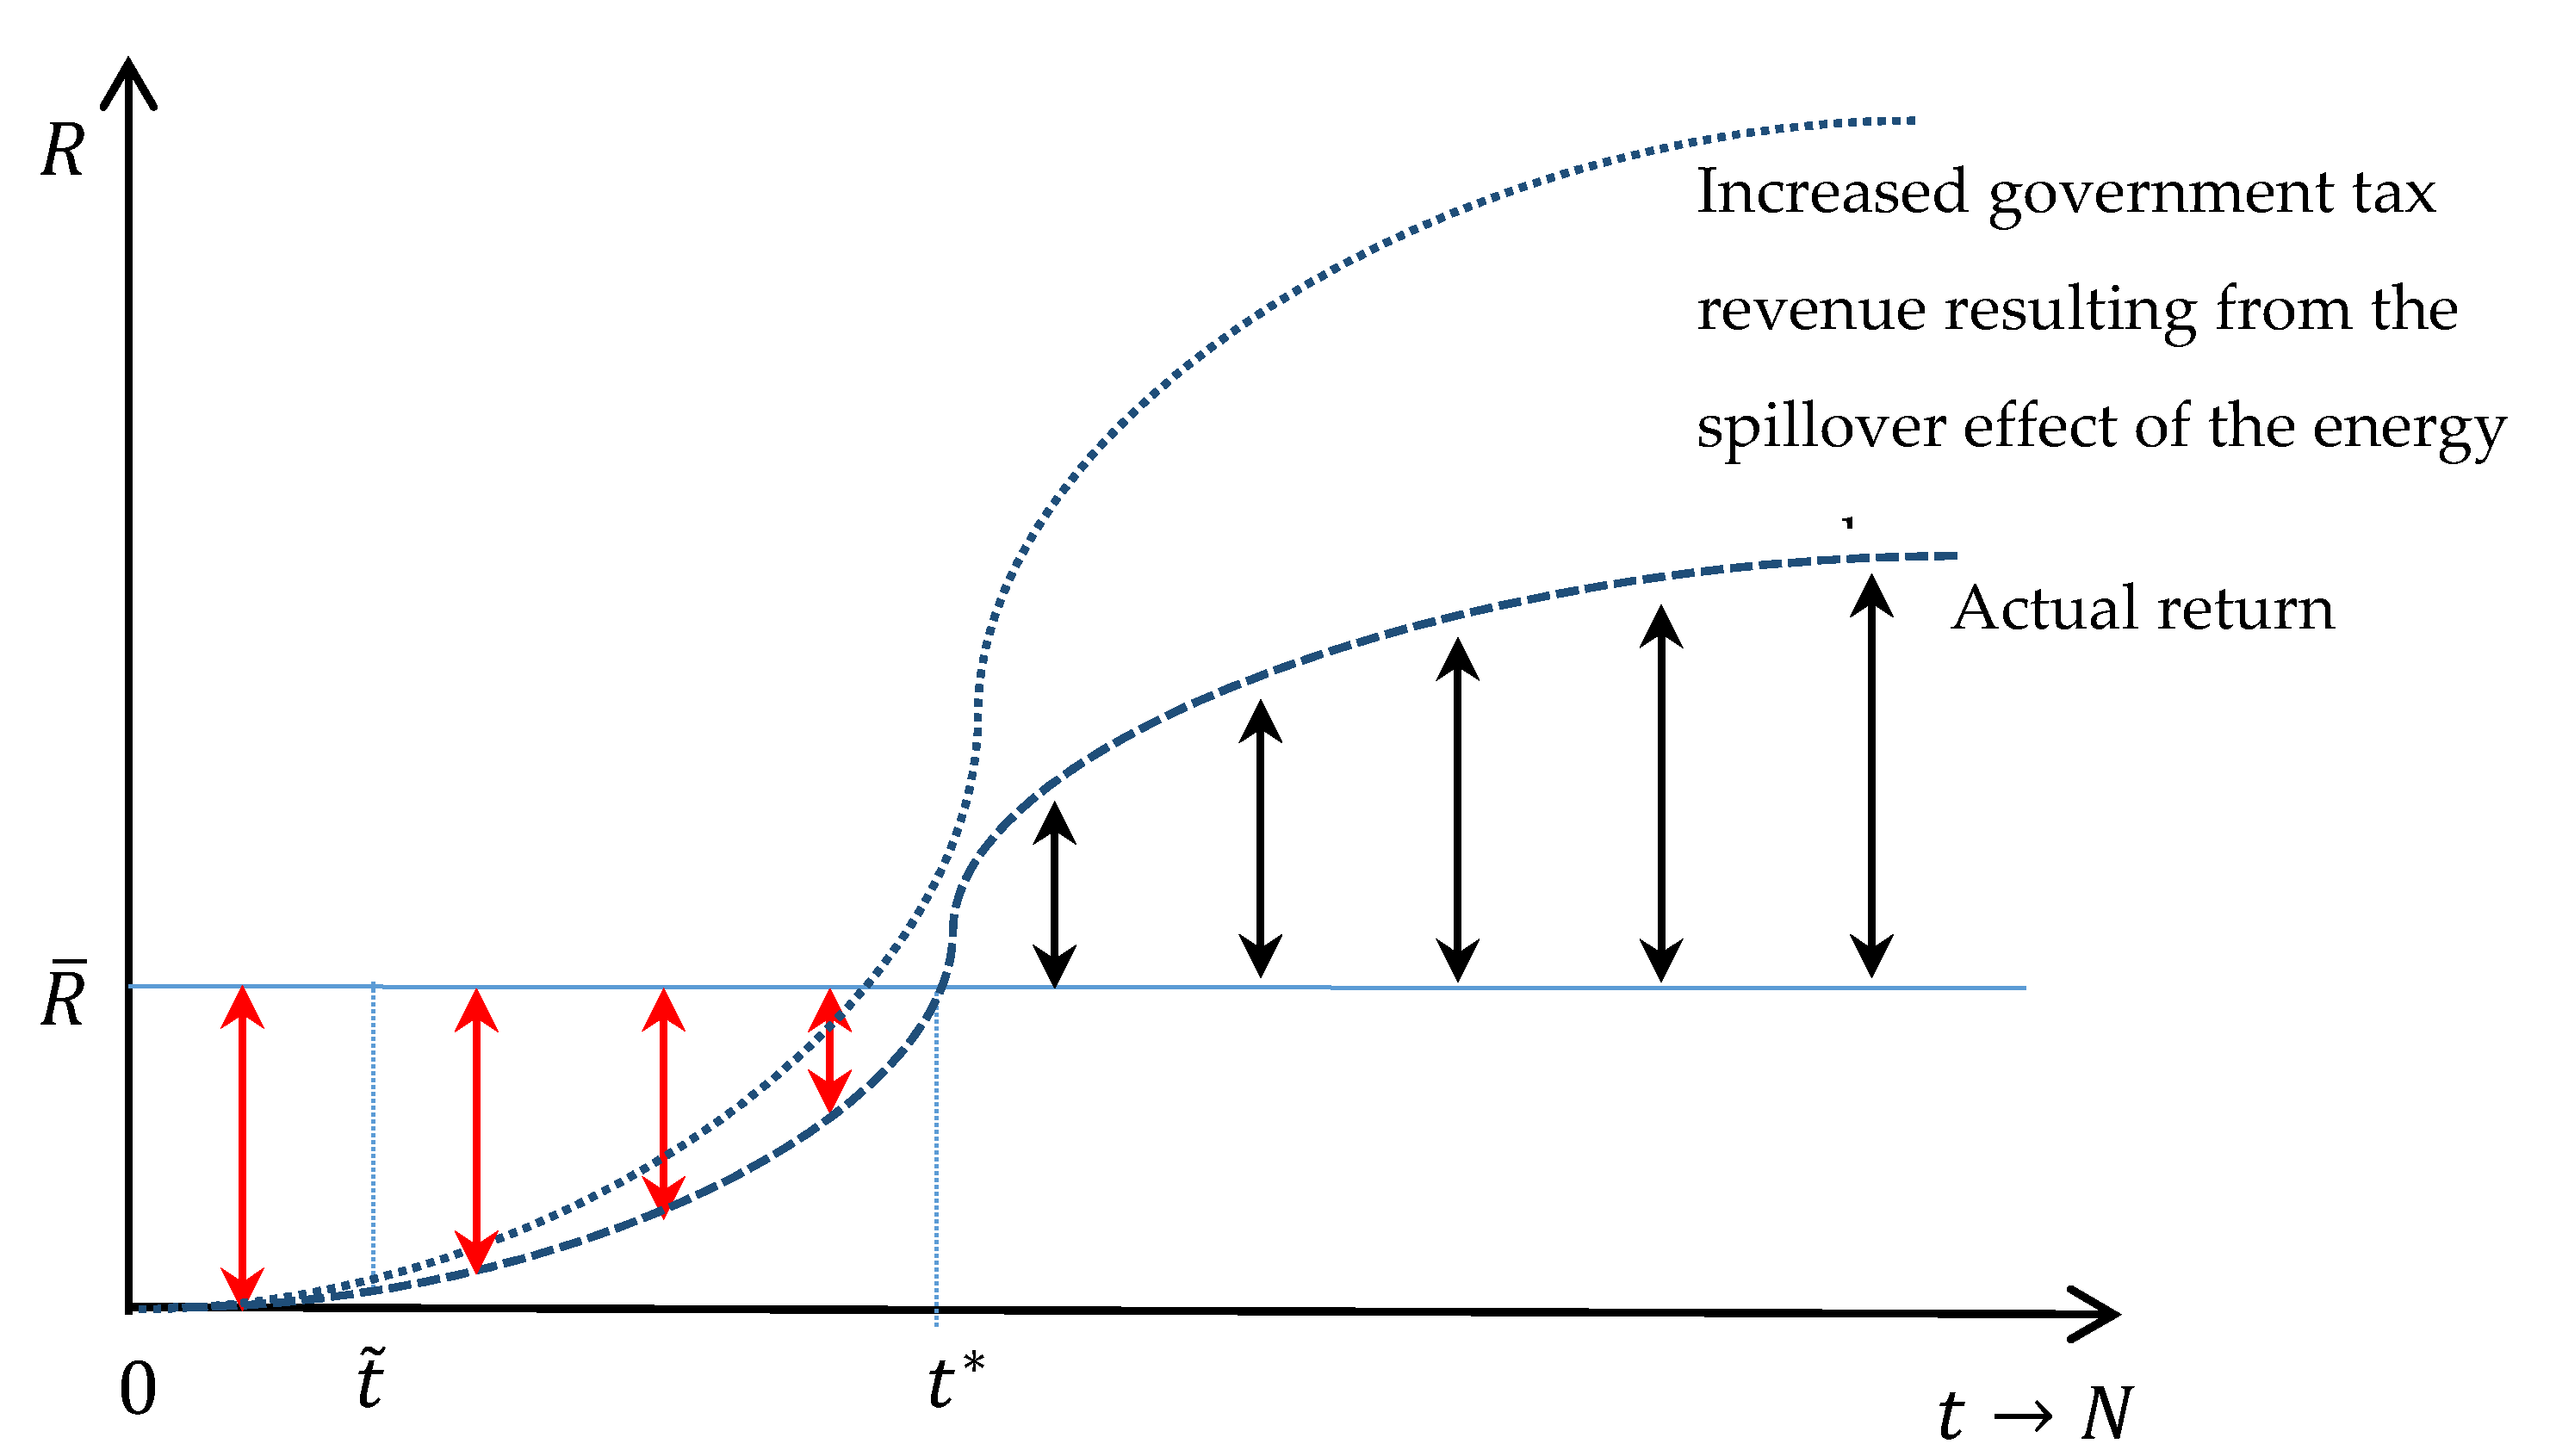
Governments often regulate electricity tariffs and usually do not determine them based on market mechanisms. Regulated tariffs make it difficult for private investors to invest in infrastructure projects because of the low rate of return on their investments. Increasing investment incentives requires the use of the spillover effects that energy supplies originally created and refunding the spillover tax revenues to investors in energy projects. The energy supply brings factories and businesses into the electrified region. The power supply enables the construction of new residences, and the property value increases. Corporate income taxes and sales taxes also rise in areas with a new energy supply. Local or central governments collect these spillover tax revenues, and they do not usually return them to investors in energy projects. Investors only receive the user charges/electricity tariffs accruing from the electricity supply. If part of the spillover tax revenues was returned to private investors, their rate of return would increase over a prolonged period, and this could support their maintenance costs [10].
Figure 3 shows that the total rate of return on a green energy project in the first year is almost zero because of the large initial investment. In addition, the spillover impact of the energy supply on the region is very low or almost zero, as it takes time for the spillover to affect the regional output and for the tax revenue of local and central governments to emerge.
From , the rate of return and the spillover tax start to increase. If the private investor relies only on user charges for the revenue of the project, the rate of return in the initial stages is very low and it takes time to increase, so the project is not viable. Hence, we suggest injecting the increase in the tax revenue generated from the spillover effect of the energy supply into the green project to secure at least the rate of return (the benchmark rate). However, the spillover tax is not sufficient until , so governments can issue long-term government bonds with N years of maturity to support the private investors until then. In the absence of a bond market, a green credit guarantee fund/corporation could provide a supporting role for securing the rate of return. We believe that, although the establishment of a GCGS will impose a cost and budget burden on the government in the initial years until , the future increases in the tax revenue due to the spillover effect of the energy supply would compensate for it. In addition, thanks to the tax revenue due to the spillover effect, the government will obtain additional revenue, as Equation (1) shows:
3.4. Collecting Carbon Tax from Polluting Industries and Injecting It into Green Projects
One way to increase the rate of return on green projects is to inject the carbon tax collected from polluting industries and firms into green projects. This policy would make green projects attractive for private investors while forcing polluting firms to shift to greener technologies. Although this policy may increase the production costs and raise the price levels initially, it will increase the R&D expenditures on these technologies in the medium term because of the higher demand for green technologies—thus reducing the costs via technological progress. In this subsection, we show how imposing carbon taxation can change firms’ behavior and induce them to use greener technologies.
Here, we assume that an economy with two firms (firms 1 and 2) has production functions, as in Equations (2) and (3):
where and are their total output, and denote their capital inputs, and and are their labor inputs. We consider the Cobb–Douglas production function for these firms, while and are the elasticity of production of capital and labor, respectively. There is a constant return to scale, hence = 1.
Equations (4) and (5) show the profit equations for firms 1 and 2:
where and denote the profit of firms 1 and 2; and show the output prices for the products of firms 1 and 2, respectively; and denote the interest rate that firms 1 and 2 pay on their borrowed capital from the bank; and and denote the wage rates that firms 1 and 2 pay to their labor inputs.
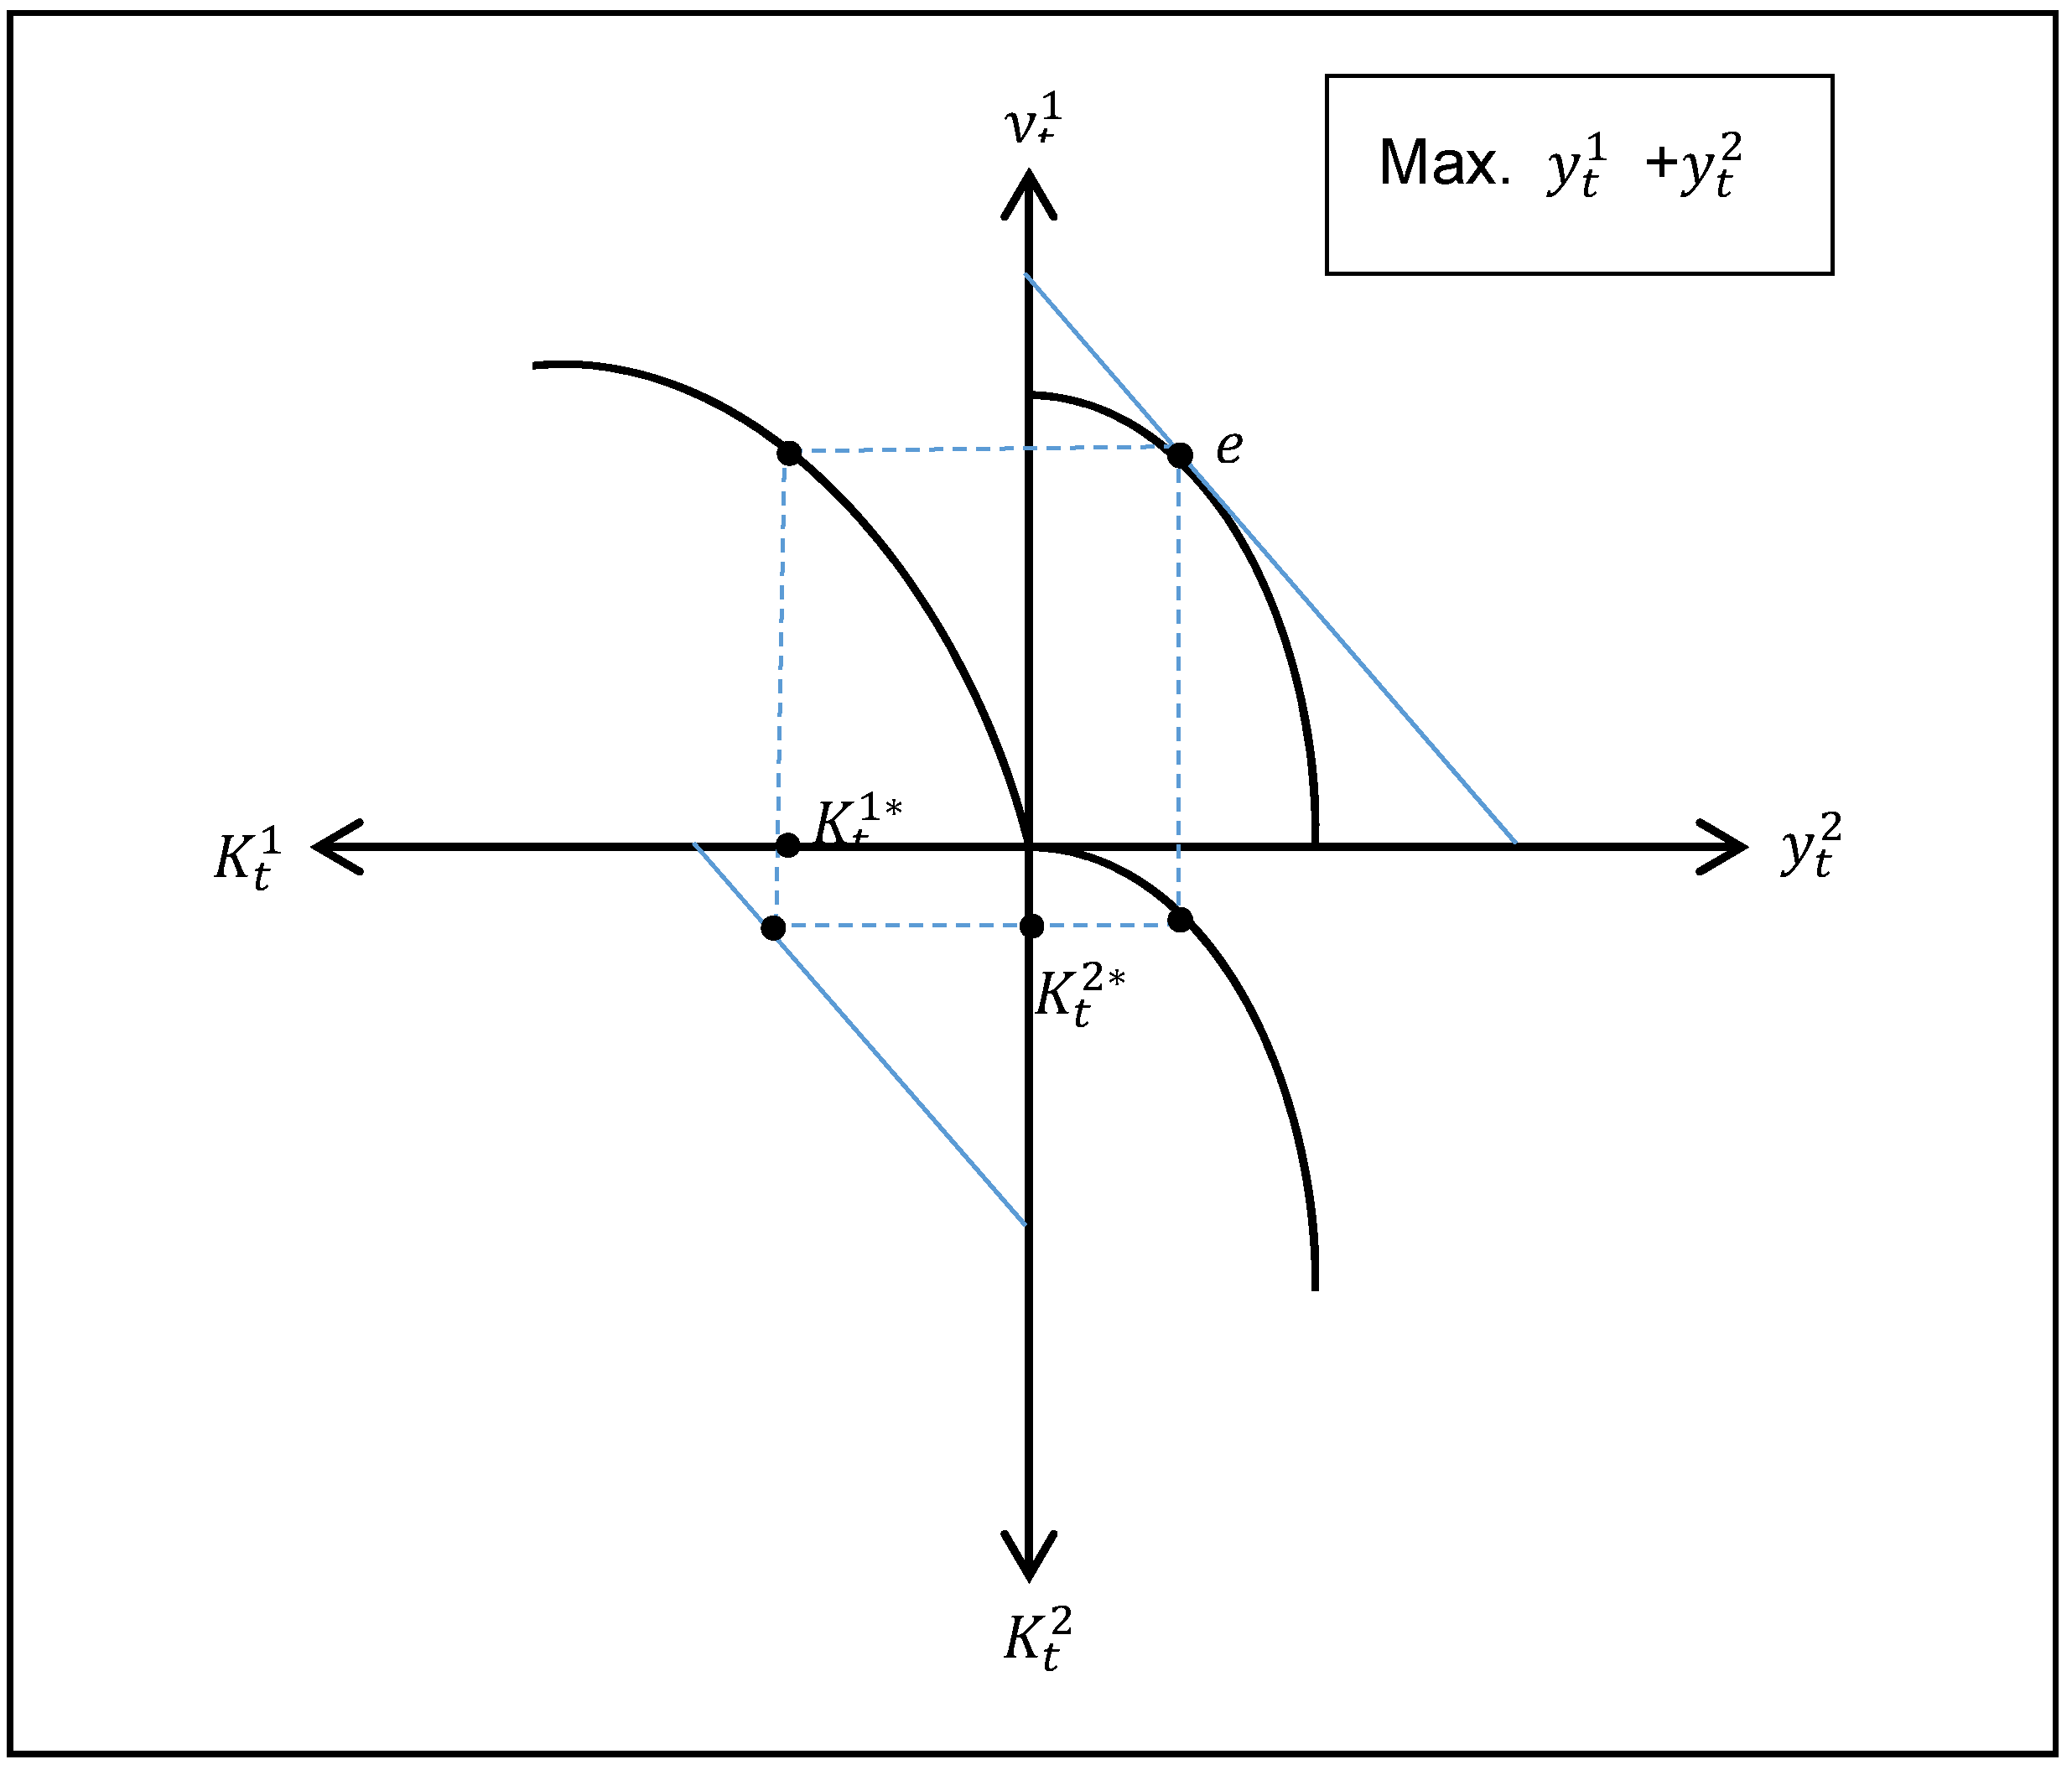
Firms follow profit maximization behavior. To find the optimal level of that maximizes the profit of each firm, we obtain the first-order condition, as in Equations (6) and (7):
The allocation of the total funds in this economy is equal to the sum of the capital of both firms, as in Equation (8):
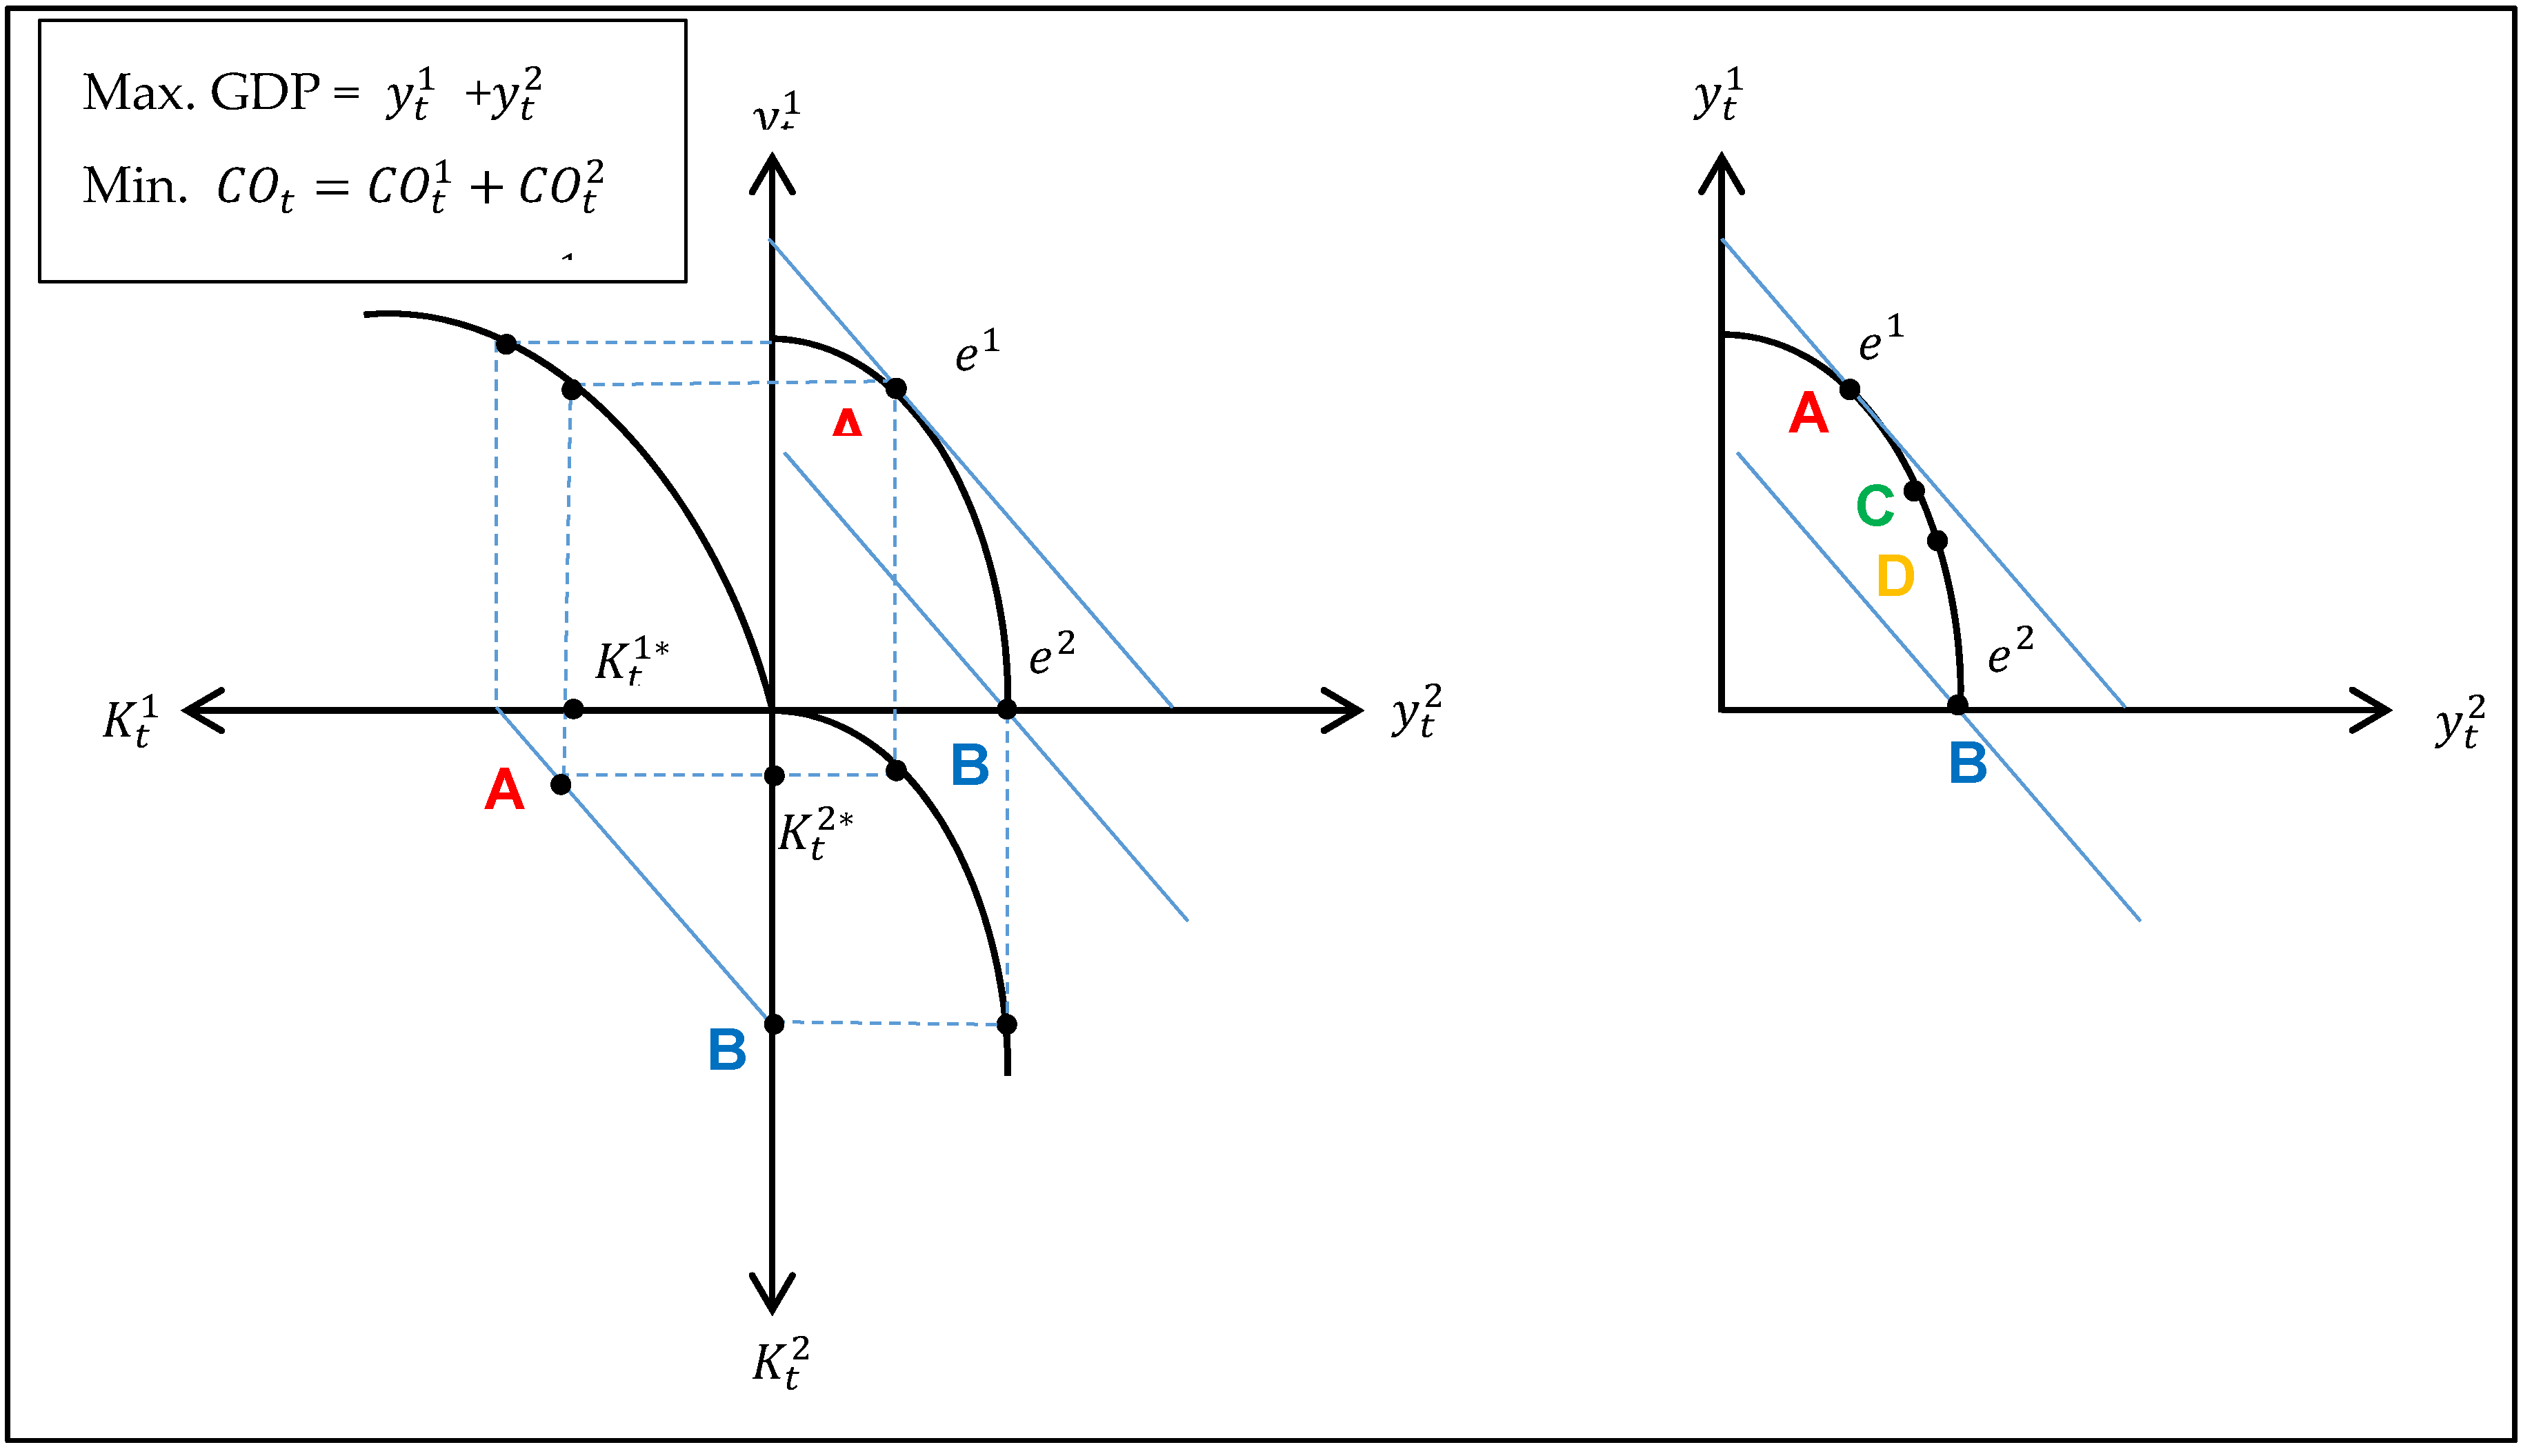
The objective of the government in this economy is to maximize the sum of the outputs of both firms, as in Figure 4.
In the previous case, we did not consider the level of emissions (carbon dioxide). However, in reality, each firm has carbon emissions. In the case below, we consider that each firm has not only a different level of output but also a different level of emissions, and the production functions are as in Equations (9) and (10):
where and show the carbon emissions of firm 1 and firm 2, respectively, at time t.
In addition to output (gross domestic product (GDP)) maximization, the second objective of the government is to minimize the carbon emissions of both firms (Equation (11)):
Therefore, the ultimate objective of the government is to maximize the cumulative output (GDP) and minimize the cumulative carbon emissions, as in Equation (12):
where is the GDP in full employment (the desired GDP level) and is the GDP gap. is the desired emission level, and is the gap between the current emission level and the desired emission level.
The chart on the left of Figure 5 shows two extreme cases. Point A reflects conventional economic theory—profit maximization without consideration of the environment. Point A is the maximization of the GDP (the sum of the outputs of firms 1 and 2). Point B just shows environmental concern and indicates the point that minimizes the sum of the emissions of firms 1 and 2. Since firm 1 has more carbon emissions, point B is where only firm 2, which has lower emissions, is producing and the output of firm 1 is zero. Points C and D show the optimal level of production for each firm, and the production function includes both the output and the carbon emission levels, as in Equations (9) and (10).
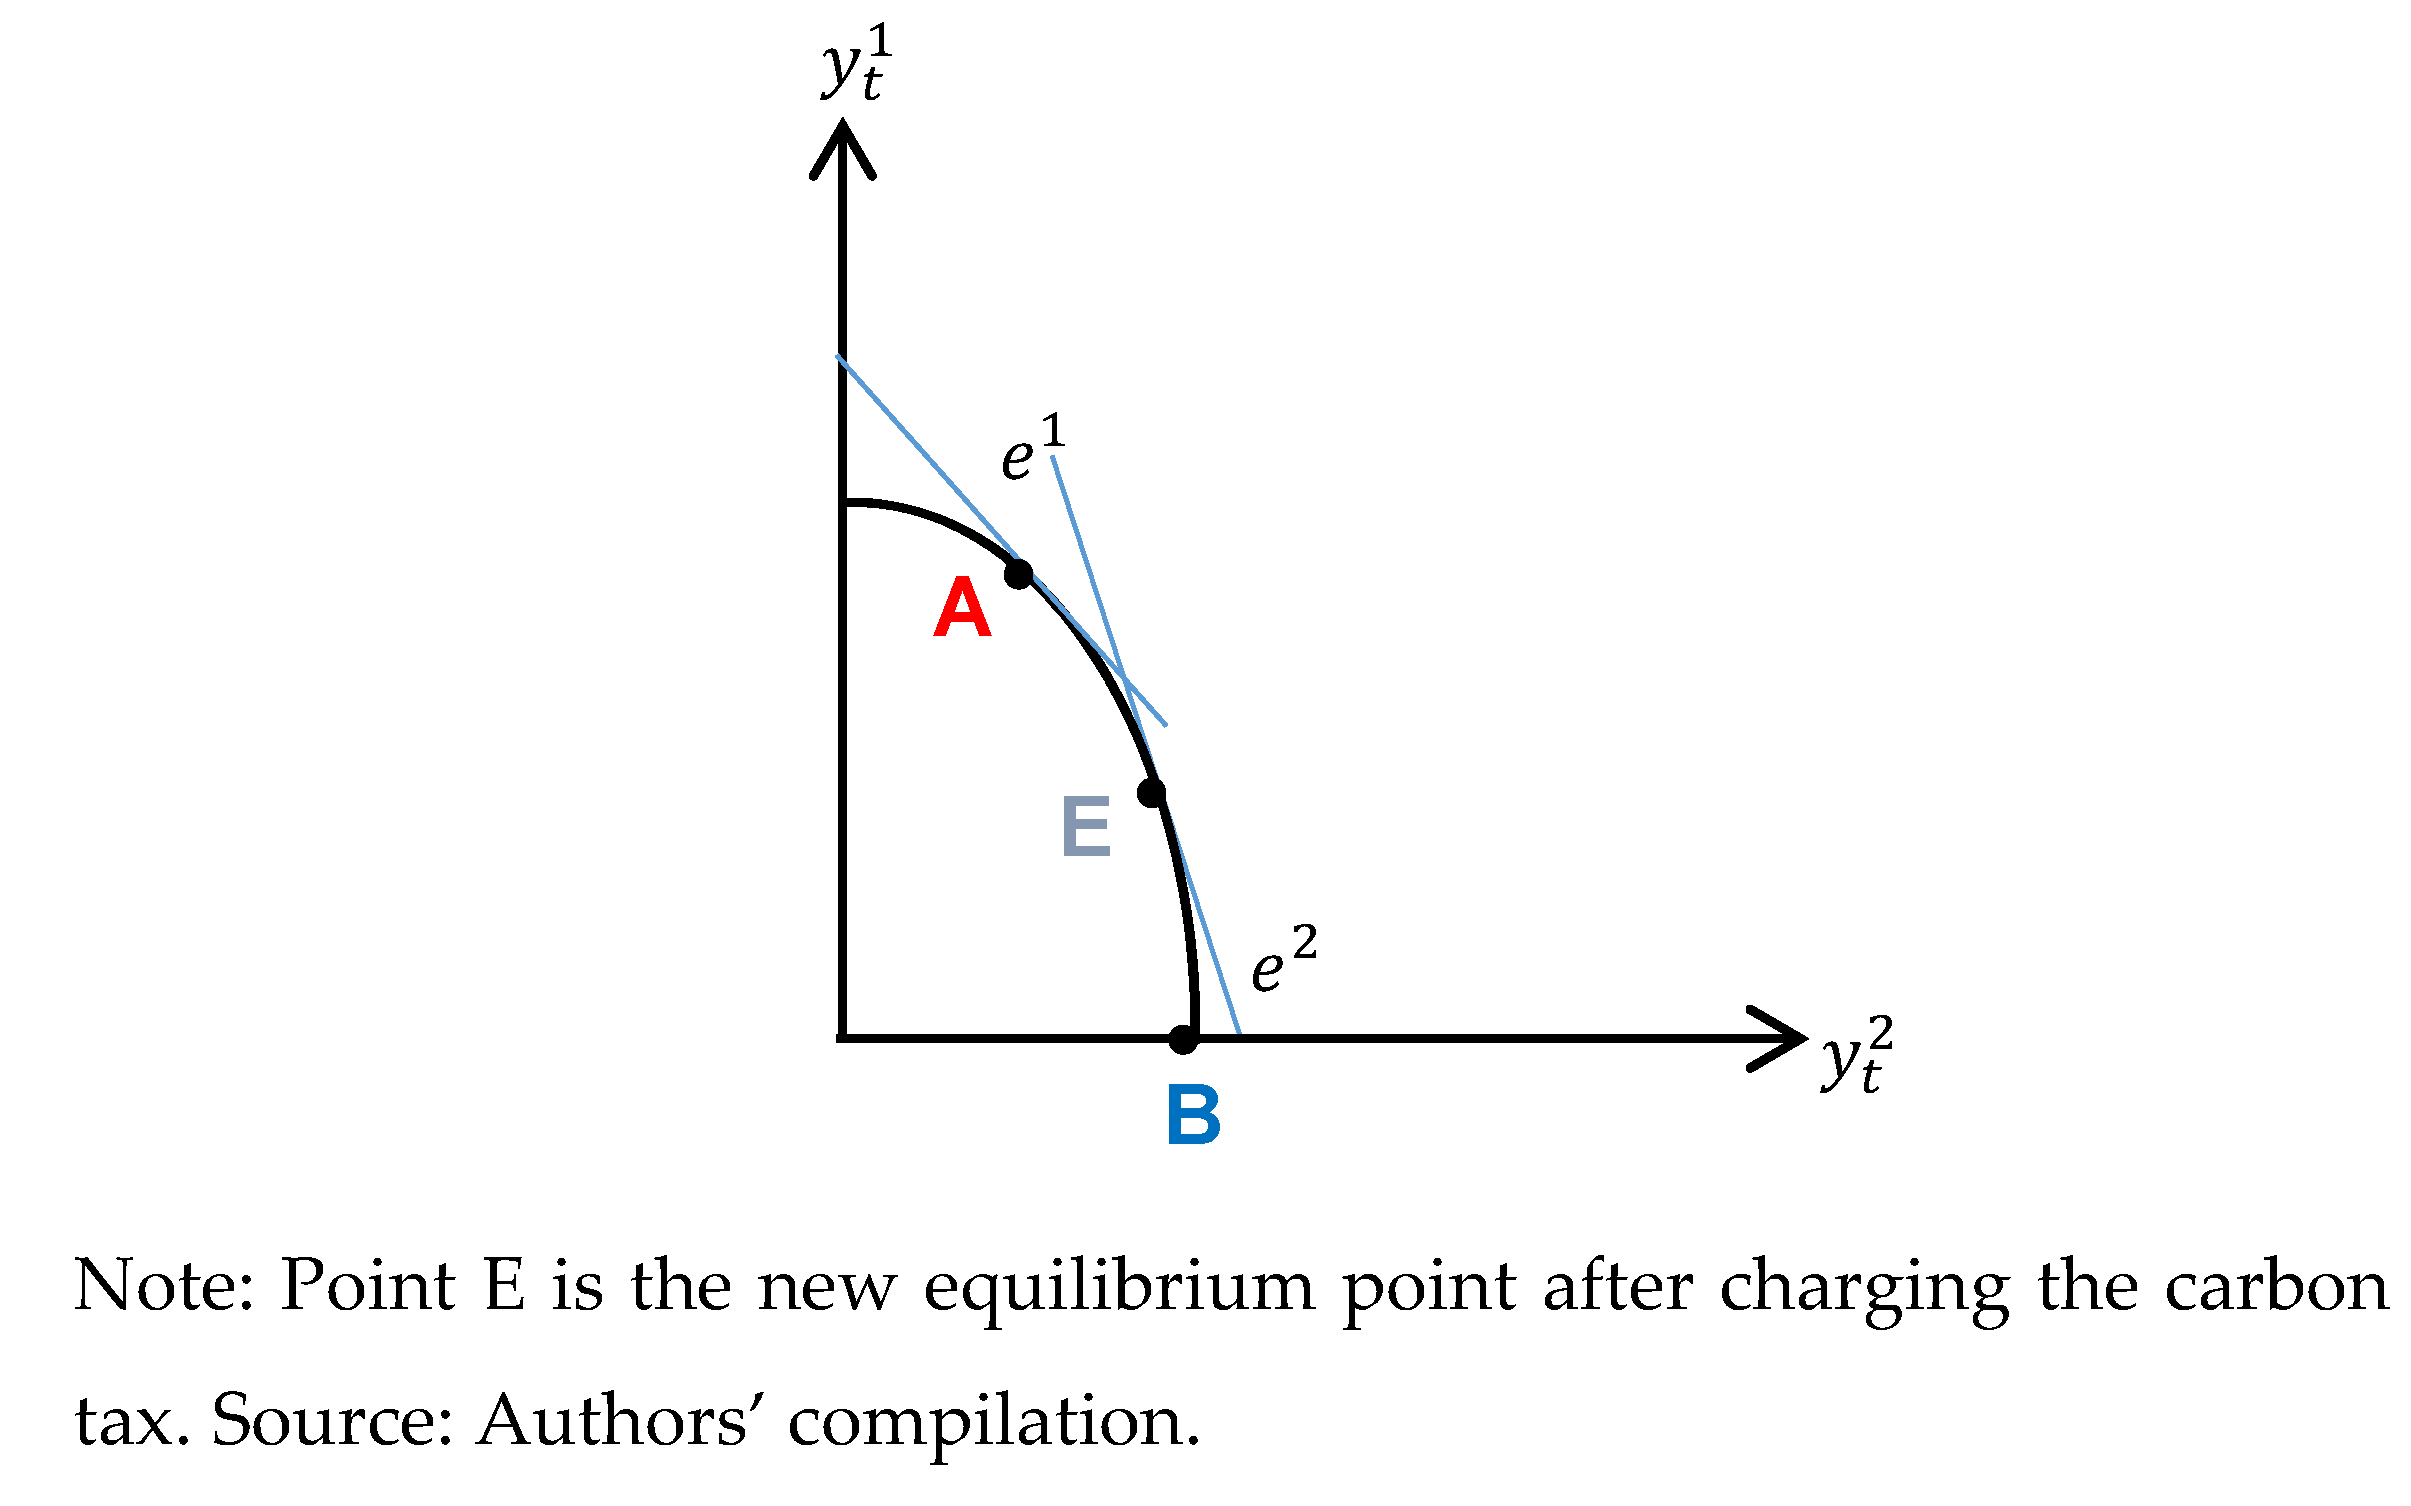
Next, the government charges a carbon tax, which affects the profits of polluting firms. Equations (13) and (14) show the carbon production, which is a function of the capital and labor inputs. A higher level of output will emit more carbon dioxide.
Equations (15) and (16) show the new profit equations of firms 1 and 2 after charging the carbon taxes, which will reduce their profits. We assume that the carbon tax rate is progressive, so a higher tax rate applies emission levels when industries pollute more. This is why firms 1 and 2 have different carbon tax rates, as in Equations (15) and (16) ( and ):
As is clear from Figure 6, the optimal level of production of both firms in the case of the charging of a carbon tax is not A or B but E, which lies between them; its position depends on many factors, including the level of emissions and the tax ratio.
This carbon tax system will induce new firms to start investing in green technologies and establish their industries with green technologies. This will create a spillover effect of green industry/infrastructure in that region, as Section 3.3 explains.
We can express the spillover effects of green technologies as follows:
where is the output of the firm that has green production (e.g., green or green energy) and are the capital, labor, and green energy production inputs, respectively.
Equation (18) depicts the spillover effect of the green energy supply. The first part in the parenthesis shows the spillover effect and the second part shows the direct effect.:
The spillover effect of the green (green) energy supply will increase the tax revenue of the government from the region that has the green energy supply. In Equation (19), we assume that the government will inject 50% of the increase in government tax revenue into green projects and retain the other 50% as the government’s ultimate revenue:
As Equations (20) and (21) show, the injection of tax revenue originally generated from the spillover effect of the green energy supply, and the carbon taxes collected from polluting industries will increase the rate of return on green projects and induce private sector investment in the green sector:
where is the rate of return on the green (green) project and is the initial rate of return on the green project, which is very low. Relying on this alone, the project will not be feasible or attractive to private investors. is the carbon tax that the government charges on polluting projects (firms) and then injects into green projects, while is the tax revenue of the government from the spillover effect of the green energy supply. Percentage of this increase in tax revenue will return to project 1 and percentage will return to project 2 to increase their rates of return. We assumed earlier that , which means that the government will inject 50% of the increase in tax revenue that the spillover effect of the green energy supply caused into green projects and take the other half as its final tax revenue. As the implementation of this scheme shows, the rate of return on green projects will increase; on the other hand, the carbon taxation will force the polluting industries to shift to cleaner industries and green technologies.
3.5. Development of Green Credit Guarantee Schemes to Reduce the Credit Risk
Credit guarantee corporations (CGCs) are public institutions supporting sectors that lack access to finance (SMEs and start-ups). CGCs serve as a guarantor and cover the risk of lending to risky sectors, such as SMEs. Japan initiated CGCs in the 1930s, and presently, many developing and developed economies are using CGCs, especially in the SME sector. The green CGCs that [7] initially proposed improve the creditworthiness of green (green) projects that lack physical collateral and have a weak credit rating.
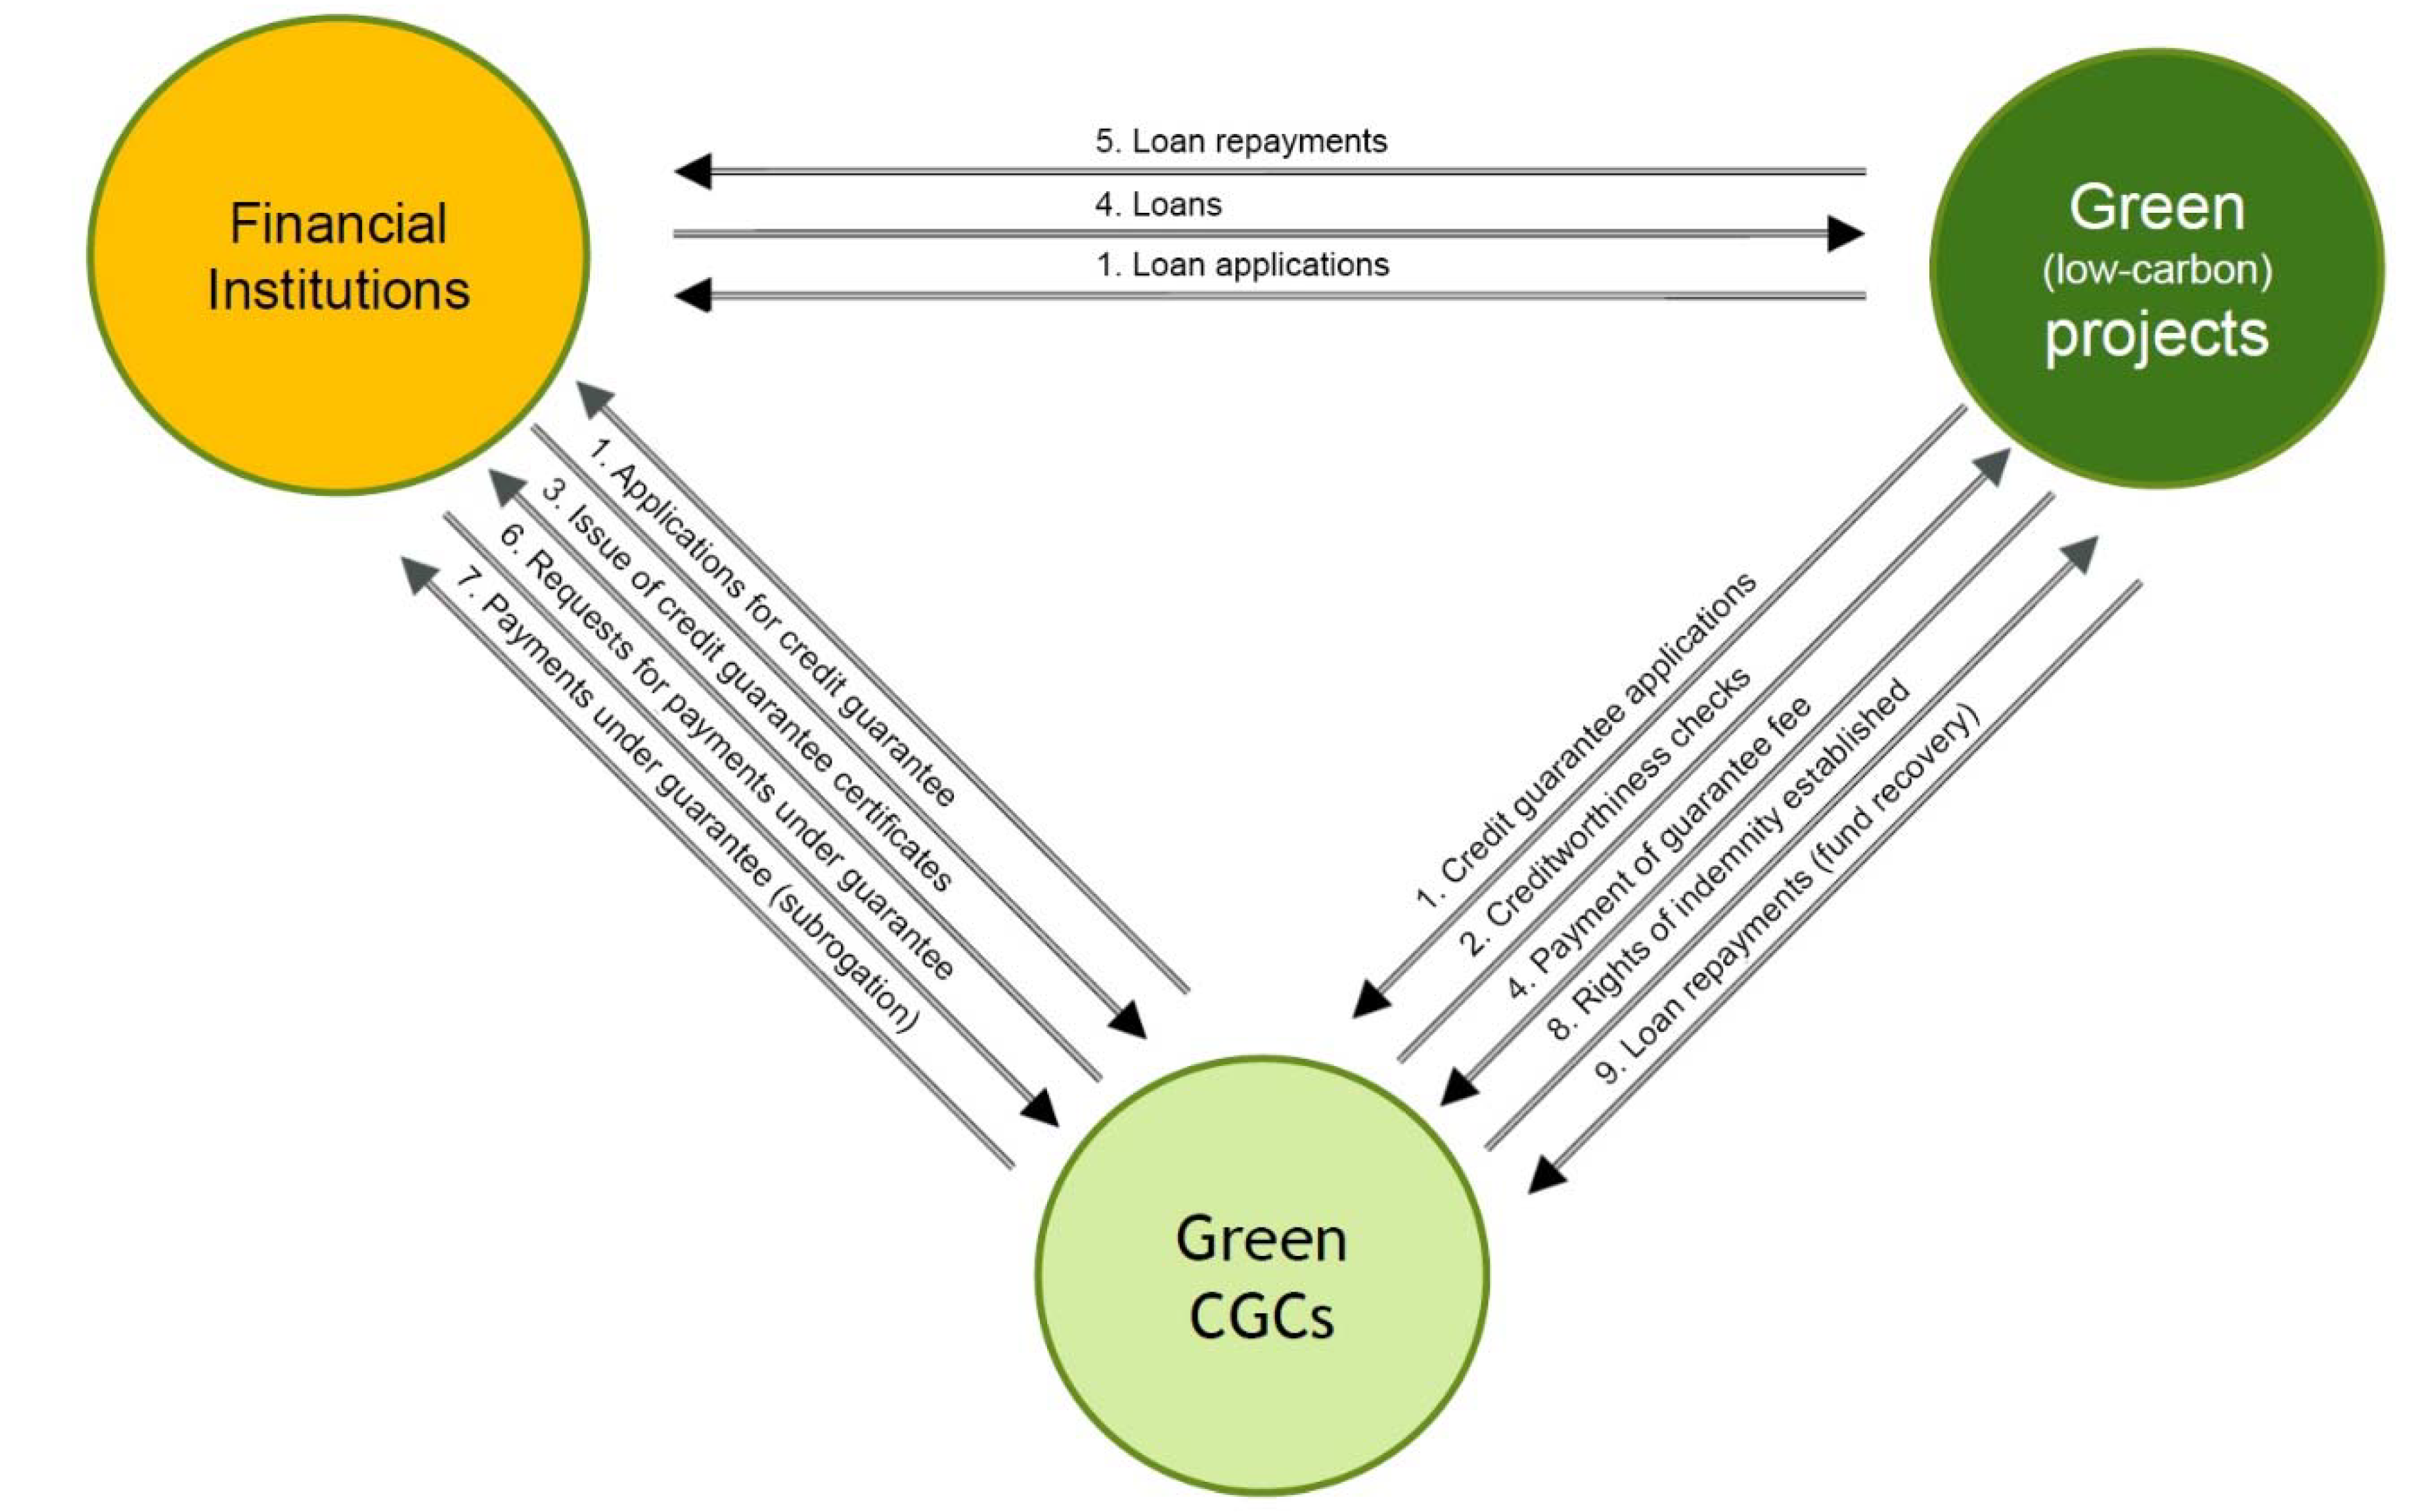
Figure 7 shows three participants in GCGs—banks, green projects, and green CGCs. Green CGCs will increase the loan supply to green projects. The green credit guarantee for green projects will reduce the asymmetry of information and decrease the expected default losses, because the CGC (government) guarantees a portion of the loan default, so banks will want to lend money to guaranteed green projects. An investor in a green project applies for a green credit guarantee when submitting the loan application. Then, a green CGC performs a creditworthiness evaluation of the project and the project owner (individual or corporate). Not all green projects are eligible to receive a guarantee—this depends on the borrower’s credit score and an evaluation of the probability of success of the green project. Depending on the results of the creditworthiness assessment of a green credit guarantee corporation (GCGC), the investor pays a guarantee fee or premium. The fee depends on the project risk rating and the borrower’s credit score. Using the same guarantee fee for all borrowers would create a moral hazard [23]. Banks also need to apply to a GCGC for a green credit guarantee, which issues the relevant certificate. Next, the bank disburses the loan to the green project (borrower), and the borrower starts to pay the loan instalments. In the case of default, the GCGC compensates a portion of the loan amount—the credit guarantee ratio—and subrogates the bank. An adjustment of the optimal credit guarantee ratio is necessary to avoid moral hazard [23]. This means that healthy banks that manage their nonperforming loans and have higher creditworthiness should receive a higher credit guarantee ratio from the government, while unsound banks need a lower guarantee and very risky banks do not obtain a guarantee. The regulator for a green finance’s selection of an optimal guarantee ratio also creates an incentive for financial institutions to improve their creditworthiness to receive a higher guarantee ratio.
3.6. Addressing Green Investment Risks via De-Risking
Various financial and nonfinancial risks are associated with green projects, as Section 2.2 explained. Since risks have an impact on access to credit, it is very important to mitigate them. De-risking is a potentially powerful policy option to redirect financial flows to green investments in two ways: financial and policy. Financial de-risking lowers the perceived risks and requires returns and, thus, reduces the investment costs. Financial de-risking can occur as a result of transferring a large portion of the risk to another party; for example, insurance risks of governments or development banks, loan guarantees, or support policies like feed-in-tariffs, subsidies, or low-carbon promotion tools, such as carbon pricing. These measures are not necessarily limited to countries receiving investments, and multilateral organizations, such as development banks, employ them equally. The UNFCCC Green Climate Fund (GCF) with a target value of US $100 billion/yr by 2020 is expected to play an important role in financial de-risking and delivering the required investment levels for the large-scale renewable energy projects in developing countries in line with the Paris Agreement [24].
Unfortunately, in many developing countries, financial de-risking to date has mainly related to coal, while only a small fraction has focused on green alternatives [25]. The green credit guarantee scheme that this paper proposes is a tool for reducing the financial risk for private investors, as the GCGS (government) covers a portion of the risk. [26] discussed the possibility of financial de-risking by increasing the transparency and improving the laws and regulations. De-risking can increase the effectiveness and efficiency of policies aiming to attract green investments [27]. Policy de-risking instruments are including programs, policies, and regulations that reduce the risks of private sector investments in green and low-carbon projects that are typically implemented by the governments. In utility-scale renewable energy, these policies and instruments include auction processes and reforms to ensure financially sound utilities (cost-recovery). In energy efficiency, the de-risking instruments include the design, implementation, and enforcement of various minimum energy efficient standards, such as green building codes or in lighting and appliances [28].
3.7. Summary of Tools and Instruments for Green Investments
Table 1 presents the tools and instruments that this section outlined, as well as suggestions for reducing the risk of green projects, raising the rate of return, increasing the capacity of the investors and other stakeholders, and facilitating access to finance and investment.
4. Example of Green Finance Management
In this section, we provide an example of the development of an environmental project. The objective is to show how the implementation of a GCGS, which this paper proposes, can reduce the risk of investment in projects. One of the major challenges that cities, mainly mega cities, in developing countries face is the environmental impact of generating huge amounts of solid waste. This issue is severe in Asia, as the Asian urban population increases by 44 million people every year. By 2050, half of the world’s population will live in Asia and the Pacific countries [30]. The People’s Republic of China generates 150 million tons of waste annually, and globally, it is the largest generator of municipal solid waste; India ranks second in the world [31]. One of the major obstacles to the development of solid waste management projects is the lack of a municipal budget and the low interest of private investors in this sector because of the low rate of return. Many municipalities in large Asian cities allocate more than 20% of the municipal budget to solid waste management.
In this section, we suggest practical funding schemes for fixed capital and working capital to incentivize solid waste management for private investors. These schemes are applicable to green and environmental projects, including waste-to-energy projects, which face similar barriers.
4.1. CGSs for Providing Fixed Capital
As mentioned earlier, many countries have used CGSs in various forms over the decades to increase the flow of funds to targeted sectors and segments of the economy that have difficulties accessing finance, including SMEs. A CGS absorbs the risk, and the guarantee that it provides acts as collateral. Therefore, by reducing the level of risk, banks are more willing to lend to borrowers. In addition, as the CGS acts as a guarantor, it needs to assess the creditworthiness of the borrower by monitoring the status of the project or borrower to improve the quality of lending.
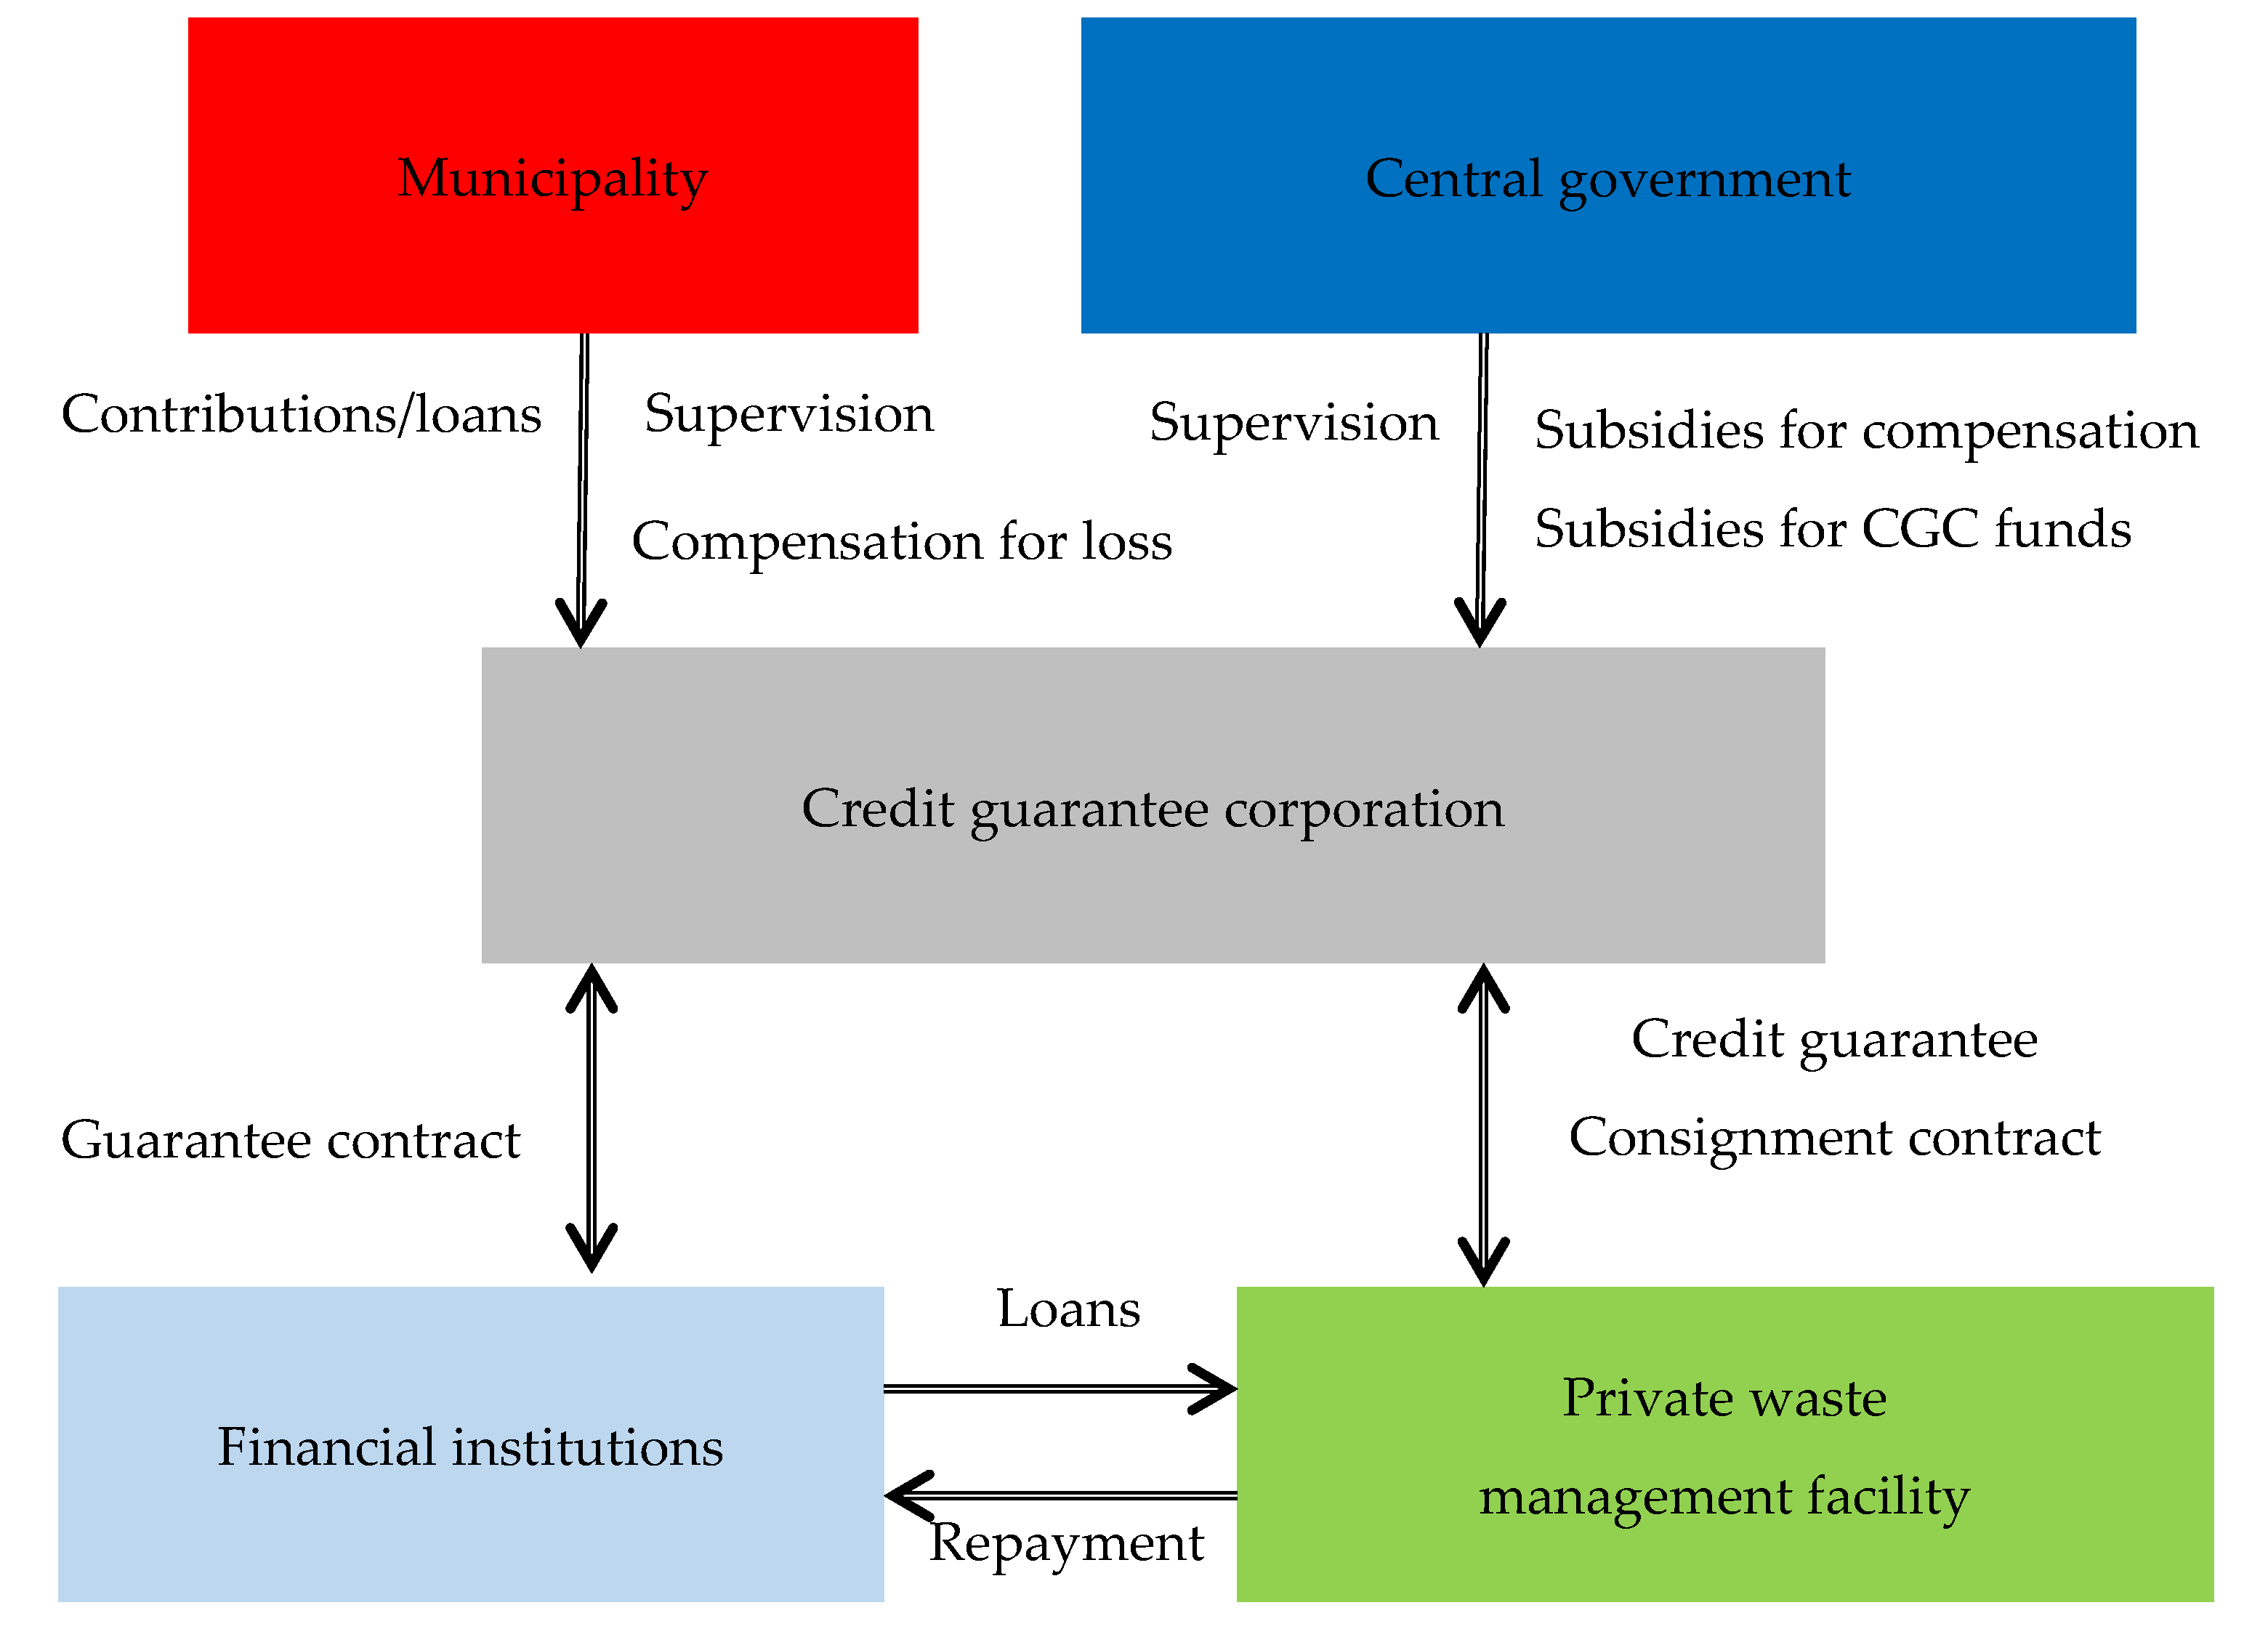
Figure 8 shows that a CGS has three players. The first is the borrower, which can be a green project. In this example, it is a waste management project seeking finance. When borrowers approach a bank, they often refuse to lend because of the asymmetry of information and a lack of collateral. The second player is the lender, which is a financial institution (bank). The third player is the guarantor, which is the CGC, which usually the government runs, providing a full or partial guarantee. The CGS has a cost, so the borrower needs to pay a credit premium to the CGC. However, in the early stages of development of a CGC, it needs enough capital to cover the risks, so it requires government support. After some years, it can become financially sustainable. For this example, this scheme is especially applicable to sectors that require large fixed capital, waste-to-energy projects, or green projects. In this example, as is clear from Figure 8, the central government or the municipality funds the CGC. After assessing the credit history of the borrower (individual or corporate) and evaluating the feasibility of the project, the CGC agrees to provide this project with a guarantee. Then, it guarantees a certain amount (e.g., 80%), and the borrower proceeds to approach a bank to apply for a loan. When the bank sees that about 80% of the loan amount has a guarantee, it is eager to lend to this project. For the remaining 20%, the bank may ask for collateral. As this is a small amount, it is easier for the project owner to provide it.
4.2. Establishment of Community-Based Funds for Providing Working Capital
In addition to the fixed capital, the second major challenge facing waste management and many green projects (e.g., waste-to-energy projects) is the difficulty in funding their working capital. Therefore, it is important to design a scheme that can adapt to the socioeconomic environment in Asia to help the private sector fund the working capital of these projects.
In many large cities, landfills occupy large tracts of land, and the space is limited. By establishing sorting, recycling, composting, and waste-to-energy facilities, the freed landfills could work better to support other, more beneficial purposes for generating user charges, rent, and making revenue from the sale of electricity generated from waste for municipalities or private investors, which could be a sustainable source of funding for working capital.
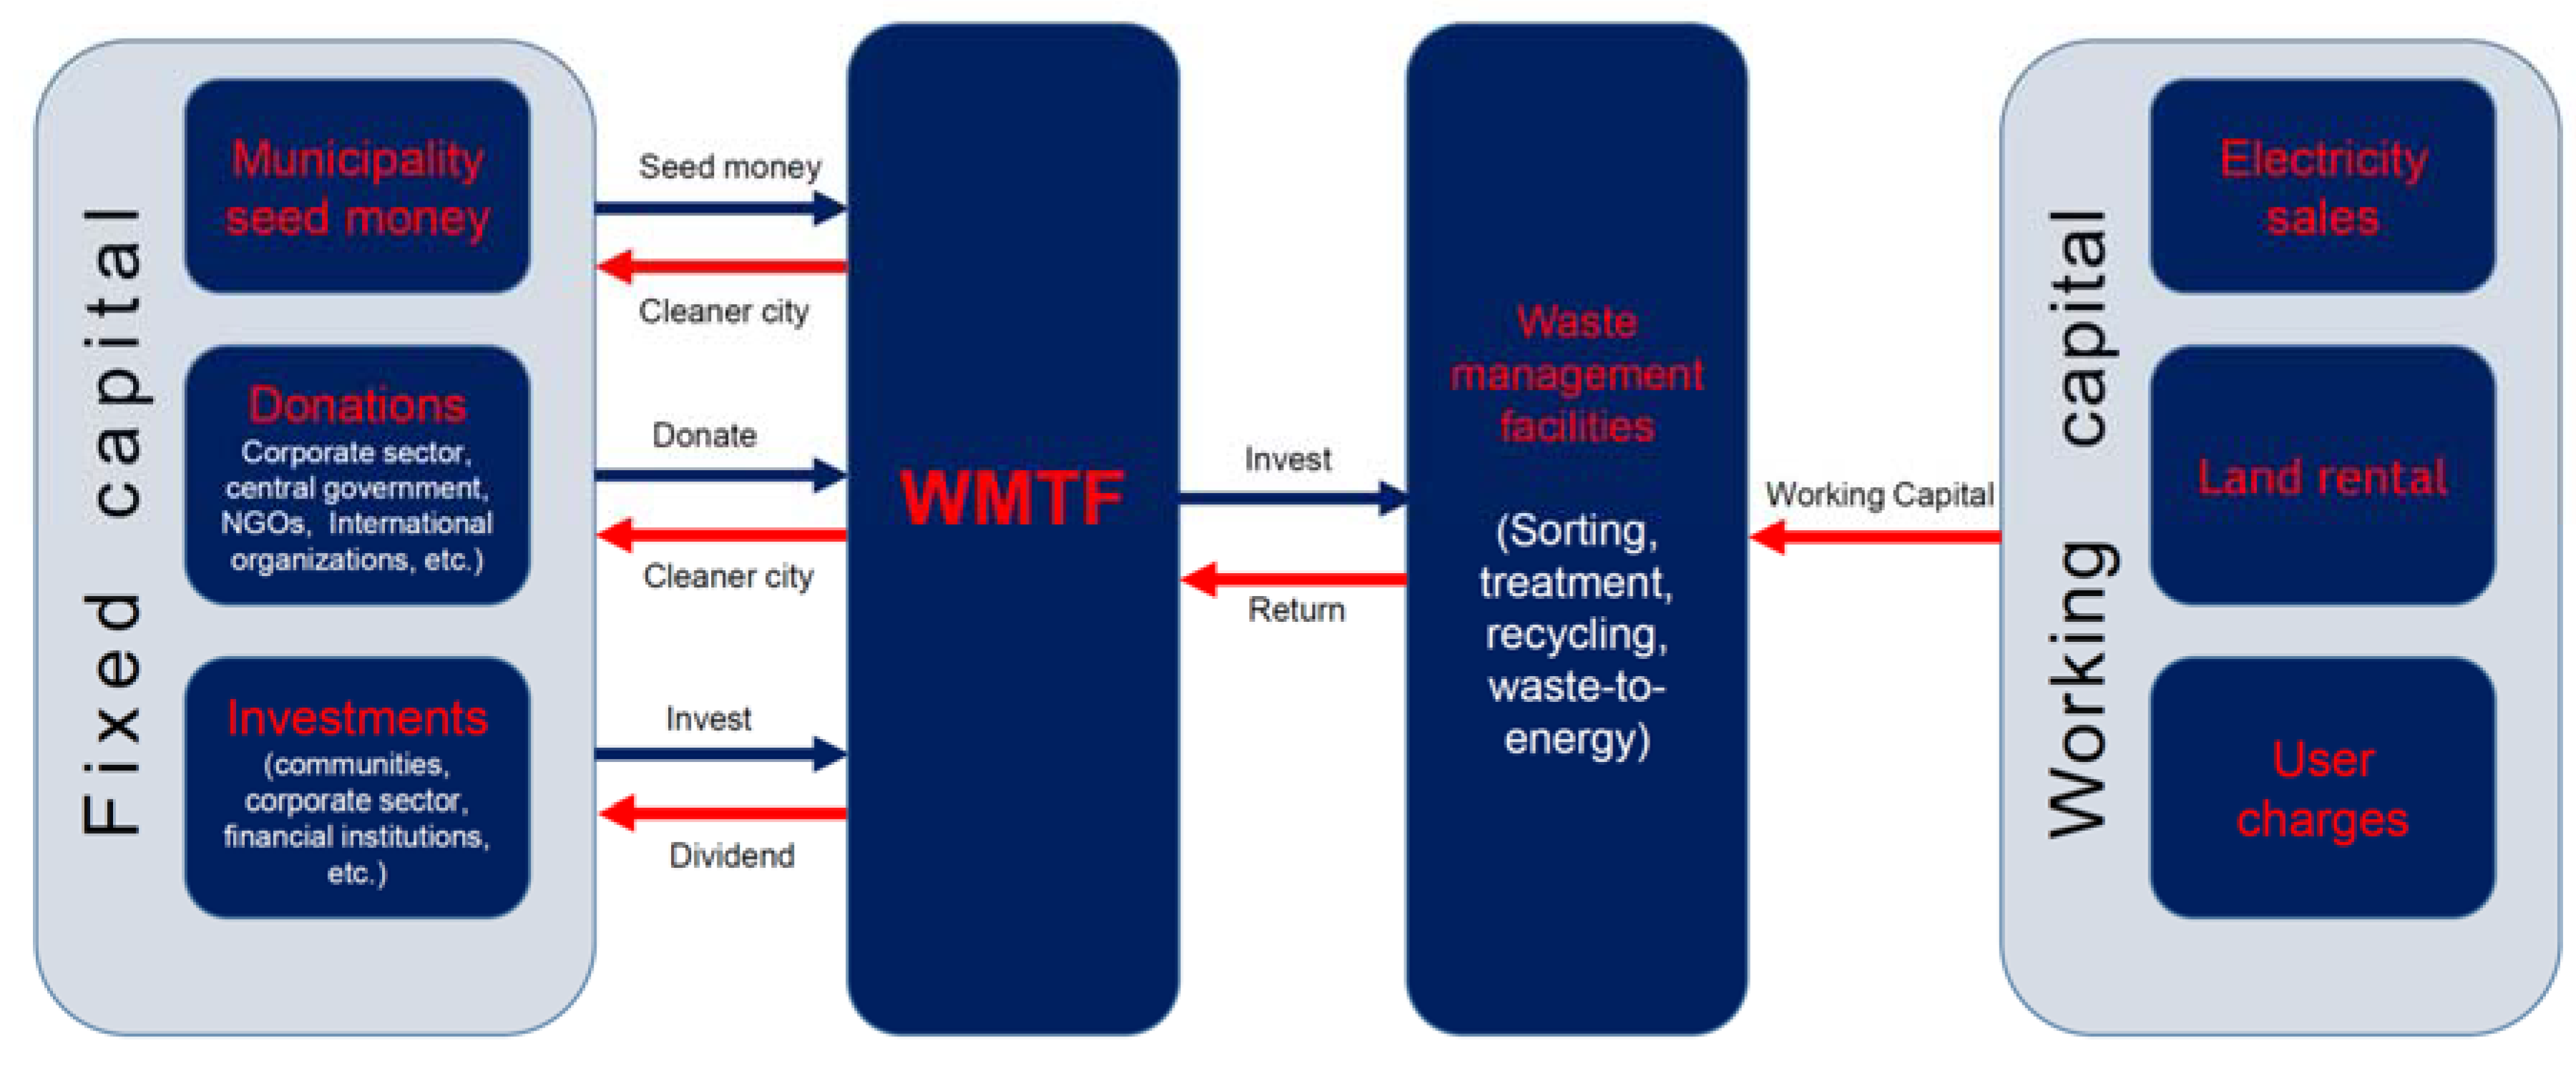
Figure 9 illustrates a waste management trust fund, a type of community-based funding or hometown investment trust fund for providing working capital for these projects.
In Japan, the development of hometown investment trust funds occurred mainly after the Fukushima nuclear power disaster in March 2011, when the government shut down the nuclear power plant as it was unsafe. Many people, especially in the affected region of Fukushima, showed an interest in renewable energy, such as solar and wind power, instead of nuclear power [32]. However, green projects carry a high risk, and most banks are reluctant to lend to them. Therefore, local people started to collect small amounts of money ($100–$5000) from the region through a local fund to build a solar power plant and wind power generator. They planned to establish a green energy plant, generate electricity, use the power that they generated, sell the excess to the power company, and make some profit. This was the reason for the establishment of the hometown investment trust funds, with the basic idea of connecting the investors to the projects in their hometown. Individual investors can invest a small amount of money through the internet in the projects toward which they are sympathetic. The investors not only seek a profit but also are well-disposed toward the project or the region. If these projects are successful, the banks will also be interested in lending to them. We believe that hometown investment trust funds are suitable for waste management projects, and the waste management trust fund is a new type of hometown investment trust fund targeting waste management projects. Hometown investment trust funds have expanded from Japan to Cambodia, Malaysia, Vietnam, and Mongolia [4]. Similar funds apply to green projects in developing countries, especially in regions where communities are integrated and trust exists among their members. These funds will help high-risk sectors, including the green sector, to grow.
As Figure 9 shows, waste management trust funds are project-oriented and designed for running waste management projects. The working capital comes from three sources: (1) rents from the freed landfills, (2) user charges from waste generators (the facility can burn the waste of other regions or other countries and receive the charges and fees—as occurs in many European cities), and (3) the sale of the electricity generated by the waste. In addition, the waste management trust funds receive donations from locals, as well as central governments from their municipal and urban management budgets in the form of seed money for increasing the rate of return of the projects.
5. Conclusions and Policy Recommendations
The lack of long-term financing, the existence of various risks, the low rate of return, and market actors’ lack of capacity are major challenges for developing green projects. Using the spillover effects on green energy projects would increase the rate of return of these projects. PFIs can use both traditional and innovative approaches to link green projects with finance by enhancing their access to capital, facilitating risk reduction and sharing, improving the capacity of market actors, and shaping broader market practices and conditions. PFIs should avoid the negative effects of government lending (crowding out of private investment) by engaging in long-term lending at stable rates and only lending where private banks cannot lend. The green R&D sector is among the sectors for which PFI lending is suitable. GCGSs will reduce the asymmetry of information and decrease the expected default losses, thereby covering part of the risk and unlocking financial institutions’ private investments and lending to green projects. GCGCs and PFIs can play important roles in credit enhancement and reduce the risks and improve the capacity for the adoption of a green economy. To prevent moral hazard, the guarantee ratio of GCGCs needs to be variable, depending on the creditworthiness of borrowers and financial institutions, and not fixed. To achieve a sustainable financing scheme of banks and NBFIs, it is important for the government to consider leverage, transparency, and specific results in the financial scheme (the case of a waste management project).
Author Contributions
F.T.-H. contributed to this research article in the formal analysis, investigation, resources, data curation, and writing of the original draft. N.Y. contributed to this research article for conceptualization and methodology. All authors have read and agreed to the published version of the manuscript.
Funding
This research was supported by JSPS Kakenhi (2019-2020) Grant-in-Aid for Young Scientists No. 19K13742 and Grant-in-Aid for Excellent Young Researcher of the Ministry of Education of Japan (MEXT).
Acknowledgments
This research paper is output of the research project titled: “Unlocking the potentials of Private Sector Financing for Accelerated Low-Carbon Energy Transition (Phase II)” of the Economic Research Institute for ASEAN and East Asia (ERIA) which done by the authors. Authors are grateful to ERIA and the Asian Development Bank Institute (ADBI) for supporting this research. The paper benefited from the precious comments received from the anonymous referees of Energies and authors are grateful to them.
Conflicts of Interest
The authors declare no conflicts of interest.
References
- Sachs, J.; Woo, W.T.; Yoshino, N.; Taghizadeh-Hesary, F. Importance of green finance for achieving sustainable development goals and energy security. In Handbook of Green Finance: Energy Security and Sustainable Development; Sachs, J., Woo, W.T., Yoshino, N., Taghizadeh-Hesary, F., Eds.; Springer: Singapore, 2019; pp. 3–12. [Google Scholar]
- Donovan, C.W. Renewable Energy Finance: Powering the Future; World Scientific Books; World Scientific Publishing Co. Pte. Ltd.: Singapore, 2015; p. 1030. [Google Scholar]
- Asian Development Bank (ADB). Meeting Asia’s Infrastructure Needs; Asian Development Bank: Manila, Philippines, 2017. [Google Scholar]
- Yoshino, N.; Taghizadeh-Hesary, F. Alternatives to private finance: Role of fiscal policy reforms and energy taxation in development of renewable energy projects. In Financing for Low-Carbon Energy Transition: Unlocking the Potential of Private Capital; Anbumozhi, V., Kalirajan, K., Kimura, F., Eds.; Springer: Tokyo, Japan, 2018; pp. 335–337. [Google Scholar]
- Schub, J. Green banks: Growing clean energy markets by leveraging private investment with public financing. J. Struct. Financ. 2015, 21, 26–35. [Google Scholar] [CrossRef]
- Gabbi, G.; Ticci, E.; Vercelli, A.; Hall, C. Financialization, economy, society and sustainable development: A European Union sustainable banking network. European Policy Brief. 2016. Available online: https://ec.europa.eu/research/social-sciences/pdf/policy_briefs/fessud_policy_brief_10.pdf (accessed on 10 October 2019).
- Taghizadeh-Hesary, F.; Yoshino, N. The way to induce private participation in green finance and investment. Financ. Res. Lett. 2019, 31, 98–103. [Google Scholar] [CrossRef]
- Geddes, A.; Schmidt, T.S.; Steffen, B. The multiple roles of state investment banks in low-carbon energy finance: An analysis of Australia, the UK and Germany. Energy Policy 2018, 115, 158–170. [Google Scholar] [CrossRef]
- Bank of Japan. Asian Financial Markets—20 Years since the Asian Financial Crisis, and Prospects for the Next 20 Years. In Proceedings of the Keynote Speech of Governor Haruhiko Kuroda at the 2017 Annual General Meeting of the Asia Securities Forum, Tokyo, Japan, 28 November 2017. [Google Scholar]
- Yoshino, N.; Taghizadeh-Hesary, F.; Nakahigashi, M. Modelling the social funding and spill-over tax for addressing the green energy financing gap. Econ. Model. 2019, 77, 34–41. [Google Scholar] [CrossRef]
- Hwang, B.-G.; Shan, M.; Phua, H.; Chi, S. An exploratory analysis of risks in green residential building construction projects: The case of Singapore. Sustainability 2017, 9, 1116. [Google Scholar] [CrossRef] [Green Version]
- Clean Energy Manufacturing Analysis Center. Benchmarks of Global Clean Energy Manufacturing; Clean Energy Manufacturing Analysis Center: Washington, DC, USA, 2017. [Google Scholar]
- Leonard, W.A. Clean is the new green: Clean energy finance and deployment through green banks. Yale Law Policy Rev. 2014, 3, 197–229. [Google Scholar]
- Merrill, L.; Bridle, R.; Klimscheffskij, M.; Tommila, P.; Lontoh, L.; Sharma, S.; Gerasimchuk, I. Making the Switch: From Fossil Fuel Subsidies to Sustainable Energy; Nordic Council of Ministers: Copenhagen, Denmark, 2017. [Google Scholar]
- Organisation for Economic Co-operation and Development (OECD). OECD Companion to the Inventory of Support Measures for Fossil Fuels 2015; OECD: Paris, France, 2015. [Google Scholar]
- Coady, D.; Parry, I.; Sears, L.; Shang, B. how large are global fossil fuel subsidies? World Dev. 2017, 91, 11–27. [Google Scholar] [CrossRef]
- United Nations Environment Programme (UNEP). 2016. Available online: http://unepinquiry.org/wp-content/uploads/2016/09/Synthesis_Report_Full_EN.pdf (accessed on 28 December 2019).
- Cochran, I.; Hubert, R.; Marchal, V.; Youngman, R. Public Financial Institutions and the Low-Carbon Transition: Five Case Studies on Low-Carbon Infrastructure and Project Investment; OECD Environment Working Papers; OECD: Paris, France, 2014. [Google Scholar]
- Japan Bank for International Cooperation (JBIC). Japan’s Role towards Global Climate Change Resolution; JBIC Today, November; Japan Bank for International Cooperation: Tokyo, Japan, 2016. [Google Scholar]
- Egli, F.; Steffen, B.; Schmidt, T. A dynamic analysis of financing conditions for renewable energy technologies. Nat. Energy 2018, 3, 1084–1092. [Google Scholar] [CrossRef]
- Gianfrate, G.; Lorenzato, G. Stimulating non-bank financial institutions’ participation in green investments. In Handbook of Green Finance: Energy Security and Sustainable Development; Sachs, J., Woo, W.T., Yoshino, N., Taghizadeh-Hesary, F., Eds.; Springer: Singapore, 2019; pp. 213–236. [Google Scholar]
- Kaminker, C.; Kawanishi, O.; Stewart, F.; Caldecott, B.; Howarth, N. Institutional Investors and Green Infrastructure Investments: Selected Case Studies; OECD Working Papers on Finance, Insurance and Private Pensions; OECD: Paris, France, 2013. [Google Scholar]
- Yoshino, N. Taghizadeh-Hesary, F. Optimal credit guarantee ratio for small and medium-sized enterprises’ financing: Evidence from Asia. Econ. Anal. Policy 2019, 62, 342–356. [Google Scholar] [CrossRef]
- Sweerts, B.; Dalla Longa, F.; van der Zwaan, B. Financial de-risking to unlock Africa’s renewable energy potential. Renew. Sustain. Energy Rev. 2019, 102, 75–82. [Google Scholar] [CrossRef]
- Chen, H. Why Are G20 Governments Financing Coal over Renewables? NRDC Expert Blog (Blog). 2017. Available online: https://www.nrdc.org/experts/han-chen/why-are-g20-governments-financing-coal-over-renewables (accessed on 12 October 2019).
- Steckel, C.J.; Jakob, M. The role of financing cost and de-risking strategies for clean energy investment. Int. Econ. 2018, 155, 19–28. [Google Scholar] [CrossRef]
- Schmidt, T.S. Low-carbon investment risks and de-risking. Nat. Clim. Chang. 2014, 4, 237–239. [Google Scholar] [CrossRef]
- United Nations. 2018. Available online: https://sustainabledevelopment.un.org/content/documents/17549PB_5_Draft.pdf (accessed on 27 December 2019).
- UNCTAD. The Continuing Relevance of Development Banks; UNCTAD Policy Brief, No. 4; United Nations Conference on Trade and Development: Geneva, Switzerland, 2012. [Google Scholar]
- ADB (Asian Development Bank). Key Indicators for Asia and the Pacific 2011; Asian Development Bank: Manila, Philippines, 2011. [Google Scholar]
- ADB (Asian Development Bank). ADB Supports Clean Waste-to-Energy Project in the PRC. 2009. Available online: https://www.adb.org/news/adb-supports-clean-waste-energy-project-prc (accessed on 10 January 2019).
- Taghizadeh-Hesary, F.; Yoshino, N.; Rasoulinezhad, E. Impact of Fukushima nuclear disaster on the oil-consuming sectors of Japan. J. Comp. Asian Dev. 2017, 16, 113–134. [Google Scholar] [CrossRef] [Green Version]
Figure 1.
Bank-dominated financial systems in Asia. Source: [9].
Figure 1.
Bank-dominated financial systems in Asia. Source: [9].

Figure 2.
Balance of trade in select clean energy technology end products and across the C-Si PV module supply chain, 2014. ($ million). c-Si = crystalline silicon and PV = photovoltaic. Source: Authors’ development based on data from the [12]. Note: The values in parentheses are negative.
Figure 2.
Balance of trade in select clean energy technology end products and across the C-Si PV module supply chain, 2014. ($ million). c-Si = crystalline silicon and PV = photovoltaic. Source: Authors’ development based on data from the [12]. Note: The values in parentheses are negative.

Figure 3.
Using GCGSs and spillover tax in green projects. GCGS = green credit guarantee scheme. Source: Authors’ compilation.
Figure 3.
Using GCGSs and spillover tax in green projects. GCGS = green credit guarantee scheme. Source: Authors’ compilation.

Figure 4.
Allocation of funds to firms and output maximization. Notes: is the equilibrium point, denotes the optimal capital for firm 1, and denotes the optimal capital for firm 2. Source: Authors’ compilation.
Figure 4.
Allocation of funds to firms and output maximization. Notes: is the equilibrium point, denotes the optimal capital for firm 1, and denotes the optimal capital for firm 2. Source: Authors’ compilation.

Figure 5.
Equilibrium levels of output with different objectives. GDP = gross domestic product. Note: is the equilibrium point considering different objectives, denotes the optimal capital for firm 1, and denotes the optimal capital for firm 2. Source: Authors’ compilation.
Figure 5.
Equilibrium levels of output with different objectives. GDP = gross domestic product. Note: is the equilibrium point considering different objectives, denotes the optimal capital for firm 1, and denotes the optimal capital for firm 2. Source: Authors’ compilation.

Figure 6.
Optimal level of output when charging carbon tax.

Figure 7.
GCGS for the management of green credit risk. CGC = credit guarantee corporation and GCGS = green credit guarantee scheme. Source: The authors following [7]. Note: The numbering shows the sequence of the workflow.
Figure 7.
GCGS for the management of green credit risk. CGC = credit guarantee corporation and GCGS = green credit guarantee scheme. Source: The authors following [7]. Note: The numbering shows the sequence of the workflow.

Figure 8.
Establishment of a CGS for reducing the supply–demand gap of finance in waste management projects. CGC = credit guarantee corporation. Source: Authors.
Figure 8.
Establishment of a CGS for reducing the supply–demand gap of finance in waste management projects. CGC = credit guarantee corporation. Source: Authors.

Figure 9.
Establishment of community-based funds for waste management projects. NGO = non-governmental organization and WMTF = waste management trust fund. Source: Authors.
Figure 9.
Establishment of community-based funds for waste management projects. NGO = non-governmental organization and WMTF = waste management trust fund. Source: Authors.


Table 1.
Tools and instruments for green investments.
| Goal | Functions | Tools and Instruments |
|---|---|---|
| Facilitate access to finance/investment | Providing long-term finance/capital Facilitating access to private finance/capital | Equity investment International climate funds Public–private partnerships Institutional investors (pension funds, insurance companies, etc.) |
| Reduce risk | Risk-sharing Credit enhancement mechanism | Green credit guarantee scheme Financial de-risking Policy de-risking Structured finance Public–private partnership |
| Raise the rate of return | Making green projects feasible | Utilizing the spillover effect in the form of tax refunds to private investors |
| Increase capacity | Aiding project development Reducing project risks | Technical assistance Capacity building Information tools (e.g., energy certificate tracking, etc.) |
© 2020 by the authors. Licensee MDPI, Basel, Switzerland. This article is an open access article distributed under the terms and conditions of the Creative Commons Attribution (CC BY) license (http://creativecommons.org/licenses/by/4.0/).
Share and Cite
MDPI and ACS Style
Taghizadeh-Hesary, F.; Yoshino, N. Sustainable Solutions for Green Financing and Investment in Renewable Energy Projects. Energies 2020, 13, 788. https://doi.org/10.3390/en13040788
AMA Style
Taghizadeh-Hesary F, Yoshino N. Sustainable Solutions for Green Financing and Investment in Renewable Energy Projects. Energies. 2020; 13(4):788. https://doi.org/10.3390/en13040788
Chicago/Turabian StyleTaghizadeh-Hesary, Farhad, and Naoyuki Yoshino. 2020. "Sustainable Solutions for Green Financing and Investment in Renewable Energy Projects" Energies 13, no. 4: 788. https://doi.org/10.3390/en13040788
Note that from the first issue of 2016, this journal uses article numbers instead of page numbers. See further details here.