Life Cycle Assessment of Electricity Generation from an Array of Subsea Tidal Kite Prototypes


1
Division of Environmental System Analysis, Department of Technology Management and Economics, Chalmers University of Technology, 412 96 Gothenburg, Sweden
2
CIRAIG, Department of Industrial Engineering, École Polytechnique de Montréal, P.O. Box 6079, Succ, Centre-ville, Montréal, QC H3C 3A7, Canada
*
Author to whom correspondence should be addressed.
Energies 2020, 13(2), 456; https://doi.org/10.3390/en13020456
Submission received: 11 December 2019
/
Revised: 7 January 2020
/
Accepted: 14 January 2020
/
Published: 17 January 2020
(This article belongs to the Special Issue Marine Renewable Energies: From Technological Advancements to Environmental Impact Assessment)
Abstract
:Tidal current technologies have the potential to provide highly predictable energy, since tides are driven by lunar cycles. However, before implementing such technologies on a large scale, their environmental performance should be assessed. In this study, a prospective life cycle assessment (LCA) was performed on a 12 MW tidal energy converter array of Minesto Deep Green 500 (DG500) prototypes, closely following the Environmental Product Declaration (EPD) standards, but including scenarios to cover various design possibilities. The global warming potential (GWP) of the prototype array was in the range of 18.4–26.3 gCO2-eq/kWhe. This is comparable with other renewable energy systems, such as wind power. Material production processes have the largest impact, but are largely offset by recycling at the end of life. Operation and maintenance processes, including the production of replacement parts, also provide major contributions to environmental impacts. Comparisons with other technologies are limited by the lack of a standardized way of performing LCA on offshore power generation technologies.
1. Introduction
The energy sector is the largest contributor to the global greenhouse gas (GHG) emissions [1]. This has led to the development of renewable energy resources with lower carbon footprints. Wind energy, for example, became the second largest power generation source in Europe, just after gas, with an installed capacity of 169 GW in 2017 [2]. However, wind energy comes with intermittency and unpredictability, due to variable wind conditions [3], requiring substantial support technologies for load balancing. Wind power is also perceived as noisy and visually interfering [4]. Tidal streams, on the other hand, are easily predicted [5], since they are generated by the rise and fall of the sea level due to gravitational forces of the moon, sun, and earth. Yet, an important factor limiting the application of tidal streams is their relatively slow speed, and the problem associated with constructing turbines with a sufficiently low cut-in speed for starting electricity generation. The first generation tidal farms require 2.5 m/s of current to start [6], making them economically viable in restricted geographical places.
According to Clarke, et al. [7], tidal current power stations could be used as base load technologies if these stations are distributed in an efficient way. Furthermore, wave and tidal stream energies have the potential to meet up to 20% of the UK’s electricity demand, representing a 30 to 50 GW installed capacity [8]. However, only a small portion (57 MW) of tidal capacity potential is expected to be installed in Europe by 2020 [9].
Given the promising potential of large-scale adoption of tidal current power generation technologies, the development, though, should be taken in a precautious manner. This development could lead to negative environmental impacts during the full life cycle (material extraction and production, manufacturing, use, and end-of-life) of the power plants. The life cycle assessment (LCA) has been widely used to assess the environmental impacts of energy technologies, where a literature review for LCAs of wind power, for example, analyzed more than 30 studies already in 2012 [10]. The majority of the emissions associated with the life cycle of wind electricity generation occurred in the production of various components.
Such studies are still scarce for marine energy technologies in general, and tidal current ones in specific. Douglas, et al. [11] were the first to study the environmental profile of a tidal energy technology (SeaGen) using LCA. While the study aimed at including the details of all the life cycle phases, the operations and maintenance (O&M) phase was not fully modelled. The replacement of the powertrain was not included, which resulted in a minor contribution from the O&M phase to the total impact. In fact, Arvesen, et al. [12] found that previous LCA studies on offshore wind farms, which require similar operations to tidal energy farms, usually underestimated the impacts of offshore operations (through ships) and spare parts. According to that study, offshore operations, including installation and maintenance, amounted to 28% of total greenhouse gas emissions, of which half were from maintenance alone. Uihlein [13] studied the impact of different tidal technologies by performing LCA on 83 tidal devices retrieved from the Joint Research Centre’s (JRC) ocean energy database. Although the database includes various information such as weights, dimensions, and material, a lot of the data had to be estimated to fill the gaps. For example, 90% of the inventory data for structural components in horizontal axis turbines were estimated based on averages of different technologies. Furthermore, several parameters were excluded, such as the electrical losses from the connections (cable, connector, and hub), the substations, and the spare parts.
Deep Green is a tidal technology which solves a major issue in other technologies. Having its cut-in speed at only 1.2 m/s, it is capable of functioning in slower currents, while operating at depths between 60 and 120 m [14]. The potential impacts of the Deep Green on local marine ecosystems have already been studied [15,16], where it was found that phytoplankton dynamics and benthic communities were unlikely to be altered by its operation. A preliminary LCA was also done on Deep Green at an early planning stage [17]. However, prototypes with improved design have been deployed after that, and better inventory data could be obtained. Thus, an updated LCA study on this technology would complement other studies and give a more accurate and comprehensive picture of its environmental profile.
The purpose of this study was to assess the environmental impact of an array of 24 DG500 prototypes at the current state of development through the entire life cycle. A prospective LCA approach was applied on a 12 MW rated power array of DG500, planned to be established 8 km off the shore of Holyhead, UK. Comparisons are also made with previous assessments of other energy technologies with a focus on tidal technologies.
The Array of Powerplants
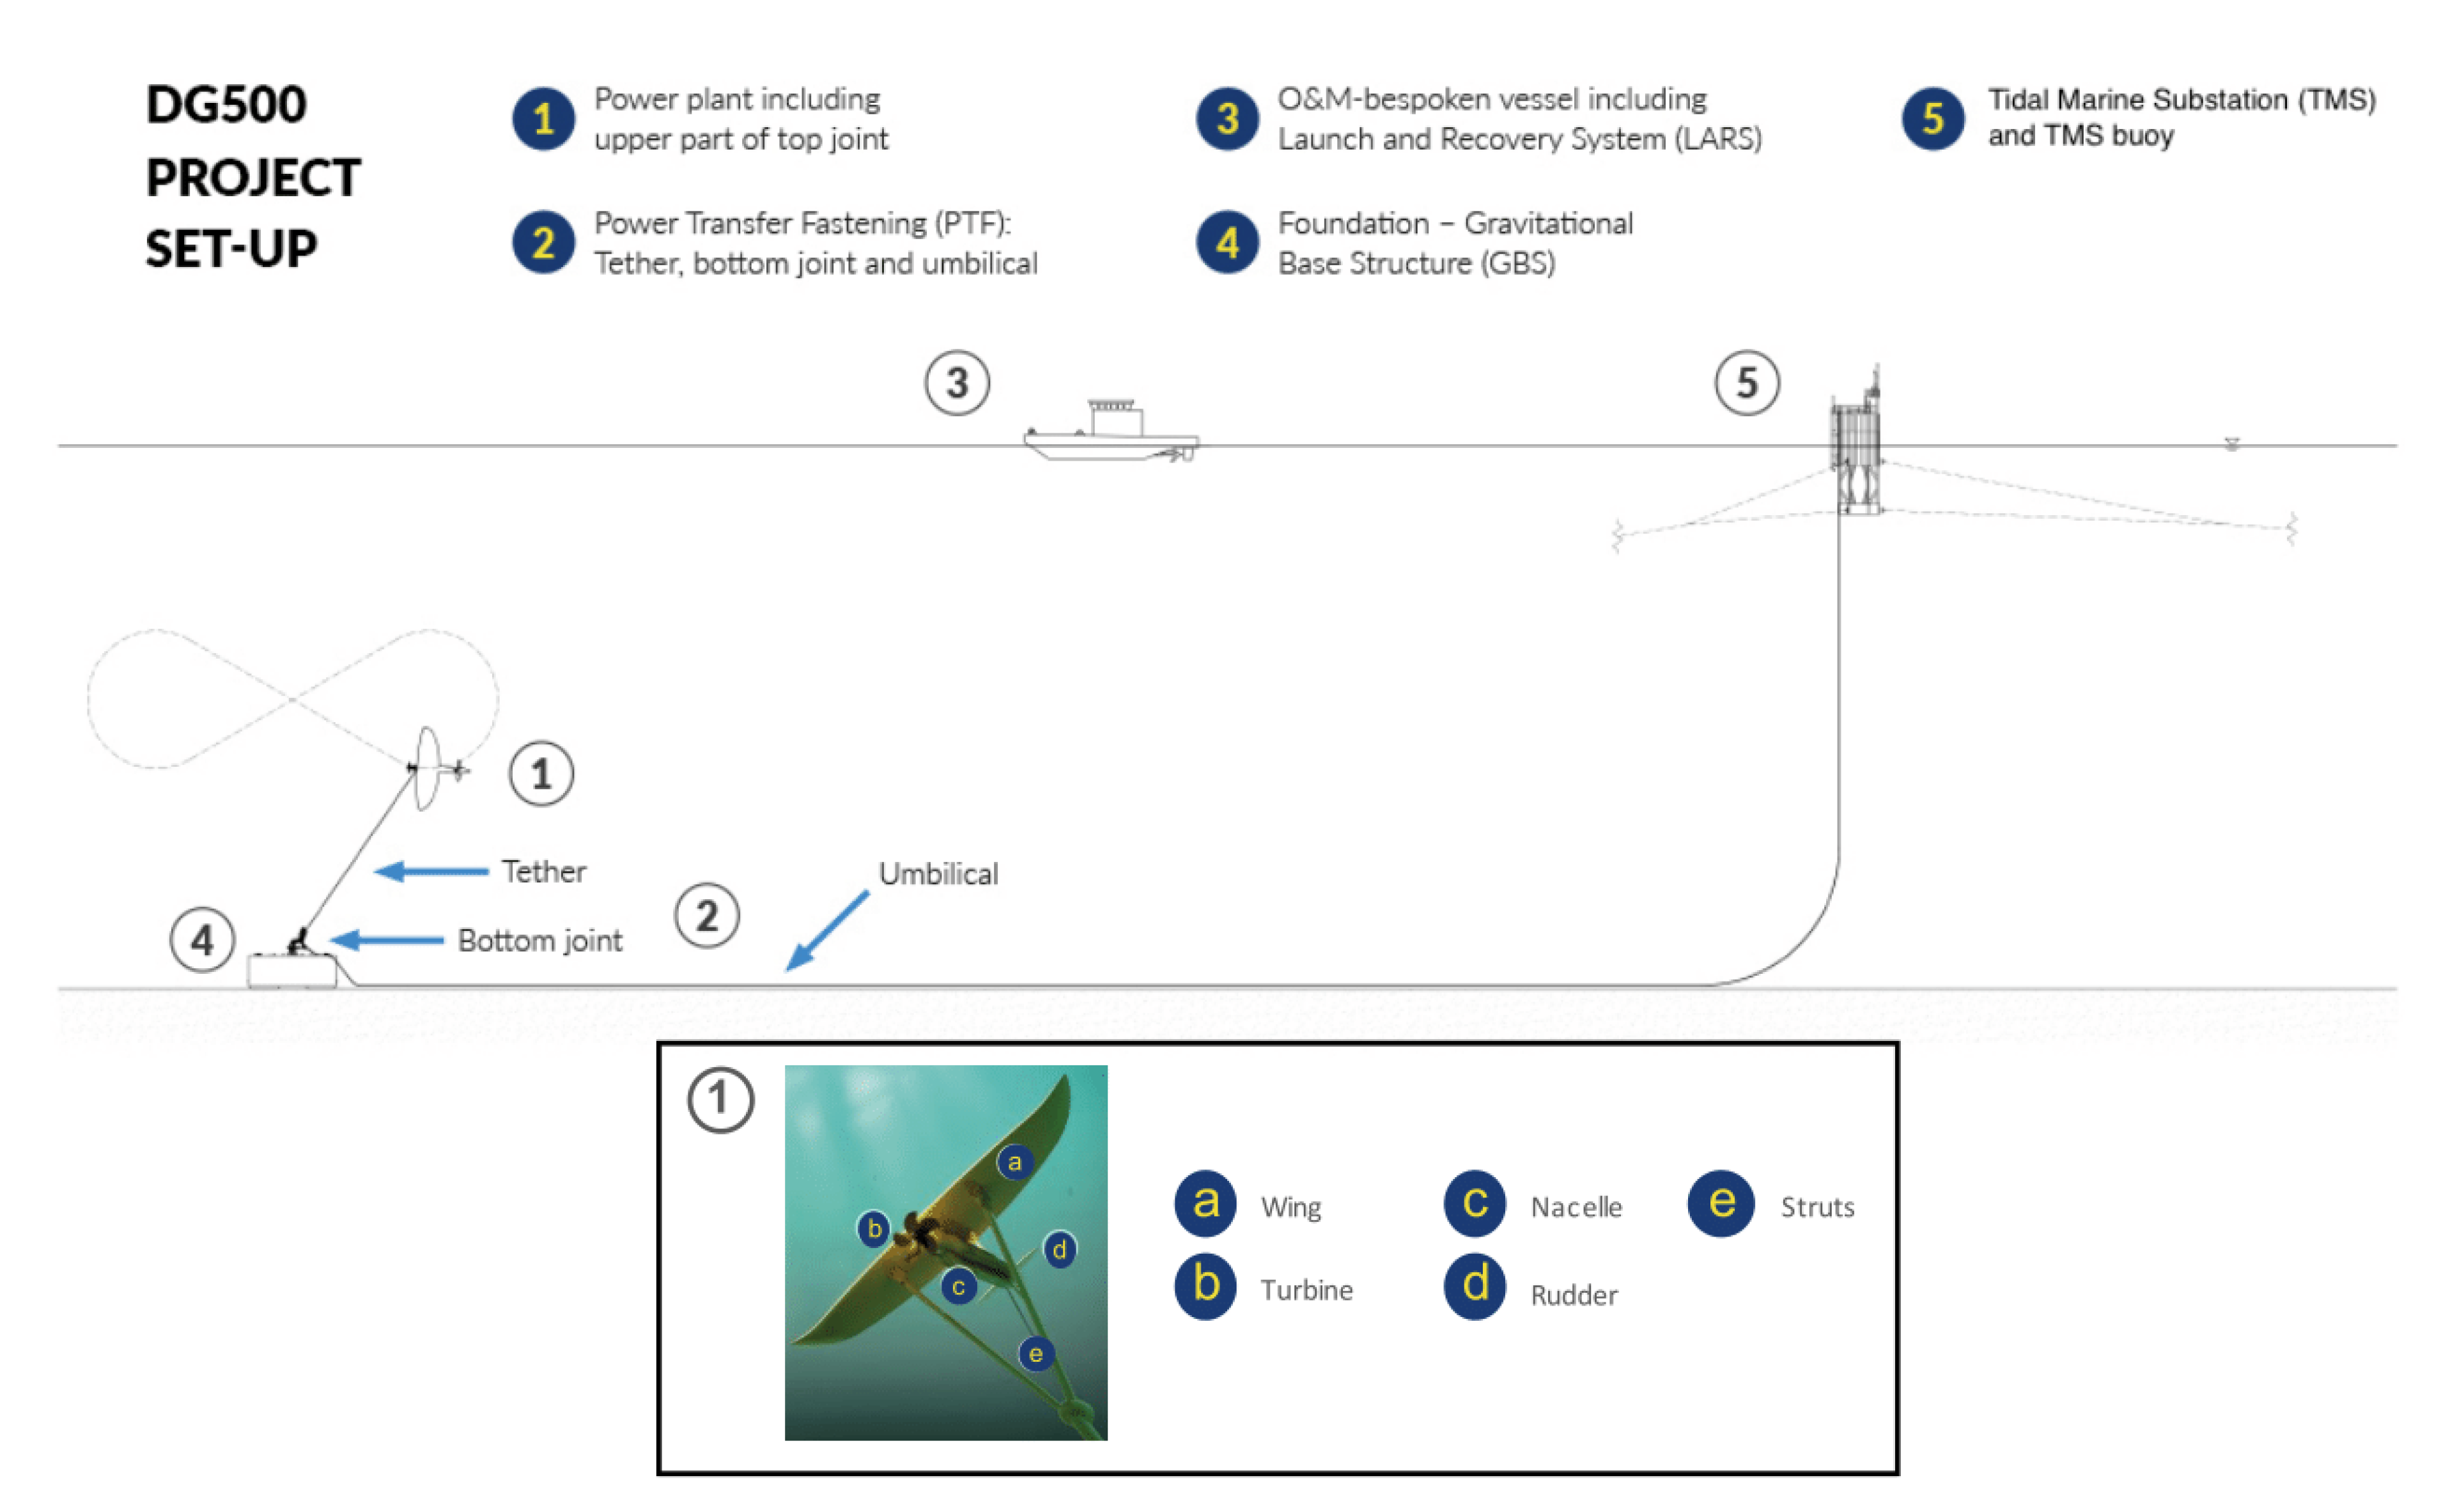
Figure 1 represents a schematic of the model of the tidal energy array assessed in this study, and Table 1 contains its main system specifications [14]. Each DG500 kite was connected to its gravity base foundation by a tether (containing the umbilical system) through the bottom joint. Every group of six DG500s was connected to a tidal marine substation (TMS) located on a floating buoy, which was connected to the onshore substation. It was assumed that the array would consist of 24 installed DG500s and four TMS buoys, one of which would also act as a substation. Furthermore, an additional two spare DG500s were assumed to be located onshore to facilitate efficient service and maintenance. The substation in turn was connected to the UK national electricity grid. The array was assumed to have a lifetime of 25 years.
2. Materials and Methods
This study was a prospective LCA [18] of a 12 MW array of 24 DG500 prototypes developed by Minesto AB [14]. The LCA was done according to the ISO 14040:2006 standard [19], covering scoping, life cycle inventory (data gathering), life cycle impact assessment, and interpretation of results. Furthermore, it followed the technical scope defined in the Product Category Rules (PCR) for electricity production technologies, as defined in the Environmental Product Declaration (EPD) System [20]. The system was modelled using openLCA software [21]. Most of the information needed for the downstream processes was obtained from Minesto and connected to the upstream data provided by the ecoinvent database version 3.3 [22]. Data gaps, when found, were filled from other LCA studies or available EPDs. ReCiPe version 1.11 [23] was used for impact assessment.
A brief literature review on available LCA studies of tidal power technologies was performed after commencing the LCA, to investigate the effect of various modelling parameter choices on the robustness of the results. Although most studies reported the results in terms of global warming potential (GWP), additional impact categories were applied to the DG500 array to enable a comparison with a study by Hertwich, et al. [24], covering a wide set of different energy generation technologies, and a study by Uihlein on tidal technologies [13].
2.1. LCA of the DG500 Array
2.1.1. Goal and Scope
This study aimed to assess the environmental impact of an array of tidal current power plants (Deep Green) planned to be installed at the Holyhead Deep site in Anglesey, UK. Since the power plant and the array were still in the prototype phase, assumptions about some technical requirements and performance metrics were taken. Different scenarios were covered to overcome these inherent uncertainties. One such important aspect was the power output, which was set to a projected hypothetical base scenario of 2 GWh/yr per kite at the selected site and an optimistic case of 3 GWh/yr.
The functional unit was chosen as one kWh of electricity delivered to the consumer connected to the UK grid. The study included the cradle-to-grave production and operation of the entire array, covering the extraction and production of raw materials, transportation, manufacturing, installation, operation and maintenance, and end of life (EOL). It also included the production of factories for the processing of materials, the manufacturing of subsea export cables, the building of an onshore substation and maintenance center, and the UK grid.
This is a site-specific study, which affects the natural conditions for the operation of the DG500, such as the tidal current speed. The site also affects the transportation distances for the materials, and the utility electricity used for the production. The grid distribution to the final user was based on the UK national grid. The raw materials, however, were produced in both the UK and Sweden; thus, utility electricity and transport distances were modelled accordingly. The expected lifetime of a DG500 is 25 years. However, the model did not take into account future technical developments (including the background system).
2.1.2. Life Cycle Inventory Analysis
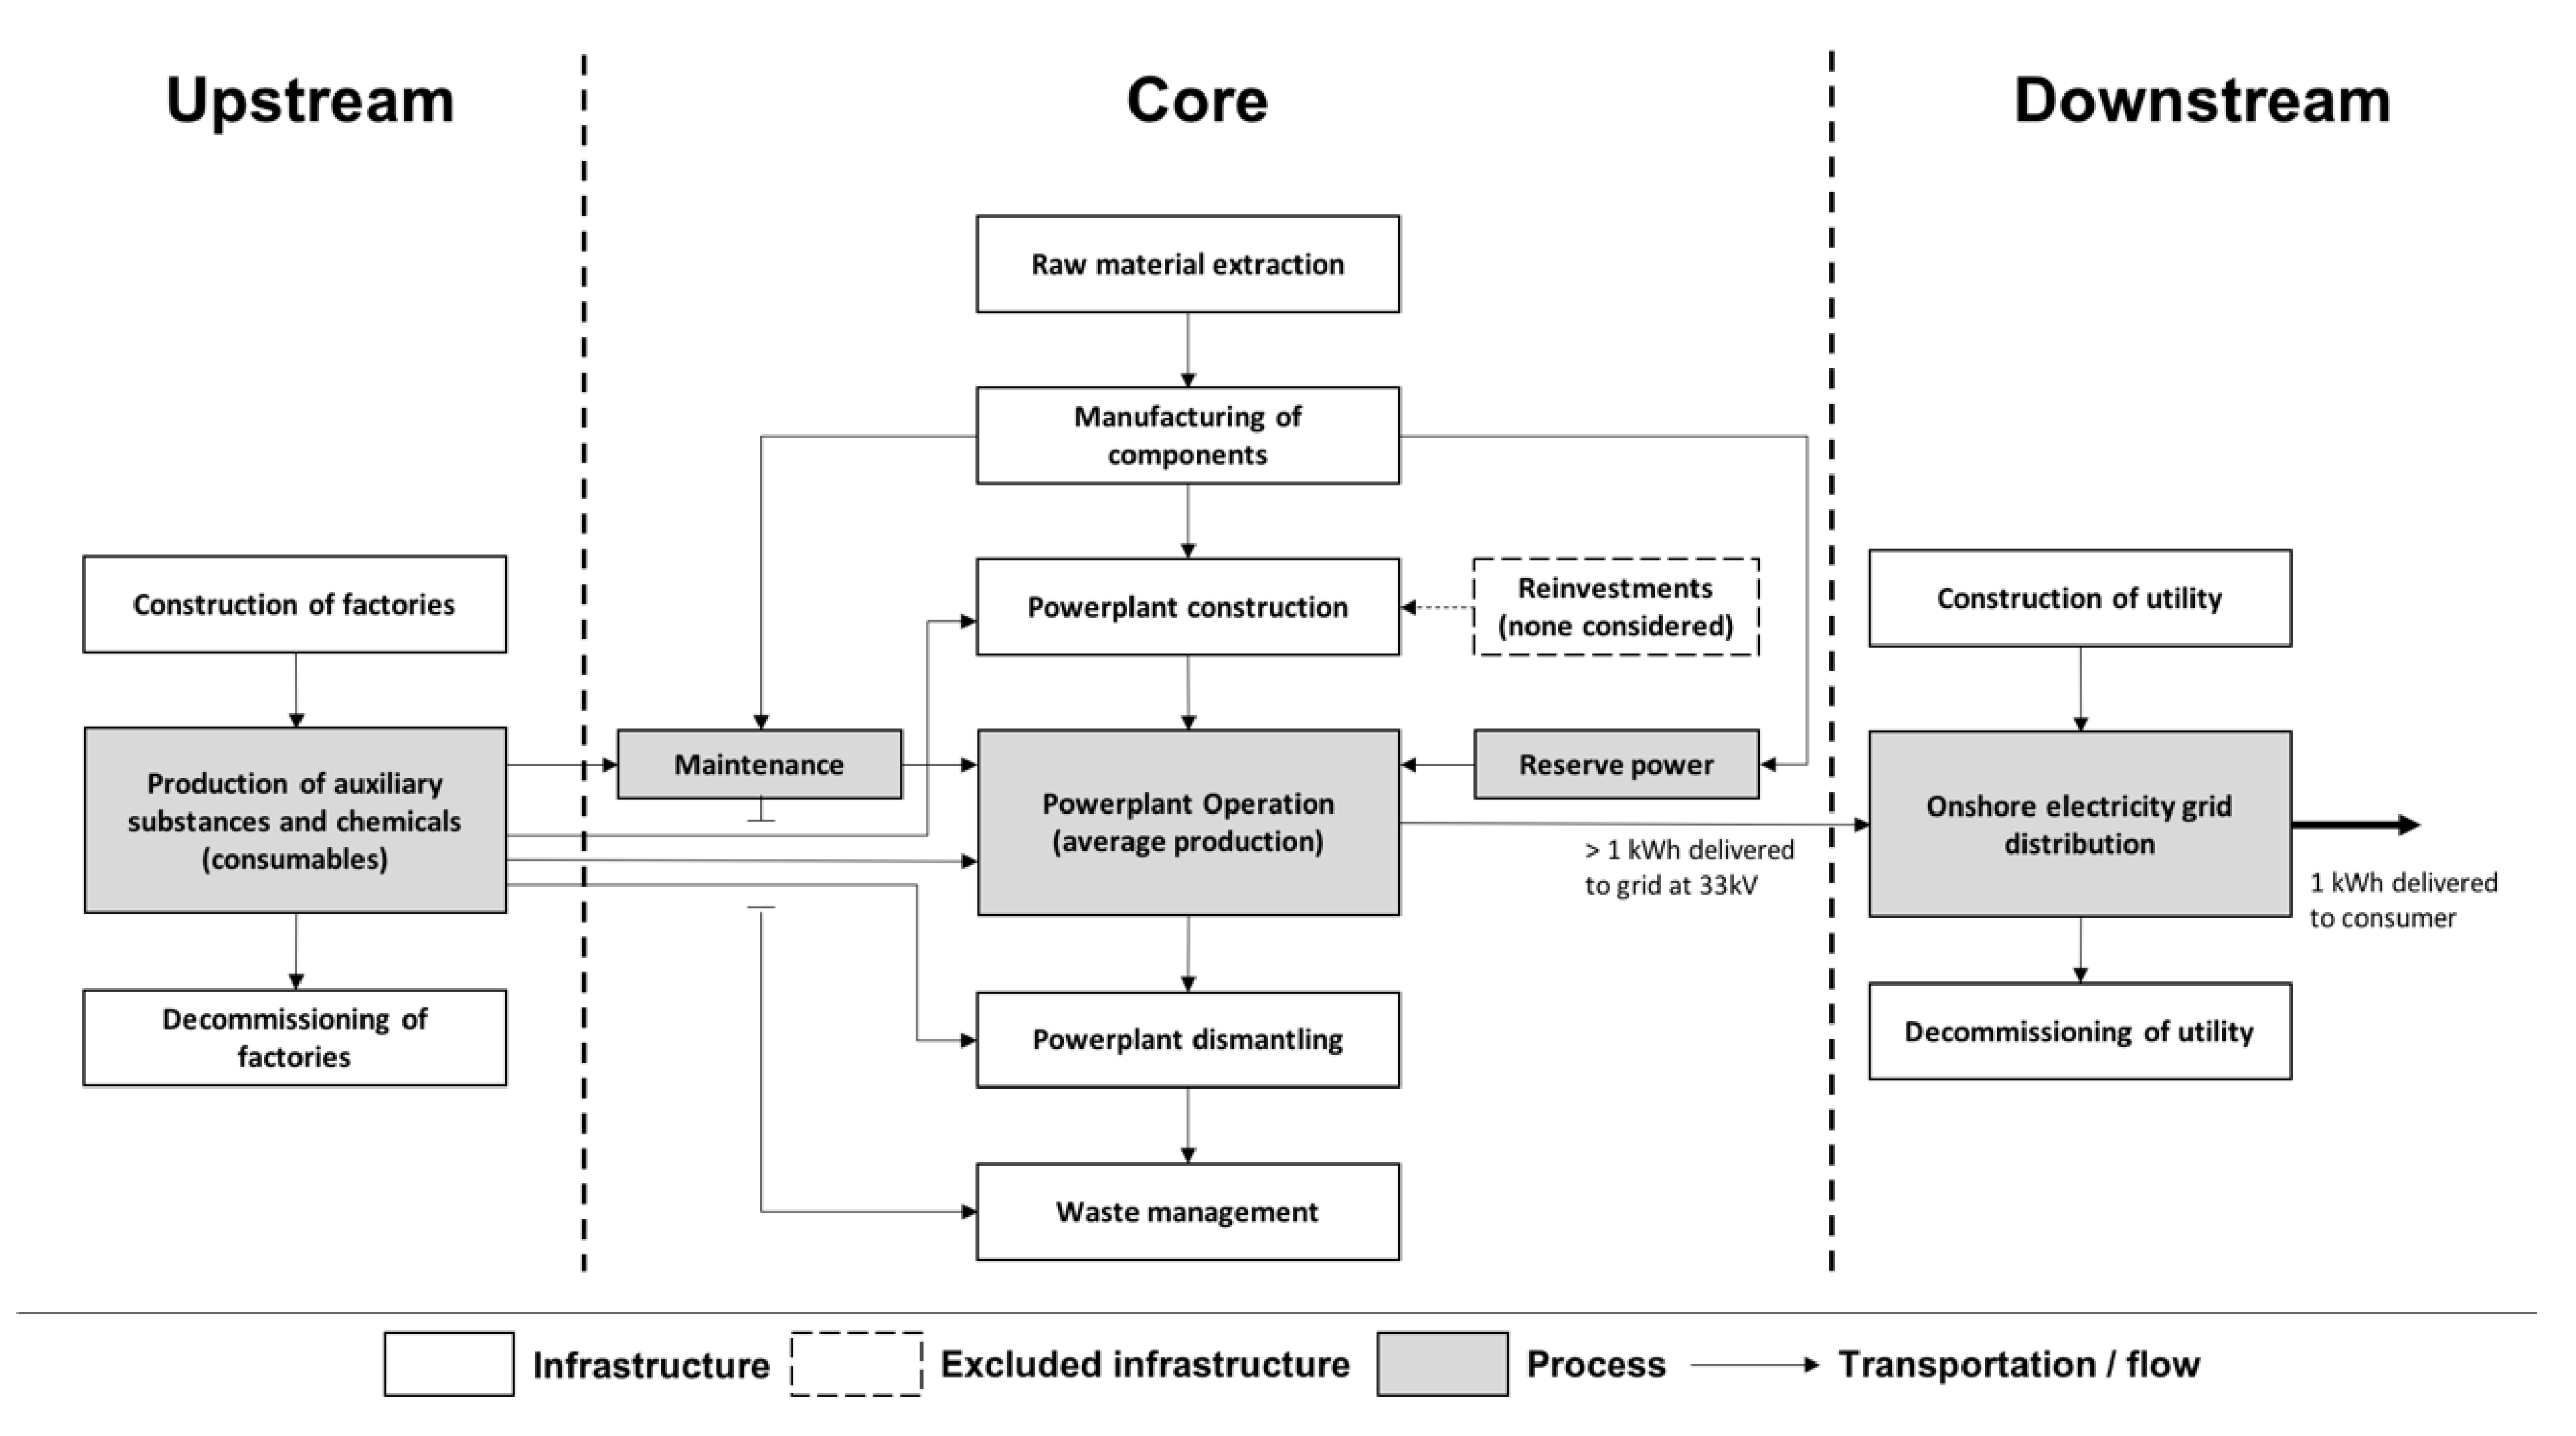
The inventory analysis was based on the system’s flow chart (Figure 2). Inventory data and processes used in the openLCA are provided in the Supplementary Materials.
Kite and Umbilical System
The main component of the DG500 tidal current power plant is the tidal energy converter (“kite”). The kite consists of a wing, a turbine, a nacelle, a rudder, struts, and a top joint that connects to the tether (Figure 1). The wing has a wingspan of 12 m and is used to create lift and propulsive force for the kite. The wing is a composite structure with metal inserts for attachment to the nacelle and the struts. Guided by the rudders, the kite sails the ocean current in a continuous infinity (∞) trajectory.
The tidal current energy is collected by a 1.5 m diameter turbine attached to the nacelle. The nacelle is 9 m long with a 0.9 m diameter steel housing that encapsulates the electronic equipment, including a generator, a gearbox, and two converters. This system transforms the kinetic energy of the turbine to electrical energy which is transferred through the umbilical (cable). The nacelle also includes sensors and electronics for controlling the rudder and providing kite performance control data. The front struts connect the wing to the top joint and transfer most of the tether load. The top joint connects the kite to the tether system. The kite measures 9.8 m from the top of the rudder to the top joint.
With 24 kites in the array, two additional complete kites are needed for swap-out during maintenance, totaling 26 kites produced for the power plant.
The tether system consists of tether fairings, a tether rope, and an umbilical cable including power and communication signal cables. Each tether is between 80 and 120 m in length. The rope carries the pull force of the kite. The tether system connects to the kite at the top joint and to the gravity based foundation (GBF) at the bottom joint. The tether fairing, made of various plastic materials, covers the rope and cables, while also reducing the flow resistance. Manufacturing of the tether involves significant energy demand during the polyurethane curing.
The data for the kite materials and assembly were mainly provided by Minesto. Additional data for the converter and the generator were taken from ABB EPDs of the ACS 600 frequency converter [25] and DMI type DC machine [26], respectively, both scaled to match the onboard components. Data (mainly VOC emissions) for the paint were taken from the Jotun data sheet [27], and from a carbon fiber LCA by Romaniw [28].
Gravity Based Foundation
The GBF anchors the kite to the seafloor. Three different GBF designs have been assessed. The first GBF design (base scenario) is a concrete block with steel reinforcement. The other two alternatives are “Bsteel”, a steel foundation consisting of a steel-based center node with 4 steel mooring chains and anchors, and “Bhybrid,” a hybrid foundation similar to the steel foundation; however, the center node is based on a concrete block with steel reinforcement.
Tidal Marine Substation and Sub-Hub
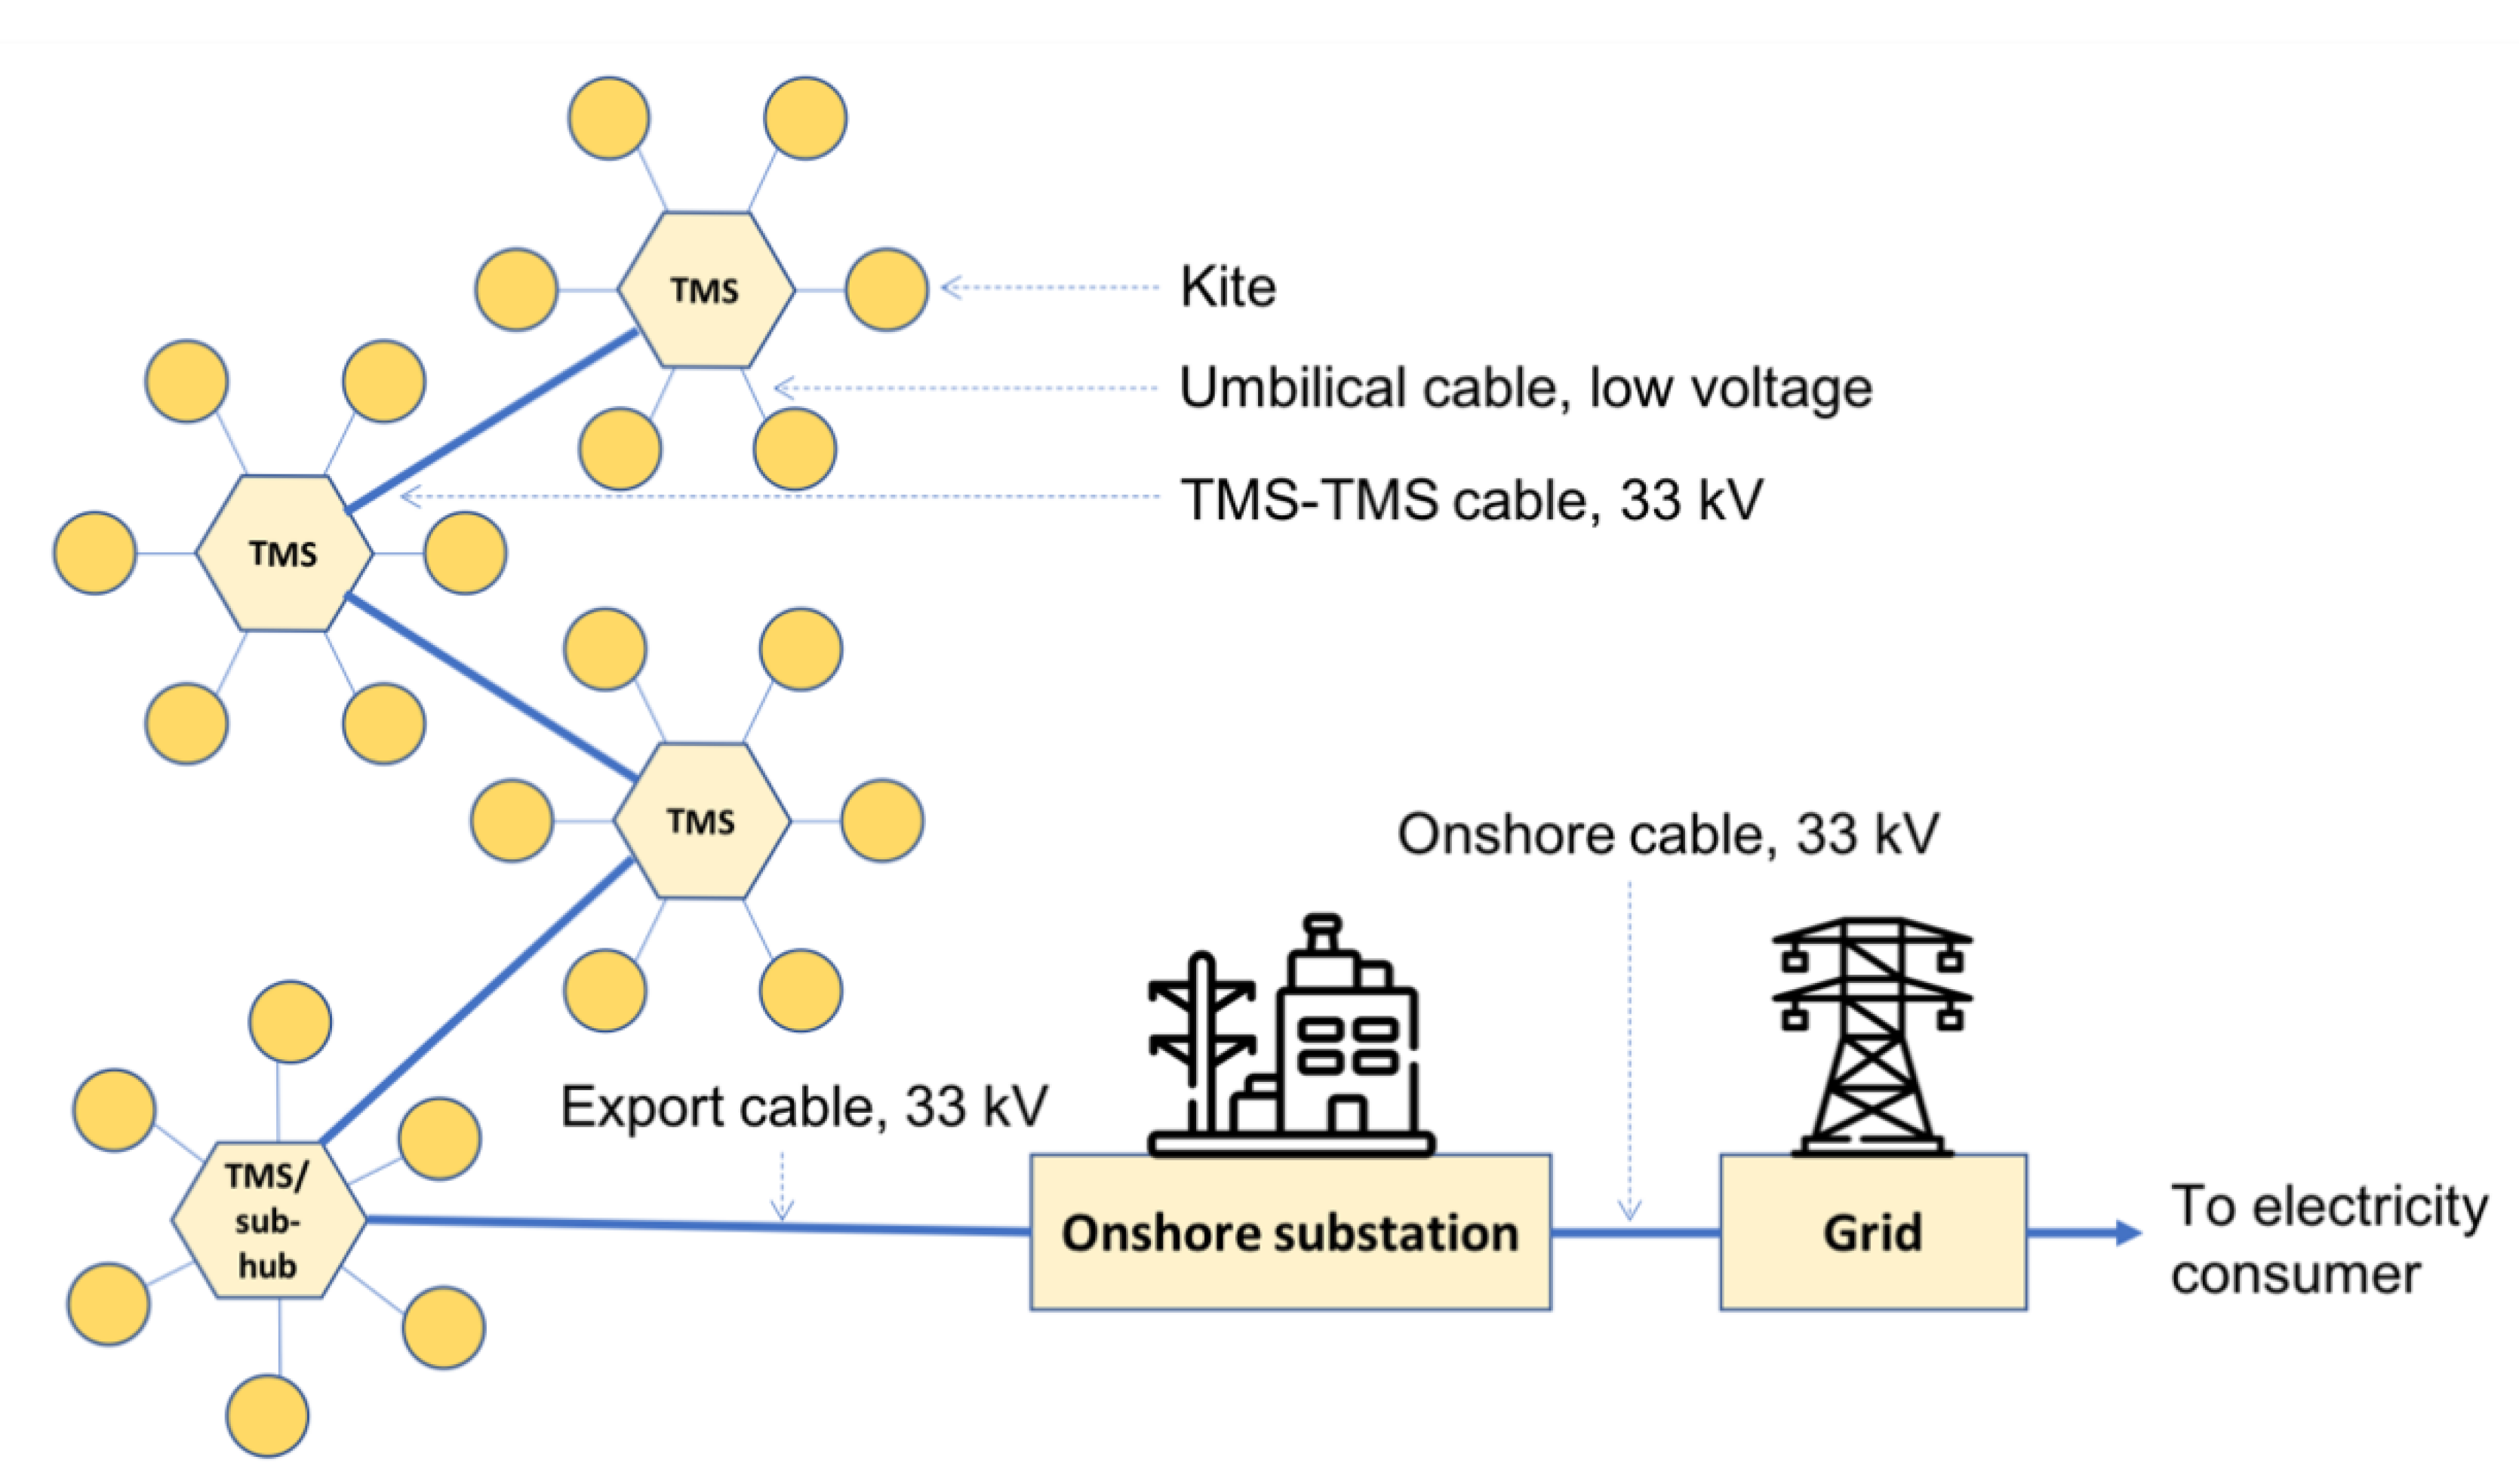
The tidal marine substation (TMS) was used to receive the electric energy from the kites (6 kites per TMS in this system) through the kites’ umbilical cables, and to step-up the voltage to 33 kV through a transformer. The TMS buoy is anchored with polyester mooring lines to a clump weights made of recycled steel. The transformer is connected to the sub-hub, which in our case was one of the TMSs, through a TMS–TMS cable. The sub-hub is connected to the onshore station through a subsea export cable. This is illustrated in Figure 3. The transformers used were modelled according to the ABB EPD for a large distribution transformer [29] and adjusted to the power levels of the DG500 devices.
Cables
There are four types of cables that transfer the electricity from the kite to the grid: the umbilical cable, the TMS–TMS cable, the export cable, and the onshore cable (Figure 3).
The 500 m, low voltage umbilical cable connects to the kite at the top joint, runs through the tether, and continues beyond the bottom joint on the seafloor to the TMS. The 33 kV TMS-TMS cables connect three of the TMSes to the sub-hub. (The sub-hub is itself a TMS, and hence needs no additional TMS–TMS cable.)
There are currently three options concerning how the 33 kV subsea and onshore cables are going to be installed. For this study, the shortest offshore path was assumed with an 8000 m subsea export cable and a 4500 m onshore cable.
Data for the cables are based on the technical data sheet from Nexans (2013) [30].
Onshore Substation
The main purpose of the onshore substation is to connect the power plant to the national grid. Various monitoring activities also take place there. Since the voltage is already at grid level after the TMS, no further transformation is needed. Next to the substation, there is a building for the maintenance of the kites, consisting of 2 bays for the current 12 MW array. The houses were modelled with the dimensions provided by Minesto and using a building dataset from the ecoinvent database. The electrical components (the reactor and earthing transformers) were modelled according to the ABB EPD for large distribution transformer [29].
Transports and Power Plant Construction
The transports of different parts of the DG500 from the manufacturing sites to the Holyhead site were modelled by train, lorry, or ship, according to the location of the supplier of each component (see Supplementary Materials). In the on-site construction phase, different vessels are used to install different parts. This includes towing and installing kite foundations, deploying the tether with bottom joint and umbilical, deploying the TMS, and deploying the export cable. Assumptions on standby times for the vessels, where diesel consumption was less, were also included. Vessels include different tugboats, multicats, and ships. This phase was modelled by the diesel combustion used by the vessels according to Jivén, et al. [31]. The total diesel needed for the complete array was approximately 820 tonnes.
Operation and Maintenance
The kite is expected to start moving with the tidal current, but when this current is too low, reserve power stored in a battery (modelled in ecoinvent) is used to get it started. Once started, the kite should be able to move by itself with the tidal current. The maintenance was also modelled based on the maintenance scheme provided by Minesto. Diesel powered multicat vessels are mainly used to perform routine and non-routine inspections and maintenance of the kites, buoys, and cables. The diesel needed for all the maintenance trips across the lifetime of the system is around 1160 tonnes. More information about the vessel operations (function of each vessel, time spent in water, idle time, and diesel consumed) is found in the Supplementary Materials. The maintenance phase also includes the production of replacement parts and transportation of those parts to the site. The assumptions of replacement rates and lifetimes for different parts were modelled according to Table 2. All other parts were assumed not to need replacement during the 25 year life time of the power plant.
A scenario was also assessed where the life-time of the tether was doubled to 10 years to assess how this would affect the environmental performance. This could be done by coating the tether with protective material, for example. The onshore maintenance building was modelled as part of the onshore substation. The final step in the operation is the connection to the grid, which was modelled according to the UK grid in ecoinvent (including grid and transformation losses and the infrastructure of the grid).
Dismantling
The dismantling of the power plants was modelled as diesel used to remove different parts based on estimations by Minesto of vessel operations needed. The total diesel needed for the dismantling is around 420 tonnes. This phase also includes the transportation of different parts to different disposal facilities, which is assumed to be done using lorries for an average distance of 100 km.
Waste Management
Modelling the waste management of novel offshore energy technologies requires assumptions, since almost no existing similar power plants (offshore wind farms for example) have yet reached their respective end-of-life stage [32]. For the DG500 tidal array, all the iron (including steel) is assumed to be recycled at a rate of 95% and copper at a rate of 90%, in line with Haapala and Prempreeda [33]. The only exceptions are the steel used for the clump weights and ballast anchor shackles for the TMS, and ballast steel in the Steel GBF scenario, which is not assumed to be recycled due to high uncertainty of recyclability of the lower quality steel made from scrap. The recycling was modelled as end-of-life recycling with avoided burden [34], crediting the system by avoiding production of virgin material, and including the impact of waste collection and treatment. Other waste materials are assumed to either be sent to landfills or incinerators, but no credits (or burdens) have been modelled due to the uncertainties.
Since the GBF contributes significantly to GWP, a scenario was defined where the concrete GBF was re-used once (i.e., the GBF life-time was extended to 50 years) in another system, based on suggestions by Andersen, Eriksson, Hillman, and Wallhagen [32]. Given that GBF has passive, durable components, extending its lifetime will most likely contribute to environmental benefits with no trade-offs [35].
Sensitivity and Scenario Analysis
To study the robustness and sensitivity of some parameters on the results, seven alternative designs were modelled. Those included extending the lifetimes of impactful components, such as the tether and the gravity base foundation (BT and BTR), different gravity base foundation alternatives (Bsteel and Bhybrid), different power outputs (optimistic), and different site locations (favorable site). In a favorable site, the power rating of the kite is higher due to faster current speeds; thus, less kites in total are needed. Besides, such a location would be closer to the shore, and no TMSes are needed to connect the kites, where each kite is directly connected to the onshore substation. Table 3 summarizes the different scenarios analyzed in this study.
2.2. Literature Review
A brief literature review was performed to analyze previous LCA studies of tidal energy technologies. The keywords used for the search were (“LCA” OR “life cycle assessment” OR “life cycle analysis”) AND (“tide” OR “tidal”) using Scopus database on January 3, 2019. That returned 29 articles, three conference papers, two review papers, and one article in press. Of those, only 10 studies were related to tidal energy generation, and only six were chosen for analysis in this study, as summarized in Table 4. Of the 10 related articles, Khare [36] was excluded because it was a hybrid solar-tidal system, and it was not possible to separate the impacts of each part. Uihlein [13] is an extensive assessment of available tidal technologies, but the average of the technologies was presented, and data were taken from a database. This study was not part of the literature review due to the aggregation of data of different tidal turbines into main categories, but used later in the discussion of the results (Section 3.3). Amponsah, et al. [37] and Walker and Howell [38] performed comparisons of different technologies, but were excluded, as they used results directly from other LCA studies [11,39] which are included in our review. Other studies had the LCA performed on the same technologies, but with varying scopes and different results; thus, they were included in the table (SeaGen in [40] and [11]; Severn barrage in [39] and [41]). Although some studies included other impacts in addition to GWP, only GWP was used for the literature review to keep it consistent. The GWP impact from the base case of the DG500 array study done in this paper is included in Table 4 for comparison.
3. Results
3.1. Environmental Profile and Dominance Analysis
Table 5 shows the overall life cycle impact assessment results for the base case scenario of the array.
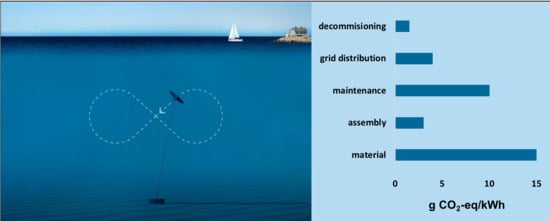
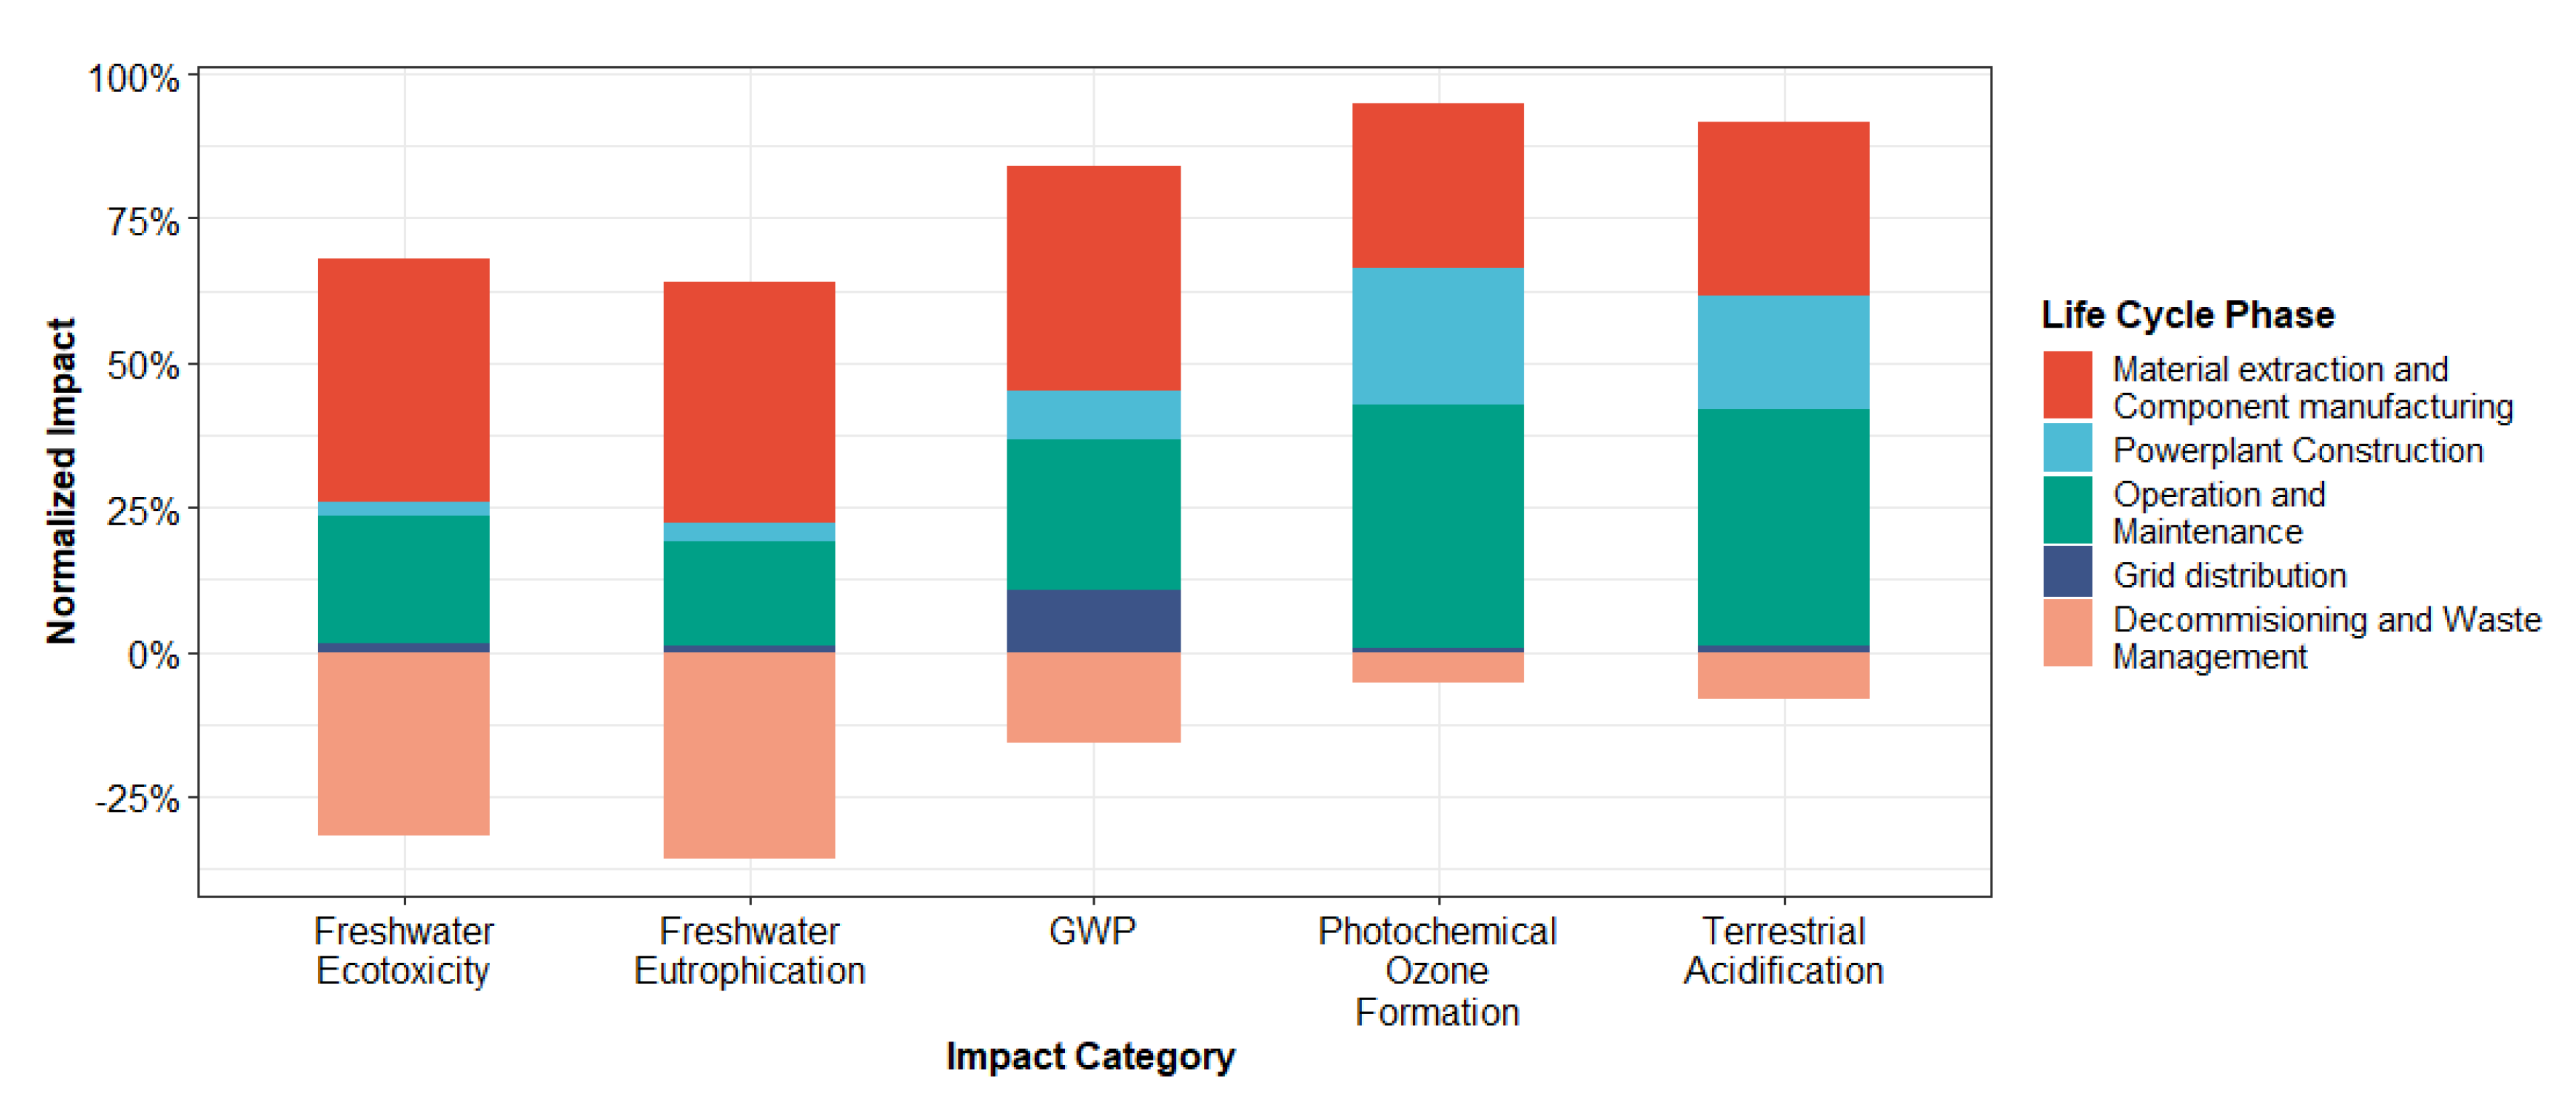
Figure 4 shows the contribution from each lifecycle phase to the different impact categories in the base case scenario. The material extraction and component manufacturing is the dominant phase for most of the impact categories (30% to 42%). This is mainly due to the production of the reinforcing steel in the foundation and other steel production. This is, however, significantly offset by the recycling at the EOL, reducing the net impact.
The other dominant phase is the operation and maintenance, which includes the replacement of parts (18% to 42%). This is highly dominated by the production of the tether spare part, which is replaced quite often (every five years) and needs a lot of electricity for the fairing, and the diesel needed for the ships to perform the maintenance trips. The EOL of the tether is not offset in the EOL analysis, since it is mainly made from polyurethane and polyethylene, which is assumed to be incinerated without energy recovery rather than being recycled.
The power plant construction contributes significantly to impact on ground level ozone formation (24%) and terrestrial acidification (20%). Emissions and losses from downstream processes grid infrastructure and distribution have noticeable contributions to GWP, but are not caused by the power plant.
3.2. Sensitivity/Scenario Analysis
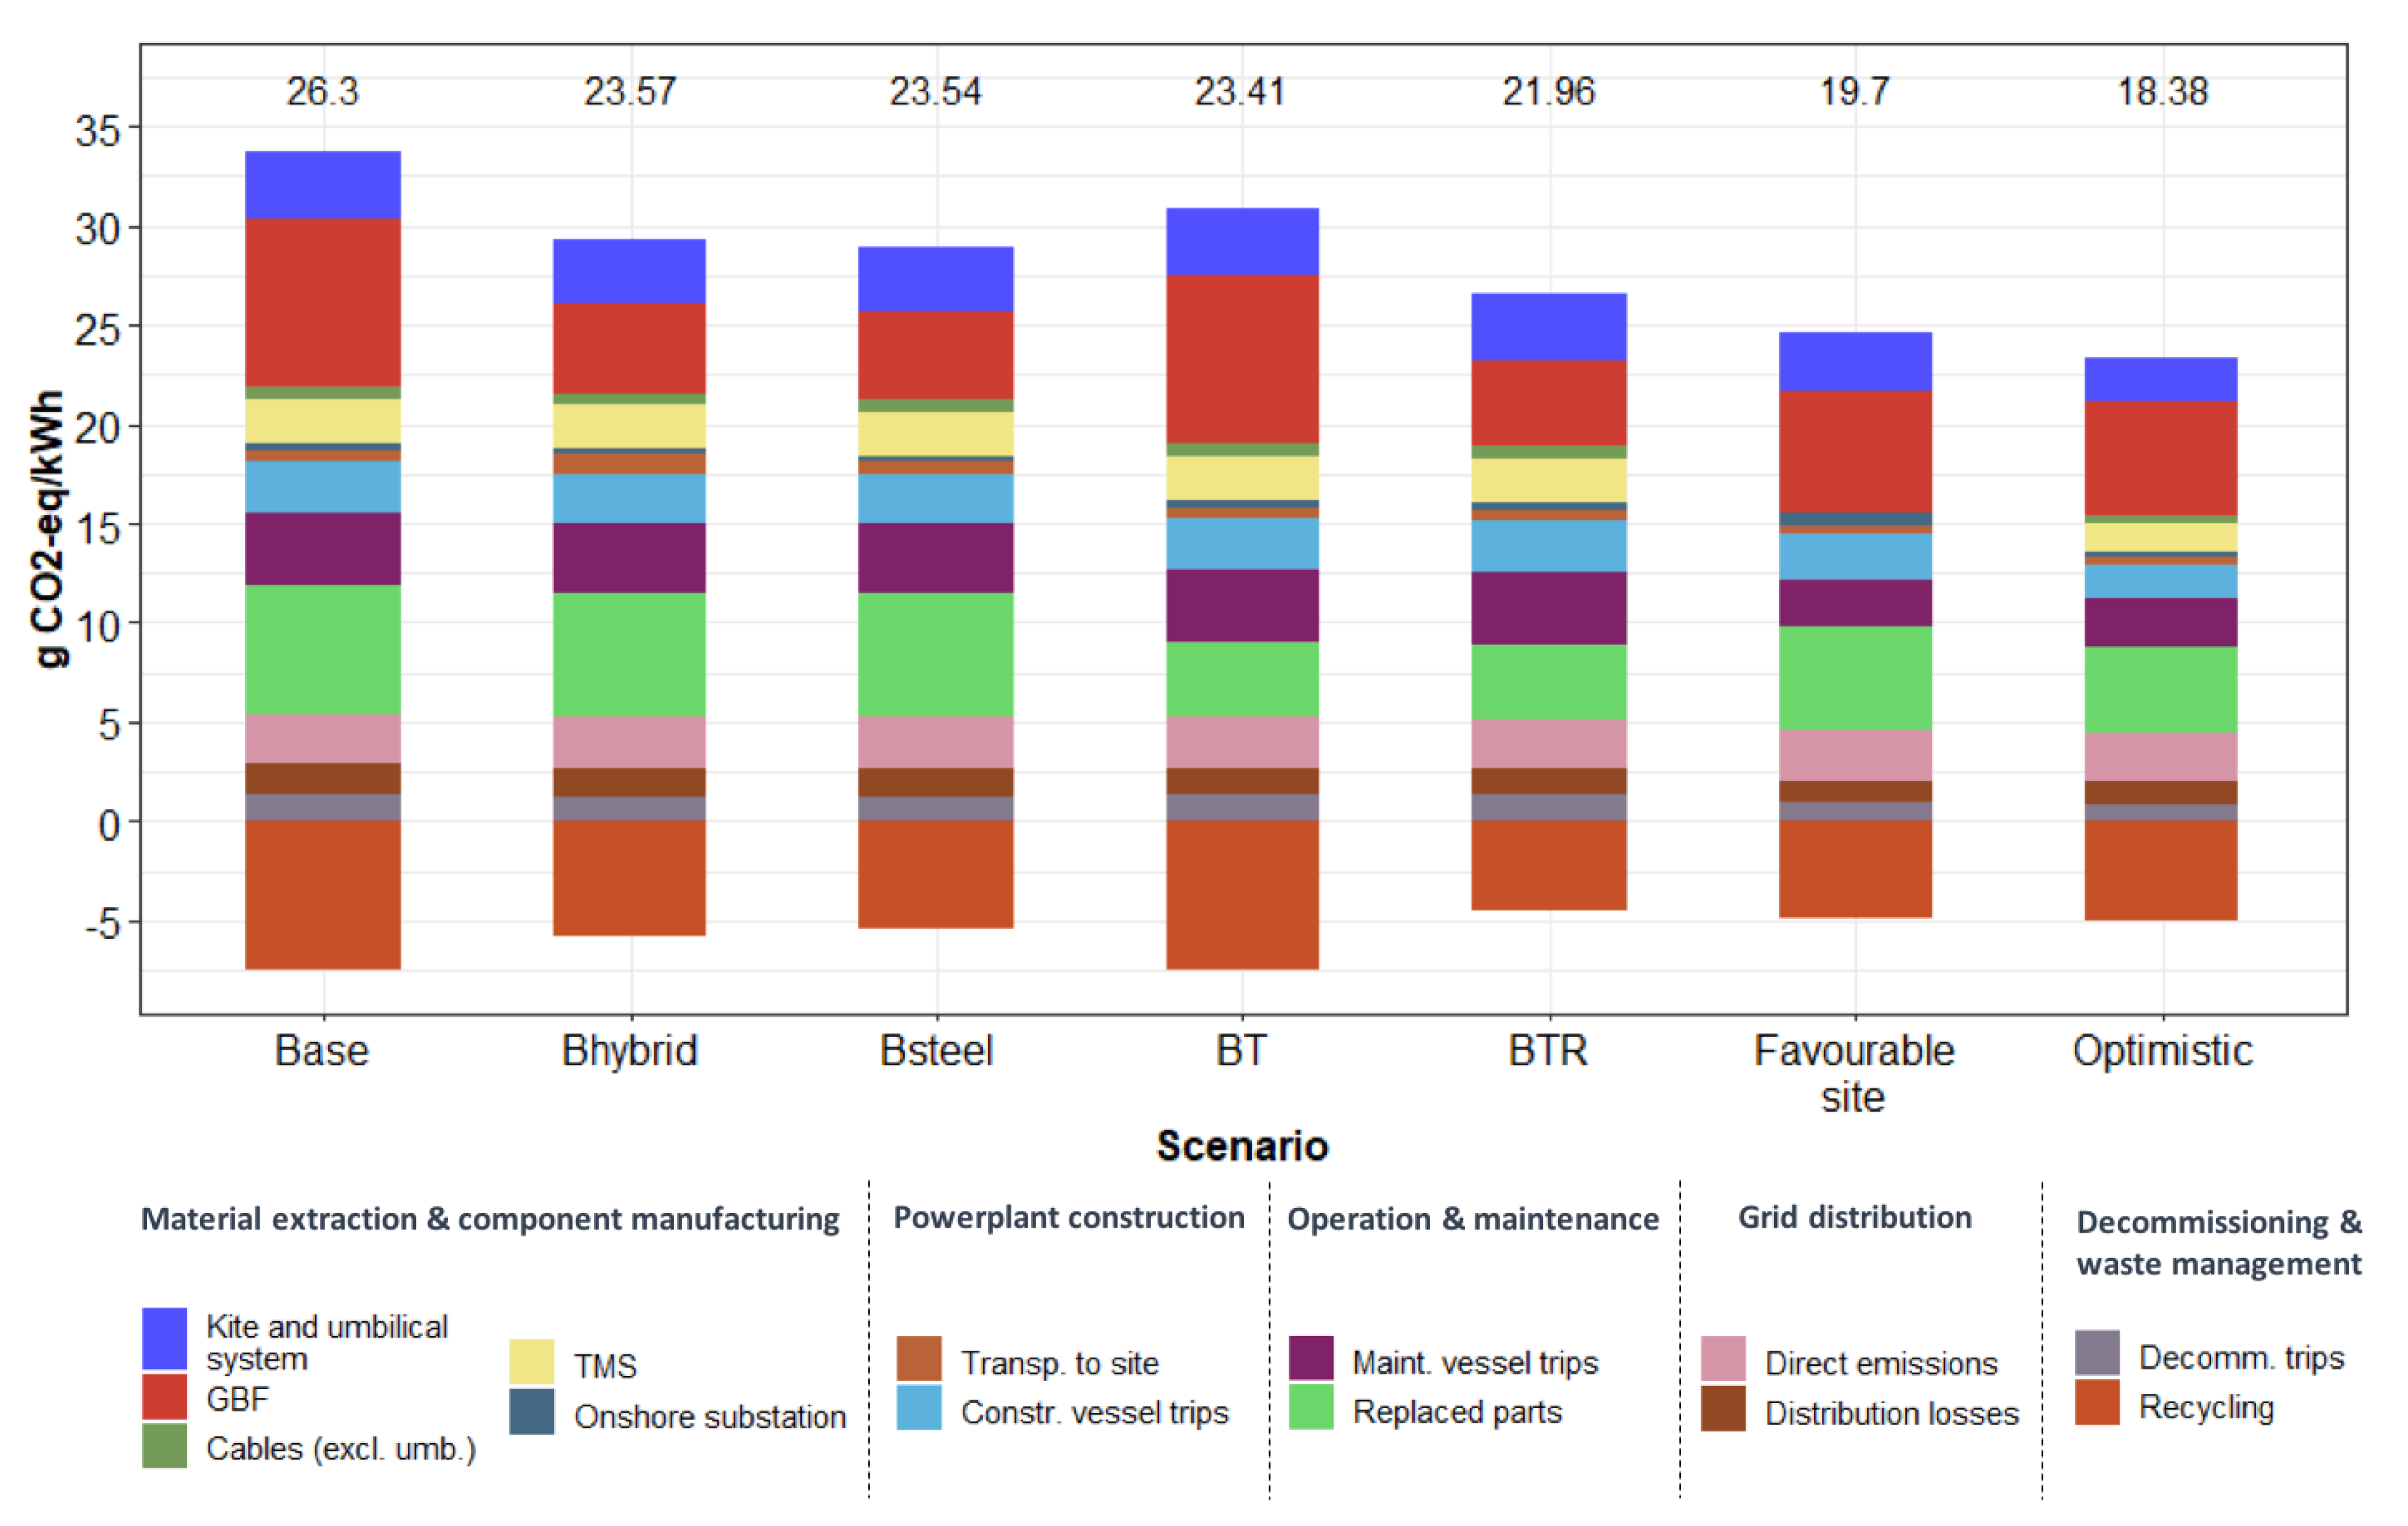
Figure 5 shows the GWP impact results of different scenarios defined in Table 3. As expected, it can be seen that the largest potential of improvement comes with increased power output (i.e., optimistic and favorable site). Changing the material of the gravity base foundation (Bhybrid and Bsteel) shows that there is not much net improvement compared to the base case. However, extending the lifetime of the tether and reusing the GBF (BTR) shows a larger potential improvement. This also shows how sensitive the results could be to the EOL assumptions, where excluding that phase (assuming no recycling) would give more variations in results.
3.3. Comparison with Available Technologies
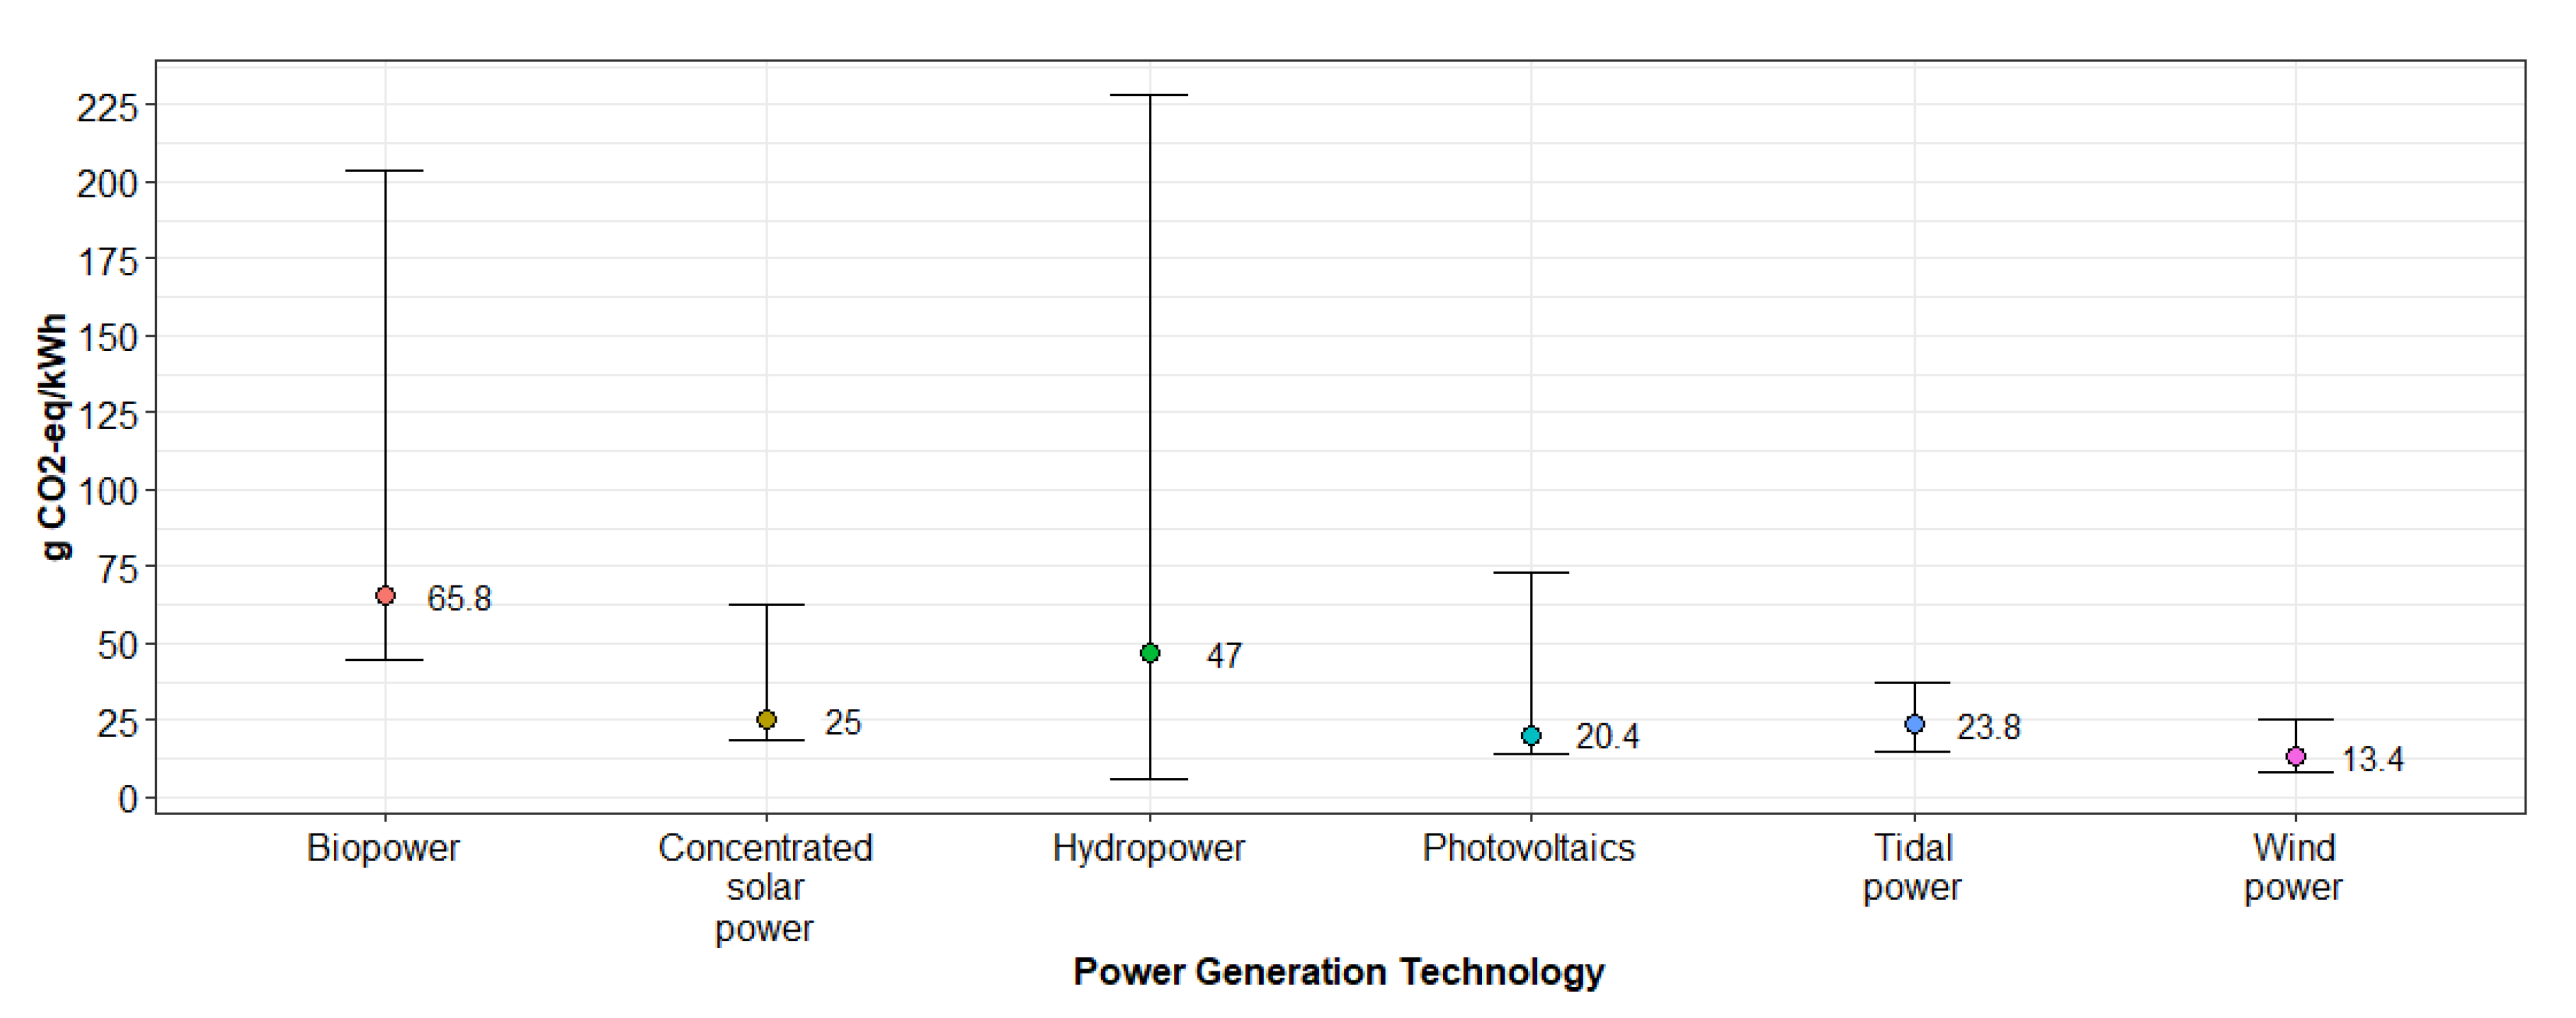
A comparison of the GWP results of the tidal current technologies found in the literature, including the DG500 array (Table 4), with selected renewable energy generation technologies assessed by Hertwich et al. [24], is shown in Figure 6. Note that in the tidal power results, Annapolis was excluded because its structure is similar to a hydropower plant; Severn barrage was too, because it is similar to a dam. Crest energy was also excluded because the data used were just a rough estimation, and a thorough study was not done. For other technologies, the graph excludes the impact of fossil based technologies, i.e., coal and natural gas power plants, to avoid out-of-scale representation of significantly more impactful technologies. It also excludes nuclear power plants, because they use non-renewable fuel, and to avoid misleading conclusions of neglecting its negative impacts in other categories, regarding the controversial issues of nuclear waste, nuclear accidents, and nuclear weapons.
Figure 7 shows the contributions of different life cycle phases to the GWP, wherein the DG500 arrays are compared to other tidal technologies done by Uihlein [13], showing the contributions of different phases to the GWP. The results show that the mooring and foundation production is the most impactful phase of the tidal power technologies, but the maintenance phase seems to be neglected. It is also interesting that Uihlein [13] found the tidal kite technology to be the worst tidal technology, and around three times worse than the results of the base case in this study. The difference is due to the assumed annual energy yield, the state of development of the technology when the study was performed, and data sources used. More about that in the discussion in Section 4.
4. Discussion
4.1. The DG500 Array
The dominant processes for generating power from the DG500 array are the production of the tether (including its frequent replacement), the mooring and foundation, and the maintenance. Comparing the results, impacts in almost all the categories were in-line with offshore wind technologies studied by Hertwich et al. [24], which have similar characteristics to tidal power. The main exception was the cement requirement, which was almost double that required for offshore wind. This may be explained by the relatively small tidal kite devices (0.5 MW/device), where each requires a large cement foundation, compared to around 2.5–5 MW/plant for the wind turbines.
In terms of GWP, the results show that the impact of tidal power (15 to 37 gCO2-eq/kWhe) is in line with that of wind power (8 to 25.4 gCO2-eq/kWhe), and slightly better than concentrated solar power (18.2 to 62.2 gCO2-eq/kWhe) and photovoltaics (14.2 to 73.1 gCO2-eq/kWhe) [24]. The worst tidal power technology is also better than the best performing biopower. This, however, does not include carbon capture and storage, which might give biopower some advantages. Although hydropower could be very clean, it has a large impact range (5.5 to 228.4 gCO2-eq/kWhe) depending on different technologies and locations, making tidal technologies’ GWP performance superior on average. Nuclear power technology can be seen as the “cleanest” in terms of GWP (5.1 to 13.6 gCO2-eq/kWhe), but it comes with its own issues: mainly nuclear waste. Compared to fossil-based technologies, such as coal (754.3 to 932.8 gCO2-eq/kWhe) and natural gas (514.4 to 524.8 gCO2-eq/kWhe) power plants, the impact of tidal current technologies is significantly lower. Finally, compared to wave generation technologies (13 to 126 gCO2-eq/kWhe) [44], tidal current generation performs slightly better with less fluctuations.
Comparing the DG500 array with Uihlein [13] in Figure 7, we observe that apart from maintenance, the impacts from DG500 are in line with other tidal technologies, where the mooring and foundation are dominant. However, comparing the DG500 to the tidal kite in the stated study, it seems that the impact of producing the mooring and foundation is overestimated in that study.
An explanation of the large difference could be that the data used was mainly based on assumptions, and that the tidal kite was still in early stages of design. The data used in our study are quite robust, as they were provided directly from Minesto, based on an existing prototype. Still, the sensitivity analysis shows that the results differ substantially, depending on the annual energy use, but that the relative contribution to impacts from different life cycle stages remains the same. Essentially the impact scales linearly with the capacity factor, with the exception of the small contribution from downstream grid distribution, which remains the same regardless of the performance of the power plant. The scenarios with alternate designs of the GBF, improving the maintenance rate of the tether, or reusing the GBF, would also reduce the impacts, but only marginally, up to ca. 10% of the base case.
Another uncertainty is the EOL process, which will occur in the future. Nevertheless, the assumptions made in this study are similar to those used in the offshore wind studies [33], and thus provide decent estimates for the DG500 technology. Accordingly, the design of the future generations of Deep Green powerplants should focus on increasing the power output, increasing the maintenance efficiency, and increasing the recycling rates at the EOL.
4.2. Current State and Improvement Potentials in LCA of Tidal Technologies
4.2.1. Maintenance
According to Arvesen, Birkeland, and Hertwich [12], the maintenance of the offshore wind power can account to 28% of the LCA impacts. A similar value for tidal power is expected, since they operate at similar conditions. Unfortunately, most of the related studies neglect maintenance or tend to make very optimistic assumptions in that regard. In addition, some studies only include one aspect of maintenance, either the production of the spare parts, or only the maintenance trips. In this study, the impact of maintenance trips was modelled according to different ship statuses during the process (with differentiation between moving and idle). The production of the replaced parts was also included. The latter two accounted for 20% of the GWP of the DG500 array. Future studies should further develop the modelling of maintenance for a complete coverage.
4.2.2. End-of-Life
Since the EOL will occur far in the future, uncertainties are huge in that regard. Besides, there are also different ways of modelling EOL, which makes a comparison between technologies difficult [34]. Thus, the methods and assumptions used in modelling the EOL should be reported clearly and transparently. Douziech, Hellweg, and Verones [40] clearly explained how the EOL method is modelled, representing only virgin material as an input, and giving credits (negative flows) as an output based on recycling rates. That was also done in this study. Walker, Howell, Hodgson, and Griffin [42] also seem to use the same methodology, but when describing the material requirement, although they stated that it contains a recycled portion, it was not clear how it was accounted for. Rule, Worth, and Boyle [43] and Douglas, Harrison, and Chick [11] only state recycling rates for different materials without describing the modelling aspect, although from the graphs it can be seen as negative flows (credit). Kelly, McManus, and Hammond [39] and Woollcombe-Adams, Watson, and Shaw [41] go further and exclude the EOL stage, stating that its impact is negligible.
4.2.3. Inclusion of Sensitivity and Uncertainty Analysis
As of 2019, the tidal energy sector is at an early stage of development [45]. Thus, it is important to perform some sensitivity and uncertainty analyses for tidal energy converters. This includes both the foreground and background systems [18]. Most reviewed studies had no sensitivity analysis [41,42,43]. Others had it only for the background system; e.g., the electricity mix. An important foreground parameter to account for is the capacity factor (which will eventually depend on the tidal stream profile of the location). It also seems that the focus of the tidal energy is still within the European context, especially the UK. If the tidal technology is to be deployed in other geographical areas, attention should be taken regarding the tidal stream profile and the electricity used in each relevant country, which are usually analyzed through sensitivity analysis. Furthermore, the power rating of the technology has the same effect as the capacity factor. This is because increasing the power rating usually requires little more materials, but allows for the generation of much more power (e.g., the case of the favorable site). Additionally, the EOL phase is unpredictable, where offshore wind plants, which are relatively in an advanced level, still have not experienced that phase [32].
Douziech, Hellweg, and Verones [40] included an extended sensitivity analysis, varying the plant lifetime, power output, recycling rates, transport distances, electricity mix, and material input. They concluded that manufacturers should aim for a long lifetime, high power output, and high recycling rates. Besides, the location had a huge impact, which affects the electricity mix and the tide conditions, and thus, researchers should be careful comparing different technologies with different locations. Douglas, Harrison, and Chick [11] varied the energy outputs, design lives, recycling rates, carbon intensities of materials and manufacturing processes, and site locations. They showed that a reduction in electricity production increases the impact by the same rate. The same applies to reducing the lifetime of the powerplant. For the recycling, when the rates were reduced by 10%, the GWP increased by 4%. In our study, the sensitivity was based on alternatives for an impactful component, rate of replacement for a component, extended lifetime, rated power output, and site characteristics. The results confirmed those in different studies, where the impact of the lifetime and the site location (which directly affects the power output) are of major importance when assessing the environmental impact of tidal power generation technologies.
4.2.4. Source of Data
As is well-known, data collection is often the most time-consuming part when conducting an LCA, and data gaps are often only filled in with assumptions. In this study, we had access to data directly from Minesto, which is both the main equipment manufacturer and the power plant operator. Several iterations of calculations were done, and the collection of improved data was done. It can be seen in Figure 7 that when data were from a reference database, the results were different from getting data from the company directly (e.g., for the kite case). For example, for the kite, some data about maintenance was not revealed previously, and only through discussion with the company, a good model was proposed. That included the exact times the ships were moving or were in an idle state. Besides, direct interaction with the supplier helped choosing the correct modelling material or an acceptable alternative whenever possible, whereas in the literature review by Uihlein [13], most of the materials were chosen according to what is “the most common material type in each case.”
5. Conclusions
This study assessed the environmental impact of tidal power generation by performing a prospective LCA of an emerging tidal current technology (Deep Green) based on the Holyhead Deep site in Anglesey, UK. The base-case 12 MW array of DG500 prototypes had a GWP of 26.3 g CO2-eq/kWhe. The processes contributing the most to the various emissions were the production of the foundations, production of spare parts, and the maintenance operations. EOL recycling also lead to significant reduction of net impacts.
The results were compared to previous LCA studies of related energy technologies. It was seen that tidal technology has much less impact than fossil-based technology, and is in the same range as other renewables. Thus, from a life cycle perspective, this technology was found to be environmentally competitive. The comparison with other studies on tidal technologies revealed that the maintenance phase is often neglected, while our results indicate its significance. Furthermore, the EOL phase is rarely clearly expressed, which hinders the possibility of reproducing the study and having fair comparisons.
The environmental impact of the power plant (to the point of delivery to the grid) is essentially linearly dependent on the capacity factor. The actual energy output depends on local conditions, and in this case the capacity factor was assumed to be 46% (2 GWh/year per DG500 kite) for the base case scenario based on prototype testing and tidal current conditions measurements at the Holyhead site. A set of scenarios was also modelled with variations in design options and various sensitive parameters. The results show moderate variations of net results, with up to 16% (22.0 g CO2/kWhe) lowered impact compared to the base case in all scenarios assuming the same capacity factor.
Supplementary Materials
The following are available online at https://www.mdpi.com/1996-1073/13/2/456/s1. Table S1: LCI of the kite and umbilical system. Table S2: LCI of the gravity base foundation. Table S3: LCI of the tidal marine substation. Table S4: LCI of the cables. Table S5: LCI of the onshore substation. Table S6: Overview of the transportation of the components to the construction site. Table S7: Overview of the water transportation during construction. Table S8: Overview of the maintenance operations. Table S9: Recycling ratios. Table S10: Processes used for the background data of the core materials in ecoinvent. Table S11: Processes used for the background data of the consumable materials in ecoinvent. Table S12: Processes used for the background data of the sub-components in ecoinvent. Table S13: Processes used for the background data of the transport modes in ecoinvent. Table S14: Processes used for the background data of the auxiliary electricity production in ecoinvent. Table S15: Processes used for the background data of the grid distribution and infrastructure in ecoinvent. Table S16: LCI results of the non-renewable material resources. Table S17: LCI results of the renewable material resources. Table S18: LCI results of the water use. Table S19: LCI results of the non-renewable energy resources. Table S20: LCI results of the renewable energy resources. Table S21: Overview of the potential environmental impacts. Table S22: Emissions to air. Table S23: Emissions to water. Table S24: Emissions of radioactive isotopes. Table S25: Emissions of biogenic carbon dioxide. Table S26: Emissions of toxic substances to air. Table S27: Emissions of oil to water and ground.
Author Contributions
Conceptualization, J.T., M.K., and S.M.; methodology, J.T. and M.K.; software, M.K.; validation, M.K.; formal analysis, M.K.; investigation, J.T. and M.K.; resources, M.K.; data curation, M.K.; writing—original draft preparation, M.K.; writing—review and editing, J.T., M.K., and S.M.; visualization, J.T. and M.K.; supervision, J.T. and S.M.; project administration, S.M.; funding acquisition, S.M. All authors have read and agreed to the published version of the manuscript.
Funding
This research was funded by European Union’s Horizon 2020 research and innovation programme, grant number 654438. The APC was funded by Chalmers Research Support.
Acknowledgments
We are very grateful for Patrik Pettersson from Minesto for coordinating the data gathering with Minesto and its suppliers needed in the modelling, and for the valuable inputs to the LCA and this article.
Conflicts of Interest
The authors declare no conflict of interest. The funders had no role in designing the study; collecting, analyzing, or interpreting data; in the writing of the manuscript, or in the decision to publish the results. The company (Minesto) provided the input data and helped in defining some scenarios, but had no role in the analyses or interpretation of data, in the writing of the manuscript, or in the decision to publish the results.
References
- Bruckner, T.; Bashmakov, I.; Mulugetta, Y.; Chum, H.; de la Vega Navarro, A.; Edmonds, J.; Faaij, A.; Fungtammasan, B.; Garg, A.; Hertwich, E. Climate Change 2014: Mitigation of Climate Change. Available online: https://www.ipcc.ch/report/ar5/wg3/ (accessed on 10 February 2018).
- Wind-Europe. Wind in Power 2017: Annual Combined Onshore and Offshore Wind Energy Statistics. Available online: https://windeurope.org/wp-content/uploads/files/about-wind/statistics/WindEurope-Annual-Statistics-2017.pdf (accessed on 14 March 2018).
- Turner, J.A. A realizable renewable energy future. Science 1999, 285, 687–689. [Google Scholar] [CrossRef] [PubMed] [Green Version]
- Pedersen, E.; Persson Waye, K. Perception and annoyance due to wind turbine noise—A dose–Response relationship. J. Acoust. Soc. Am. 2004, 116, 3460–3470. [Google Scholar] [CrossRef] [PubMed] [Green Version]
- Kavousi-Fard, A. Modeling uncertainty in tidal current forecast using prediction interval-based SVR. IEEE Trans. Sustain. Energy 2017, 8, 708–715. [Google Scholar] [CrossRef]
- Iyer, A.; Couch, S.; Harrison, G.; Wallace, A. Variability and phasing of tidal current energy around the United Kingdom. Renew. Energy 2013, 51, 343–357. [Google Scholar] [CrossRef] [Green Version]
- Clarke, J.A.; Connor, G.; Grant, A.; Johnstone, C. Regulating the output characteristics of tidal current power stations to facilitate better base load matching over the lunar cycle. Renew. Energy 2006, 31, 173–180. [Google Scholar] [CrossRef]
- UK-Government. Wave and Tidal Energy: Part of the UK’s Energy Mix. Available online: https://www.gov.uk/guidance/wave-and-tidal-energy-part-of-the-uks-energy-mix (accessed on 7 June 2018).
- Magagna, D.; Uihlein, A. Ocean energy development in Europe: Current status and future perspectives. Int. J. Mar. Energy 2015, 11, 84–104. [Google Scholar] [CrossRef]
- Arvesen, A.; Hertwich, E.G. Assessing the life cycle environmental impacts of wind power: A review of present knowledge and research needs. Renew. Sustain. Energy Rev. 2012, 16, 5994–6006. [Google Scholar] [CrossRef] [Green Version]
- Douglas, C.; Harrison, G.; Chick, J. Life cycle assessment of the Seagen marine current turbine. Proc. Inst. Mech. Eng. Part M J. Eng. Marit. Environ. 2008, 222, 1–12. [Google Scholar] [CrossRef] [Green Version]
- Arvesen, A.; Birkeland, C.; Hertwich, E.G. The importance of ships and spare parts in LCAs of offshore wind power. Environ. Sci. Technol. 2013, 47, 2948–2956. [Google Scholar] [CrossRef] [Green Version]
- Uihlein, A. Life cycle assessment of ocean energy technologies. Int. J. Life Cycle Assess. 2016, 21, 1425–1437. [Google Scholar] [CrossRef] [Green Version]
- Minesto. Our Technology. Available online: https://minesto.com/our-technology (accessed on 10 October 2018).
- Schuchert, P.; Kregting, L.; Pritchard, D.; Savidge, G.; Elsäßer, B. Using coupled hydrodynamic biogeochemical models to predict the effects of tidal turbine arrays on phytoplankton dynamics. J. Mar. Sci. Eng. 2018, 6, 58. [Google Scholar] [CrossRef] [Green Version]
- Kregting, L.; Elsaesser, B.; Kennedy, R.; Smyth, D.; O’Carroll, J.; Savidge, G. Do changes in current flow as a result of arrays of tidal turbines have an effect on benthic communities? PLoS ONE 2016, 11, e0161279. [Google Scholar] [CrossRef] [PubMed] [Green Version]
- Torosian, R.; Elmehag, E. Life Cycle Assessment of an Ocean Energy Power Plant: Evaluation and Analysis of the Energy Payback Time with Comparison Between Sweden and Tanzania. Bachelor’s Thesis, University of Skövde, Skövde, Sweden, 2013. [Google Scholar]
- Arvidsson, R.; Tillman, A.M.; Sandén, B.A.; Janssen, M.; Nordelöf, A.; Kushnir, D.; Molander, S. Environmental assessment of emerging technologies: Recommendations for prospective LCA. J. Ind. Ecol. 2018, 22, 1286–1294. [Google Scholar] [CrossRef] [Green Version]
- ISO. ISO 14040: 2006. Environmental Management-Life Cycle Assessment-Principles and Framework; European Committee for Standardization: Geneva, Switzerland, 2006. [Google Scholar]
- EPD. Product Category Rules According to ISO 14025. Product Group Classification: UN CPC 171 and 173 Electricity, Steam and Hot/Cold Water Generation and Distribution. Available online: https://www.environdec.com/PCR/Detail/?Pcr=5802 (accessed on 10 April 2018).
- Ciroth, A. ICT for environment in life cycle applications openLCA—A new open source software for life cycle assessment. Int. J. Life Cycle Assess. 2007, 12, 209. [Google Scholar] [CrossRef]
- Ecoinvent. Ecoinvent 3.3. Available online: https://www.ecoinvent.org/database/ecoinvent-33/ecoinvent-33.html (accessed on 5 October 2018).
- Huijbregts, M.; Steinmann, Z.; Elshout, P.; Stam, G.; Verones, F.; Vieira, M.; Hollander, A.; Zijp, M.; Van Zelm, R. ReCiPe 2016: A Harmonized Life Cycle Impact Assessment Method at Midpoint and Endpoint Level Report I: Characterization. Available online: http://www.rivm.nl/en/Documents_and_publications/Scientific/Reports/2016/december/ReCiPe_2016_A_harmonized_life_cycle_impact_assessment_method_at_midpoint_and_endpoint_level_Report_I_Characterization (accessed on 14 March 2018).
- Hertwich, E.G.; Gibon, T.; Bouman, E.A.; Arvesen, A.; Suh, S.; Heath, G.A.; Bergesen, J.D.; Ramirez, A.; Vega, M.I.; Shi, L. Integrated life-cycle assessment of electricity-supply scenarios confirms global environmental benefit of low-carbon technologies. Proc. Natl. Acad. Sci. USA 2015, 112, 6277–6282. [Google Scholar] [CrossRef] [PubMed] [Green Version]
- ABB. Environmental Product Declaration for ACS 600 Frequency Converter, 250 kW Power. Available online: https://library.e.abb.com/public/3aad93ad845f4988c1256d630040684a/9780_EPD%20for%20ACS600lowres.pdf (accessed on 5 May 2018).
- ABB. Environmental Product Declaration for DMI Type DC Machine—180-471 kW Power Range. Available online: https://library.e.abb.com/public/afa1510442415fc6c1256d640022e99f/Product%20Declaration%20S-P%2000009%20rev%20P.pdf?x-sign=OyM9xKoFDAa4dPThofiDKCm97rt8S8RMi44z0+gUbTGWTmR2A (accessed on 5 May 2018).
- Jotun. Jotamastic 87 Aluminium Technical Data Sheet. Available online: https://www.jotun.com/Datasheets/Download?url=%2FTDS%2FTDS__523__Jotamastic%2087%20Aluminium__Euk__GB.pdf (accessed on 20 April 2018).
- Romaniw, Y.A. The Relationship between Light-Weighting with Carbon Fiber Reinforced Polymers and the Life Cycle Environmental Impacts of Orbital Launch Rockets. Ph.D. Thesis, Georgia Institute of Technology, Atlanta, GA, USA, 2013. [Google Scholar]
- ABB. Environmental Product Declaration for Large Distribution Transformer 10 MVA. Available online: https://library.e.abb.com/public/57c1d5721712c65fc1256de9003d9401/10%20MVA.pdf?x-sign=6lm9n20/x6U8CFRRScbospcDaLlja81Ojv7/HOHBz/v5vzJXGGbHPmzEbj+cXcQI (accessed on 5 May 2018).
- Nexans. Submarine Power Cables. Available online: http://www.nexans.com/Germany/2013/SubmPowCables_FINAL_10jun13_engl.pdf (accessed on 20 April 2018).
- Jivén, K.; Sjöbris, A.; Nilsson, M.; Ellis, J.; Traegaardh, P.; Nordstroem, M. LCA-Ship, Design Tool for Energy Efficient Ships-A Life Cycle Analysis Program for Ships, Final Report. Available online: http://www.mariterm.se/wp-content/uploads/2016/08/Final-report-LCA-ship.pdf (accessed on 7 February 2018).
- Andersen, N.; Eriksson, O.; Hillman, K.; Wallhagen, M. Wind Turbines’ End-of-Life: Quantification and Characterisation of Future Waste Materials on a National Level. Energies 2016, 9, 999. [Google Scholar] [CrossRef] [Green Version]
- Haapala, K.R.; Prempreeda, P. Comparative life cycle assessment of 2.0 MW wind turbines. Int. J. Sustain. Manuf. 2014, 3, 170–185. [Google Scholar] [CrossRef]
- Nordelöf, A.; Poulikidou, S.; Chordia, M.; Bitencourt de Oliveira, F.; Tivander, J.; Arvidsson, R. Methodological Approaches to End-Of-Life Modelling in Life Cycle Assessments of Lithium-Ion Batteries. Batteries 2019, 5, 51. [Google Scholar] [CrossRef] [Green Version]
- Kaddoura, M.; Kambanou, M.L.; Tillman, A.-M.; Sakao, T. Is Prolonging the Lifetime of Passive Durable Products a Low-Hanging Fruit of a Circular Economy? A Multiple Case Study. Sustainability 2019, 11, 4819. [Google Scholar] [CrossRef] [Green Version]
- Khare, V. Prediction, investigation, and assessment of novel tidal–solar hybrid renewable energy system in India by different techniques. Int. J. Sustain. Energy 2019, 38, 447–468. [Google Scholar] [CrossRef]
- Amponsah, N.Y.; Troldborg, M.; Kington, B.; Aalders, I.; Hough, R.L. Greenhouse gas emissions from renewable energy sources: A review of lifecycle considerations. Renew. Sustain. Energy Rev. 2014, 39, 461–475. [Google Scholar] [CrossRef]
- Walker, S.; Howell, R. Life cycle comparison of a wave and tidal energy device. Proc. Inst. Mech. Eng. Part M J. Eng. Marit. Environ. 2011, 225, 325–337. [Google Scholar] [CrossRef]
- Kelly, K.; McManus, M.; Hammond, G. An energy and carbon life cycle assessment of tidal power case study: The proposed Cardiff–Weston severn barrage scheme. Energy 2012, 44, 692–701. [Google Scholar] [CrossRef] [Green Version]
- Douziech, M.l.; Hellweg, S.; Verones, F. Are Wave and Tidal Energy Plants New Green Technologies? Environ. Sci. Technol. 2016, 50, 7870–7878. [Google Scholar] [CrossRef]
- Woollcombe-Adams, C.; Watson, M.; Shaw, T. Severn Barrage tidal power project: Implications for carbon emissions. Water Environ. J. 2009, 23, 63–68. [Google Scholar] [CrossRef]
- Walker, S.; Howell, R.; Hodgson, P.; Griffin, A. Tidal energy machines: A comparative life cycle assessment study. Proc. Inst. Mech. Eng. Part M J. Eng. Marit. Environ. 2015, 229, 124–140. [Google Scholar] [CrossRef] [Green Version]
- Rule, B.M.; Worth, Z.J.; Boyle, C.A. Comparison of life cycle carbon dioxide emissions and embodied energy in four renewable electricity generation technologies in New Zealand. Environ. Sci. Technol. 2009, 43, 6406–6413. [Google Scholar] [CrossRef] [PubMed]
- Paredes, M.G.; Padilla-Rivera, A.; Güereca, L.P. Life cycle assessment of ocean energy technologies: A systematic review. J. Mar. Sci. Eng. 2019, 7, 322. [Google Scholar] [CrossRef] [Green Version]
- ClimateXChange. Wave & Tidal Energy: State of the Industry. Available online: https://www.climatexchange.org.uk/media/3100/state-of-the-wave-and-tidal-industry-report.pdf (accessed on 5 December 2019).
Figure 1.
Schematic of the tidal energy array covered in this study. The upper part of the figure gives a general overview of the power plant, its foundation, and other parts. The lower part (insert 1) shows the tidal energy converter (kite). (Illustrations provided by Minesto).
Figure 1.
Schematic of the tidal energy array covered in this study. The upper part of the figure gives a general overview of the power plant, its foundation, and other parts. The lower part (insert 1) shows the tidal energy converter (kite). (Illustrations provided by Minesto).

Figure 2.
Flow chart of the assessed system following the Environmental Product Declaration (EPD) terminology.
Figure 2.
Flow chart of the assessed system following the Environmental Product Declaration (EPD) terminology.

Figure 3.
Schematic outline of different connections in the array.

Figure 4.
Overview of some assessed impact categories normalized to 100%, for the base case scenario. The bar segments represent the different life-cycle stages. Processes contributing to less than 1% were excluded.
Figure 4.
Overview of some assessed impact categories normalized to 100%, for the base case scenario. The bar segments represent the different life-cycle stages. Processes contributing to less than 1% were excluded.

Figure 5.
Impact on global warming potential (gCO2-eq/kWhe) for the seven scenarios defined in Table 3. The material yields from recycling steel and copper are credited as avoided impacts from producing virgin materials. The net impact is shown above each column.
Figure 5.
Impact on global warming potential (gCO2-eq/kWhe) for the seven scenarios defined in Table 3. The material yields from recycling steel and copper are credited as avoided impacts from producing virgin materials. The net impact is shown above each column.

Figure 6.
Comparison of the global warming potential (gCO2-eq/kWhe) values of the tidal power generation technologies (Table 4) with other power generation technologies assed by Hertwich et al. [24]. Wind power includes onshore and offshore technologies, and photovoltaics include ground and roof versions of the polycrystalline, CIGS, and CdTe technologies. The limits shown represent the minimum, maximum, and median (to which the value shown corresponds).

Figure 7.
Impact on global warming potential (gCO2-eq/kWhe). Comparison of the DG500 array (base case scenario) with other tidal-based electricity generation technologies reported by Uihlein [13]. Note that the assembly and installation phase and the maintenance phase in the literature are negligible, and thus were not presented in the graph.


Table 1.
Technical parameters of the tidal energy converter array.
| Specification | Amount | Note |
|---|---|---|
| Rated power total | 12 MW | - |
| Rated power per DG500 | 0.5 MW | - |
| Energy yielded | 2 GWh/year 1 | Per DG500 |
| DG500s in array | 24 | Installed offshore |
| DG500s onshore | 2 | Ready for swap-out during maintenance |
| TMS in array | 4 | Each TMS connects six DG500s |
| Onshore substation | 1 | - |
| Distance from shore | 8 km | - |
| Onshore distance to grid | 4.5 km | - |
| Water current velocity | 1.2–2.4 m/s | - |
| Installation depth | 60–120 m | - |
| Lifetime of array | 25 years | - |
1 Based on a hypothetical base case that corresponds to a capacity factor of 46%. Calculations were based on prototype performance and the tidal current profile in the Holyhead site, but not measured on-site.
Table 2.
Overview of the lifetimes and replacement rates of the components.
| Part | Lifetime (Years) | Replacement Rate (per Year) |
|---|---|---|
| Nacelle innards | 10 1 | 10% |
| Umbilical cable | 20 | 5% |
| Tether | 5 | 20% |
1 Lifetime of nacelle innards is 10 years; that for outer parts is 25 years.
Table 3.
Overview of different scenarios analyzed in the study.
| Scenario | Power Rating (KW) | Avg. Power Output (GWh/yr) | Kites in Array (pcs) | GBF Type | GBF Reuse | Tether Lifetime (yr) | TMS in Array (pcs) |
|---|---|---|---|---|---|---|---|
| Base Case | 500 | 2 | 24 | Concrete | No | 5 | 4 |
| BT | 500 | 2 | 24 | Concrete | No | 10 | 4 |
| BTR | 500 | 2 | 24 | Concrete | Once | 10 | 4 |
| Bsteel | 500 | 2 | 24 | Steel | No | 5 | 4 |
| Bhybrid | 500 | 2 | 24 | Hybrid | No | 5 | 4 |
| Optimistic | 500 | 3 | 24 | Concrete | No | 5 | 4 |
| Favorable site | 750 | 3 | 18 | Concrete | No | 5 | 0 |
Table 4.
Overview of tidal energy technologies in the literature and this study, arranged by chronological order. MAIN refers to maintenance, SP refers to spare part., Comp refers to company, Lit refers to Literature. The column “Grid” indicates whether the grid infrastructure and losses are included in the study, and “Sensitivity” indicates whether a sensitivity or uncertainty analysis was performed.
| Ref. | Name | Year | Location | CO2 Intensity (gCO2/kWh) | Power Rating (MW) | Lifetime (yr) | Capacity Factor (%) | Impact Assessment Method | EOL Method Described | Maintenance | Grid | Sensitivity | Source of Data |
|---|---|---|---|---|---|---|---|---|---|---|---|---|---|
| this | DG500 | 2018 | Wales | 26.3 | 0.5 | 25 | 46 | ReCiPe 2010 | Yes | MAIN + SP | Yes | Yes | Comp |
| [40] | HS1000 | 2016 | Scotland | 37 | 1 | 25 | 40 | ReCiPe 2008 | Yes | MAIN + SP | No | Yes | Comp |
| [40] | Hydratidal | 2016 | Norway | 20.1 | 1.5 | 25 | 38 | ReCiPe 2008 | Yes | MAIN + SP | No | Yes | Comp |
| [40] | SeaGen | 2016 | Northern Ireland | 25.5 | 1.2 | 25 | 44 | ReCiPe 2008 | Yes | MAIN + SP | No | Yes | Lit |
| [40] | Annapolis | 2016 | Canada | 3.9 | 20 | 75 | 29 | ReCiPe 2008 | Yes | MAIN + SP | No | Yes | Lit |
| [42] | DeepGen | 2015 | UK | 34.2 | 1 | 25 | 18 | Other 1 | Vague | MAIN | No | No | Comp |
| [42] | OpenHydro | 2015 | UK | 19.6 | 2 | 20 | 24 | Other 1 | Vague | MAIN | No | No | Comp |
| [42] | SR2000 | 2015 | UK | 23.8 | 2 | 20 | 21 | Other 1 | Vague | MAIN | No | No | Comp |
| [42] | Flumill | 2015 | UK | 18.5 | 2 | 20 | 21 | Other 1 | Vague | MAIN | No | No | Comp |
| [39] | Severn Barrage | 2012 | UK | 56.2 | 7200 | 120 | 27 | IPCC2007 GWP 100a | EOL excluded | SP | No | Yes | Lit |
| [43] | Crest Energy | 2009 | New Zealand | 1.8 | 0.385 | 100 | 37 | Other 1 | Vague | MAIN + SP | No | No | Lit |
| [41] | Severn Barrage | 2009 | UK | 5.7 | 7200 | 100 | 28 | Other 1 | EOL excluded | Excluded | No | No | Lit |
| [11] | SeaGen | 2008 | Northern Ireland | 15 | 1.2 | 20 | 48 | Other 1 | Vague | MAIN + SP | No | Yes | Comp |
1 Coefficients for embodied energy and CO2 emissions for raw material acquisition, manufacturing, and transportation were taken directly from different studies.
Table 5.
Overview of the environmental impacts for the base case scenario (complete array).
| Impact Category | Unit (kWhe−1) | Impact |
|---|---|---|
| Aluminum Requirement | g | 0.042 |
| Cement Requirement | g | 3.400 |
| Copper Requirement | g | 0.041 |
| Iron Requirement | g | 0.850 |
| Non-renewable Energy Demand | MJ | 0.410 |
| Land Occupation | m2 ·yr | 0.002 |
| Global Warming Potential | g CO2 eq | 26.300 |
| Acidification Potential | g SO2 eq | 0.200 |
| Freshwater Eutrophication Potential | mg P eq | 7.100 |
| Freshwater Ecotoxicity | g 1,4 DB eq | 0.420 |
| Photochemical Ozone-creation Potential | g C2H4 eq | 0.200 |
| Particulate Matter Formation | g PM10 eq | 0.075 |
© 2020 by the authors. Licensee MDPI, Basel, Switzerland. This article is an open access article distributed under the terms and conditions of the Creative Commons Attribution (CC BY) license (http://creativecommons.org/licenses/by/4.0/).
Share and Cite
MDPI and ACS Style
Kaddoura, M.; Tivander, J.; Molander, S. Life Cycle Assessment of Electricity Generation from an Array of Subsea Tidal Kite Prototypes. Energies 2020, 13, 456. https://doi.org/10.3390/en13020456
AMA Style
Kaddoura M, Tivander J, Molander S. Life Cycle Assessment of Electricity Generation from an Array of Subsea Tidal Kite Prototypes. Energies. 2020; 13(2):456. https://doi.org/10.3390/en13020456
Chicago/Turabian StyleKaddoura, Mohamad, Johan Tivander, and Sverker Molander. 2020. "Life Cycle Assessment of Electricity Generation from an Array of Subsea Tidal Kite Prototypes" Energies 13, no. 2: 456. https://doi.org/10.3390/en13020456
Note that from the first issue of 2016, this journal uses article numbers instead of page numbers. See further details here.