Analysis of Archimedes Spiral Wind Turbine Performance by Simulation and Field Test
by
Hyeonmu Jang
1, 
Dongmyeong Kim
1,
Yechan Hwang
1,
Insu Paek
1,*,
Seungjoo Kim
2 and
Joonho Baek
3 1
Department of Advanced Mechanical Engineering, Kangwon National University, Chuncheon-si 24341, Korea
2
Korea Testing Certification, 22, Heungan-dearo 27, Gunpo-si 15809, Korea
3
Department of Engineering Research, Eastern Star Cooperation Real Time Services (ESCO RTS), Doosanventuredigm, B112, Pyeongchon-Dong, 126-1, Dongan-Gu, Anyang, Gyeonggi-Do 431-070, Korea
*
Author to whom correspondence should be addressed.
Energies 2019, 12(24), 4624; https://doi.org/10.3390/en12244624
Submission received: 14 November 2019
/
Revised: 28 November 2019
/
Accepted: 3 December 2019
/
Published: 5 December 2019
(This article belongs to the Section A3: Wind, Wave and Tidal Energy)
Abstract
:In this study, the performance of an Archimedes spiral wind turbine is analyzed by simulation and validated by a field test. It is characterized as a horizontal-axis drag-type wind turbine. This type of wind turbine cannot be analyzed by the well-known Blade Element Momentum(BEM) theory or Double Stream Tube Method(DSTM) commonly used to analyze the performance of lift-type wind turbines. Therefore, the computational fluid dynamics (CFD) method was applied. From the simulation, the power coefficient, known as the mechanical efficiency of the rotor, the tip speed ratio was obtained. The maximum power coefficient, and the corresponding tip speed ratio were found to be 0.293 and 2.19, respectively. In addition, the electrical efficiency with respect to the rotational speed of the generator was obtained through generator–controller test. The obtained mechanical and electrical efficiencies were used to predict the power curve of the wind turbine. Finally, the predicted performance of the wind turbine, including the electrical losses, was validated by the field test. The maximum error between the prediction and the measured power was found to be less than 7.80%.
1. Introduction
As the global demand for wind energy increased, the cumulative installed capacity of wind turbines as of 2018 reached 595 GW in the world [1,2]. Although the definition of small wind turbines are different in different countries, wind turbines that have a rotor swept area of the rotor less than 200 m2 and a rated output voltage less than 1 kV AC or 1.5 kV DC are defined as small wind turbines in Korea [3]. Small wind turbines are more likely to be installed closer to urban areas than large wind turbines, improving the opportunity for off-grid urban equipment [4].
For large wind turbines, the horizontal-axis lift-type configuration with three blades is considered the standard type and it has the highest aerodynamic efficiency. In the case of small wind turbines, they can be distinguished by either lift or drag configurations depending on the effective aerodynamic force that rotates the wind turbine rotor. These types of wind turbines can be classified into horizontal and vertical-axis categories. For horizontal-axis lift-type turbines, they operate under the same principle and shape as a large wind turbine, but for vertical-axis lift-type turbines, the rotor rotates about an axis parallel to the tower by the lift generated from the blade surface. Vertical-axis lift type wind turbines are known to be slightly less efficient than their horizontal-axis counterparts. Unlike lift-type wind turbines, there exist drag-type wind turbines for small wind turbines. Most drag-type wind turbines are vertical-axis wind turbines such as Savonious and twisted Savonious wind turbines, and they use the wind-induced drag on the blade surface to rotate the rotor. There exists, however, a horizontal-axis drag-type turbine which is known as Archimedes spiral wind turbine. For these turbines, the torque generated by the drag on the blade enables the rotor to rotate about an axis parallel to the ground. The Archimedes spiral wind turbine, a horizontal-axis drag-type turbine, is known to have slightly higher aerodynamic efficiency than those of vertical-axis drag-type wind turbines. Although they are less efficient than horizontal-axis lift-type wind turbines, according to drag-driven turbine, they can start generating power at cut-in wind speed. The shape of the rotor can contribute aligning rotor to wind direction. So, they do not need to install any additional yaw devices. Also, they generate less aerodynamic noise. Therefore, the demand for this type of wind turbines has been increasing recently for street-lighting systems [5].
For general horizontal axis lift type wind turbines, commercial analysis programs based on blade element momentum theory [6], are used to predict their performance. For example, Det Norske Veritas and Germanischer Lloyd, DNV-GL’s Bladed [7] is a proven wind turbine aero-elastic analysis program that has been used commonly in the wind industry. Bladed can be used to predict the power performance of wind turbines, to perform load calculations, and to optimize system control design.
FAST [8], a freeware provided by National Renewable Energy Laboratory, NREL, is an aero-elastic analysis program similar to Bladed that predicts turbine performance and performs load calculations. QBlade [9] is also a freeware by TU-Berlin to be used in the analysis for both vertical and horizontal-axis lift-type wind turbines with an in-built two-dimensional airfoil analysis program, XFoil [10]. HAWC2 [11], a commercial code by Technical University of Denmark (DTU) can be used to perform an aero-elastic analysis of horizontal and vertical axis lift-type wind turbines.
However, these simulation tools, that only support lift-type wind turbines, cannot be used in the analysis of the target wind turbine in this study. Therefore, a numerical approach through a computational flow dynamics program was used. The simulation tool used for analysis was Ansys Fluent [12], and RANS equation-based analysis was performed. A number of studies have shown that the performance prediction of drag-type wind turbines, mostly vertical-axis wind turbines, are possible using CFD simulations [13,14,15,16,17,18]. For a very limited number of cases however, experimental validation has been performed.
Fujisawa [13] used commercial CFD codes to predict the power performance of a Savonius type vertical-axis wind turbine. Fernando [14] introduced a flow-based approach based on the momentum of the fluid particles to predict the performance of a Savonius wind turbine. In addition, Shinohara and Ishimatsu [15] predicted the output performance of a Savonius-type wind turbine by CFD simulation and verified the results by an experimental method using small-scaled lab-scale wind tunnel. In these studies, the performance prediction methods for drag-type wind turbines using CFD programs were appropriate for simulation; however, there were limitations when validating the simulation results with experimental tests using a scaled model. Their experiments performed at a laboratory scale could not reflect the behavior of the actual wind turbine because of the electrical components like generator-inverter without considering electrical losses and turbine control algorithm.
For Archimedes wind turbines, the following studies have been conducted. Lu [16] proposed a theoretical output prediction model of spiral wind turbines based on the angular momentum equation. In addition, a CFD simulation was performed to predict the wind turbine performance. Through the result, a comparison of the proposed theoretical model was compared with CFD simulation. Both methods estimated the power coefficient of the Archimedes spiral wind turbine, which indicated a mechanical efficiency as 0.25. No experimental validation was made, however.
Safidari [17] built an Archimedes spiral wind turbine scaled-model and predicted the aerodynamic efficiency through CFD analysis. In his study, the maximum power coefficient of 0.25 was predicted. Kim [18] determined the power of an Archimedes spiral wind turbine through a CFD simulation. Both researchers conducted experimental validation, however, they conducted experiments for flow characterization around rotor using PIV measurement but, did not conduct experiments on the performance of the turbine.
In the studies of Lu [13], Safidari [17], and Kim [18], the characteristics of the wind turbine power performance and the flow field around the rotor are assessed through simulation. Validation was carried out by experimental methods; however, only comparative validations related to the flow field and not to the power performance were conducted. Therefore, no experiments have been carried out to experimentally verify the predicted electrical output performance through simulation.
Thus, in this study, the performance prediction of an Archimedes spiral wind turbine by CFD simulation is re-investigated. Although the target wind turbine is similar to those of previous studies [16,17,18], the dimensions of the blades are different. Also, unlike previous studies, the aim of this study was to predict the total electrical power output of the target wind turbine, and also to experimentally validate the simulation results by a field test. For this, the wind turbine was modeled and simulated using Fluent to find out the aerodynamic efficiency of the wind turbine. Also, to find out the electrical efficiency of the generator and the controller, a generator-controller coupled test was performed with a motor-generator test bench for various rotational speeds. Then the total electrical efficiency measured was applied to estimate the power curve of the target wind turbine, and the results were validated by the results of the field tests using the actual wind turbine at a test site.
2. Simulation Model
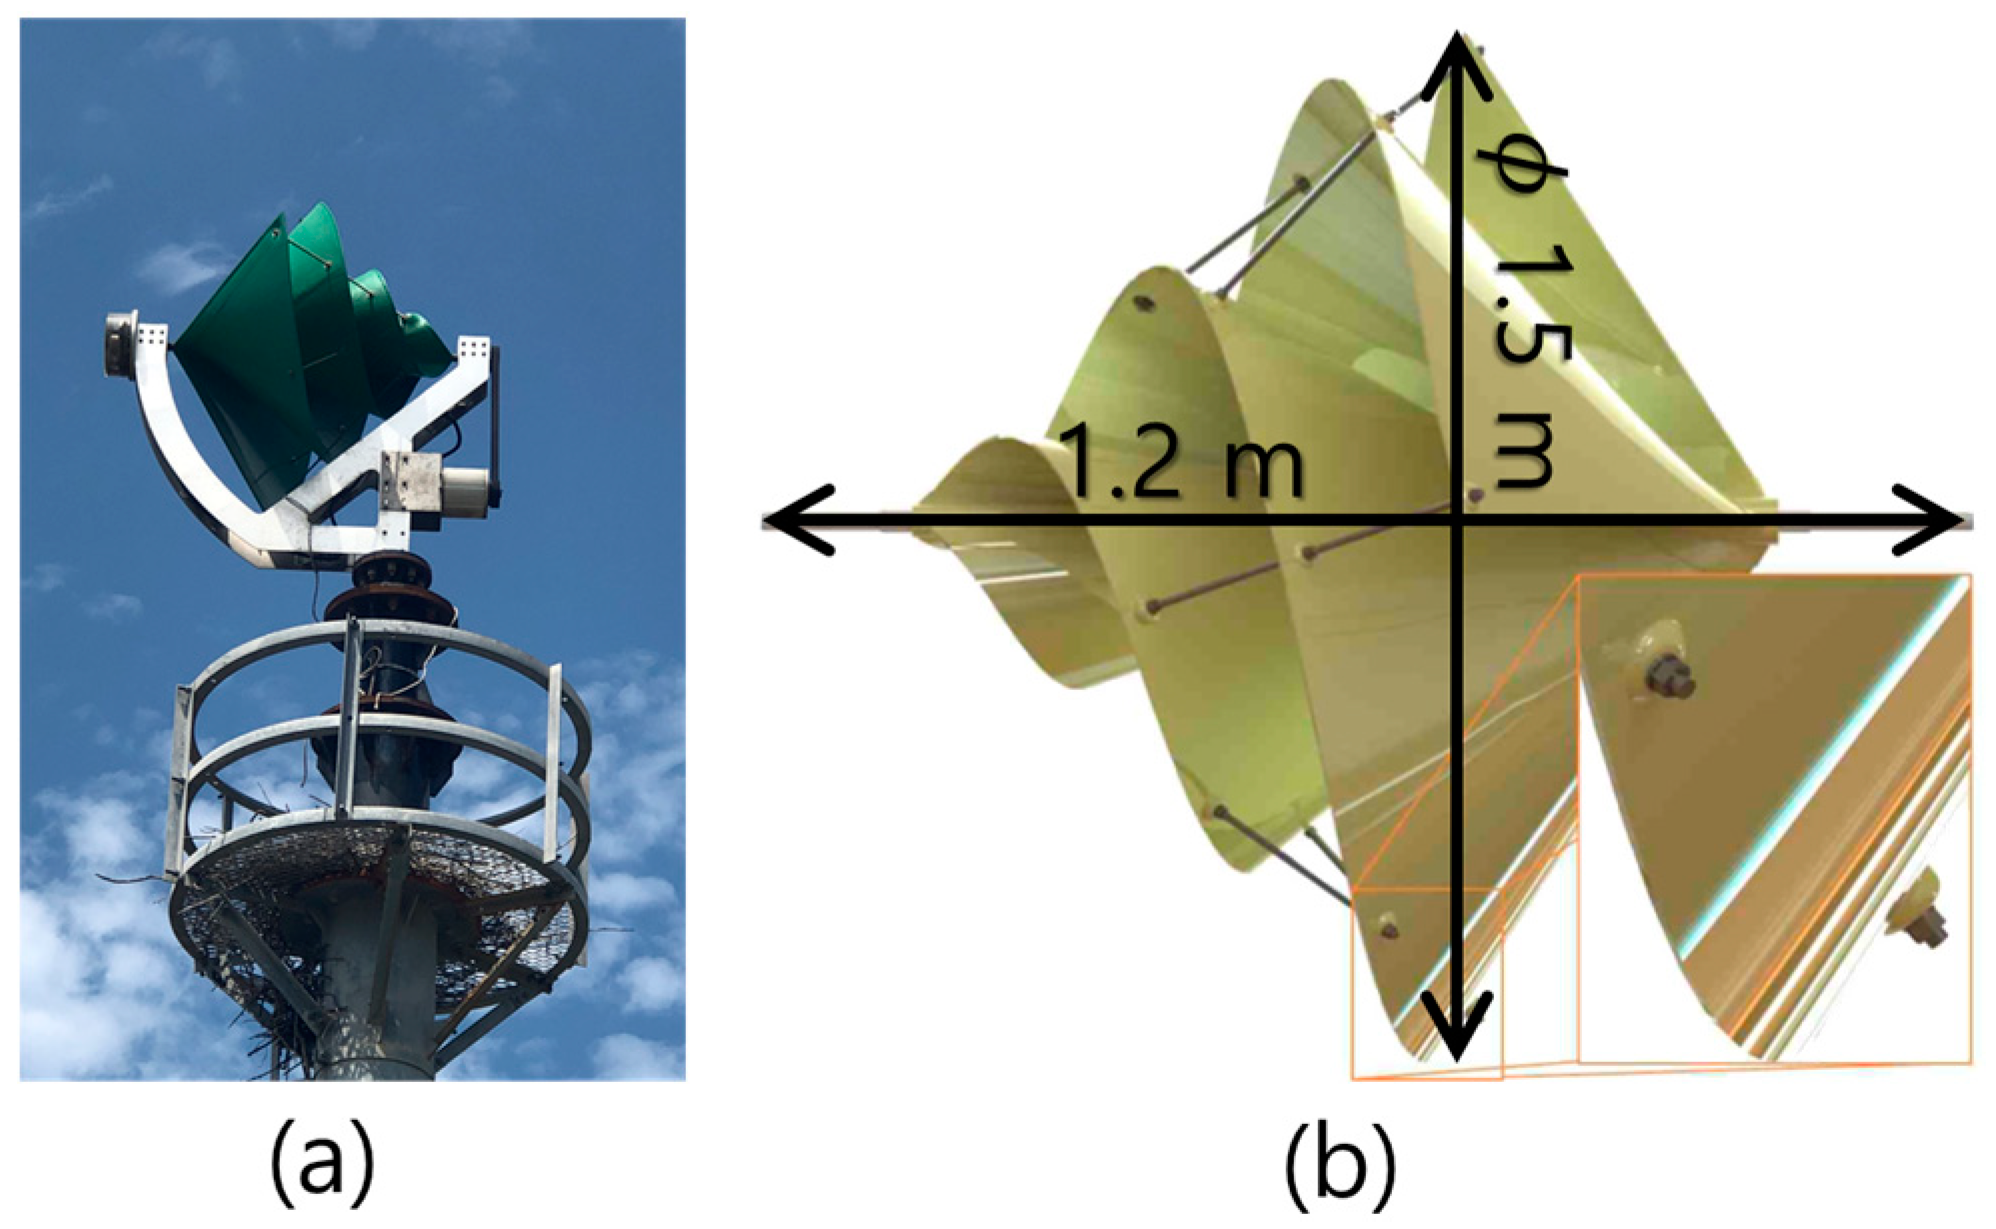
Figure 1 shows the shape of the wind turbine used in this study. Figure 1a shows the full-scale wind turbine installed at a test site. For the turbine simulation, a 3D Computer Aided Design(CAD) model of the wind turbine was built as shown in Figure 1b. From the 3D model and geometrical measurement of a real wind turbine, the maximum diameter of the wind turbine was 1.5 m and the rotor stream-wise length was 1.2 m along the rotational axis. Table 1 lists the specifications of the wind turbine. The rated power of the wind turbine is 500 W at the rated wind speed of 12.0 m/s. The rated rotational speed of the wind turbine is 330 rpm. The force causing the rotation of the blade dominantly is the drag acting on three blades. Further, as mentioned earlier, this wind turbine was developed for the street-lightening system.
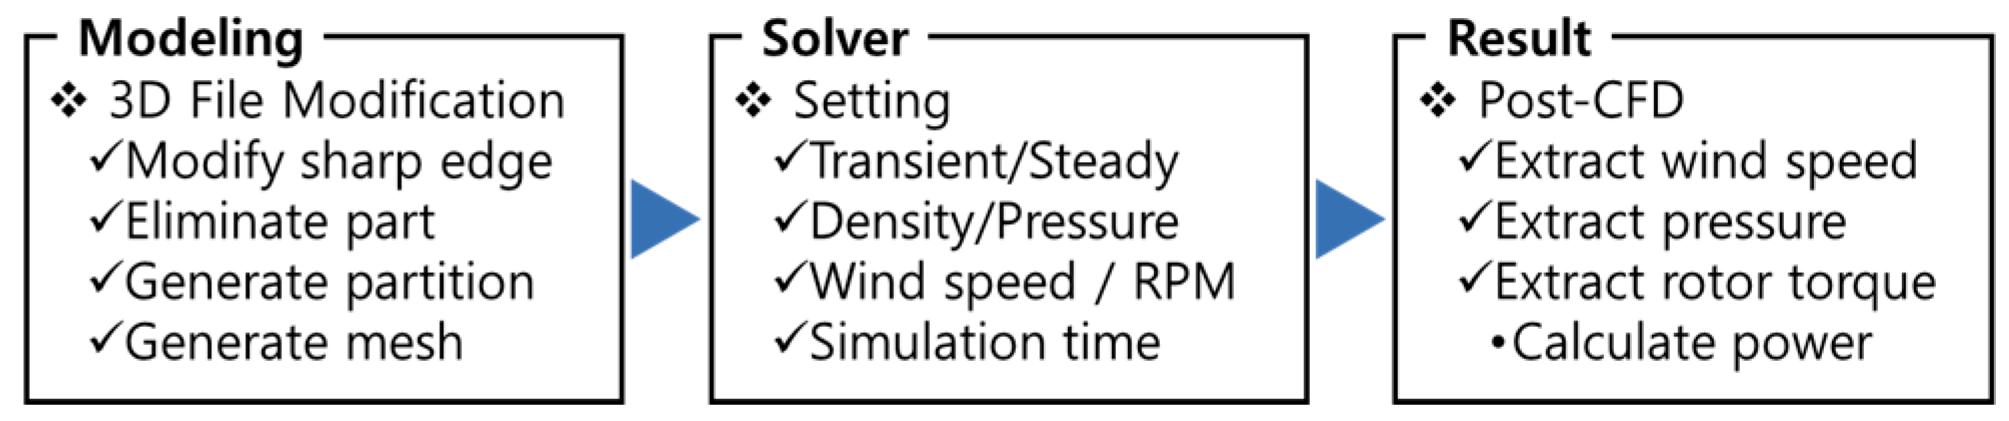
Owing to the reasons discussed earlier, this study was conducted based on a CFD simulation. Figure 2 shows the outline of the simulation procedures for estimating the turbine performances. Simulation procedures were distinguished in modeling, solver setting, and analysis of results. The detailed procedure of each step are as follows:
2.1. Modeling and Grid Generation
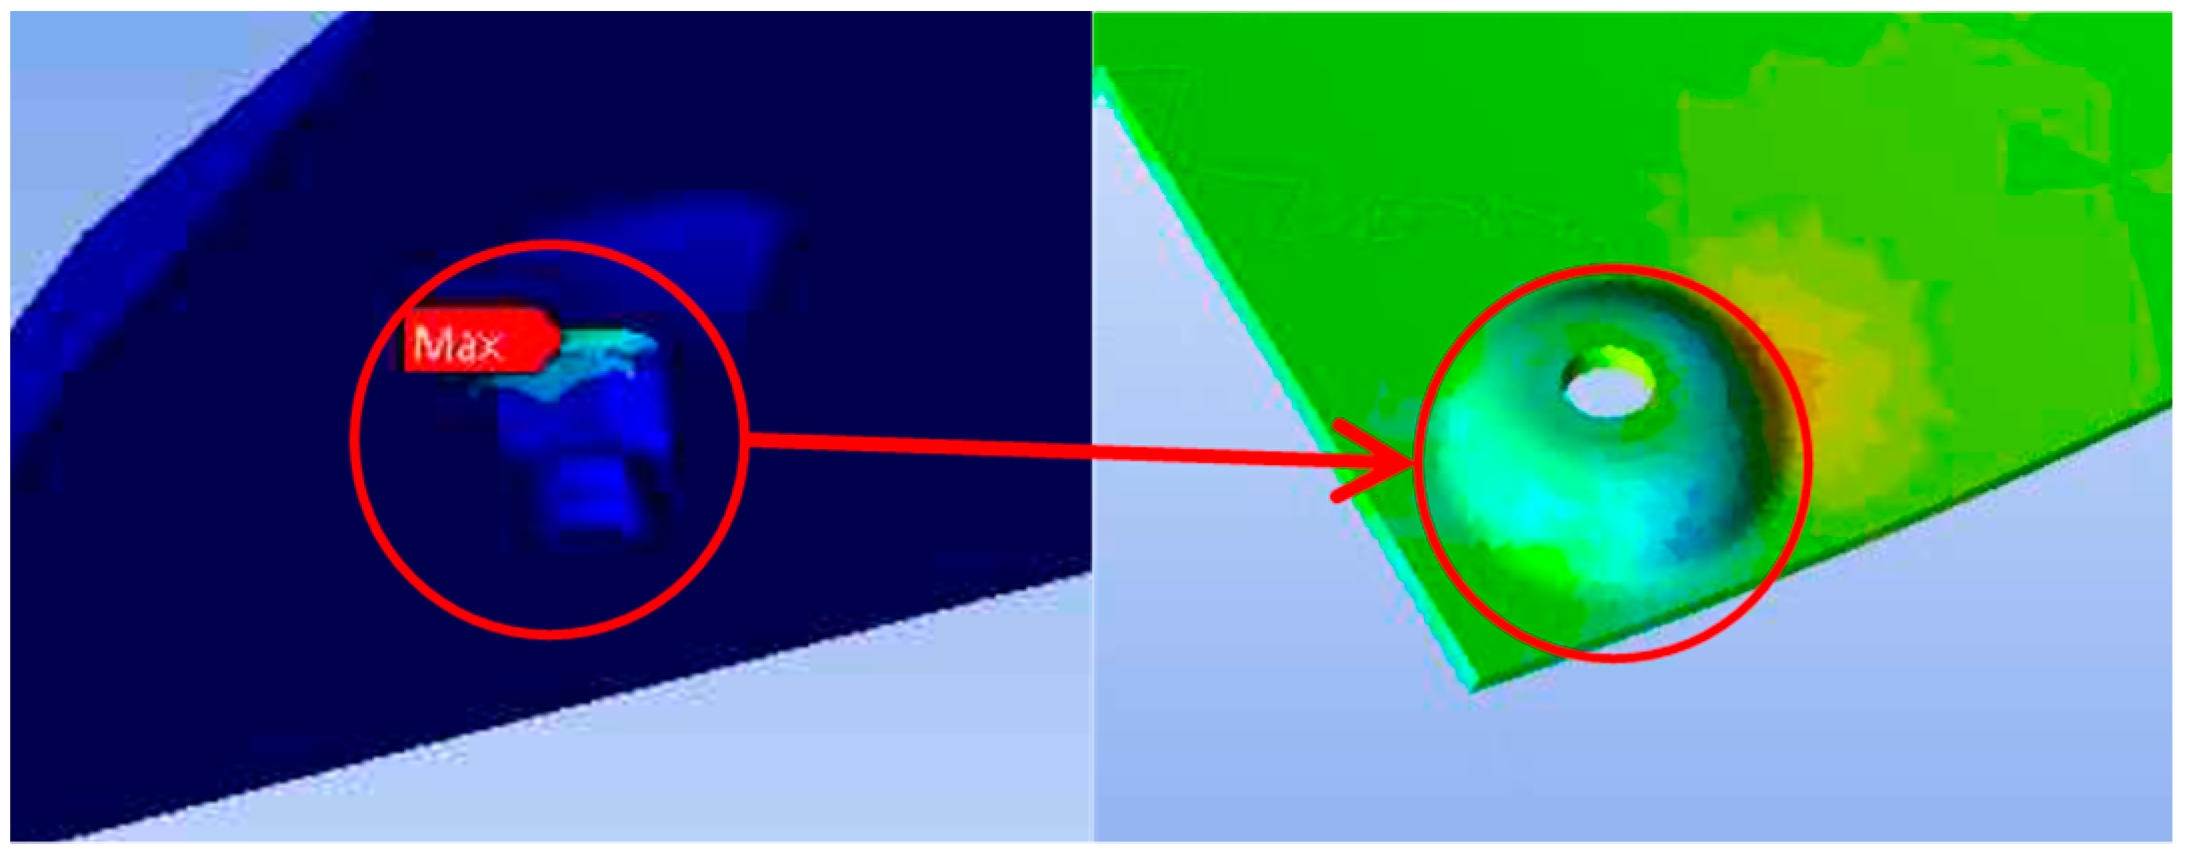
To build a numerical model, the 3D model of the wind turbine was simplified. Owing to the problems with bolts and nuts and program resolution, components that did not show thickness and dimensional information were simplified for analysis in Fluent.
Figure 3 shows the simplification of the bolt used to fix the blade. As shown in the figure, the bolt shape was simplified to a cap shape to minimize the effects of blade fracture and vortex. Through the shape modification, the low-quality grid near the bolt was avoided to obtain more reliable results. Furthermore, the unnecessary generators and other additional components of the wind turbine was removed to reduce the calculation time in the aerodynamic analysis.
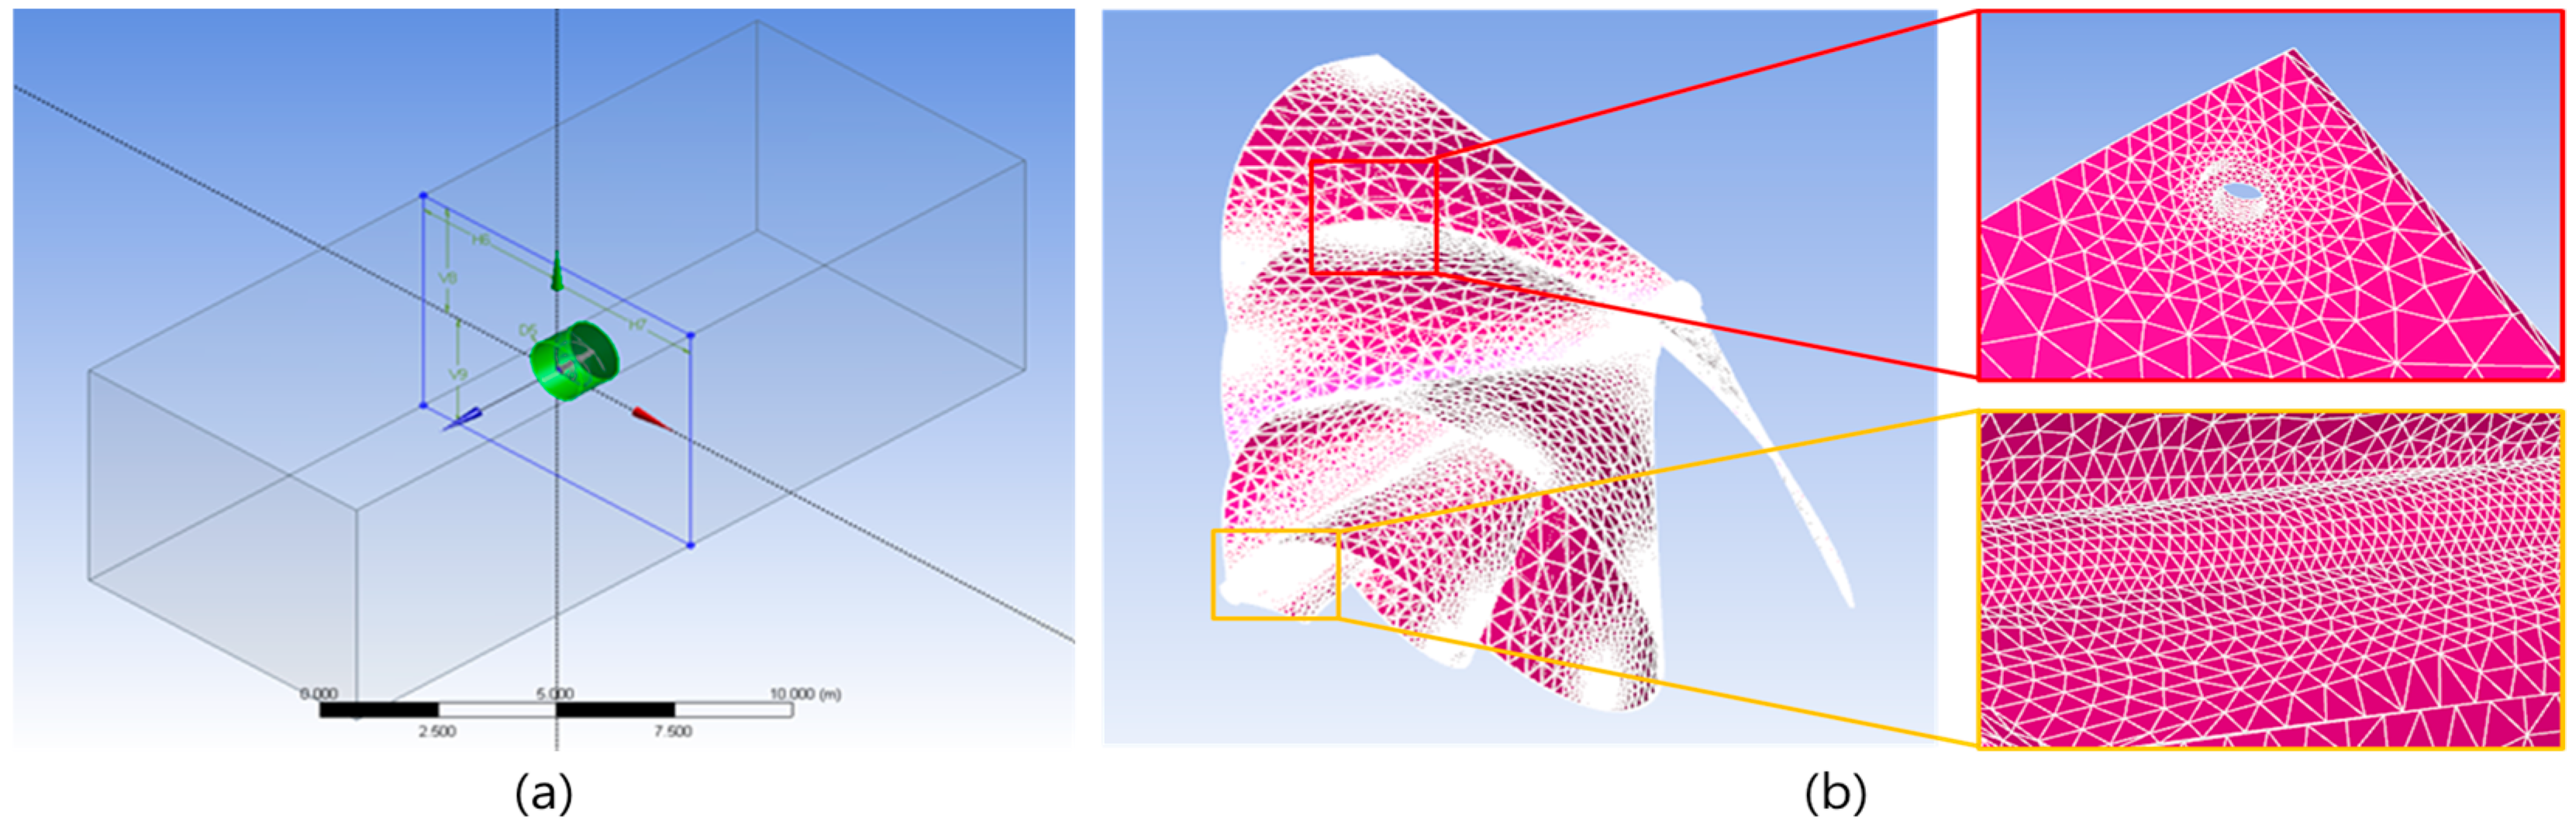
For the analysis of the rotor, the flow field area surrounding the wind turbine rotor was set to 8 m wide and 6 m high, as shown in Figure 4a. The height and width of the cross-section of the flow field was 4 times, and 5.3 times larger than the rotor diameter of the wind turbine, respectively. In addition, the flow field length, a distance from inlet to outlet was set as 10 m for the simulation to converge smoothly at the outlet section with a boundary value of 0 Pascal, the atmospheric pressure.
After modifying the shape, the mesh required for simulation was generated. For a mesh type, the tetra shape was selected. The generated mesh was manually modified by considering the connecting components, curvature, and complexity of the feature to improve the quality of the solution and shorten the solving time. The quality of the generated mesh was checked by a grid-independent test and then, the minimum mesh size finally selected was 0.5 mm, which is 50% of the minimum thickness of the rotor. As a result, the generated numerical model including the mesh contained 8,131,206 tetra elements and 1,442,438 nodes.
2.2. Solver and Solution Setting for Simulation
To calculate the force generated by the rotor surface and the torque about the rotor axis from simulation, a transient analysis was selected. For a turbulence model to be used as a closure of the Reynolds Averaged Navier–Stokes equations, the k-Omega Shear Stress Transport(SST) model was applied and also the “second order accuracy” was selected to minimize possible errors in the simulation results [4]. The maximum iteration was sat as 100 times for each case and the time-step of the simulation was sat as 0.01 s which is reciprocal of the maximum rotational speed of the rotor.
The CFD method calculates the pressure distribution over the blade surface with the inputs of the inlet wind speed and the rotational speed of the rotor, which can be used to calculate the torque of the rotor and the thrust force along the axial direction, in the end. Therefore, the rotational speed of the rotor was defined and the wind speed of the flow field at the inlet was applied. Finally, the torque obtained and the input rotational speed can be used to calculate the mechanical power output by using Equation (1).
Also, the power coefficient of the rotor which is the aerodynamic efficiency can be calculated by the ratio of mechanical power output from the rotor to the aerodynamic power input as shown in Equation (2).
The power coefficient is a function of the tip speed ratio, which is the ratio of the rotational speed to wind speed as shown in Equation (3) [6].
To obtain the power coefficients for various tip speed ratios, the simulations were repeated with a fixed value of the wind speed and the rotational speed of the rotor varying from 50 rpm to 500 rpm with an interval of 50 rpm. The simulation conditions are summarized in Table 2. From the simulation results, a plot of the power coefficient with respect to the tip speed ratio was obtained.
3. Simulation Result
3.1. Estimation of Rotor Power Performance
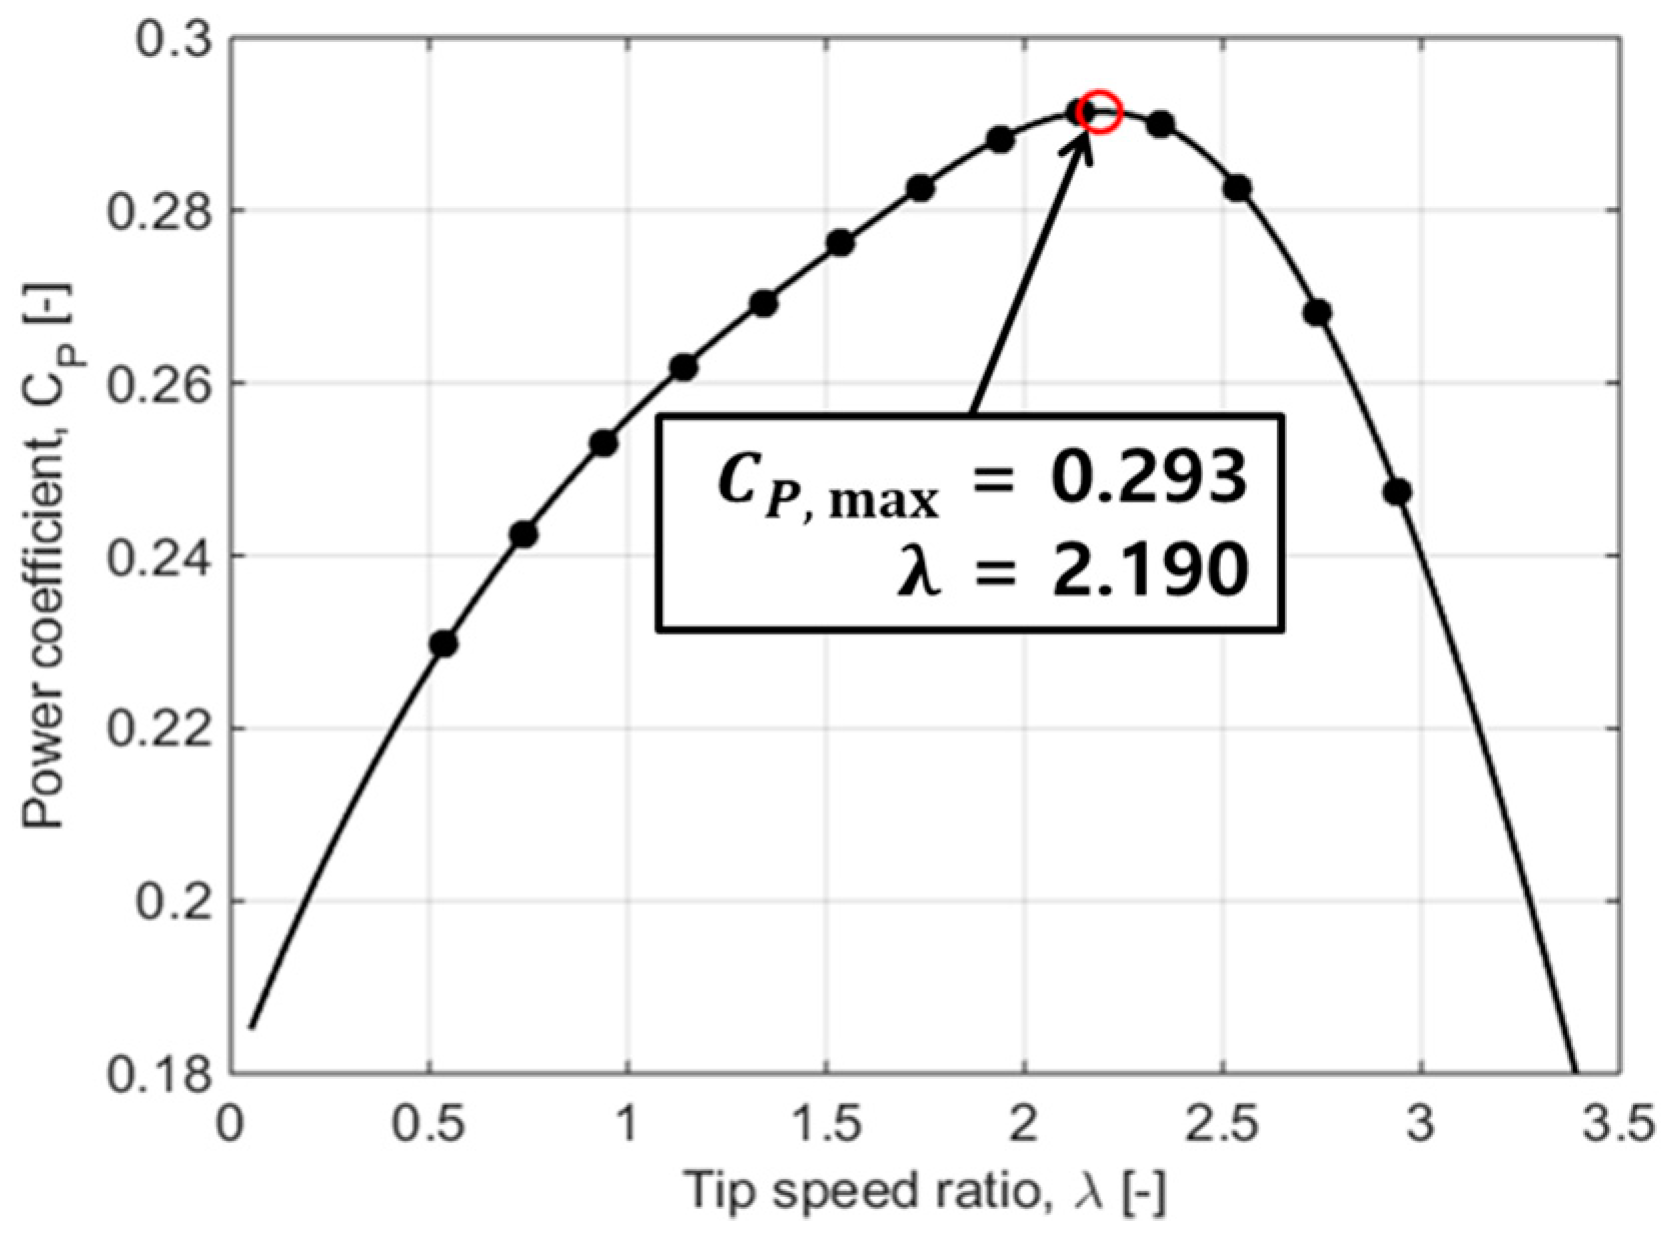
Figure 5 shows the power coefficient according to the tip speed ratio obtained by the simulation. The dots in the plot indicate the simulation results performed with various tip speed ratios. Therefore, to construct Figure 5, thirteen simulations were performed. Although errors may occur due to numerical calculations, the power coefficient curve shows the general arch shape with a maximum as expected. Based on the figure, the maximum power coefficient was 0.293 (29.3%) that was obtained at the tip speed ratio of 2.19 which is the estimated optimal tip speed ratio for the turbine configuration under study. The maximum power coefficient is slightly higher than those with similar Archimedes configuration presented in the literature [16,17,18]. However, this value is lower than those of common horizontal-axis lift-type wind turbines [6,19,20,21,22].
3.2. Estimated Aerodynamic Power Output
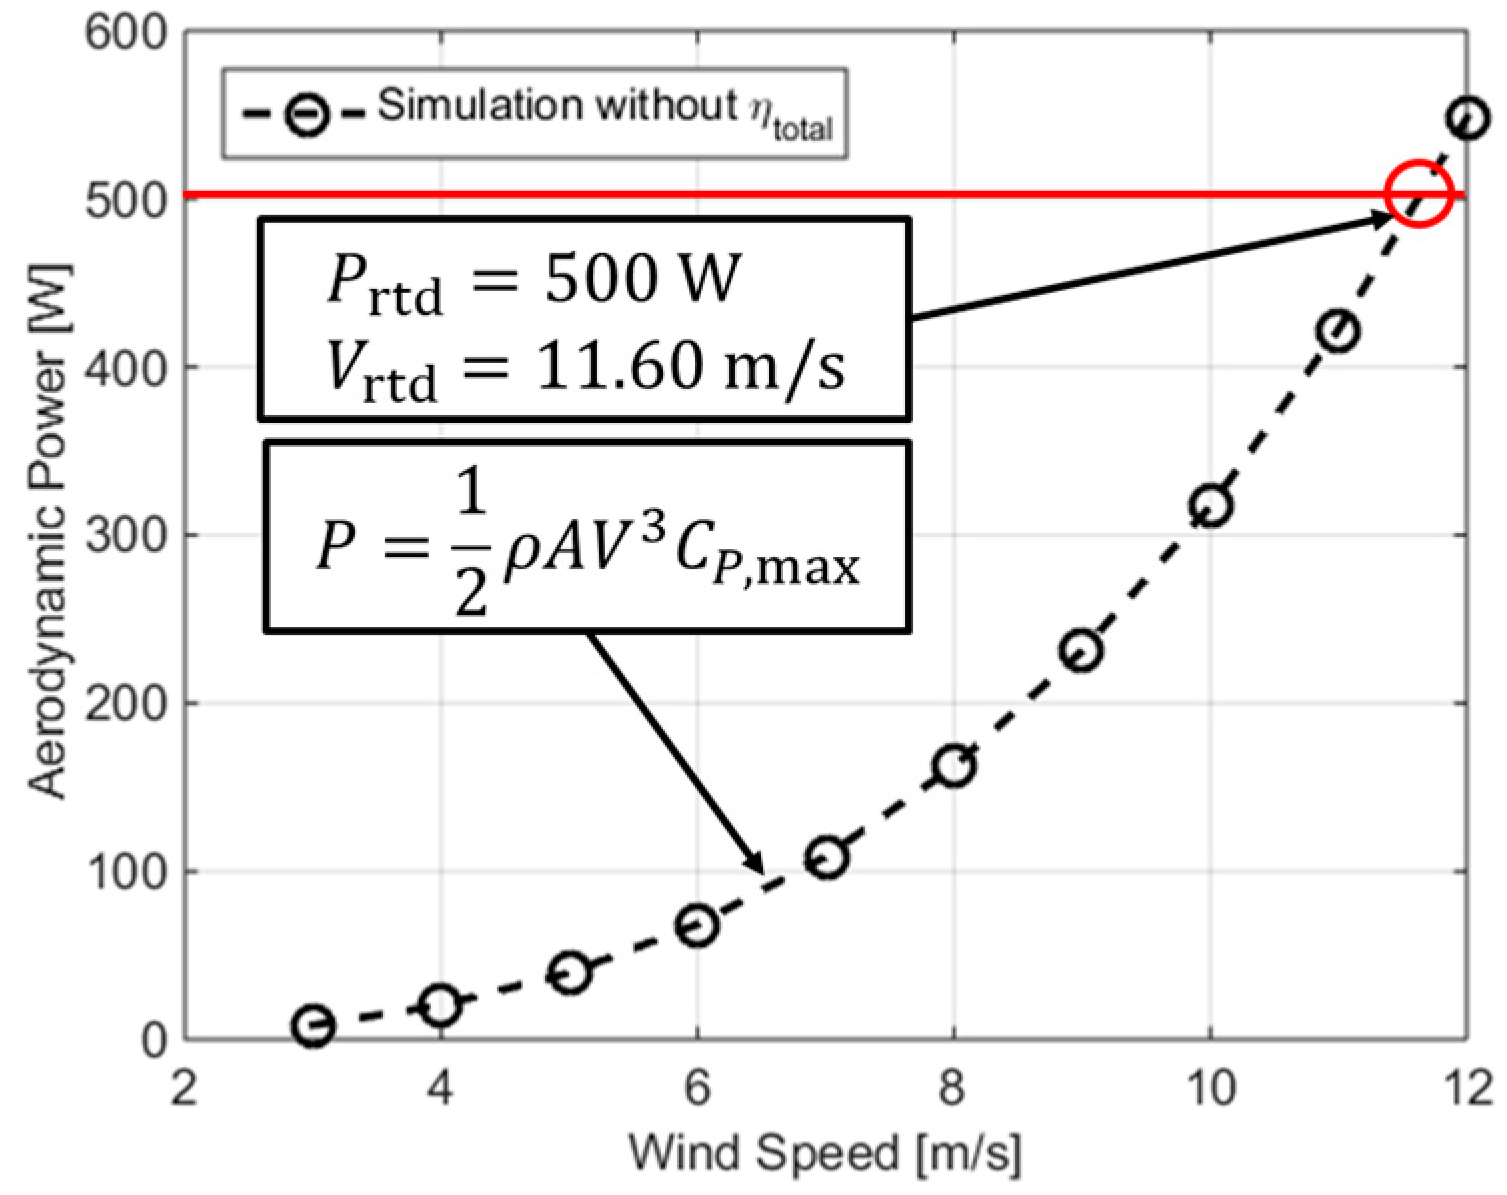
Based on the maximum power coefficient and Equation (2), the optimal mechanical power output from the wind turbine with respect to the wind speed can be calculated as shown in Equation (4).
To calculate the mechanical power output from the wind turbine for various wind speeds, the maximum power coefficient obtained by the simulation shown in Figure 5 was used. In reality, this condition is achieved by the so-called maximum power point tracking (MPPT) torque control. When MPPT is applied, the controller adjusts the rotational speed by torque commands to maintain the optimal tip speed ratio that maximizes the power. Therefore, the power coefficient of the wind turbine is maintained at a constant value of 0.293 when the wind speed is lower than the rated wind speed.
Under Maximum Power Point Tracking(MPPT) control, the predicted mechanical power output of the wind turbine with respect to the wind speed is shown in Figure 6. Based on the figure, the rated wind speed to generate the rated power which is 500 W is about 11.6 m/s. However, electrical losses of the generator and the controller are not included in the aerodynamic power output in Figure 6, and therefore the electrical power output should be smaller in the end.
4. Evaluation of Performance of Wind Turbine System
4.1. Generator-Related and Controller-Related Tests
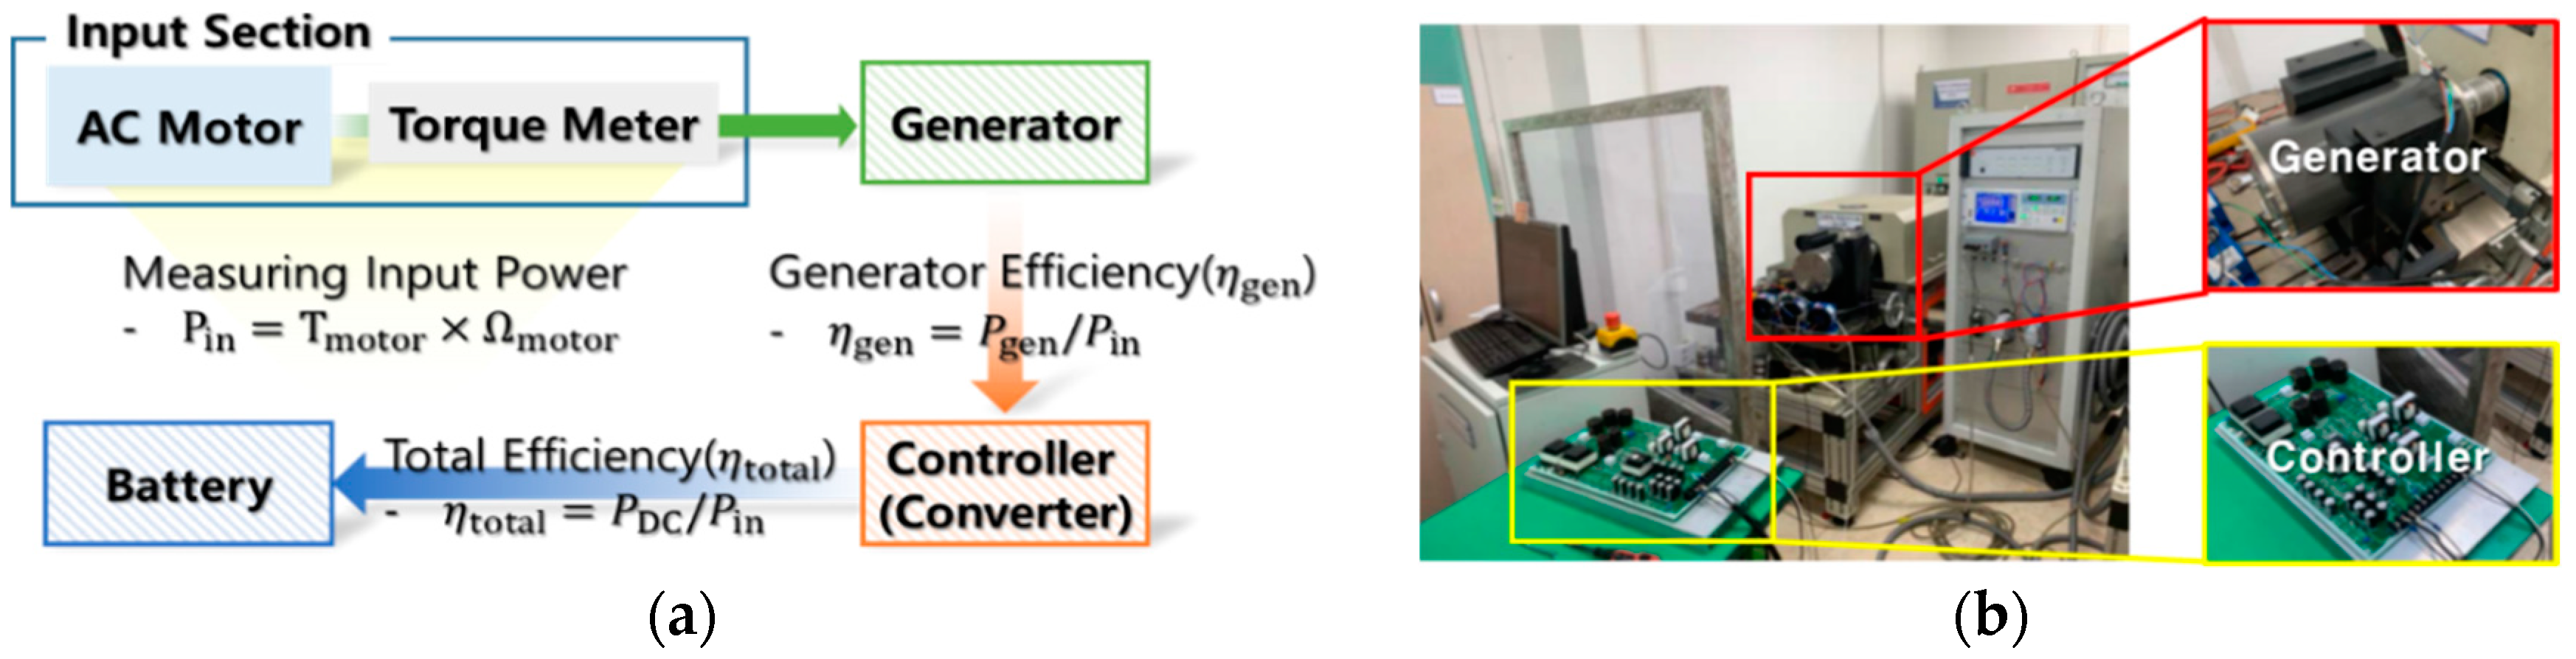
To assess the CFD simulation results and compare them with experimental measurements, losses can be caused by electrical components like generator and inverter were needed and applied to the result of CFD simulation. Losses of those components can be found in the experiment. To find out the electrical efficiency of the generator and the controller, the coupled test of the generator and controller was performed. The test was carried out at Korea Testing and Certification (KTC) which is one of the certified test institutions for generators and power converters of wind turbines in Korea. In order to perform the test, an experimental setup shown in Figure 7 was used.
The test setup is simply a coupled motor–generator device. The motor connected to the generator shaft plays the role of the wind turbine rotor. A torque sensor and a coupling were installed between the rotating motor and the generator. The torque sensor measures the rotational speed of the motor and the mechanical torque of the generator. Using these measured values, the input mechanical power can be calculated using Equation (1). Then, the generator efficiency can be determined by the ratio of the power produced by the generator to the mechanical power input.
The electrical efficiency of the controller was calculated by the ratio of the DC power output from the controller to the measured AC power input. The combined efficiency of the electrical systems was calculated by dividing the DC power output from the controller which is the final output to the mechanical power input.
4.2. Wind Turbine Power Output Considering Electrical Efficiency
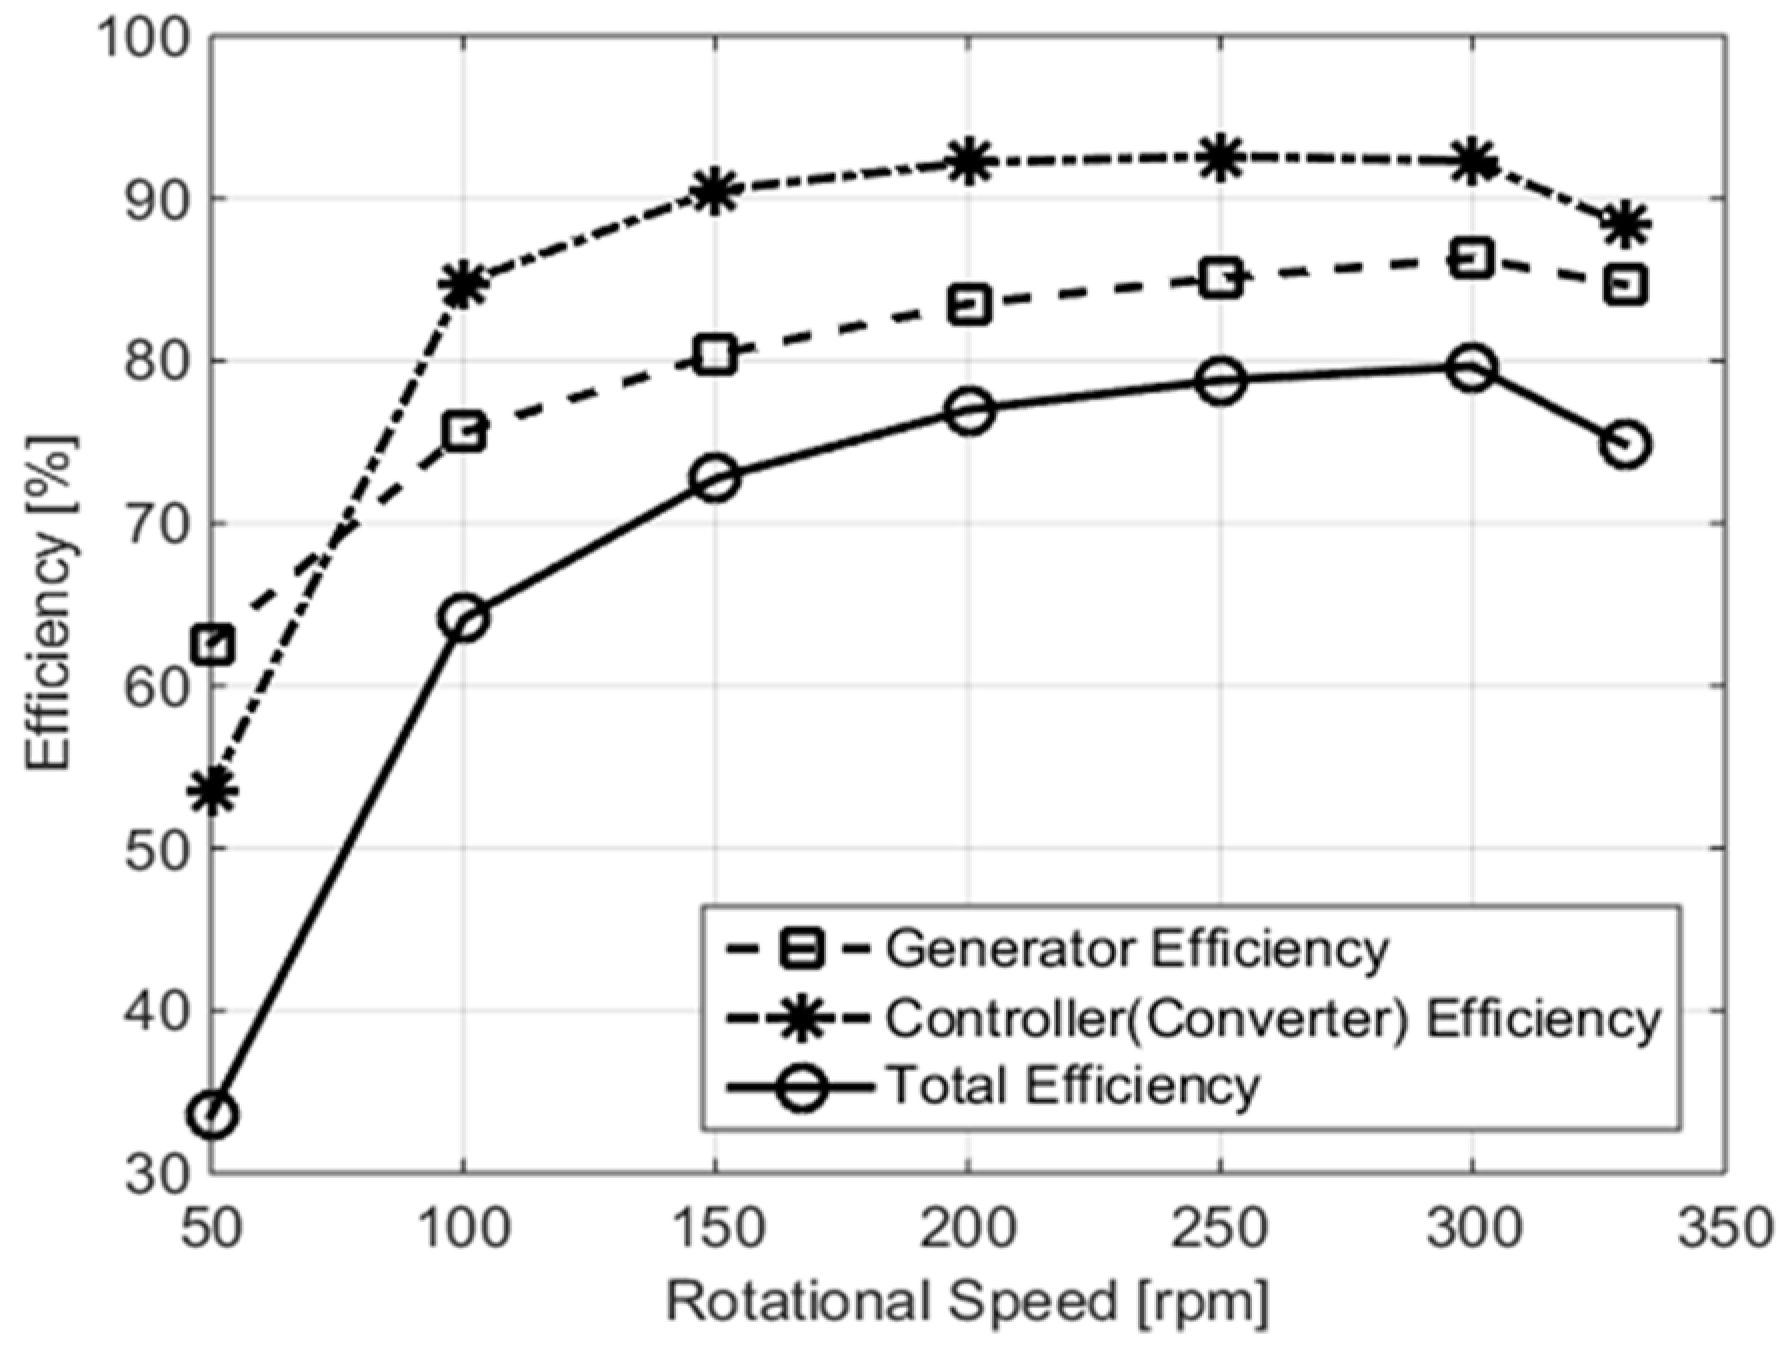
The efficiencies determined by the generator-controller test with respect to the generator rotational speed are shown in Figure 8. The generator efficiency was found to be 62.6% at 50 rpm and reached up to 86.3% at 300 rpm. The AC power output from the generator was converted into DC by the controller, and the efficiency of the controller was found to be at least 53.6% and at most 92.6%. The total (combined) electrical efficiency was obtained with a minimum value of 33.6% and a maximum value of 79.7%.
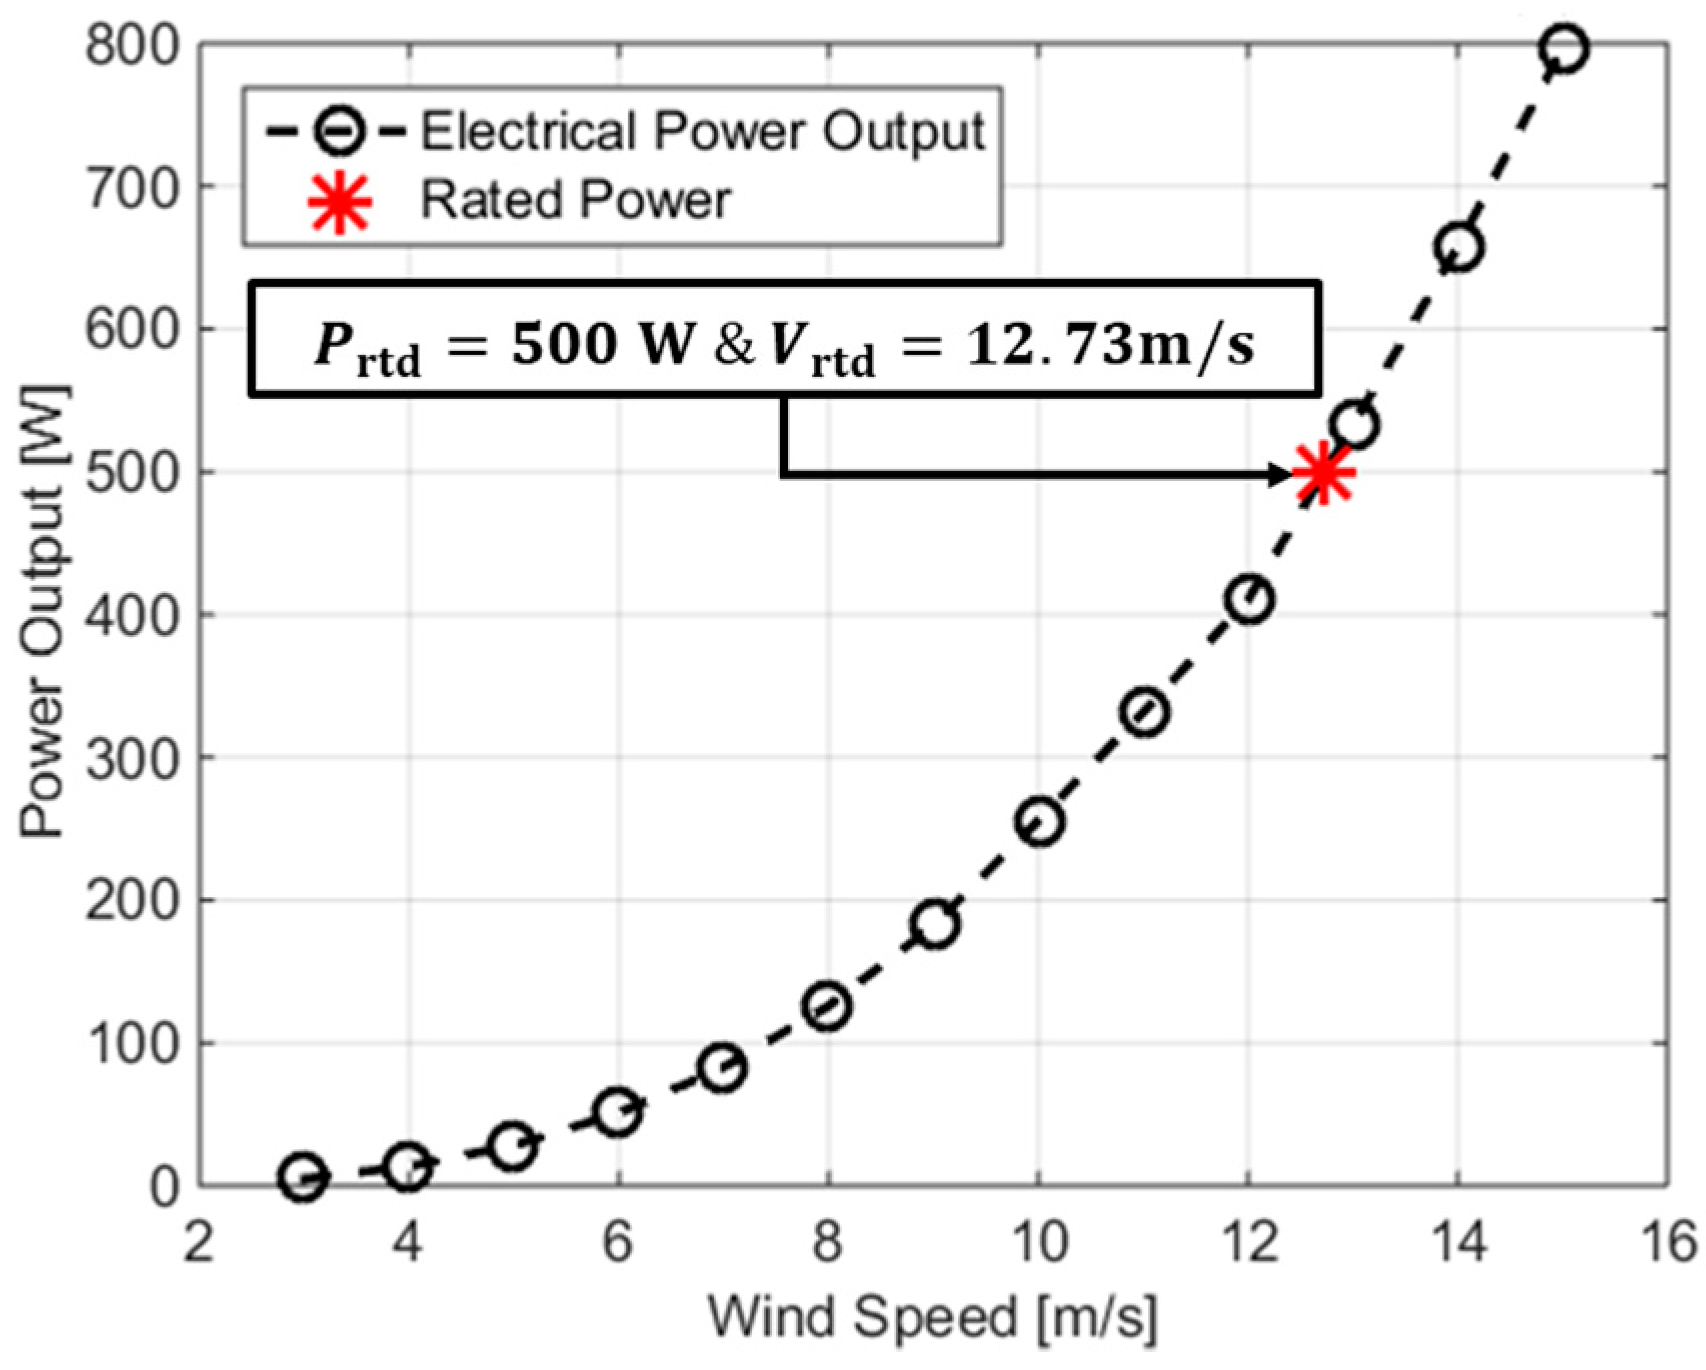
The electrical efficiency shown in Figure 8 was applied to the simulation results in Figure 6, and the total electrical power output of the wind turbine with respect to wind speed was predicted. The result is shown in Figure 9. As shown in the figure, the electrical power output from the wind turbine by prediction reached the rated power of 500 W at 12.73 m/s. As expected, the rated wind speed with the electrical losses is higher than the rated wind speed in Figure 6.
5. Experimental Validation by Field Tests
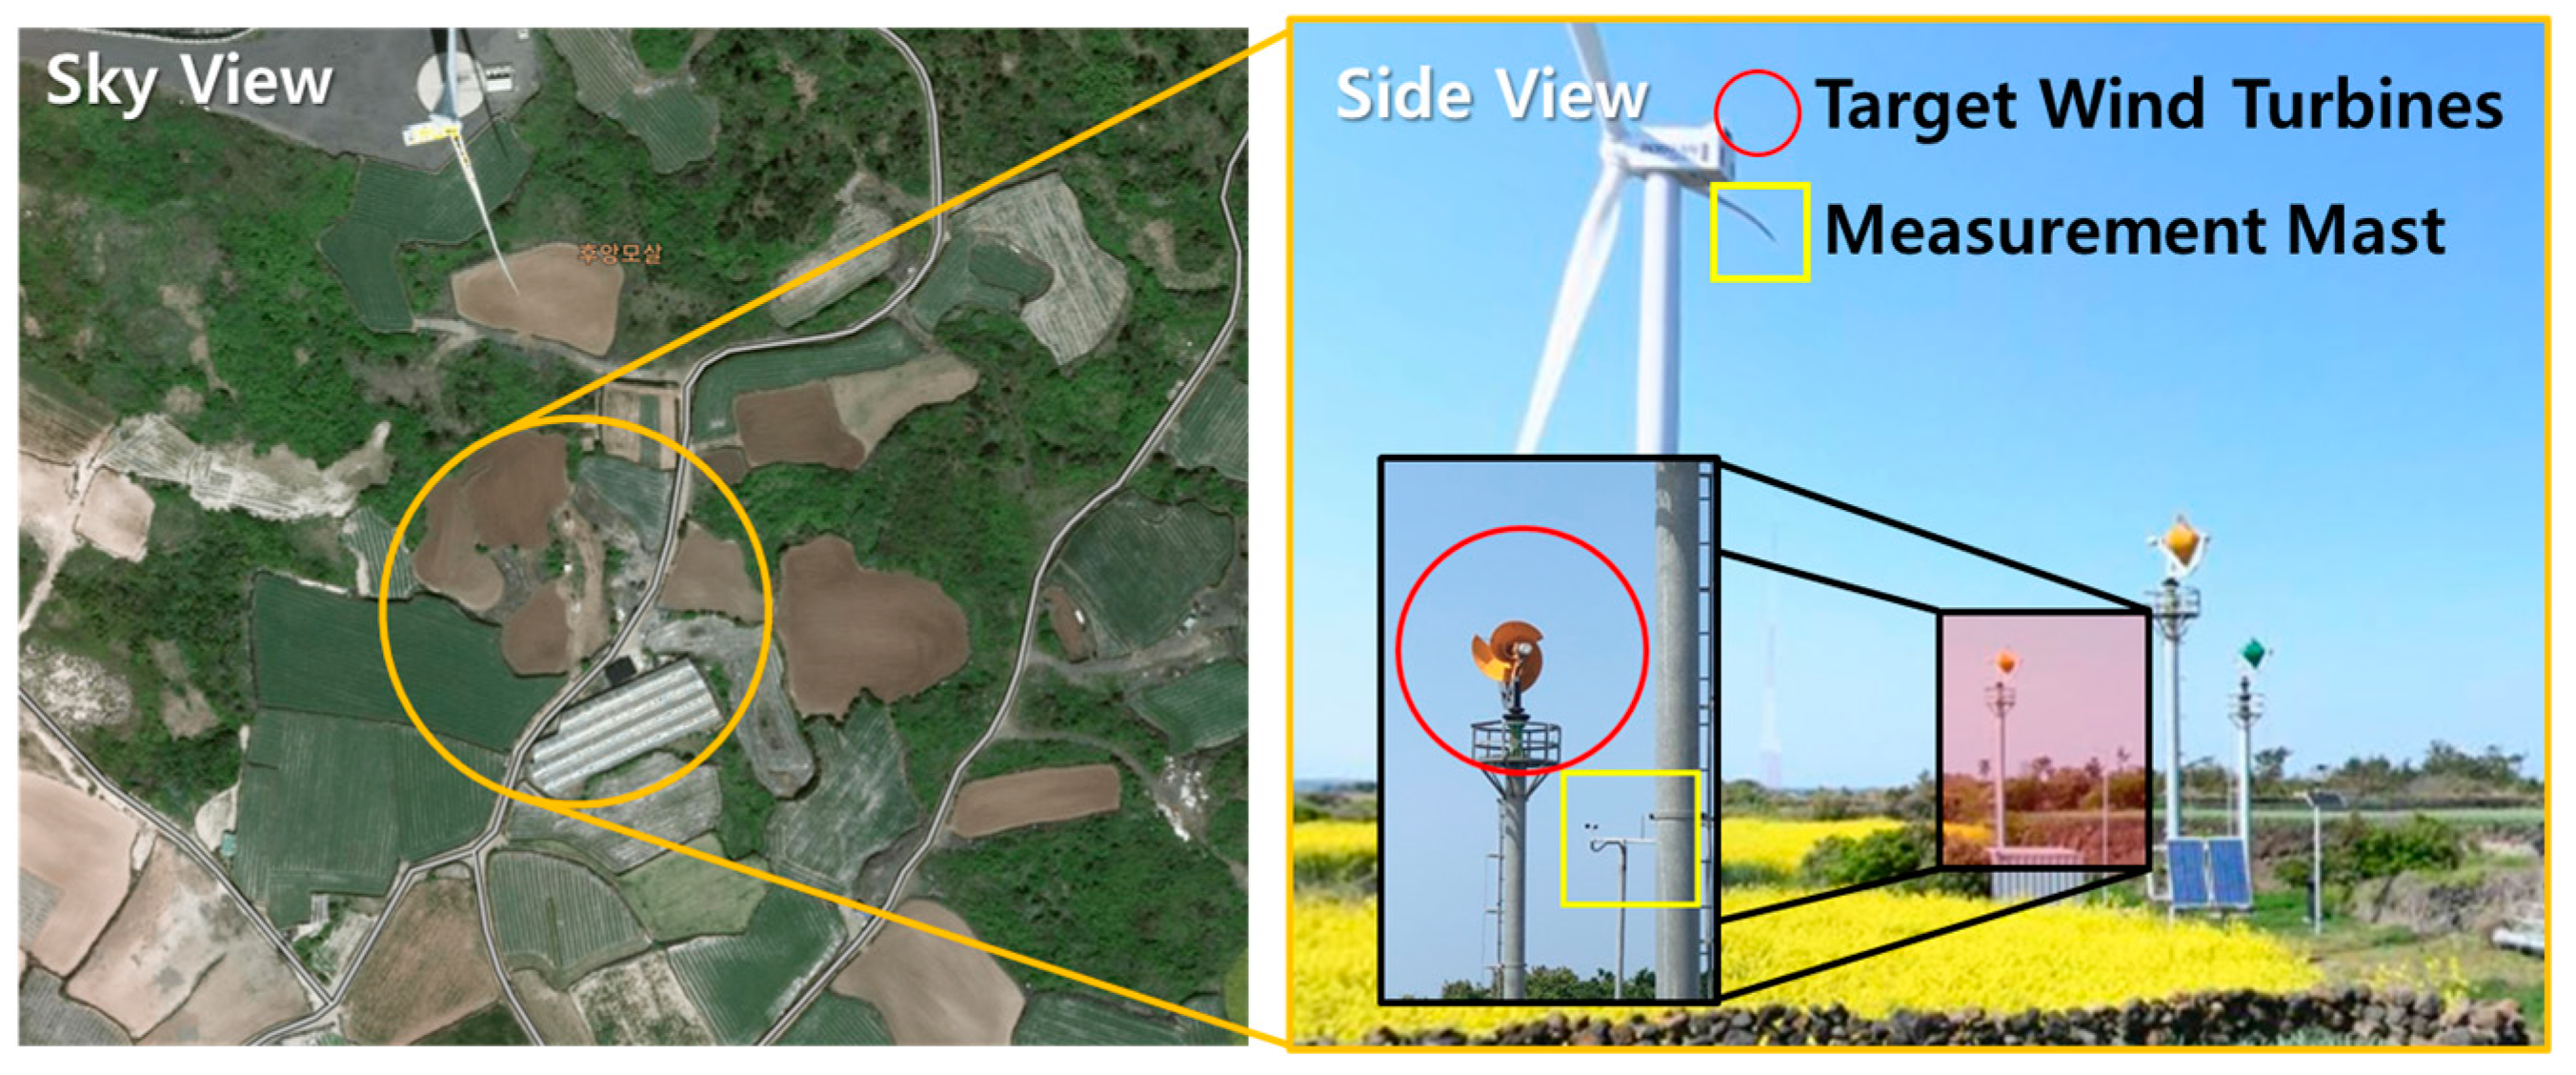
To experimentally verify the performance prediction based on the CFD analysis and the generator-controller test, the target wind turbine was installed at a test site in Jeju island in Korea. Figure 10 shows the test setup. The electrical power output and the corresponding wind speed at the measurement mast located on the test site were measured with a sampling frequency of 100 Hz and averaged for 60 s. The anemometer and the wind vane installed on the measurement mast were at a height of 6 m from the ground. The measured wind speed was used to find out the wind speed at the hub height of the wind turbine which is 10 m from the ground using the power-law shown in Equation (5). In Equation (5), is the wind speed at the hub height, is the wind speed measured from the anemometer installed on the measurement mast, z is the hub height, 10 m, and is the measurement height using the anemometer, 6 m. Also, is the wind sheer exponent, and a value of 1/7 which is suitable for flat terrain as shown in Figure 10 was used based on the literature [23].
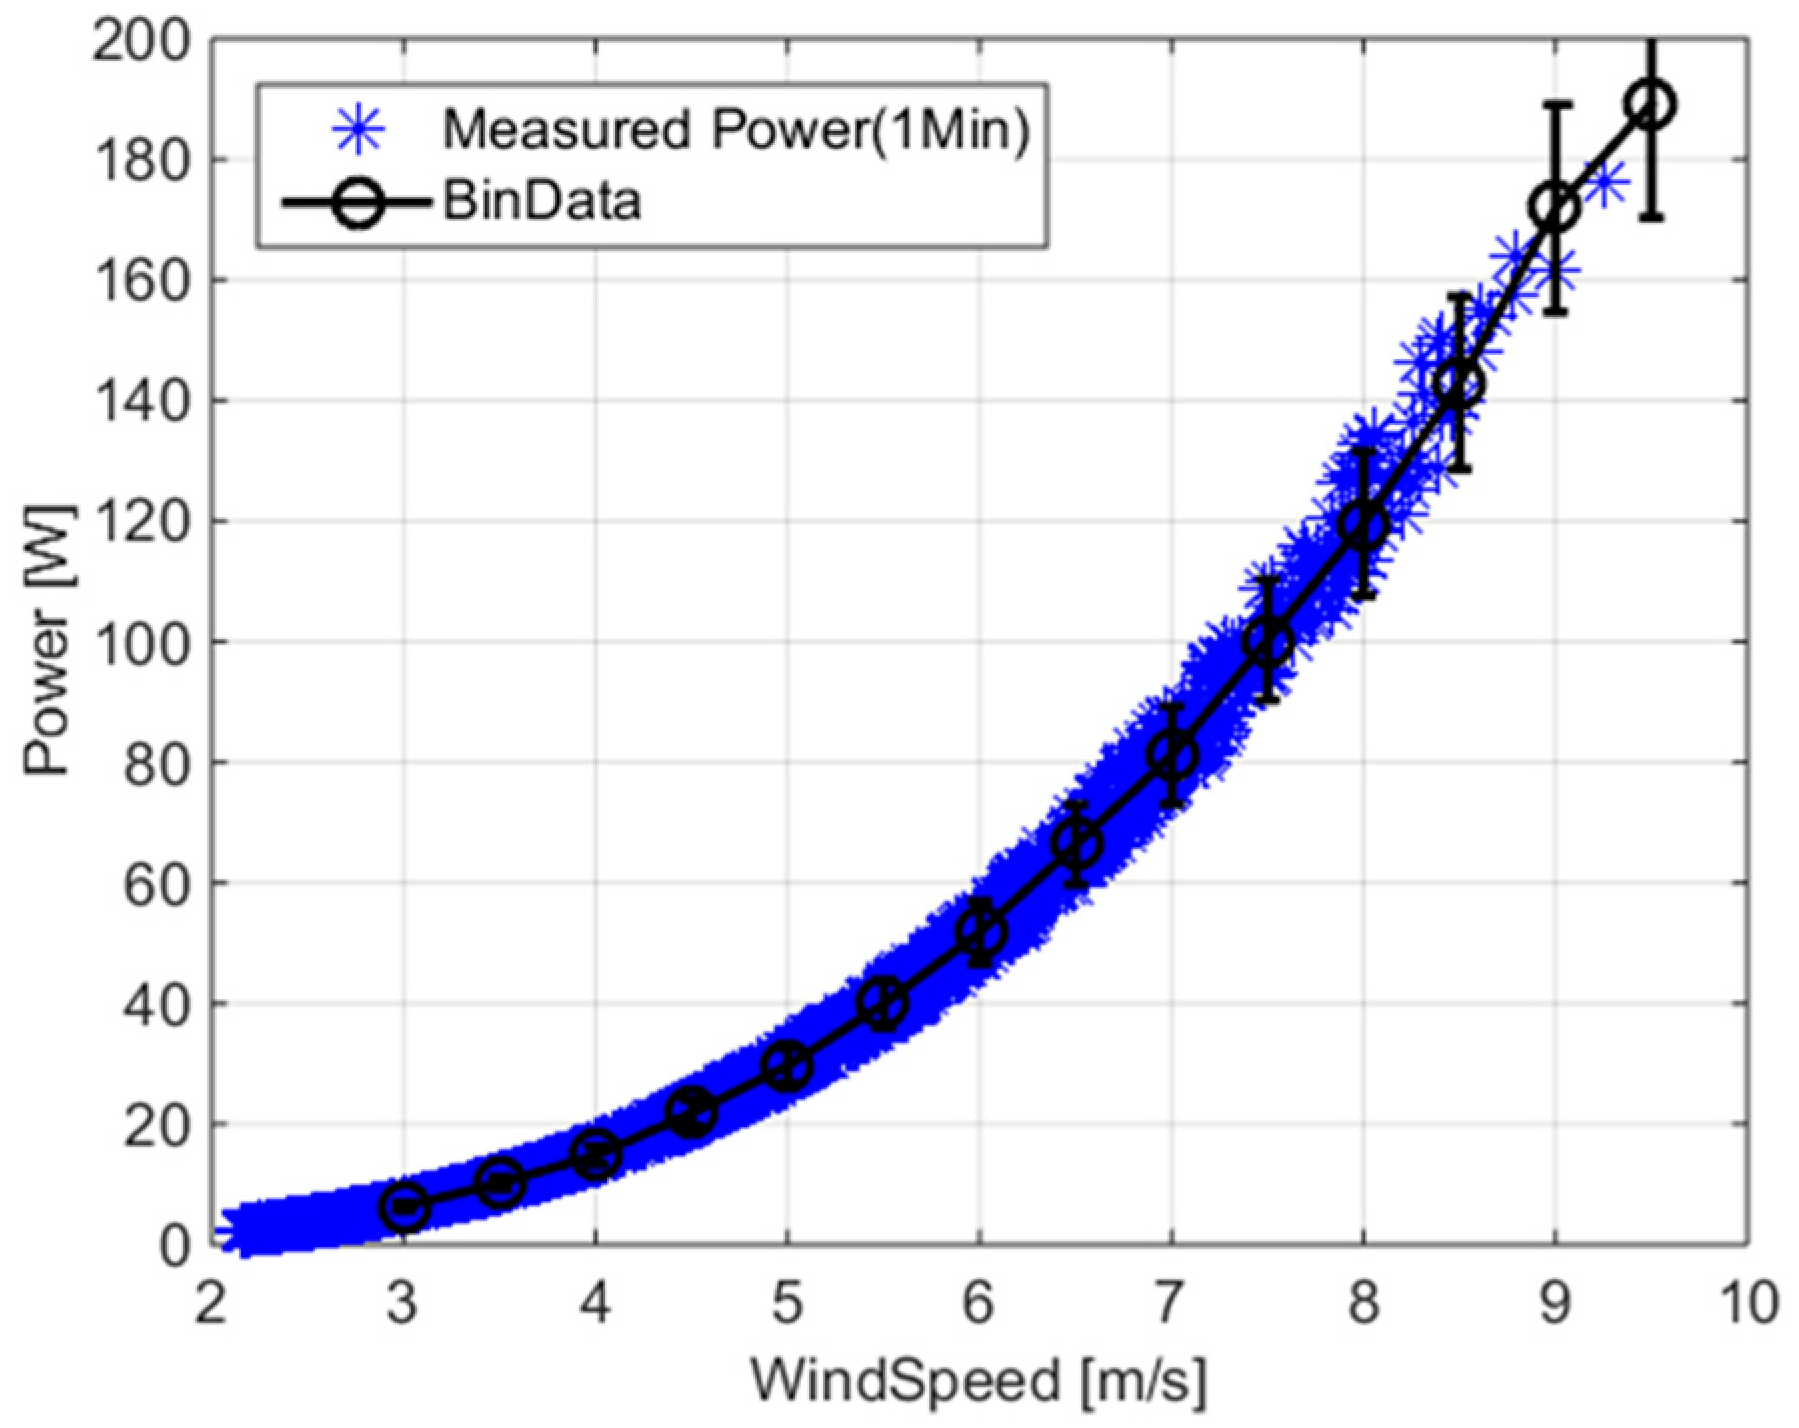
Figure 11 shows the test results. Each asterisk means one minute averaged data. Because of the turbulence in the wind, there exist scatters in the test data. The circles represent the average electrical power at each wind speed bin with an interval of 0.5 m/s starting from 3 m/s. Also, the short vertical lines passing the circles represent the standard deviation added and subtracted from the average. Unfortunately, the rated wind speed of 12.73 m/s and the rated power of 500 W were not measured due to the low frequency of the wind speed over 10 m/s during the measurement campaign.
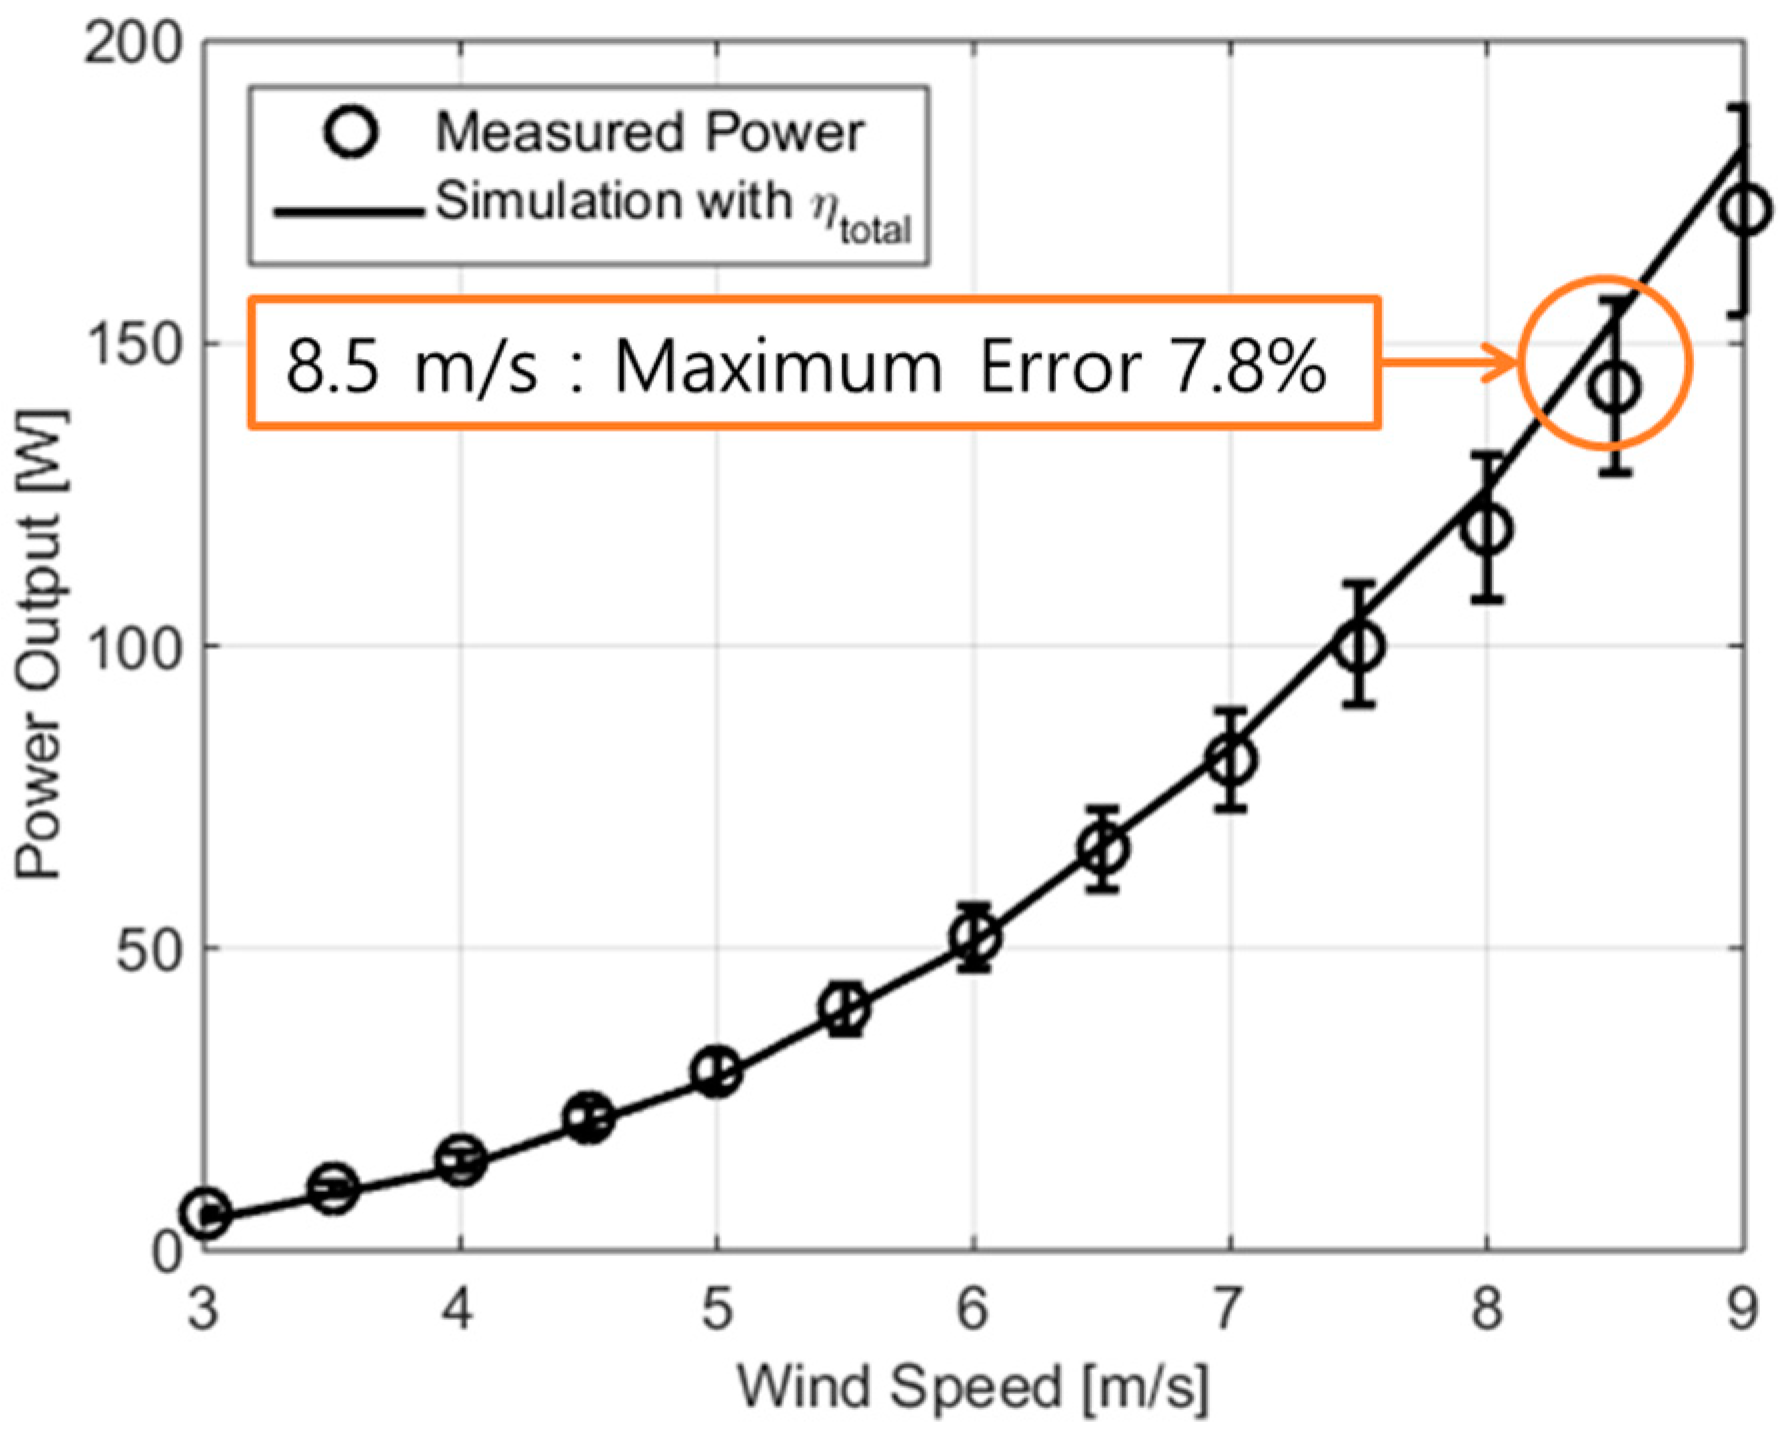
Comparing the measured output with the simulation results with measured electrical losses implemented enabled the validation of the simulation results and the performance prediction procedures. A comparison of the simulation and the measurement results is shown in Figure 12. As shown in the figure, the maximum error between the simulation and the binned average of measurement data was 7.80% at 8.5 m/s.
6. Conclusions
In this study, the performance of an Archimedes spiral horizontal-axis wind turbine was predicted by a CFD simulation and experimentally validated by a field test. As a result of the prediction, a maximum mechanical efficiency of 0.293 was observed when the tip speed ratio of the rotor was 2.19. In addition, a test was carried out to find out the electrical efficiency of the generator and the controller, and the efficiency variation according to the rotating speed of the rotor was measured. By applying the measured electrical efficiency to the simulation results by CFD, the electrical power output of the wind turbine could be predicted with respect to wind speed, and the rated wind speed to produce the rated power of 500 W was found to be 12.73 m/s.
To validate the suitability of the power results and performance prediction processes, the wind turbine was installed at the test site in Korea and its power output was measured. After comparing the measured power with the simulations, the maximum error between the measured power and the simulation was found to be 7.80% when the wind speed was 8.5 m/s. Therefore, the performance prediction by CFD was found to be in good agreement with the field data in a test site.
In order to more accurately predict the performance of wind turbines, the aerodynamic performance of the rotor and electrical efficiency such as generator-inverter should be considered. In case of CFD simulation to derive the aerodynamic performance of the rotor, the quality evaluation of the generated grid through the grid-independent test is important. In addition, when applying generator-inverter test results into CFD results, it is necessary to apply electrical efficiency corresponding to the predicted rotational speed respect to wind speed. If both cases are considered, the performance prediction of the drag wind turbine will be similar to the actual scale test and will be a more economic way to verify the system performance before the prototype is manufactured.
Author Contributions
H.J. performed the simulation of the wind turbine rotor, and the analysis the results of the field test and electrical efficiency test. D.K. performed the reorganizing and conversion of field test data (raw data to satisfying regulation). Y.H. organized Fluent simulation and extract figure files. I.P. supervised the research and revised the paper. S.K. performed the generator-controller test and analyzed the test result. J.B. manufactured the proto-type wind turbine and performed the field test.
Funding
This work was supported by the Human Resources Program in Energy Technology and the New and Renewable Energy-Core Technology Program of the Korea Institute of Energy Technology Evaluation and Planning (KETEP) with a granted financial resource from the Ministry of Trade, Industry and Energy, Republic of Korea (Grants No. 20153010024470 and 20184030201940).
Acknowledgments
The preliminary results of this study were presented at Autumn Annual Conference of the Korean Solar Energy Society (KSES, 2019).
Conflicts of Interest
The authors declare no conflicts of interest.
References
- Kim, H.; Kim, J.; Kim, H. Long-Term Statistical Analysis of Global Wind Resources using Reanalysis Data. J. Wind Energy 2018, 9, 19–24. [Google Scholar]
- World Wind Energy Association. 2017 Small Wind World Report. Available online: https://wwindea.org/wp-content/uploads/2014/10/ SWWR2017-SUMMARY.pdf (accessed on 20 July 2019).
- Korean Agency for Technology and Standards. KS C 8570, Small Wind Turbine. 2015. Available online: https//standard.go.kr/KSCI/standard-Intro/getStandardSearchView.do\menuId=919topMenuId=502&upperMenu-Id=503&ksNo=KSC8570&tmprKsNo=KSC8570&reformo=00 (accessed on 20 July 2019). (In Korean)
- Jang, H.; Paek, I.; Kim, S.; Jeong, D. Performance Prediction and Validation of a Small-Capacity Twisted Savonius Wind Turbine. Energies 2019, 12, 1721. [Google Scholar] [CrossRef] [Green Version]
- Rao, S.S.; Shanmukesh, K.; Naidu, M.K.; Kalla, P. Design and Analysis of Archimedes Aero-Foil Wind Tur-bine Blade for Light and Moderate Wind Speeds. Int. J. Recent Technol. Mech. Electr. Eng. 2018, 5, 1–5. [Google Scholar]
- Manwell, J.F.; McGowan, J.G.; Rogers, A.L. Wind Energy Explained: Theory, Design and Application; John Wiley: Chichester, UK, 2002. [Google Scholar]
- Bossanyi, E.A. GH Bladed—Theory Manual; DNVGL: Bristol, UK, 2003; pp. 56–58. [Google Scholar]
- Jonkmann, J.M.; Buhl, M.L., Jr. FAST User’s Guide NREL/EL-500-38230; National Renewable Energy Laboratory: Golden, CO, USA, 2005; p. 16.
- Marten, D. QBlade Guidelines V0. 95 Guidelines for Lifting Line Free Vortex Wake Simulations; Technical Report; HFI: Berlin, Germany, 2016. [Google Scholar]
- MIT. Xfoil-Subsonic Airfoil Development System. Available online: https://web.mit.edu/drela/Public/web/xfoil/ (accessed on 21 July 2019). (In Korean).
- Larsen, T.J.; Hansen, A.M. How to HAWC2, the User’s Manual; DTU Wind Energy: Roskilde, Denmark, 2012; pp. 40–46. [Google Scholar]
- Ansys Fluent Tutorial Guide; Ansys, Inc.: Canonsburg, PA, USA, 2017; pp. 230–266.
- Fujisawa, N. On the torque mechanism of Savonius rotors. J. Wind Eng. Ind. Aerodyn. 1992, 40, 277–292. [Google Scholar] [CrossRef]
- Fernando, M.S.U.K.; Modi, V. A numerical analysis of the unsteady flow past a Savonius wind turbine. J. Wind Eng. Ind. Aerodyn. 1989, 32, 302–327. [Google Scholar] [CrossRef]
- Shinohara, T.; Ishimatsu, K. Simulation of flow around rotating Savonius rotors. In Proceedings of the Japan Society of Computational Fluid Dynamics, 6th National Symposium on Computational Fluid Dynamics, Tokyo, Japan, 21–23 December 1992; Volume 2, pp. 691–694. Available online: http://adsabs.harvard.edu/abs/1993cfd..proc..691I (accessed on 4 January 2019).
- Lu, Q.; Li, Q.; Kim, Y.K.; Kim, K.C. A study on design and aerodynamic characteristics of a spiral-type wind turbine blade. J. Korean Soc. Vis. 2012, 10, 27–33. [Google Scholar]
- Safidari, A.; Kim, K.C. Aerodynamic and Structural Evaluation of Horizontal Archimedes Spiral Wind Turbine. J. Clean Energy Technol. 2015, 3, 34–38. [Google Scholar] [CrossRef] [Green Version]
- Kim, K.; Ji, K.; Kim, H.Y.; Lu, Q.; Baek, J. Experimental and Numerical Study of the Aerodynamic Characteristics of an Archimedes Spiral Wind Turbine Blade. Energies 2014, 7, 7893–7914. [Google Scholar] [CrossRef] [Green Version]
- Kim, K.; Kim, H.; Kim, K.; Paek, I. Power regulation of upstream wind turbines for power increase in a wind farm. Int. J. Precis. Eng. Manuf. 2016, 17, 665–670. [Google Scholar] [CrossRef]
- Kim, K.; Kim, H.; Kim, C.; Paek, I.; Bottasso, C.L.; Campagnolo, F. Design and Validation of Demanded Power Point Tracking Control Algorithm of Wind Turbine. Int. J. Precis. Eng. Manuf. Green Technol. 2018, 5, 387–400. [Google Scholar] [CrossRef]
- Kim, K.; Kim, H.; Paek, I.; Kim, H.; Son, J. Field Validation of Demanded Power Point Tracking Control Algorithm for Medium-Capacity Wind Turbine. Int. J. Precis. Eng. Manuf. Green Technol. 2019, 6, 875–881. [Google Scholar] [CrossRef]
- Kim, C.; Kim, K.; Song, Y.; Paek, I. Tower Load Reduction Control by Pitch Loop Individual Gain Scheduling. J. Wind Energy 2018, 9, 25–32. [Google Scholar]
- David, A.S. Wind Turbine Technology—Fundamental Concept of Wind Turbine Engineering, 2nd ed.; ASME: New York, NY, USA, 2003. [Google Scholar]
Figure 1.
Wind turbine geometrical shape: (a) installed win turbine during performance test; (b) 3D model file for simulation.
Figure 1.
Wind turbine geometrical shape: (a) installed win turbine during performance test; (b) 3D model file for simulation.

Figure 2.
Scheme of simulation procedure.

Figure 3.
Shape simplification example of complex components.

Figure 4.
Model on Fluent: (a) boundary area and section; (b) generated grid shape.

Figure 5.
Estimated power efficiency with respect to tip speed ratio.

Figure 6.
Estimated power output from simulations.

Figure 7.
Test environment: (a) scheme of test; (b) installed test setup.

Figure 8.
Test results for electrical efficiency respect to generator rotational speed.

Figure 9.
Estimated power output considering electrical efficiency.

Figure 10.
Field test site.

Figure 11.
Measured power from the field tests.

Figure 12.
Comparison of measured power and estimated power through the electrical efficiency considered simulation.
Figure 12.
Comparison of measured power and estimated power through the electrical efficiency considered simulation.


Table 1.
Specification of wind turbine.
| Subject | Unit | Value |
|---|---|---|
| Rated power (P) | W | 500 |
| Rated wind speed (V) | m/s | 12.0 |
| Rated RPM () | rpm | 330 |
| Rotor dimension (radius, axial length) | m | Φ 1.5 1.2 |
| Number of blades | ea | 3 |
Table 2.
Simulation condition—analysis range.
| Subject | Unit | Value | Intervals |
|---|---|---|---|
| Wind Speed (V) | m/s | 12 | - |
| Rotational Speed () | rpm | 50–500 | 50 |
© 2019 by the authors. Licensee MDPI, Basel, Switzerland. This article is an open access article distributed under the terms and conditions of the Creative Commons Attribution (CC BY) license (http://creativecommons.org/licenses/by/4.0/).
Share and Cite
MDPI and ACS Style
Jang, H.; Kim, D.; Hwang, Y.; Paek, I.; Kim, S.; Baek, J. Analysis of Archimedes Spiral Wind Turbine Performance by Simulation and Field Test. Energies 2019, 12, 4624. https://doi.org/10.3390/en12244624
AMA Style
Jang H, Kim D, Hwang Y, Paek I, Kim S, Baek J. Analysis of Archimedes Spiral Wind Turbine Performance by Simulation and Field Test. Energies. 2019; 12(24):4624. https://doi.org/10.3390/en12244624
Chicago/Turabian StyleJang, Hyeonmu, Dongmyeong Kim, Yechan Hwang, Insu Paek, Seungjoo Kim, and Joonho Baek. 2019. "Analysis of Archimedes Spiral Wind Turbine Performance by Simulation and Field Test" Energies 12, no. 24: 4624. https://doi.org/10.3390/en12244624
Note that from the first issue of 2016, this journal uses article numbers instead of page numbers. See further details here.