Energy Accounting for a Renewable Energy Future


1
Department of Design, Monash University-Caulfield Campus, P.O. Box 197, Caulfield East, Victoria 3145, Australia
2
Department of Mechanical and Aerospace Engineering, Monash University-Clayton Campus, P.O. Box 31, Victoria 3800, Australia
*
Author to whom correspondence should be addressed.
Energies 2019, 12(22), 4280; https://doi.org/10.3390/en12224280
Submission received: 17 October 2019
/
Revised: 6 November 2019
/
Accepted: 8 November 2019
/
Published: 10 November 2019
(This article belongs to the Special Issue Rethinking Energy: Earth System Science Approaches)
Abstract
:For millennia, humans relied almost entirely on renewable energy (RE), largely biomass, for their energy needs. Over the past century, fossil fuels (FFs) have not only largely replaced RE, but have enabled a many-fold rise in total energy use. This FF dominance changed the way we think about and accounted for energy use. If (as at present) the world essentially continues to ignore climate change, eventual resource depletion will force conversion to RE and, perhaps, nuclear energy will once again have to provide most of the world’s energy use. However, the change is more likely to come about because of the urgent need for climate change mitigation. At present, primary RE electricity accounting is done by calculating the FF energy that would be needed to produce it. But as FFs disappear, this approach makes less sense. Instead, a new approach to energy accounting will be needed, one that allows for the intermittent nature of the two most abundant RE sources, wind and solar power. Surplus intermittent RE might be converted to H2, further complicating energy accounting. An additional complication will be the treatment of energy reductions, especially from passive solar energy, likely to be more important in the coming decades. This paper is a review of the evidence to try to determine the best approach to future energy accounting.
1. Introduction
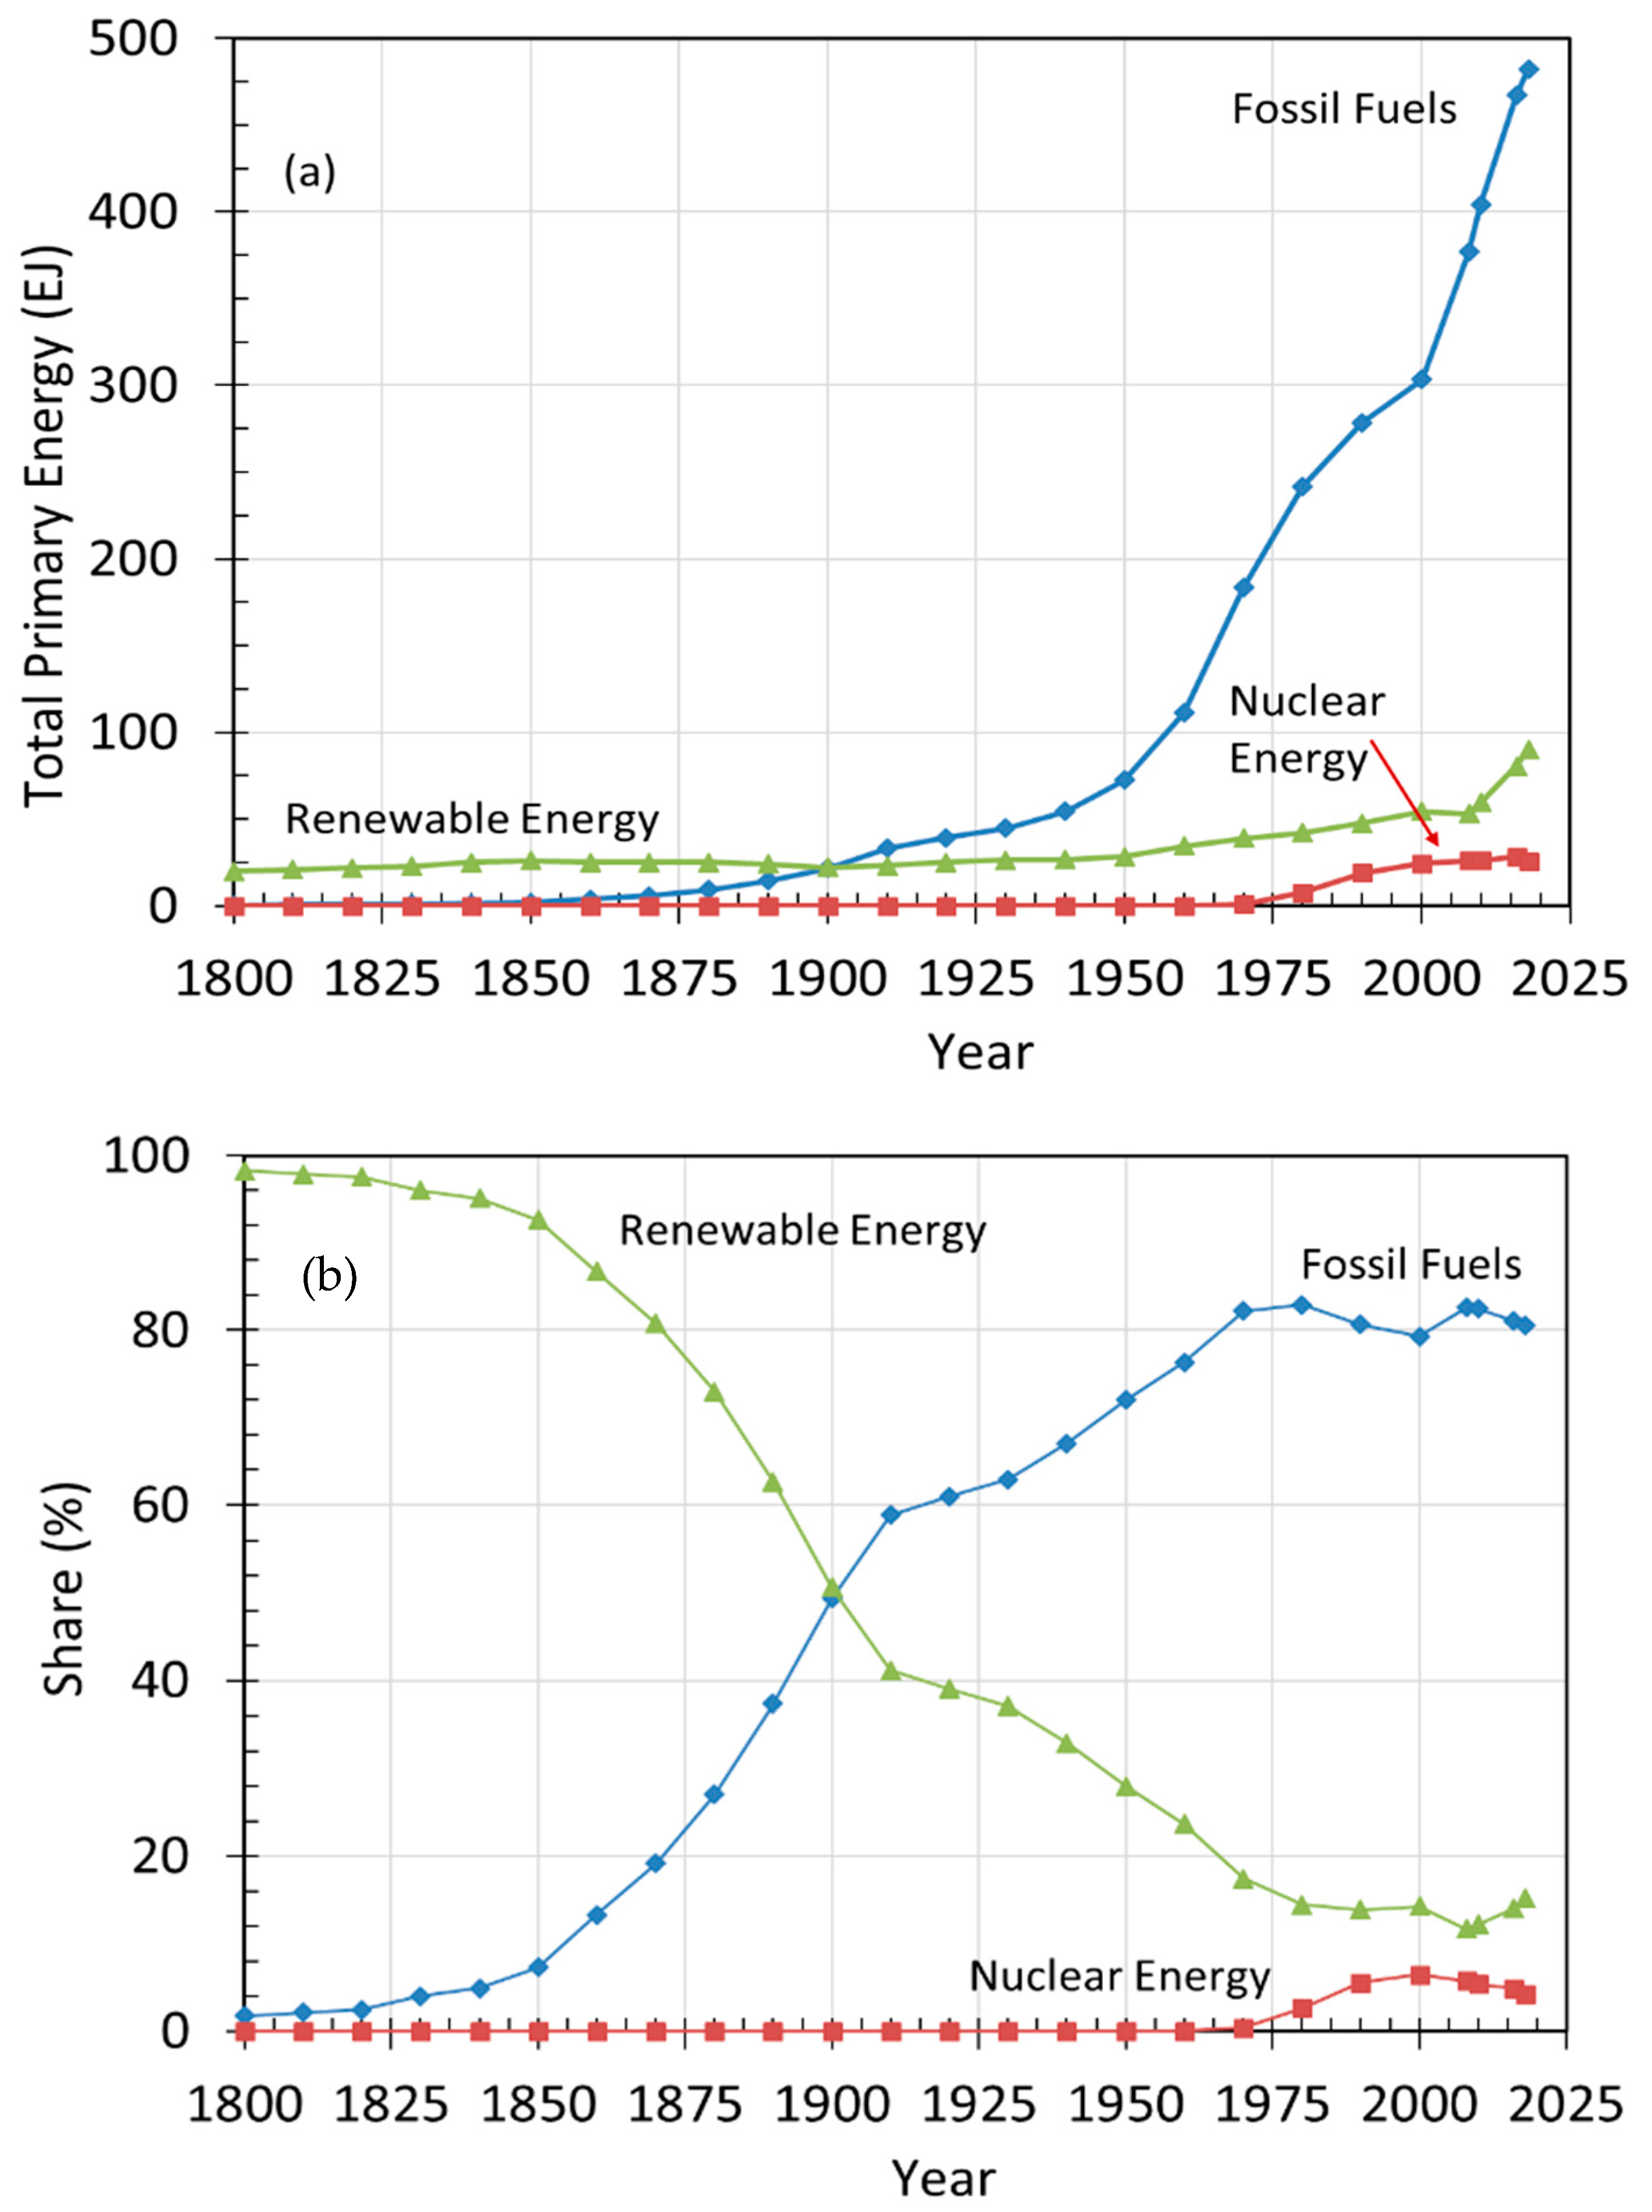
According to Vaclav Smil [1], global primary energy use in the year 1800 was only 20.35 EJ (exajoule = 1018 joule), of which nearly all (an estimated 20 EJ) was fuel wood and the rest coal. Figure 1 shows how primary energy use has developed since 1800, with fossil fuels enabling the massive growth in use, particularly since 1950, to 576 EJ in 2016 [2]. Despite bioenergy falling to around 10% of global primary energy today, its use has also grown from 1800 to around 50 EJ today. The more than century-long dominance of fossil fuels (FF) has shaped the way we think about energy. The world, especially the high-income nations, have become accustomed to using—by historical standards, at least—vast quantities of cheap energy [3]. The world is also accustomed to viewing fossil energy as a very energy large store, so that, so far, there have been no geological limits on annual withdrawals.
It is not hard to see why keeping track of both FF reserves and production statistics are important. The Organization of the Petroleum Exporting Countries (OPEC), for example, at various times have imposed production quotas on its member states to boost or maintain oil prices, which evidently require the assembling of production statistics not only for OPEC countries, but also on global production (see, for example OPEC [4]). Statistics on reserves of FFs are also important, given the vital importance of oil and natural gas (NG) exports for many countries, not only in OPEC. Knowledge of proven recoverable reserves are essential for energy infrastructure planning, for economic planning and for securing international loans. Calculating global or national annual consumption of each fossil fuel is needed to determine how long it will take to exhaust proven recoverable reserves of these stocks. Importing countries likewise need to know what quantities are available for importing in the future, and from which countries. They also need to have statistics on the daily and annual consumption of each FF, especially oil and NG, in order to know how long their stockpiles will last in the case of supply interruptions. Figure 1, based mainly on historical data from [1,2], and later data from [5,6], gives a view of global energy use since 1800.
This dominant role for FF must change in the coming decades. Increasingly, there is talk of most of the global FF reserves becoming ‘stranded assets’ or ‘unburnable oil’ [7], because of limits on anthropogenic greenhouse gas emissions necessary to avoid serious climatic change [8]. Even if absolute levels of RE increase only at around the annual levels shown in Figure 1, its share of total energy could rise rapidly if FF use (and so global energy use) is curtailed to reduce energy related greenhouse gas (GHG) emissions, chiefly carbon dioxide (CO2).
Nuclear energy is not likely to be more than a minor energy source in the coming decades [9,10], although it is conceivable that breeder and even fusion reactors could be important later on. Before oil and gas were developed as additional thermal fuels, coal production statistics were simply given in tonnes. In a world energy system produced mainly from FFs, it made sense to base energy accounting on the total thermal content of the various fuels (although NG power stations have greater efficiency than coal power stations). Bioenergy was readily fitted into this scheme, as was nuclear and even geothermal energy. Before the recent growth in wind and solar energy, the only non-thermal energy source was hydroelectricity.
A renewable energy world will still need some form of energy accounting, but not necessarily one that is a legacy of the FF age [11]. Today, a large proportion of FF production crosses international borders. For petroleum, over 71% of production is moved internationally by pipe or ship [6]. In the coming RE age, energy could be mainly produced from wind and solar photovoltaic (PV) energy, which are both intermittent producers of primary electricity. Today, unlike FFs, only a few % of electricity moves across borders. National and electricity grid level statistics will still be essential for energy planning, and, as will be seen, even statistics on energy consumption aggregated at the global level will still be relevant.
This paper is a review of the issues and difficulties surrounding any attempt to move to a new, more appropriate method of energy accounting. A search on Google Scholar found thousands of entries for the term ‘energy accounting’. However, close inspection found nearly all were on topics unrelated to the problem posed in this Introductory section, although many were on the related topics of energy analysis and energy return on energy invested (EROI), i.e., the energy output divided by the energy invested; both are reviewed in this paper.
Papers most relevant to the topic were on emergy. Amaral [12] (p. 887) summarises this novel approach to energy accounting as follows: “[…] it uses a single measurement unit for all types of resources, thus enabling fairer comparison within and between systems; it takes into account different levels of energy quality (and its capacity to perform work) by using the concept of transformity […]” The authors make clear that emergy accounting, (despite its ambition of solve all the problems discussed in this review) has its own problems, and is not yet accepted by mainstream energy researchers. Accordingly, this paper mainly reviews relevant topics such as EROI and technical potentials. Because of the vast literature on these auxiliary topics, emphasis was given to the most recent papers.
The rest of the review proceeds as follows. Section 2 shows why RE will be the main energy source in future decades. Section 3 examines the present treatment of primary electricity, and the problem of intermittency. Section 4 discusses the inconsistencies in what is presently included in RE primary energy totals, and what is left out. Bioenergy, presently the largest RE source, and like FF, a thermal source of energy is considered in Section 5, and the technical potential for the other RE sources in Section 6. Section 7 discusses the implications of the preceding sections for energy accounting. Finally, Section 8 provides a summary of the ideas presented in the paper, especially the difficulties likely to be encountered for a RE-based accounting system.
2. Why Do We Need RE?
The first question which must be addressed in this review is why RE will have to provide most of the world’s energy in future. After all, the Intergovernmental Panel on Climate Change (IPCC) and the International Energy Agency (IEA) place heavy reliance on carbon capture and storage (CCS) for fossil fuels and negative emissions technologies (NETs) including CCS with bioenergy (BECCS) [13,14], while others have argued that solar radiation management (SRM) is increasingly an important option for climate change mitigation [15]. If either of these options were successfully implemented, non-biomass RE would take decades to be a major energy source, as FF annual production slowly declined to low levels [16]. The question of changing our energy accounting system could likewise be postponed for decades.
Steffen et al. [17] adopted a figure of 350 ppm for CO2 in the atmosphere as the safe ‘planetary boundary’. In 2018, the atmospheric concentration of CO2 passed 407 ppm [18]. If we assume that 400 ppm is at or above the safe limit, then the Earth is already in overshoot on this planetary boundary—as evidenced by the already observed increase in frequency and severity in extreme weather events [8] (because of ocean thermal inertia, some of the temperature rise from the present level of climate forcing is still to be realised in coming decades). One suggested approach to mitigation is carbon dioxide removal (CDR), either by biological or mechanical means.
Biological CDR, such as reforestation, has limited potential [19], and in any case global (net) deforestation is once again rising. Since most of the present CO2 emissions come from large FF plants such as power stations or refineries, CO2 could in principle be captured directly from the exhaust stacks, where CO2 concentrations can be 10%–15%, then stored underground in deep saline aquifers, for example. The energy penalty in suitably optimised plants, would probably only be of the order of 25%, but because very few existing plants are so optimised, the energy costs for CCS could be appreciably higher. This energy cost will further lower their EROI [20,21]. Other forms of mechanical CDR include negative emissions technologies (NETs) such as direct air capture of CO2 or enhanced weathering of minerals. Implementing these technologies would take decades to be significant, and are very costly in energy and monetary terms [22]. Anderson [23,24] has cautioned against unproven technologies such as NETs forming the basis of future energy plans. Although bioenergy is addressed separately below in Section 5, when operating as BECCS, the same storage problems arise as for fossil fuel CCS.
Alternatively, geoengineering could be attempted, either on a regional basis or globally, although the risks may be great, and it may not even be as effective as planned. Baker et al. [25] (p. 608) have shown that even if the most-discussed geoengineering option, SRM, could limit global mean temperatures rise to 1.5 °C above pre-industrial, extreme weather events would still pose serious risks. They argued that ‘geoengineering schemes aimed at reducing global warming impacts without reducing CO2 concentration would not fully mitigate changes in extremes whose likelihoods have increased by the direct effect of increasing CO2 concentrations.’ Furthermore, SRM will have energy costs, as well as additional energy needed for combatting ocean acidification, which will continue under SRM.
In brief, these two options both face numerous challenges, including basic feasibility, political and legal opposition, high costs and even new, unforeseen environmental risks [26,27,28]. It therefore seems very likely that RE will need to become the major energy source, even if this change owes as much to major FF decreases in use, as to rapid RE output growth.
3. Treatment of Primary RE Electricity
Although there are standards recommending methods to compile energy statistics [29], conflicting approaches remain between major groups in the calculation of the contribution to global primary energy from non-thermal electricity sources such as from hydro, wind and photovoltaic (PV) cells [11], see Table 1. These conflicts are inevitable, given that as Raugei [30] has pointed out comparing electricity and thermal energy is like counting ‘apples and oranges’ together. The IEA [2] method converts primary electricity to primary energy on a 1:1 basis, although for all thermal sources of electricity, whether FF, RE, or nuclear, the input heat energy is used based on a conversion efficiency of 33%. In contrast, BP converts non-thermal electricity to primary energy “by calculating the equivalent amount of fossil fuel required to generate the same volume of electricity in a thermal power station assuming a conversion efficiency of 38% (the average for OECD thermal power generation)” [6] (p. 60). BP also excludes non-commercial fossil fuels from its primary energy statistics, partly because, unlike fossil fuels, their consumption can only be roughly estimated.
Electricity production from low thermal conversion efficiency RE sources present further difficulties. For STEC and geothermal electricity the IEA assume 33% and 10% conversion efficiencies respectively [2]. Hence primary energy is calculated as 10 times the electrical energy output. But what if ocean thermal energy conversion (OTEC)—electricity generated from the roughly 20 °C difference between surface waters and deep water in tropical oceans—is developed on a large scale? Conversion efficiency at such low temperature differences would only be a few percent [31]. Would primary energy be calculated as 30–50 times the electric output?
Even though hydroelectricity produced 4193 terawatt-hr (TWh = 1012 watt-hr) of electricity in 2018, compared with 2701 TWh from nuclear [6], in the IEA accounts, hydro is credited with only about half the total primary energy of nuclear power, even though electricity is presently its sole output [2]. For wind and solar, use of either approach will not make much difference at present low levels of output. But if RE has to largely replace FFs in the total energy mix, wind and solar energy will have to account for the bulk of energy production [32]. Which method is used will then become an important question.
For UN bodies such as the IPCC, particularly when undertaking long term scenario planning, the problems arising from use of accounting for different energy production methods is addressed through use of a method known as direct equivalent energy accounting. This method “…counts one unit of secondary energy provided from non-combustible sources as one unit of primary energy” [32] (p. 1294). It is claimed that this method enables planers to deal with energy systems undergoing transition to low carbon energy sources [33].
A common factor of all these methods is that they ignore the intermittent nature of what will become the main energy sources, wind and solar [32]. At present, such intermittency does not matter much, since nearly all electricity is produced from non-intermittent sources. In 2018 the intermittent sources (solar and wind) only produced 7.0% of global electricity—and a much smaller share of final energy demand [6]. If wind and solar dominate energy supply in future, energy storage on a large scale will be necessary, especially since most energy will be produced as electricity. Methods could include batteries, pumped water storage, compressed air energy storage, and conversion to hydrogen, either for direct use or storage for later use. The problem is that regardless of which storage method is used, substantial energy losses are incurred [34]. The important point is that in a future dominated by intermittent RE, electricity produced from these sources cannot be simply added to electricity from dispatchable sources such as hydroelectricity.
Wind and PV solar energy produce only electricity, but although many services presently using non-electric sources—such as road passenger transport—can be converted to use electricity, not all energy can be used in the form of electricity. Conversion to some other energy form such as hydrogen (H2) will be needed. Again, this conversion process will inevitably involve energy losses, and so will lead to low EROI sources dropping out of the mix and will complicate any RE energy accounting.
4. Selective Inclusion of Items in Present RE Accounts
Use of passive solar energy, and even some active RE sources, is a grey area in official energy statistics. For RE, it is also not always clear where the boundary lies between active and passive energy, or between passive energy and energy conservation.
Some items which should be included for consistency with present energy accounting methods are given below. It is often not clear whether, or to what extent, these items are included in official energy statistics, such as those of the IEA. For example, the IEA [2] state that geothermal or biomass heat only includes heat that is produced for sale. Even on-farm use of biogas by commercial farms is excluded. Yet the heat value of non-commercial fuel wood is included in the IEA global primary energy total.
- Geothermal heat. Naturally occurring geothermal pools have been used by humans since paleolithic times and are found on all continents. The Romans used geothermal energy for space heating two millennia ago, and a geothermal district heating system has been operating in one French town since the 15th century [35,36]. The geothermal input energy needed to maintain the temperature of all these pools utilised today should be included in the geothermal energy (heat) statistics, even if the hot water has not been fed in by a pipe or otherwise engineered As with use of fire in agriculture (see below), one objection might be that this natural heat energy source is ‘used’ inefficiently, but satellite pictures of brightly-lit cities at local midnight time also indicate high energy waste—yet the electricity so consumed is still counted in official statistics.
- Greenhouses. Greenhouses throughout the world occupy large areas—in the mid-1980s in the EU alone, greenhouses already covered 600 km2 [37], and today in the Netherlands, cover 0.25% of the entire country [38]. In temperate climates, fossil fuels are often used as auxiliary fuels to heat them (and, of course, to manufacture greenhouse materials), but in some cases passive solar energy alone is used for their heating. Hassanien et al. [39] have also discussed how passive solar energy can be used to heat greenhouses by redesigning them as solar collectors and employing special materials. During the transition to an accounting system based on RE, passive solar energy use could be calculated by comparing the temperature difference in solar-heated greenhouses with that in adjacent open fields—and subtracting any input FF energy to obtain the net energy.
- Cooling by evapotranspiration from trees. Trees can transpire large quantities of water each day from their leaves, and the latent heat needed for evaporation can be a useful source for urban cooling, counteracting to some extent the Urban Heat Island (UHI) effect. In fact, reduced evapotranspiration from paved and roofed urban surfaces (along with heat release and the ‘canyon effect’) is a major contributor to the UHI [40]. In the large sub-tropical city of Shenzhen, China, Zhang et al. [41] (p. 323) found that in urban parks: “As compared to the control open sites, the temperature reduction due to plant communities ranged from 2.14 °C to 5.15 °C, and the relative humidity increase ranged from 6.21% to 8.30%”. Urban parks can accordingly to some extent substitute for mechanical air conditioning: Xu et al. [42] have in fact calculated the air-conditioning kWh saved by the presence of an urban park in Beijing, China.
- Passive solar heating/cooling of buildings. There is now a very large volume of research on the energy efficiency of buildings [43], including the use of passive solar energy for heating, cooling and lighting [44,45,46,47]. Chan et al. [47] reported that passive solar design can add anywhere between 0% and 15% to design and construction costs. The energy costs of the materials also must be considered, especially if exotic materials like nanofibers are used (see below). Again, it is the net energy which is important. However, special materials now being developed for thermal control of buildings make the distinction between active and passive solar energy problematic. Li et al. [48] (p. 760) have developed a high strength structural timber by removing the lignin and densifying the material. They found that: “The cellulose nanofibres in our engineered material backscatter solar radiation and emit strongly in mid-infrared wavelengths, resulting in continuous subambient cooling during both day and night”. The authors also modelled the energy savings possible with their engineered material as between 20% and 60%, with the higher figure for hot, dry climates. These and other new materials such as a variety of phase change materials [49] can be used for cooling buildings, with reported energy savings as high as 98%. Granqvist et al. [50] (p. 1170) have reviewed the use of electrochromic materials in buildings. These materials are “characterized by properties that can be tuned, persistently and reversibly, through the application of electrical current or voltage”. They can be incorporated as thin films into window glass for “modulating optical transmittance” to reduce building energy consumption. They can be applied to other building surfaces as well as glass. All researchers have concluded that application of passive solar energy techniques could very significantly reduce present energy consumption of buildings in most countries.
- Solar drying of crops, clothes and sea salt. Another widespread use of solar energy is for drying crops and seasoning construction timber. A combination of wind and solar energy is also used in many countries for salt production [51]. According to Wikipedia [52], “The evaporation of seawater is the production method of choice in marine countries with high evaporation and low precipitation rates. Salt evaporation ponds are filled from the ocean and salt crystals can be harvested as the water dries up”. In other cases, mechanical evaporation of brine is used. Ranjan et al. [53] have performed an energy (and exergy) analysis on what they describe as passive solar distillation system for fresh water production. But the glass cover over the saline water makes it similar to flat plate solar water heaters, which are regarded as active solar energy systems. Wind/solar energy is also used by hundreds of millions of households worldwide for outside clothes drying.
It is evident from the preceding discussion that it is often hard to draw a clear line between active and passive solar energy. Further, passive solar energy refers to a spectrum of uses of ambient energy. At one extreme, we have the millennia-old practice of clothes and salt drying, and at the other extreme we have high-technology engineered materials for storing solar energy or reflecting very high proportions of incident radiation. In between these two extremes are long-established practices such as buildings having a large thermal mass to balance out day and night temperatures, Trombe walls, etc. Which of these applications should be included in RE energy accounting?
5. The Special Case of Bioenergy
Bioenergy, still by far the largest RE source in global primary energy use, is different from other RE sources in several important ways. First, like fossil fuels, themselves derived from ancient living biomass, the energy is available in the form of chemical bonds. Biomass, like coal, is a solid fuel, and can be co-fired with coal in power stations, and like fossil fuels, can be stored for later use, although its energy density is much lower than that for FFs. But from an energy accounting viewpoint, two further, related, characteristics stand out. First, bioenergy competes heavily with other uses for biomass, and second, these non-energy uses are not accounted for, unlike the case for FFs.
5.1. Indeterminate Nature of Bioenergy Technical Potential
An important factor that distinguishes biomass from other RE sources is that discussion of biomass technical potential is meaningless. We can perhaps determine a maximum sustainable value for human appropriation of net primary production (HANPP) of all biomass, but this has to be allocated between food and fodder, bioenergy, and materials such as construction timber and paper. Although estimates of annual global bioenergy potential are available in the earlier literature, in more recent papers a large range of values is reported (e.g., [54], who report an annual range of 33−1135 EJ). In future, bioenergy use will increasingly be at the expense of the other two uses [55].
Providing an adequate diet for all humanity is an ethical priority for biomass. Some researchers attempt to allow for this priority by calculating the resources that could be freed up for bioenergy if the world’s people moved to a more vegetarian diet [56]. Further, using construction timber in place of energy intensive alternatives like steel or concrete will save energy and CO2 emissions [55].
It is true that some other RE sources can compromise agricultural production (e.g., drowning of farmland to create hydropower reservoirs), but the reductions on a global scale are small. Area needed for RE sources have been detailed in [57,58], but their figures are in conflict, possibly due to different assumptions on what areas to include. Capellan-Perez et al. [59] have cited typical values found in the literature, and also given their range of values; for bioenergy they reported a value for net power density of only about 0.1 MWe/km2, but 0.5–2.0, 0.5–7.0 and 2.0–10 MWe/km2 for wind, large hydro and solar power plants respectively. Further most of the area for wind turbines can be used for agriculture, and some solar energy can be generated from rooftop PV installations. The global area used for bioenergy is already large [60], and would need to expand many-fold to meet the highest future bioenergy estimates.
5.2. Inclusion of Non-Energy Uses for Fuels
In their accounts for Total Final Consumption (TFC), the IEA include the non-energy uses for fossil fuels (FFs), such as oil used for lubricants, or natural gas used for making fertiliser [2]. In 2016, non-energy use for FFs amounted to 870 million tonnes of oil equivalent (Mtoe) compared with global TFC of 9555 Mtoe, or about 9%. No use for non-energy purposes was recorded for any RE source. (Of course, if RE replaced FF, RE energy would be needed to manufacture these non-energy products such as the fertilisers and plastics.) Yet non-energy use for biomass actually accounts for most of its consumption, since biomass is mainly used for food, fodder, timber for construction, or materials such as paper and cotton. Including non-energy use of biomass would increase total TFC for RE several-fold, mainly because of the energy content of biomass-based materials.
A further complication is that food (and fodder) are energy sources themselves and in some accounts (e.g., Haberl [61]) are included as such. Even if food energy is ignored because of its present low direct contribution to global primary energy, its environmental effects are large (and food production accounts for a significant share of global HANPP), and these effects are a significant fraction of those for fossil fuel combustion.
In modern agriculture, land is cleared using machinery, and synthetic fertilisers are added, the production of which uses energy-intensive manufacturing. But in many low-income parts of the world, fire is used to both clear vegetation and improve soil fertility. For consistency, the biomass energy consumed in such deliberately-set fires should be included in bioenergy and thus RE accounts. If such fires were suppressed, ceteris paribus, increases in mechanical energy for agriculture would be needed. It is true that this practice represents a very inefficient use of bioenergy. However, so does most use of bioenergy: most is in the form of fuel wood used in low income countries, combusted at very low energy efficiency (about 8% for traditional stoves, far less for open fires), even excluding the human energy expended in fetching and carrying the wood, which can entail daily trips by householders up to 5–10 km [62].
The use of palm oil for diesels has become increasingly important, but whether or not it should be classed a ‘green’ fuel is disputed [63], despite its present inclusion as a zero-carbon energy source. Hooijer et al. [64] (p. 1505) have calculated that: “Forested tropical peatlands in Southeast Asia store at least 42,000 Million metric tonnes (Mt) of soil carbon”. This vast carbon store is threated by release from a combination of “deforestation, drainage and fire”. Clearing this land for bioenergy plantations, particularly for palm oil, releases the stored energy in both the forest biomass and the peat in the soil. Apart from the obvious fuel use for any agricultural machinery, such stored energy should be counted as an input into palm oil fuel production [65].
Given these diverse uses for biomass, it makes more sense to explore the sustainable limits on all human biomass uses. The concept of “human appropriation of net primary production” (HANPP) is a measure (in units of dry biomass, carbon or energy) of all such human biomass uses. This figure can be compared with global net primary production (NPP) of all Earth’s land-based ecosystems defined as “the gross annual fixation of living plant matter, minus respiration” [55] (p. 22). Different studies produce very different values for HANPP because of different items for inclusion [55]. However, comparisons done on a global, regional, or smaller area basis using the same set of assumptions give important information. For a region like south-central Asia, the HANPP/NPP ratio is already over 80%, but is only about 6% for South America [66].
6. Technical Potential for Other RE Sources
The indeterminate nature of bioenergy technical potential has already been discussed. If RE is ever needed to almost entirely replace FF, it is still important to know whether all RE sources together have the potential to meet current and possible future global energy needs. It may be thought that only if ambitious schemes such as a global electricity grid is adopted will global RE energy statistics be important for planning. However, Capellán-Pérez et al. [67] have shown that land constraints alone would limit the ability of densely populated countries in Northern Europe or Japan from meeting their present energy needs from local RE sources. RE can be exported across oceans in the form of liquid hydrogen. Japan, presently a major importer of fossil fuels, plans to inaugurate a “hydrogen society” [68,69]. The hydrogen (H2) would be imported from countries like Australia and Argentina, both with good potential for solar and wind energy. The H2 could be produced in the exporting countries from surplus intermittent RE by hydrolysis, although H2 conversion and overseas transport as liquefied H2 could result in low net energy [70].
In 2016, the world consumed 576 EJ from all primary energy sources including non-commercial fuel wood energy [2], and estimates for year 2100 reviewed in [71] go up to 1000 EJ or even higher. Published estimates for global RE technical potential display a large range, but mostly well in excess of 1000 EJ, suggesting that technical potential will not limit RE use any time soon. However, these high values are not based on EROI calculations; RE sources and fields with low EROI values should be excluded (see below). Annual estimates for low temperature geothermal energy range up to 300,000 EJ, even though the range for annual geothermal electricity potential is several orders of magnitude lower, at 1.1–22 EJ [71]. But this figure for low temperature heat would not be sustainable in the long term: annually, the heat flow to all Earth’s surface is only about 1300 EJ, and most of this heat flow occurs under the oceans or in inaccessible areas on land [72]. For the US, geothermal energy is concentrated west of the Rockies, so that only a small fraction of the US population could economically use it [73]. Until the actual amount of useable geothermal heat is calculated for each region of Earth, this figure cannot be estimated.
As we have shown in Section 5 for bioenergy, it is not possible to provide even an approximate estimate for technical potential, because of the impossibility of allocating biomass to the three competing uses—food, construction and materials, and energy [55]. When attempting to estimate the technical potential for other RE sources, whether at the national or global level, it is important in principle to construct a cumulative primary energy output vs EROI profile for each one. Clearly, any output with EROI < 1.0 cannot be counted as technical potential. The problem is, of course, that such curves are not available, although the authors have attempted to provide one for global wind energy [71].
Some researchers believe that the cut-off point should be set at a higher minimum level. Hall et al. [74] argued for a minimum EROI = 3.0, but for the US, Fizaine and Court [75] have theorised that an EROI in the primary energy system of at least 11 is needed for economic growth. Not only is the cut-off point for a viable EROI contest, but the values of EROI for each RE source are themselves hotly contested, especially that for PV solar electricity [76,77,78,79,80,81]. The claims for PV cells vary from PV still being an energy sink to PV cells paying back their energy costs in a few days. Some researchers have suggested that actual EROI values for RE are lower than 11, and in some cases even lower than 3.0, especially if storage energy costs are incurred [20,81]. The EROI values discussed here are assumed to be the “standard” EROI [21]. A further problem concerns the dynamic energy analysis of the transition from FF to RE sources [21,59,82]. If RE capacity was to grow rapidly, the input energy for construction could significantly constrain the net energy available to the non-energy sectors of the economy.
One exception to low EROI values for RE sources is large-scale hydro; it is not only a dispatchable energy source, but has an EROI estimated to be as high as 84 [20]. However, with a technical potential estimated as low as 30 EJ [66] (although Zhou et al. [83] gave an ‘exploitable potential’ of 57.6 EJ), it can only ever be a minor share of most countries’ energy supply—unless there are major overall energy reductions, perhaps through degrowth.
There is a further problem: the EROI calculated for each RE source depends on the share of FF at any stage in the transition from FF to RE. At present, FF energy is still about 84 % of total primary commercial energy [6], and, with the exception of hydro, fossil fuels are usually thought to have much higher EROIs than RE sources. However, this advantage is questioned, especially when the losses in converting thermal energy to electricity are factored in [84]. The transition from an FF to a RE energy system will evidently lead to a progressive reduction in overall energy system EROI. In addition, the EROIs calculated for RE sources will also fall, because of higher input energy costs for RE production as FF inputs are replaced by RE inputs. [85]. This effect on EROI will be greater for higher ratios of EROI for FF compared with those for RE and lower absolute values of EROI for RE.
In summary, there is great uncertainty in the technical potential of all RE sources, particularly when the need for ecosystem maintenance energy is factored into the input energy costs for RE production [85]. It is thus an open question as to whether RE at the global level can even satisfy present global energy needs. Also, as is the case for biomass, many countries and regions will have energy demands exceeding local capacity, so that an international trade in energy will be needed, including shipments of H2 or some other energy carrier derived from surplus intermittent RE electricity. However, the EROI for this imported H2 could be low.
7. Implications for Renewable Energy Accounting
The global energy system is undergoing a historic shift back to RE, after a mere century or so of FF dominance. During the transition to RE as the major energy source, the present energy accounting system, based on most energy being thermal in origin, could continue. Passive solar energy could then be included by calculating the fossil fuel energy saved, as discussed in Section 4 for greenhouses and building passive solar energy use. Eventually, however, thermal energy could become a minor source of energy consumption in nearly all countries. Energy accounting for primary RE electricity should therefore no longer be based on conversion to thermal power station equivalents, as in the BP system [6]. Nor does it seem useful to continue assessing passive solar in terms of FF energy avoided. How should we get a handle on energy use in a RE future?
ExxonMobil [86], in their future energy projections, give a value in EJ for the energy savings from energy efficiency. Lovins [87] has long argued that energy efficiency can give us what he terms ‘negawatts’, although there are doubts about the potential for energy efficiency to save energy, partly because of the rebound effect [88]. By analogy with energy savings from efficiency improvements, savings from passive solar energy and energy conservation could also be treated in this manner. Such savings are vital for the rapid FF reductions needed if the world is to effectively implement climate change mitigation, and need to be part of energy planning. But, just as today, they should not form part of the national or global energy statistics in an energy future based on RE. This virtual energy does not need energy any conversion devices, nor can this virtual energy be imported or exported. The energy savings are always local. Their inclusion or non-inclusion matters, if only because very different answers for energy intensity (measured as GJ per $ GDP) and its trend over time would result.
As discussed in Section 4 and [11], energy accounts need to be as consistent as is possible, although perfect consistency may be impossible. Estimates for domestic consumption of bioenergy (e.g., biogas), all geothermal heat and domestic PV electricity need to be included, even if exact statistics are not available, just as is the case with fuel wood energy. Future RE will consist of four types:
- Intermittent primary electricity from wind, solar, and perhaps wave energy;
- Direct primary dispatchable electricity from hydropower;
- Thermal dispatchable electricity from geothermal, solar, and bioenergy sources;
- Direct thermal energy from bioenergy and low-temperature geothermal energy.
Harjanne and Korhonen [89] have recently called for abandoning the term renewable energy, partly because RE does not mean renewable and because the various RE sources are very different. Earlier, Prieto and Hall [90] had stressed that solar PV systems were not fully renewable. We have used the term in this paper, while recognizing the problems these authors have pointed out, particularly the differences in the four RE types given above. These differences suggest that no one figure for all energy use, such as the term ‘primary energy’, will be satisfactory in future. Combined heat and power (CHP) systems are likely to be far more common in future, as zero pollution stationary fuel cells are used to generate heat and power from H2. A country like Japan can generate small amounts of electricity from hydro, geothermal and solar energy, but future energy imports could be entirely in the form of liquid H2. It makes sense to measure this energy directly in terms of H2 used. Even if Japan’s hydro solar and geothermal electricity are converted into H2, low-grade geothermal heat will not easily be fitted into a H2-based energy accounting system.
Given that most energy in future may be produced as primary electricity in future, using TWh of electricity for energy accounting would be an option. Most likely, much of this would then be sent to hydrolysis plants for conversion to H2, which is in turn used (mainly) for fuel. Electrolysis plants could be regarded as just another use for electricity, along with its use in buildings or factories. After all, similar energy conversion losses occur with electric vehicle batteries, where electrical energy is stored as chemical energy for later conversion back into electric energy. Furthermore, electricity use in buildings is often converted into mechanical energy in the numerous electric motors found in modern buildings. The best option might be net energy sent out from generating plants (wind and solar PV farms etc), supplemented by a separate account for heat energy.
8. Discussion and Conclusions
The global energy system is still essentially a fossil fuel one, and present energy accounting methods were devised with this dominant energy source in mind. Other thermal electricity energy sources—nuclear, geothermal, biomass—can be readily accommodated in this FF framework. Further, uranium fuel is a stock like FFs and bioenergy and geothermal energy also can be considered as energy stocks in the short to medium term. Even hydropower with a reservoir has some energy storage. Biomass energy is renewable on time scales of one year or even less, while it takes perhaps 30 years to recharge depleted geothermal fields. But these are likely to be minor future energy sources. As argued in Section 2, RE is very likely to replace FFs as the leading energy source, with most energy, not only electricity, first generated as (intermittent) primary electricity. It makes little sense to continue to convert such electricity to thermal equivalents.
As shown in Section 3, present practice in energy accounting is to convert all energy to primary energy equivalents, so that a single number can represent the energy use of any one country or the entire globe. As the discussion on energy quality demonstrates [91], this is not entirely satisfactory: more and more final energy use is now as electricity, making comparisons over time ambiguous. The IEA and BP assess primary renewable energy differently, although their present low use means that the differences in primary energy supply are minor. The intermittency of the future leading energy sources, wind and solar, are likewise only a minor problem at present. Other inconsistences occur in RE accounting, such as inconsistent inclusion or non-inclusion of some items, which implies that per capita energy use in the deep past (and in some low-income countries today) is higher than usually calculated.
For all RE sources, but particularly for biomass, this review has shown that great uncertainty surrounds their technical potential. Can RE supply energy at present, let alone increased, levels of global consumption? Many regions of the world cannot hope to be anywhere near self-sufficient, which means that some countries will need to generate an RE surplus for energy-deficient countries to import. It is thus important to know the RE technical potential of these exporting countries. For many deficient countries such imports are likely to be in the form of liquid H2 transported by tanker.
Energy accounting in an RE world would be simple if the only output was electricity, or alternatively, only H2 produced directly—perhaps from photolysis or microalgae [92]. But neither of these simple options is likely to occur in any country, so that any accounting system will still need to deal with at least some heat energy produced from low-temperature geothermal or bioenergy. In conclusion net electricity sent from generating plants could be the main energy statistic, supplemented by a minor account for heat energy.
Author Contributions
Conceptualization, P.M. and D.H.; methodology, P.M. and D.H.; writing—original draft preparation, P.M.; writing—review and editing, D.H.
Funding
This research received no external funding.
Conflicts of Interest
The authors declare no conflict of interest.
Abbreviations
| BECCS | bioenergy with carbon capture and storage |
| CCS | carbon capture and storage |
| CDR | carbon dioxide removal |
| CHP | combined heat and power |
| CO2 | carbon dioxide |
| EIA | Energy Information Administration |
| EJ | exajoule (1018 joule) |
| EROI | energy return on energy invested |
| FF | fossil fuels |
| GHG | greenhouse gas |
| GJ | gigajoule (109 joule) |
| Gt | gigatonne (109 tonne) |
| GtC | gigatonne carbon |
| GW | gigawatt |
| HANPP | human appropriation of net primary production |
| H2 | hydrogen |
| IEA | International Energy Agency |
| IPCC | Intergovernmental Panel on Climate Change |
| Mt | megatonne (106 tonne) |
| Mtoe | million tonne of oil equivalent |
| MWe | megawatt electric (106 watt) |
| NET | negative emissions technology |
| NG | natural gas |
| NPP | net primary production |
| OECD | Organization for Economic Cooperation and Development |
| OPEC | Organization of the Petroleum Exporting Countries |
| ppm | parts per million |
| PV | photovoltaic |
| RE | renewable energy |
| STEC | solar thermal electricity conversion |
| TFC | Total Final Consumption |
| TWh | terawatt-hour (1012 watt-hr) |
| UHI | Urban Heat Island |
References
- Smil, V. Energy Transitions: History, Requirements, Prospects; Praeger: Santa Barbara, CA, USA, 2010. [Google Scholar]
- International Energy Agency (IEA). Key World Energy Statistics 2018; IEA/OECD: Paris, France, 2018. [Google Scholar]
- Fouquet, R. Long-run demand for energy services: Income and price elasticities over two hundred years. Rev. Environ. Econ. Policy 2014, 8, 186–207. [Google Scholar] [CrossRef]
- Organization of the Petroleum Exporting Countries (OPEC). 2018 OPEC World Oil Outlook. 2018. Available online: http://www.opec.org (accessed on 14 June 2019).
- International Energy Agency (IEA). Global Energy and CO2 Status Report; IEA/OECD: Paris, France, 2019. [Google Scholar]
- BP. BP Statistical Review of World Energy 2019; BP: London, UK, 2019. [Google Scholar]
- McGlade, C.; Ekins, P. Un-burnable oil: An examination of oil resource utilization in a decarbonized energy system. Energy Policy 2014, 64, 102–112. [Google Scholar] [CrossRef]
- Hoegh-Guldberg, O.; Jacob, D.; Taylor, M.; Guillén Bolaños, T.; Bindi, M.; Brown, S.; Camilloni, I.A.; Diedhiou, A.; Djalante, R.; Ebi, K.; et al. The human imperative of stabilizing global climate change at 1.5 °C. Science 2019, 365, 1263. [Google Scholar] [CrossRef] [PubMed]
- Johnstone, P.; Sovacool, B.K.; MacKerron, G.; Stirling, A. Nuclear power: Serious risks. Science 2016, 354, 1112. [Google Scholar] [CrossRef]
- Kramer, D. US nuclear industry fights for survival. Phys. Today 2018, 71, 26. [Google Scholar] [CrossRef]
- Moriarty, P.; Honnery, D. A hydrogen standard for future energy accounting? Int. J. Hydrogen Energy 2010, 35, 12374–12380. [Google Scholar] [CrossRef]
- Amaral, L.P.; Martins, N.; Gouveia, J.B. A review of emergy theory, its application and latest developments. Renew. Sustain. Energy Rev. 2016, 54, 882–888. [Google Scholar] [CrossRef]
- Intergovernmental Panel on Climate Change (IPCC). Climate Change 2014: Synthesis Report; IPCC: Geneva, Switzerland, 2014. [Google Scholar]
- International Energy Agency (IEA). Sustainable Development Scenario. 2019. Available online: https://www.iea.org/weo/weomodel/sds/ (accessed on 16 August 2019).
- MacMartin, D.G.; Caldeira, K.; Keith, D.W. 2014 Solar geoengineering to limit the rate of temperature change. Phil. Trans. R. Soc. A 2014, 372, 20140134. [Google Scholar] [CrossRef]
- Brandt, A.R.; Masnadi, M.S.; Englander, J.G.; Koomey, J.; Gordon, D. Climate-wise choices in a world of oil abundance. Environ. Res. Lett. 2018, 13, 044027. [Google Scholar] [CrossRef]
- Steffen, W.; Rockström, J.; Richardson, K.; Lenton, T.M.; Folke, C.; Liverman, D.; Summerhayes, C.P.; Barnosky, A.D.; Cornell, S.E.; Crucifix, M.; et al. Trajectories of the Earth system in the Anthropocene. Proc. Natl. Acad. Sci. USA 2018, 115, 8252–8259. [Google Scholar] [CrossRef]
- Lindsey, R. Climate Change: Atmospheric Carbon Dioxide. 2019. Available online: https://www.climate.gov/news-features/understanding-climate/climate-change-atmospheric-carbon-dioxide (accessed on 23 July 2019).
- Smith, L.J.; Torn, M.S. Ecological limits to terrestrial biological carbon dioxide removal. Clim. Chang. 2013, 118, 89–103. [Google Scholar] [CrossRef] [Green Version]
- King, L.C.; van den Bergh, J.C.J.M. Implications of net energy-return-on-investment for a low-carbon energy transition. Nat. Energy 2018, 3, 334–340. [Google Scholar] [CrossRef] [Green Version]
- Capellán-Pérez, I.; de Castro, C.; González, L.J.M. Dynamic Energy Return on Energy Investment (EROI) and material requirements in scenarios of global transition to renewable energies. Energy Strategy Rev. 2019, 26, 100399. [Google Scholar] [CrossRef]
- Fuss, S.; Lamb, W.F.; Callaghan, M.W.; Hilaire, J.; Creutzig, F.; Amann, T.; Beringer, T.; De Oliveira Garcia, W.; Hartmann, J.; Khanna, T. Negative emissions—Part 2: Costs, potentials and side effects. Environ. Res. Lett. 2018, 13, 063002. [Google Scholar] [CrossRef]
- Anderson, K. Duality in climate science. Nat. Geosci. 2015, 8, 898–900. [Google Scholar] [CrossRef]
- Anderson, K.; Peters, G. The trouble with negative emissions. Science 2016, 354, 182–183. [Google Scholar] [CrossRef] [PubMed] [Green Version]
- Baker, H.S.; Millar, R.J.; Karoly, D.J.; Beyerle, U.; Guillod, B.P.; Mitchell, D. Higher CO2 concentrations increase extreme event risk in a 1.5 °C world. Nat. Clim. Chang. 2018, 604, 604–608. [Google Scholar] [CrossRef]
- Boysen, L.R.; Lucht, W.; Gerten, D.; Heck, V.; Lenton, T.M.; Schellnhuber, H.J. The limits to global-warming mitigation by terrestrial carbon removal. Earth’s Future 2017, 5, 463–474. [Google Scholar] [CrossRef]
- Irvine, P.J.; Kravitz, B.; Lawrence, M.G.; Muri, H. An overview of the Earth system science of solar geoengineering. WIREs Clim. Chang. 2016, 7, 815–833. [Google Scholar] [CrossRef] [Green Version]
- Prichard, C.; Yang, A.; Holmes, P.; Wilkinson, M. Thermodynamics, economics and systems thinking: What role for air capture of CO2? Process Saf. Environ. Prot. 2015, 94, 188–195. [Google Scholar] [CrossRef]
- International Recommendations for Energy Statistics (IRES). Statistical Papers, Series M No.93, UN, NY, 2017, (ISBP:978-92-1-161584-5). Available online: https://unstats.un.org/unsd/energystats/methodology/documents/IRES-web.pdf (accessed on 18 October 2019).
- Raugei, M. Net energy analysis must not compare apples and oranges. Nat. Energy 2019, 4, 86–88. [Google Scholar] [CrossRef]
- Odum, H.T. Emergy evaluation of an OTEC electrical power system. Energy 2000, 25, 389–393. [Google Scholar] [CrossRef]
- Moriarty, P.; Honnery, D. Can renewable energy power the future? Energy Policy 2016, 93, 3–7. [Google Scholar] [CrossRef]
- Intergovernmental Panel on Climate Change (IPCC). Climate Change 2014: Mitigation of Climate Change; IPCC: Geneva, Switzerland, 2014. [Google Scholar]
- Trainer, T. Some inconvenient theses. Energy Policy 2014, 64, 168–174. [Google Scholar] [CrossRef]
- Wikipedia. Geothermal Energy. 2019. Available online: https://en.wikipedia.org/wiki/Geothermal_energy (accessed on 20 August 2019).
- Erfurt-Cooper, P. The importance of natural geothermal resources in tourism. In Proceedings of the World Geothermal Congress 2010, Bali, Indonesia, 25–29 April 2010. [Google Scholar]
- Santamouris, M.; Balaras, C.A.; Dascalaki, E.; Vallindra, M. Passive solar agricultural greenhouses: A worldwide classification and evaluation of technologies and systems used for heating purposes. Sol. Energy 1994, 53, 411–426. [Google Scholar] [CrossRef]
- Wikipedia. Greenhouse. 2019. Available online: https://en.wikipedia.org/wiki/Greenhouse (accessed on 20 August 2019).
- Hassanien, R.; Hassanien, E.; Li, M.; Lin, W.D. Advanced applications of solar energy in agricultural greenhouses. Renew. Sustain. Energy Rev. 2016, 54, 989–1001. [Google Scholar] [CrossRef]
- Levermore, G.; Parkinson, J.; Lee, K.; Laycock, P.; Lindley, S. The increasing trend of the urban heat island intensity. Urban Clim. 2018, 24, 360–368. [Google Scholar] [CrossRef]
- Zhang, Z.; Lv, Y.; Pan, H. Cooling and humidifying effect of plant communities in subtropical urban parks. Urban For. Urban Green. 2013, 12, 323–329. [Google Scholar] [CrossRef]
- Xu, X.; Sun, S.; Liu, W.; García, E.H.; He, L.; Cai, Q.; Xu, S.; Wang, J.; Zhu, J. The cooling and energy saving effect of landscape design parameters of urban park in summer: A case of Beijing, China. Energy Build. 2017, 149, 91–100. [Google Scholar] [CrossRef]
- Ürge-Vorsatz, D.; Cabeza, L.F.; Serrano, S.; Barreneche, C.; Petrichenko, K. Heating and cooling energy trends and drivers in buildings. Renew. Sustain. Energy Rev. 2015, 41, 85–98. [Google Scholar] [CrossRef] [Green Version]
- Albayyaa, H.; Hagare, D.; Saha, S. Energy conservation in residential buildings by incorporating Passive Solar and Energy Efficiency Design Strategies and higher thermal mass. Energy Build. 2019, 182, 205–213. [Google Scholar] [CrossRef]
- Le Page, M. Global cooling starts at home. New Sci. 2018, 17, 22–23. [Google Scholar] [CrossRef]
- Omrany, H.; Ghaffarianhoseini, A.; Ghaffarianhoseini, A.; Raahemifar, K.; Tookey, J. Application of passive wall systems for improving the energy efficiency in buildings: A comprehensive review. Renew. Sustain. Energy Rev. 2016, 62, 1252–1269. [Google Scholar] [CrossRef]
- Chan, H.-Y.; Riffat, S.B.; Zhu, J. Review of passive solar heating and cooling technologies. Renew. Sustain. Energy Rev. 2010, 14, 781–789. [Google Scholar] [CrossRef]
- Li, T.; Zhai, Y.; He, S.; Gan, W.; Wei, Z.; Heidarinejad, M.; Dalgo, D.; Mi, R.; Zhao, X.; Song, J.; et al. A radiative cooling structural material. Science 2019, 364, 760–763. [Google Scholar] [CrossRef] [Green Version]
- McKenna, P. Melt buildings to save fuel. New Sci. 2012, 7, 17–18. [Google Scholar] [CrossRef]
- Granqvist, C.G.; Arvizu, M.A.; Pehlivan, I.B.; Qu, H.-Y.; Wen, R.-T.; Niklasson, G.A. Electrochromic materials and devices for energy efficiency and human comfort in buildings: A critical review. Electrochim. Acta 2018, 259, 1170–1182. [Google Scholar] [CrossRef] [Green Version]
- Rodrigues, C.M.; Bio, A.; Amat, F.; Vieira, N. Artisanal salt production in Aveiro/Portugal—An ecofriendly process. Saline Syst. 2011, 7, 3. Available online: http://www.salinesystems.org/content/7/1/3 (accessed on 10 August 2019). [CrossRef]
- Wikipedia. Salt. 2019. Available online: https://en.wikipedia.org/wiki/Salt (accessed on 11 August 2019).
- Ranjan, K.R.; Kaushik, S.C.; Panwar, N.L. Energy and exergy analysis of passive solar distillation systems. Int. J. Low Carbon Technol. 2016, 11, 211–221. [Google Scholar] [CrossRef]
- Hoogwijk, M.; Faaij, A.; van den Broek, R.; Berndes, G.; Gielenc, D.; Turkenburg, W. Exploration of the ranges of the global potential of biomass for energy. Biomass Bioenergy 2003, 25, 119–133. [Google Scholar] [CrossRef]
- Moriarty, P.; Honnery, D. Review: Assessing the climate mitigation potential of biomass. AIMS Energy 2017, 5, 20–38. [Google Scholar] [CrossRef]
- Powell, T.W.R.; Lenton, T.M. Future carbon dioxide removal via biomass energy constrained by agricultural efficiency and dietary trends. Energy Environ. Sci. 2012, 5, 8116. [Google Scholar] [CrossRef]
- Pimentel, D. (Ed.) Renewable and Solar Energy Technologies: Energy and Environmental Issues. In Biofuels, Solar and Wind as Renewable Energy Systems; Springer: New York, NY, USA, 2008; pp. 1–17. [Google Scholar]
- Evans, A.; Strezov, V.; Evans, T.J. Assessment of sustainability indicators for renewable energy technologies. Renew. Sustain. Energy Rev. 2009, 13, 1082–1088. [Google Scholar] [CrossRef]
- de Castro, C.; Mediavilla, M.; Miguel, L.J.; Frechoso, F. Global solar electric potential: A review of their technical and sustainable limits. Renew. Sustain. Energy Rev. 2013, 28, 824–835. [Google Scholar] [CrossRef]
- Giampietro, M.; Mayumi, K. The Biofuel Delusion: The Fallacy of Large-Scale Agro-Biofuel Production; Earthscan: London, UK, 2009. [Google Scholar]
- Haberl, H.; Fischer-Kowalski, M.; Krausmann, F.; Martinez-Alier, J.; Winiwarter, V. A socio-metabolic transition towards sustainability? Challenges for another great transformation. Sustain. Dev. 2011, 19, 1–14. [Google Scholar] [CrossRef]
- Ramachandra, T.V.; Subramanian, D.K.; Joshi, N.V.; Gunaga, S.V.; Harikantra, R.B. End use efficiencies in the domestic sector of Uttara Kannada District. Energy Convers. Manag. 2000, 41, 833–845. [Google Scholar] [CrossRef]
- Rochmyaningsih, D. Making peace with oil palm. Science 2019, 365, 112–115. [Google Scholar]
- Hooijer, A.; Page, S.; Canadell, J.G.; Silvius, M.; Kwadijk, J.; Wosten, H.; Jauhiainen, J. Current and future CO2 emissions from drained peatlands in Southeast Asia. Biogeoscience 2010, 7, 1505–1514. [Google Scholar] [CrossRef] [Green Version]
- Normile, D. Parched peatlands fuel Indonesia’s blazes. Science 2019, 366, 18–19. [Google Scholar] [CrossRef]
- Imhoff, M.L.; Bounoua, L.; Ricketts, T.; Loucks, C.; Harriss, R.; Lawrence, W.T. Global patterns in human consumption of net primary production. Nature 2004, 429, 870–873. [Google Scholar] [CrossRef] [Green Version]
- Capellán-Pérez, I.; de Castro, C.; Arto, I. Assessing vulnerabilities and limits in the transition to renewable energies: Land requirements under 100% solar energy scenarios. Renew. Sustain. Energy Rev. 2017, 77, 760–782. [Google Scholar] [CrossRef] [Green Version]
- Iida, S.; Sakata, K. Hydrogen technologies and developments in Japan. Clean Energy 2019, 3, 105–113. [Google Scholar] [CrossRef] [Green Version]
- International Energy Agency (IEA) The Future of Hydrogen. 2019. Available online: https://www.iea.org/hydrogen2019/ (accessed on 3 September 2019).
- Moriarty, P.; Honnery, D. Prospects for hydrogen as a transport fuel. Int. J. Hydrogen Energy 2019, 44, 16029–16037. [Google Scholar] [CrossRef]
- Moriarty, P.; Honnery, D. What is the global potential for renewable energy? Renew. Sustain. Energy Rev. 2012, 16, 244–252. [Google Scholar] [CrossRef]
- Moriarty, P.; Honnery, D. Rise and Fall of the Carbon Civilisation; Springer: London, UK, 2011. [Google Scholar]
- Bloomster, C.H.; Fassbender, L.L.; McDonald, C.L. Geothermal Energy Potential for District and Process Heating in the US—An Economic Analysis; BNWL-2311, UC-66i; Battelle: Richland, WA, USA, 1977. [Google Scholar]
- Hall, C.A.S.; Balogh, S.; Murphy, D.J.R. What is the minimum EROI that a sustainable society must have? Energies 2009, 2, 25–47. [Google Scholar] [CrossRef]
- Fizaine, F.; Court, V. Energy expenditure, economic growth, and the minimum EROI of society. Energy Policy 2016, 95, 172–186. [Google Scholar] [CrossRef]
- Raugei, M.; Sgouridis, S.; Murphy, D.; Fthenakis, V.; Frischknecht, R.; Breyer, C.; Bardi, U.; Barnhart, C.; Buckley, A.; Carbajales-Dale, M.; et al. Energy Return on Energy Invested (ERoEI) for photovoltaic solar systems in region of moderate insolation: A comprehensive response. Energy Policy 2017, 102, 377–384. [Google Scholar] [CrossRef]
- Ferroni, F.; Hopkirk, R.J. Energy Return on Energy Invested (ERoEI) for photovoltaic solar systems in regions of moderate insolation. Energy Policy 2016, 94, 336–344. [Google Scholar] [CrossRef] [Green Version]
- Ferroni, F.; Hopkirk, R.J.; Guekos, A. Further consideration to: Energy Return on Energy Invested (ERoEI) for photovoltaic solar systems in region of moderate insolation. Energy Policy 2017, 107, 498–505. [Google Scholar] [CrossRef]
- Smil, V. A skeptic looks at alternative energy. IEEE Spectrum 2012, 49, 46–52. [Google Scholar] [CrossRef]
- Smil, V. It’ll be harder than we thought to get the carbon out. IEEE Spectrum 2018, 55, 72–75. [Google Scholar] [CrossRef]
- Weißbach, D.; Ruprecht, G.; Huke, A.; Czerski, K.; Gottlieb, S.; Hussein, A. Energy intensities, EROIs (energy returned on invested), and energy payback times of electricity generating power plants. Energy 2013, 52, 210–221. [Google Scholar] [CrossRef]
- Honnery, D.; Moriarty, P. Energy availability problems with rapid deployment of wind-hydrogen systems. Int. J. Hydrogen Energy 2011, 36, 3283–3289. [Google Scholar] [CrossRef]
- Zhou, Y.; Hejazi, M.; Smith, S.; Edmonds, J.; Li, H.; Clarke, L.; Calvin, K.; Thomson, A. A comprehensive view of global potential for hydro-generated electricity. Energy Environ. Sci. 2015, 8, 2622–2633. [Google Scholar] [CrossRef]
- Brockway, P.E.; Owen, A.; Brand-Correa, L.I.; Hardt, L. Estimation of global final-stage energy-return-on-investment for fossil fuels with comparison to renewable energy sources. Nat. Energy 2019, 4, 612–621. [Google Scholar] [CrossRef] [Green Version]
- Moriarty, P.; Honnery, D. Ecosystem maintenance energy and the need for a green EROI. Energy Policy 2019, 131, 229–234. [Google Scholar] [CrossRef]
- ExxonMobil. Outlook for Energy: A View to 2040; ExxonMobil: Irving, TX, USA, 2018. [Google Scholar]
- Lovins, A.B. Negawatts: Twelve transitions, eight improvements and one distraction. Energy Policy 1996, 24, 331–343. [Google Scholar] [CrossRef]
- Moriarty, P.; Honnery, D. Energy efficiency or conservation for mitigating climate change? Energies 2019, 12, 3543. [Google Scholar] [CrossRef]
- Harjanne, A.; Korhonen, J.M. Abandoning the concept of renewable energy. Energy Policy 2019, 127, 330–340. [Google Scholar] [CrossRef]
- Prieto, P.A.; Hall, C.A.S. Spain’s photovoltaic revolution. In The Energy Return on Investment; Springer Briefs in Energy: New York, NY, USA; Berlin/Heidelberg, Germany; Dordrecht, The Netherlands; London, UK, 2013. [Google Scholar]
- Stern, D.I. Energy quality. Ecol. Econ. 2010, 69, 1471–1478. [Google Scholar] [CrossRef]
- Moriarty, P.; Honnery, D. New energy technologies: Microalgae, photolysis and airborne wind turbines. Science 2019, 1, 43. [Google Scholar] [CrossRef]
Figure 1.
Global primary energy use by energy type, 1800–2018: (a) in EJ; (b) Share %. Sources: 1,2,5,6.
Figure 1.
Global primary energy use by energy type, 1800–2018: (a) in EJ; (b) Share %. Sources: 1,2,5,6.


Table 1.
Major differences between methods used by the International Energy Agency (IEA) and BP to calculate primary energy consumption.
Table 1.
Major differences between methods used by the International Energy Agency (IEA) and BP to calculate primary energy consumption.
| IEA Energy Statistics | BP Energy Statistics |
|---|---|
|
|
© 2019 by the authors. Licensee MDPI, Basel, Switzerland. This article is an open access article distributed under the terms and conditions of the Creative Commons Attribution (CC BY) license (http://creativecommons.org/licenses/by/4.0/).
Share and Cite
MDPI and ACS Style
Moriarty, P.; Honnery, D. Energy Accounting for a Renewable Energy Future. Energies 2019, 12, 4280. https://doi.org/10.3390/en12224280
AMA Style
Moriarty P, Honnery D. Energy Accounting for a Renewable Energy Future. Energies. 2019; 12(22):4280. https://doi.org/10.3390/en12224280
Chicago/Turabian StyleMoriarty, Patrick, and Damon Honnery. 2019. "Energy Accounting for a Renewable Energy Future" Energies 12, no. 22: 4280. https://doi.org/10.3390/en12224280
Note that from the first issue of 2016, this journal uses article numbers instead of page numbers. See further details here.