Study on Mechanical Properties of Self-Compacting Concrete and Its Filled in-Line Multi-Cavity Steel Tube Bundle Shear Wall


1
College of Civil and Hydraulic Engineering, Ningxia University, Yinchuan 750021, China
2
Ningxia Research Center of Technology on Water-saving Irrigation and Water Resources Regulation, Yinchuan 750021, China
3
Engineering Research Center for Efficient Utilization of water Resources in Modern Agriculture in Arid Regions, Yinchuan 750021, China
*
Author to whom correspondence should be addressed.
†
These authors contributed equally to this work and should be considered co-first authors.
Energies 2019, 12(18), 3466; https://doi.org/10.3390/en12183466
Submission received: 24 August 2019
/
Revised: 3 September 2019
/
Accepted: 5 September 2019
/
Published: 8 September 2019
Abstract
:In this paper, five groups of C40 fly ash and silica fume self-compacting concrete (SCC) mix proportion tests and in-line multi-cavity steel tube bundle self-compacting concrete shear wall axial compression performance tests and numerical simulation are completed and presented. The influence of fly ash and silica fume additions on SCC mechanical properties and the filled in-line multi-cavity steel tube bundle shear wall mechanical properties are analyzed and studied. With an increase in the fly ash content from 10% to 40%, the compressive strength of self-compacting concrete increases firstly and then decreases. When the fly ash content is 30% and the silica fume content is 4%, the compressive strength of the 28 d age self-compacting concrete is the highest and the compressive strength formula of the wrapped curing SCC is proposed. The failure of steel tube bundle is multi-wave buckling failure. As the SCC is most obviously affected by the collar at the corner point of the steel tube bundle, its compressive strength is 110 MPa, and is 96 MPa higher than the concrete at the middle point of the web. The deformation resistance of SCC is obviously enhanced by the confinement effect.
1. Introduction
China is a large country that produces coal and iron, and has wastes of fly ash and silica fume discharged from coal-fired power plants and ferroalloy plants, respectively. With rapid industrialization, the total amount of fly ash is increasing year by year and the annual output is expected to reach 400 million tons by 2020 [1,2]. Fly ash and silica fume were once considered as industrial by-products that not only lead to environmental pollution, but also cause secondary pollution such as land occupation. However, Golewski [3] pointed out that from the perspective of economic and sustainable developments, the use of fly ash and silica fume as cementing materials instead of cement will bring many benefits. At present, reactive powder concrete has evolved into a comparatively mature phase and has become popular in various areas such as municipal works, buildings, roads and bridges [4,5,6,7,8,9,10]. Nonetheless, there is little research on self-compacting concrete (SCC) of double-doped silica fume-fly ash, and only Yang Zhiwei [11] and Bao Mingxuan [12] have done research on compressive strength, chloride ion penetration resistance and sulfate resistance of SCC of double-doped silica fume-fly ash. With little ongoing research, there is considerable room for the study of SCC of double silica fume and fly ash. SCC is a concrete with high fluidity, uniformity and stability, not needing external vibration during pouring, and can flow and fill space under the action of self-weight [13]. In fact, the employing of fly ash and silica fume not only change the chemical properties of the concrete but also to some extent the mechanical properties, especially the internal friction [14,15,16,17]. The SCC improves the quality and speed of construction compared to ordinary concrete, reduces the noise in the process of pouring concrete, improves the living environment of the surrounding residents and realizes the labor-saving pouring of concrete. At the same time, it also improves and solves the problem of difficult vibration of concrete filled steel tubes during construction [18,19,20,21,22]. The concrete-filled steel tube (CFST) has gradually replaced the traditional reinforced concrete shear wall which has poor seismic performance and is prone to brittle failure due to its advantages of high-quality rapid constructions. At present, Xu et al. [23] have carried out low-cycle reversed load tests on 15 steel reinforced concrete T-shaped shear walls, and not only analyzed the seismic failure mechanism of steel reinforced concrete T-shaped shear walls, but also the influence of shear span ratio, axial compression ratio and other parameters on the seismic performance. Their results show that the seismic performance of steel reinforced concrete T-shaped shear walls is better than that of traditional reinforced short-leg shear walls. Shang et al. [24] designed a full-scale steel short-leg shear wall, and analyzed the bearing capacity, failure process and failure characteristics of the short-leg shear wall. They reveal that the bearing capacity of the short-leg shear wall is greatly improved when the steel is configured, and the steel ratio and the length-width ratio of the appropriate steel short-leg wall has an obvious effect on the bearing capacity of the short-leg shear wall. Fang et al. [25,26] designed and completed the axial compression tests of 18 high strength concrete filled steel tube shear walls, and analyzed the mechanical mechanism, failure mode, denaturation capacity and bearing capacity of such members under axial compression. The test results show that with an increase in concrete volume stirrup ratio between steel tubes, the ultimate compressive strain of concrete will also increase. The stirrup effect of steel tubes on concrete will become more obvious, and the deformation and bearing capacities of members will also boost accordingly. Jiang [27] designed 20 specimens of high-strength concrete-filled steel tube shear walls, and carried out axial compression tests and non-linear finite element analysis to study their axial compression mechanical properties. The results show that the simple superposition method is more appropriate to calculate the bearing capacity of high-strength concrete-filled steel tube shear walls.
The above-mentioned research shows that the steel-concrete composite combination has good bearing capacity and seismic performance, but at present, there is little research on the assembled multi-cavity steel tube self-compacting concrete shear wall and there is a lack of understanding on the mechanical properties of such components. The failure mechanism and mechanical performance of the multi-cavity steel tube shear wall and the reinforced concrete shear wall are obviously different, and if calculated according to the reinforced concrete shear wall in actual structural engineering, the calculated structure will be conservative. Although the working mechanisms of the steel plate-concrete shear wall, concrete-filled steel tube shear wall and multi-cavity steel tube shear wall is similar, there are differences in structural forms and cross-sectional dimensions. Therefore, the mechanical properties of multi-cavity steel tube shear wall cannot be directly calculated with reference to the relevant theories of steel plate-concrete shear wall and steel tube shear wall. For this reason, it is necessary to systematically study the failure mechanism and mechanical performance of multi-cavity steel tube SCC shear wall and put forward relevant calculation theories and design methods. Relying on the renovation project of Hongxinyuan shanty in Hongguang Town, and to provide reference for engineering design, the relevant conclusions are drawn by the method of combining experimental research and finite element analysis.
2. SCC Proportioning Test
2.1. Materials
In accordance with the technical specification for the application of self-compacting concrete, five groups of C40 SCC were prepared with fly ash as the main parameter. Materials used for concrete are as follows:
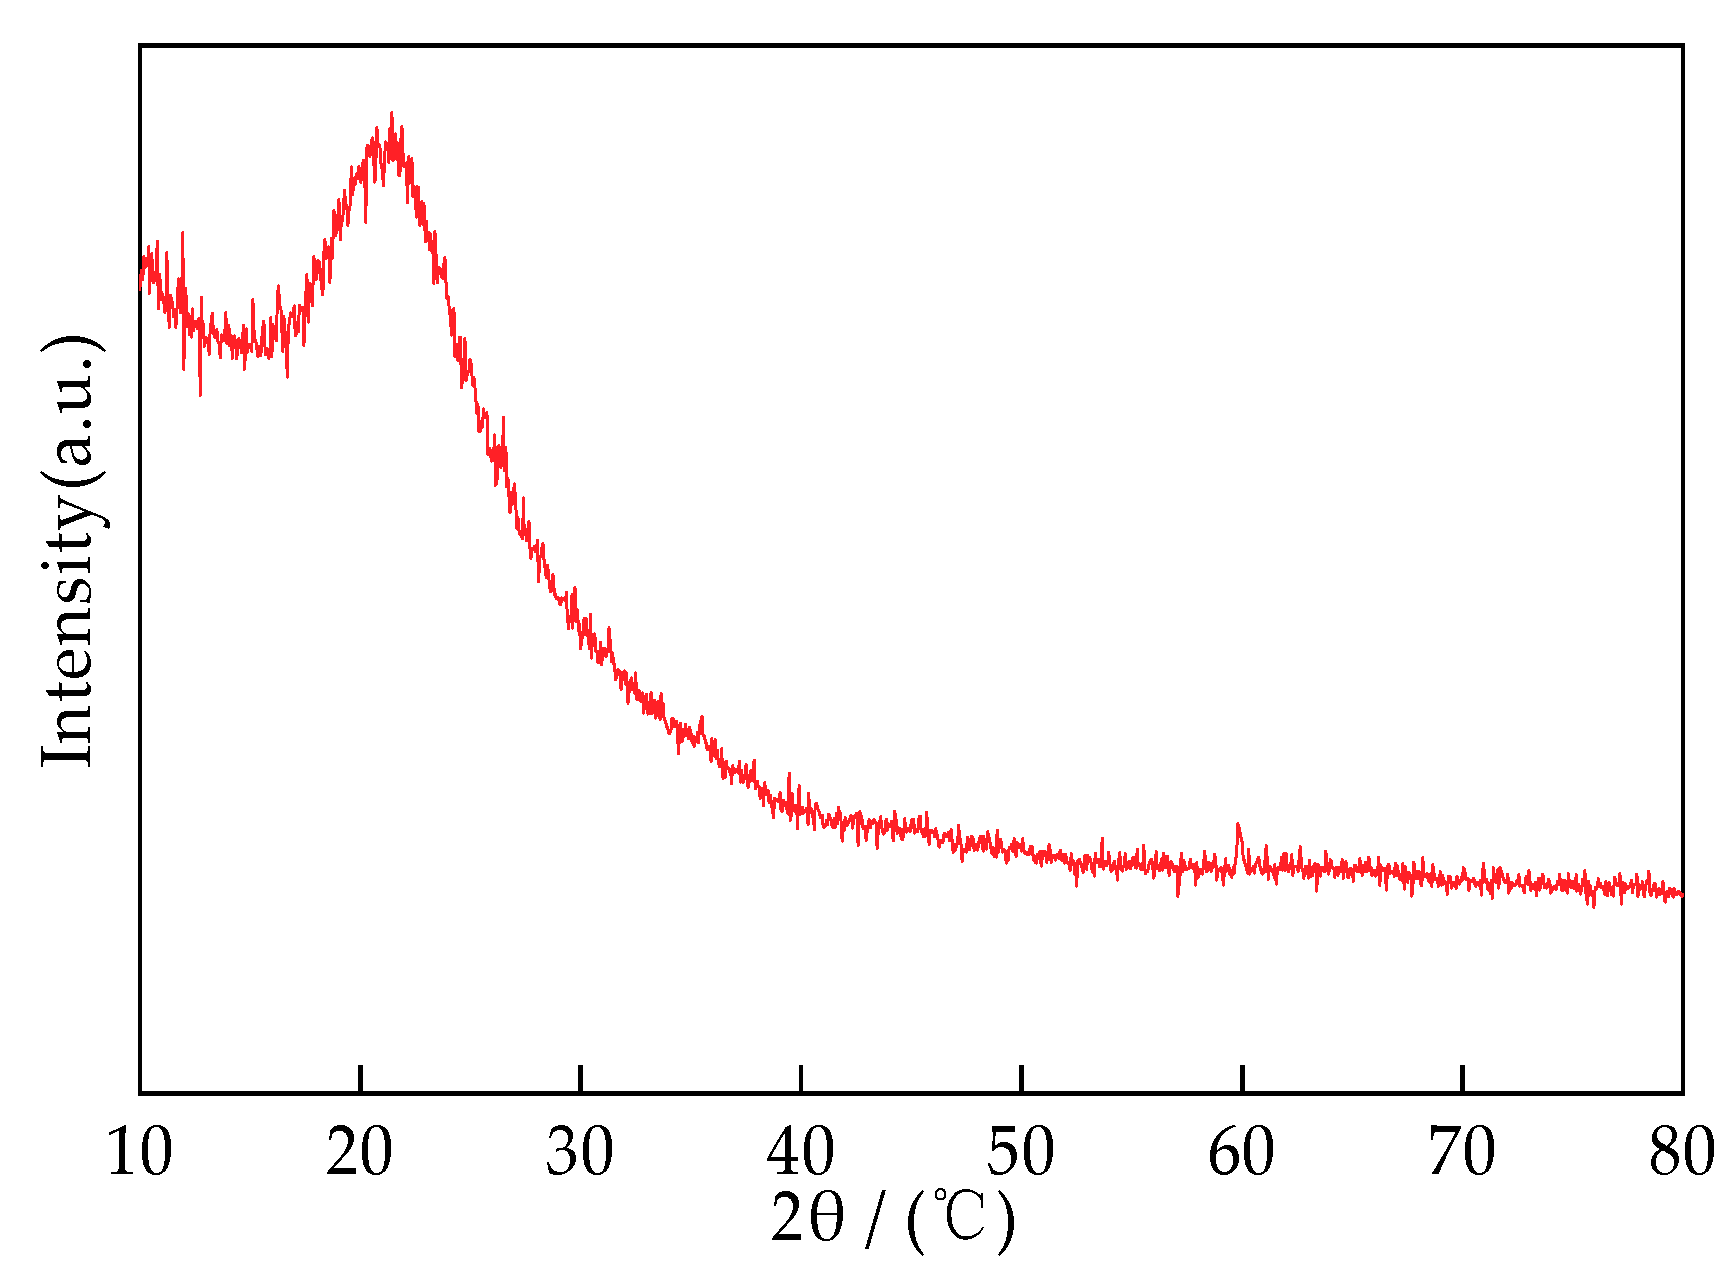
- Silica fume: Local silica fume in Yinchuan was used, and its chemical composition and physical properties are shown in Table 5. An XRD diagram of silica fume is shown in Figure 3.As can be seen in the XRD spectra of silica fume, 20°–30° appears as a wide diffraction characteristic peak, which explains the existence of a large number of amorphous phases. This, with the silica fume itself, shows characteristics of high content of amorphous SiO2.
- Stone: Continuously graded Helan Mountain crushed stone in Yinchuan was adopted.
- Sand: Well graded local medium sand, with fineness module 2.6, apparent density 2678 kg/m3, and bulk density 1680 kg/m3 was adopted.
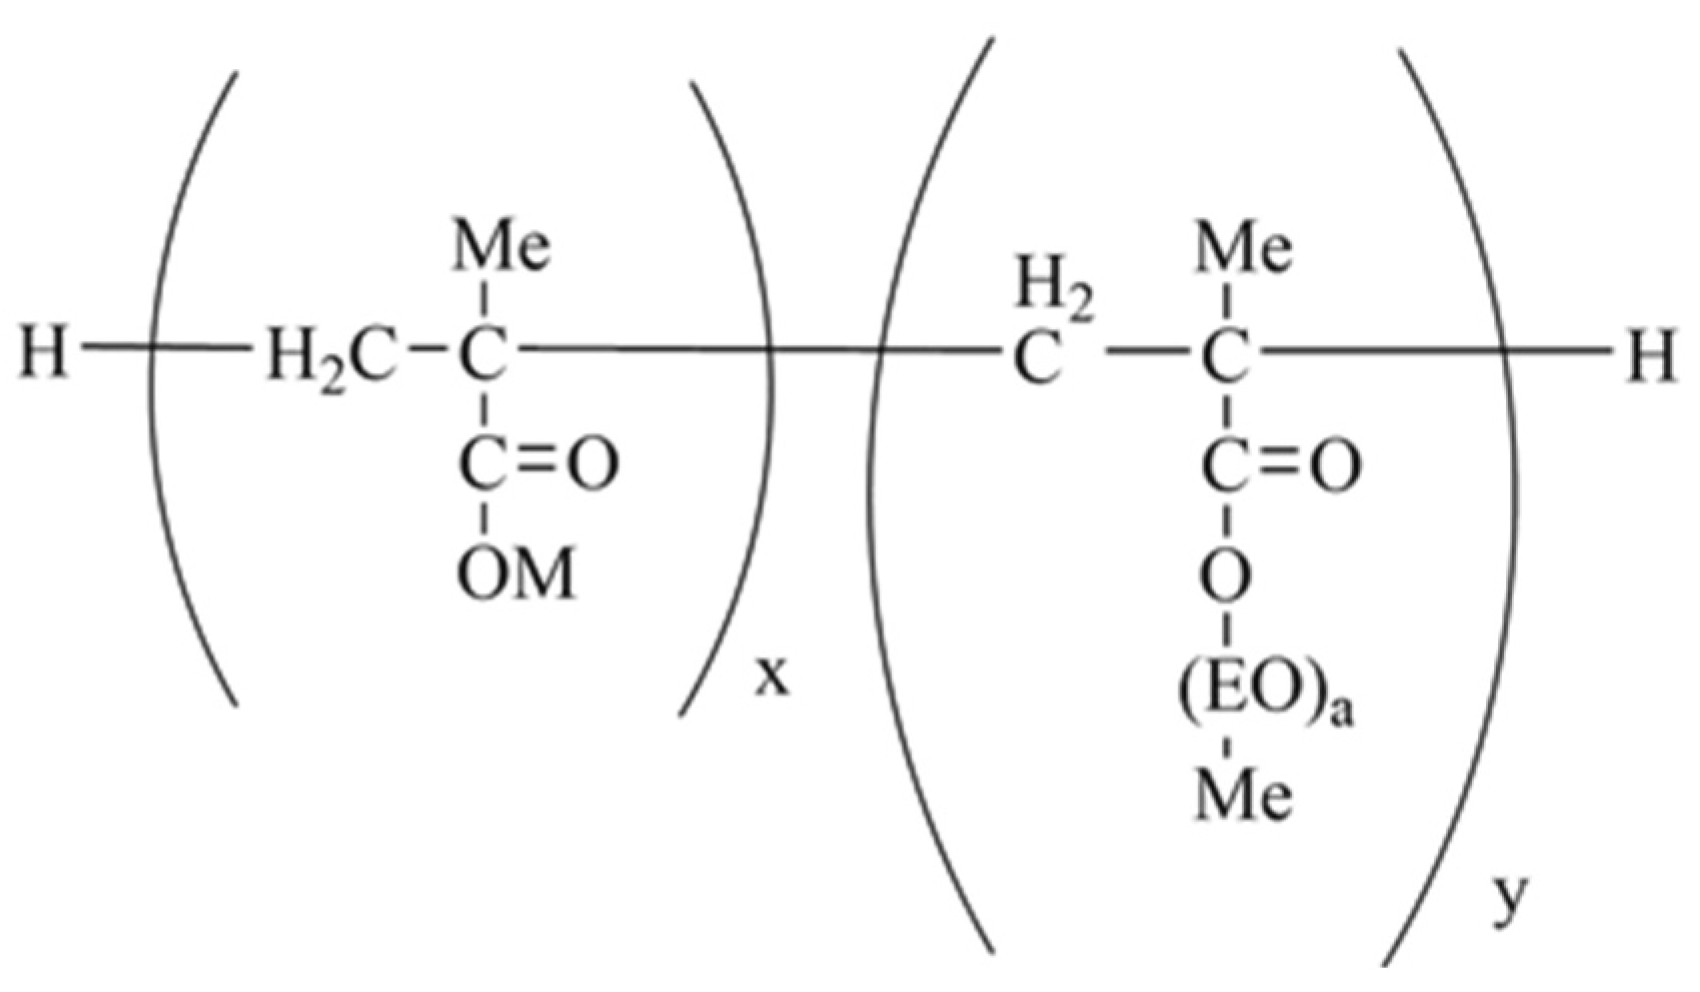
- Water reducer: Polycarboxylic acid high-efficiency retarding water reducer with a water reducing rate of 30% was used and its performance conforms to the provisions of GB8076-2008 Concrete Admixture. The chemical formula is shown in Figure 4.
- Water: Tap water.
2.2. Mix Proportion
2.3. Test Methods
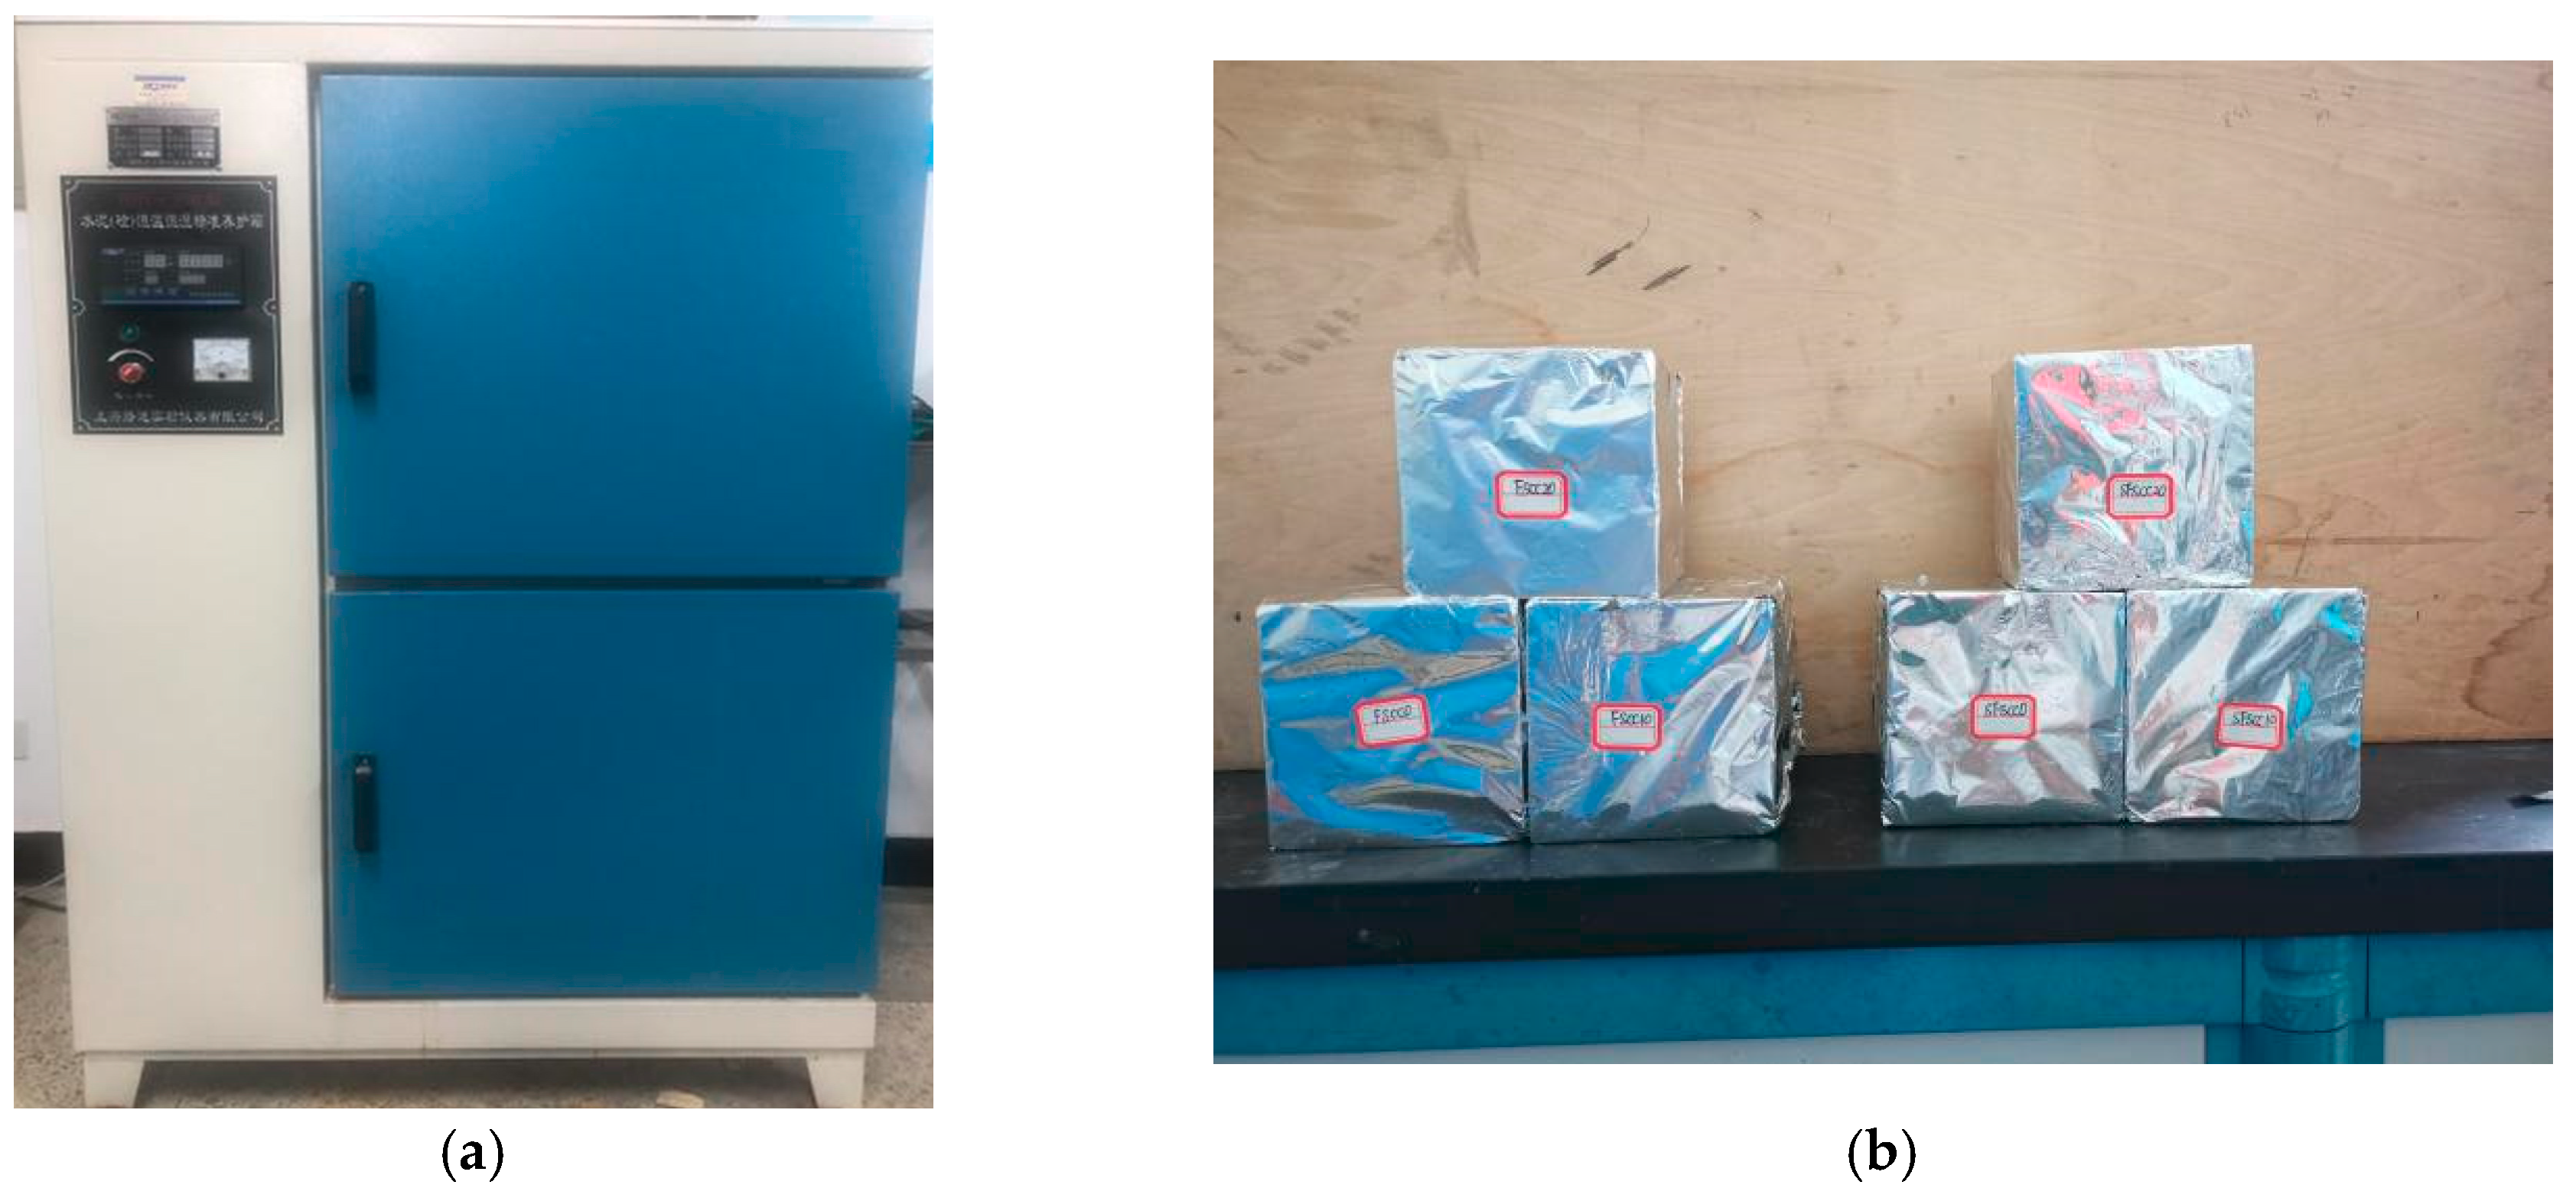
In order to ensure the accuracy of the experimental data, the materials needed to be processed before the test. In the first instance, the sand is dried in the sun to ensure the water content is basically the same, and then, the crushed stones are cleaned. After that, it is mixed with a forced action mixer and two groups of concrete cube test pieces with side lengths of 100 mm were poured at the same time. Standard curing and tinfoil wrapping curing were adopted, respectively. As shown in Figure 6, each group had nine test pieces.
2.4. Test Results
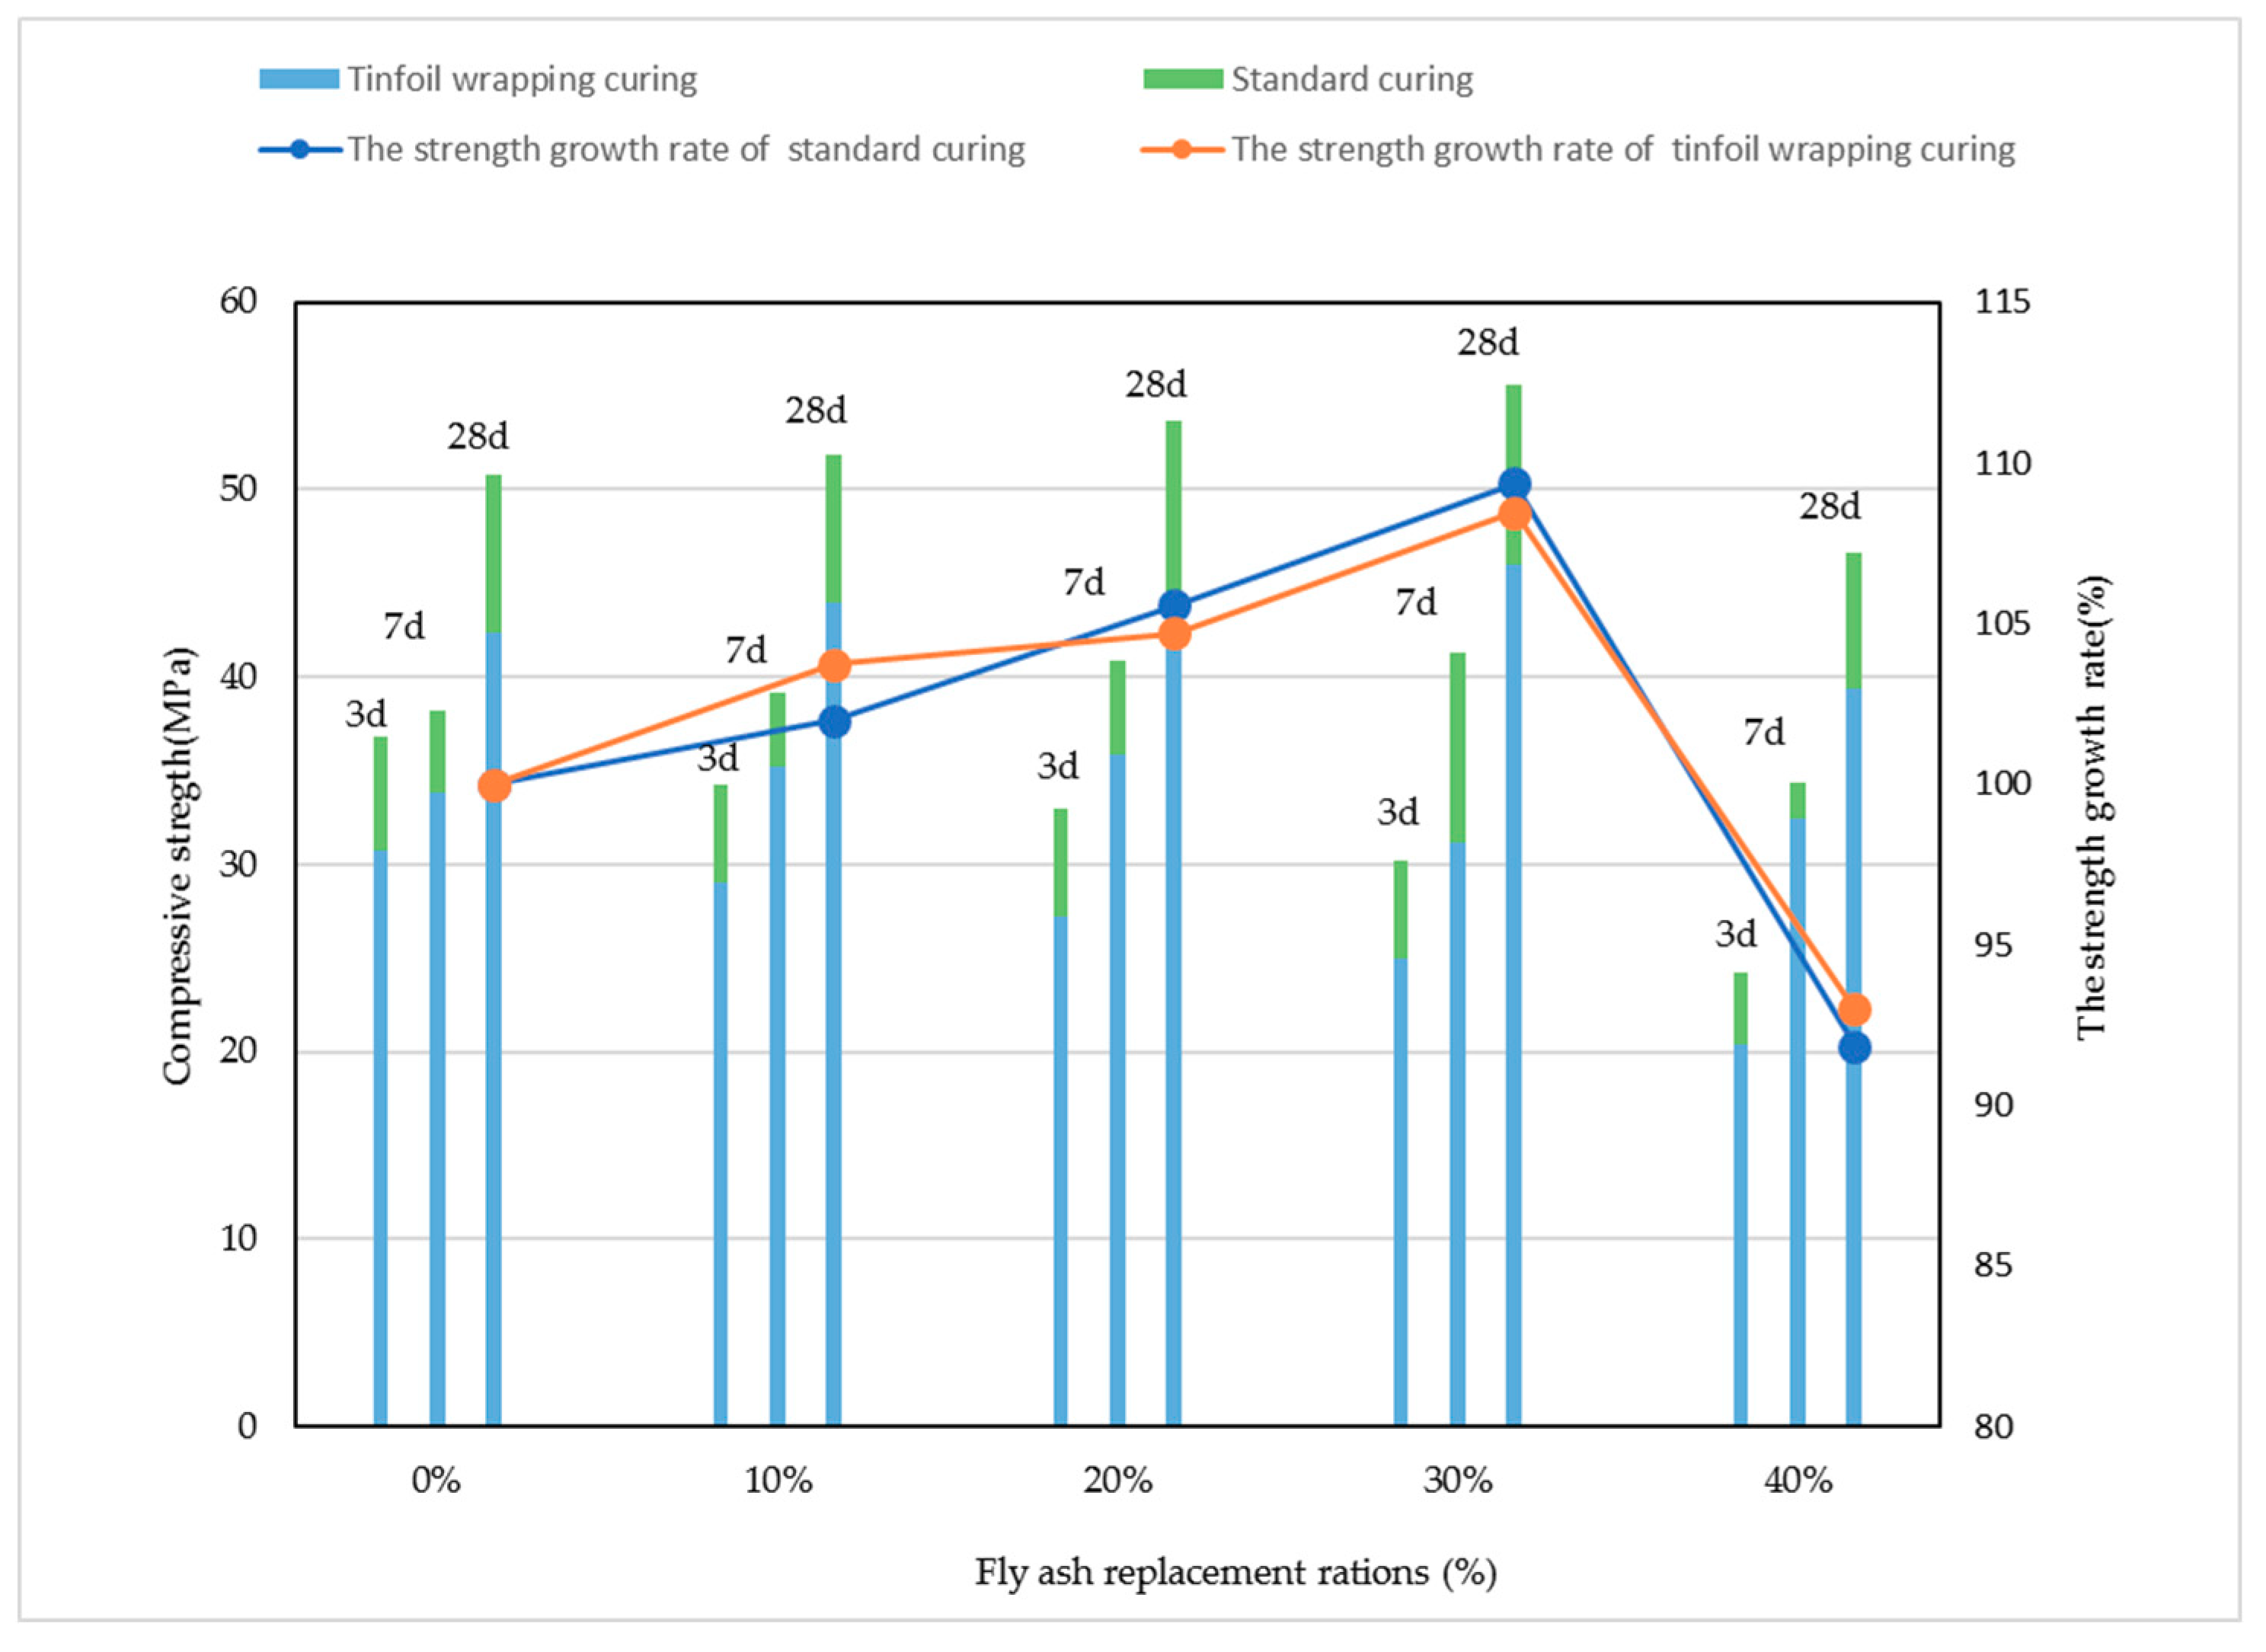
The compressive strengths at 3 d, 7 d and 28 d are shown in Figure 7. Generally, the 28 d strength of SCC increased first, and then decreased with the increasing of fly ash content.
Owning comparatively small fly ash strength and slow pozzolanic reaction rate in the early stage, and its secondary reaction lags behind that of cement and silica fume, resulting in a slower concrete setting. Due to the great pozzolanic activity of amorphous SiO2, the addition of silica fume significantly improved the strength of SCC. On one hand, the pozzolanic reaction makes the cementitious phase of C-S-H grow rapidly, improving the strength of cement-based materials; on the other hand, the silica fume promotes the conversion of CH crystals into C-S-H gels. The obtained structure of cement stone is filled with gels, and the unreacted CH layered crystals grow alternately among the C-S-H gels. The chemical filling significantly enhances the compactness of the cement stone structure, thus improving the mechanical properties of cement-based materials, that is:
The reaction process mentioned above is called the secondary hydration reaction, and the hydrated calcium silicate has a good gelling effect. The hydration reaction of cement and fly ash is carried out alternately.
As can be seen in Figure 7, under standard curing and tinfoil wrapping curing conditions, the 7 d and 28 d strength of SCC mixed with fly ash is not the same as that of ordinary concrete, which decreases with the amount of fly ash. When the content of fly ash is 30%, the strength of SCC is at maximum.
Because the curing method of concrete filled steel tube is similar to that of tinfoil, the compressive strength of tinfoil curing is selected as the strength of concrete in this paper. Moreover, due to the characteristics of the development of SCC, the compressive strength development rule formula fn = f28 lgn/lg28 of ordinary concrete is not applicable to the compressive strength development rule of SCC. The compressive strength development rule formula proposed by European code CEB-FIP is:
where t1 refers to 1 day; S refers to type constant of cement, 0.2 for early strength cement, 0.25 for ordinary cement and 0.38 for slow hard cement; fcu,28 refers to the compressive strength of 28 d concrete.
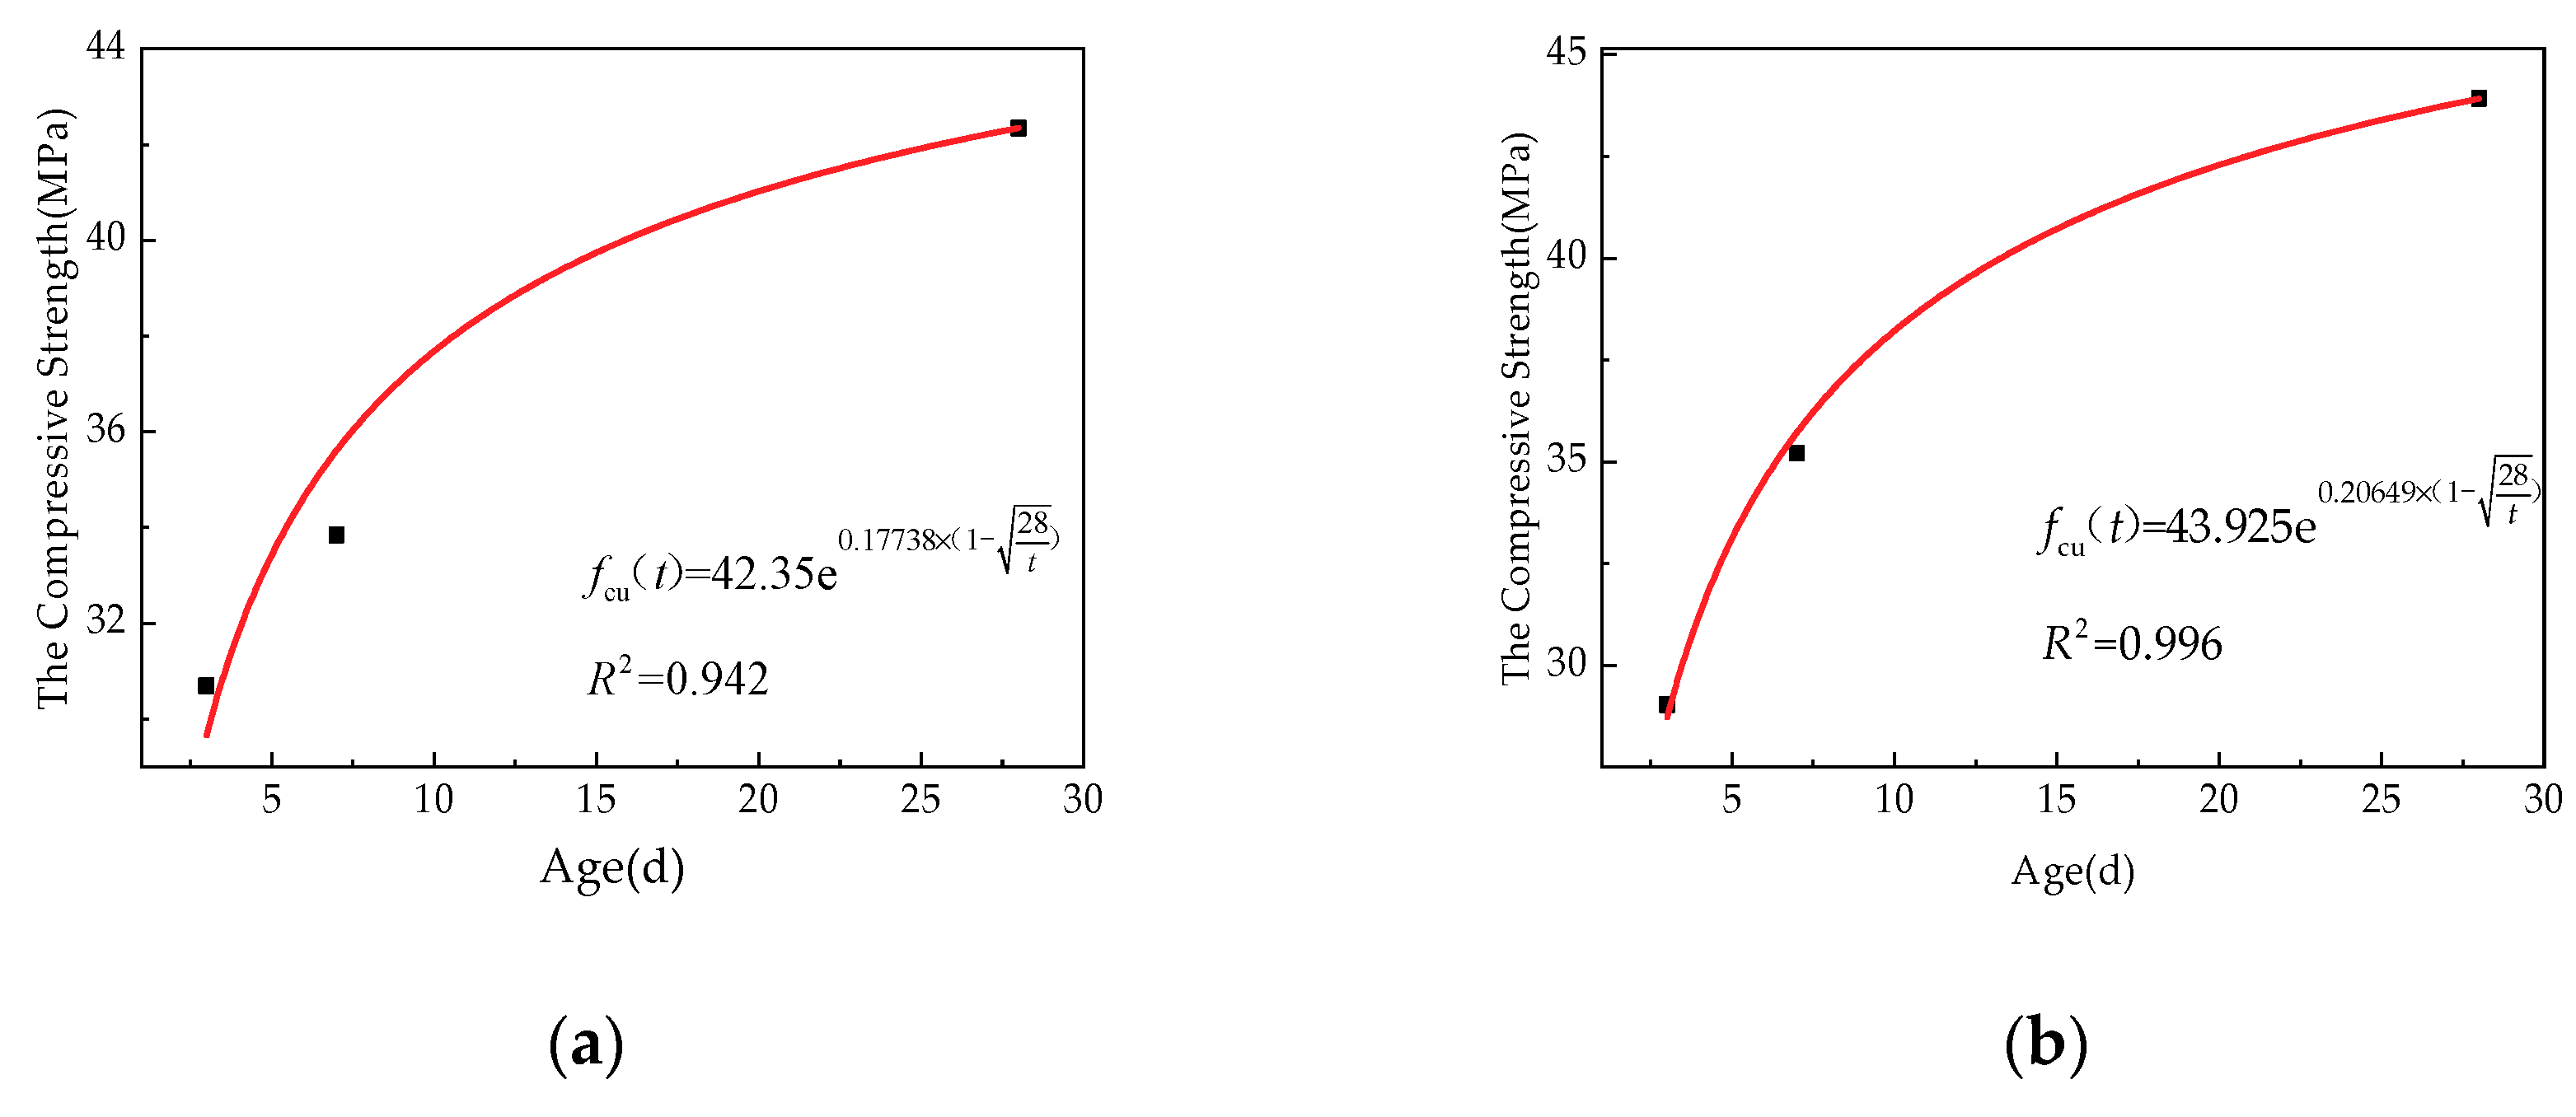
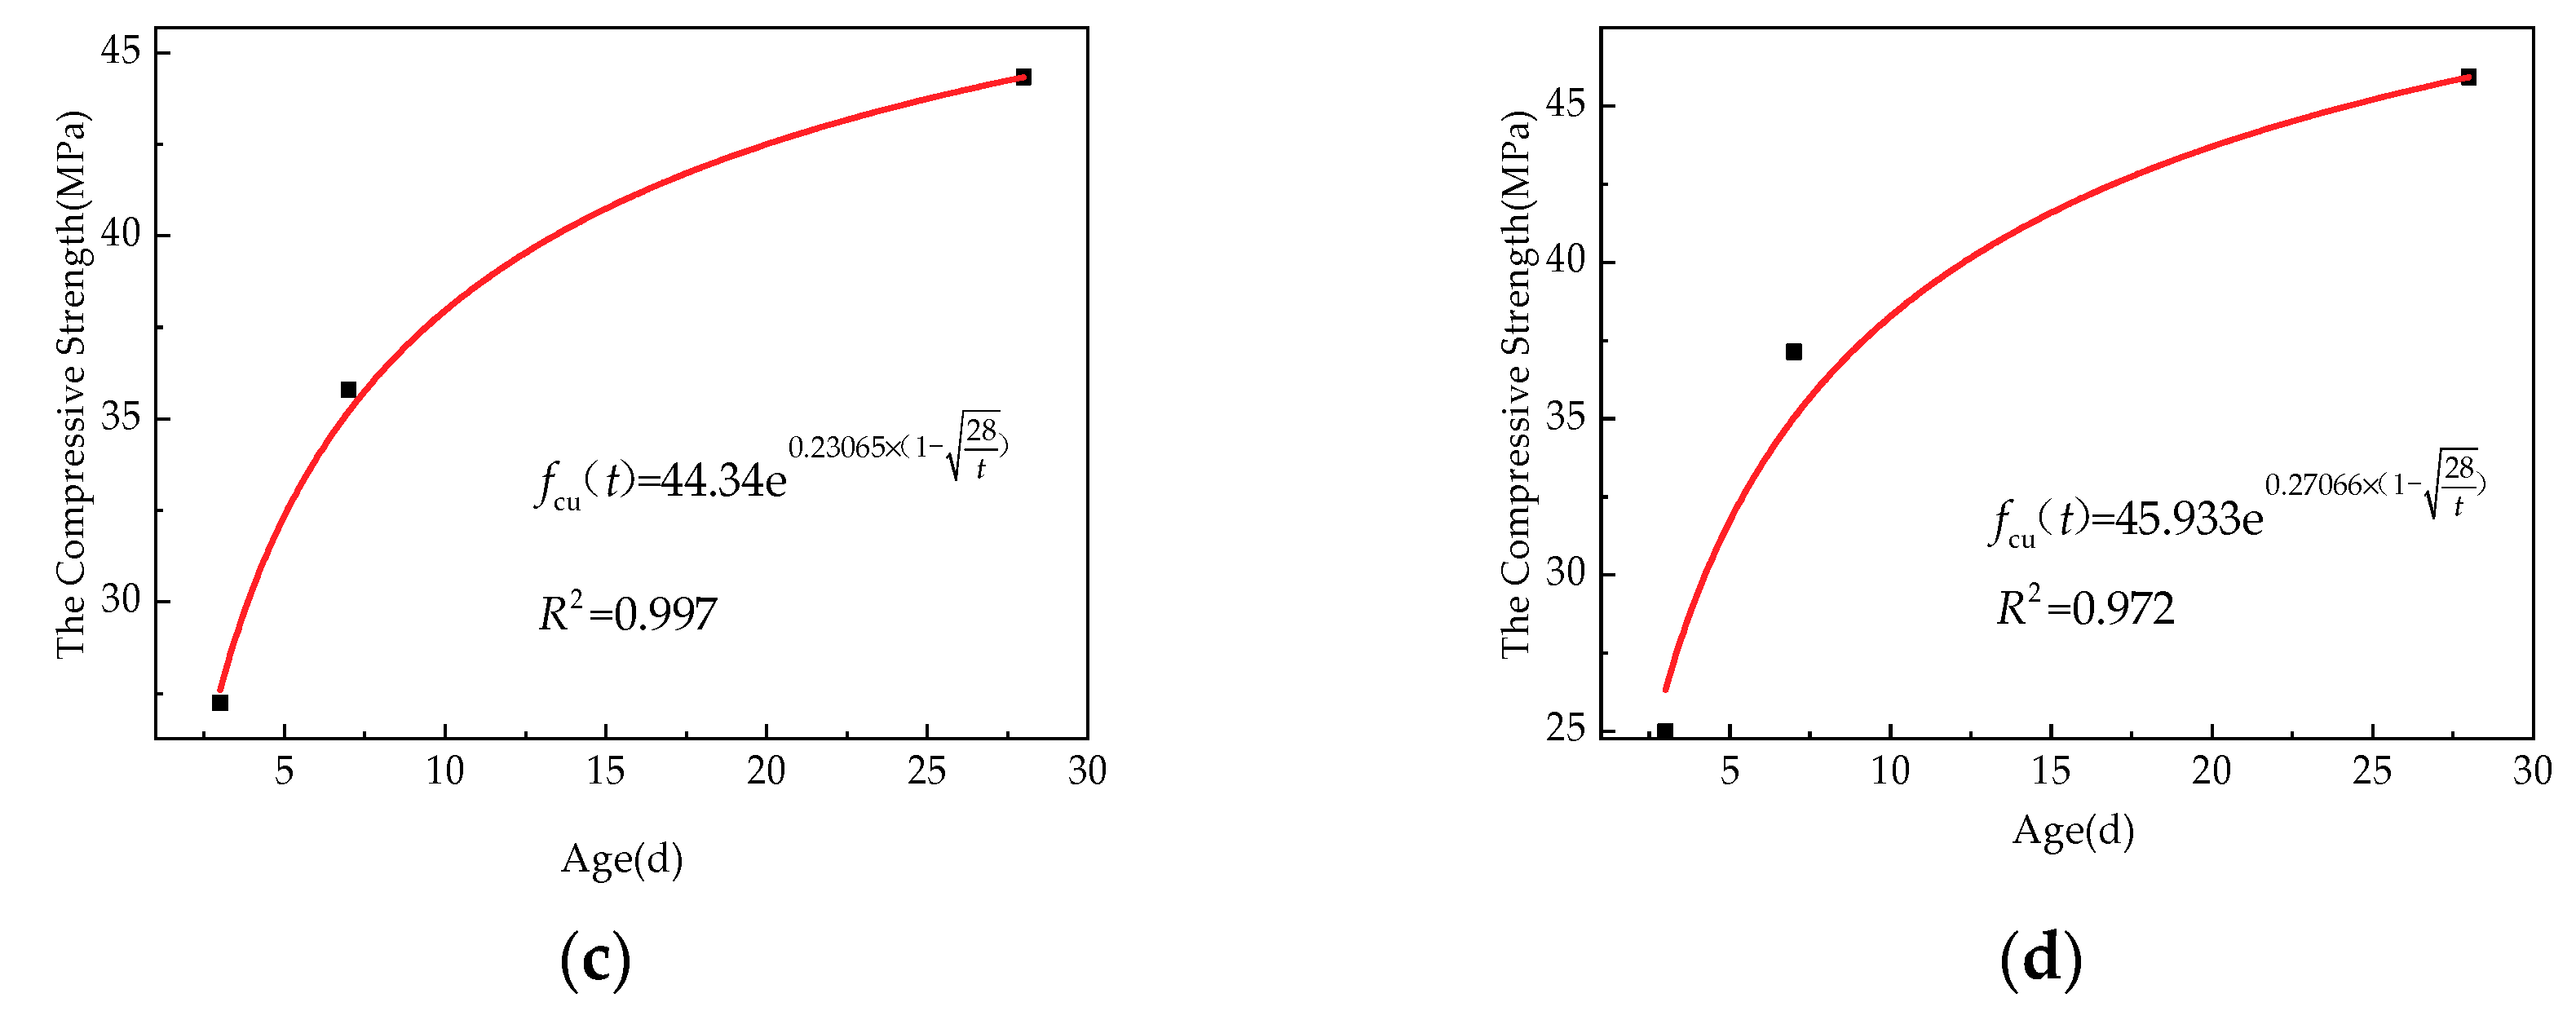
According to the test results, firstly, the compressive strength of SCC is preliminarily fitted according to the improved form (3) of European formula form (2); the results are shown in Figure 8.
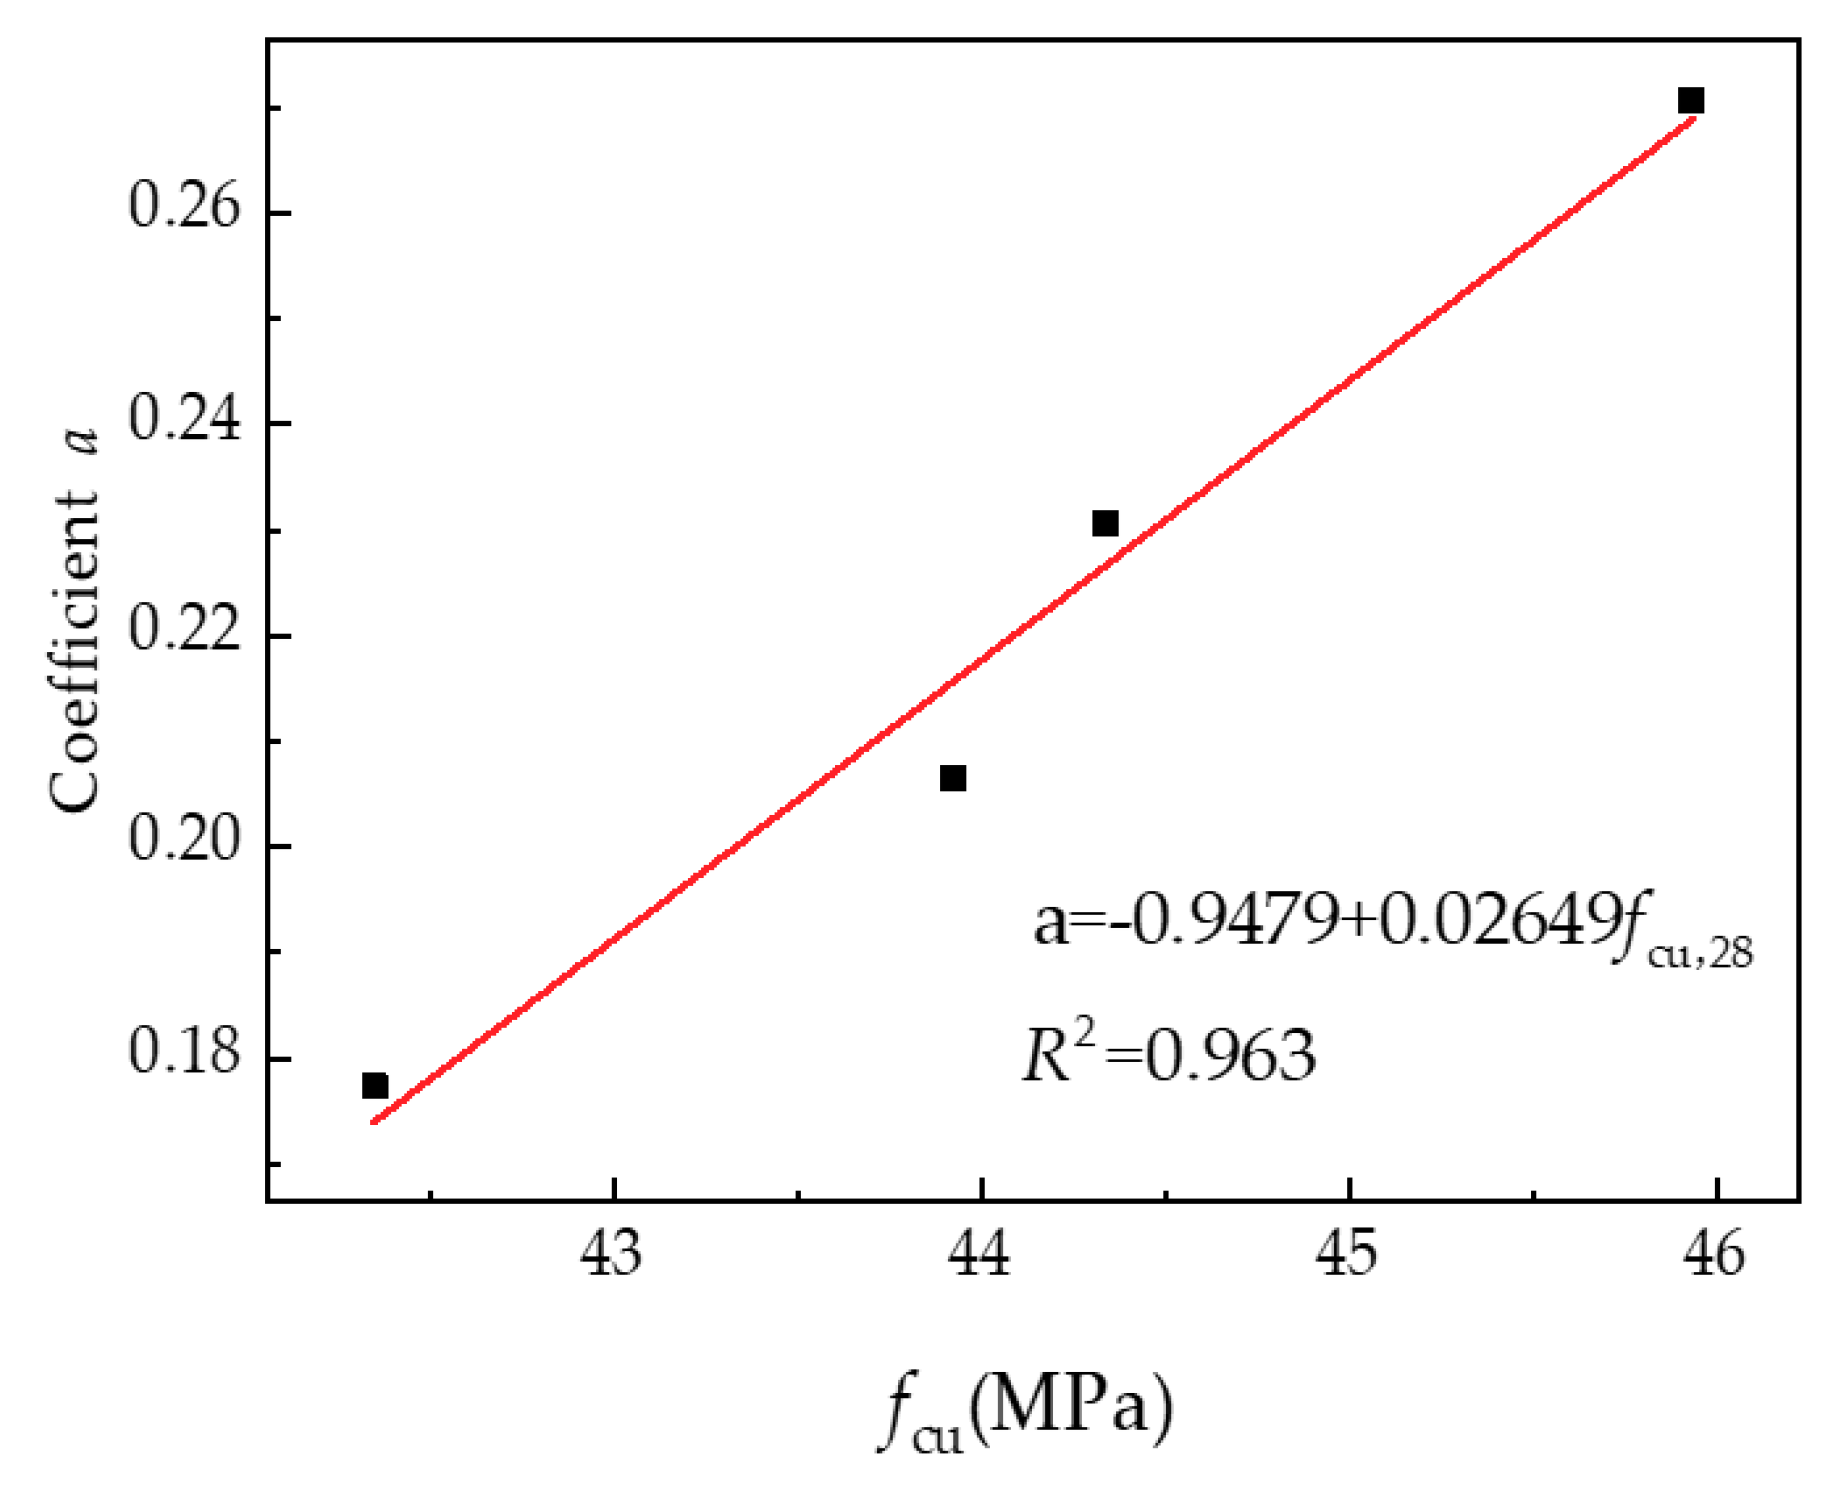
From the regression curve equation in Figure 8, it can be seen that regression coefficient a has a certain relationship with SCC compressive strength. Regression analysis is carried out using the data in Table 7 and the results are shown in Figure 9.
As a result, Formula (4) was obtained from Figure 9:
a = −0.9479 + 0.02649fcu,28
Substituting Formula (5) into (4), the formula for calculating the compressive strength with age of SCC containing silica fume and fly ash was obtained as below:
3. Test of Concrete Filled Steel Tubular
3.1. Material Mechanical Properties
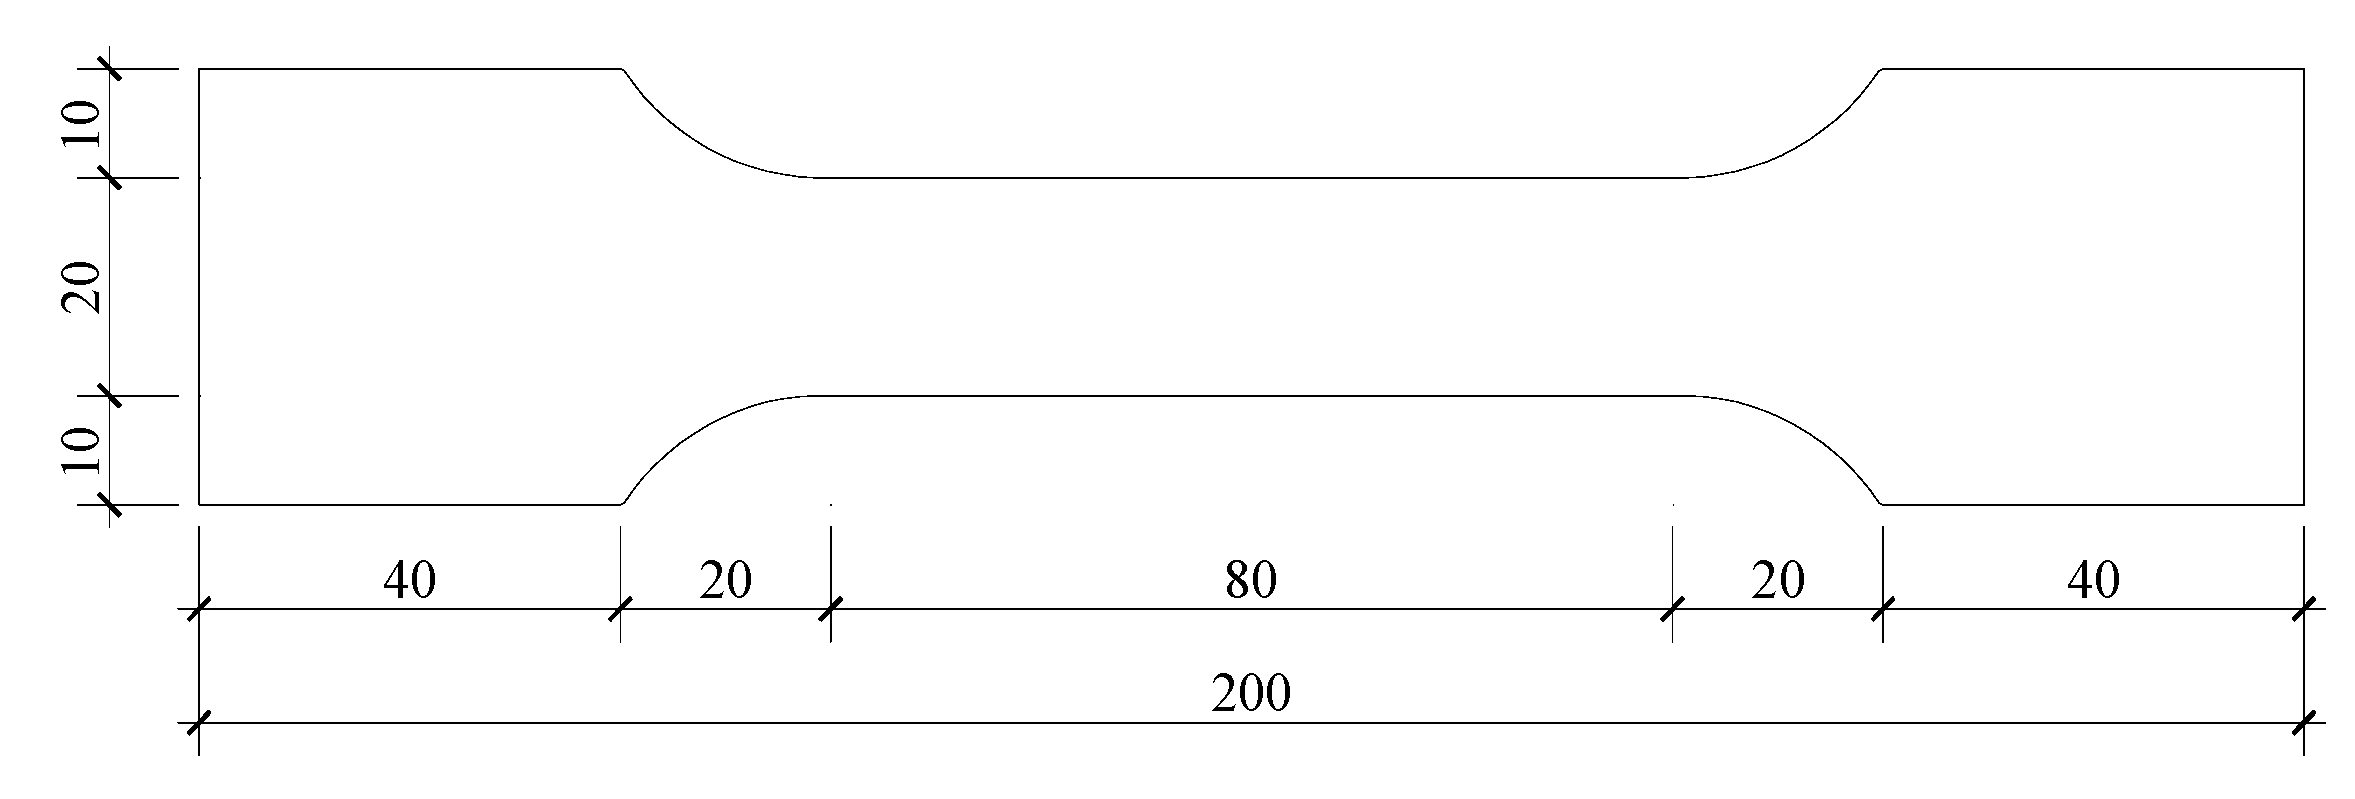
The concrete is selected from the optimum ratio in the above test, that is, the blending ratio of fly ash content of 30% and silica fume content of 4%, and the measured strength of concrete in 28 days is 45.933 MPa. The nominal thickness of the steel used in the test is 3.0 mm and the test are carried out according to the provisions of “tensile test of metal materials” (GB/T 228.1-2010). The specific dimensions of the test pieces are shown in Figure 10, and the measured mechanical properties of the steel are shown in Table 8.
3.2. Loading Device and Scheme
After the concrete was cured for 28 days, the test pieces were subjected to an axial compression load failure test, carried out on a 3000 kN pressure machine. A longitudinal strain gauge and a transverse strain gauge are installed on the outer wall of the steel tube at the upper and lower parts and the middle parts of the specimen. That is to say, a total of six strain gauges are attached to each specimen to measure the longitudinal and transverse strains of the specimen. Four displacement meters are symmetrically arranged at the bottom corners and the top corner of the specimen to measure the displacement variation of the four parts, respectively. The specific arrangements are shown in Figure 11. Figure 12 shows an in-line multi-cavity steel tube bundle self-compacting concrete shear wall.
Firstly, the specimen was geometrically centered and then preloaded to ensure good contact between the strain gauge and displacement meter. During the preloading process, when the values displayed by the four displacement meters were approximately equal, the specimen was ensured to be physically centered in the testing machine. The formal loading was carried out in stages. Within the elastic range, the loading of each stage is 1/10 of the estimated load; when the steel tube bundle yields, the loading of each stage is 1/15 of the estimated load, and each stage holds the load for 1 min. The shear wall was considered to be damaged when the specimen load fell below 75% of the peak load or when the steel tube edges and corners were torn.
3.3. Experimental Results and Analysis
3.3.1. Failure Process and Form
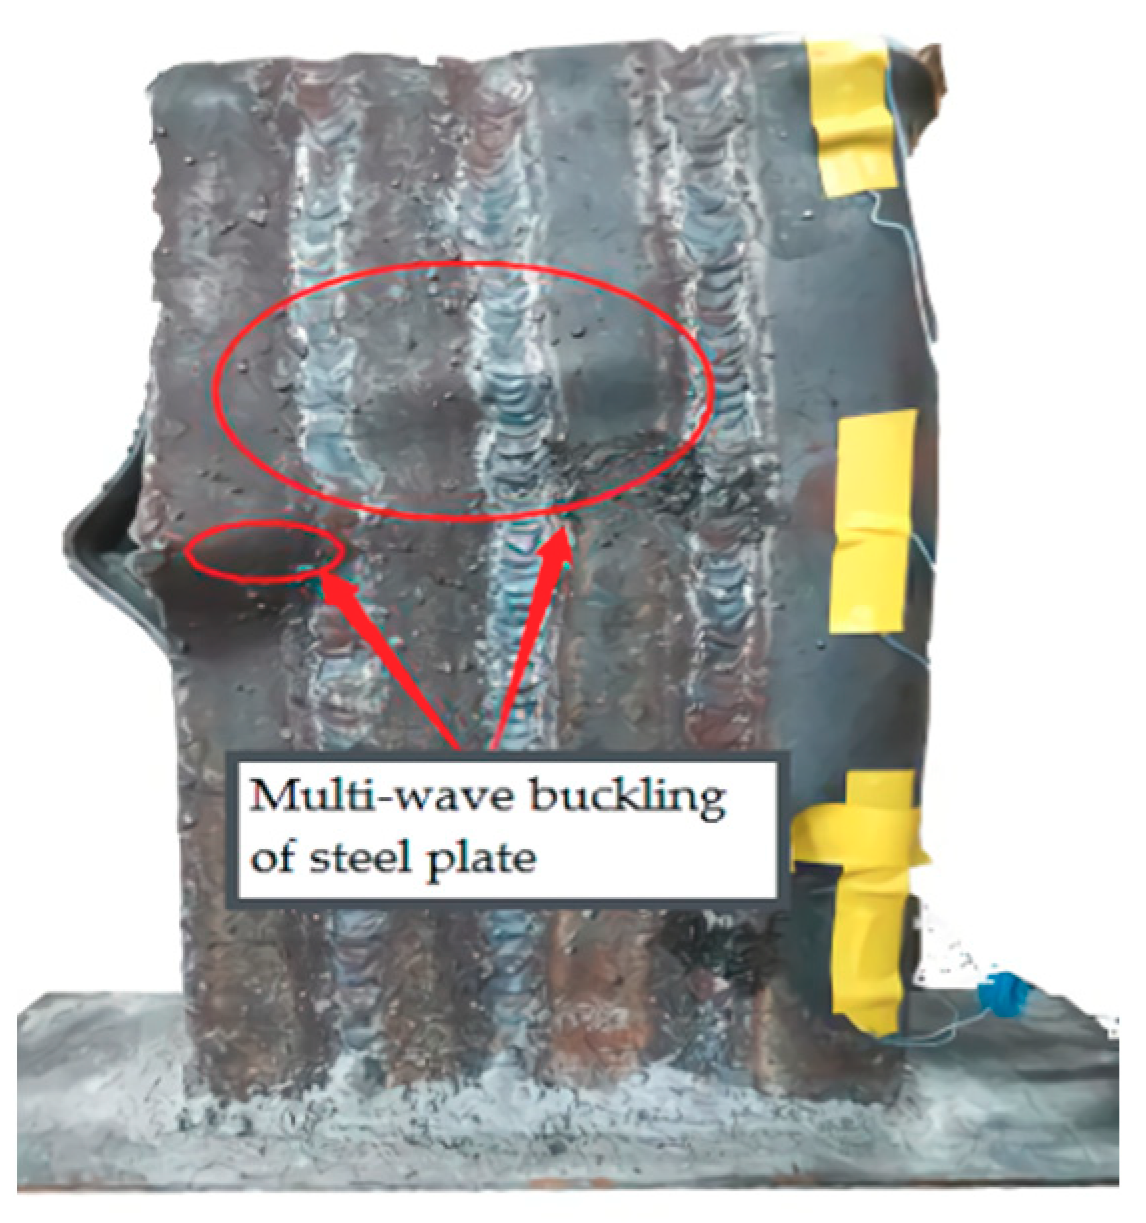
At the initial stage of loading (before 0.65 Nu, Nu is the peak load, Nu = 997.89 kN), the deflection of the specimen basically increases linearly with the increase of load and there is no obvious phenomenon in the specimen. When the specimen enters the elastic-plastic stage (0.65 Nu~0.8 Nu), the middle part of the steel tube begins to slightly bulge. When the test is loaded to 997.89 kN (Nu), the specimen appears multi-wave bulging phenomenon, as shown in Figure 10. This multi-wave bulging phenomenon of the steel plate of the test piece is more obvious during the lowering process of the test load. When the test load is lowered to 648.62 kN (65% Nu), the bulging degree is deepened and the steel plate is accompanied by a squeak. When the test load is further lowered to 598.734 kN (60% Nu), the weld seam is torn, most likely caused by the relative sliding of the bonding interface between the multi-cavity steel tube and the inner core concrete.
The main failure of shear wall is concentrated in the middle of the steel tube and the final failure is multi-wave buckling of steel plate (Figure 13). Due to the extrusion of the core concrete of the adjacent cavity, the end steel tube finally shows bending buckling failure.
3.3.2. Analysis of Experimental Results
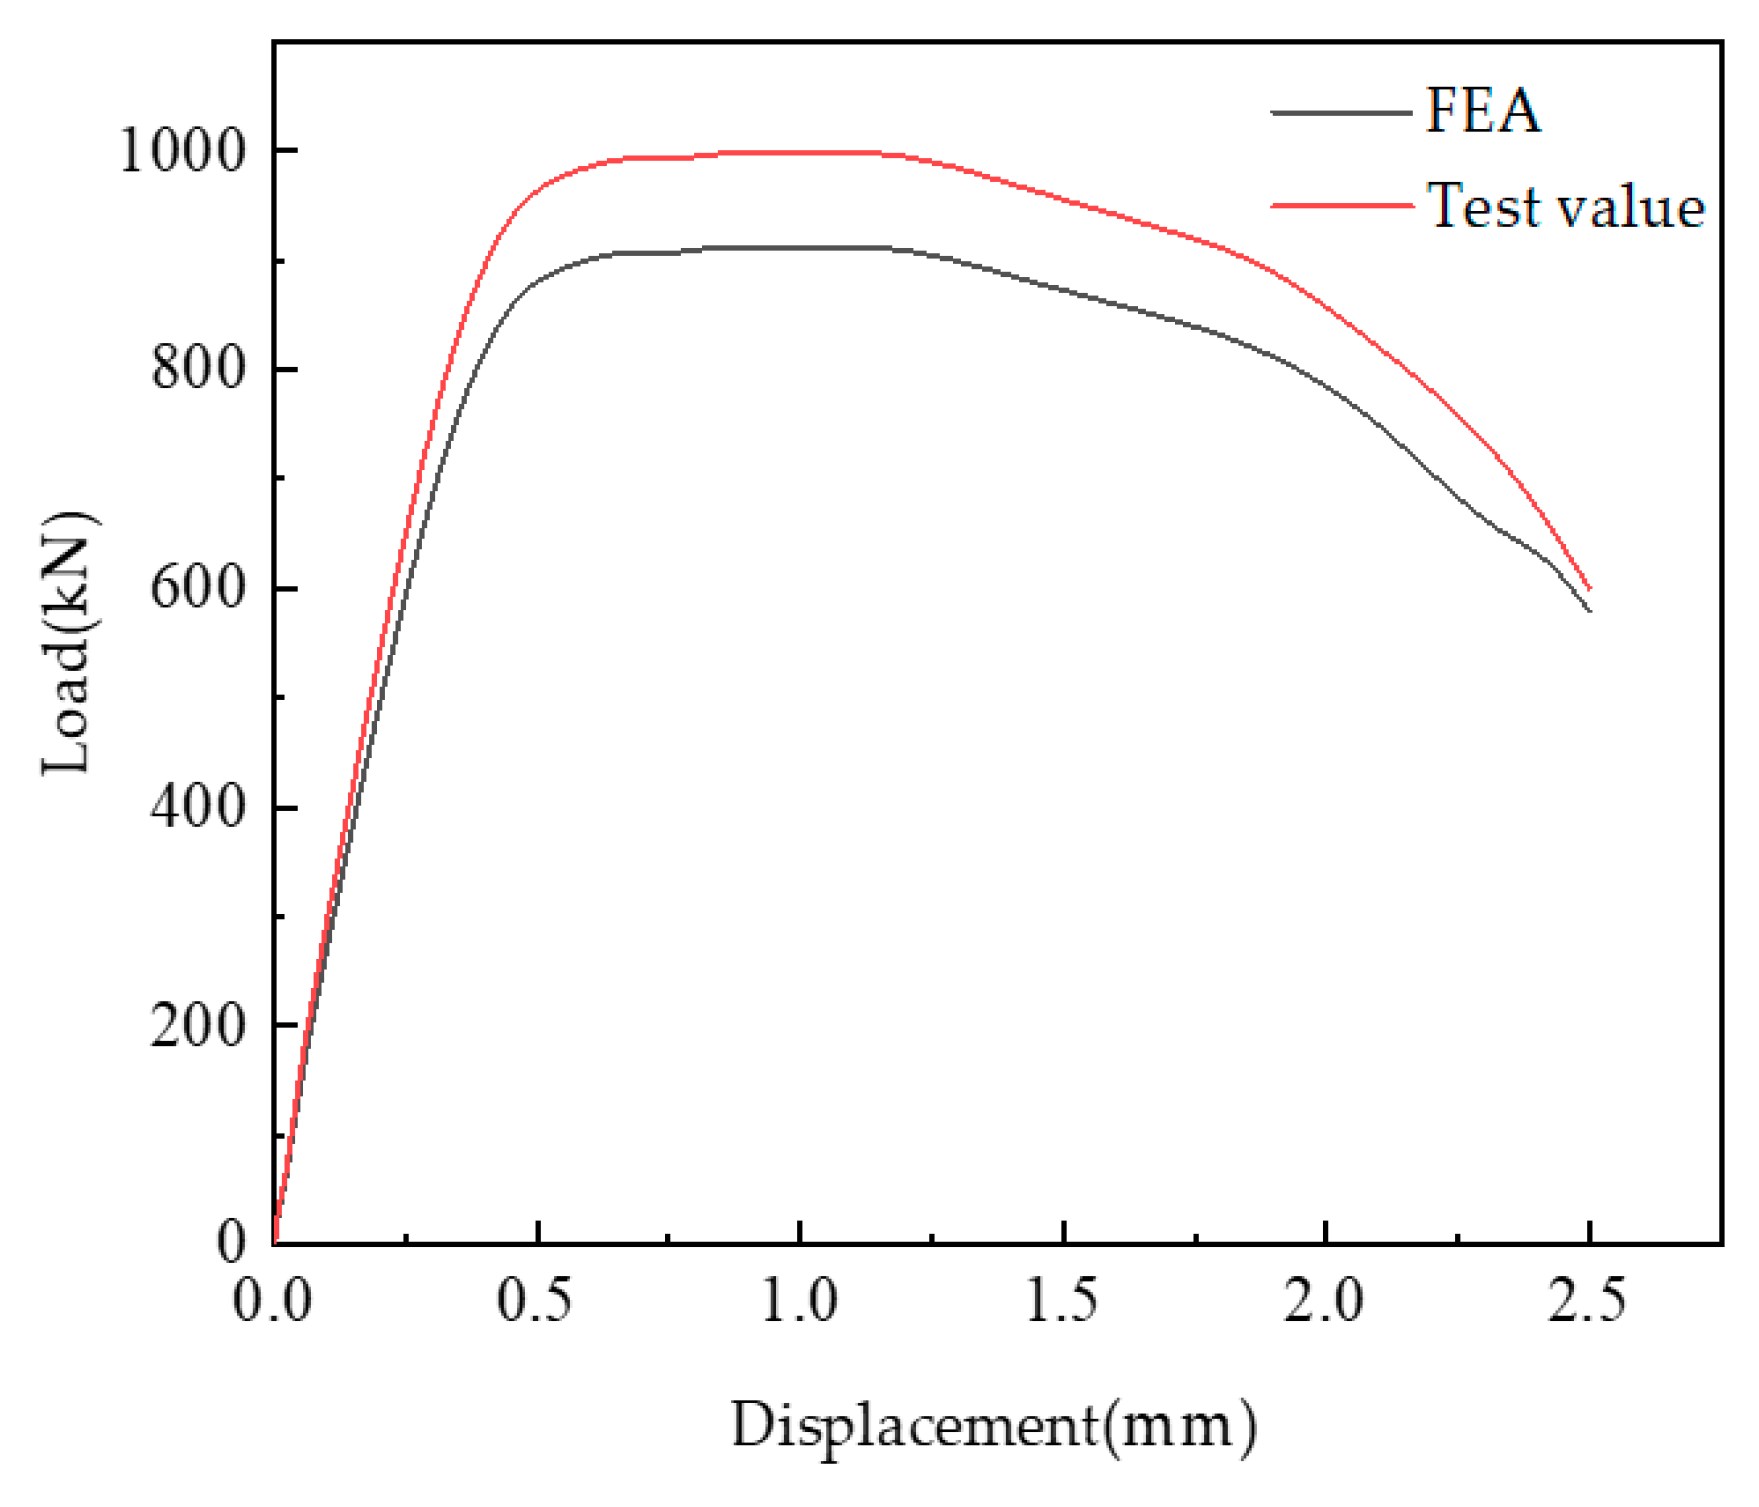
The longitudinal load-displacement curve of the I-shaped multi-cavity concrete filled steel tube shear wall is shown in Figure 14, where the displacement is the average value of the displacement measured by the two displacement meters at the bottom. As seen in the figure, the load drop value of the in-line multi-cavity concrete filled steel tube shear wall is relatively less after the peak point, indicating that the multi-cavity concrete filled steel tube shear wall has better ductility performance. Therefore, the multi-cavity steel tube can restrain the core concrete well and the shear wall will not show brittle failure due to concrete crushing at the failure stage.
4. Finite Element Model and Verification
4.1. Material Constitutive Model
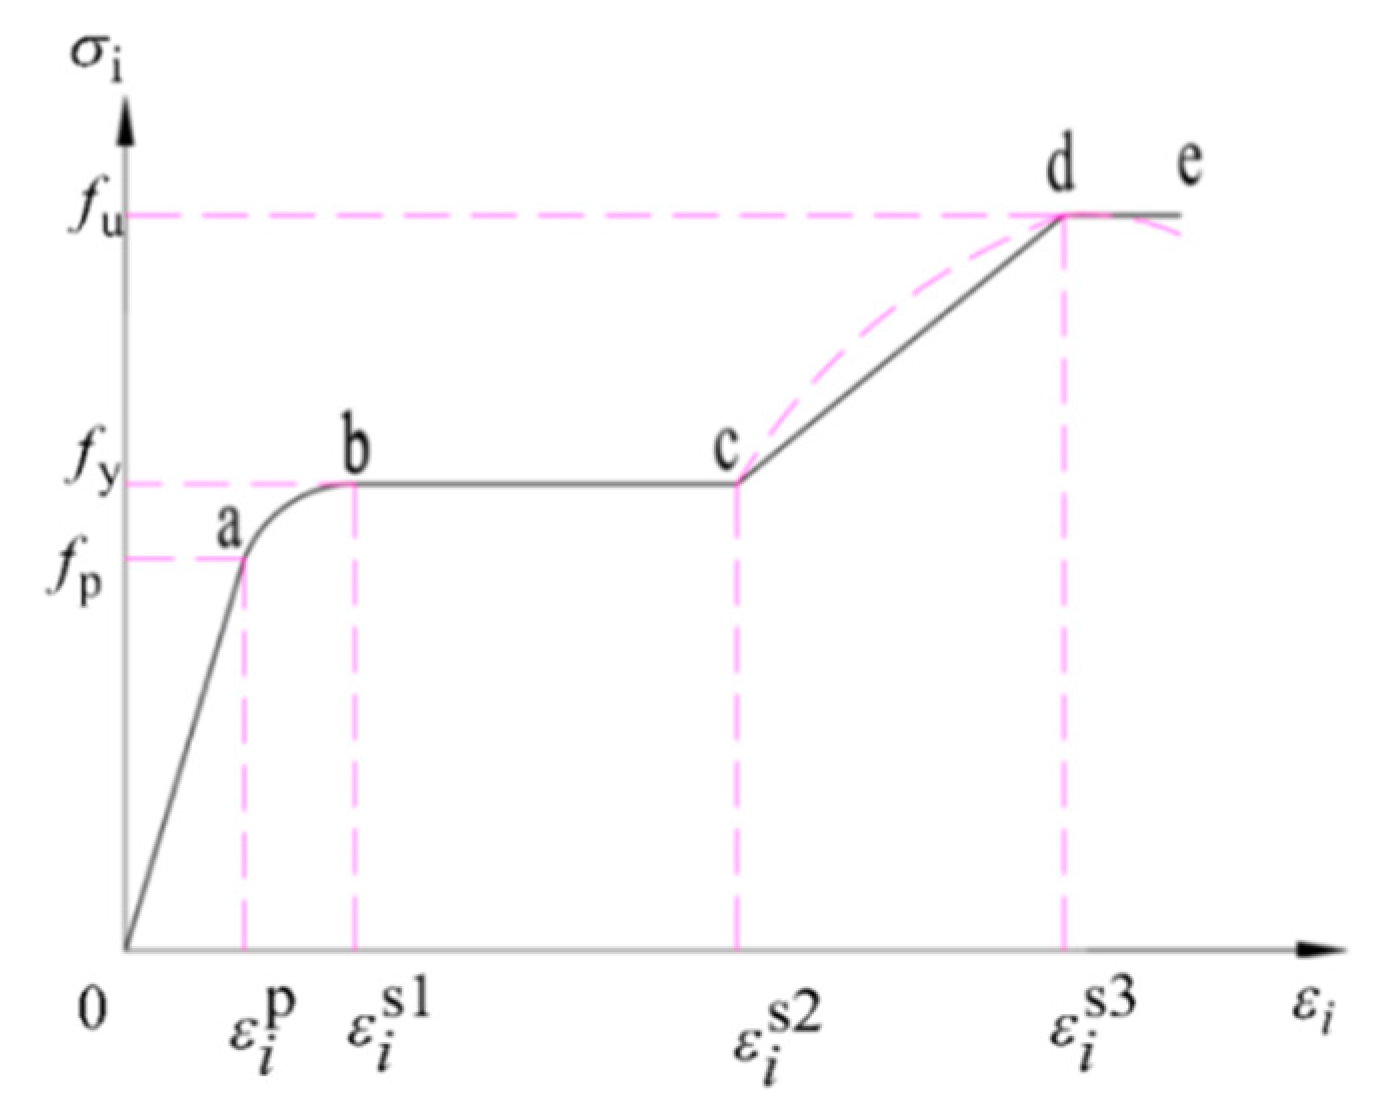
The steel is Q345 steel, and the stress-strain relationship curve is divided into five stages [28] including elastic stage (oa), elastic-plastic stage (ab), plastic stage (bc), strengthening stage (cd) and secondary plastic flow (de), as shown in Figure 15. The model expression is shown in the formula (6).
where εe = 0.8fy/Es, εe1 = 1.5εe, εe2 = 10ε1, εe3 = 100ε1, A = 0.2fy/(εe1 − εe2)2, B = 2Aεe1, C = 0.8fy + Aεe1 − Bεe.
The concrete expression of stress-strain relation curve [29] of core concrete obtained by a decomposition analysis method for core concrete is shown in Formula (7):
where:
where fcu is the cube compressive strength of concrete (MPa), fck is the standard value of axial compressive strength of concrete (MPa), ξ is the height of concrete boundary relative compression zone, ε0 is core concrete hoop strain, fy is the yield point of steel (MPa), As is the area of reinforcement (mm2) and Ac is the cross-sectional area of concrete (mm2).
The constitutive relation is convenient to use and can better show the constraint effect of steel tube on concrete under axial compression.
4.2. Element Selection and Contact Simulation
The core concrete in the steel tube adopts C3D8R solid element with an eight-node hexahedron linear reduced integral format, and the steel tube adopts S4R shell element with a four-node reduced integral format, which belongs to a universal shell element and allows shear deformation along the thickness direction. At the same time, with the thickness change of the shell element, the model will be automatically modified to conform to the thin shell theory or thick shell theory. The structural partition network is used for three-dimensional solid concrete unit and the free partition network is used for shell unit steel pipe.
The normal direction of the interface between the steel tube and core concrete adopts ‘hard contact’, and the pressure P perpendicular to the interface can be completely transmitted between contact units. Coulomb “penalty” friction model is adopted in tangential direction. When the formula is set, it means that the contact surface of the steel plate is allowed to move slightly when transferring stress between the steel plate and the concrete surface, that is, “elastic sliding” in ABAQUS, which is closer to the actual stress state of the member. When the surface-surface contact is set, the concrete is set as the main surface and the steel plate as the secondary surface, as the model needs to consider the shape change of steel plate and concrete, so as to ensure that no penetration will occur under the normal deformation of the two. The interface between the steel tube and concrete can transfer shear stress and reach the critical value.
Formula (8) can be used for critical shear stress τbond of square steel tube according to Morishita et al. [30]:
where b is the side length of the square steel tube and t is the wall thickness of the square steel tube.
τbond = 0.75 × [2.314 − 0.0195(b/t)]
4.3. Boundary Conditions and Loading Methods
The bottom end of the shear wall is subjected to complete fixed end constraint, which restricts the displacement and rotation angle in three directions. The top end of the shear wall fixes the displacement in two directions and rotation angle in three directions in the horizontal plane, releases the vertical displacement constraint, and applies a displacement load of 1/100 of the height of the shear wall.
4.4. Finite Element Verification
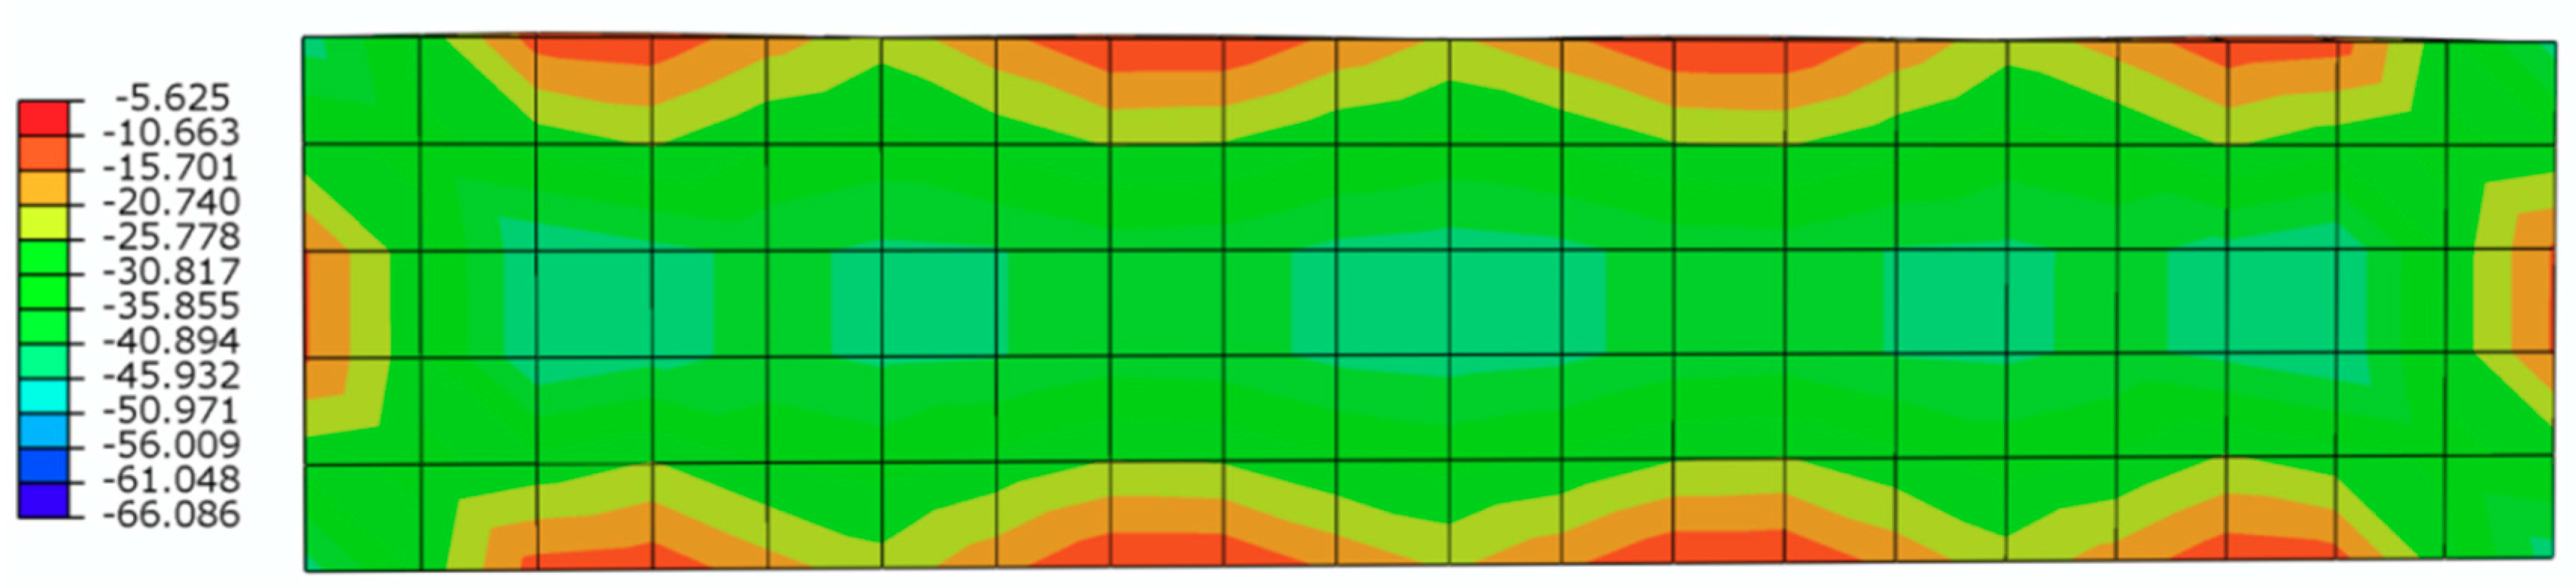
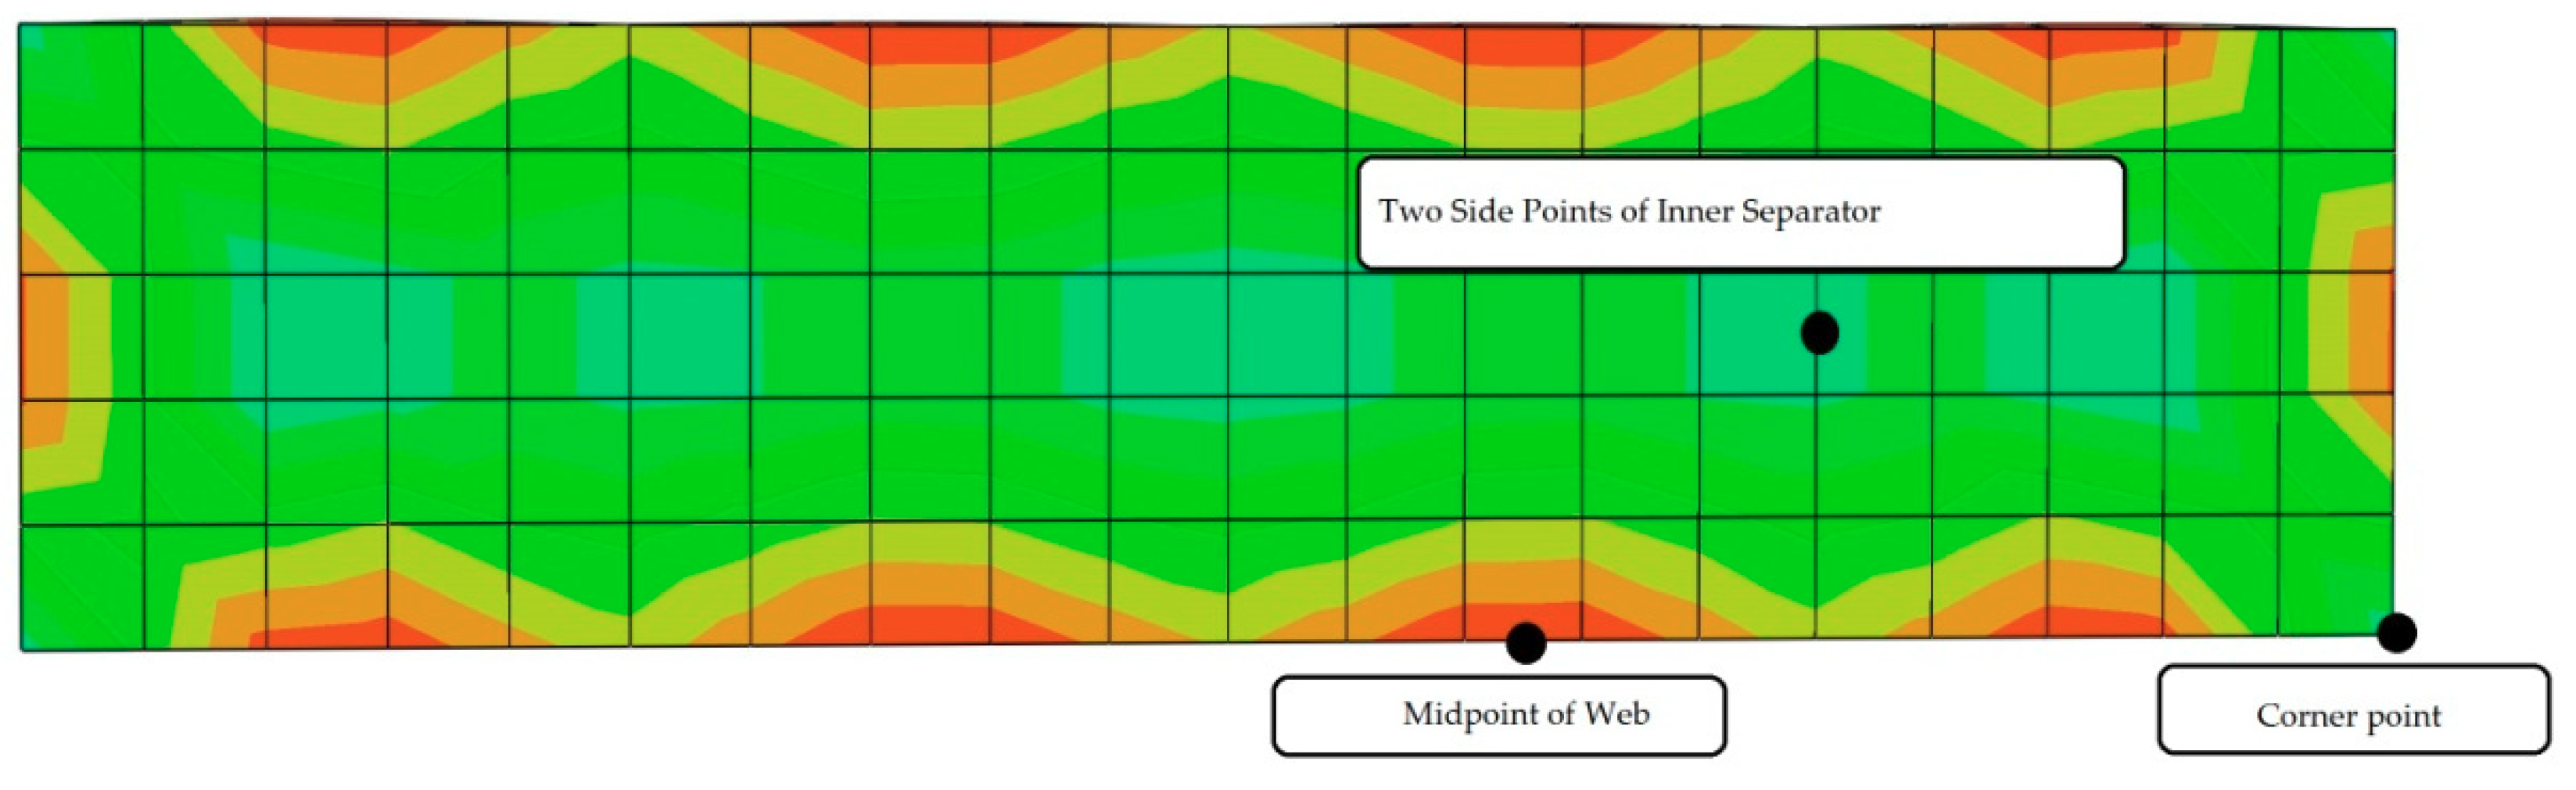
The experimental results and the finite element analysis results are shown in Figure 14. Through comparison, the finite element model can more effectively simulate the bearing capacity and deformability of the shear wall. Figure 16 and Figure 17 show the stress distribution of concrete and multi-cavity steel tubes under peak load, respectively. From Figure 16, it can be seen that multi-cavity steel tubes can effectively restrain core concrete. From the stress distribution of steel tubes, it can be seen that the middle of steel tubes presents a trend of multi-wave buckling. Therefore, the finite element model is more accurate, and can better simulate the deformation and mechanical properties of the multi-cavity steel tube SCC shear wall.
5. Analysis of Compression Performance of Axis Compression Members
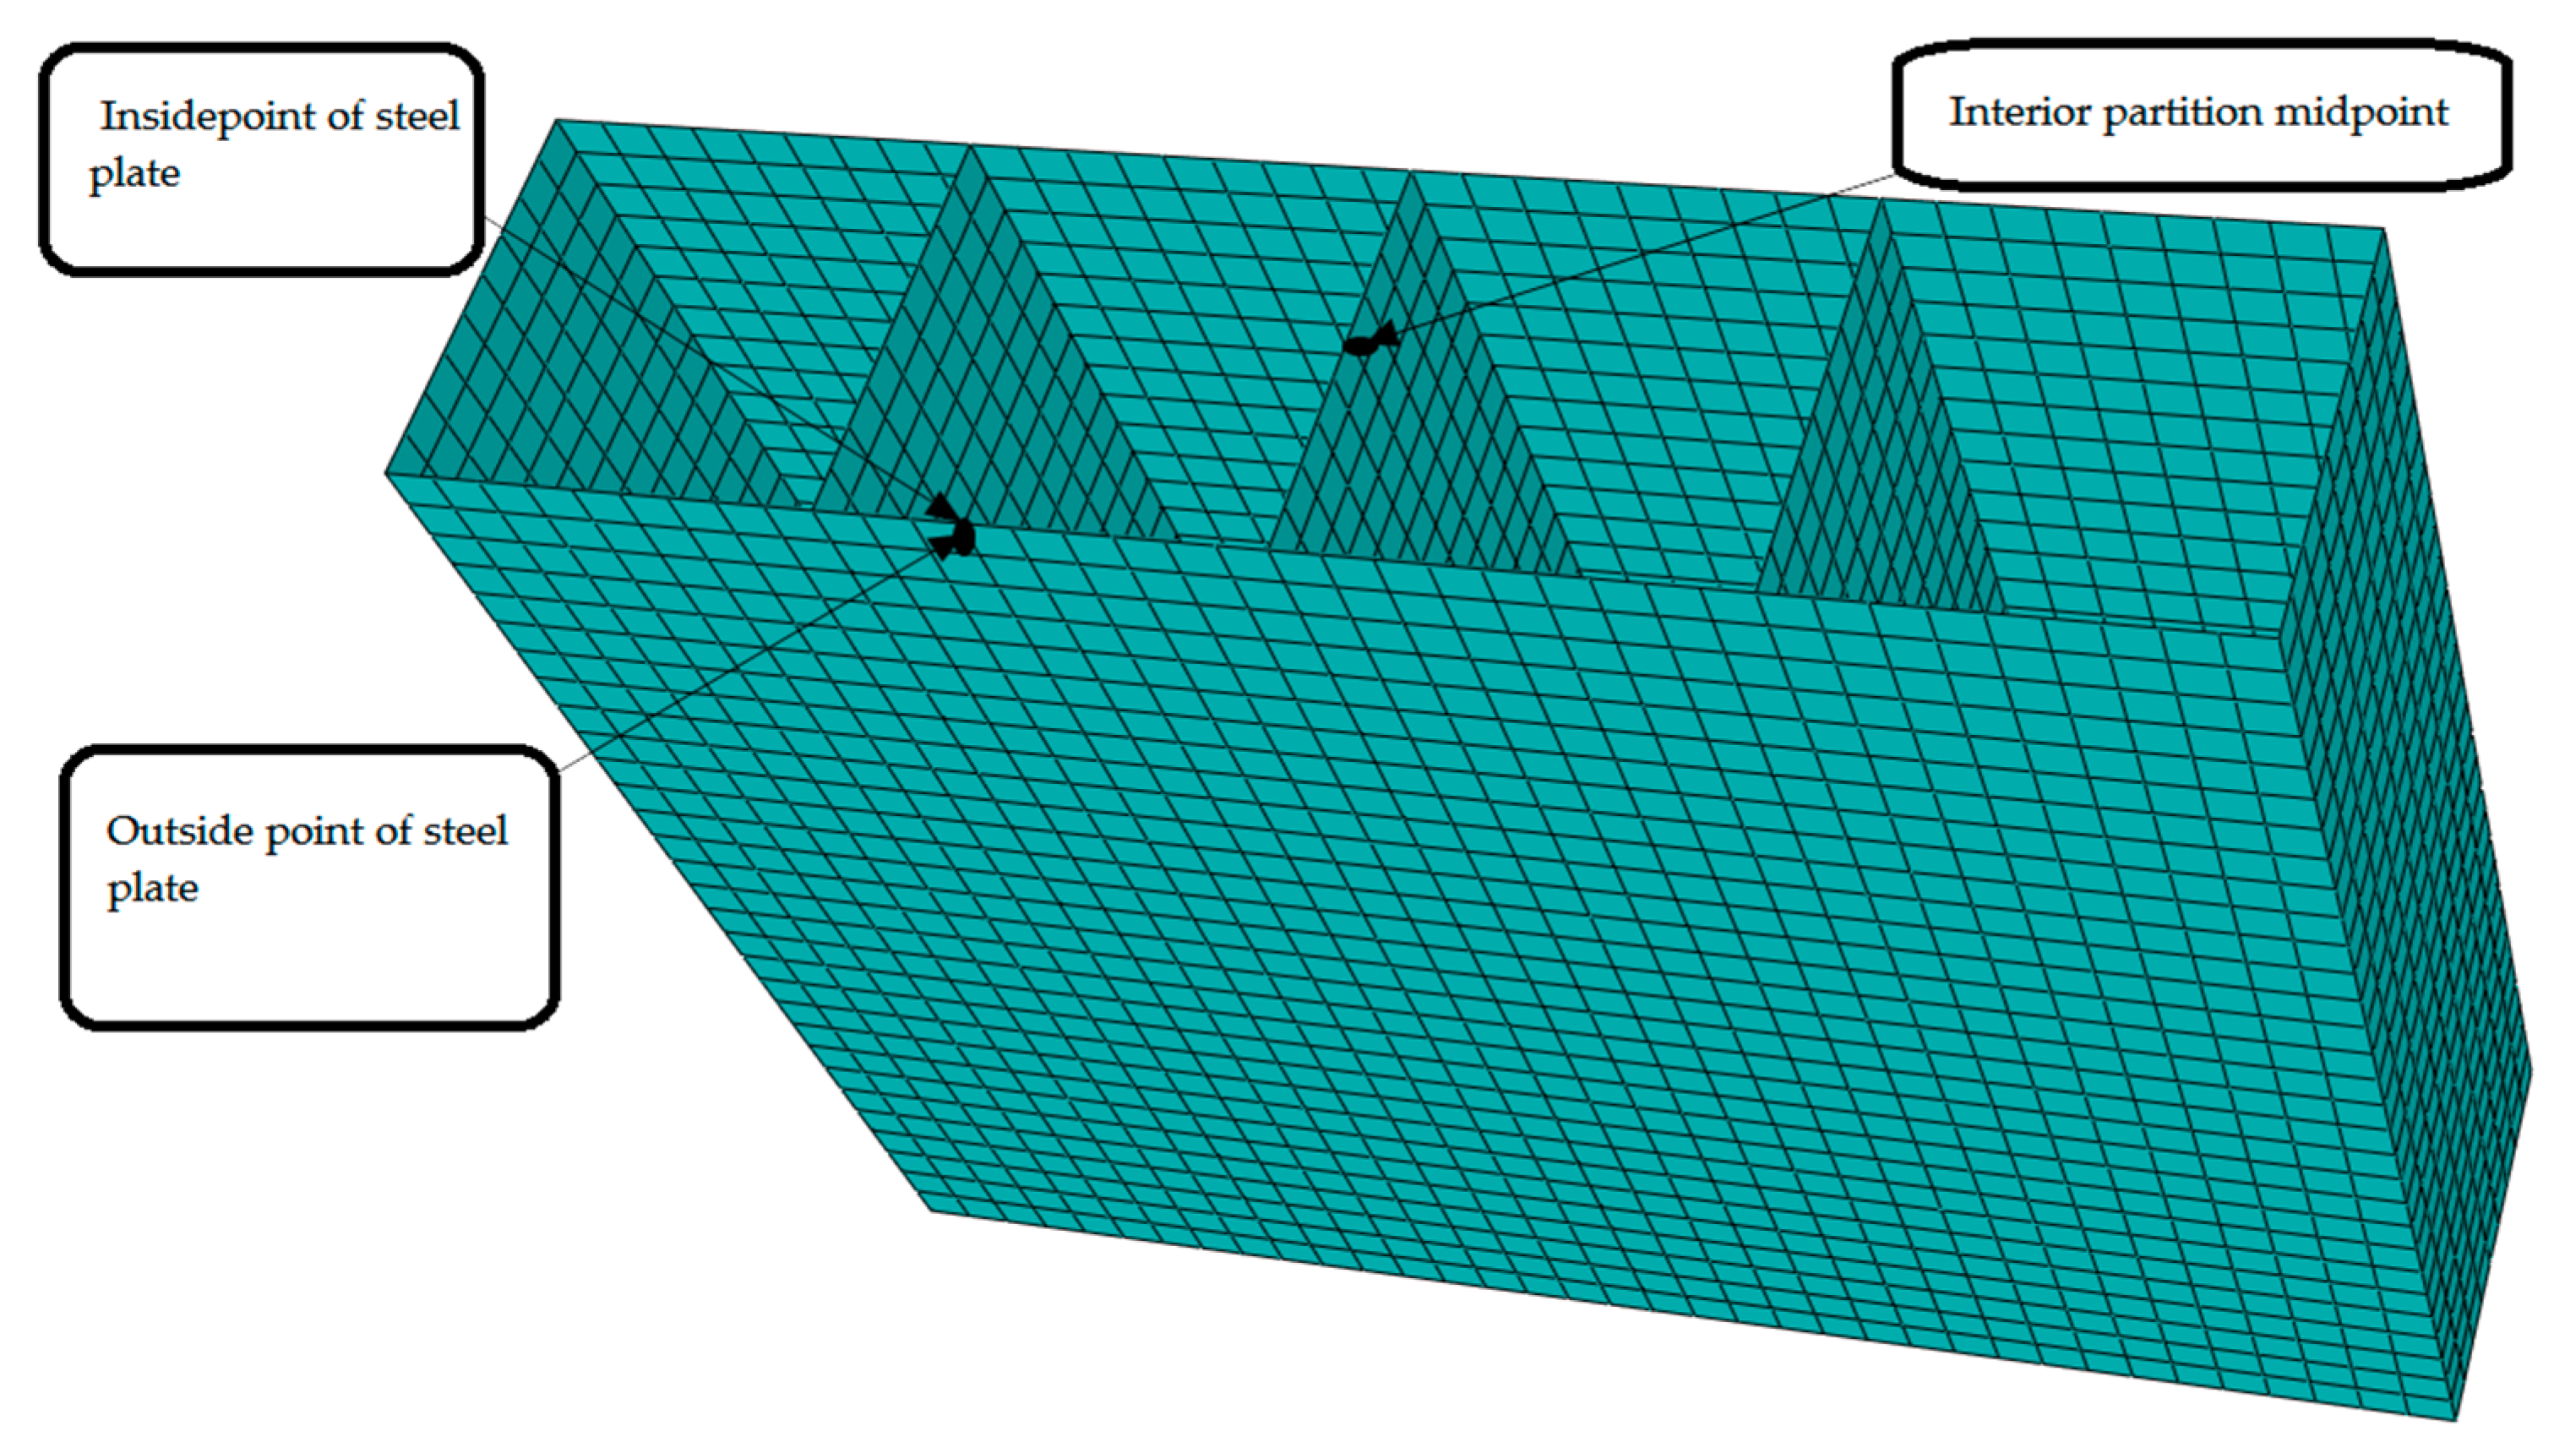
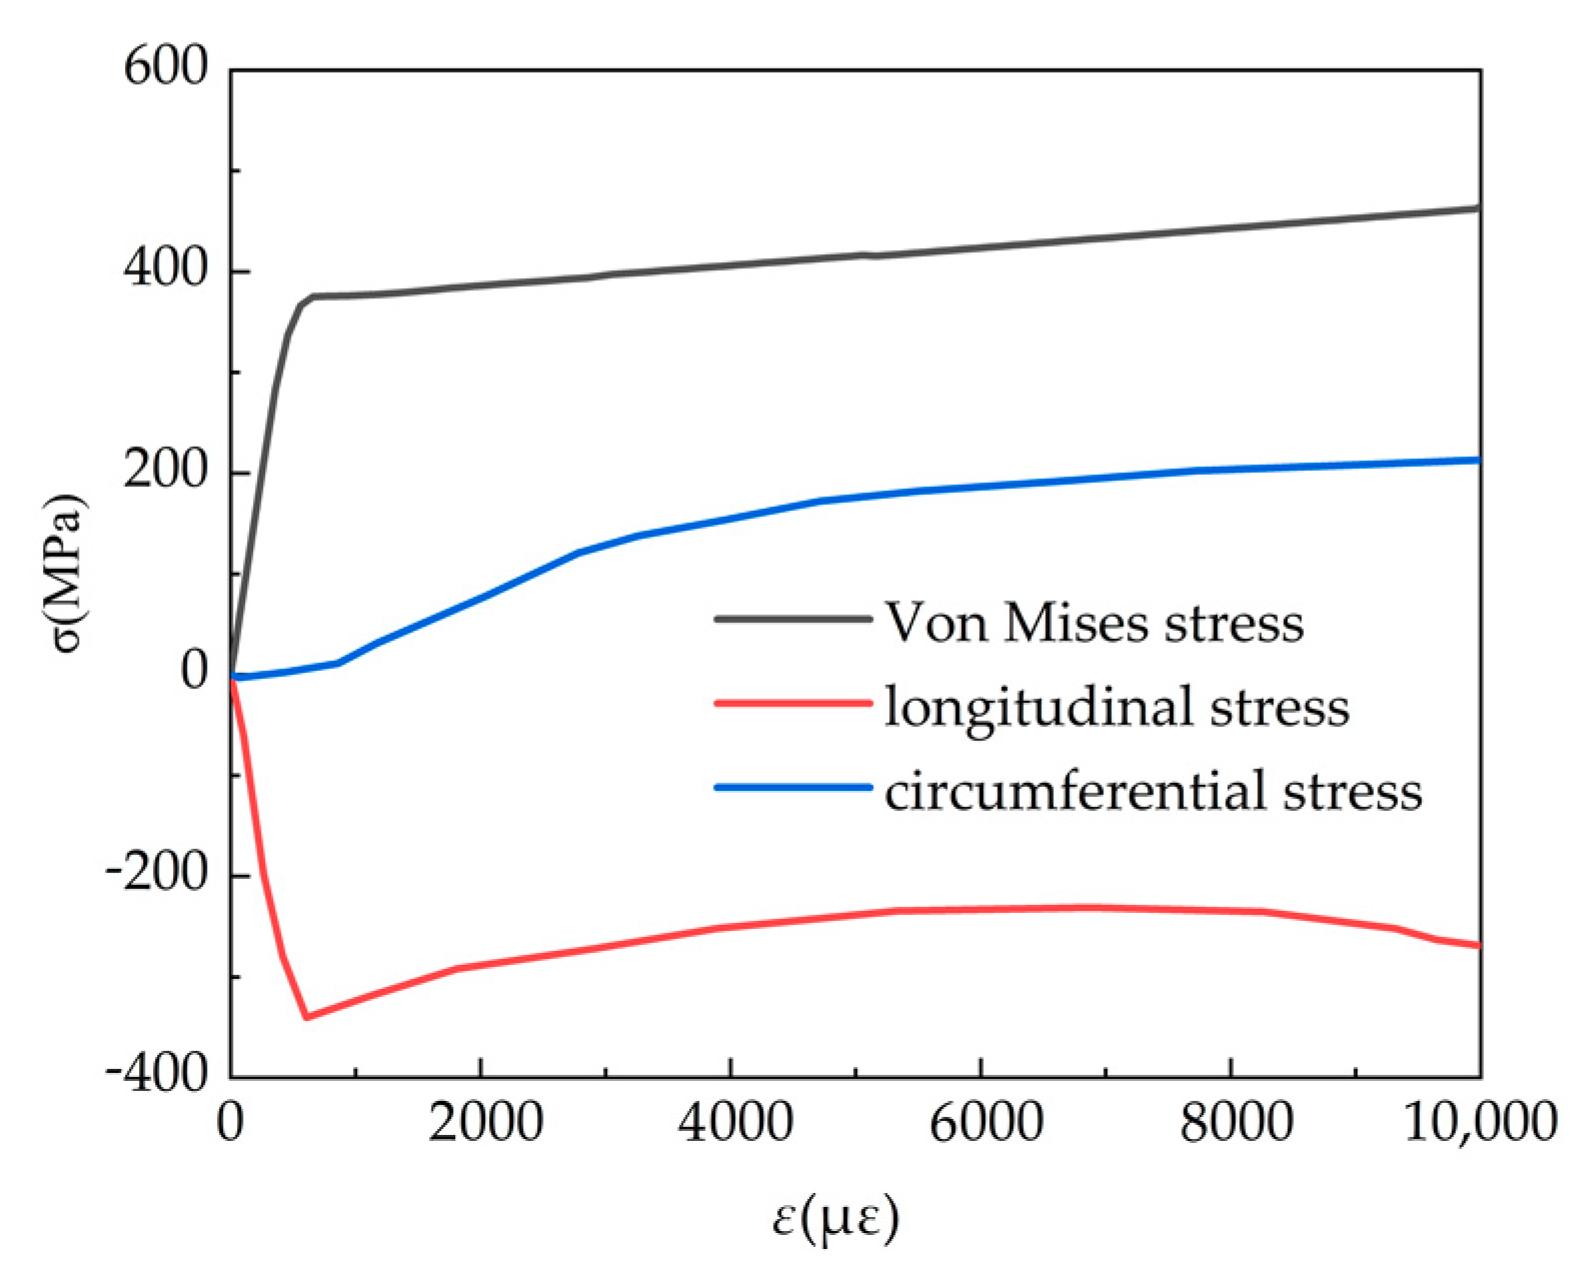
Figure 18 shows the positions of each characteristic point of the H/2 high section of the multi-cavity steel tube. The stress-strain relation curves of the inner and outer surfaces of the web plate and the stress-strain curve of the midpoint of the inner partition plate is shown in Figure 19 and Figure 20, respectively.
As can be seen in Figure 19 and Figure 20, in the initial stage of loading, the shear wall is in the elastic stage, and the stresses on the inner and outer surfaces of the web remain the same. In this stage, the Von-Mises stress and the longitudinal stress at the middle point of the partition in the multi-cavity steel tube show a linear increasing trend with the strain, while the circumferential stress is close to 0, because the Poisson’s ratio (0.24) of the steel is greater than that of the SCC (0.2). When subjected to axial load, the transverse deformation of the concrete is smaller than that of the steel, and the two are in mutually independent stages, and basically, shows no synergistic effect.
In Figure 20, when the longitudinal strain is more than 750 με, the internal partition plate begins to show circumferential stress. This is because when the concrete exceeds the proportional limit, the concrete enters the elastic-plastic stage before the steel tube does, and the Poisson’s ratio of the concrete begins to increase, making the transverse deformation of the concrete larger than the transverse strain of the steel tube. At this point, the multi-cavity steel tube will limit the transverse deformation of the concrete, have a restraining effect on the concrete and the transverse stress of the steel plate will appear and gradually increase. At this time, the stress difference between the inner and outer surfaces of the web begins to appear.
After that, with the increase of longitudinal strain, the longitudinal stress begins to decrease and the circumferential stress increases obviously. With the increase of axial load, both the multi-cavity steel tube and the inner core concrete enter the elastoplastic stage, and their Poisson’s ratio increases continuously. However, the Poisson’s ratio of multi-cavity steel tube increases relatively slowly compared to that of concrete, thus causing its circumferential strain to increase rapidly. The multi-cavity steel tube has a more obvious effect on limiting the lateral deformation of concrete and shows a more obvious constraint effect on the core concrete. After yielding, the multi-cavity steel tube obeys Von-Mises yield criterion; that is, the longitudinal stress of the multi-cavity steel tube will inevitably decrease as the hoop stress increases.
Figure 21 shows the distribution diagram of concrete characteristic points, and the longitudinal stress-strain relationship curves of concrete points under peak load are shown in Figure 22. In Figure 22, the stress level at the midpoint of the web is the lowest, and the constraint effect at the diagonal point of the multi-cavity steel tube is the strongest, where the longitudinal stress can reach 110 MPa. The constraint effect of the multi-cavity steel tube at the internal partition plate is weaker than that at the diagonal point, where the maximum stress reaching 98 MPa. From the analysis of the overall stress mechanism, the compression mechanism of the multi-cavity steel tube shear wall is similar to that of the rectangular steel tube [31] concrete, but due to the existence of the inner partition plate, the concrete is more restrained.
6. Conclusions
Through concrete compression test and concrete filled steel tube shear wall test, the following conclusions are drawn.
- (1)
- With the increase of fly ash content, the compressive strength of SCC demonstrates a trend of increasing first and then decreasing. When the fly ash content is 30% and the silica fume content is 4%, the 28 d compressive strength of SCC is the highest.
- (2)
- The development law of compressive strength of SCC cured by standard curing is different from that cured by wrapping. This paper puts forward the compressive strength formula of wrapping curing.
- (3)
- As the SCC is most obviously affected by the collar at the corner point of the steel tube bundle, its compressive strength is 110 MPa, and is 96 MPa higher than the concrete at the middle point of the web.
- (4)
- Under the constraint of steel tube, the core concrete is in a three-dimensional compression state, the maximum compressive strength of concrete at the corner can reach 110 MPa and the concrete presents obvious plastic material properties.
- (5)
- The finite element model can effectively simulate the axial compression performance of cavity steel tube bundle SCC shear wall structure.
Author Contributions
H.L. and H.S. conceived of the original idea and designed the experiment. W.Z. analyzed the data. H.G. wrote the paper. Q.Y. revised the paper.
Funding
This research was supported in part by the Major (key) project of key research and development plan in the Ningxia Hui Autonomous Region (2018BEG02009), The Funding Project of First-Class Discipline Construction of University in Ningxia(Domestic First-Class Discipline Construction) under Grant NXYLXK2017A03, The “Yangtze River Scholars and Innovation Team Development Program” Innovation Team of the Ministry of Education funded the project (IRT1067), the Ningxia Natural Fund Project (2019AAC03050), the Ningxia Hui Autonomous Region Special Funding Project for Foreign Science and Technology Cooperation (2018BFH03002) and the Ningxia University Postgraduate Innovation Project Funding Scheme (GIP2019026).
Conflicts of Interest
The authors declare no conflicts of interest.
References
- Liu, X.J.; Wang, H.; Liu, L. Development and utilization of fly ash resources. Inorg. Chem. Ind. 2018, 50, 12–14. [Google Scholar]
- Misra, A. Stabilization characteristics of clays using class C fly ash. Transp. Res. Rec. 1998, 1611, 46–54. [Google Scholar] [CrossRef]
- Golewski, G.L. The influence of microcrack width on the mechanical parameters in concrete with the addition of fly ash: Consideration of technological and ecological benefits. Constr. Build. Mater. 2019, 197, 849–861. [Google Scholar] [CrossRef]
- Golewski, G.L.; Sadowski, T. Macroscopic Evaluation of Fracture Processes in Fly Ash Concrete. Solid State Phenom. 2016, 254, 188–193. [Google Scholar] [CrossRef]
- Licheng, W.U.; Zhe, W.; Di, L. Effect of Confining Pressure and Steel Fiber Volume Content on Mechanical Property of Reactive Powder Concrete. J. Build. Mater. 2018, 21, 208–215. [Google Scholar]
- Abed, M.; Nasr, M.; Hasan, Z. Effect of silica fume/binder ratio on compressive strength development of reactive powder concrete under two curing systems. MATEC Web Conf. 2018, 162. [Google Scholar] [CrossRef]
- Williams, P.N.; Mathias, F.; Urs, M. Analysis of the Flexural Behavior of Textile Reinforced Reactive Powder Concrete Sandwich Elements Using Optical Measurements. Proceedings 2018, 2, 393. [Google Scholar] [Green Version]
- Flansbjer, M.; Portal, N.W.; Vennetti, D. Composite Behaviour of Textile Reinforced Reactive Powder Concrete Sandwich Façade Elements. Int. J. Concr. Struct. Mater. 2018, 12, 71. [Google Scholar] [CrossRef]
- Asteray, D.B.; Odhiambo, O.W.; Muse, S.S. Mechanical and microstructural properties of recycled reactive powder concrete containing waste glass powder and fly ash at standard curing. Cogent Eng. 2018, 5, 1464877. [Google Scholar]
- Li, H.B.; Sun, H.; Tian, J.C. Mechanical and Ultrasonic Testing of Self-Compacting Concrete. Energies 2019, 12, 2187. [Google Scholar] [CrossRef]
- Yang, Z.W.; Cao, X.W.; Ding, H.Z. Influence of High-Volume Fly Ash-Silica Fume on Compressive Strength and Chloride Permeability of self Compacting Concrete. Build. Technol. 2017, 1, 25–27, 52. [Google Scholar]
- Bao, M.X.; He, H.Z.; Xue, M. Sulphate-Resistance Performance of Self-Compacting High Flowing Concrete Mixed with Fly Ash and Grammite Powder. Coal Ash China 2006, 1, 6–8. [Google Scholar]
- JGJ/T283-2012. Technical Specification for Application of Self-Compacting Concrete; Architecture & Building Press: Beijing, China, 2012. [Google Scholar]
- Chiaia, B.; Kumpyak, O.; Placidi, L.; Maksimov, V. Experimental analysis and modeling of two-way reinforced concrete slabs over different kinds of yielding supports under short-term dynamic loading. Eng. Struct. 2015, 96, 88–99. [Google Scholar] [CrossRef]
- Scerrato, D.; Giorgio, I.; Madeo, A.; Darve, F. A simple non-linear model for internal friction in modified concrete. Int. J. Eng. Sci. 2014, 80, 136–152. [Google Scholar] [CrossRef] [Green Version]
- Giorgio, I.; Scerrato, D. Multi-scale concrete model with rate-dependent internal friction. Eur. J. Environ. Civ. Eng. 2016, 21, 821–839. [Google Scholar] [CrossRef]
- Contrafatto, L.; Cuomo, M.; Fazio, F. An enriched finite element for crack opening and rebar slip in reinforced concrete members. Int. J. Fract. 2012, 178, 33–50. [Google Scholar] [CrossRef]
- Choi, Y.W.; Kim, Y.J.; Shin, H.C.; Moon, H.Y. An experimental research on the fluidity and mechanical properties of high-strength lightweight self-compacting concrete. Cem. Concr. Res. 2006, 36, 1595–1602. [Google Scholar] [CrossRef]
- Okamura, H.; Ozawa, K. Self-Compacting High Performance Concrete. Struct. Eng. Int. 1996, 6, 269–270. [Google Scholar] [CrossRef]
- Domone, P.L. A review of the hardened mechanical properties of self-compacting concrete. Cem. Concr. Compos. 2007, 29, 1–12. [Google Scholar] [CrossRef]
- Khatib, J.M. Performance of self-compacting concrete containing fly ash. Constr. Build. Mater. 2008, 22, 1963–1971. [Google Scholar] [CrossRef]
- Mastali, M.; Dalvand, A.; Sattarifard, A. The impact resistance and mechanical properties of the reinforced self-compacting concrete incorporating recycled CFRP fiber with different lengths and dosages. Compos. Part B Eng. 2017, 112, 74–92. [Google Scholar] [CrossRef]
- Xu, J.J.; Chen, Z.P.; Xue, J.Y. Seismic performance of T-shaped steel reinforced concrete members. J. Build. Struct. 2018, 39, 119–130. [Google Scholar]
- Shang, J.; Li, Z.L.; Zhang, C. Nonlinear Analysis of T-Shaped RC Steel Reinforced Concrete Short-Pier Shell Wall. J. Xi’an Univ. Technol. 2013, 29, 362–366. [Google Scholar]
- Fang, X.D.; Wei, H.; Li, F.H. Study on axial bearing capacity of shear wall with steel tube-confined high-strength concrete. J. Build. Struct. 2016, 37, 11–22. [Google Scholar]
- Fang, X.D.; Jiang, B.; Wei, H. Axial compressive test and study on steel tube confined high strength concrete shear wall. J. Build. Struct. 2013, 34, 100–109. [Google Scholar]
- Jiang, B. Study on Axial Bearing Capacity of Shear Wall with Steel Tube-Confined High-Strength Concrete; South China University of Technology: Guangzhou, China, 2012. [Google Scholar]
- Han, L.H. Concrete Filled Steel Tubular Structure: Theory and Practice; Science Press: Beijing, China, 2004. [Google Scholar]
- Feng, C.Q. Research on Mechanical Performance of SRC Cross-Shaped Shorted-Limb Shear Walls; Xi’an University of Technology: Xi’an, China, 2015. [Google Scholar]
- Morishita, Y.; Tomii, M.; Yoshimura, K. Experimental studies on bond strength in octagonal steel tubular columns subjected to axial loads. Trans. Jpn. Concr. Fill. Sq. Concr. Inst. 1979, 1, 336–359. [Google Scholar]
- Wang, Z.B.; Tao, Z.; Yu, Q. Axial compressive behaviour of concrete-filled double-tube stub columns with stiffeners. Thin Walled Struct. 2017, 120, 91–104. [Google Scholar] [CrossRef]
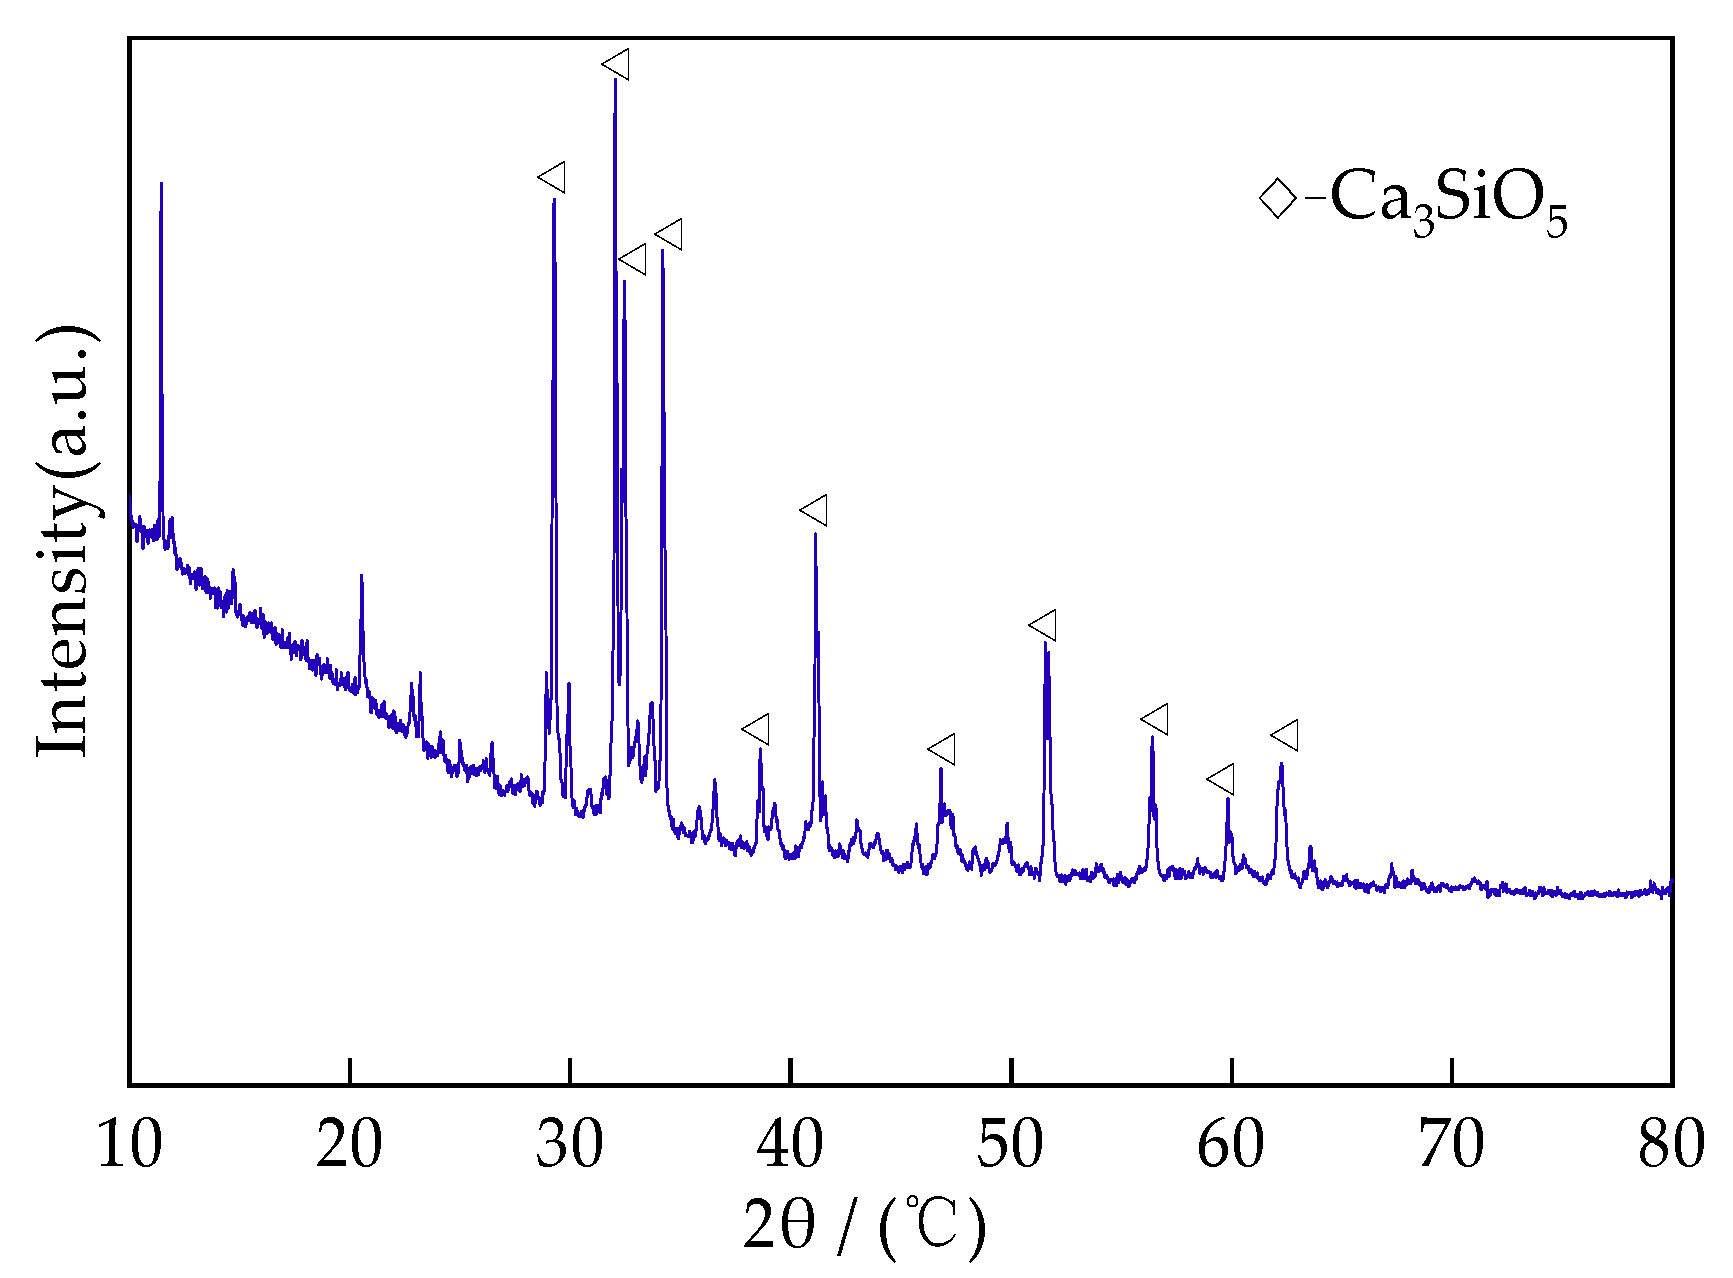
Figure 1.
XRD diagram of cement.

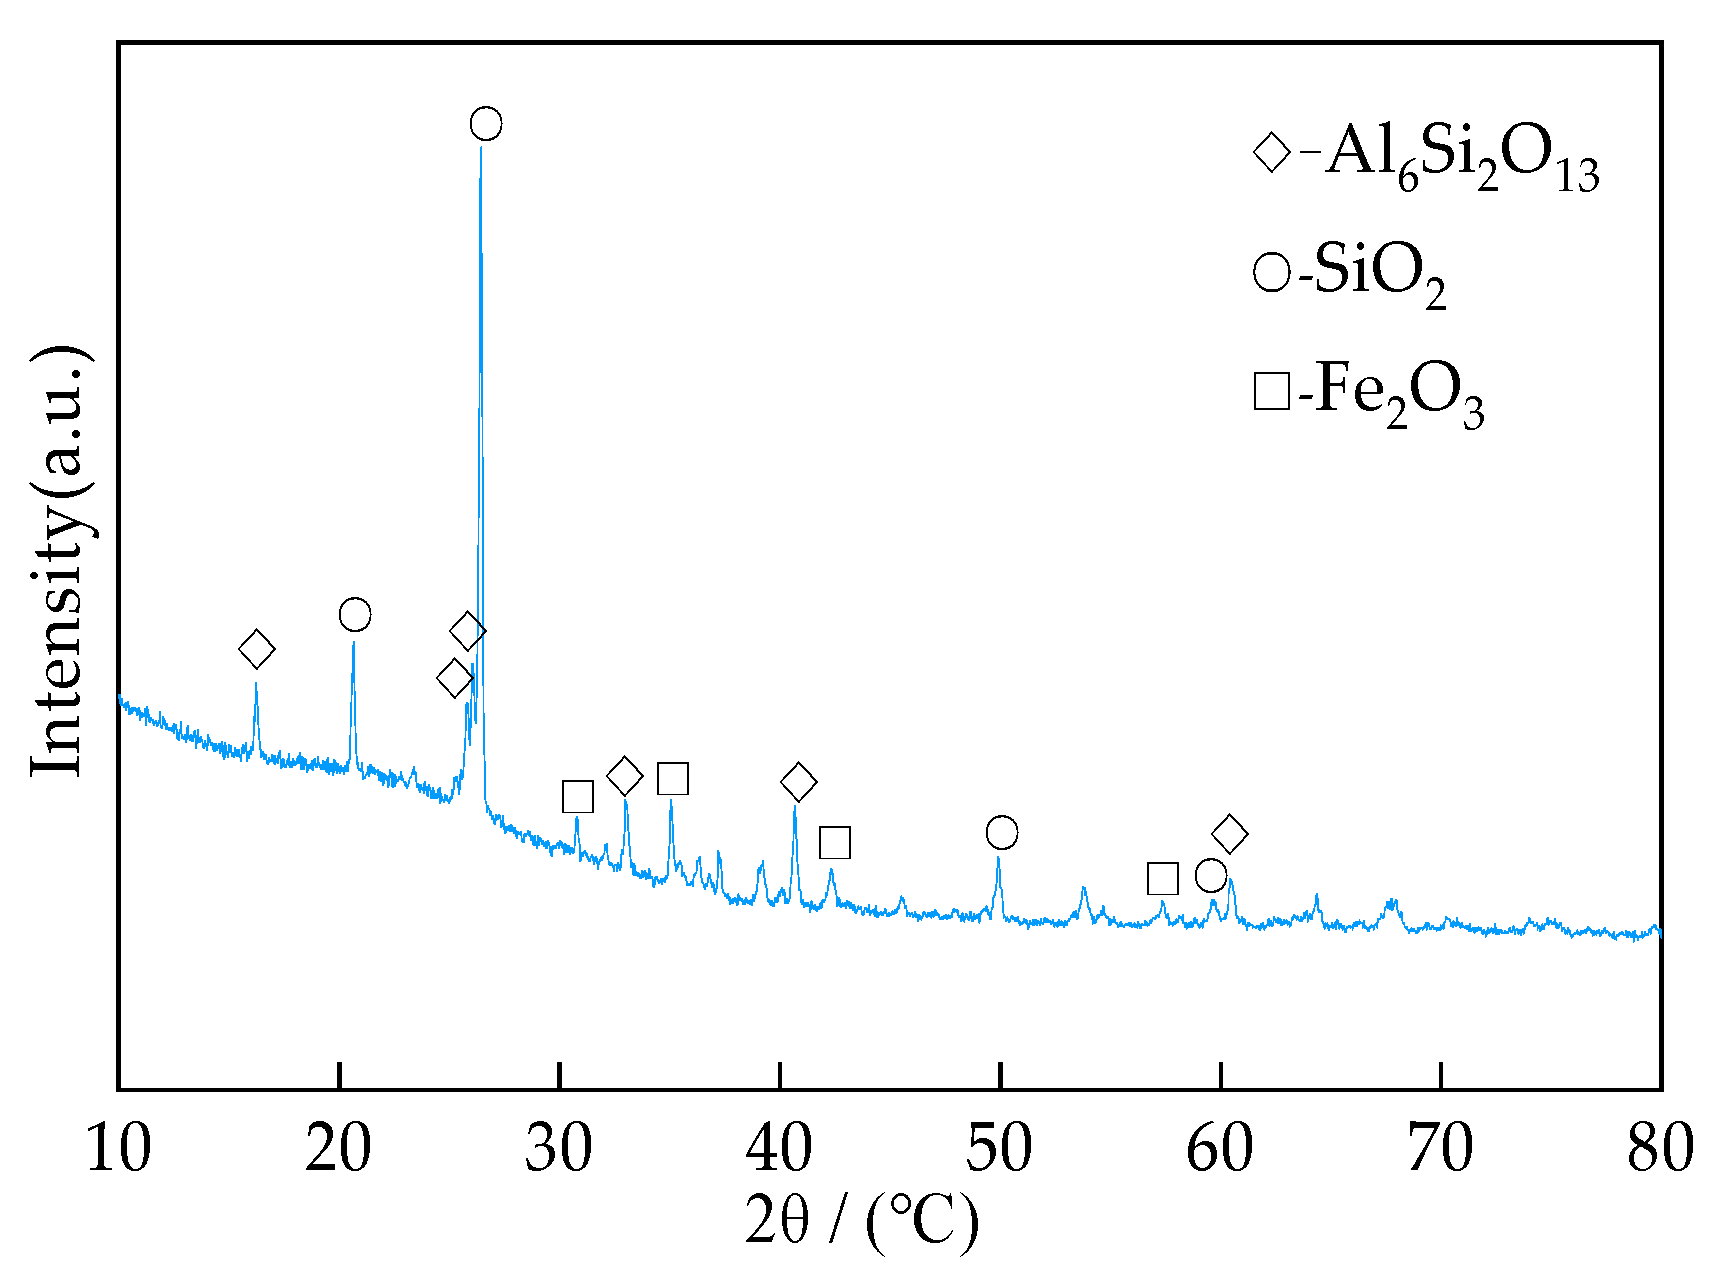
Figure 2.
XRD diagram of fly ash.

Figure 3.
XRD diagram of silica fume.

Figure 4.
The molecular formula of polycarboxylic acid.

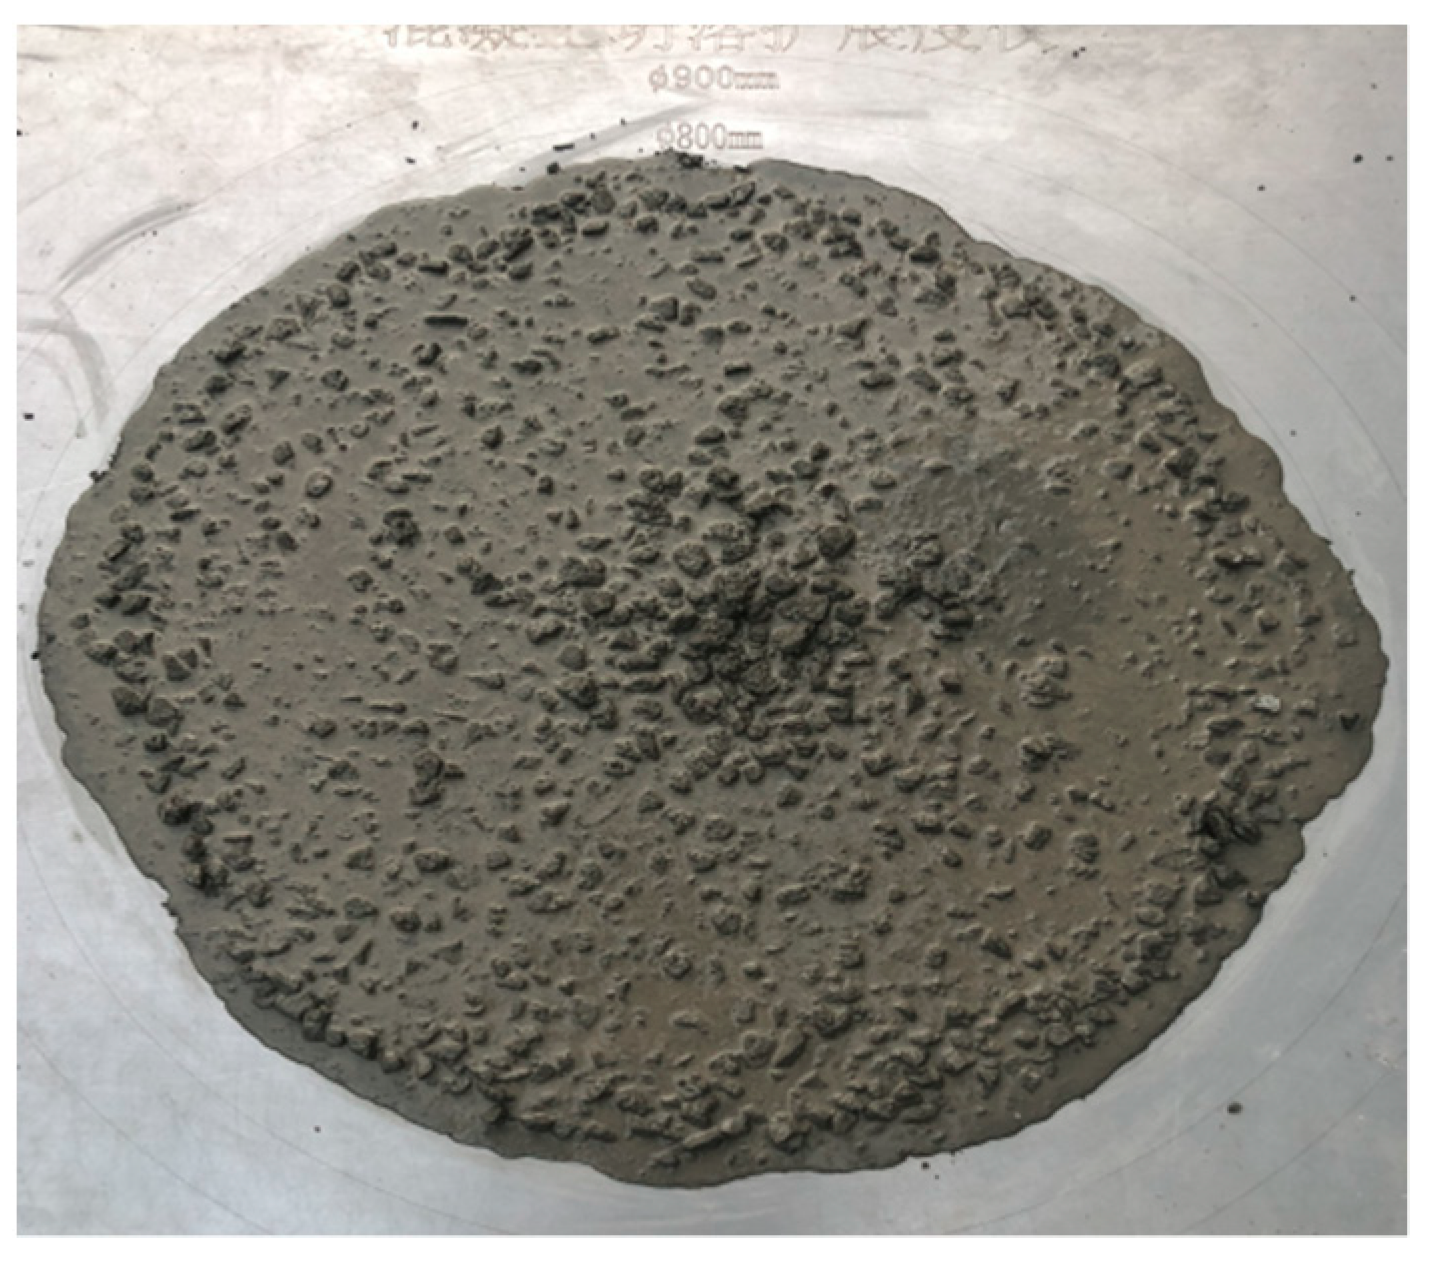
Figure 5.
The extending properties of self-compacting concrete (SCC).

Figure 6.
(a) Standard curing. (b) Tinfoil wrapping curing.

Figure 7.
The Compressive Strength of SCC.

Figure 8.
These are modified formulas of compressive strength of SCC with low fly ash and silica fume content. (a) Fitting formula with fly ash replacement rate of 0%; (b) fitting formula with fly ash replacement rate of 10% (c) fitting formula with fly ash replacement rate of 20%; (d) fitting formula with fly ash replacement rate of 30%.


Figure 9.
The relationship between compressive strength and coefficient a.

Figure 10.
Drawing of Steel Material Tensile Specimen.

Figure 11.
Loading device.

Figure 12.
In-line multi-cavity steel tube bundle self-compacting concrete shear wall.

Figure 13.
Multi-wave buckling of steel plate.

Figure 14.
Load-displacement curve of test piece.

Figure 15.
Relationship of steel.

Figure 16.
Stress distribution of concrete under peak load (MPa).

Figure 17.
Distribution of Steel under Peak Load (MPa).

Figure 18.
Position of each characteristic point (H/2) of multi-cavity steel tube section.

Figure 19.
Curves of inner and outer surfaces of web plate.

Figure 20.
Curve of middle point of internal baffle.

Figure 21.
Distribution of Concrete Characteristic Points (H/2).

Figure 22.
Longitudinal stress-strain relationship curves of concrete at various points under peak load.
Figure 22.
Longitudinal stress-strain relationship curves of concrete at various points under peak load.


Table 1.
Physical Indexes of Cement.
| Setting Time(min) | Flexural Strength (MPa) | Compressive Strength (MPa) | Water Consumption for Normal Consistency (%) | |||
| initial setting | final setting | 3 d | 28 d | 3 d | 28 d | |
| 200 | 245 | 5.64 | 8.71 | 25.48 | 42.67 | 27.73 |
Table 2.
Chemical composition of Cement.
| Composition | SiO2 | Al2O3 | CaO | Fe2O3 | MgO | SO3 | P2O5 | Na2O | K2O |
|---|---|---|---|---|---|---|---|---|---|
| Content (%) | 22.46 | 7.60 | 57.15 | 5.00 | 1.54 | 2.96 | 0.11 | 0.31 | 0.86 |
Table 3.
Physical Indexes of Fly Ash.
| Projects | Fineness (%) | Moisture Content (%) | Loss on Ignition (%) | Water Demand Ratio (%) | 28d Activity Index (%) |
|---|---|---|---|---|---|
| Estimated value | 17.90 | 0.32 | 2.08 | 100.00 | 72.50 |
| Standard value | ≤25.00 | ≤1.00 | ≤8.00 | ≤105.00 | - |
Table 4.
Chemical composition of fly ash.
| Composition | SiO2 | Al2O3 | CaO | Fe2O3 | MgO | SO3 | TiO2 | K2O |
|---|---|---|---|---|---|---|---|---|
| Content (%) | 40.9 | 23.7 | 9.4 | 11.3 | 4.16 | 3.27 | 0.105 | 2.8 |
Table 5.
Chemical Composition and Physical Indexes of silica fume.
| Chemical Composition (%) | Fineness(m2/kg) | 28d Activity Index (%) | ||||||
| SiO2 | Al2O3 | Fe2O3 | CaO | MgO | K2O | Na2O | ||
| 92.00 | 0.30 | 0.80 | 0.40 | 0.30 | 0.90 | 0.20 | 18,000.00 | 95.00 |
Table 6.
Mix Proportion of SCC (kg/m3).
| Mix Code | Cement | Fly Ash | Silica Fume | Coarse Aggregate | Fine Aggregate | Water Reducer | Water |
|---|---|---|---|---|---|---|---|
| SFSCC0 | 540.36 | 0.00 | 13.55 | 867.20 | 790.19 | 2.33 | 198.41 |
| SFSCC10 | 486.32 | 54.04 | 13.55 | 867.20 | 790.19 | 2.33 | 198.41 |
| SFSCC20 | 432.29 | 108.07 | 13.55 | 867.20 | 790.19 | 2.33 | 198.41 |
| SFSCC30 | 378.41 | 162.01 | 13.55 | 867.20 | 790.19 | 2.33 | 198.41 |
| SFSCC40 | 324.22 | 216.15 | 13.55 | 867.20 | 790.19 | 2.33 | 198.41 |
Table 7.
Relationship between Coefficient a and Compressive Strength.
| NO. | GFSCC0 | GFSCC10 | GFSCC20 | GFSCC30 |
|---|---|---|---|---|
| fcu,28 (MPa) | 42.350 | 43.925 | 44.340 | 45.933 |
| Coefficient a | 0.17738 | 0.20649 | 0.23065 | 0.27066 |
Table 8.
Mechanical Properties of Steel.
| Measured Thickness | Yield Strength | Tensile Strength | Elastic Modulus | Poisson’s Ratio | Elongation Rate |
|---|---|---|---|---|---|
| ts (mm) | fy (MPa) | fu (MPa) | Es (×105 MPa) | μs | δs |
| 2.70 | 340.00 | 505.50 | 2.06 | 0.24 | 0.35 |
© 2019 by the authors. Licensee MDPI, Basel, Switzerland. This article is an open access article distributed under the terms and conditions of the Creative Commons Attribution (CC BY) license (http://creativecommons.org/licenses/by/4.0/).
Share and Cite
MDPI and ACS Style
Li, H.; Sun, H.; Zhang, W.; Gou, H.; Yang, Q. Study on Mechanical Properties of Self-Compacting Concrete and Its Filled in-Line Multi-Cavity Steel Tube Bundle Shear Wall. Energies 2019, 12, 3466. https://doi.org/10.3390/en12183466
AMA Style
Li H, Sun H, Zhang W, Gou H, Yang Q. Study on Mechanical Properties of Self-Compacting Concrete and Its Filled in-Line Multi-Cavity Steel Tube Bundle Shear Wall. Energies. 2019; 12(18):3466. https://doi.org/10.3390/en12183466
Chicago/Turabian StyleLi, Hongbo, Hao Sun, Wanlong Zhang, Huiyan Gou, and Qiuning Yang. 2019. "Study on Mechanical Properties of Self-Compacting Concrete and Its Filled in-Line Multi-Cavity Steel Tube Bundle Shear Wall" Energies 12, no. 18: 3466. https://doi.org/10.3390/en12183466
Note that from the first issue of 2016, this journal uses article numbers instead of page numbers. See further details here.