An Innovative Planning Method for the Optimal Capacity Allocation of a Hybrid Wind–PV–Pumped Storage Power System

1
College of Information and Electrical Engineering, China Agricultural University, Beijing 100083, China
2
China Electric Power Research Institute, Beijing 100192, China
*
Author to whom correspondence should be addressed.
Energies 2019, 12(14), 2809; https://doi.org/10.3390/en12142809
Submission received: 15 March 2019
/
Revised: 9 July 2019
/
Accepted: 9 July 2019
/
Published: 22 July 2019
Abstract
:In recent years, wind and photovoltaic power (PV) have been the renewable energy sources (RESs) with the greatest growth, and both are commonly recognized as the major driving forces of energy system revolution. However, they are characterized by intermittency, volatility and randomness. Therefore, their stable and efficient implementation is one of the most significant topics in the field of renewable energy research. In order to improve the stability of RESs and reduce the curtailment of wind and solar energy, this paper proposes an innovative planning method for optimal capacity allocation. On one hand, a new power generation system is introduced which combines a pumped storage power station with a wind farm and PV; on the other hand, the sequential Monte Carlo method is utilized to analyze the economy and reliability of the system under different capacity configurations considering investment cost, operating characteristics and influence factors of wind and solar energy. Then, optimal capacity allocation can be achieved. In summary, this proposed scheme provides an effective solution for the planning and construction of a new power generation system with RESs.
1. Introduction
Over the last decades, with the increasingly serious challenges caused by the energy crisis and climate change, more and more countries are choosing RESs, such as wind farms and PV, instead of fossil fuels in order to face the worsening problems. However, the negative effects which wind farms and PV have on the safe and economic operation of the power system because of their strongly intermittent, volatile and random characteristics should not be overlooked [1]. As a large-capacity energy storage resource, a pumped-storage power station can effectively mitigate the output power fluctuation of RESs. Also, the hybrid wind–PV–pumped storage power generation system is much more reliable and stable than a pure wind–PV system. Therefore, it is widely recognized as a better selection considering economy and reasonability factors [2].
The use of a pumped-storage power station is becoming a source of clean energy options for energy storage. Therefore, in recent years, several researchers have studied the operating principle of hybrid wind–PV–pumped storage systems. In [3,4,5,6], the optimum size, time arrangement, technical, and economic analysis of a hybrid wind–PV–pumped Storage system are studied. The Monte Carlo simulation is easy to implement and has been widely used for the reliability assessment of renewable energy storage, such as in [7,8,9]. Because it takes a lot of time for Monte Carlo to obtain the probability index by simulating the stochastic behavior of the actual physical system, it becomes complicated and unsuitable for planning research.
At present, there are several research results related to the optimal configuration of hybrid RESs and energy storage systems. In [10], a hybrid wind–PV–pumped storage system is established to simulate the impact of the hybrid system on energy performance in island grids. In [11], using seawater as a lower reservoir, a similar system is built up to study the impact of the capacity of the pumped storage unit and the upper reservoir on calculating the allowed capacity of RESs. In [12], four configuration schemes—wind–PV–storage, wind–PV–diesel, PV–storage–diesel and wind–storage–diesel systems—are compared and analyzed in detail in different aspects, such as the ratio of the RES’s installed capacity, the proportion of wind and solar abandonment, and the reliability of the power supply. However, the case study is only performed in an island grid. In [13], a standalone PV–wind–diesel–battery hybrid micro grid system model and its corresponding economics model are set up. Setting the minimum composite cost and expenses as the optimization objective, the optimal capacity configuration of different power resources is solved by the genetic algorithm. However, a power supply reliability analysis of the whole system is lacking. In [14], an optimal capacity allocation method of the standalone micro grid is proposed, and based on different public subsidies, the different benefits and costs of optimal capacity allocation under independent subsidy modes are analyzed. However, the focus of this paper is only on the cost analysis, and it thus lacks consideration of renewable energy efficiency. In [15], a benefit evaluation model is established to study the influence of energy storage configurations on the system reliability in an active distribution network. The reliability benefit ratio is proposed as the main index. However, the optimal capacity configuration of wind and solar is not discussed. In [16,17], the reliability assessment method of a distribution network is studied, and the authors introduce the application of the modified Monte Carlo method and sequential Monte Carlo method, respectively. However, effective measures to enhance the system economy are not mentioned. In [18,19], a kind of power curve modeling method is put forward to improve the accuracy of wind power prediction. However, in the planning stage, some key parameters of this method are not available.
In summary, all of the above literature has not really resolved the problem of how to realize the optimal capacity configuration of a wind–PV–pumped storage system in the planning stage in a way which not only guarantees the power supply reliability but also improves wind and solar energy efficiency. Based on the methods mentioned above, it is very difficult to avoid wind and solar abandonment in the process of system operation, and thus low investment efficiency is inevitable.
As a result, this paper proposes an innovative planning method, which establishes a comprehensive benefit model considering both the investment of various power resources and the operating efficiency of different RESs. By analyzing and testing individually the impact of the wind farm, PV and pumped storage capacity, a continual stable hybrid system and maximum system benefit could be both achieved.
2. The Topology of Hybrid RESs
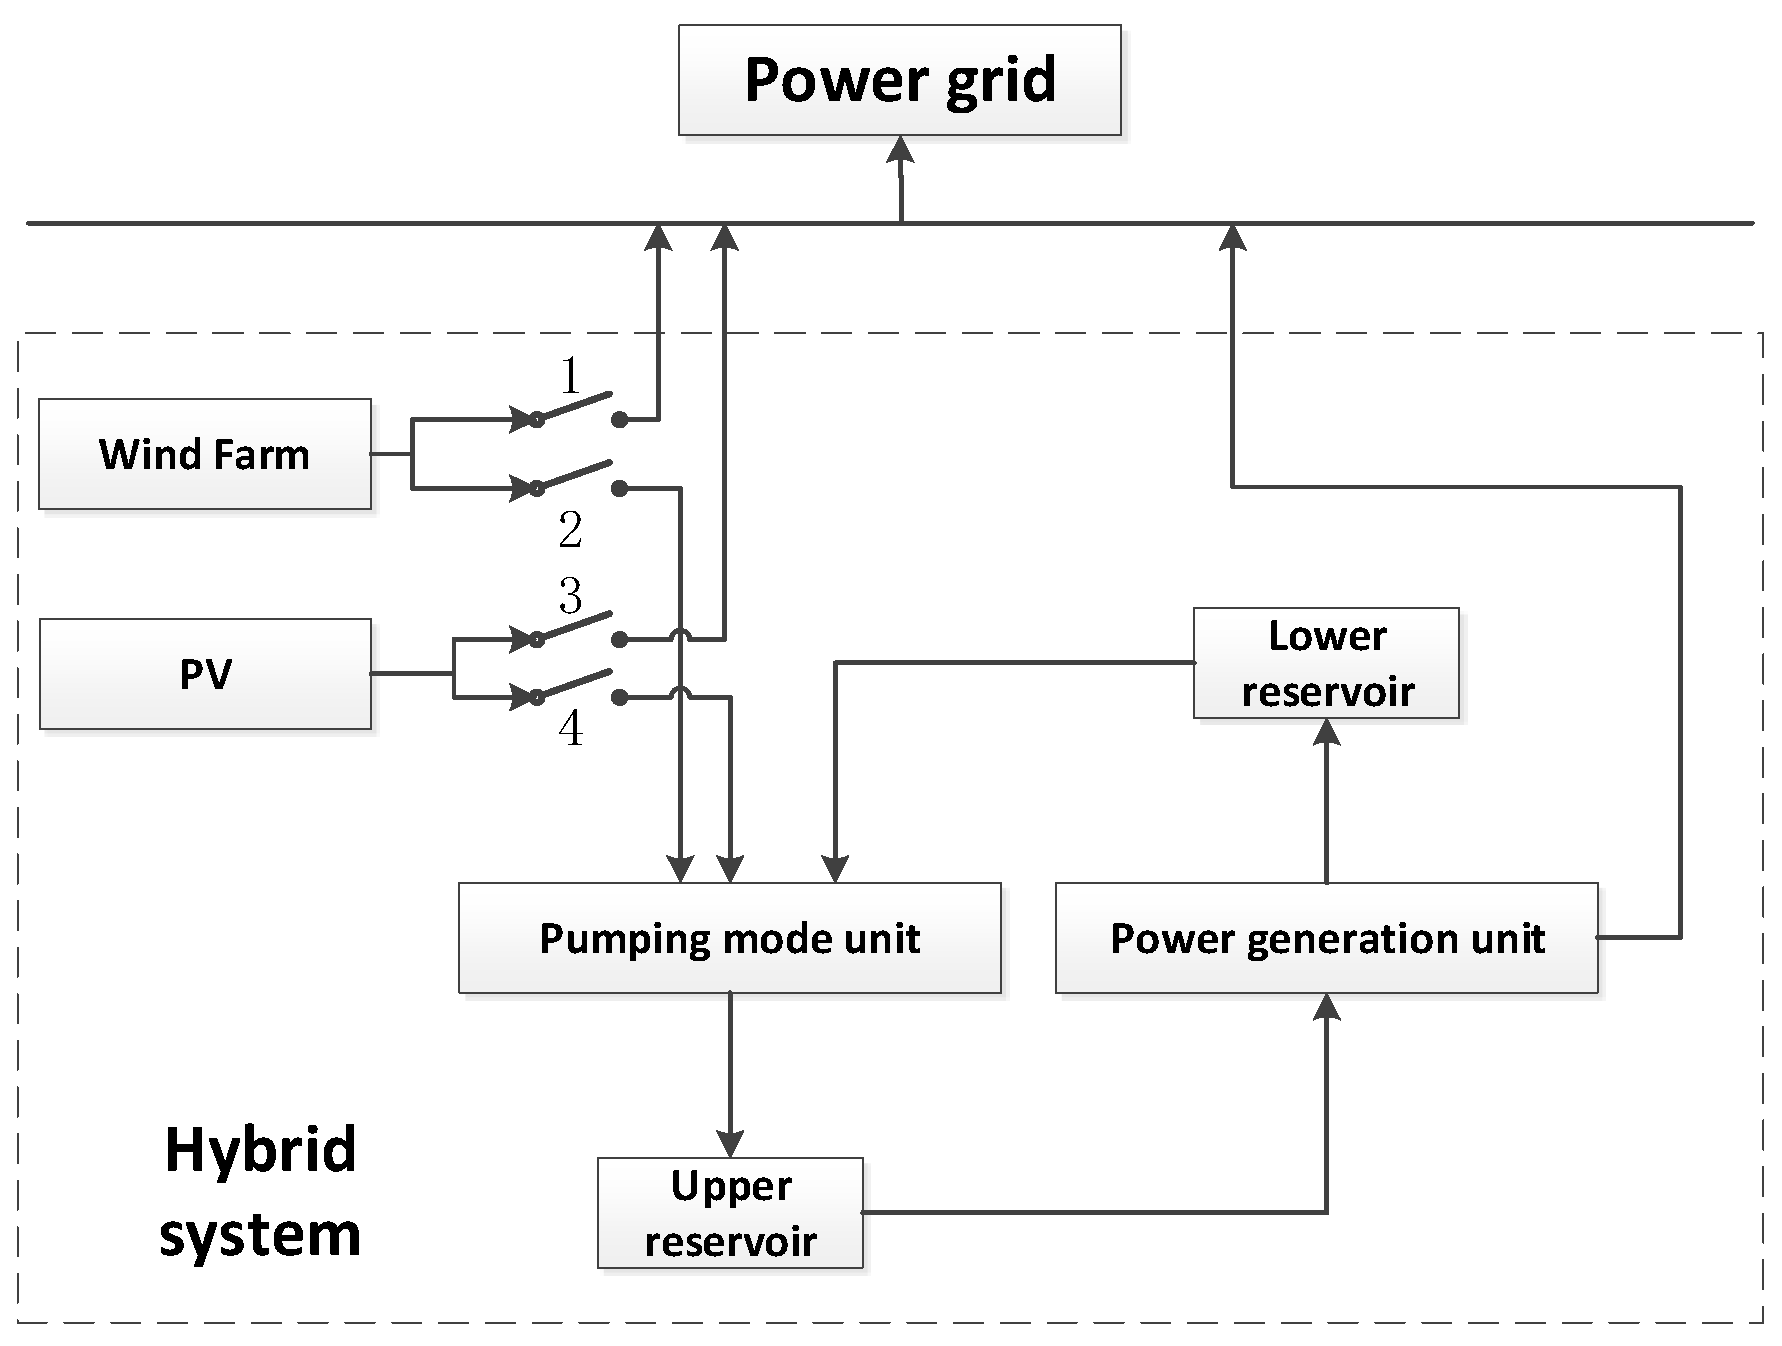
In order to reduce the amount of wind and solar abandonment, and improve the efficiency of wind and solar resources, this paper considers the hybrid wind–PV–pumped storage system as an equivalent generation unit for the large power grid, which provides a continuous and stable power supply to the customers. The topology of this hybrid wind–PV–pumped storage system is shown in Figure 1.
The output power of the wind farm and PV can be determined according to the wind speed and light intensity of a typical year; in addition, the pumped storage power station is used to balance this output power to obtain the maximum equilibrium output value of the hybrid system. Since the load forecasting data have not yet been obtained, the equilibrium output curve is treated as a special case of the load curve in this paper, and the correctness of the calculation method is not affected. Considering the power fluctuations, the feed-in tariff and the investment of the wind farm and PV, two kinds of coordination strategies are introduced.
Strategy 1: When the total output of the wind farm and PV exceeds the maximum equilibrium value of the hybrid system, PV is preferred to pump in water for the pumped storage power station. In addition, when the total output of the RESs is more than the range of the pumped storage capacity, solar abandonment should have priority over wind.
Strategy 2: When the total output of the wind farm and PV exceeds the maximum equilibrium output of the hybrid system, the wind farm is preferred to pump in water to store energy. In addition, when the total output of the RESs is more than the range of the pumped storage capacity, wind abandonment should have priority over PV.
3. Optimal Capacity Configuration Model
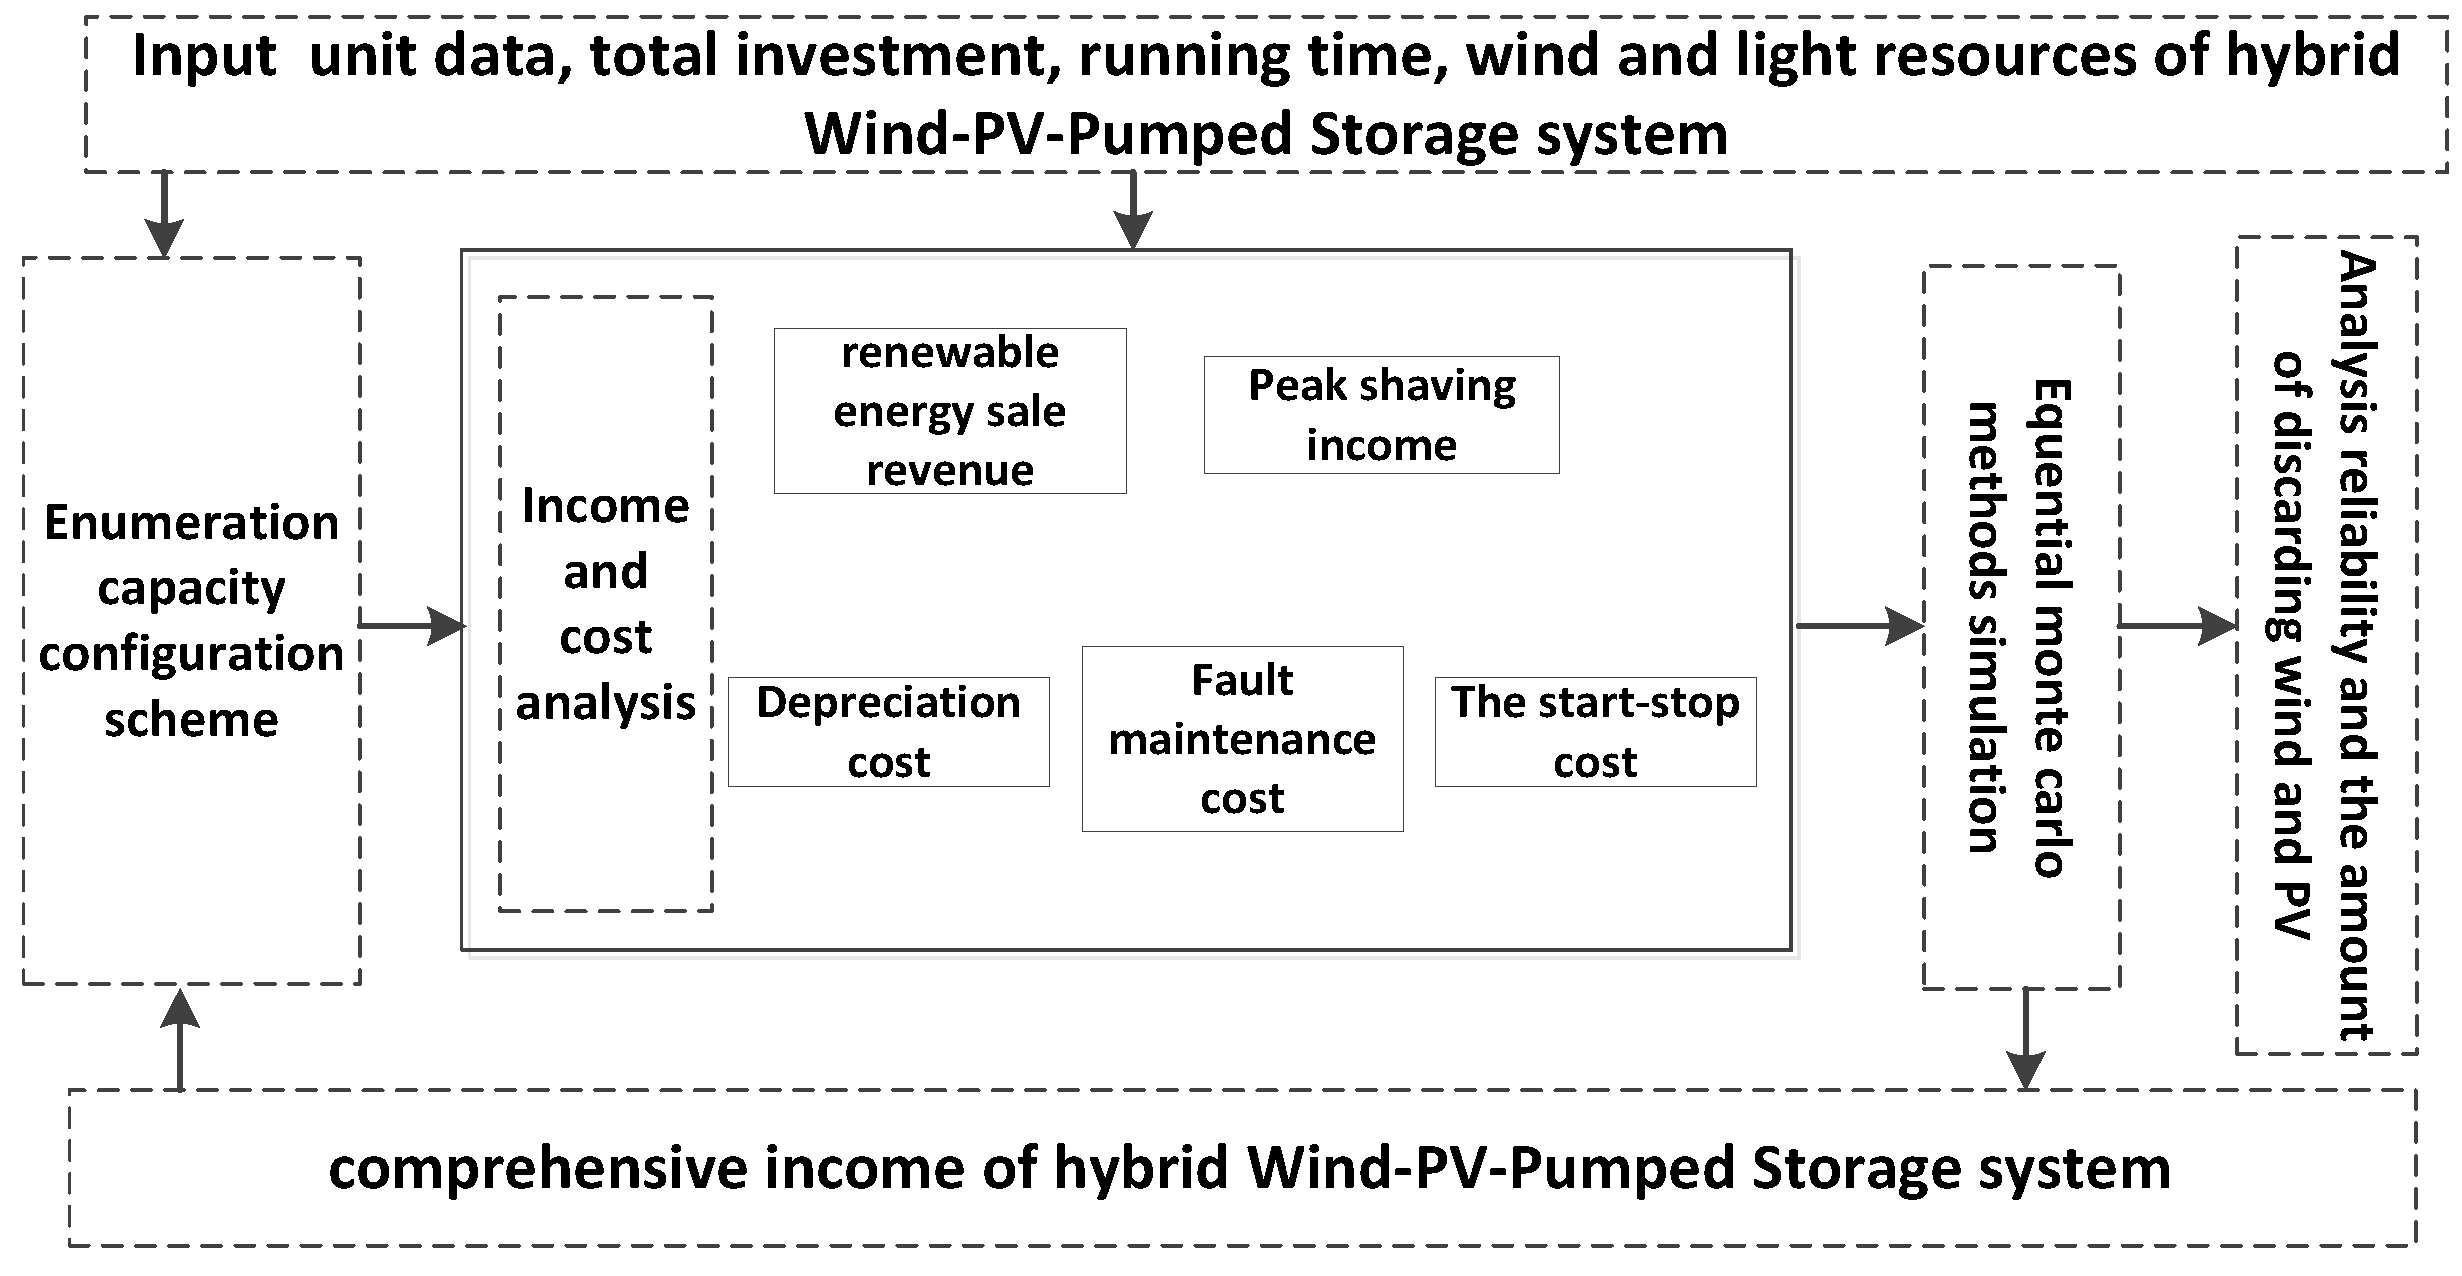
The flow diagram of the optimal capacity configuration method for the hybrid wind–PV–pumped storage system is constructed and presented as shown in Figure 2. The enumeration method and sequential Monte Carlo method are used to calculate the comprehensive benefits under different capacity configurations by taking into consideration the electricity on-grid profits, peak shaving ability, investment allocation, fault maintenance and generation unit start–stop. In this case, the calibration of the system reliability of new energy power stations is calculated. This specific model is introduced in detail in the following sections.
3.1. Objective Function
The objective function is set as follows:
where F is the comprehensive benefit; Fx is the renewable energy sale revenue; Ft is the peak shaving income; Fz is the depreciation cost; Fw is the generation unit maintenance cost; and Fqt is the start–stop cost of the pumped storage unit.
1. Renewable energy sale revenue
The definition of renewable energy sale revenue is the electricity sale income from the renewable energy, which is connected to the power grid.
where Sf and Sg are the on-grid electricity prices of wind and PV, respectively, and Ef and Eg are the on-grid power of wind and PV, respectively.
2. Peak shaving income
The peak shaving income refers to the sale revenue of the pumped storage energy, which is the power when the renewable energy exceeds the maximum equilibrium output power. This paper only considers the profit after the energy conversion of RESs and the pumped storage power station, without regard to the different prices in peaks and valleys.
where Etf and Etg are the wind and PV amount used for pumping in water, respectively, and η is the generation efficiency of the pumped storage station.
3. Depreciation cost
The depreciation cost refers to the cost calculated by the straight-line method based on the total investment of the wind–PV–pumped storage system.
where C is the total investment; θ is the residual rate; and a is the depreciation period.
4. Fault maintenance cost
The fault maintenance cost refers to the cost of repairing wind and PV units after failure.
where ngf and ngg, respectively, indicate the failure number of the wind turbine and PV, and Sxf and Sxg, respectively, represent the average maintenance cost of the wind turbine and PV at each time.
5. The start–stop cost
The start–stop cost refers to the cost of the pumped storage unit start–stop [20].
where Sq and St, respectively, represent the cost for starting up and shutting down the pumped storage unit; nq and nt, respectively, indicate the start–stop times within the time limit.
3.2. Constraint Conditions
3.2.1. Total Investment Cost Constraints
The total investment cost includes the unit cost and construction cost of the wind farm, PV and pumped storage unit. For convenience of calculation, the unit and related construction cost are combined together into the unit capacity cost. The calculation formula is shown in Formula (7).
where Cf, Cg, and Cx are, respectively, the unit capacity cost of wind power, PV and the pumped storage power station; Rf, Rg and Rx are, respectively, the unit capacity of wind power, PV and the pumped storage unit; and nf, ng and nx are, respectively, the number of wind turbines, PVs and pumping storage units.
3.2.2. Wind Power and PV Output Constraints
In this paper, wind power output is mainly calculated by the mechanism modeling method according to the typical annual wind speed of the planned place [21]. Considering the influence of wind speed fluctuation on the output power, the relationship between them can be deduced as follows:
where vci, vr and vco are the cut-in wind speed, rated wind speed and cut-out wind speed, respectively, and Pr is the rated output power of the wind turbine.
Similarly, according to the typical annual solar intensity, the PV output can be approximately considered as proportional to the solar intensity and PV module area. The relationship can be expressed as Equation (9):
where r is the solar intensity; A is the total area of the PV module; and η0 is the total efficiency of the PV generation system. η0 = η1·η2, where η1 is the total PV conversion efficiency and η2 is the efficiency of the PV power inverter.
Thus, the total output at each moment of the wind farm and the PV can be expressed as Equations (10) and (11).
3.2.3. Pumped Storage Unit Output Constraints
Considering the capacity of the pumped-storage machine and the minimum operation power, the output of the pumped-storage unit can be obtained [18].
When , the pumping power is as shown in Equation (12).
When , the generated power is as shown in Equation (13).
where α denotes the minimum power factor of the pumped storage unit in the pumping mode, and β denotes the minimum power factor of the pumped storage unit in the generating mode. Meanwhile, because the current national policy requires the limiting of wind and solar abandonment, the equilibrium output can be obtained according to Formula (14).
where Pj is the equilibrium output of the hybrid system; T is the total simulation time, set as one year in this paper; and η is the conversion coefficient between the pumping and generating mode of the pumped storage unit.
3.2.4. Storage Constraints
3.2.5. Quadratic Constraints
The entire pumped storage power station can only be operated separately in pumping or generating modes, as for the same net output, the energy loss is too great when the system works in the two modes at the same time. Therefore, the two processes of pumping and power generating can be decoupled, or a flag variable can be set to indicate whether the station is currently in pumping or generating mode. That is, at any time, one of the pumping and generating units should be zero, as shown in Equation (16) [22].
where nxc, nxf, respectively, represent the unit number in the pumping mode and generating mode; and and , respectively, represent the positive operating power in different working modes.
3.3. Optimal Configuration Algorithm Flow Diagram
In [23], a multi-state probability model of a reservoir was proposed based on a pumped storage unit, combined with analysis technology to evaluate the reliability index of the hybrid system, and its calculation efficiency is high. Considering the possibility of wind and PV failures, in order to simulate the operating state and reliability of the hybrid system, the sequential Monte Carlo method is used in this paper to evaluate the system reliability after capacity configuration. Since the data in the planning stage only support the calculation of the probability of loss of load and the expected value of the shortage of electricity, this paper only uses these two indicators here. It is generally considered that the normal working duration and fault repair time of wind turbines and photovoltaic units are subject to exponential distribution, and the sampling values of the state duration using the sequential Monte Carlo method are shown in Equation (17).
where Ri is a random number distributed in [0, 1] corresponding to the unit i. When the current state is the normal working state, r is equal to the failure rate λ, and MTT is the average failure time; when the current state is the failure outage state, r is the repair rate μ, and MTT is the average repair time.
Two reliability indicators as well as the wind and solar curtailment ratio can be calculated by Equations (18)–(20).
where LOLP is the probability of load loss; EENS is expectation of insufficient power; Q is the wind and solar curtailment ratio; LLDi, ENSi are the duration and the total amount of power shortage in the sampling year i; Qi is the amount of wind and solar curtailment in sampling year i; N is the total number of sampling years; and T is the total duration of the sample year.
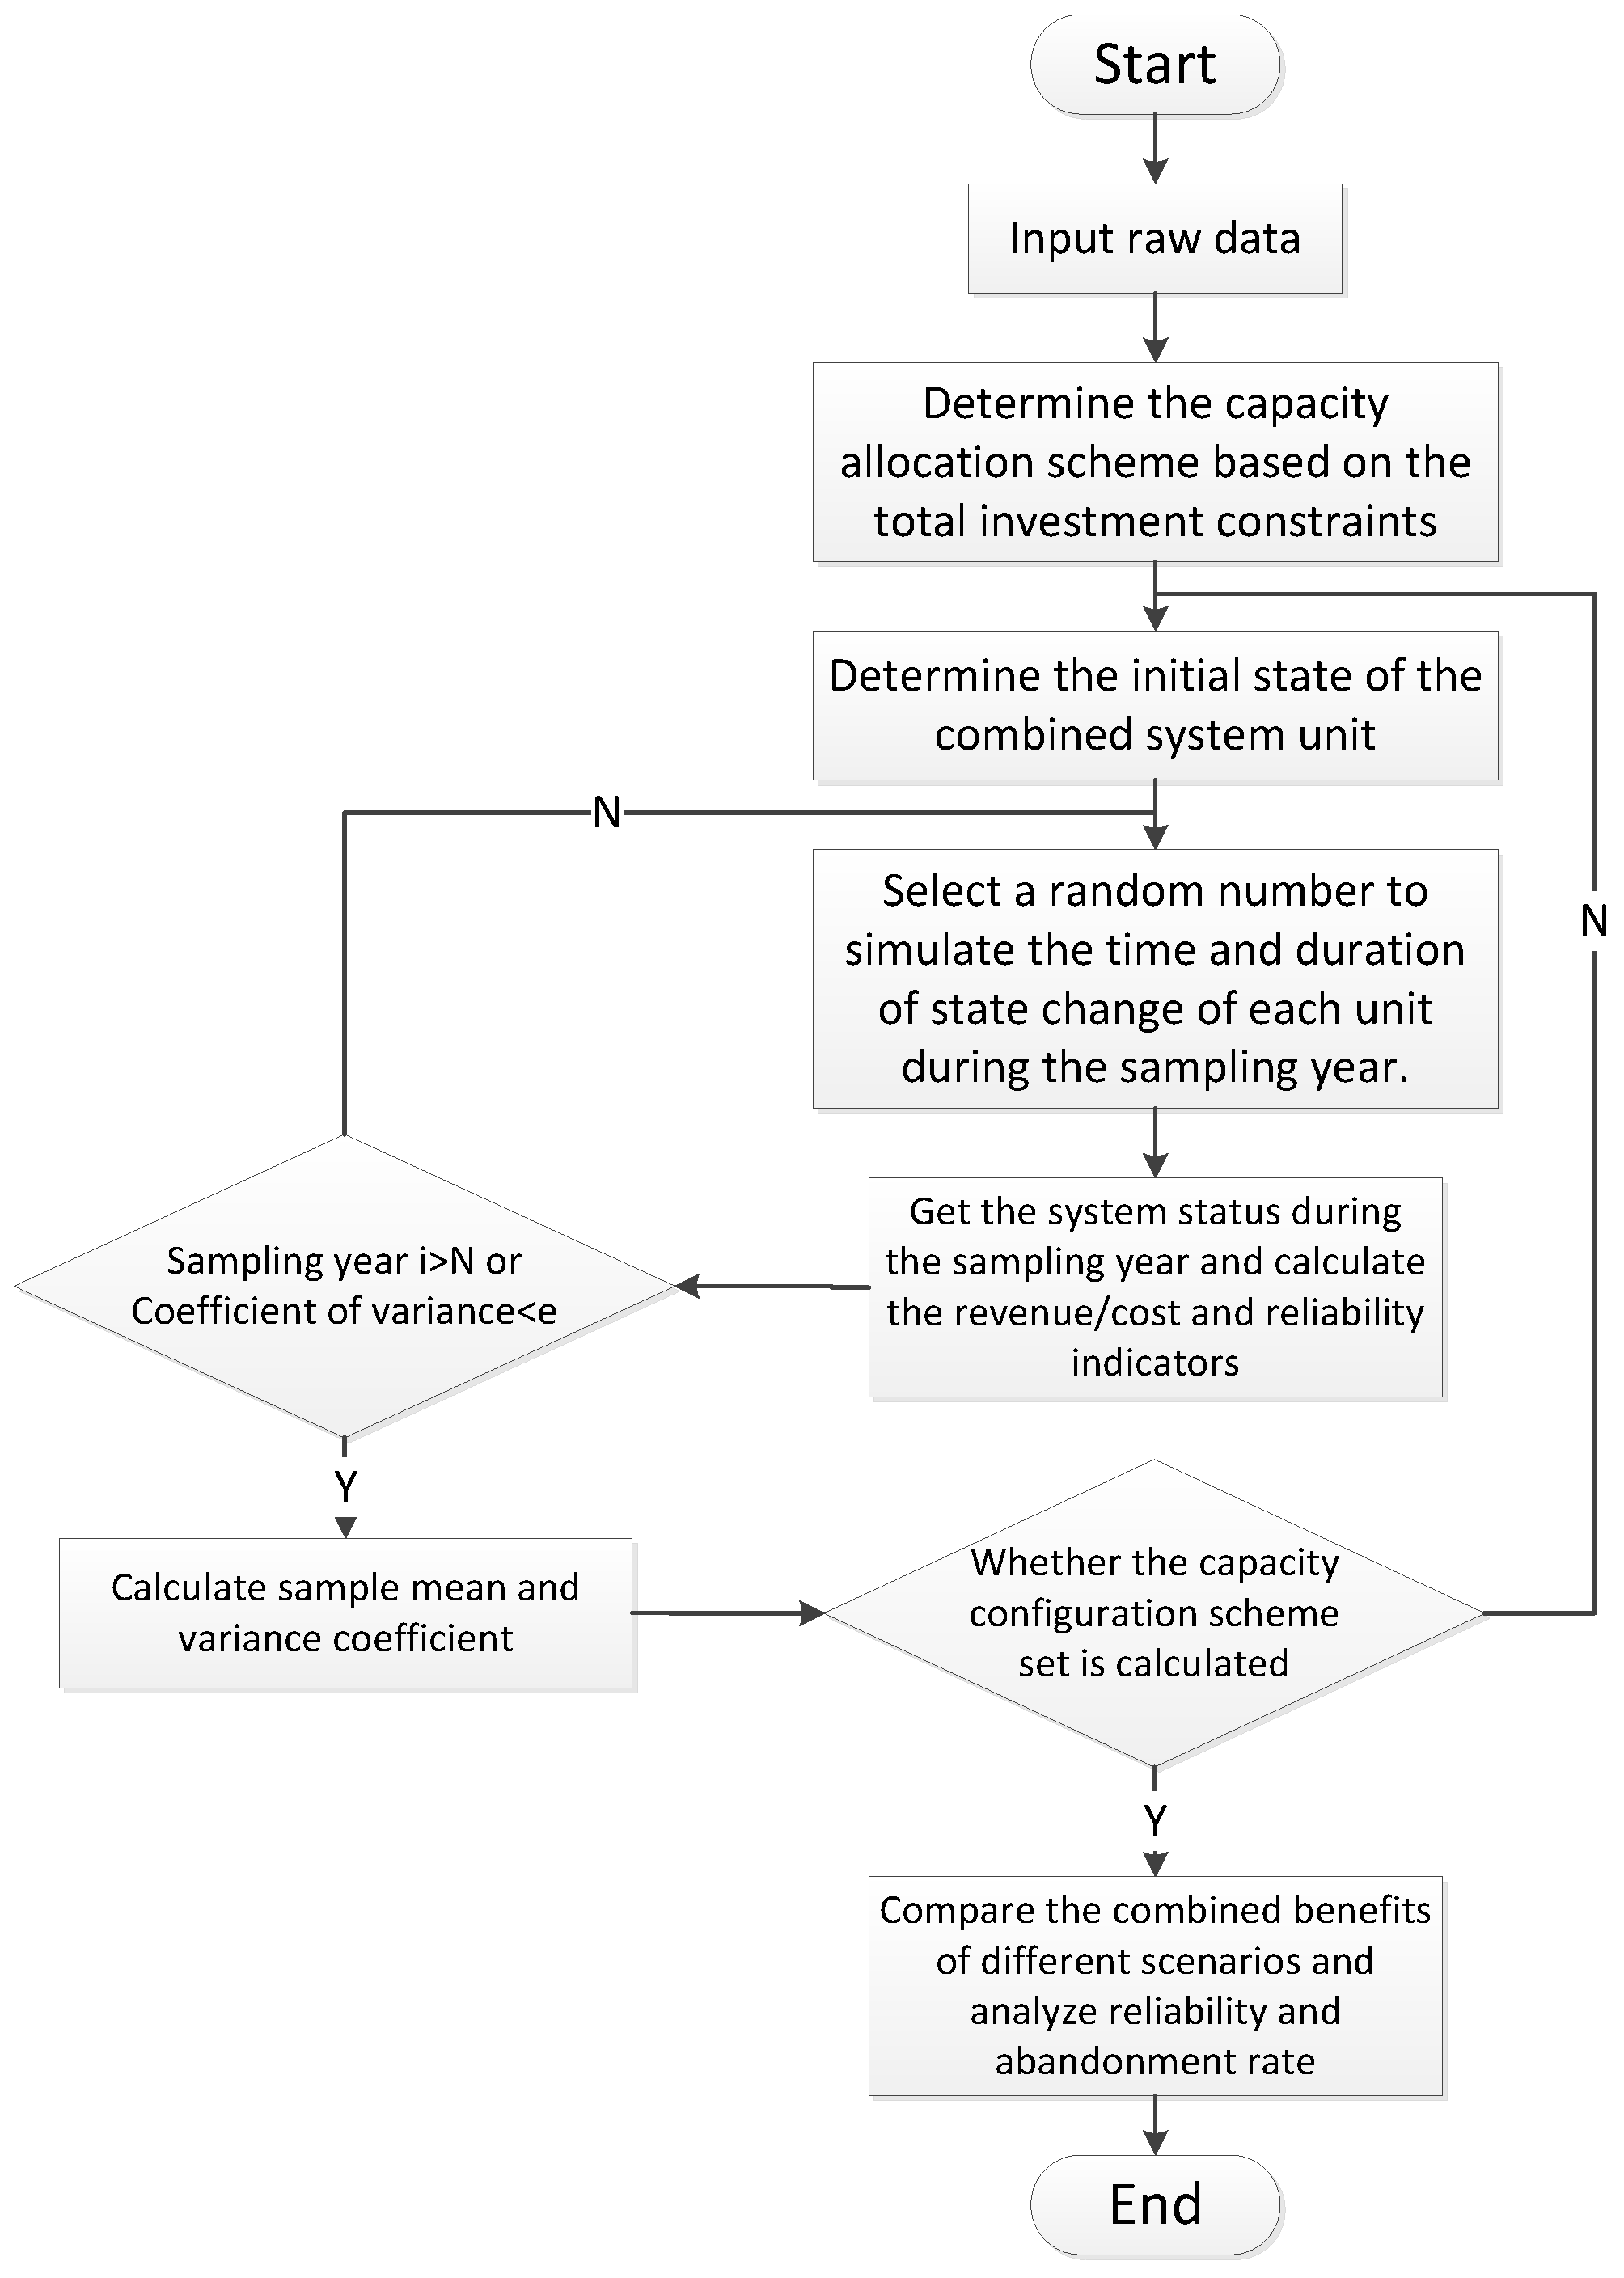
The flow diagram of this optimal capacity allocation planning method is shown in Figure 3.
- (1)
- Input raw data, such as the typical annual wind speed and light intensity, the unit configuration data of each power station, the total equipment investment and the on-grid price of renewable energy.
- (2)
- According to the total investment constraints, the enumeration method is utilized to formulate the capacity allocation plan for the whole hybrid system.
- (3)
- A comprehensive benefit model is established considering the investment of the renewable energy power station, on-grid income, the possibility of unit failure, and the adjustment capacity of the pumped storage unit.
- (4)
- The sequential Monte Carlo method is used to simulate the failure possibility and actual output of the renewable energy unit, and the comprehensive benefits of each scheme are calculated.
- (5)
- When the calculation of all capacity allocation schemes is completed, a comprehensive analysis is carried out based on different indicators, such as the system reliability and wind/solar abandonment rate.
Through this method, considering the investment cost, failure rate of wind turbines and PV arrays, the start–stop of the pumped storage unit and the on-grid electricity price of wind power and PV, the comprehensive benefit calculation is carried out for the wind–PV–pumped storage system, which can guarantee stable output under certain wind and solar resources. At the same time, the sequential Monte Carlo method is used to analyze the reliability index and the wind and solar curtailment rate of different capacity configurations. Then, the optimal capacity allocation scheme considering both economy and reliability is obtained. Based on this scheme, the hybrid renewable energy system can effectively utilize wind and solar resources to provide a continuous and stable output to the large power grid.
4. Case Study
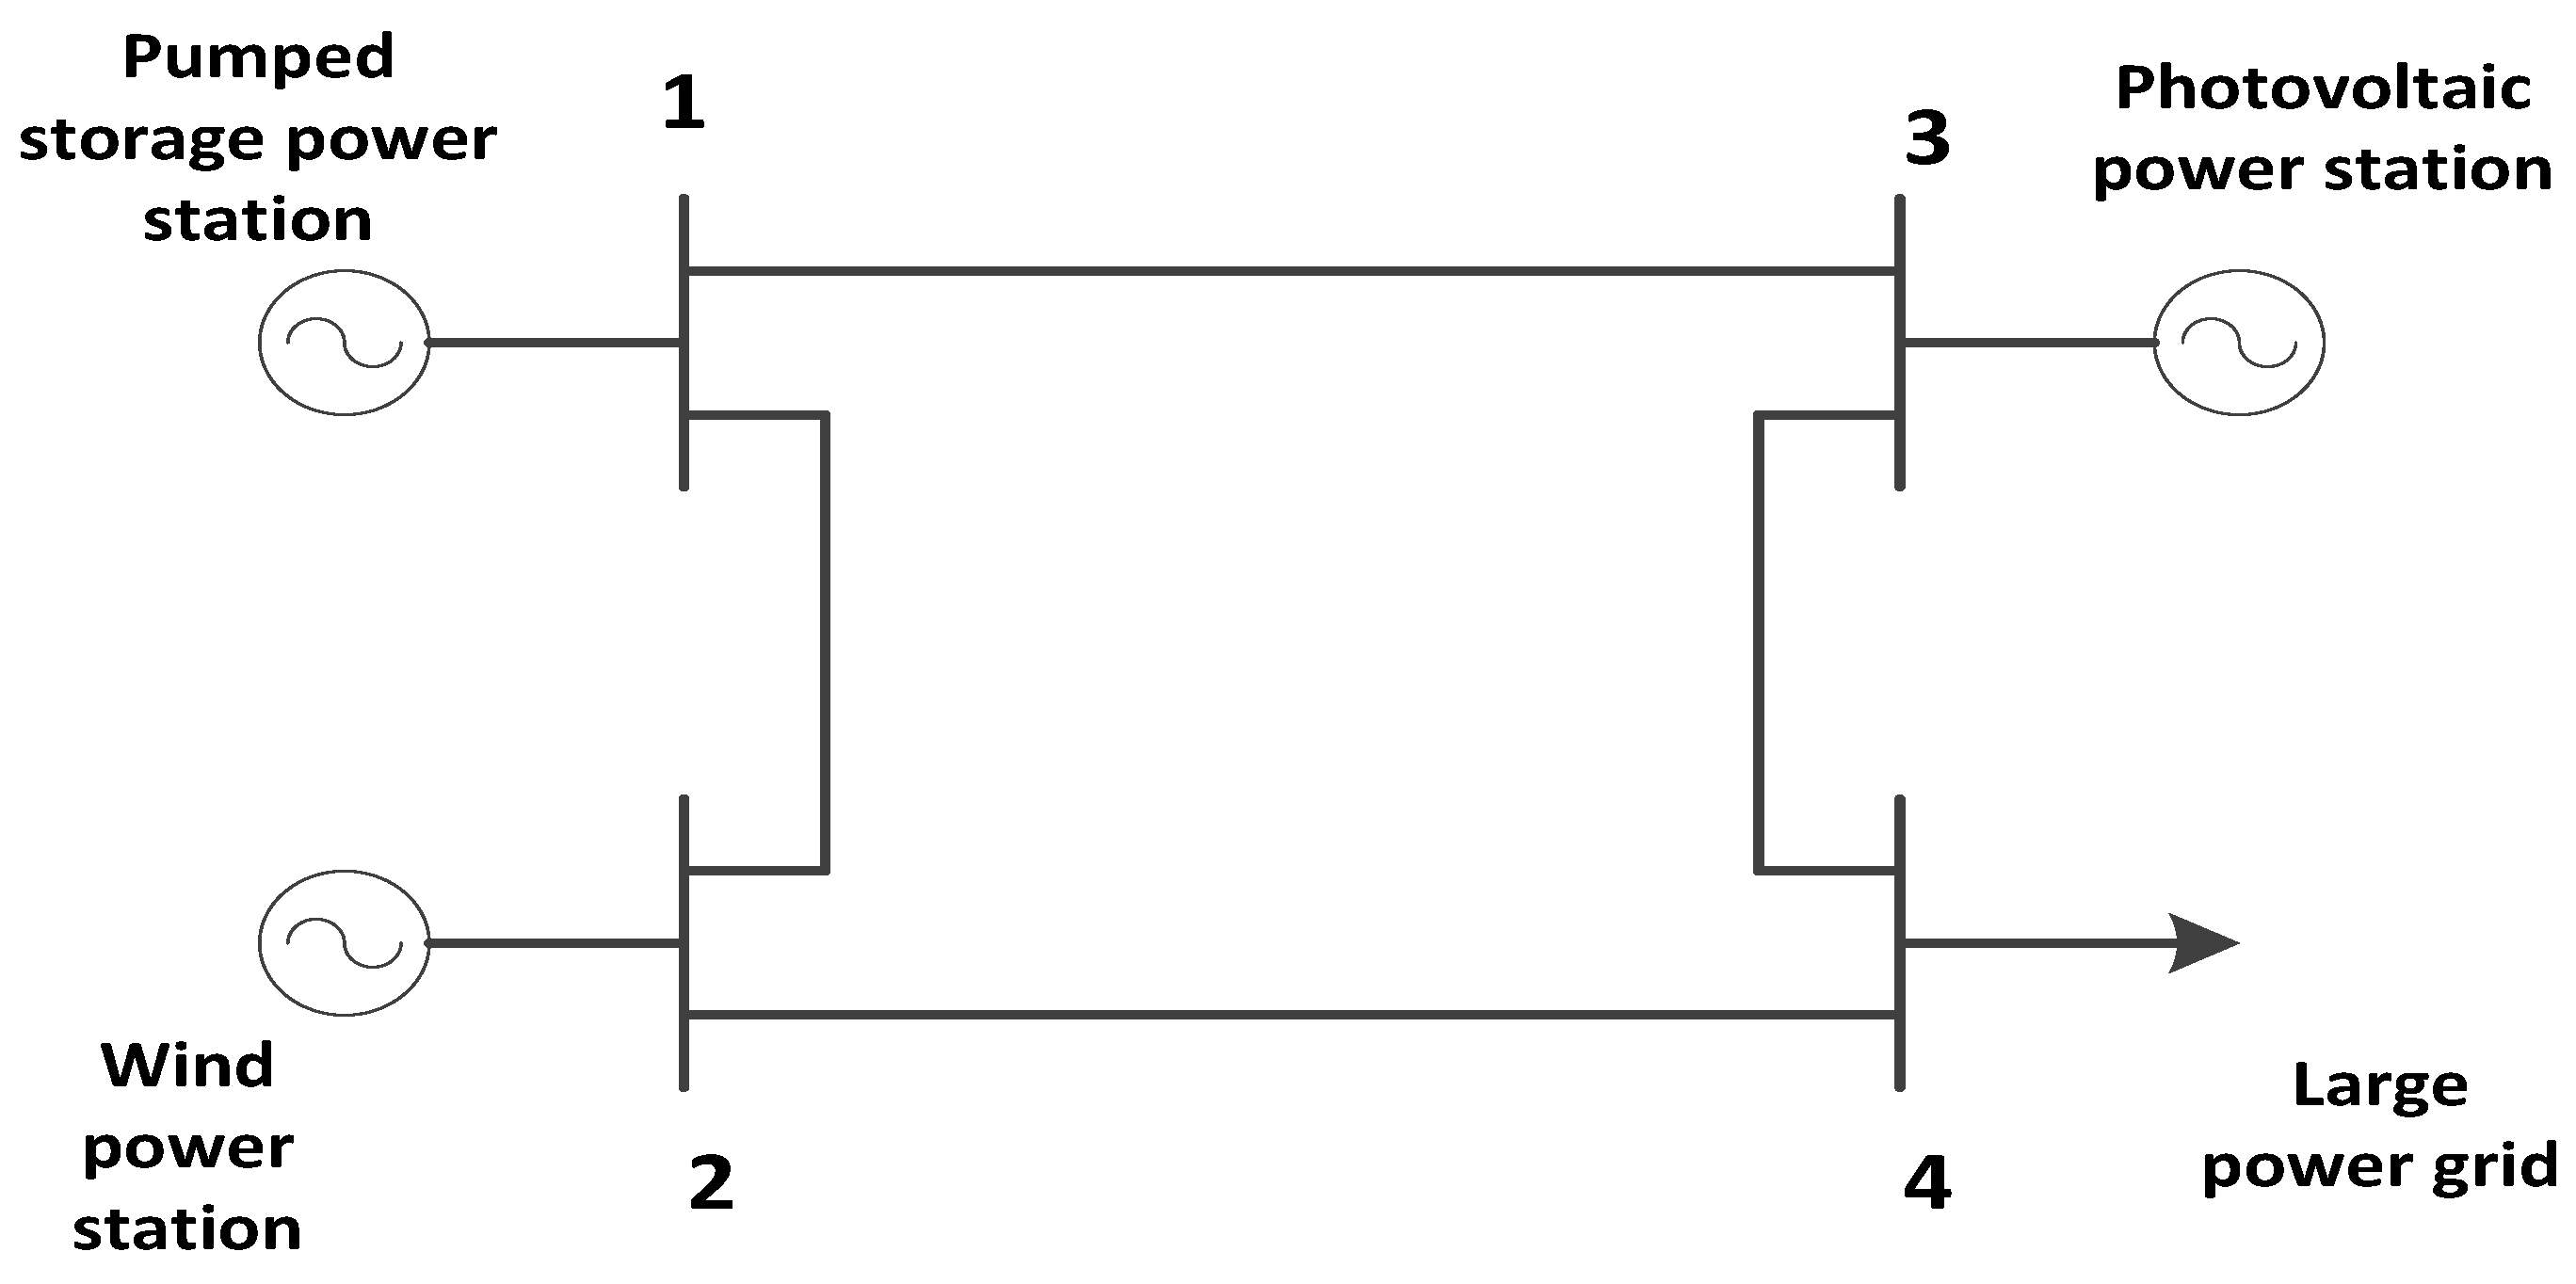
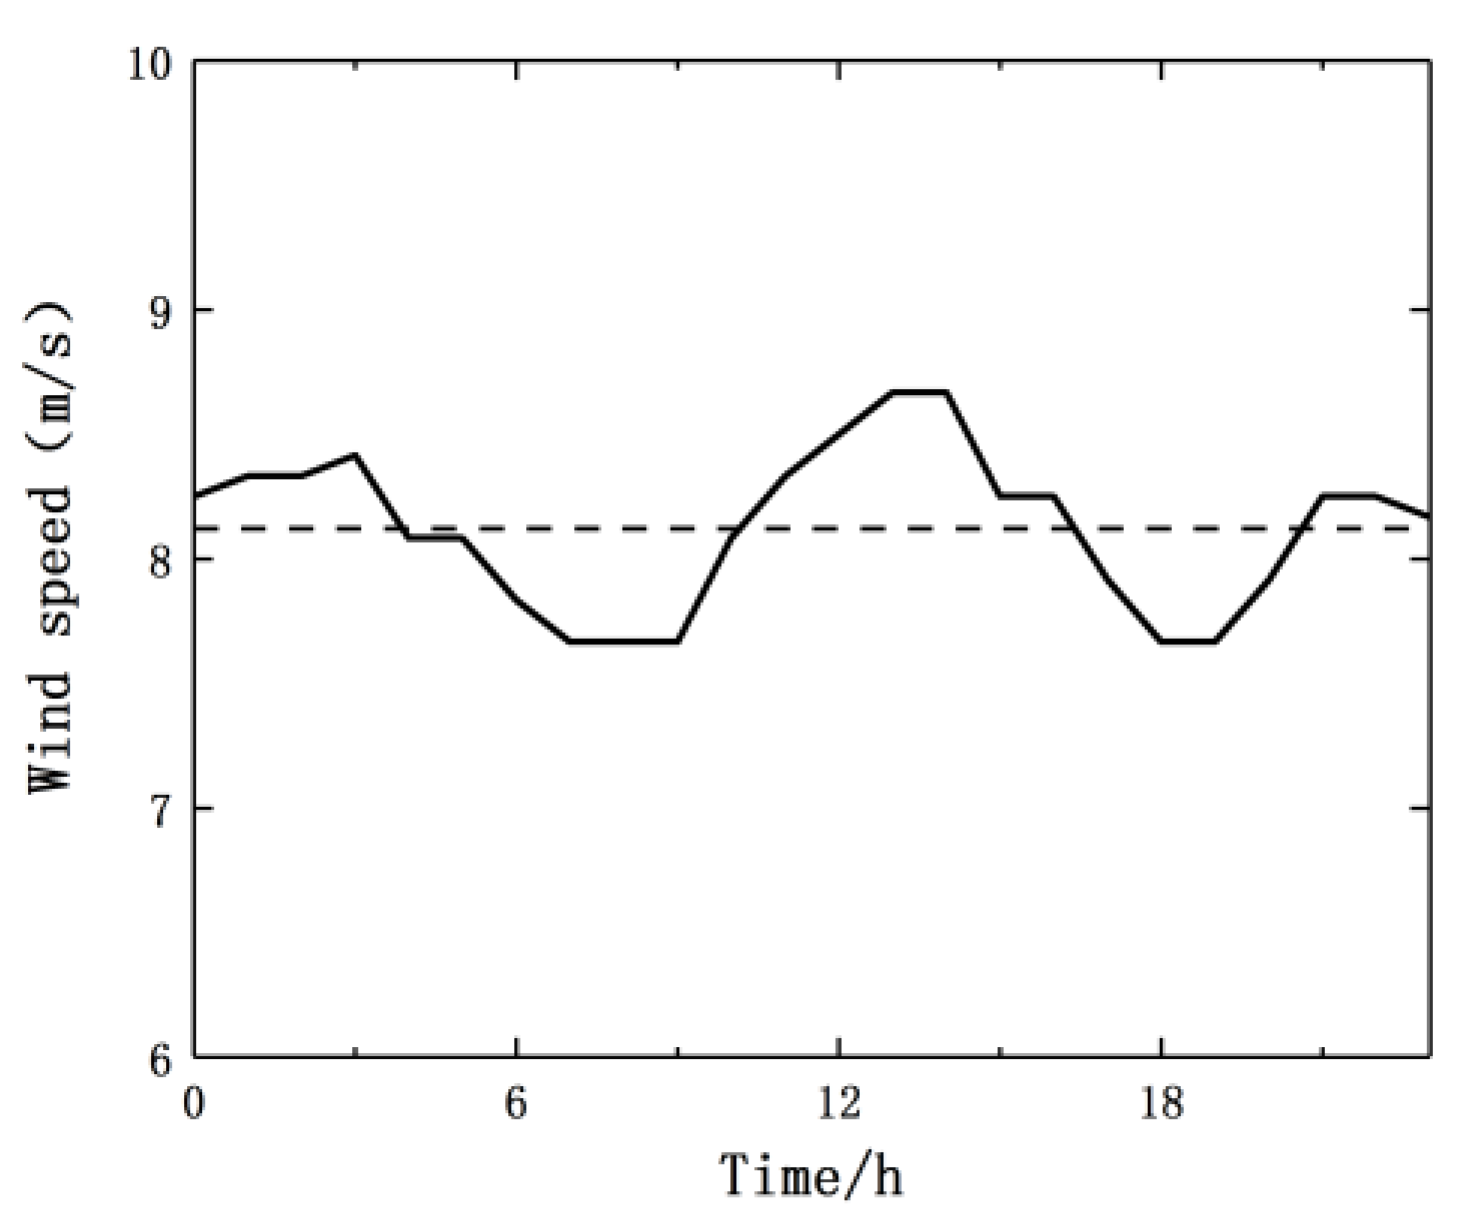
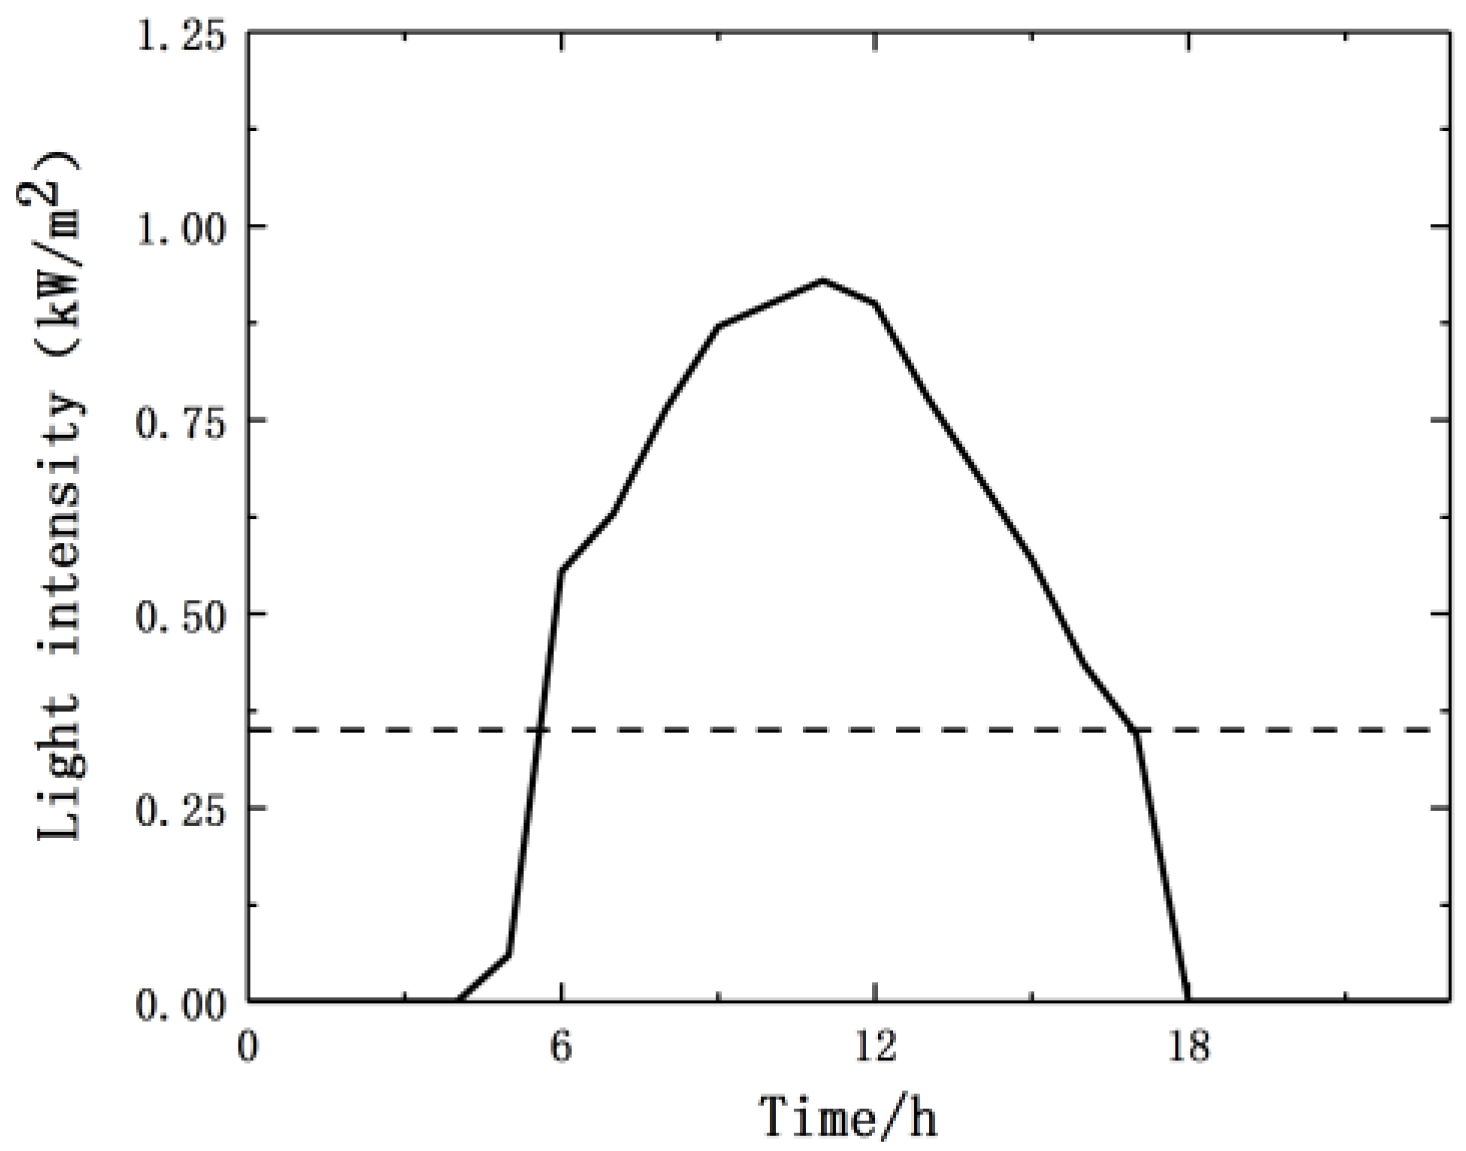
The proposed method is used to analyze the wind speed and light intensity data of a typical year in a region of North China and calculate the comprehensive benefit under different wind farm, PV and pumped storage capacity configurations. The hybrid renewable energy system topology is shown in Figure 4. Node 1 is connected to the pumped storage power station, node 2 is connected to the wind farm, node 3 is connected to PV, and node 4 is connected to the large power grid. Typical daily data represent the expected mean of the hourly data per day for a phase. In the actual project, we use the typical day of every ten days to represent the basic parameter values of the ten days. This paper uses the typical annual data for convenience, but the data processing method is as described above. The typical annual data of wind speed and illumination are shown in Figure 5 and Figure 6. We set the total investment as 40 billion yuan, which is used to equip the system with wind turbines, photovoltaic units and pumped storage units. The related parameters, such as the capacity, cost, failure rate and repair time of wind turbines, PV and pumped storage units are shown in Table 1. In this paper, environmental factors could be neglected, assuming that the construction of pumped storage power stations is mainly affected by wind and solar fluctuations. Otherwise, assuming the investment proportion of the pumped storage station is less than 10%, we assume that it operates without failure.
Other calculation conditions are as follows:
- (1)
- The pumped-storage power station 0’s pumping–generating efficiency η is 75%; the pumped storage unit is charged separately for start-up and shutdown, and the cost is calculated at 3000 yuan each time [24]; the minimum power factor α in pumping mode is 50%, and the minimum power factor β in generating mode is 15%.
- (2)
- According to the “Notice of the National Development and Reform Commission on Improving the Electricity Price Policy for Onshore Wind and PV Power Generation”, the wind power on-grid price of the region is 0.47 yuan/kWh; according to the “Notice of the National Development and Reform Commission on the price policy of PV power generation projects in 2018”, the on-grid price of PV in the region is 0.65 yuan/kWh.
- (3)
- (4)
- The total depreciation period is 20 years, and the residual value rate is set as 5%.
- (5)
- The cut-in wind speed, rated wind speed and cut-out wind speed of the wind turbine are taken as 15 km/h, 45 km/h and 90 km/h, respectively; in addition, the photo-electronic conversion efficiency is 14%, and the output efficiency of the PV power inverter is 92% [27].
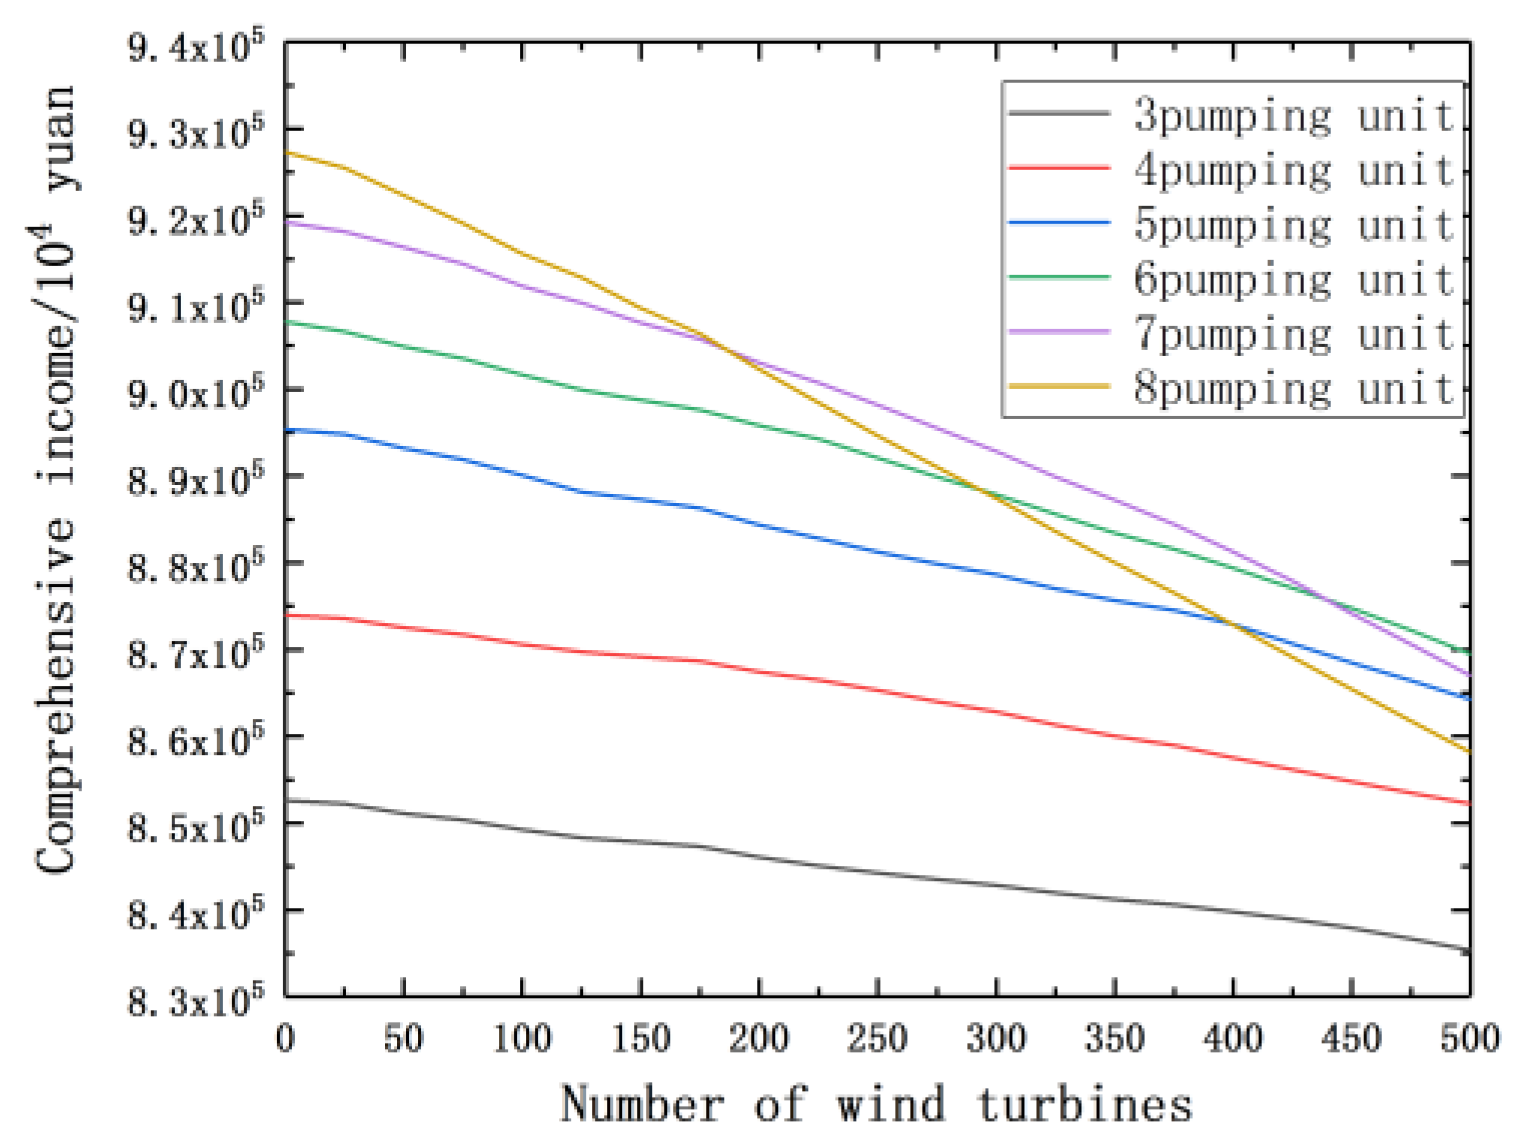
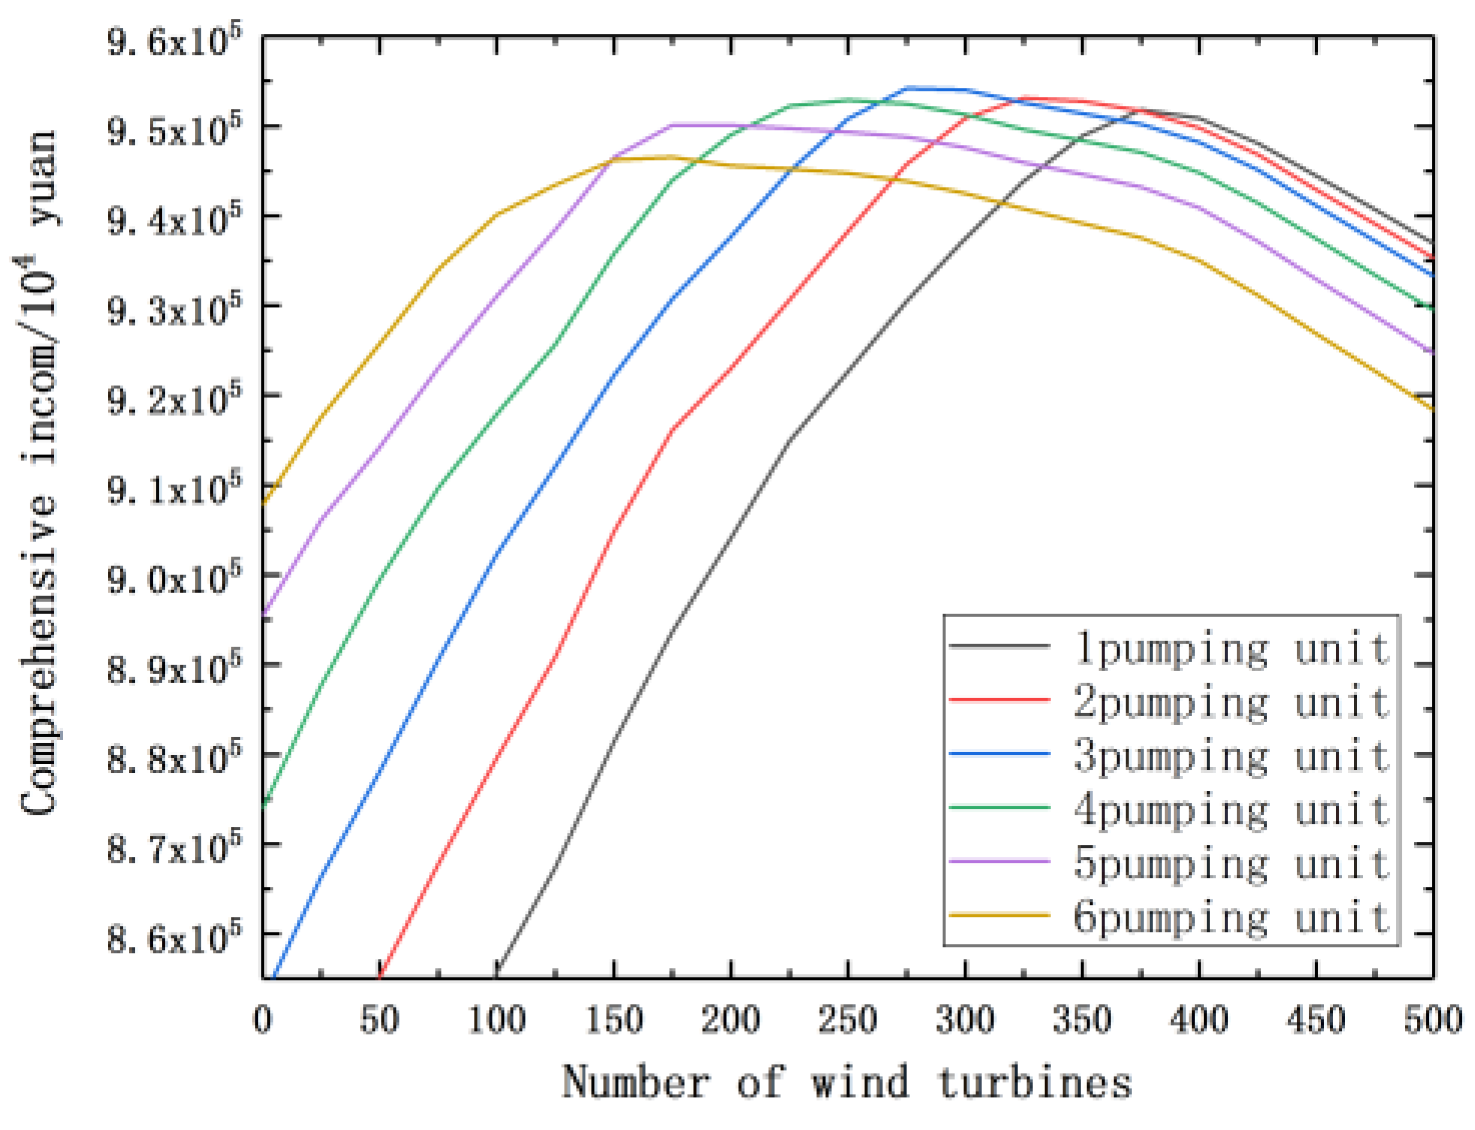
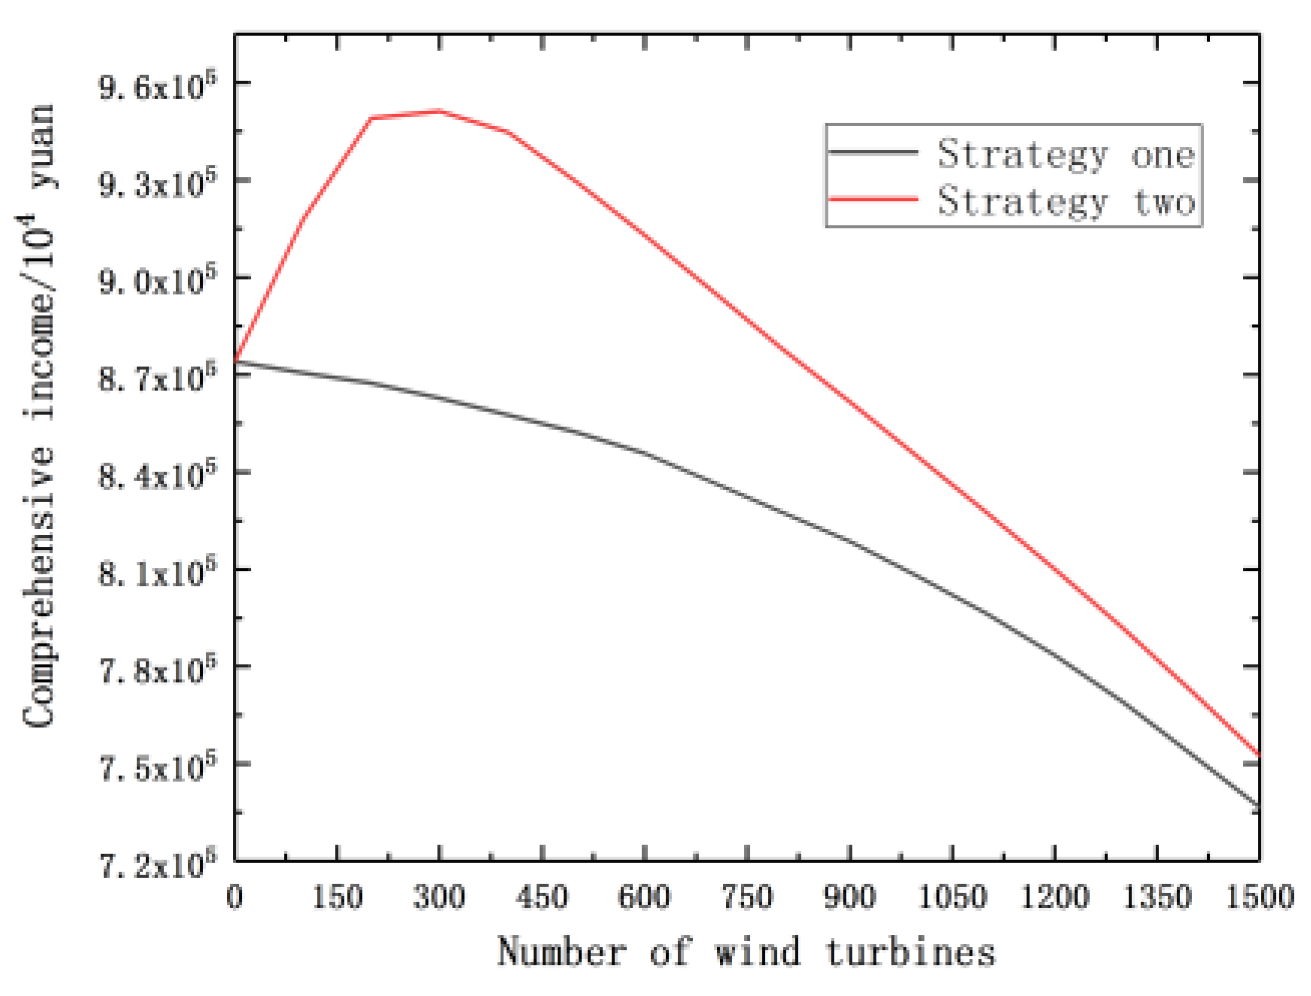
According to the method proposed in this paper, the failure rate of the units is considered, and the corresponding comprehensive income under different wind, light and pumping capacity configuration schemes is obtained by sequential Monte Carlo calculation. The related results calculated under Strategy 1 and Strategy 2 are shown in Figure 7 and Figure 8.
The ordinate indicates the comprehensive benefit of the hybrid system, and the abscissa indicates the number of wind turbines; accordingly, the number of PVs can be determined because of the fixed amount of investment. Therefore, the PV quantity is not introduced here. In Figure 7, strategy 1 is implemented, and it can be seen that when the system prefers to abandon PV, the comprehensive benefit decreases with the increase of the proportion of wind turbines. This shows that PVs have a better comprehensive benefit than wind farms under the same investment. As shown in Figure 8, according to strategy 2, the comprehensive benefit rises as the number of wind turbines increases before reaching the maximum value. At this time, the wind and light characteristics are the main influencing factors. The increase of wind turbines can significantly reduce the volatility of the photovoltaic output and reduce the disposal of new energy to achieve the goal of increasing revenue. When the number of wind turbines increases to a certain value, the overall revenue decreases as the number of wind turbines increases. At this time, the comprehensive benefit generated by the unit capacity cost is the main influencing factor, and the unit capacity cost of the wind turbine unit is lower than that of the photovoltaic unit. When the hybrid system is equipped with four pumped storage units, the comparison of strategy 1 and strategy 2 is shown clearly in Figure 9. With strategy 2, in order to guarantee the maximum comprehensive benefit, PV has the priority over the wind farm, whose redundant power is used for pumping in water and storage adjustment. Referring to the results of Figure 8, three optimal capacity allocation options with the maximum comprehensive benefit are illustrated in Table 2, when the number of pumped storage units are 3, 4, and 5.
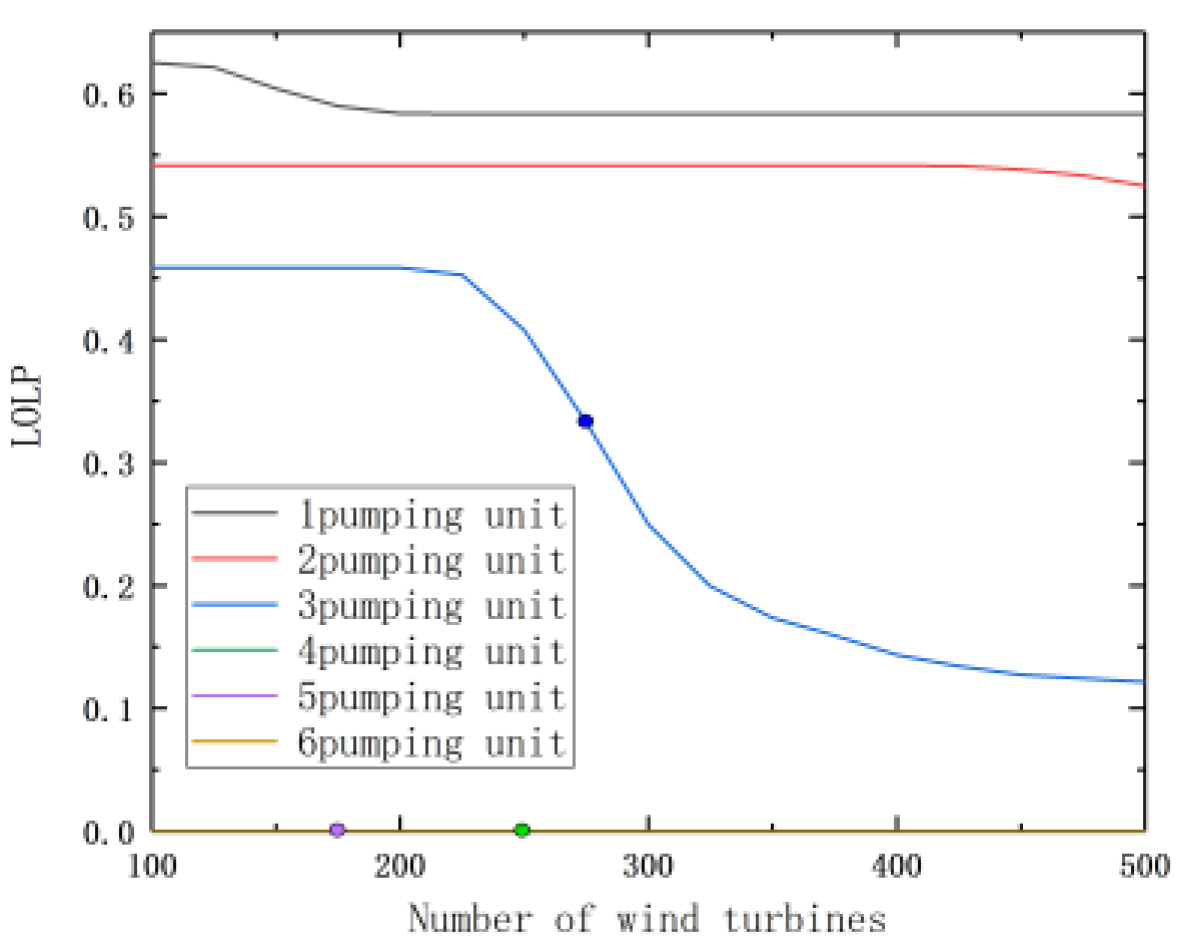
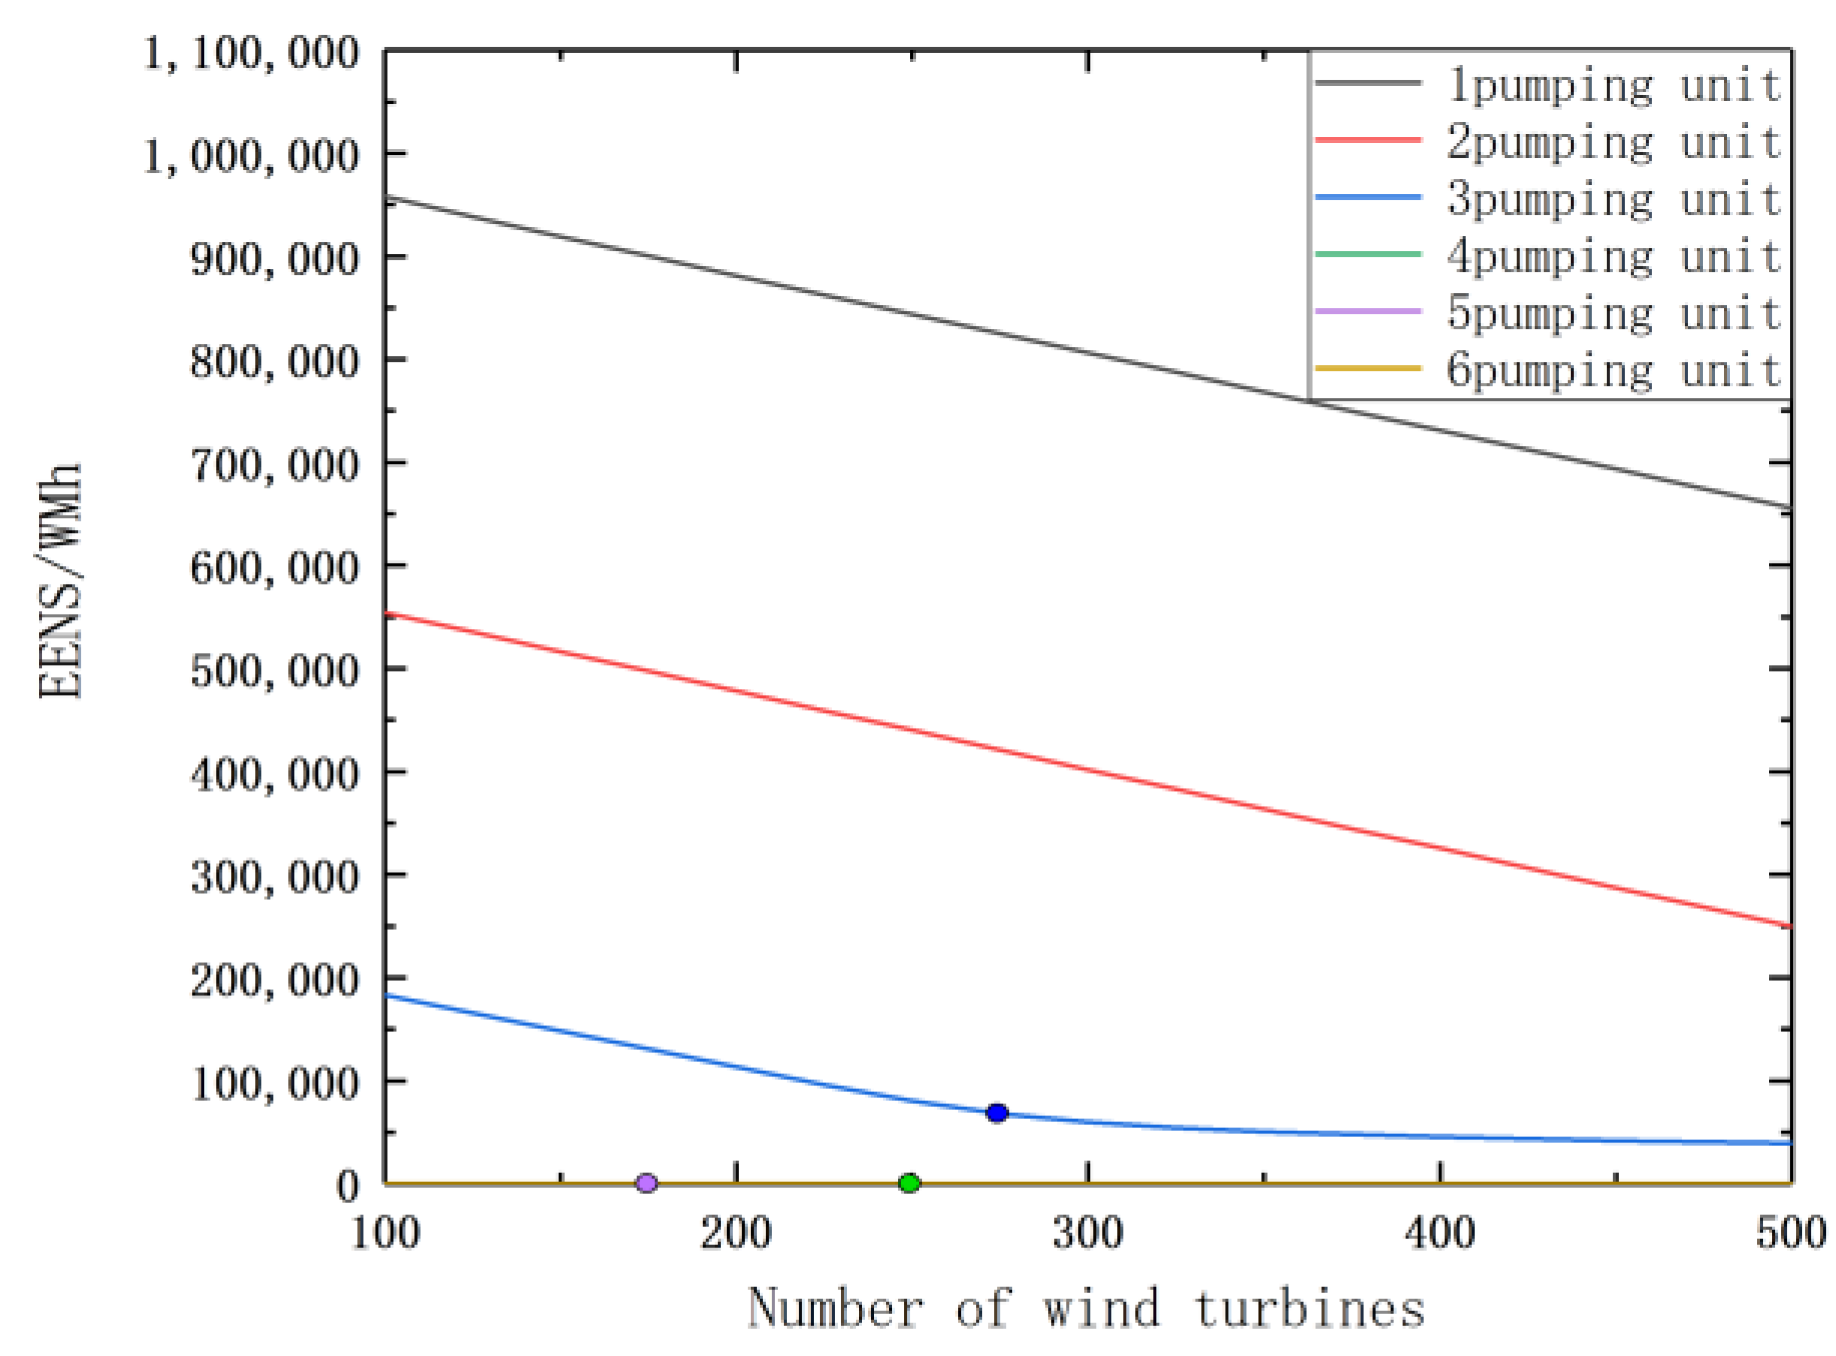
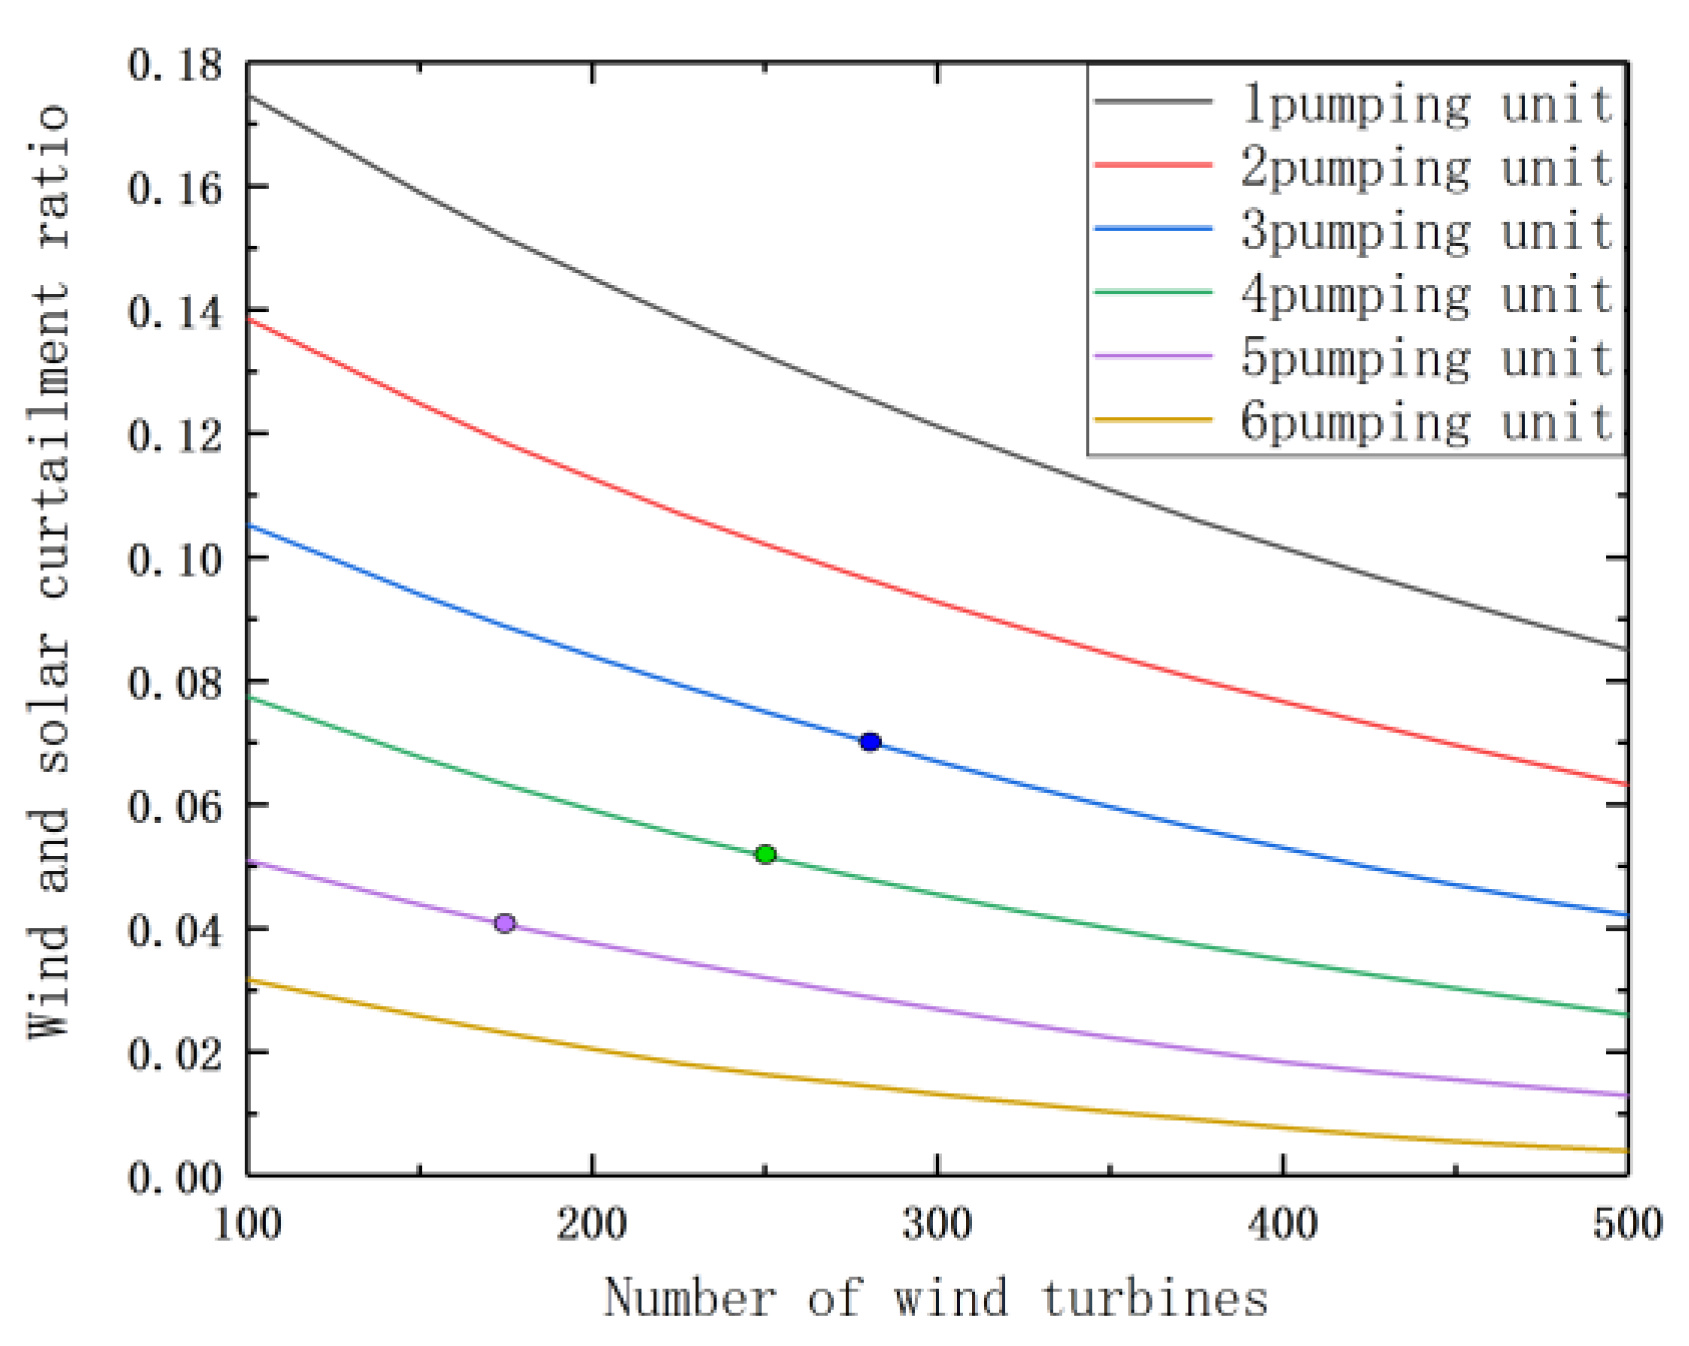
The comprehensive benefits of option 1, 2, and 3 are similar. The system reliability index as well as the wind and solar abandonment rate are calculated by the sequential Monte Carlo method, as shown in Figure 10, Figure 11 and Figure 12, and the comparison results are shown in Table 3. When the pumping storage unit is between 4–6 units, the hybrid wind–PV-pumped storage power system’s probability of load loss (LOLP) and the expectation of insufficient power (EENS) are zero, as shown in Figure 10 and Figure 11. According to the requirements of the 13th Five-Year Plan, there should be basically no wind and solar curtailment in the newly-built wind farms and PV power plants. Additionally, the wind and solar curtailment rate should be controlled within 5% in 2020. The corresponding power shortage probability (LOLP) of option 1 is 0.33. The annual electricity shortage value (EENS) is 1307 MWh, so the system reliability is low, and the wind and solar curtailment rate is 7.1%, which does not meet the requirement. In contrast, the power shortage probability and annual electricity shortage value in option 2 and 3 are basically 0, which meets the reliability requirement. Additionally, the wind and solar curtailment rate is less than 5%. The comprehensive benefit of option 2 is slightly higher than Scheme 3. Therefore, considering the system reliability and economy together, under the typical wind and solar data in this region, the optimized wind farm, PV and pumped storage capacity are 750 MW, 5532 MW and 320 MW, respectively.
5. Conclusions
This paper studies the optimal capacity allocation method for a hybrid renewable power system and establishes an optimal comprehensive benefit model. The main innovations are as follows:
- (1)
- An innovative planning method for the optimal capacity allocation of a large-scale hybrid wind–PV-pumped storage power system under certain investment amounts and wind and solar energy is proposed, and the optimal wind farm, PV and pumped-storage capacity configurations corresponding to the maximum comprehensive benefit can be obtained. The method considers factors such as the output of wind turbines and photovoltaic units, pumped storage unit adjustment, storage capacity constraints, and wind farm and PV coordination generation, meeting the reliability requirements and conforming to the actual situation;
- (2)
- The type of energy consumed by the pumped storage unit pumping has a great impact on the comprehensive benefit. When the sum of wind–PV generation exceeds the load demand, the benefit from storing wind energy is much greater than the benefit from storing photovoltaic energy;
- (3)
- The optimal capacity of the pumped storage unit calculated according to this method can overcome the influence of wind–PV generation failure and meets the reliability requirements of LOLP and EENS.
This proposed method considers not only economy but also reliability issues. The simulation results meet the relevant requirements and provide a reference for planning a large-scale hybrid power system.
Author Contributions
Conceptualization, methodology, software and writing—original draft preparation, Y.X. and B.W.; validation and investigation, Y.L. and X.Y.
Funding
The research was carried out under the State Grid Corporation of China Science and Technology Project “Study on Key Technologies of Operation and Maintenance of Major Science and Technology Demonstration Projects in Zhangjiakou Renewable Energy Demonstration Zone”.
Conflicts of Interest
The authors declare no conflict of interest.
References
- Zhang, L.; Yin, M.; Bu, J.; Song, K. A Joint Optimal Operation Model of Wind Farms and Pumped Storage Units Based on Cost-Benefit Analysis. Power Syst. Technol. 2015, 39, 3386–3392. (In Chinese) [Google Scholar]
- Guo, C.; Zhang, L.; Zhang, J.; Zong, M. Reliability analysis of wind and photovoltaic integrated generating system. Power Syst. Prot. Control 2013, 41, 102–108. (In Chinese) [Google Scholar]
- Deane, J.P.; Gallachoir, B.P.; McKeogh, E.J. Techno-economic review of existing and new pumped hydro energy storage plant. Renew. Sustain. Energy Rev. 2010, 14, 1293–1302. [Google Scholar] [CrossRef]
- Ma, T.; Yang, H.; Lu, L.; Peng, J. Pumped storage-based standalone photovoltaic power generation system: modeling and techno-economic optimization. Appl. Energy 2015, 137, 649–659. [Google Scholar] [CrossRef]
- Ma, T.; Yang, H.; Lu, L.; Peng, J. Technical feasibility study on a standalone hybrid solar-wind system with pumped hydro storage for a remote island in Hong Kong. Renew. Energy 2014, 69, 7–15. [Google Scholar] [CrossRef]
- Ma, T.; Yang, H.; Lu, L.; Peng, J. Optimal design of an autonomous solar–wind-pumped storage power supply system. Appl. Energy 2015, 160, 728–736. [Google Scholar] [CrossRef]
- Billinton, R.; Cui, Y. Reliability evaluation of small stand-alone wind energy conversion systems using a time series simulation model. IEE Proc. Gener. Transm. Distrib. 2003, 150, 96–100. [Google Scholar] [CrossRef]
- Roy, B. Impacts of energy storage on power system reliability performance. In Proceedings of the Canadian Conference on Electrical and Computer Engineering, Saskatoon, SK, Canada, 1–4 May 2005; pp. 494–497. [Google Scholar]
- Billinton, R. Incorporating well-being considerations in generating systems using energy storage. IEEE Trans. Energy Convers. 2005, 20, 225–230. [Google Scholar]
- Notton, G.; Mistrushi, D.; Stoyanov, L.; Berberi, P. Operation of a photovoltaic-wind plant with a hydro pumping-storage for electricity peak-shaving in an island context. Sol. Energy 2017, 157, 20–34. [Google Scholar] [CrossRef]
- Sultan, H.M.; Zaki Diab, A.A.; Kuznetsov, O.N.; Zubkova, I.S. Design and evaluation of PV-wind hybrid system with hydroelectric pumped storage on the National Power System of Egypt. Glob. Energy Interconnect. 2018, 1, 301–311. [Google Scholar]
- Li, J.; Zheng, X.; Ai, X. Optimal Design of Capacity of Distributed Generation in Island Standalone Microgrid. Trans. China Electrotech. Soc. 2016, 31, 176–184. (In Chinese) [Google Scholar]
- Ding, M.; Wang, B.; Zhao, B. Configuration Optimization of Capacity of Standalone PV-Wind-Diesel-Battery Hybrid Microgrid. Power Syst. Technol. 2013, 37, 575–581. (In Chinese) [Google Scholar]
- Pan, W.; Li, J.; Fang, K. Optimization Method of Capacity Configuration of Standalone Microgrid Considering Subsidy. Power Syst. Technol. 2018, 42, 2206–2212. (In Chinese) [Google Scholar]
- Li, Z.; Li, Y.; Zhang, D. Influence analysis and optimal allocation of energy storage device on reliability of distribution network. Power Syst. Technol. 2018, 11, 3676–3683. (In Chinese) [Google Scholar]
- Hou, Y.; Wang, X. Dimensional Importance Based Quasi-Monte Carlo Method for Power System Reliability Evaluation. Autom. Electr. Power Syst. 2016, 40, 31–37. (In Chinese) [Google Scholar]
- Wang, H.; Bai, X.; Xu, J. Reliability assessment considering the coordination of wind power, solar energy and energy storage. Proc. CSEE 2012, 32, 13–20. (In Chinese) [Google Scholar]
- Cui, J.; Yang, J.; Xing, Z. Multi-scenario Wind Power Forecasting Method Based on Single Turbine Optimal Power Curve Fitting. Autom. Electr. Power Syst. 2015, 39, 23–28. (In Chinese) [Google Scholar]
- Cui, J.; Yang, J.; Yang, L. New Method of Combined Wind Power Forecasting Based on Improved CFD and Wavelet-HNN Model. Power Syst. Technol. 2017, 41, 79–85. (In Chinese) [Google Scholar]
- Xiao, B.; Cong, J.; Gao, X. A Method to Evaluate Comprehensive Benefits of Hybrid Wind Power-Pumped Storage System. Power Syst. Technol. 2014, 38, 400–404. (In Chinese) [Google Scholar]
- Wang, M. Reliability Evaluation and Credible Capacity Model of Joint System consist of Multi-Wind Farms and Pumped Storage Power Station. Master’s Thesis, Chongqing University, Chongqing, China, 2016. [Google Scholar]
- Hu, Z.; Ding, H.; Kong, T. A Joint Daily Operational Optimization Model for Wind Power and Pumped-storage Plant. Autom. Electr. Power Syst. 2012, 36, 36–41. (In Chinese) [Google Scholar]
- Rathore, A.; Patidar, N.P. Reliability assessment using probabilistic modelling of pumped storage hydro plant with PV-Wind based standalone microgrid. Electr. Power Energy Syst. 2019, 106, 17–32. [Google Scholar] [CrossRef]
- Billinton, R.; Li, W. Reliability Assessment of Electric Power Systems Using Monte Carlo Methods; Plenum Press: New York, NY, USA; London, UK, 1994; pp. 34–37. [Google Scholar]
- Zhao, H.; Zhang, J.; Gao, D. A Condition Based Opportunistic Maintenance Strategy for Wind Turbine. Proc. CSEE 2015, 35, 3851–3858. (In Chinese) [Google Scholar]
- Zhong, Y. Research on Cost Compensation Strategy of Photovoltaic Grid-connected Power Generation Project Based on Real Options. Chin. J. Manag. Sci. 2010, 18, 68–74. (In Chinese) [Google Scholar]
- Chen, X.; Yang, Y.; Zhang, Y. Influence of Illumination Probability of Photovoltaic System on Voltage of Power Distribution Networks. J. South China Univ. Technol. 2015, 43, 112–118. (In Chinese) [Google Scholar]
Figure 1.
Structure of the hybrid renewable energy system. PV: photovoltaics.

Figure 2.
The hybrid renewable energy system capacity configuration method.

Figure 3.
Block diagram of the capacity allocation planning for the hybrid renewable energy system.

Figure 4.
Diagram of the hybrid renewable energy system.

Figure 5.
Typical day wind speed.

Figure 6.
Typical day light intensity.

Figure 7.
Capacity allocation comprehensive income of strategy 1.

Figure 8.
Capacity allocation comprehensive income of strategy 2.

Figure 9.
Strategy 1 and 2: comprehensive income comparison.

Figure 10.
Probability of load loss (LOLP) for different capacity configuration schemes.

Figure 11.
Expectation of insufficient power (EENS) for different capacity configuration schemes.

Figure 12.
Wind power and solar power curtailment ratio for different capacity configuration schemes.
Figure 12.
Wind power and solar power curtailment ratio for different capacity configuration schemes.


Table 1.
Wind turbine, PV, and pumped storage unit cost and reliability parameters.
| Power Unit | Stand-Alone Capacity/MW | Unit Cost/(Ten Thousand Yuan/MW) | Failure Rate/Year−1 | Repair Time/h |
|---|---|---|---|---|
| Wind Turbine | 3 | 750 | 1.5 | 600 |
| PV array | 0.08 | 600 | 0.9 | 6 |
| Pumped storage unit | 80 | 370 | \ | \ |
Table 2.
Wind farm, PV, pumped storage capacity allocation and comprehensive benefit statement.
| Scheme | Pumped Storage Unit Quantity | Pumped Storage Capacity/MW | Wind Turbine Quantity | Wind Turbine Capacity/MW | Photovoltaic Panel Quantity | Photovoltaic Panel Capacity/MW | Comprehensive Benefit/Ten Thousand Yuan |
|---|---|---|---|---|---|---|---|
| 1 | 3 | 240 | 275 | 825 | 68,593 | 5487 | 954,218 |
| 2 | 4 | 320 | 250 | 750 | 69,148 | 5532 | 952,902 |
| 3 | 5 | 400 | 175 | 525 | 72,047 | 5764 | 950,112 |
Table 3.
Scheme 1, 2, 3 reliability and comprehensive income comparison table.
| Scheme | LOLP | EENS/MWh | Wind and Solar Curtailment Ratio | Comprehensive Benefit/Ten Thousand Yuan |
|---|---|---|---|---|
| 1 | 0.33 | 1307 | 7.1% | 954,218 |
| 2 | 0 | 0 | 4.8% | 952,902 |
| 3 | 0 | 0 | 3.9% | 950,112 |
© 2019 by the authors. Licensee MDPI, Basel, Switzerland. This article is an open access article distributed under the terms and conditions of the Creative Commons Attribution (CC BY) license (http://creativecommons.org/licenses/by/4.0/).
Share and Cite
MDPI and ACS Style
Xu, Y.; Lang, Y.; Wen, B.; Yang, X. An Innovative Planning Method for the Optimal Capacity Allocation of a Hybrid Wind–PV–Pumped Storage Power System. Energies 2019, 12, 2809. https://doi.org/10.3390/en12142809
AMA Style
Xu Y, Lang Y, Wen B, Yang X. An Innovative Planning Method for the Optimal Capacity Allocation of a Hybrid Wind–PV–Pumped Storage Power System. Energies. 2019; 12(14):2809. https://doi.org/10.3390/en12142809
Chicago/Turabian StyleXu, Yumin, Yansheng Lang, Boying Wen, and Xiaonan Yang. 2019. "An Innovative Planning Method for the Optimal Capacity Allocation of a Hybrid Wind–PV–Pumped Storage Power System" Energies 12, no. 14: 2809. https://doi.org/10.3390/en12142809
Note that from the first issue of 2016, this journal uses article numbers instead of page numbers. See further details here.