An Enhanced Flow-Thermo-Structural Modeling and Validation for the Integrated Analysis of a Film Cooling Nozzle Guide Vane

1
School of Power and Energy, Northwestern Ploytechnical University, Xi’an 710072, China
2
Faculty of Aviation Engine, Shenyang Aerospace University, Shenyang 110136, China
3
Department of Aeronautics and Astronautics, Fudan University, Shanghai 200433, China
*
Author to whom correspondence should be addressed.
Energies 2019, 12(14), 2775; https://doi.org/10.3390/en12142775
Submission received: 8 May 2019
/
Revised: 1 July 2019
/
Accepted: 17 July 2019
/
Published: 19 July 2019
Abstract
:The target of this paper is to develop an enhanced flow-thermo-structural (FTS) model with high computational accuracy, to perform the integrated analysis of film cooling nozzle guide vane (NGV). An efficient turbulence model and weak spring approach are utilized in the enhanced FTS model. In respect of the power balance principle of aeroengine rotor shaft and temperature test of a typical combustor, the mean temperature inlet and five normalization temperature curves were confirmed, respectively. The temperature-sensitive paint (TSP) technology was used to verify the numerical simulation. From this study, we find that the predicted temperature caters for the TSP test well, between which the maximum error is less than 6%, and the maximum thermal stress is 758 MPa around the hole edges and the location of stress concentration keeps the consistency with that of the cracks. The maximum thermal stress increases by 10% with the increasing inlet temperature and reduces by about 16% with the shifting of flame peak from the outer to inner hub. The prediction provides general information on the initiation of cracks on a vane segment. The developed enhanced FTS model is validated to be workable and precise in the integrated analysis of film cooling NGV. The efforts of this study provide an integrated analysis approach of film cooling NGV and are promising to provide guidance for the integrated design of film cooling components besides NGV.
1. Introduction
With the development of aeronautical technology, turbine inlet temperature reaches to 2000 K which exceeds the melting point of high-temperature metal materials. It is necessary for the normal operation of turbine components to apply cooling measurement [1]. By adopting turbine cooling technology, it is possible to reduce average temperature away from rupture strength and temperature gradient to decrease thermal stress level. In term of the estimation of temperatures on turbine components based on engineering practices, thermal fatigue life of nozzle guide vane (NGV) is very sensitive to temperature. Therefore, it is urgent to find an efficient approach to accurately predict the temperature of turbine guide vane.
With the development of conjugate heat transfer (CHT) technology, the aerodynamic heat transfer of NGV is attracting the attention of numerous researchers. Funazaki [2] studied the cooling effectiveness at the leading edge of turbine front stages using the CHT calculation technique. Maheu [3] and Liu [4] discussed the heat transfer performance of a low-Mach turbine blade and heat transfer problem of a typical film cooling blade by ANSYS-CFX software. However, it is a large challenge for the design of turbine devices, especially NGV, owing to the non-uniform temperature profiles of turbine inlet (combustor outlet). To investigate the interacting influences between total pressure and temperature radial gradients on heat transfer performance of a high-pressure turbine vane, Barringer et al. [5,6] developed a combustor simulator and revealed pressure gradient seriously influencing vane heat transfer [7]; Povey et al. [8] also simulated the engine combustor exit realistic temperature profiles. The subsequent studies revealed the influences of hot spot on the heat transfer of both NGV and intermediate pressure vanes [9]. Wang et al. [10] pointed out that the migration path of hot streak in vane passage was influenced by the vortices. The above works demonstrated that the passage vortex extended the radial migration of fluids and induced higher temperature. However, the influence of film cooling holes on the temperature of NGV was not focused on. The investigation of NGV aerodynamic heat transfer problems by CHT technology is promising to give an exact temperature for thermal structure analysis.
One point causing the thermal fatigue of NGV is non-uniform temperature environment. Recently, based on FTS coupling technology, the influence of non-uniform temperature field on thermal strength performance of NGV was widely researched [11,12], and some studies about NGV life prediction also emerged. Kim et al. studied convective heat transfer coefficients and stresses on blade surfaces using finite volume (FV) and finite element (FE) methods [13], showed the maximum material temperature and thermal stress at the trailing edge near the mid-span, and discussed the life prediction methods of turbine components by coupling aero-thermal simulation with a nonlinear deformation thermal-structural FE model and a slip-based constitutive model [14]. Chung [15] predicted cracks on the vane of a power generation gas turbine by the FTS method.
The other point is film cooling technology which may lead to thermal stress concentration. The purpose of film cooling technology is to reduce the working temperature of NGV material [16]. This technology was also one of the hotspots in the research of aeroengine cooling technology in recent years [17]. Elnadya et al. [18] studied the cooling effectiveness of expanded holes on the leading edge of NGV and found that the cooling effectiveness of a cooling hole was proportional to blowing ratio, and the stress at the hole edges varied smoothly. Moritz et al. [19] studied film cooling holes at the leading edge of NGV by thermal-fluid coupling calculations. Kim et al. [20] and Nowak et al. [21] optimized the hole-structure to some extent and reduced the maximum temperature load with regard to the influences of porosity, passage, jet angle, and arrangement on film cooling effectiveness. In fact, however, the maximum temperature is not the sole factor of determining NGV service life. Thermal stress concentration caused by concentrated cooling in holes was validated to also be a key factor of determining NGV service life [22]. A large temperature gradient might lead to thermal fatigue and thus should be considered in the design process [23,24]. In this case, thermal stress was further discussed and controlled by cooling technology [25,26].
Briefly, in the design process of an NGV, it is unsatisfactory to only consider heat transfer performance or thermal strength. The concept of high-integrity was proposed by the United States Air Force in 2012, for numerical simulation of NGV cooling structure [27]. High-integrity requires the consistency of numerical simulation with a real structure. Due to excess computational loads, however, we have not found related works investigating the high-integrated NGV simulation so far.
This paper attempts to develop an enhanced flow-thermo-structural model to improve the integrated analysis of film cooling NGV in computing accuracy, by regarding non-uniform inlet temperature. In the enhanced model, an efficient turbulence model (i.e., shear-stress-transport model (SST γ-θ model)) and weak spring approach are utilized and the temperature test data of combustor are referenced in constraint conditions, to ensure the analytical accuracy of NGV computational fluid dynamics (CFD) and computational solid dynamics (CSD), respectively.
The remainder of this paper is organized as follows. Section 2 introduces the modeling and simulation approaches including physical model, material parameters, boundary conditions, meshing, and simulation procedure. The verification strategy involving the turbulence model and temperature test is discussed in Section 3. In Section 4 the results and discussions on flow characteristic analysis, temperature field analysis, and thermo-structural analysis are investigated. Section 5 gives the conclusions and findings of this paper.
2. Modeling and Simulation Methods
2.1. Physical Model
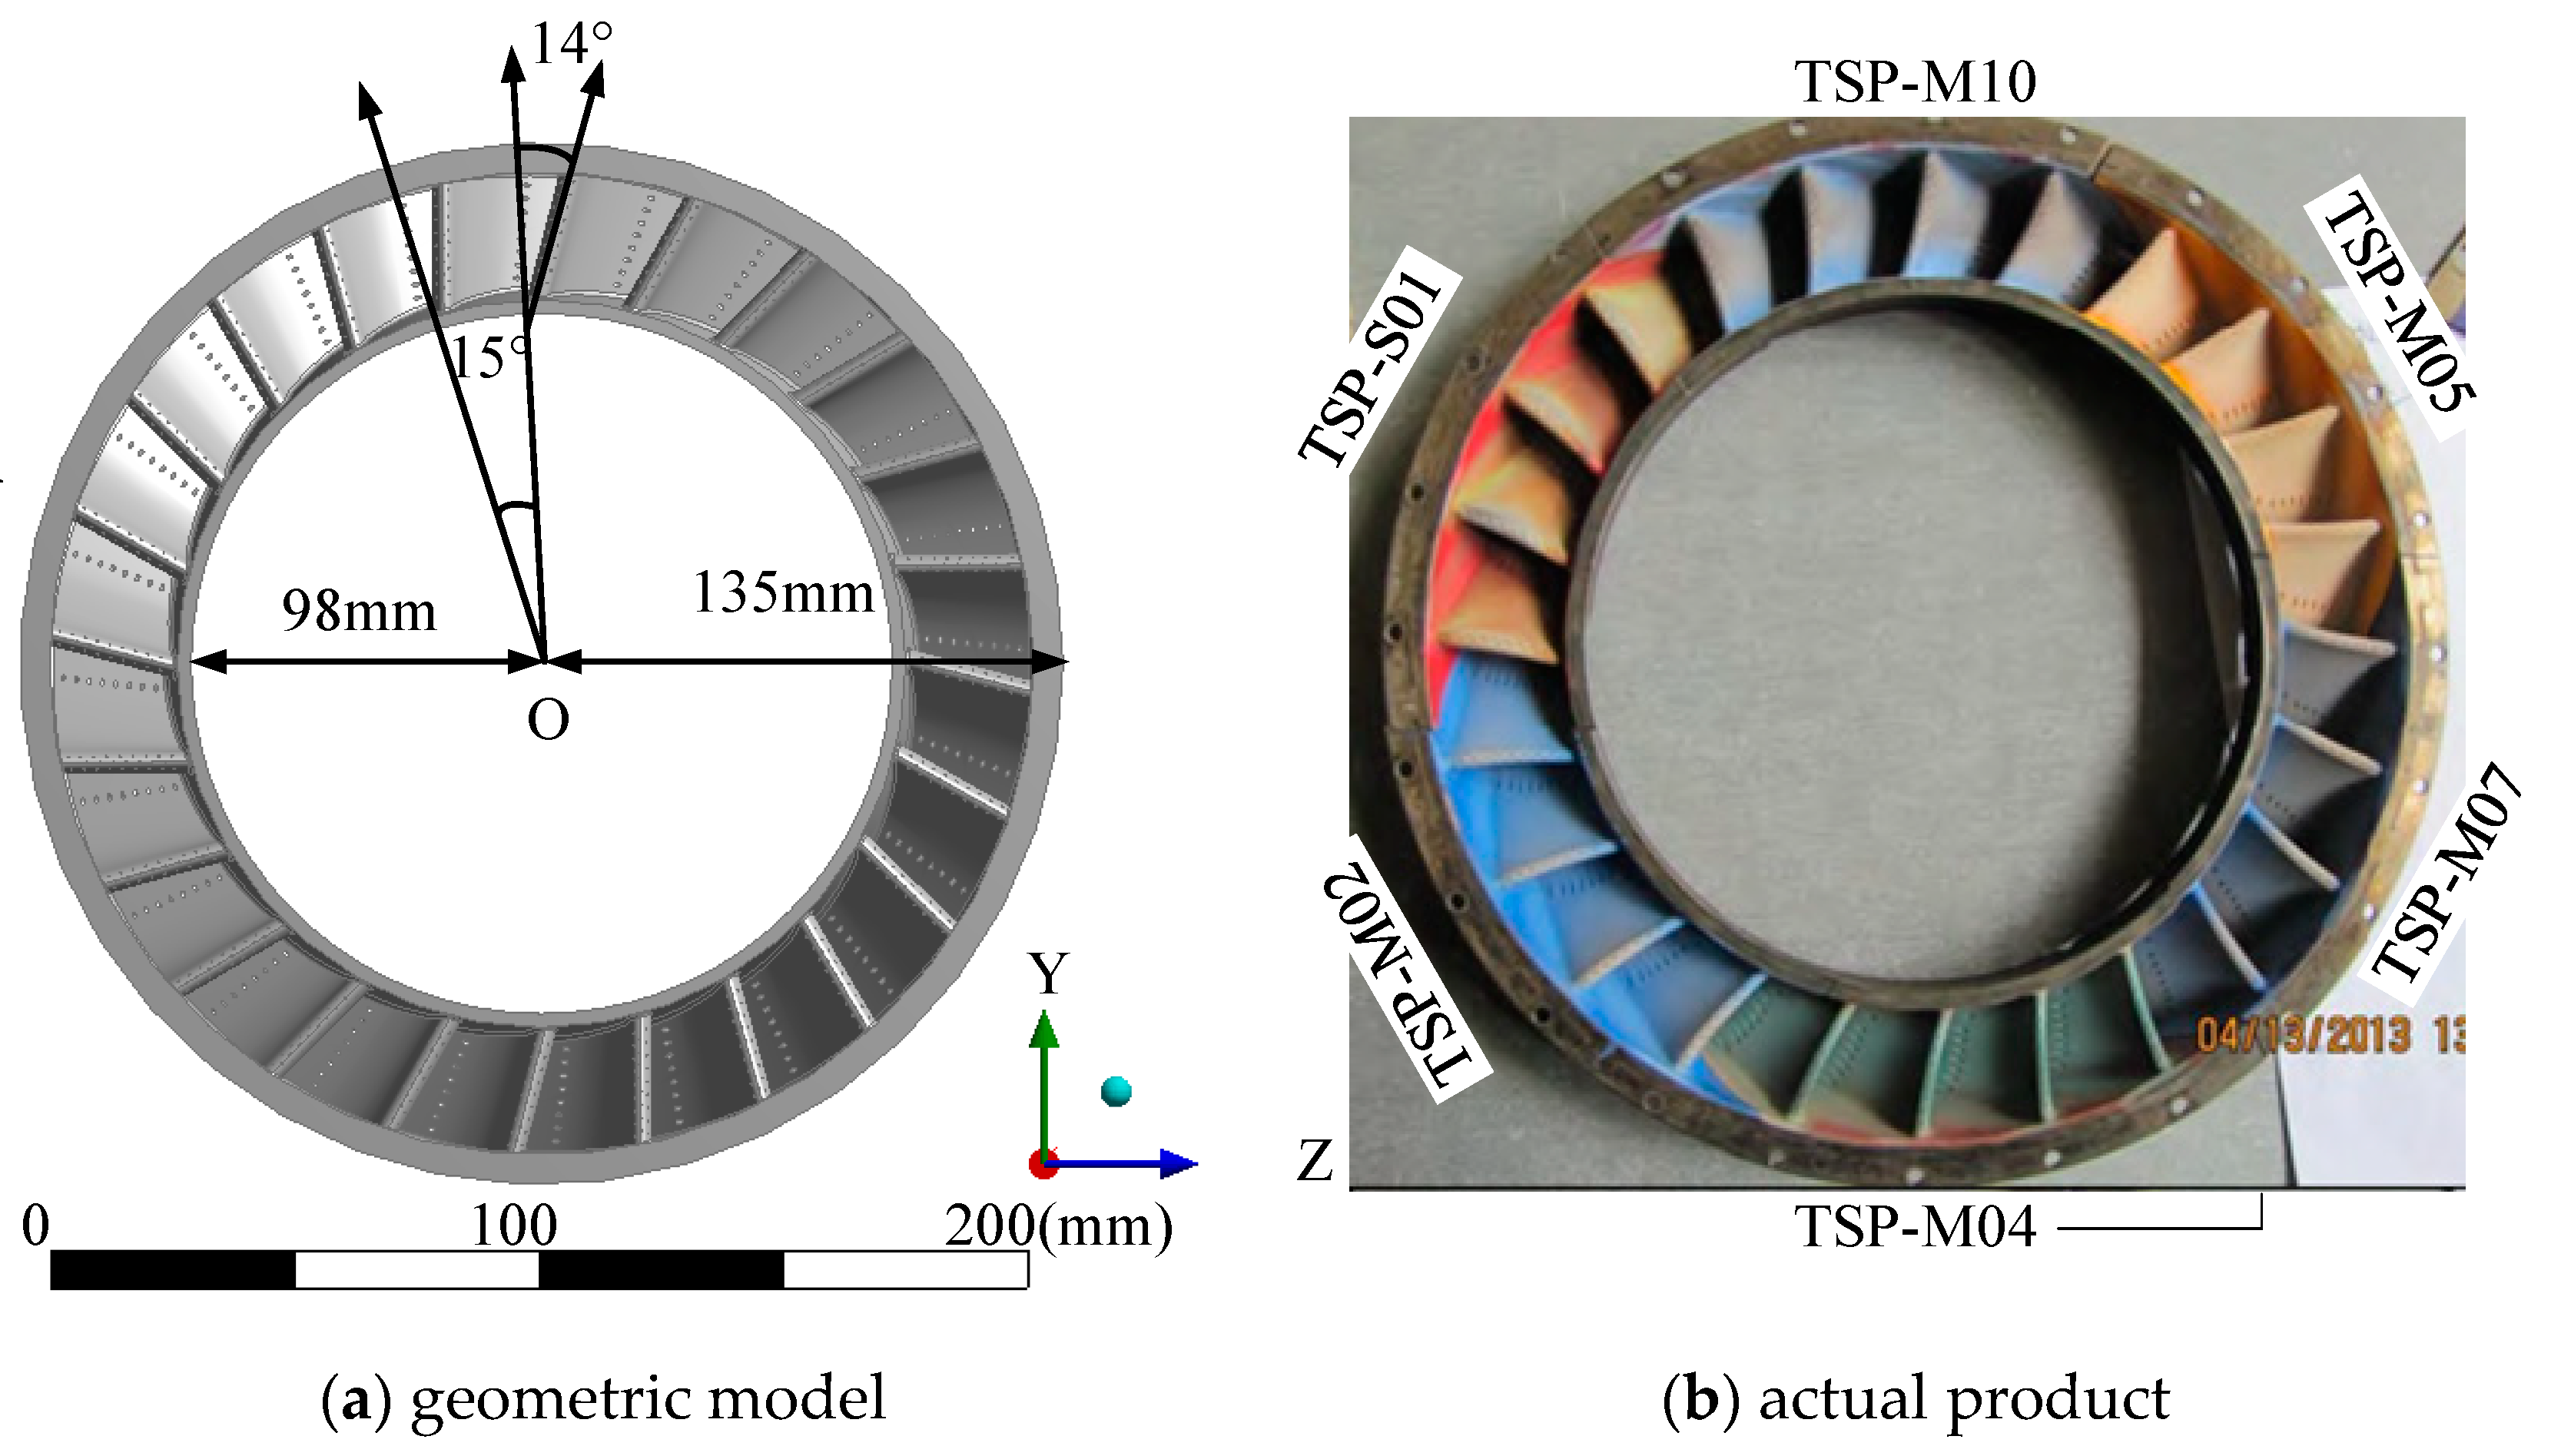
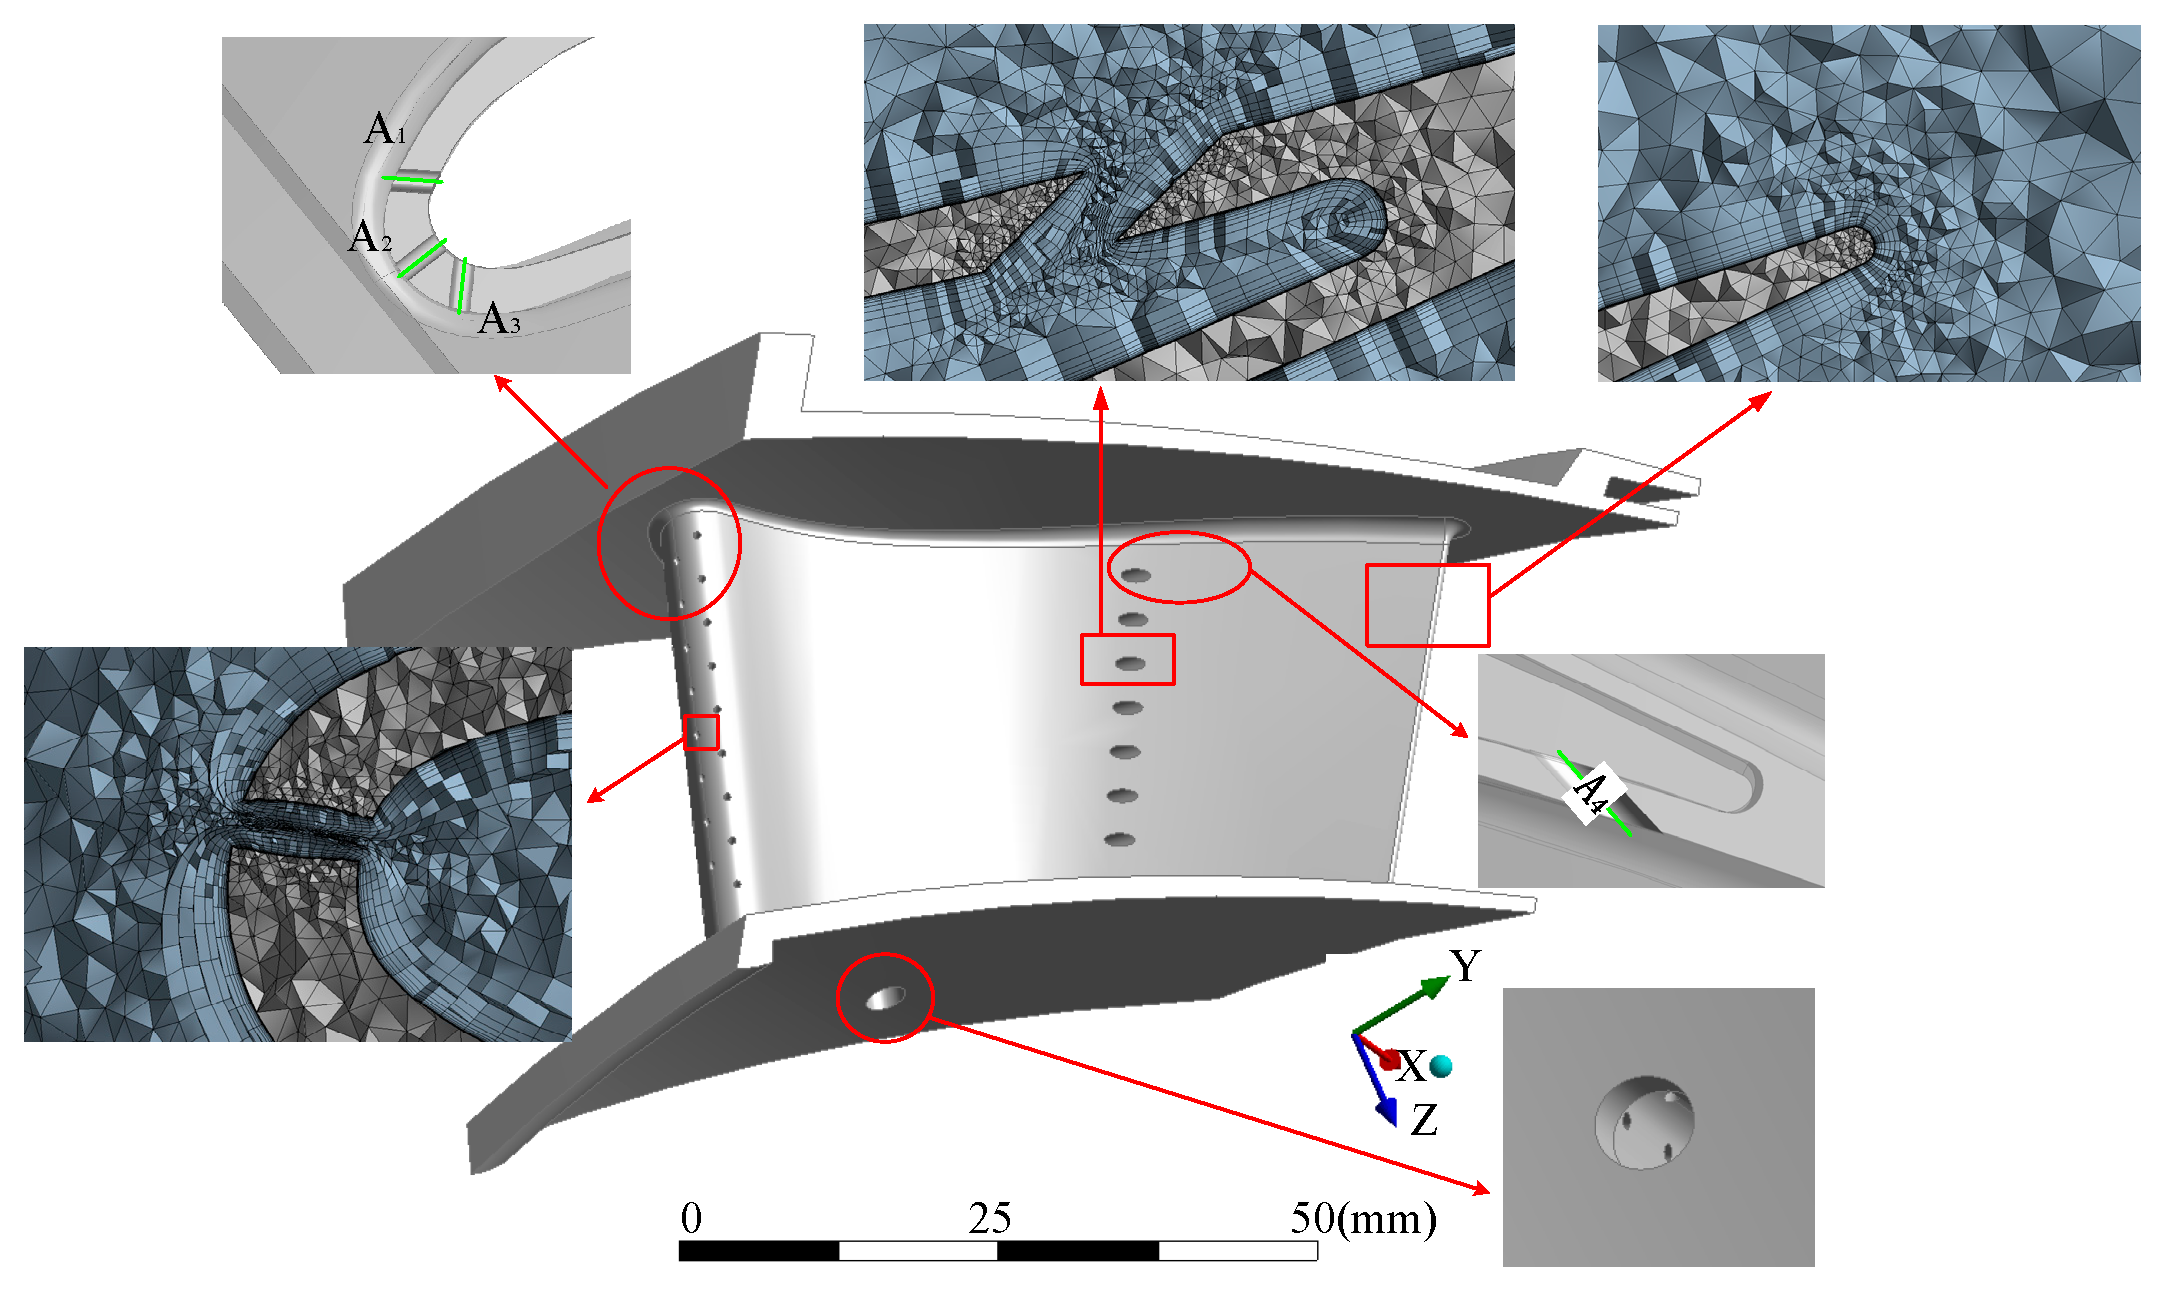
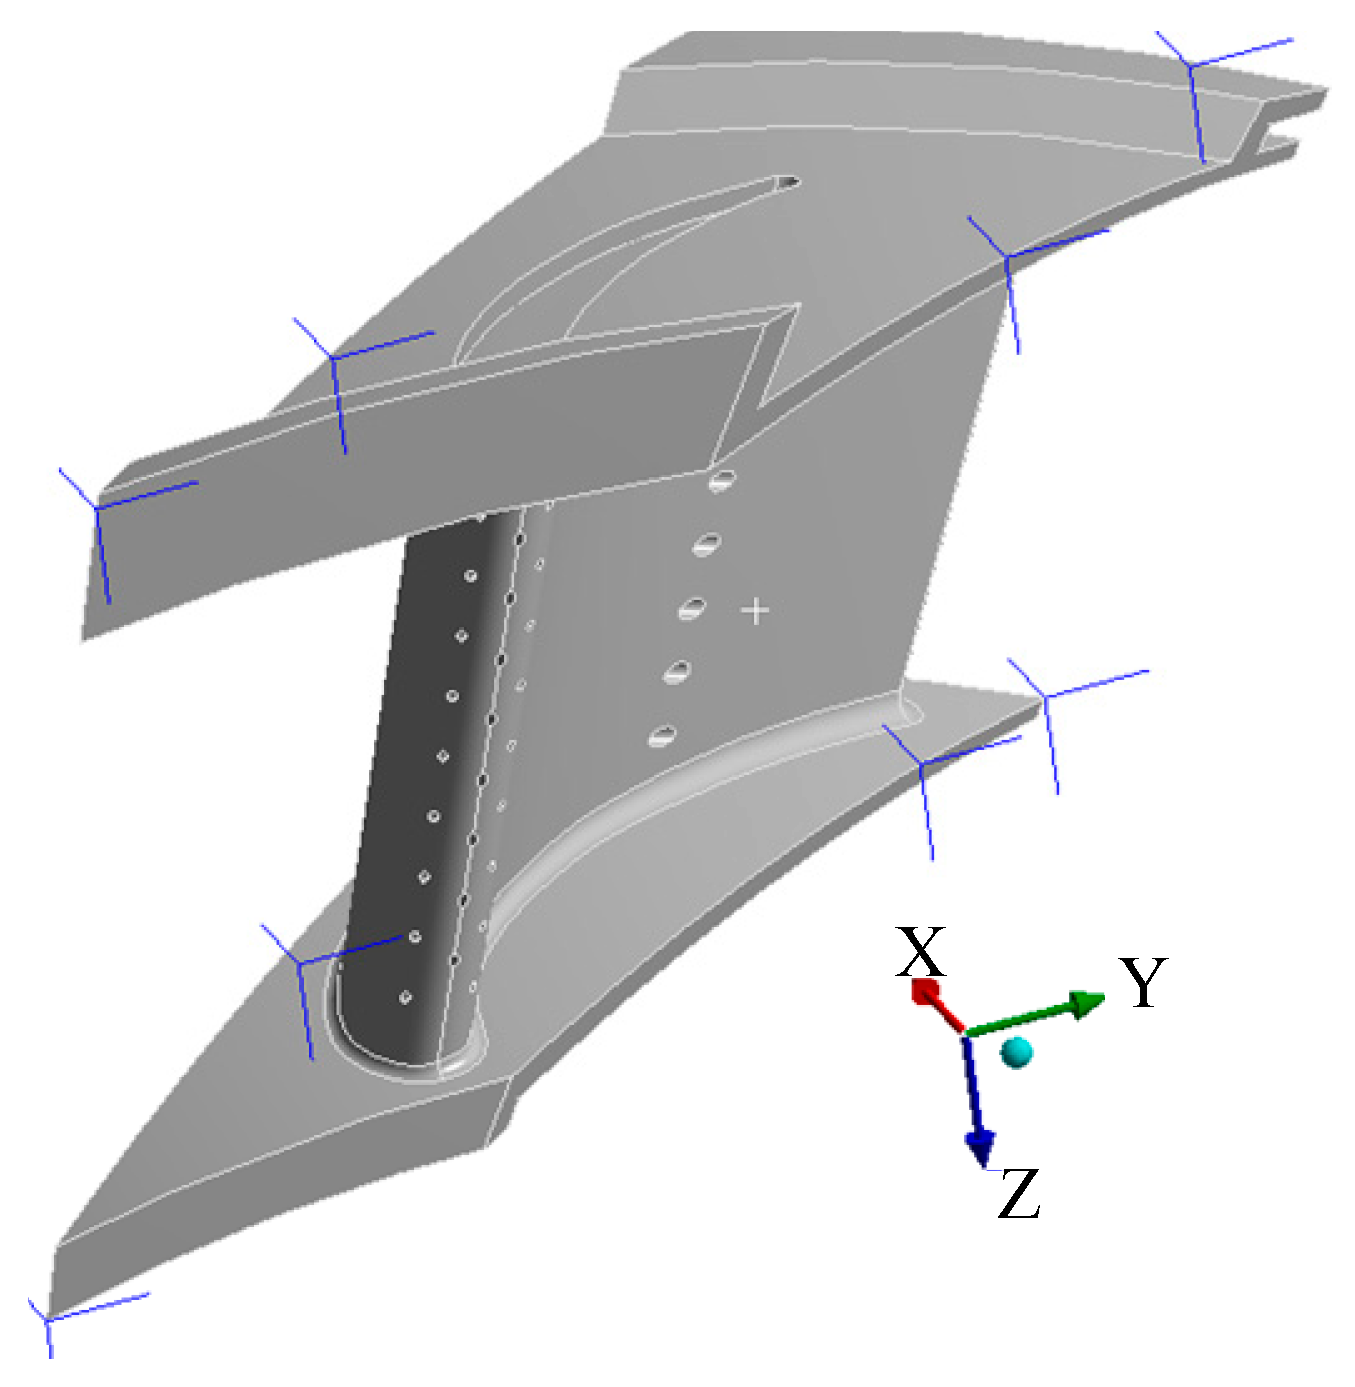
This paper selected a high-pressure turbine guide vane of an axial flow turbojet engine as the object of study. The geometric model and actual product of the guide vane is shown in Figure 1. The original cascade comprises 24 vanes. The internal and external radii of the guide vane are 98 and 135 mm, respectively. The central angle of each NGV is 15°, and the intersection angle between vane height and radial direction is 14°. The number of cooling holes on the leading edge and trailing edge are 26 and 8, respectively. The hole diameters at the leading edge and trailing edge are 0.5 and 1.2 mm, respectively. The geometric parameters are indicated in Figure 1a. To reduce the computational load, the vane cascade in the simulation was simplified as a single channel since the air flow in the cascade varies periodically. The grids and cooling holes of NGV for the CFD simulation are schematically presented in Figure 2 and Table 1.
2.2. Material Parameters and Boundary Conditions
In this study, gas is assumed to be ideal gas and the material of vane is DD3 which is the first-generation Ni-based single crystal superalloy in China [28] and is widely applied to NGV under high temperature (below 1100 °C). Second-order polynomial fitting method is used to establish a relationship between temperature T and physical parameters (K, C, E, α, and ν) [28], as shown in Equation (1). The material equations are written into CFX software and FE code by CFX Expression Language (CEL).
where K, Cv, E, α, and ν are heat conductivity of the material, specific heat capacity for volume, Young’s modulus, thermal expansion coefficient, and Poisson’s ratio, respectively.
In terms of the power balance principle of aeroengine rotor shaft for the boundary conditions, the relationship between Mach number Maeng and total pressure P*eng at engine inlet is
In respect of the efficiency ηcom = 0.98 of the compressor [29], the outlet temperature T*com of the compressor is
where π = P*com/P*eng is the pressure ratio of compressor, in which P*com and P*eng are the total pressure at compressor outlet and engine inlet static pressure, respectively; Teng* is the total temperature of engine inlet. The temperature of cooling air is determined by the outlet temperature of compressor because cooling air comes directly from the end of the compressor. Cooling air mass flow Wc, mean temperature Tmean at cascade inlet, and inlet total pressure P*in can be gained respectively by
where w = 1.88% is the percentage of cold coolant flow; Weng indicates oil mass; F = Wfu/Weng denotes gas-oil ratio in which Wfu denotes fuel mass flow; Cg is the specific heat capacity of ideal gas; Cpg is the specific heat capacity of hot gas; Wca indicates cooling air mass flow; T*ex is exhaust nozzle total temperature; ηsh = 99% is the mechanical efficiency of aeroengine shaft; ηrs = 0.97 is the total pressure recovery coefficient of combustor [29].
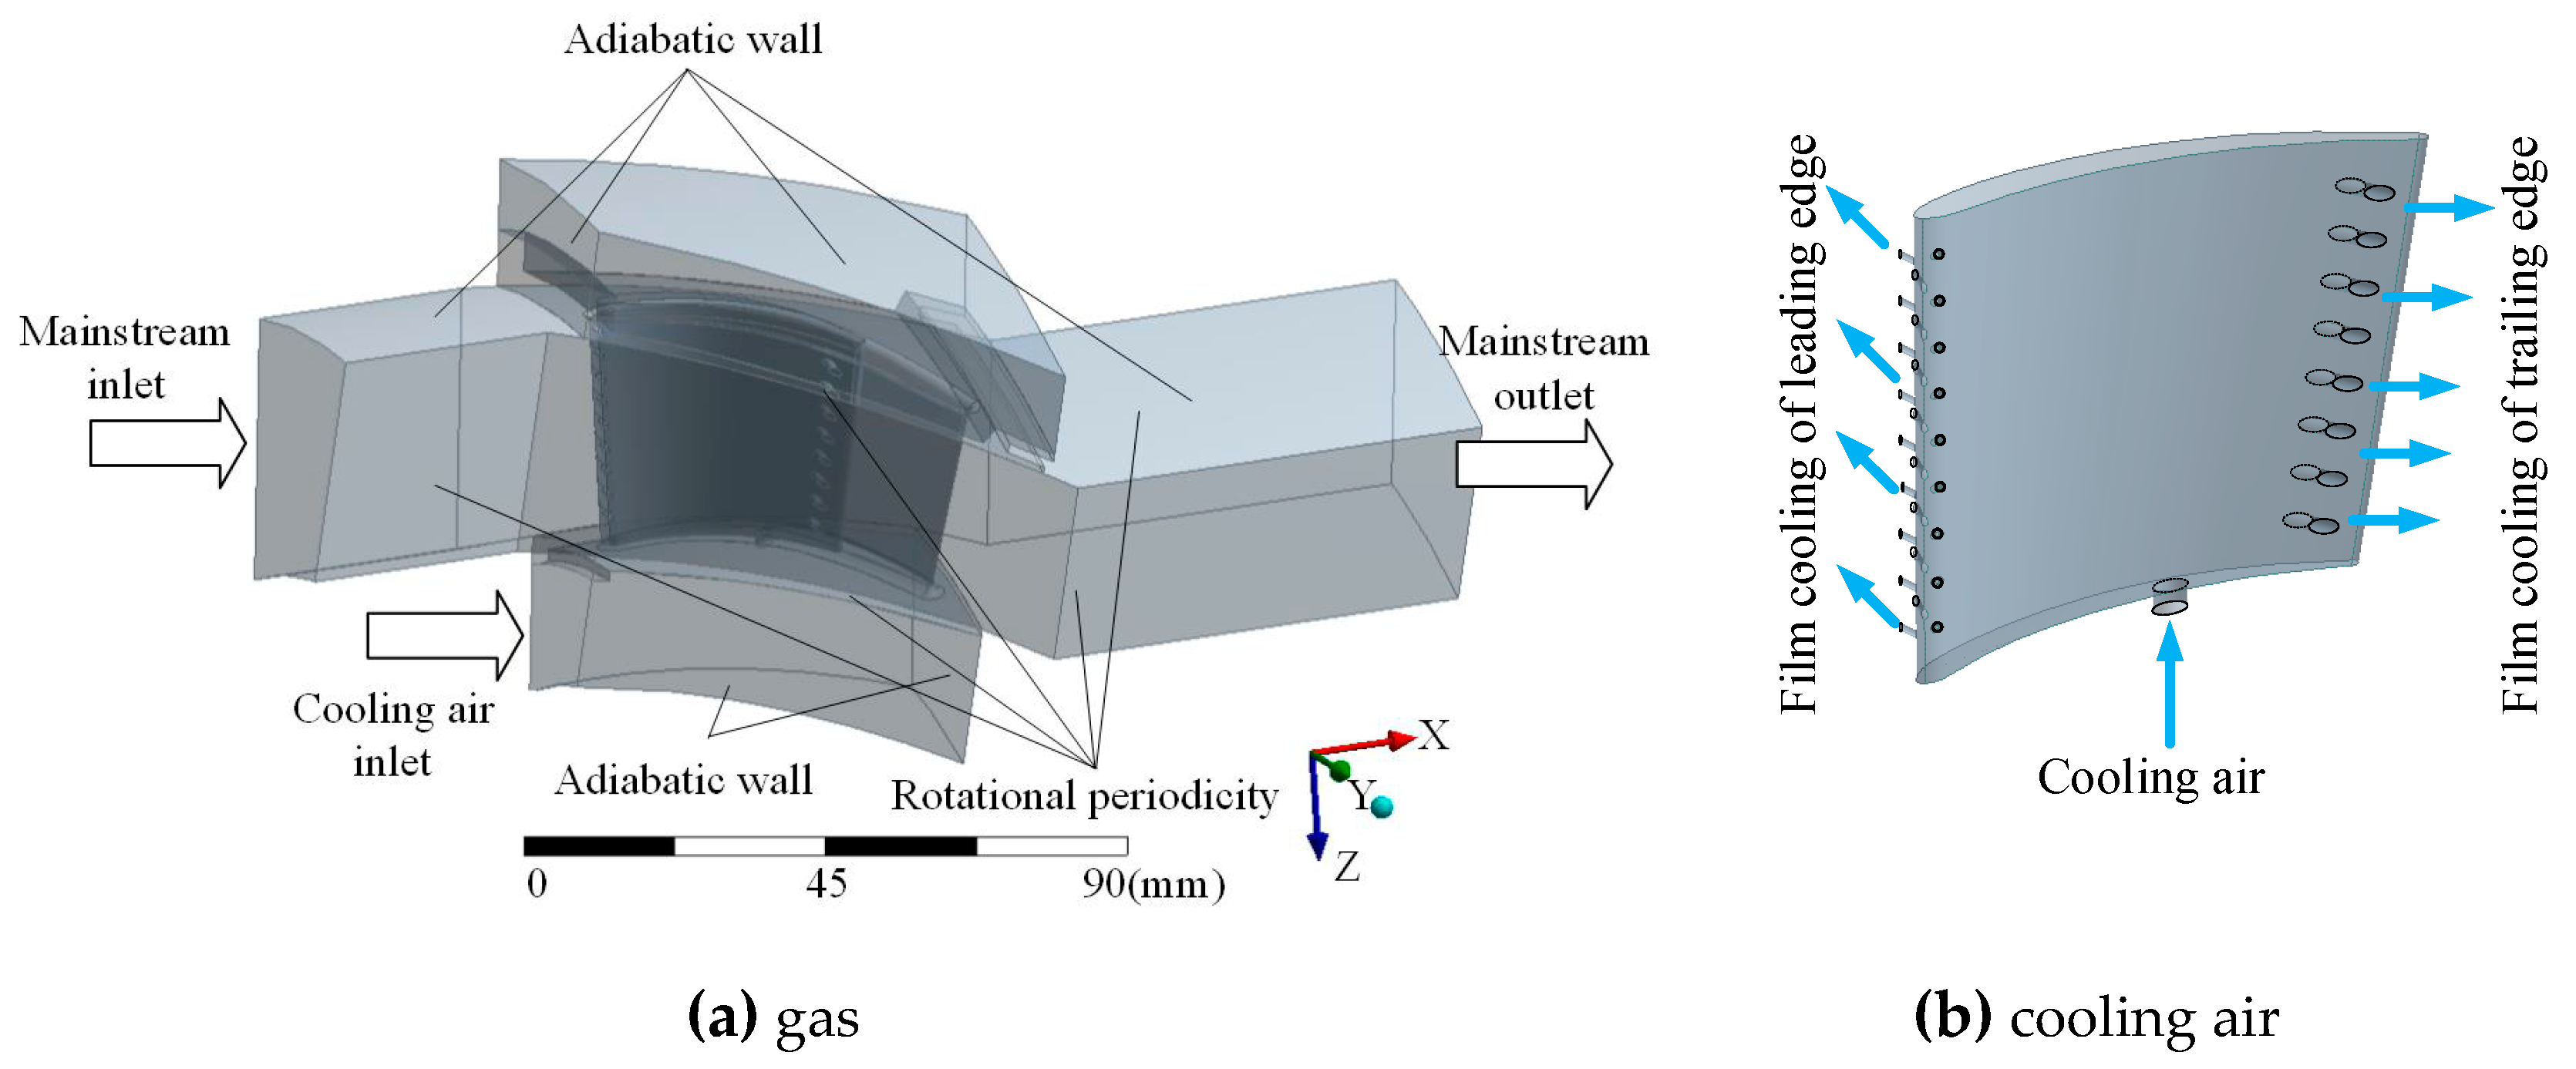
The above parameters in the power balance equation provided by Xiong [30] are listed in Table 2. In terms of Equations (2)–(6), the conditions of NGV simulation are shown in Table 3. All boundaries are set up as non-slip walls, and the periodic boundary method is used to predict periodic flow. The boundary conditions are displayed in Figure 3. The influence of gas kinetic energy on heat transfer is considered by using the total energy model in this study.
The non-uniform temperature profile at the outlet of annular combustor chamber was studied by Povey [8]. It was shown that the distribution of radial temperature was similar to a parabola curve. Normalization and polynomial fitting method [31] were used to get a typical temperature distribution curve in this paper. The axis and boundary of curves were modified many times to make the temperature result of the CFD simulation cater for that of the temperature-sensitive paint (TSP) test [30]. The standard dimensionless temperature equation for Case 1 was considered as standard condition which is referenced to compare with experimental results. To discuss the influence of radial flame peak and temperature gradient, five curves are established, where the Case 2 and Case 3 represent different temperature gradients; Case 4 and Case 5 represent different positions of flame peak; Case 6 represents average temperature inlet, as shown in Table 4.
The mean value of all temperature profiles is 1310 K. The equations of six temperatures, denoted by T1, T2, …, T6, are expressed as
where χ = (r − rint )/(rext − rint ) is the dimensionless distance between the inner hub and outer hub, in which rint and rext indicate the radii of the inner and outer hub, respectively. The fitted curves of inlet temperature in radial direction for six Cases are shown in Figure 4.
2.3. Meshing
The simulation data between cascade and NGV were exchanged by general-grid-interface technology. The thickness of the first boundary layer grid was 1 μm, the expansion ratio was 1.2, and the total number of near-wall nodes was 15. When the analysis results were sensitive to the number of mesh nodes, a grid-independent test was performed to find the number of the best grid. An average change coefficient ϕcha is introduced to test the influence of mesh number, i.e.,
where ϕn and ϕn − 1 are the physical parameters (i.e., temperature, stress, deformations, etc.) of the nth mesh in the FE model, respectively; z is the number of elements; n indicated the nth mesh.
2.4. Simulation Procedure
The prediction method of NGV stress is described as follows. Firstly, finite meshing software was used to create an unstructured grid of cascade flow and NGV. The calculation results of Equations (2)–(6) were used as boundary conditions of cascade flow. The dimensionless temperature curves were inputted into CFX software to simulate CHT. Then, the axis and boundary of standard temperature curve were modified repeatedly until the maximum temperature error between CFD simulation and experiment was less than 6%. Lastly, the temperature results of NGV were imported into ANSYS software directly and thermal stresses were solved by the thermal elastic FEM code. The simulation process is shown in Figure 5.
3. Verification Strategy
3.1. Turbulence Model
The prediction of heat transfer on airfoil surface by CFD simulation is susceptible to the turbulence model. It is essential to assess the prediction accuracy of turbulence model in heat transfer. The turbulence model applied in this paper is SST γ-θ. The SST γ-θ model has good transition prediction capability in transient fluid-structural heat transfer analysis, because the model considers the time effect and adopts an intermittent factor to predict the time and position where the transition happens [32].
As there are not enough aerodynamic measurement parameters and heat transfer test results of NGV in the open database, a typical guide vane which is similar to the geometrical structure and working environment of the model described in this paper, was selected to verify the accuracy of the aerodynamic simulation results. The boundary conditions and experimental data of the typical guide vane are provided by Hylton [33]. The simulation method and finite grids agree with the method discussed in Section 2. The equation of convective heat transfer coefficient (HTC) is
where q is wall heat flux; Taw is wall temperature; Tsp is mean temperature at gas inlet.
The comparison results of midspan pressure and HTC are shown in Figure 6 and Figure 7, respectively.
As illustrated in Figure 6 and Figure 7, although the error of HTC at the middle of suction side is larger than other positions due to the interaction phenomenon in shock wave-boundary layer [34], the average absolute error of the CFD simulation on gas pressure agrees well with the test data. The results validate that the turbulence model SST γ-θ is precise in CFD simulation and basically meets the requirement of CHT calculation. Thus, the turbulence model SST γ-θ was adopted in the integrated analysis of film cooling NGV in this paper.
3.2. Temperature Test
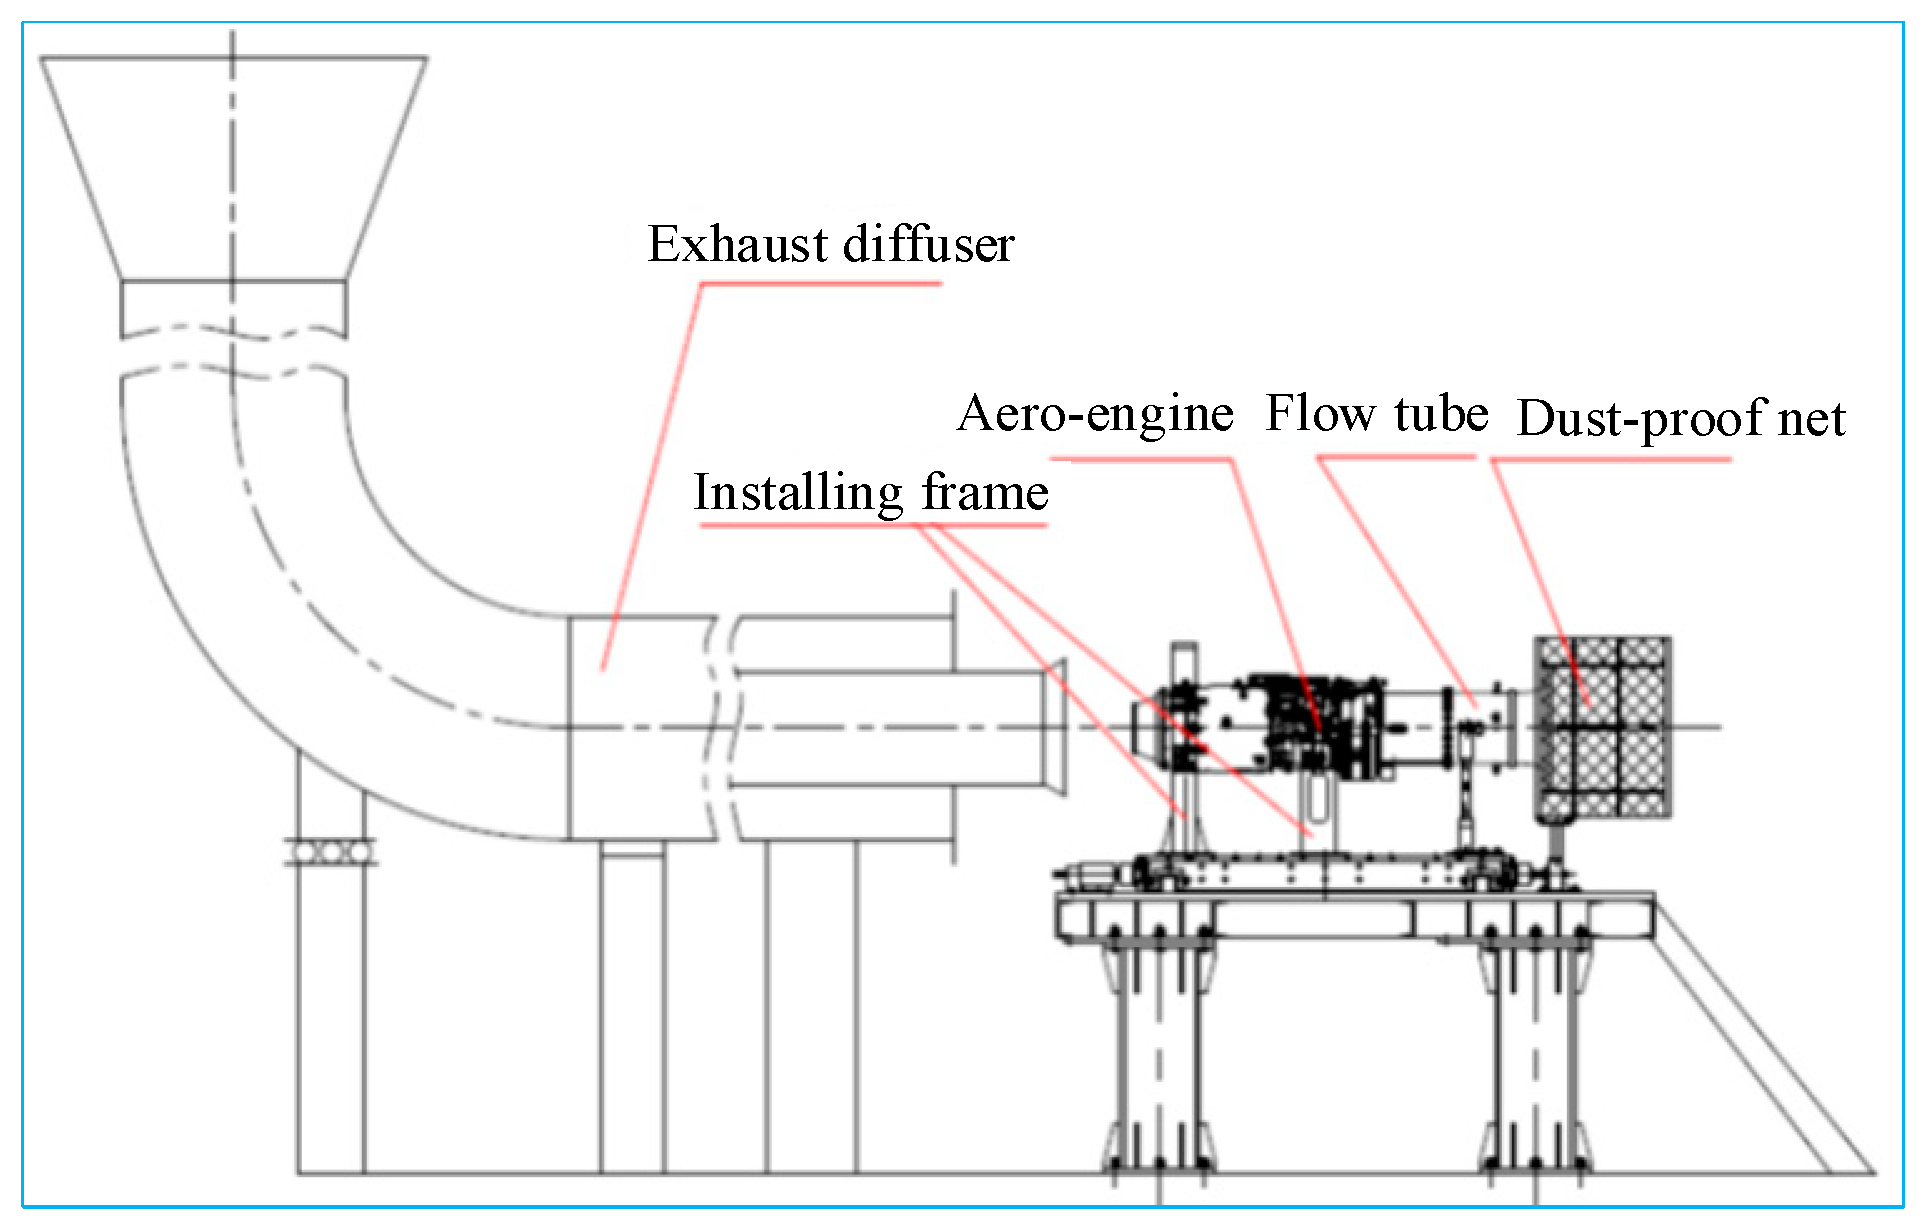
Surface temperature was tested by aeroengine test room in China Gas Turbine Establishment (GTE) under normal atmospheric temperature and pressure. TSP technology was adopted to measure the surface temperature of NGV under the maximum operation conditions. The surface temperature of NGV was tested inside an indoor aero-engine test rig, the structure of which is shown in Figure 8 and the technical parameters of the engine are listed in Table 2.
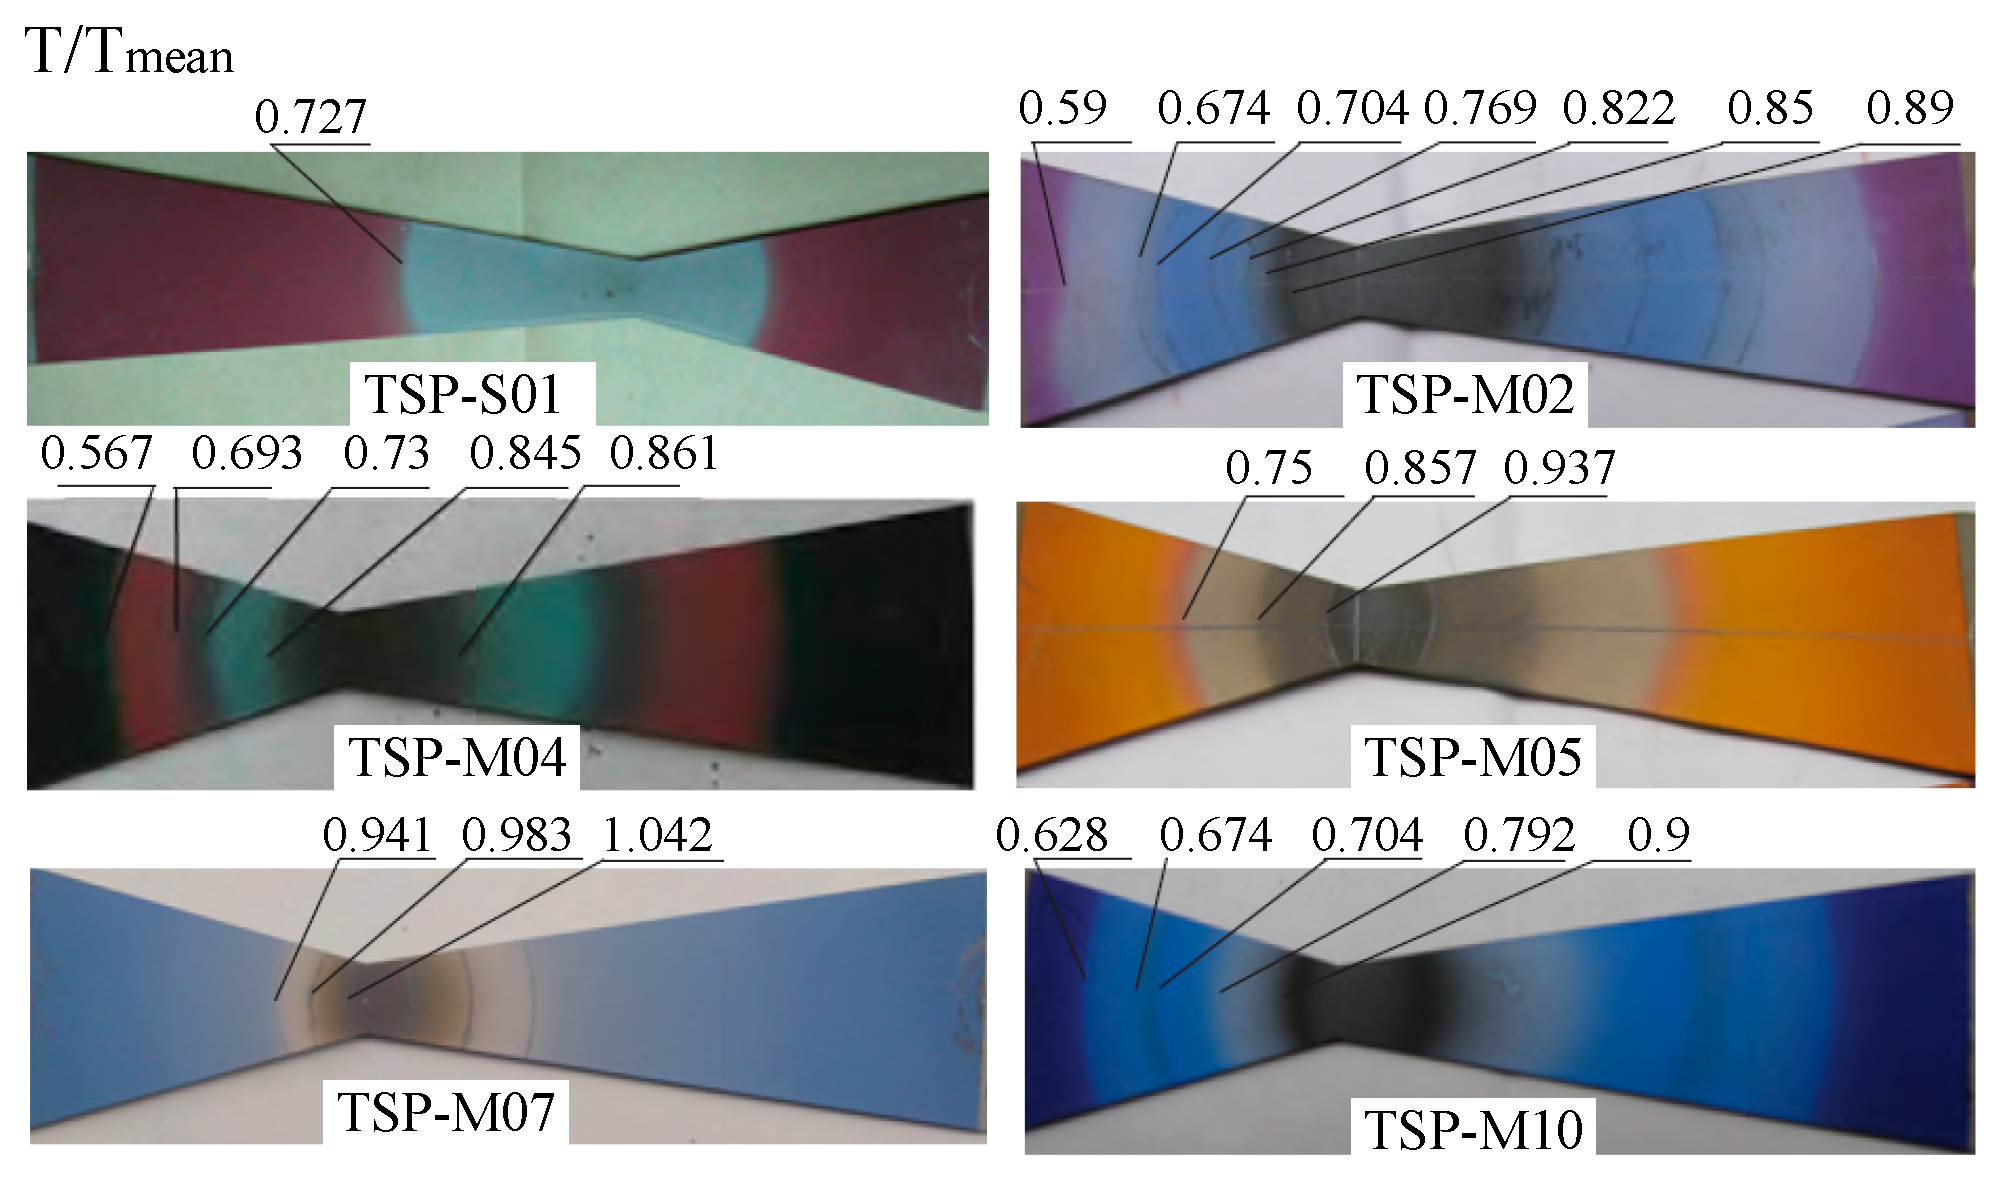
Each TSP material has one temperate sensitive range so that the temperature in the range can be tested. In this paper six typical TSPs were reasonably selected to test the temperatures on different regions of the vane rim. In other words, the guide vane rim was divided into six regions and each region had one TSP. The regions with different colors were explained in Figure 1. Isothermal lines (i.e., discoloration lines) were used to calibrate and explain the TSPs after heating, instead of the colors, by thermocouples. The calibrated temperatures of thermal-indicate standard models under the constant peak temperature for 3 min are shown in Figure 9. In Section 4, the colors under different temperatures on different regions in Figure 9 are regarded as the reference to determine the temperature distributions gained in the integrated analysis of film cooling NGV.
4. Result and Discussions
This section will discuss the integrated analysis of film cooling NGV to validate the effectiveness of the developed enhanced FTS model in computing precision from flow characteristics, temperature distributions, and fluid-structural coupling characteristics, respectively.
4.1. Flow Characteristic Analysis
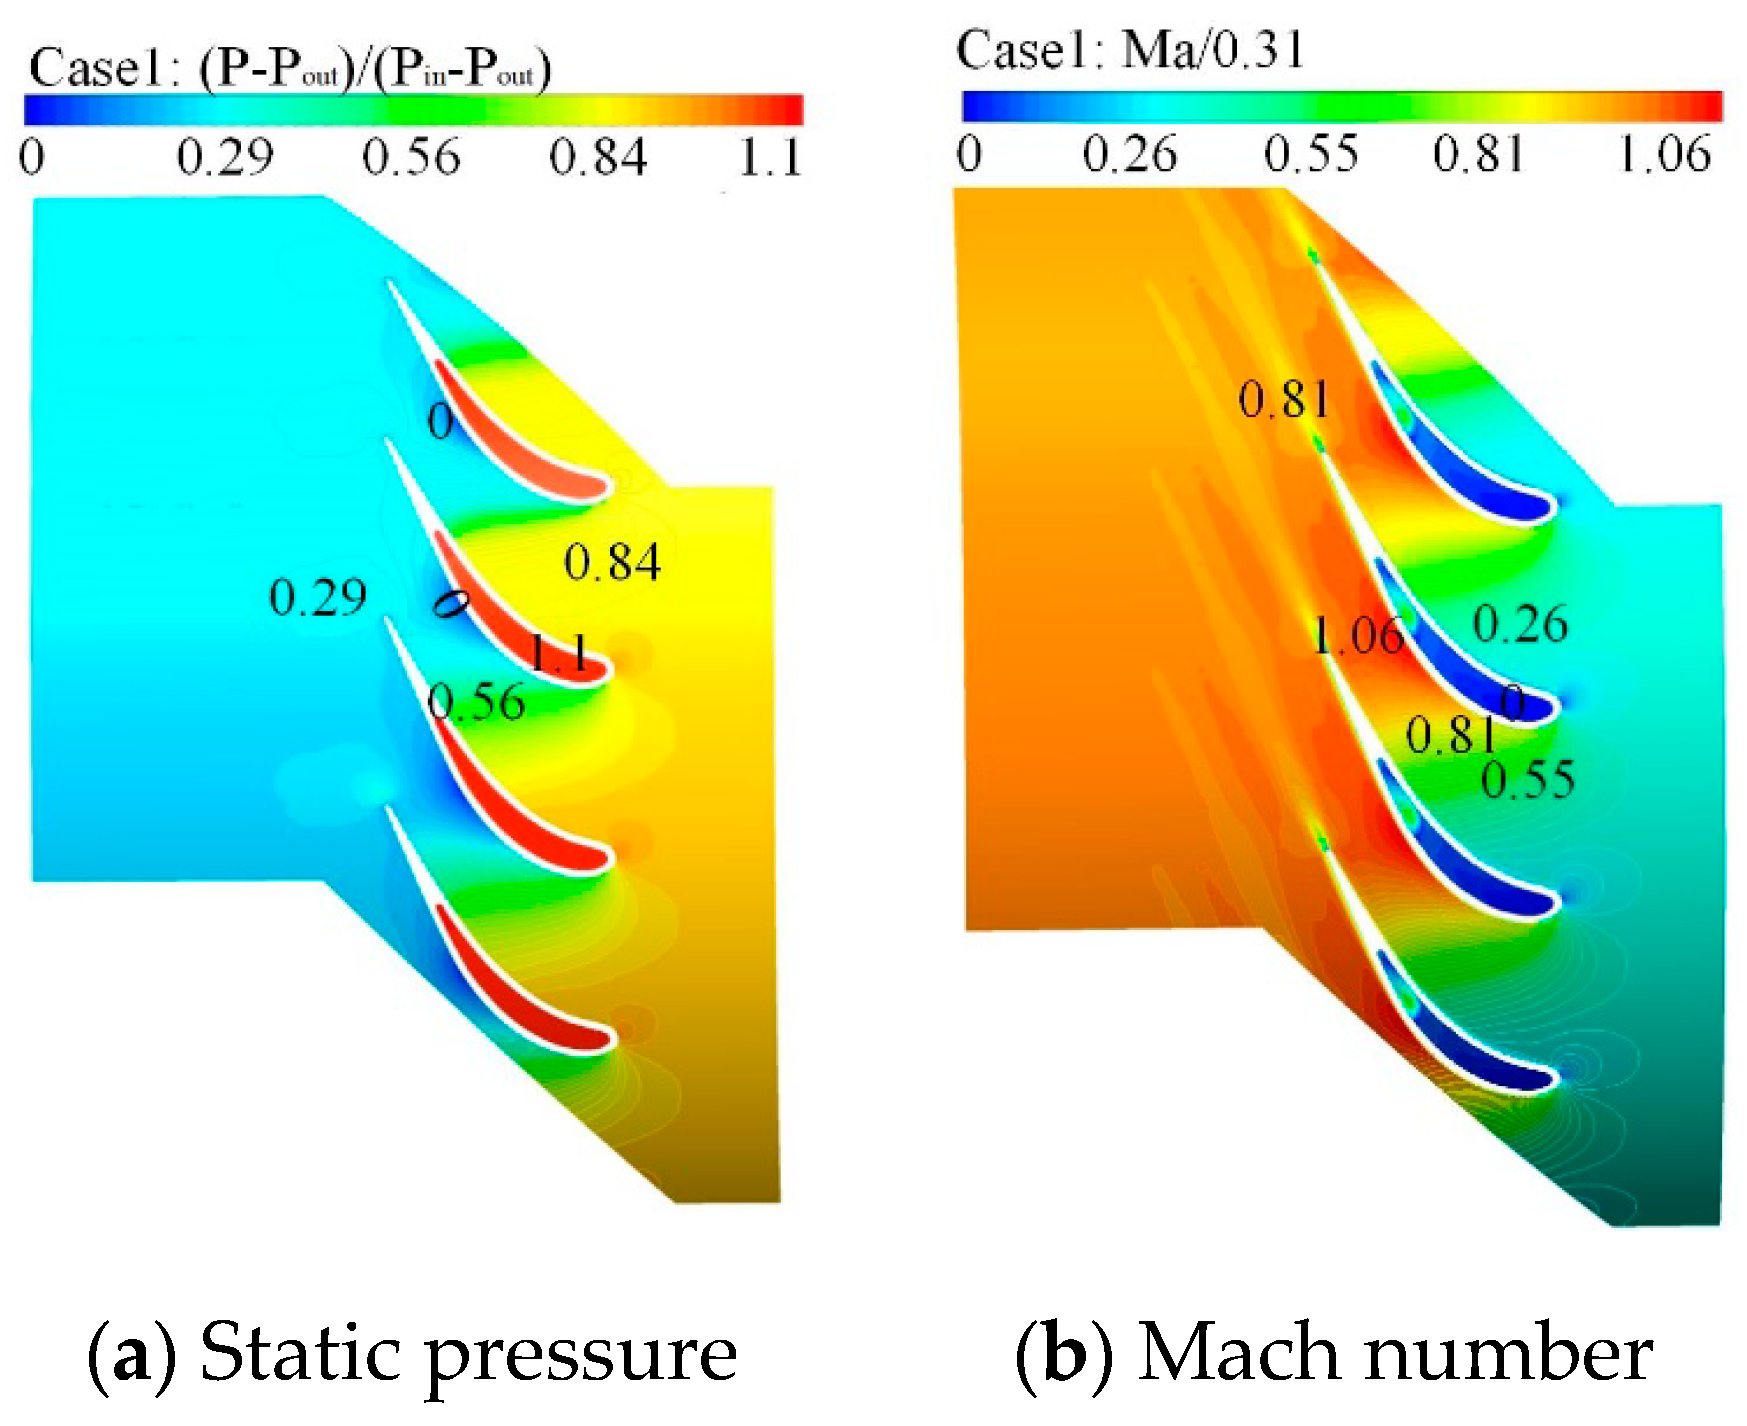
Based on the developed enhanced FTS model, the effects of static pressure and Mach number around the NGV on temperature distribution were studied. Figure 10 shows static pressure and Mach number distribution on midspan of Case 1.
As shown in Figure 10a, the peak pressure appears in the stagnation zone of the leading edge. The distributions law of static pressure on midspan is similar to that in Figure 6, which basically proves the effectiveness of the proposed model. As the pressure wave at suction side is distinct, the rapid expansion of mainstream enhances the Mach number to the maximum (closing to that of the engine entrance) at the second half of the suction side. The increase of gas flow rate greatly increases the heat transfer rate in the region, which is also the basis of the heat transfer characteristic analysis of the NGV surface.
Figure 11 shows the distribution of static pressure differences and Mach number differences between Case 1 under the standard condition and Case 6 under the mean temperature inlet condition at midspan.
As illustrated in Figure 11, the static pressure increases with the increasing inlet temperature, and influences the flow performances of internal cooling air. As the pressure of mainstream rises, the cooling air cannot flow out of the holes at the trailing edge, and radial velocity enlarges. As the flow rate of cooling air directly effects the distribution of thermal stress around the cooling holes, the calculation results can provide a reference for the location of stress concentration.
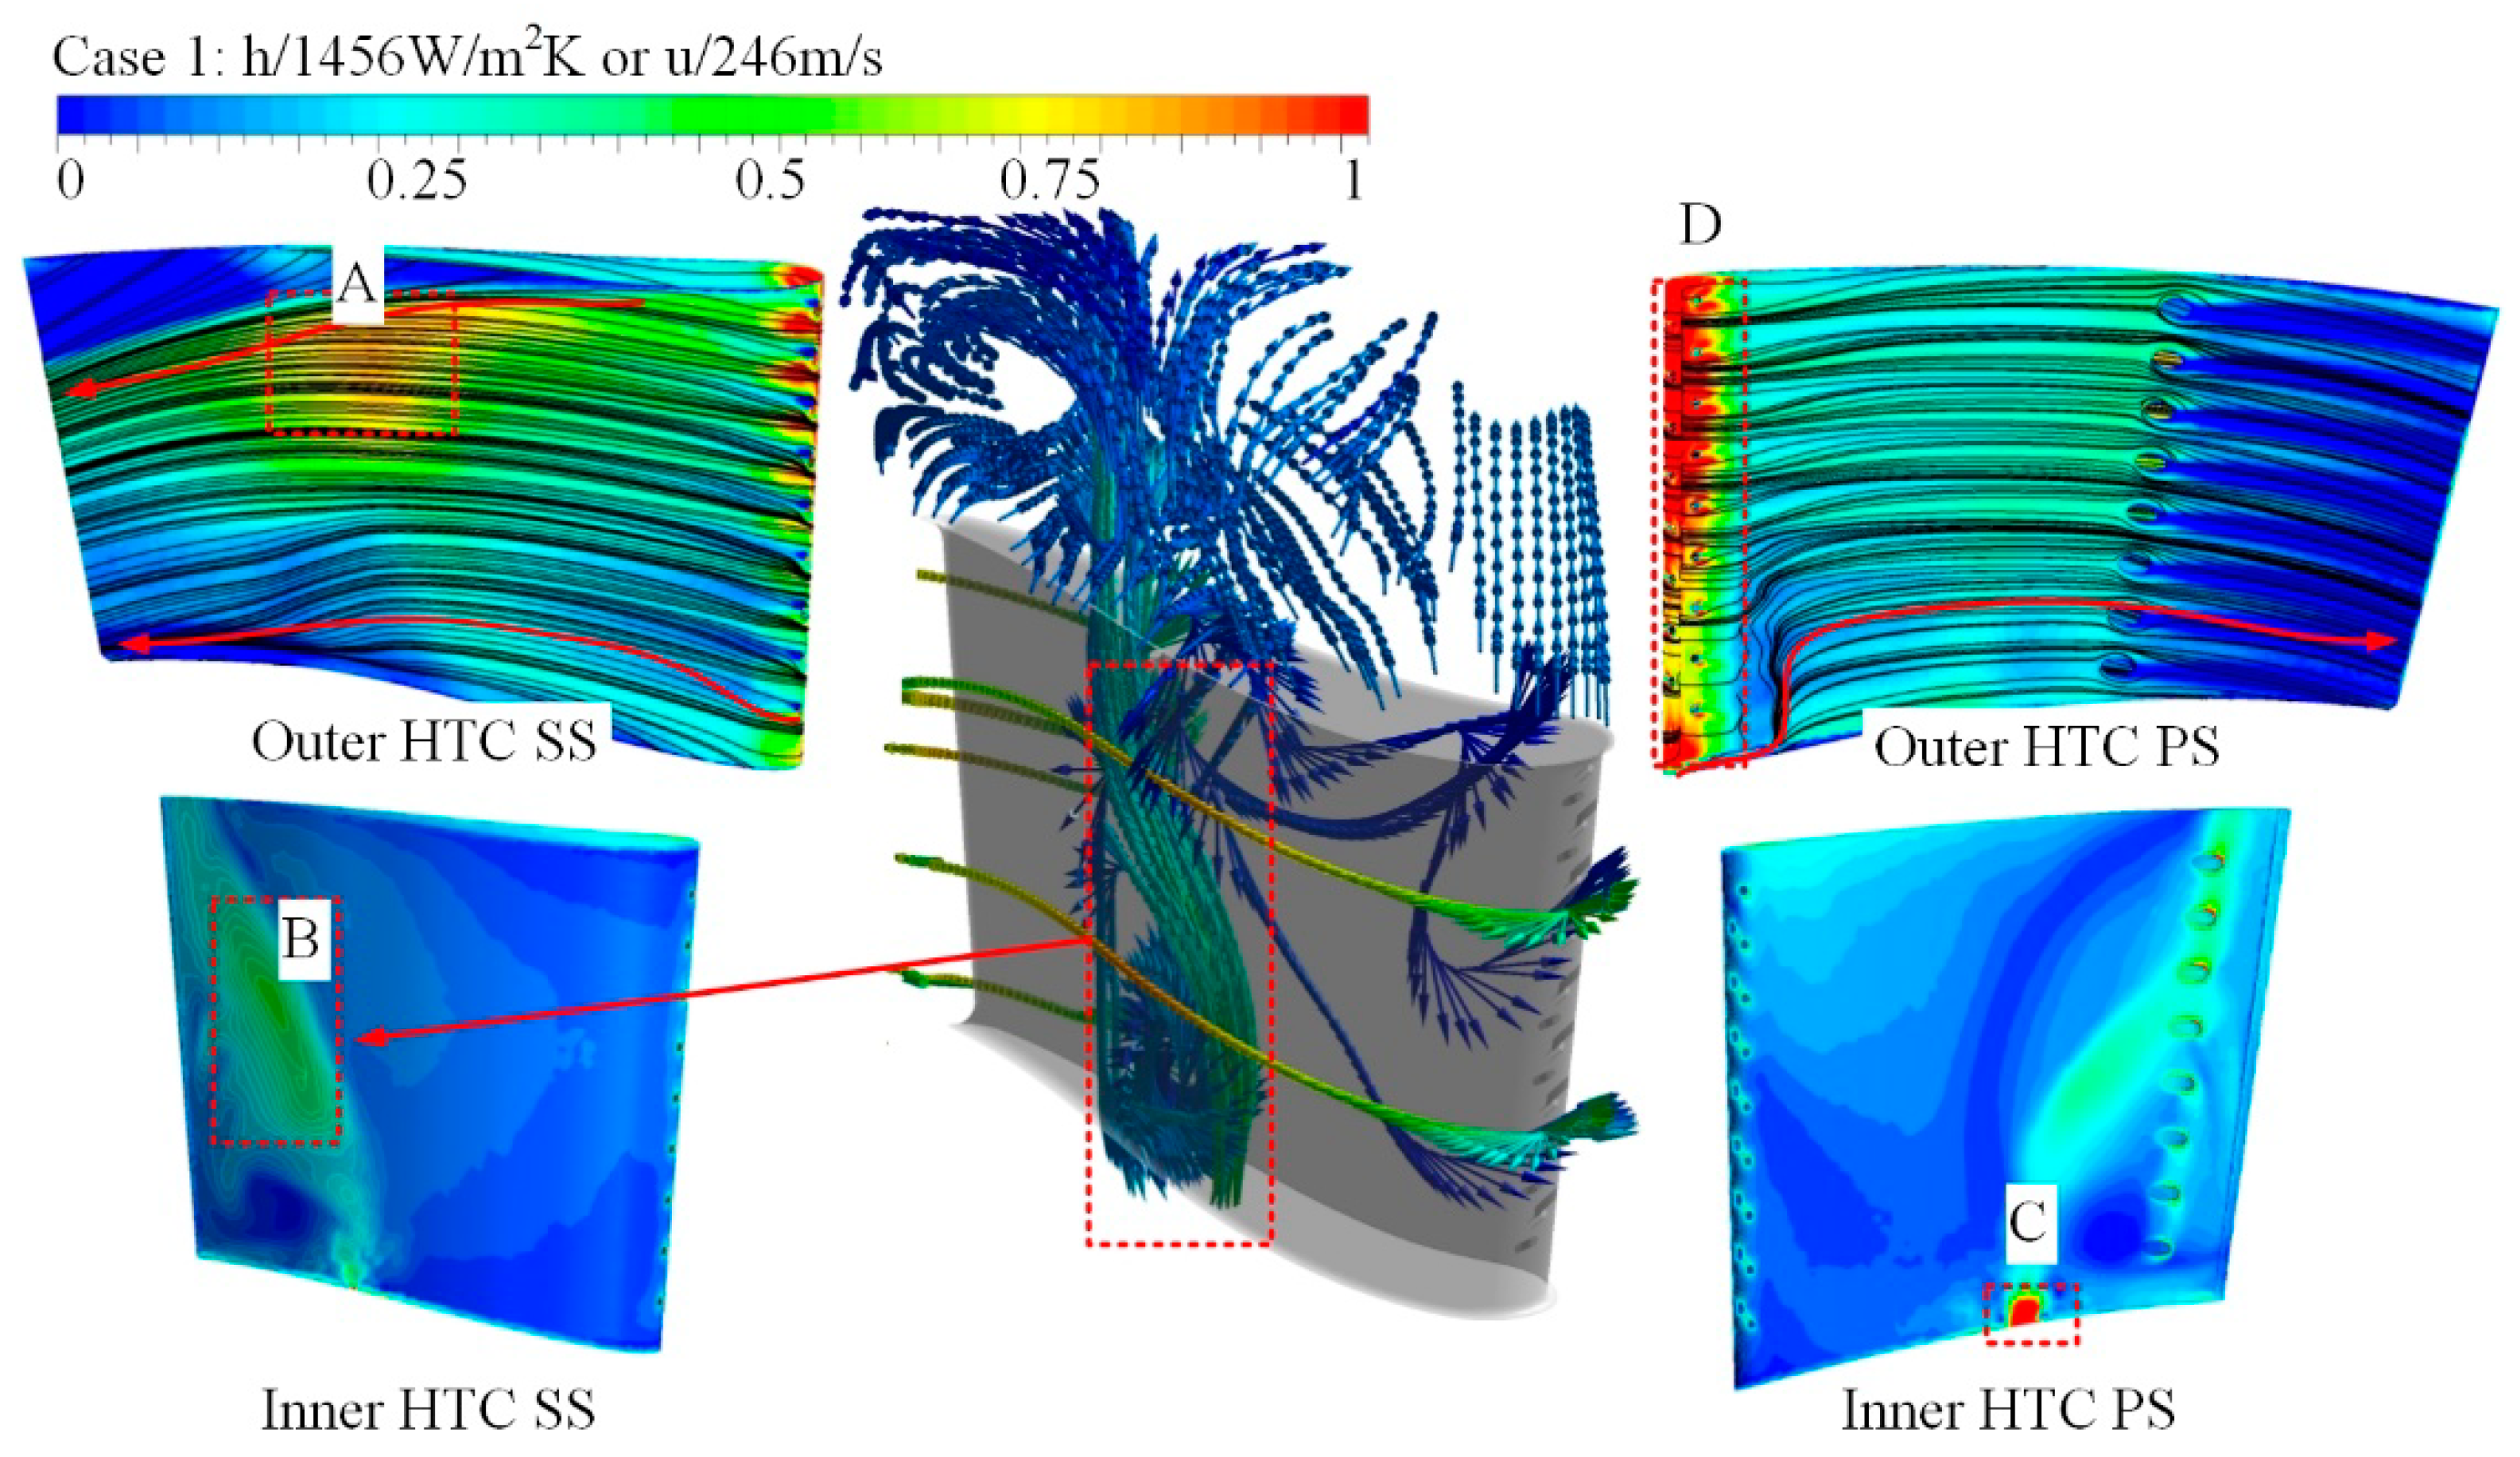
In the integrated analysis of NGV, HTC is an important parameter of determining temperature distribution. Figure 12 shows the flow-heat transfer performance on both the outer and inner surface under the condition of Case 1. Tsp = 1310 and 491 K were employed to calculate outer and inner HTC, respectively.
As revealed in Figure 12, four regions are denoted by A, B, C, and D, to study the HTC performance. Large HTCs that appeared on regions A and D are induced by high flow speed and high pressure in Figure 10. All cooling air injects into NGV through a small hole at the bottom, and causes the local severe heat transfer in region C. The cooling air injected from a small hole directly attacks against region B. In this case, the local HTC on the suction side is improved. In addition, the cooling gas flow outside the outer hub has a circumferential velocity. Therefore, the simulation of HTC is reasonable and effective to validate the effectiveness of CHT calculation.
4.2. Temperature Field Analysis
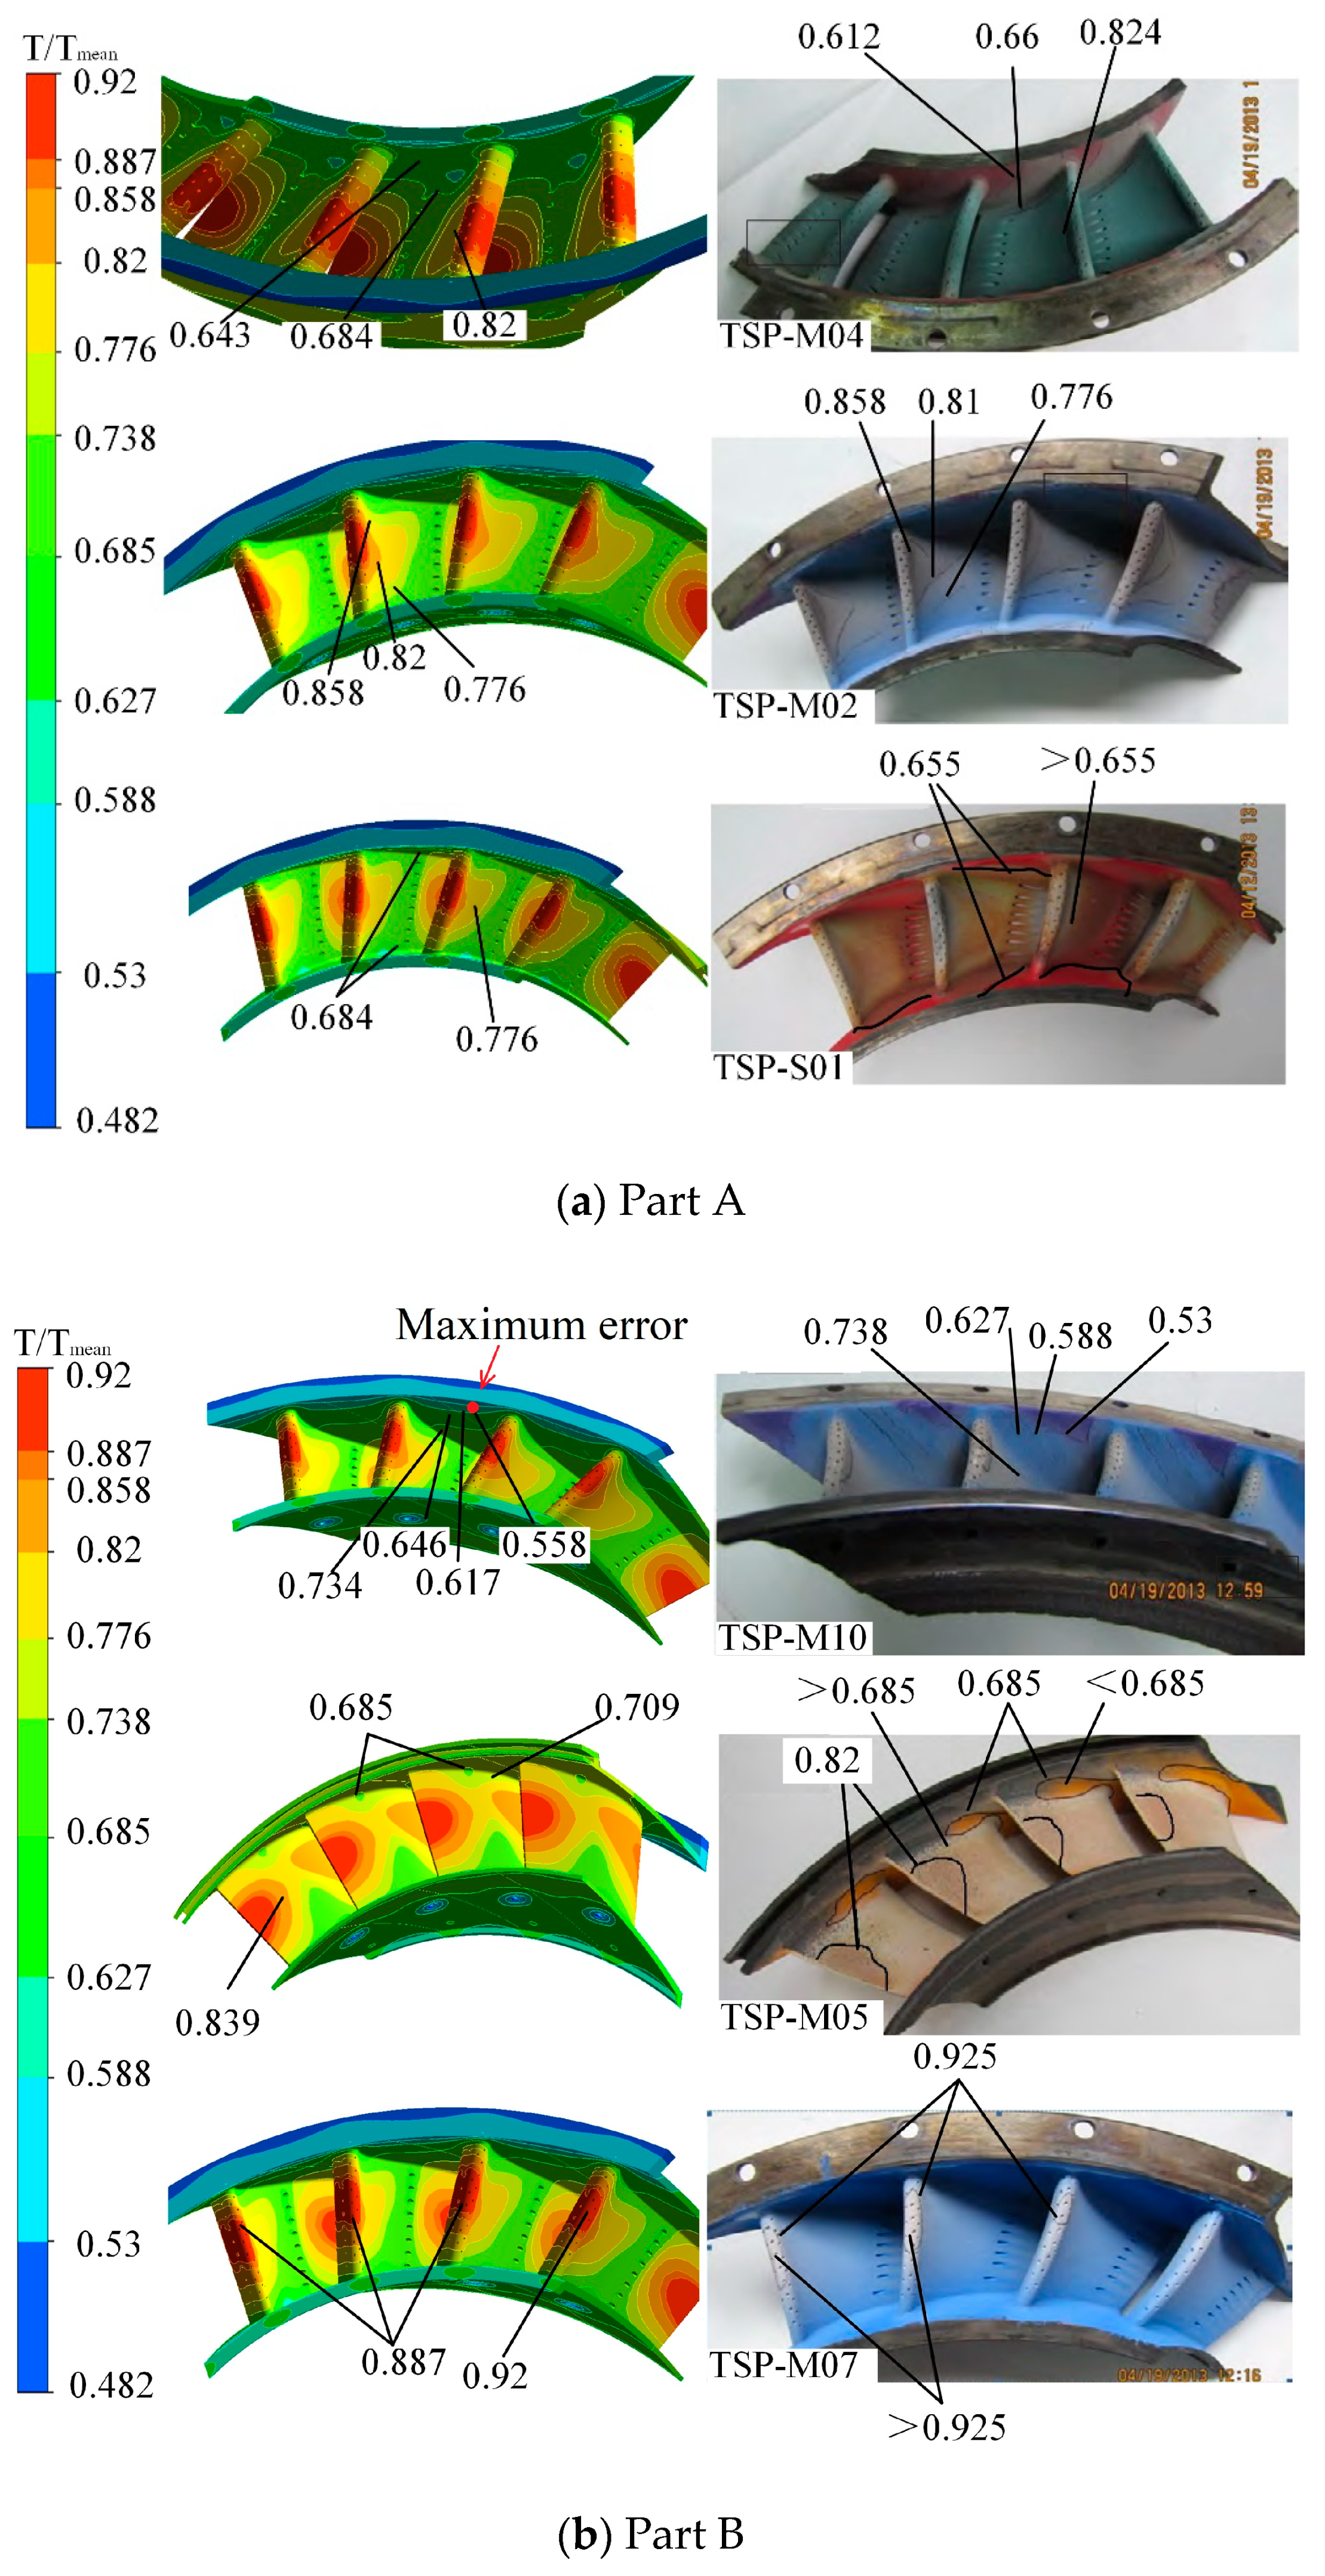
Figure 13 shows temperature distribution contours of Case 1 and TSP test results for the NGV. As illustrated in Figure 13, high temperature appears at both the leading edge and trailing edge with the maximum 1205 K at the center of the vane airfoil on the trailing edge (50% height), and the temperature gradually decreases in the chord direction to a local minimum 821 K at film cooling holes, and the temperatures on the vane agree with these of the TSP standard model in respect of TSP-M02, TSP-M05, and TSP-M07, because the maximum calculation error is only 4.1%. The simulation temperatures at the inner and outer hub of the leading edge are 730–962 K and 802–896 K, respectively. For the same position of TSP test, the temperatures in TSP-M04, TSP-S01, and TSP-M10 are 694–966 K and 801–864 K. Obviously, the maximum error is 5.2% indicated in Figure 13b, which displays that the location and value calculated by the CFD simulation are consistent with the TSP test. In previous works, the NGV was discussed under the same condition using an average temperature inlet and SST model [16]. The results revealed that the temperature of the outer hub of the leading edge varied in [720 K, 808 K] which is much lower than that of TSP test in [801 K, 964 K], and had the error range [6.4%, 10.1%]. Compared to the maximum error 10.1% in the previous work, therefore, the proposed enhanced FTS model is accurate owing to the maximum error of 5.2%.
On the trailing side, a higher temperature observed by the thermal load was relatively lower due to no internal passage. The maximum temperature difference between cooling holes and the trailing edge was 384 K which was quite large for a hollow structure. Similarly, the maximum temperature 1190 K on the pressure side localized at 2/3 the height of the leading edge on the vane airfoil. The same height had the peak value of inlet temperature profile. Moreover, in the inner passage, the air jet raised the temperature and formed a tongue-shaped temperature contour at the suction side and pressure side. This phenomenon is consistent with that observed in the TSP test and the distribution of HTC.
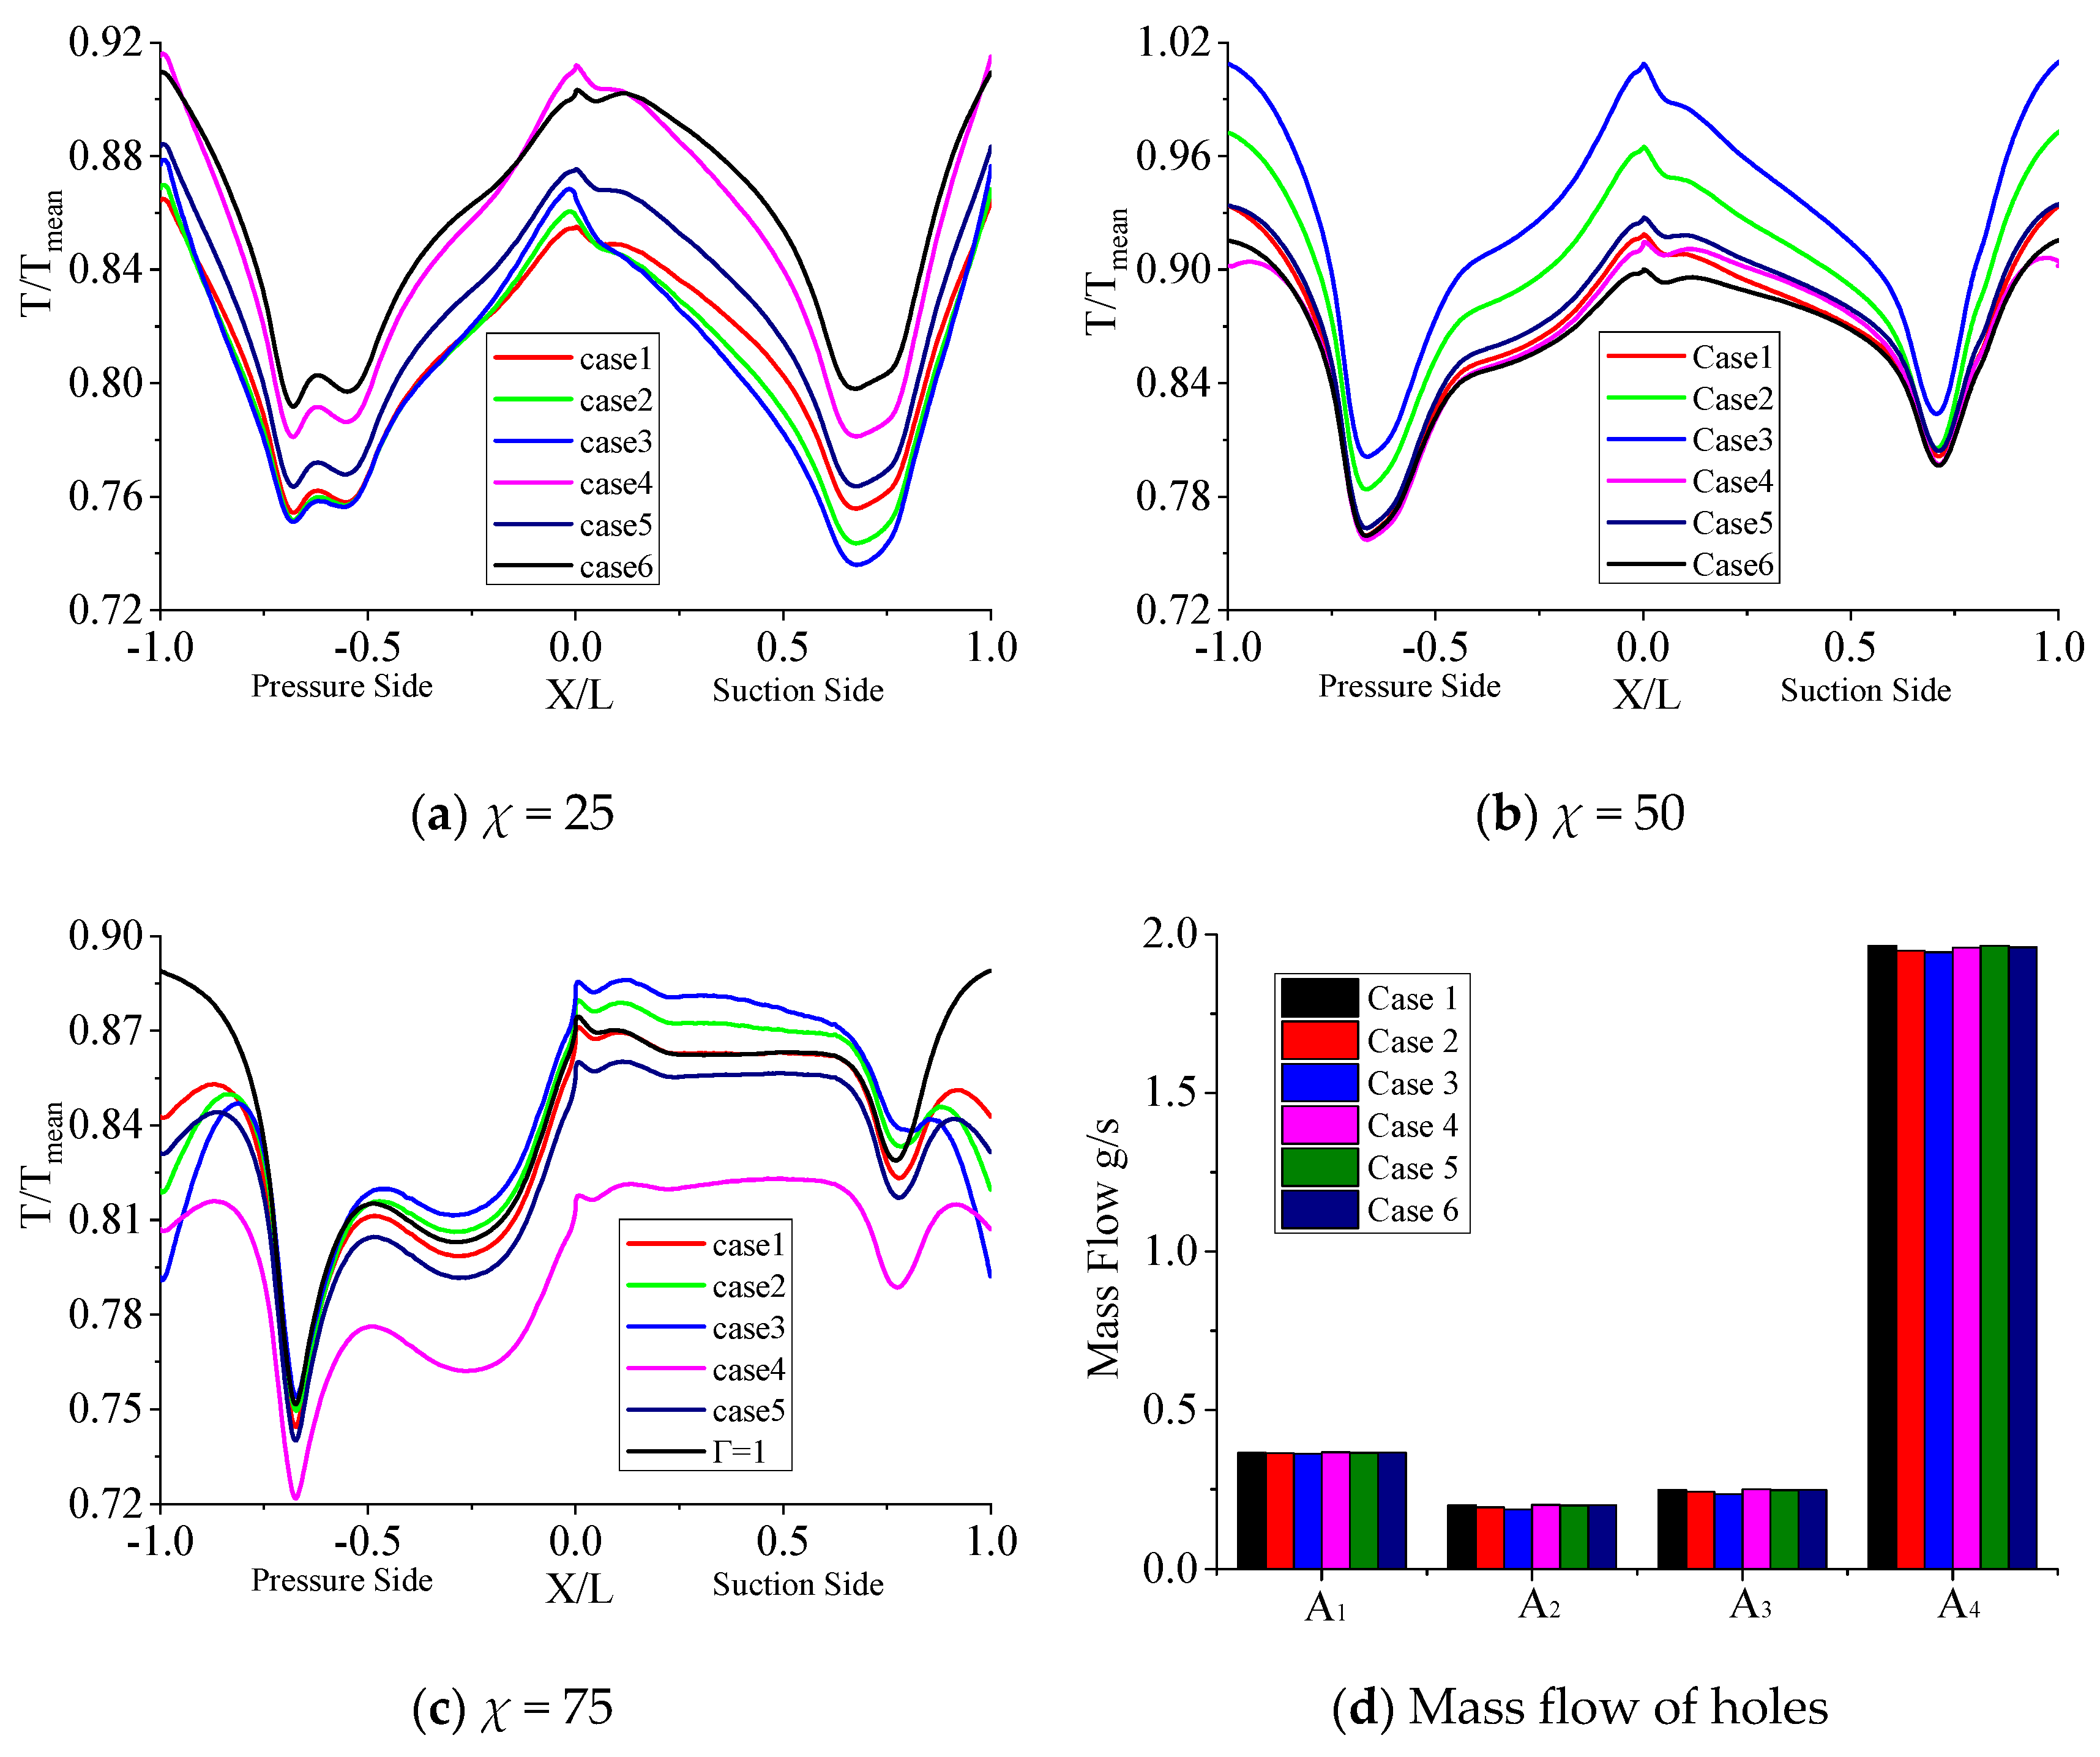
Figure 14 shows temperature profiles distributions at different heights and the total mass flow of cooling air from A1 to A4. As illustrated in Figure 14, the direction of cooling air is positive along the outlet direction of holes. Due to the unequal distribution of cooling air mass flow under different suctions, the maximum temperatures are almost same as 25% and 50% spanwise of the leading edge and trailing edge. The temperature curves at the leading edge are smoother than that of the trailing edge, which indicates that the thermal deformation is relatively gentle and increasing the gradient of inlet temperature can enlarge the temperature gradient in the midspan. As the flame peak shifts from the outer to inner hub, the upper temperature decreases obviously. The max-temperature drop on the suction side is 8%. The distribution of temperature profiles regarding the uniform temperature inlet is different from the test results in Figure 13. Without non-uniform inlet temperature, the midspan temperature at the leading edge is the lowest in all Cases. By contrast, the temperature at 75% height on the trailing edge is the highest. The total mass flow of holes under different lines slightly changes with the increasing inlet temperature gradient.
4.3. Thermo-Structural Analysis
A large enough gap between parts is required due to the thermal expansion under high-temperature operation. As collision and compression always unavoidably appear among different parts of the guide vane rim, a periodic boundary condition was utilized to prevent the circumferential displacement of the NGV as shown in Figure 3. To find the structure strength of the NGV, the equivalent stress σvon (also called von Mises stress) was adopted, i.e.,
where σx, σy, and σz indicate the stresses in x, y, and z directions, respectively.
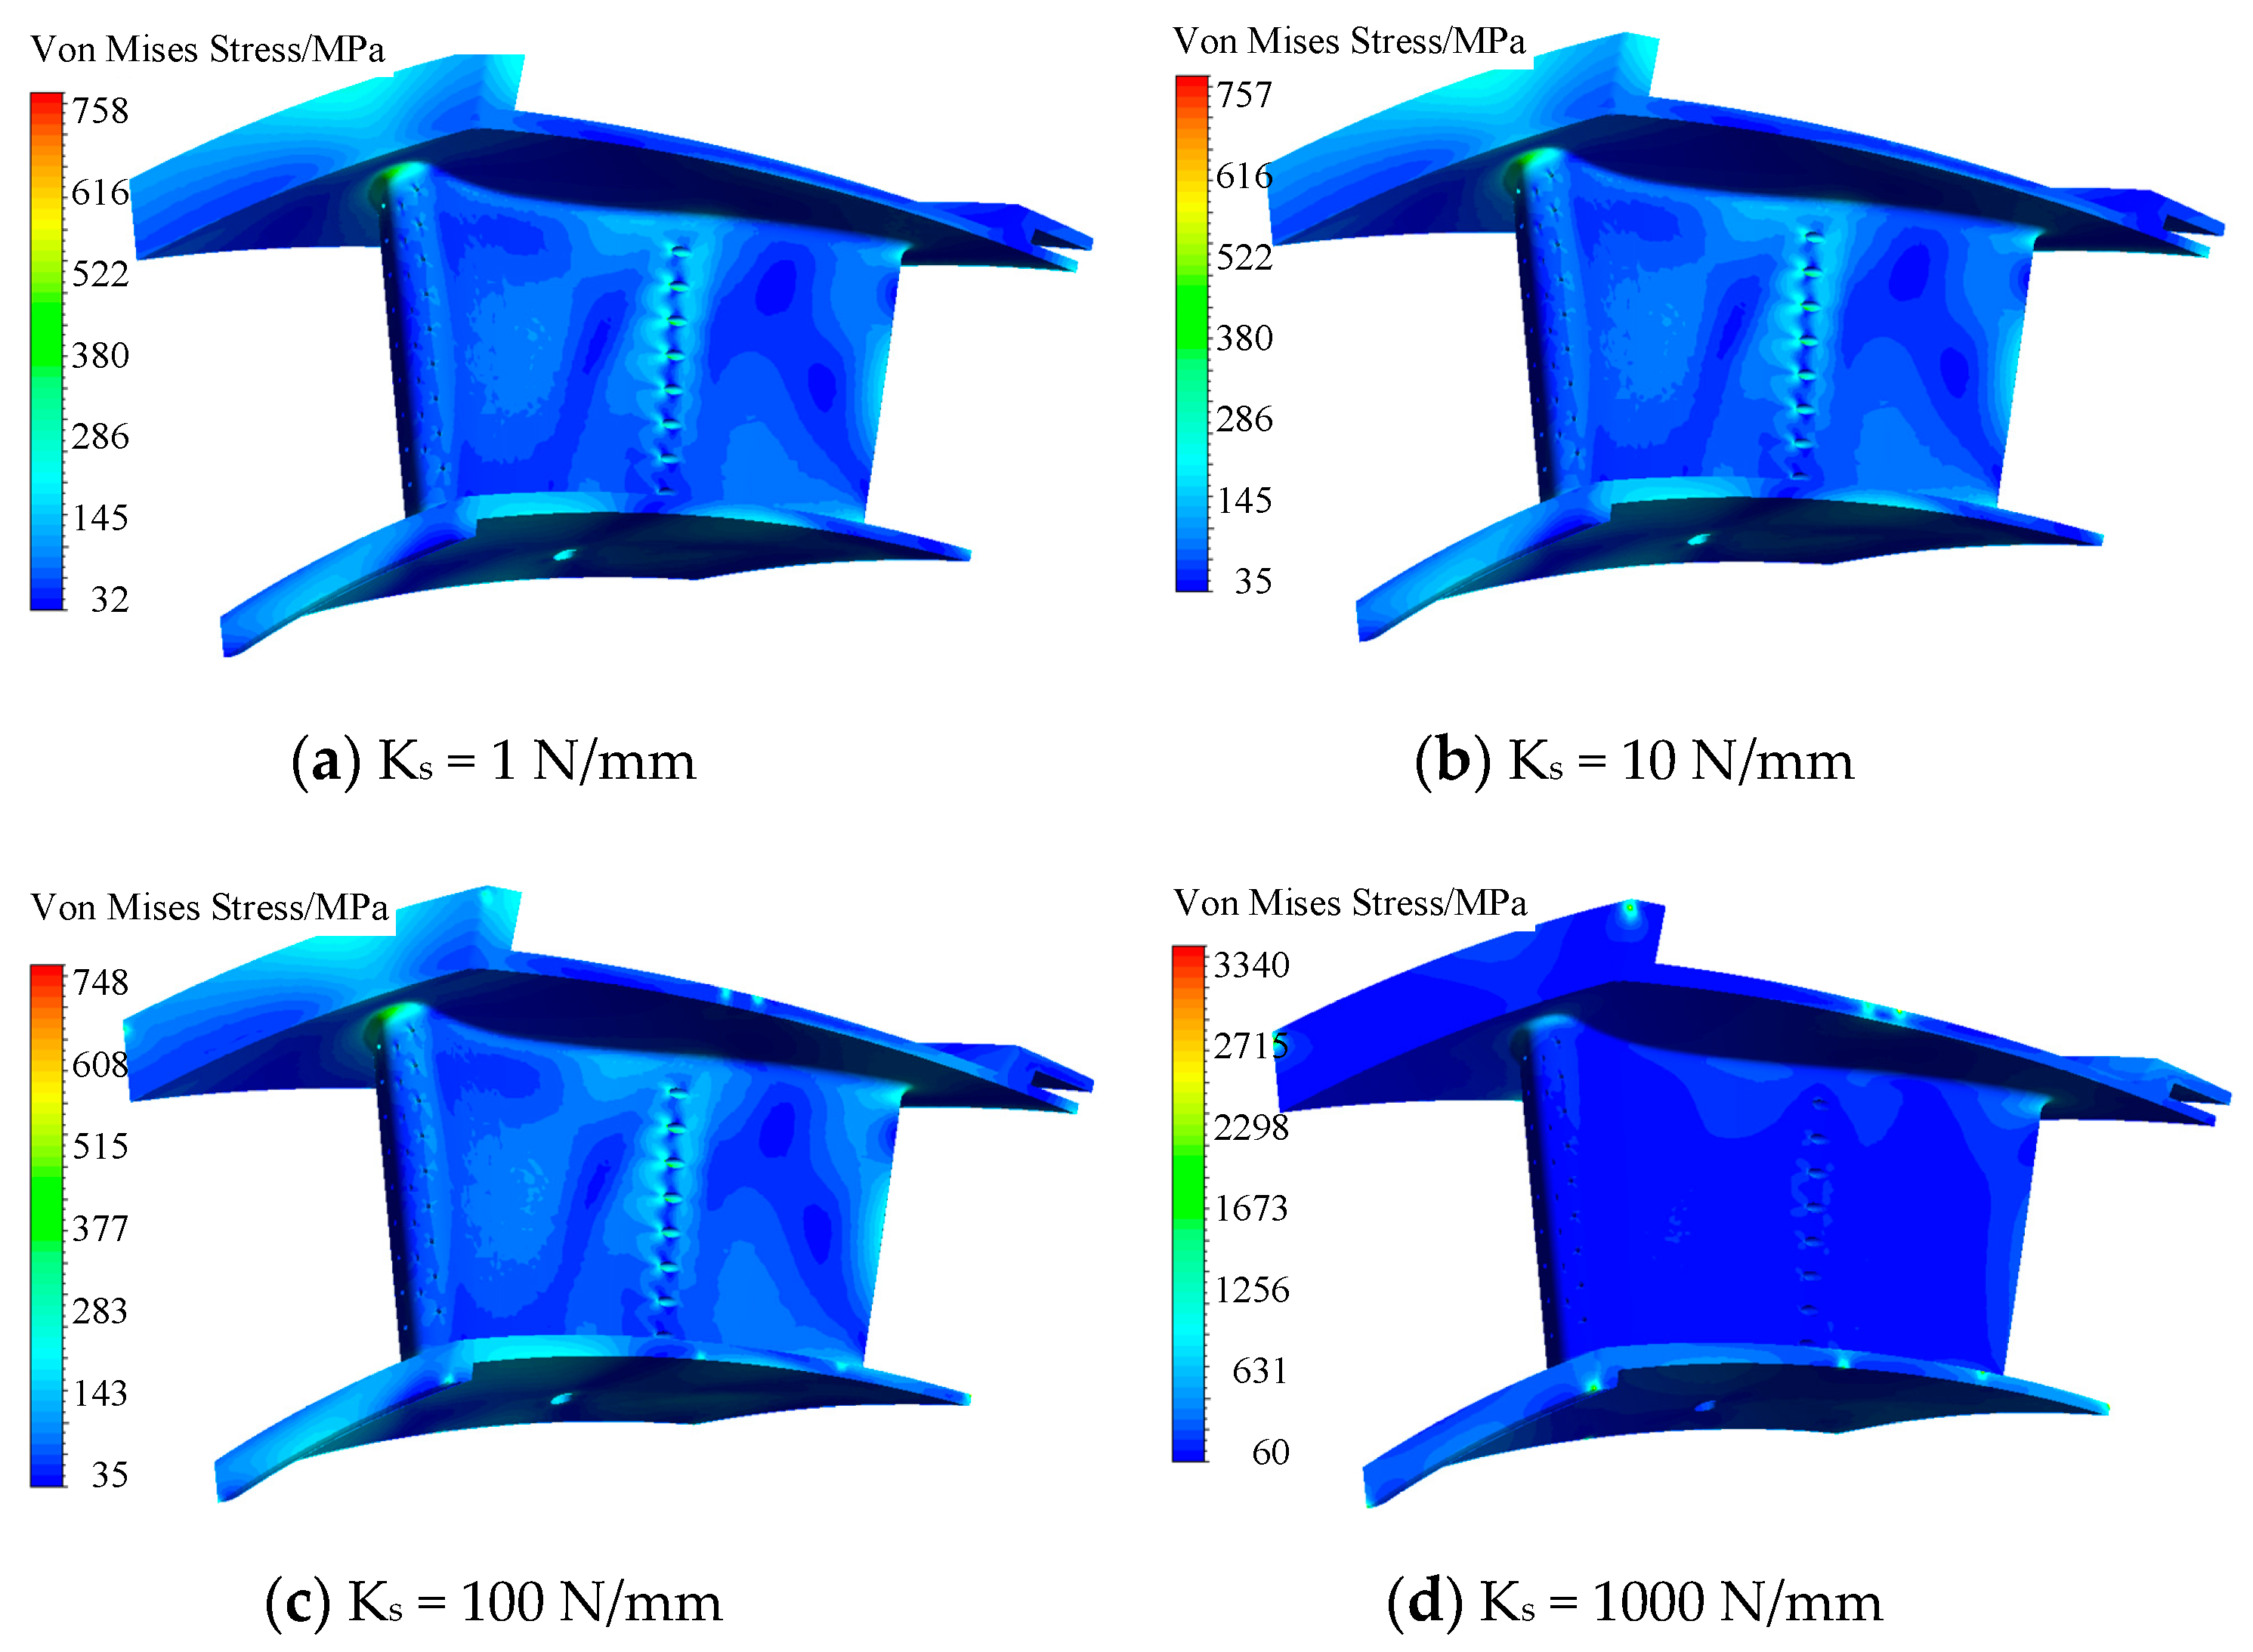
The aperture of NGV connections is large enough (i.e., larger than the deformation caused by thermal expansion) to allow the vane to move freely [35]. Thus, the thermal stress caused by the connection structure is negligibly small, which means a free boundary may be suitable for this problem. However, according to the thermal-elastic constitutive equations, if all boundaries are free, the equations will lack constraints. In this case, the weak spring approach is used to avoid computational divergence. Weak spring was added at eight grid nodes at the boundaries on three directions, as shown in Figure 15. The weak springs provide a virtual force on the structure boundaries, so that the convergence can be ensured. To reduce the boundary force, the spring stiffness should be as small as possible. However, when the stiffness coefficient is small enough, the simulation will be diffused. To find the balance between computational convergence and over-constrained, the thermal stress results of four stiffness coefficients Ks are shown in Figure 16. The increase of spring stiffness will lead to stress concentration at the grid nodes. Obviously, increasing the spring stiffness could not reflect the real situation. According to the simulation test, this paper considers the spring stiffness as 1 N/mm.
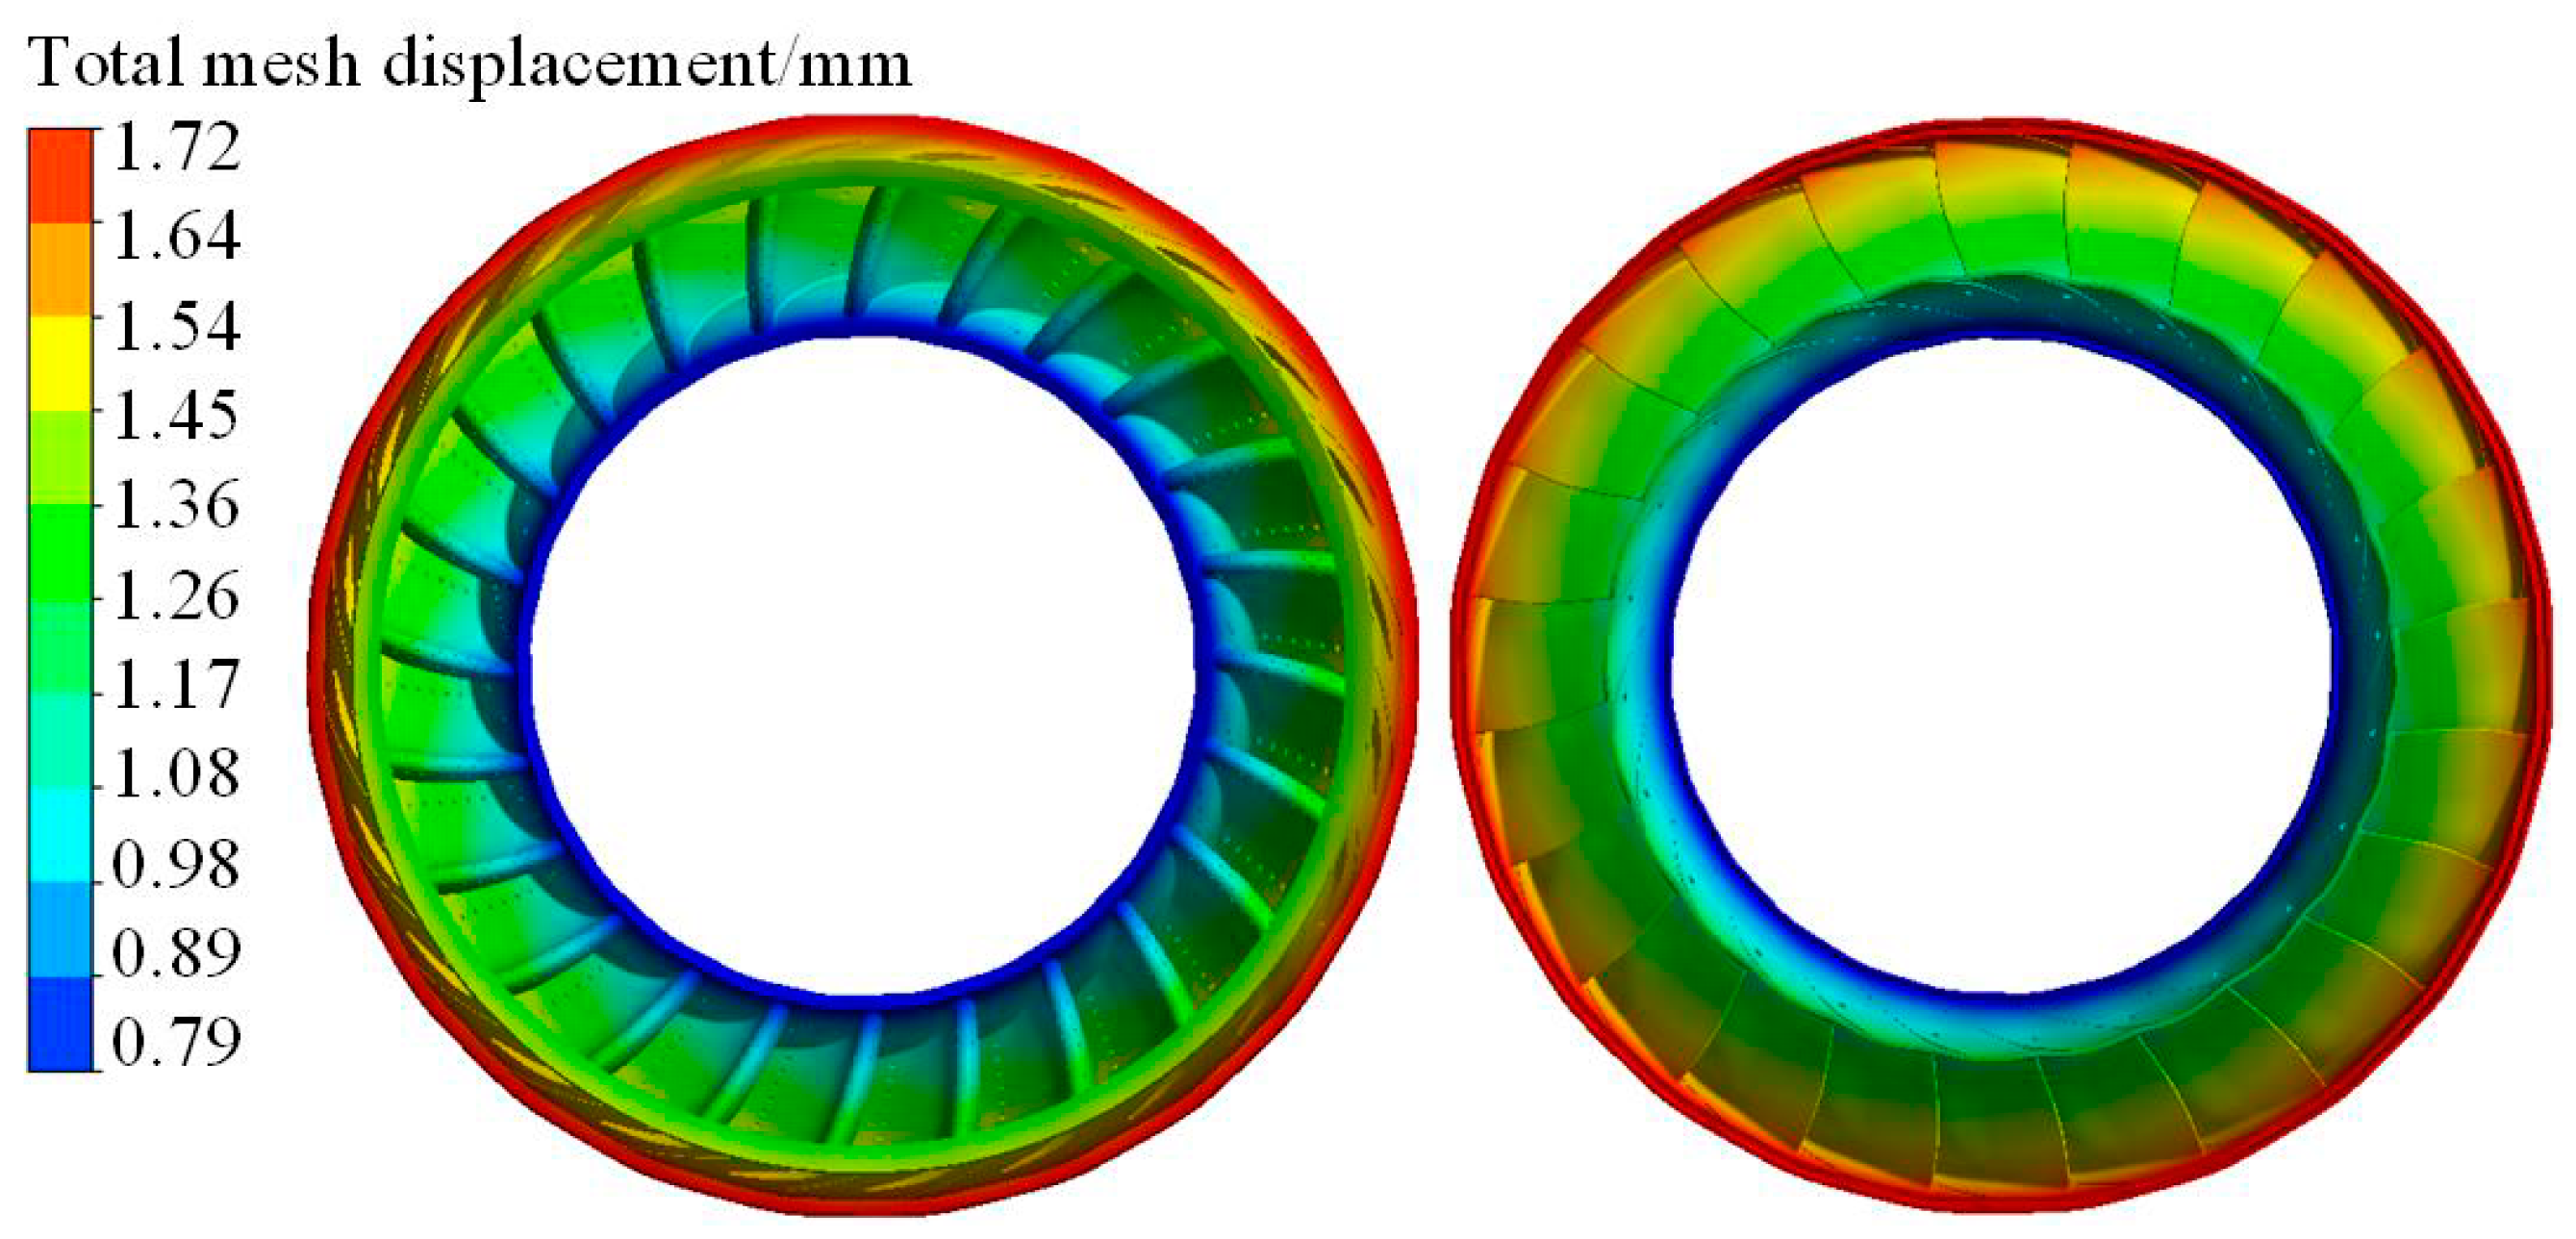
With respect to the FE analysis, the expansion and total mesh displacement are shown in Figure 17. As revealed in Figure 17, the maximum mesh displacement was 1.72 mm. As it is difficult to observe the deformation in one-to-one scaled images, the deformation in Figure 17 was displayed by magnifying 65 times. As shown in Figure 13, the outer and inner hub at the leading edge are cooler than the same positions of the trailing edge. Therefore, the trailing edge mainly bears the tension load. The deformation was proportional to the radial direction.
Guo [36] studied a type of NGV with a similar structure, material, and working environment. The comparison of the Von Mises stress on the NGV surface with the actual cracks [36] is shown in Figure 18. Compared with the experiment, the locations of predicted stress concentration show the consistency with the cracks on the gas turbine vanes after an operating period.
Generally, the thermal stress is induced by the total thermal expansion from hot mainstream in vane cascade and the centralized cooling structures, such as cooling holes, inject holes, etc. As seen in Figure 18, thermal stress concentrations exist at the junctions between the vane and hub, because vane ring limits radial expansion. The stresses may be relaxed by junction chamber described in Table 1.
The other thermal stress concentrations occur at the edges of the cooling hole at the trailing edge. The maximum stress (758 MPa) appears in the fifth cooling hole counting from the hub. Specifically, the number of cracks on the holes of the trailing edge are more than that of the leading edge. Thus, the thermal stress concentration in cooling holes is dangerous as to induce cracks when a mass of cooling air goes through a small hole in hot metallic materials.
4.4. Effect of Non-Uniform Temperature Inlet
The aim of integrated analysis is to show how the flow environment affects structural thermal stress. Figure 19 shows the relationship between cooling air mass flow rate and thermal stress under different cooling holes at the trailing edge from Case 1 to Case 6. Under the standard conditions, the air mass flow first increases and then decreases in the cooling holes in the radial direction. The kinetic energy of cooling gas reaches the maximum between No. 6 and No. 7 holes, and then declines slowly. In most cases, the distribution of maximum stress in holes is similar to the distribution of air mass flow. However, it is more sensitive than the cooling air flow. With the increasing inlet temperature gradient, the maximum hole mass flow moves from hole No. 6 to No. 7, resulting from the increasing radial velocity indicated in Figure 11b. The results of integrated analysis show that the slight change of aerodynamic environment may lead to a significant increase in the thermal stress of NGV, which is different from the findings in the traditional isolation analysis.
5. Conclusions
The target of this paper was to perform the integrated analysis of film cooling nozzle guide vane (NGV) by proposing an enhanced fluid-thermo-structural model, by adopting an efficient turbulence model (i.e., SST γ-θ model), and weak spring approach, in respect to computational fluid dynamics (CFD) and computational solid dynamics (CSD). Through the validation of the enhanced model and the integrated analysis of film cooling NGV involving the characteristics of flow field, temperature field, and thermo-structural coupling field, some conclusions are summarized as follows:
- The enhanced FTS model can precisely predict flow field, temperature field, and thermo-structural coupling field, following the general working state of film cooling NGVs. Compared with the traditional method, the accuracy of temperature field calculation is improved by about 5%.
- The simulated results of pressure and convective heat transfer coefficient with SST γ-θ model agree well with test data. Both temperature distribution and crack generation position are basically consistent with a real vane and only have an error of <6% of the maximum predicted temperature. It is indicated that the enhanced FTS model is accurate and effective.
- The increasing inlet temperature gradient hardly affects the pressure distribution at the midspan. In this case, however, the radial velocity of the inner cooling gas near the trailing edge holes increase, and temperature gradient and thermal stress is enhanced by about 7.5%. The peak change of gas temperature from the outer to inner hub hardly influences the distribution of cooling air, while the max thermal stress reduces by 16%. It is revealed that thermal stress is largely affected by aerodynamic characteristics and the enhanced FTS model is reasonable and effective.
- Thermal stress concentrations are located at the hole edges of the trailing edge near the outer hub and the junction between the vane and ring, respectively. Although the temperature around the holes is small, the thermal stress is almost twice that at junctions. Therefore, the cracks appear at the edge of holes before appearing at the junctions. This is significant for designing film cooling NGV.
In short, the developed enhanced FTS model is validated to hold high-computational precision and efficiency in the integrated analysis of film cooling NGV, by comparing the temperature characteristics, fluid field distribution, and thermo-structural coupling characteristics with the experimental investigation. The efforts of this study provide a promising modeling strategy for the integrated design of NGV in engineering.
Author Contributions
Conceptualization, Y.-T.A. and P.G.; Methodology, P.G.; Software, P.G.; Validation, P.G. and C.-W.F.; Formal Analysis, P.G. and C.-W.F.; Investigation, P.G. and C.-W.F.; Resources, Y.-T.A. and C.-W.F.; Data Curation, P.G. and C.-W.F.; Writing–Original Draft Preparation, P.G.; Writing–Review and Editing, C.-W.F.; Visualization, P.G.; Supervision, Y.-T.A. and C.-W.F.; Project Administration, Y.-T.A. and C.-W.F.; Funding Acquisition, Y.-T.A. and C.-W.F.
Funding
This research was funded by [National Natural Science Foundation of China] grant number [51406124 and 51605016], and [Research Start-up funding of Fudan University] grant number [FDU38341]. The APC was funded by [51406124 and FDU38341].
Conflicts of Interest
The authors declare that there is no conflict of interests regarding the publication of this article.
Nomenclature
| P | Pressure (Pa) |
| T | Temperature (K) |
| t | Time (s) |
| h | Convective heat transfer coefficient (W/m2·K) |
| C | Specific heat capacity (J/kg·K) |
| E | Young’s modulus (Pa) |
| K | Heat conductivity of the material (W/m·K) |
| W | Air mass flow (kg/s) |
| Ma | Mach number |
| w | Percentage of cold coolant flow (%) |
| F | Gas-oil ratio |
| z | Number of elements |
| q | Wall heat flux |
Greek letters
| η | Efficiency |
| ρ | Density (kg/m3) |
| ν | Poisson’s ratio |
| α | Thermal expansion coefficient (K−1) |
| σ | Stress (MPa) |
| π | Compressor pressure ratio |
| χ | Radial dimensionless distance |
| Ф | Average change coefficient |
Subscript
| eff | Effectiveness |
| von | Von Mises |
| eng | Engine inlet |
| com | Compressor |
| ex | Exhaust nozzle |
| * | Total |
| c | Coolant |
| fu | Fuel |
| sh | Shaft |
| ca | Cooling air inlet |
| mean | Average temperature |
| g | Ideal gas |
| rs | Combustor |
| in | Mainstream inlet |
| out | Mainstream outlet |
| cha | Change |
| aw | Adiabatic wall |
| sp | Specified |
| int | Internal |
| ext | External |
| n | Number of elements |
Acronyms
| NGV | Nozzle guide vane |
| CHT | Conjugate heat transfer |
| CFD | Computational Fluid Dynamics |
| CSD | Computational Solid Dynamics |
| FTS | Flow-thermo-structural |
| GTE | China Gas Turbine Establishment |
| HTC | Convective heat transfer coefficient |
| TSP | Temperature-sensitive paint |
References
- Ke, Z.; Wang, J. Conjugate heat transfer simulations of pulsed film cooling on an entire turbine vane. Appl. Therm. Eng. 2016, 109, 600–609. [Google Scholar] [CrossRef]
- Funazaki, K.I.; Yokota, M.; Yamawaki, S. Effect of Periodic Passing Wakes on the Leading Edge Film Cooling Effectiveness. Studies on 90-degree-inclination Cooling Holes. Trans. Jpn. Soc. Mech. Eng. Ser. B 1995, 61, 2698–2705. [Google Scholar] [CrossRef]
- Maheu, N.; Moureau, V.; Domingo, P. Large-Eddy Simulation of Flow and Heat Transfer Around A Low-Mach Number Turbine Blade; ERCOFTAC Book Series; Springer: Berlin/Heidelberg, Germany, 2012. [Google Scholar]
- Liu, J.J.; An, B.T.; Liu, J.; Zhan, W. Leading edge film cooling enhancement for an inlet guide vane with fan-shaped holes. J. Therm. Sci. 2010, 19, 514–518. [Google Scholar] [CrossRef]
- Barringer, M.D.; Thole, K.A.; Polanka, M.D. Experimental evaluation of an inlet profile generator for high-pressure turbine tests. J. Turbomach. 2007, 129, 382–393. [Google Scholar] [CrossRef]
- Barringer, M.D.; Thole, K.A.; Polanka, M.D. Effects of combustor exit profiles on vane aerodynamic loading and heat transfer in a high pressure turbine. J. Turbomach. 2009, 131, 285–295. [Google Scholar] [CrossRef]
- Montomoli, F.; Massini, M.; Yang, H.; Han, J.C. The benefit of high-conductivity materials in film cooled turbine nozzles. Int. J. Heat Fluid Flow 2012, 34, 107–116. [Google Scholar] [CrossRef] [Green Version]
- Povey, T.; Qureshi, I. A hot-streak (combustor) simulator suited to aerodynamic performance measurements. Proc. Inst. Mech. Eng. Part O J. Risk Reliab. 2008, 222, 705–720. [Google Scholar] [CrossRef]
- Chana, K.S.; Povey, T.; Hones, T.V. Heat transfer and aerodynamics of an intermediate pressure nozzle guide vane with and without inlet temperature non-uniformity. In Proceedings of the ASME Turbo Expo, Atlanta, GA, USA, 16–19 June 2003. [Google Scholar]
- Wang, Z.; Wang, D.; Liu, Z.; Feng, Z. Numerical analysis on effects of inlet pressure and temperature non-uniformities on aero-thermal performance of a HP turbine. Int. J. Heat Mass Transf. 2017, 104, 83–97. [Google Scholar] [CrossRef]
- Rahim, A.; Khanal, B.; He, L.; Romero, E. Effect of Nozzle Guide Vane Lean Under Influence of Inlet Temperature Traverse. J. Turbomach. 2014, 136, 1–12. [Google Scholar] [CrossRef]
- Prapamonthon, P.; Xu, H.Z.; Yang, W.S.; Wang, J.H. Numerical Study of the Effects of Thermal Barrier Coating and Turbulence Intensity on Cooling Performances of a Nozzle Guide Vane. Energies 2017, 10, 362. [Google Scholar] [CrossRef]
- Kim, K.M.; Park, J.S.; Dong, H.L.; Lee, T.W.; Cho, H.H. Analysis of conjugated heat transfer, stress and failure in a gas turbine blade with circular cooling passages. Eng. Fail. Anal. 2011, 18, 1212–1222. [Google Scholar] [CrossRef]
- Kim, K.M.; Yun, H.J.; Yun, N.; Dong, H.L.; Cho, H.H. Thermo-mechanical life prediction for material lifetime improvement of an internal cooling system in a combustion liner. Energy 2011, 36, 942–949. [Google Scholar] [CrossRef]
- Chung, H.; Sohn, H.S.; Park, J.S.; Kim, K.M.; Cho, H.H. Thermo-structural analysis of cracks on gas turbine vane segment having multiple airfoils. Energy 2017, 118, 1275–1285. [Google Scholar] [CrossRef]
- Guan, P.; Ai, Y.T.; Wang, Z.; Bao, T.N. Structure strength simulation of film cooling vane after heat shock by thermal/flow/structure coupling. J. Aerosp. Power 2018, 33, 1811–1820. [Google Scholar]
- Prenter, R.; Ameri, A.; Bons, J.P. Deposition on a cooled nozzle guide vane with non-uniform inlet temperatures. In Proceedings of the ASME Turbo Expo, Montreal, QC, Canada, 15–19 June 2015. [Google Scholar]
- Elnadya, T.; Hassana, I.; Kadema, L.; Lucasb, T. Cooling effectiveness of shaped film holes for leading edge. Exp. Therm. Fluid Sci. 2013, 44, 649–661. [Google Scholar] [CrossRef]
- Moritz, N.; Kusterer, K.; Bohn, D.; Sugimoto, T.; Tanaka, R. Conjugate calculation of a film-cooled blade for improvement of the leading edge cooling configuration. Propuls. Power Res. 2013, 2, 1–9. [Google Scholar] [CrossRef] [Green Version]
- Kim, K.M.; Moon, H.; Park, J.S.; Cho, H.H. Optimal design of impinging jets in an impingement/effusion cooling system. Energy 2014, 66, 839–848. [Google Scholar] [CrossRef]
- Nowak, G.; Wróblewski, W. Cooling system optimisation of turbine guide vane. Appl. Therm. Eng. 2009, 29, 567–572. [Google Scholar] [CrossRef]
- Wang, Z.; Liu, J.J.; Zhang, C. Multi-field coupling analysis on the film-cooling of a turbine guide vane. In Proceedings of the ASME Turbo Expo, San Antonio, TX, USA, 3–7 June 2013. [Google Scholar]
- Fei, C.W.; Bai, G.C. Wavelet correlation feature scale entropy and fuzzy support vector machine approach for aeroengine whole-body vibration fault diagnosis. Shock Vib. 2013, 20, 341–349. [Google Scholar] [CrossRef]
- Fei, C.W.; Bai, G.C.; Tang, W.Z.; Ma, S. Quantitative diagnosis of rotor vibration fault using process power spectrum entropy and support vector machine method. Shock Vib. 2014, 2014, 1–9. [Google Scholar] [CrossRef]
- Amaral, S.; Verstraete, T.; Braembussche, R.V.D.; Arts, T. Design and optimization of the internal cooling channels of a HP turbine blade, Part I methodology. In Proceedings of the ASME Turbo Expo, Berlin, Germany, 9–13 June 2008. [Google Scholar]
- Chen, H.X.; Zhou, D.Q.; Zheng, Y.; Jiang, S.W.; Yu, A.; Guo, Y. Load Rejection Transient Process Simulation of a Kaplan Turbine Model by Co-Adjusting Guide Vanes and Runner Blades. Energies 2018, 11, 3354. [Google Scholar] [CrossRef]
- Johnson, J.J.; King, P.I.; Clark, J.P.; Koch, P.J. Exploring conjugate CFD heat transfer characteristics for a film-cooled flat plate and 3-D turbine inlet vane. In Proceedings of the ASME Turbo Expo, Copenhagen, Denmark, 11–15 June 2012. [Google Scholar]
- China Aviation Materials Manual Commission. China Aviation Materials Manual; Standards Press of China: Beijing, China, 2002; pp. 792–806. [Google Scholar]
- Lian, X.C.; Wu, H. Principles of Aeroengine; Northwest Polytechnic University Press: Xi’an, China, 2005; pp. 152–161. [Google Scholar]
- Xiong, Q.R.; Shi, X.J.; Xu, F.; Zhong, M. Surface temperature measurement of turbine nozzle based on temperature-sensitive paint. Gas Turbine Exp. Res. 2014, 27, 45–48. [Google Scholar]
- Zhang, S.J.; Lin, C.Y.; Li, X.; Zou, Z.; Liu, Y.; Liu, Y.Z. Normalized transfer function for characterizing conversion efficiency and harmonic distortion of all-optical sampling. Chin. Sci. Bull. 2011, 56, 1633–1636. [Google Scholar] [CrossRef] [Green Version]
- Menter, F.R.; Langtry, R.B.; Likki, S.R.; Suzen, Y.B.; Huang, P.G.; Völker, S. A Correlation based Transition Model using Local Variables Part 1-Model Formulation. J. Turbomach. 2006, 128, 413–422. [Google Scholar] [CrossRef]
- Hylton, L.D.; Mihelc, M.S.; Turner, E.R.; Nealy, D.A.; York, R.E. Analytical and Experimental Evaluation of the Heat Transfer Distribution over the Surfaces of Turbine Vanes; NASA: Indianapolis, IN, USA, 1983; pp. 1–220.
- Steelant, J.; Dick, E. Modeling of laminar-turbulent transitional for high freestream turbulence. J. Fluids Eng. 2001, 123, 22–30. [Google Scholar] [CrossRef]
- Guan, P.; Ai, Y.T.; Wang, Z.; Wang, F. Numerical Simulation of Nozzle Guide Vane Subjected to Thermal Shock Load. J. Propuls. Technol. 2016, 37, 1938–1945. [Google Scholar]
- Guo, Z.Y. Reseach on Methodology of Thermal-Flow-Elastic Couping Numerial Simulation in Air-Cooled Turbine with the Finite Difference. Ph.D. Thesis, Energy Science and Engineering, Harbin Institute of Technology, Harbin, China, 2009. [Google Scholar]
Figure 1.
(a,b). Geometric structure of guide vane rim.

Figure 2.
Single channel structure and local grids.

Figure 3.
(a,b). Computational boundary conditions.

Figure 4.
Fitted curves of inlet temperature in radial direction for six Cases.

Figure 5.
Integrated analysis of film cooling NGV with the enhanced flow-thermo-structural (FTS) model.
Figure 5.
Integrated analysis of film cooling NGV with the enhanced flow-thermo-structural (FTS) model.

Figure 6.
Pressure comparison of predicted NGV midspan with the experimental data.

Figure 7.
Heat transfer coefficient (HTC) comparison of predicted NGV midspan with the experimental data.
Figure 7.
Heat transfer coefficient (HTC) comparison of predicted NGV midspan with the experimental data.

Figure 8.
Indoor aeroengine test cell.

Figure 9.
Temperature test of standard temperature-sensitive paint (TSP) model.

Figure 10.
(a,b). Static pressure and Mach number distributions on flow field midspan for Case 1 (Pout = 486 KPa).
Figure 10.
(a,b). Static pressure and Mach number distributions on flow field midspan for Case 1 (Pout = 486 KPa).

Figure 11.
(a,b). Differences of static pressure and Mach number on flow field midspan by △ = Case 1 − Case 6.
Figure 11.
(a,b). Differences of static pressure and Mach number on flow field midspan by △ = Case 1 − Case 6.

Figure 12.
HTC distributions on the surface with hot streamlines and cooling air velocity vector.

Figure 13.
(a,b). Comparison of Case 1 with the TSP test.

Figure 14.
(a–d). Temperature profiles under different heights and mass flow of holes.

Figure 15.
Positions of weak springs.

Figure 16.
(a–d). Thermal stress under four spring stiffness (Case 1).

Figure 17.
Total mesh displacement by amplifying 65 times.

Figure 18.
Predicted stress concentrations and cracks.

Figure 19.
(a–f). Comparison of predicted thermal stress with mass flow of holes at the trailing edge.
Figure 19.
(a–f). Comparison of predicted thermal stress with mass flow of holes at the trailing edge.


Table 1.
Geometrical sizes of nozzle guide vane (NGV).
| Physical Parameters | Values |
|---|---|
| Vane wall thickness, mm | 1.25 |
| Vane height, mm | 40 |
| Junction chamber, mm | 1–2 |
| Chord length, mm | 60 |
| Rings thickness, mm | 2 |
| Number of cooling hole, mm | 34 |
| Leading hole diameter, mm | 0.5 |
| Trailing hole diameter, mm | 1.2 |
| Angle of radial direction (A1 and A3), degrees | 30 |
| Angle of radial direction (A2), degrees | 45 |
| Angle of chord direction (A4), degrees | 30 |
Table 2.
Engine performance parameters.
| Parameters | Values |
|---|---|
| Engine inlet average total temperature Teng*, K | 290.29 |
| Exhaust nozzle total temperature Tex*, K | 917.33 |
| Engine inlet static pressure Peng, kPa | 95.22 |
| Compressor outlet total pressure Pcom*, kPa | 538.39 |
| Inlet air flow of the engine Weng, g/s | 3520 |
| Fuel mass flow Wfu, g/s | 54.48 |
| Mach number of engine inlet Maeng | 0.31 |
Table 3.
Simulation conditions of NGV.
| Variables | Values |
|---|---|
| Inlet total pressure Pin*, KPa | 522 |
| Inlet average temperature Tmean, K | 1310 |
| Outlet mass flow Wout, g/s | 148.9 |
| Cooling air mass flow Wca, g/s | 2.8 |
| Cooling air inlet total temperature Tcom*, K | 491 |
Table 4.
Applicability of all distributions.
| Case Number | Temperature Profiles |
|---|---|
| 1 | Standard condition |
| 2 | Peak temperature 1580 K |
| 3 | Peak temperature 1800 K |
| 4 | Flame peak at the 25% vane height |
| 5 | Flame peak at the 50% vane height |
| 6 | Average temperature inlet |
Table 5.
Mesh independence evaluation for NGV.
| Mesh | Number of Elements | ||
|---|---|---|---|
| Mean-Temp, K | Max-Temp, K | ||
| 1 | 3,700,000 | – | – |
| 2 | 4,300,000 | 3.1 | 3.4 |
| 3 | 5,000,000 | 1.3 | 1.9 |
| 4 | 5,500,000 | 1.2 | 1.1 |
© 2019 by the authors. Licensee MDPI, Basel, Switzerland. This article is an open access article distributed under the terms and conditions of the Creative Commons Attribution (CC BY) license (http://creativecommons.org/licenses/by/4.0/).
Share and Cite
MDPI and ACS Style
Guan, P.; Ai, Y.-T.; Fei, C.-W. An Enhanced Flow-Thermo-Structural Modeling and Validation for the Integrated Analysis of a Film Cooling Nozzle Guide Vane. Energies 2019, 12, 2775. https://doi.org/10.3390/en12142775
AMA Style
Guan P, Ai Y-T, Fei C-W. An Enhanced Flow-Thermo-Structural Modeling and Validation for the Integrated Analysis of a Film Cooling Nozzle Guide Vane. Energies. 2019; 12(14):2775. https://doi.org/10.3390/en12142775
Chicago/Turabian StyleGuan, Peng, Yan-Ting Ai, and Cheng-Wei Fei. 2019. "An Enhanced Flow-Thermo-Structural Modeling and Validation for the Integrated Analysis of a Film Cooling Nozzle Guide Vane" Energies 12, no. 14: 2775. https://doi.org/10.3390/en12142775
Note that from the first issue of 2016, this journal uses article numbers instead of page numbers. See further details here.