A State of Health Estimation Method for Lithium-Ion Batteries Based on Voltage Relaxation Model

1
Clean Energy Automotive Engineering Center, Tongji University, Shanghai 201804, China
2
School of Automotive Studies, Tongji University, Shanghai 201804, China
3
Institute for Applied Materials (IAM), Karlsruhe Institute of Technology (KIT), 76344 Eggenstein-Leopoldshafen, Germany
*
Author to whom correspondence should be addressed.
Energies 2019, 12(7), 1349; https://doi.org/10.3390/en12071349
Submission received: 10 March 2019
/
Revised: 6 April 2019
/
Accepted: 6 April 2019
/
Published: 8 April 2019
(This article belongs to the Section E: Electric Vehicles)
Abstract
:The state of health estimation for lithium-ion battery is a key function of the battery management system. Unlike the traditional state of health estimation methods under dynamic conditions, the relaxation process is studied and utilized to estimate the state of health in this research. A reasonable and accurate voltage relaxation model is established based on the linear relationship between time coefficient and open circuit time for a Li1(NiCoAl)1O2-Li1(NiCoMn)1O2/graphite battery. The accuracy and effectiveness of the model is verified under different states of charge and states of health. Through systematic experiments under different states of charge and states of health, it is found that the model parameters monotonically increase with the aging of the battery. Three different capacity estimation methods are proposed based on the relationship between model parameters and residual capacity, namely the α-based, β-based, and parameter–fusion methods. The validation of the three methods is verified with high accuracy. The results indicate that the capacity estimation error under most of the aging states is less than 1%. The largest error drops from 3% under the α-based method to 1.8% under the parameter–fusion method.
1. Introduction
Battery electric vehicles (BEV) with lithium-ion batteries as the main energy source have been promoted and popularized worldwide. However, compared with traditional internal-combustion vehicles, a critical drawback of the BEVs is that the commercial lithium-ion batteries will have a significant aging phenomenon with the increase of the operational time, resulting in an attenuation in energy and power performance [1]. Battery management systems (BMS) are currently used in BEVs to manage the battery packs, and one of the key functions of BMS is to accurately estimate the state of health (SOH) of the batteries during usage, to ensure that the battery system can operate safely and stably throughout the lifetime of the BEV [2,3].
Research on the SOH estimation for lithium-ion batteries has been a hotspot for several years, and lots of effective methods have been proposed in the literature [4,5,6]. In order to estimate the SOH, the first step is to determine the evaluation parameter of the battery SOH [4]. After obtaining the exact value of the SOH evaluation parameter at a certain time, it is compared with the SOH evaluation parameter of the battery at the initial state, and the SOH value at that time can be achieved. Therefore, the key step of a SOH estimation method is to accurately obtain the SOH evaluation parameter of the battery. Considering that the main behavior of the aging phenomenon of a lithium-ion battery is the attenuation of energy and power performance, most of the SOH estimation methods select the decrease of capacity [7,8,9,10,11,12,13,14,15,16] and/or the increase of impedance [17,18,19,20,21,22,23,24] as the evaluation parameter.
The capacity is an external characteristic which indicates the usable energy stored in the battery [7]. Typically, the battery capacity is obtained by fully discharging the battery after it has been fully charged, using a constant current (CC) discharging profile. In the literature, there is not a standard value of the CC discharging profile, and the values such as 1/3C [8] and 1C [12] are commonly used. Generally speaking, the online capacity estimation algorithms can be divided into two groups, namely the direct way and the indirect way. The direct way is based on the Ampere-hour counting method. It utilizes the accumulated charge value and the change value of state of charge (SOC) during a charging or discharging process and uses the definition of SOC to calculate the total capacity value directly [8]. This method is often coupled with the SOC estimation methods in the literature [9,10,11,12]. The indirect group of methods is based on the relationship of the capacity and several characteristics of the battery. It utilizes the obtained value of the characteristics and estimates the capacity indirectly [13,14,15,16]. Typically, the terminal voltage curve of the battery during charging or discharging is used. The commonly used techniques are the differential voltage analysis (DVA) [13] and the incremental capacity analysis (ICA) [14]. The basic principles of these two techniques are similar. Those capacity estimation methods are established by studying the relationship between the change of the terminal voltage curve and the capacity.
Unlike the capacity, which has a relatively well-recognized definition in actual use, there are various categories of battery impedance, and all kinds of them can be used to characterize the aging state of the battery. The first is the alternating current (AC) impedance spectrum of the battery in the frequency domain, which is normally known as the electrochemical impedance spectroscopy (EIS) [17]. This method gives the battery an alternating excitation and then calculates the impedance of the battery at different frequencies. This method is usually used for offline analysis in laboratories due to the limitation that the test requires specific equipment [18]. The second is the direct current (DC) impedance in the time domain. The DC impedance is obtained by applying a charge or discharge current pulse to the battery and dividing the amount of terminal voltage change during a period of time by the current value. The obtained DC impedance can be used to characterize the different impedance components of the battery, depending on the length of the time period. For example, the impedance obtained during a very short time period (usually below 0.1 s) is generally regarded as an ohmic impedance, and the impedance obtained around 18 s is regarded as the polarization impedance. Literature has shown that the DC impedance components may change as the aging state of the battery changes [19]. The third method is based on the electrical circuit model (ECM) or electrochemical model of the battery, and the model parameter of the battery is used as the characterization of the battery impedance [20,21,22]. The key point of this method is to use the algorithm to accurately and conveniently identify the model parameters. Since the model parameters of the battery often have an influence on the state estimation of the battery, they are also often coupled with the SOC estimation algorithm [23,24]. This method is most commonly used because it can be easily implemented for online applications.
In addition to the aforementioned SOH estimation methods based on the battery capacity and impedance estimation, which generally need to be implemented under a certain dynamic working condition, a novel SOH estimation method which utilizes the resting process after charging or discharging, that is, the relaxation voltage process, has been proposed in recent years. Various researchers have proved that the relaxation process has relationships with the SOH of battery, and the terminal voltage of the battery during relaxation process, namely the relaxation voltage, could be used to estimate the battery SOH [25,26,27,28,29]. Baghdadi et al. [25] measured the relaxation voltage after fully charged and 30 min of rest and found a linear dependence between that value and the capacity value. An estimation method was then established based on that relationship. Similarly, He et al. [26] and Qin et al. [27] used the relaxation voltage value after fully charged and studied the relationship between the value and capacity of the battery after different aging cycles. Kai et al. [28] utilized a period time of the relaxation voltage, that is, the relaxation voltage curve as the research subject. The relationship between the curve and the capacity after aging was studied and a support vector machine method was used to select characteristics of the curve as the health factor denoting the battery SOH. Attidekou et al. [29] used the ICA technique to analyze the relationship between the relaxation voltage and capacity. These researchers have proven that the relaxation process, including the relaxation voltage value at the specific time and the voltage curve during a period of time, has a relationship with the aging state and can be used to estimate the battery SOH. To some extent, this approach can be seen as an indirect method for SOH estimation, because the proposed methods are basically establishing the relationship between the relaxation process and capacity or impedance and using this relationship to estimate the capacity or impedance. This method can be easily implemented to on-board conditions and can be used as an effective supplement to SOH estimation methods under dynamic conditions.
At present, there have already been several related studies on the modelling method for the relaxation process [30,31,32,33,34]. The basic idea of the modeling method is still based on the ECM. Unlike the ECM under dynamic working conditions, the ECM for the relaxation process is composed of multiple resistor–capacitor (RC) parallel links (generally more than 3 links) to accurately fit the relaxation voltage curve over a long period of time [32,33]. However, as the amount of RC links increases, the complexity of the model will increase accordingly, which makes the practical application more difficult. To solve this problem, Pei et al. [34] calculated the time constant value of the battery at each moment according to the definition formula of the time constant of RC links. It was found that for the lithium iron phosphate (LFP) battery, the time constant of the battery exhibits a linear change with time during the relaxation process, and this phenomenon exists at almost all temperatures and SOCs. Based on this relationship, the research proposed a simple expression of time constant during the relaxation process and establishes a voltage relaxation model accordingly. However, there are still certain limitations for practical usage. Firstly, most of the existing methods are based on the relaxation process after being fully charged, and the relaxation processes under the other SOCs have not been systematically studied. In addition, in-depth study on the model for relaxation voltage process model for other cathodes, such as nickel cobalt aluminum oxide (NCA), is needed to enhance the understanding of voltage relaxation mechanisms and on-line implementation for BEV.
In this paper, we conducted in-depth research on the relaxation voltage process of Li1(NiCoAl)1O2-Li1(NiCoMn)1O2 (NCA-NCM) batteries and confirmed that the linearity of the time constant with time under different SOC and aging conditions is still valid. Based on the relaxation model proposed in [34], a SOH estimation method of the battery is established by using the two parameters of the model. The remainder of the paper is organized as follows: in Section 2, the pre-experiments under 4 different aging states and SOCs and the systematic experiments under different SOCs and aging states are introduced. In Section 3, the voltage relaxation model is first introduced and validated by the results of pre-experiments. Then the change patterns of the model parameters are analyzed by the results of the systematic experiments, and the SOH estimation method is introduced and verified. Section 4 gives the conclusions.
2. Experiments
In this research, the lithium-ion battery with NCA-NCM as cathode material and graphite as anode material was selected as the research object. The selected samples are commercial 18,650 lithium-ion batteries with a nominal capacity of 2.5 Ah. The charge cutoff voltage is 4.2 V, and the discharge cut-off voltage is 2.55 V. Two groups of experiments were designed and carried out. The first group is the pretest aiming to establish and validate the voltage relaxation model. The second group is the systematic experiment under different SOC and aging states of the battery, which is used to establish and validate the SOH estimation method.
2.1. Pretests with 4 Different States and Working Conditions
In order to study the relaxation process of the battery after different working conditions, four pretests were carried out on a lithium-ion battery cell at different aging states and different SOCs. The test conditions are shown in Table 1.
In this research, all tests, including the following systematic experiments, were all carried out using the Chroma 17011/5V20A regenerative battery test system. The environmental temperature was controlled at 25 °C by a Votsch C4-180 environmental chamber.
Test (a), (c), and (d) were carried out on the cell with 100 cycles, and test (b) was carried out on the cell with 450 cycles. Test (a) and (b) were charged from 80% to 85% SOC under 1C current rate. Test (c) was discharged from 90% to 85% SOC under 1C current rate. Test (d) was charged from 70% to 75% SOC under 1C current rate. The sample period of terminal voltage is 0.5 s.
2.2. Systematic Experiments Under Different SOCs and Aging States
In this experiment, six new cells were used and recorded as #1, #2, #3, #4, #5, and #6, respectively. The tests were divided into aging tests and calibration tests. The aging tests are designed to achieve a specific aging state of the battery. The calibration tests were carried out after each cycle period, including the capacity calibration and relaxation voltage calibration tests.
2.2.1. Cycling Test
Six cells were cycled for a specific number of times to study the changing pattern of voltage relaxation model parameters after aging. During each cycle, the cell was charged with a CC profile at 1C until the voltage reached 4.2 V, and continually charged with a constant voltage (CV) profile until the current reached 0.2C. Then, the cell was discharged with a CC profile at 1C until voltage reached 2.55 V. The cells were separated into 2 groups, the experimental group and the verification group.
The experimental group included cell #1 and #2. The two cells were used to find out the relationship between the aging state and the model parameters and establish the SOH estimation method. The #1 cell was cycled for 100, 200, 300, 400, 500, and 600 times. The #2 cell was cycled for 100, 200, and 300 times.
The verification group included cell #3, #4, #5, and #6. The four cells were used to verify the SOH estimation method built by the experimental group. To verify the robustness of the method, the four cells bypassed the number of cycles that was previously used by the experimental group. The cell #3 was cycled directly 150 times. The cell #4 was cycled directly 350 times. The cell #5 was cycled directly 550 times. To verify the predictability of the method, the cell #6 was cycled directly 650 times. All aging tests were conducted at 25 °C in the environmental chamber.
2.2.2. Calibration Test
After each cycle period, the calibration tests were carried out for each cell, including capacity and relaxation voltage calibration tests.
During the capacity calibration test, the cell was charged with a CC profile at 1C until voltage reached 4.2 V and was continually charged with a CV profile until the current reached 0.05C. Then the cell was discharged with a CC profile at 1C until voltage reached 2.55 V. The capacity value is the amount of charge released during the discharge process.
The relaxation test was then carried out every 5% SOC. Considering that the main purpose of this research was to establish a SOH estimation method based on the voltage relaxation model under different SOCs, the factors considered in this research are the SOC and aging state. The influence of temperature and working condition before relaxation is not considered and will be considered in future research.
Therefore, the detailed procedure of relaxation test can be described as Table 2 shows.
It should be noted that “1C” in the aging test and capacity calibration test is equal to the current rate by which the nominal capacity can be discharged from full to empty in 1 h, in other words, it is equal to 2.5 A. However, in order to ensure that the SOC value of each cell during the relaxation test after different cycle periods is the same, “1C” in the relaxation tests is equal to the current rate by which the actual capacity can be discharged from full to empty in 1 h, that is, the value is equal to the calibrated capacity value after each cycle period. In this research, the change in the State of Charge -Open-Circuit Voltage (SOC-OCV) curve with the aging state of the battery is neglected, therefore the OCV values at the same SOC could be considered as the same. However, it should be noted that, according the literature [35], the SOC-OCV curve may also change slightly as the battery ages. Therefore, when applying this method on batteries with other materials, it is also necessary to consider whether this change has a significant impact on the OCV result.
3. Results and Discussion
3.1. Voltage Relaxation Model
The dynamic behavior of a battery can be described by an ECM which includes several RC links. Through the combination of electrical components, the ECM can simulate the physical and chemical processes inside the battery. As can be seen from Figure 1, the terminal voltage is mainly composed of the ohmic overpotential of the battery η0, the charge transfer overpotential ηct, the diffusion overpotential ηd, and the OCV UOCV. In Figure 1, Ubat denotes the terminal voltage, while Cdl and Rct represent the capacitance and resistance of the RC component which describes the charge transfer process, respectively. C1–CN and R1–RN represent the capacitors and resistors of the RC components which describe the diffusion process. Since the release speed of the ohmic overpotential η0 in the battery is extremely fast, it can be considered that the η0 disappears at the moment when the external circuit of the battery is disconnected (i.e., Ibat = 0). The release speed of ηct and ηd is relatively slow. They gradually decrease as the open circuit time increases until the accumulated charge on the corresponding capacitor component is completely consumed. Therefore, the set of UOCV, ηct, and ηd, which are involved in the relaxation process, can be collectively referred to as the relaxation voltage, namely URLX, of the battery, and the unit is V.
The OCV of a battery can be expressed as the potential difference between the positive and negative electrodes and is mainly determined by the SOC. Batteries with different positive and negative electrode materials have their specific SOC-OCV curves. As the battery ages, the shape of the relaxation voltage curve also changes. The mechanism for this phenomenon is complicated, and possible explanations include loss of active material on the positive and negative electrodes, structural changes in the material of the positive and negative electrodes, or loss of the amount of circulating lithium ions.
The analysis of the relaxation voltage curve is generally based on the time constant, which is used to represent the recovery speed of the terminal voltage. Figure 2 shows a typical relaxation curve and the fitting curves with different orders of ECM. It can be seen from Figure 2 that fitting the relaxation voltage curve with a single RC link is inferior, and as the amount of RC link increases, that is, with more time constants, the fitting curve tends to be more accurate.
According to Figure 1, the terminal voltage is expressed as:
The charge transfer overpotential is generated by the charging process of the double layer at the two-phase interface. The release process of ηct is very short, and normally lasts for a few tens of seconds [36]. In contrast, the diffusion overpotential is generated by the diffusion process of lithium ions from the surface of the electrode to the inside [37]. The diffusion process runs through most of the relaxation phase and the release process lasts for a long time. Therefore, this process is the key to the relaxation voltage research. Based on this analysis, the relaxation voltage URLX can be expressed as:
where tk indicates the open circuit time. Tct and Td represent the release period of charge transfer and diffusion process, respectively.
For the RC links used to describe the diffusion process, the discrete recursive formula for the overpotential corresponding to it can be described as:
where τd is normally known as the time constant in other literature, which is a constant representing the rate of release process. However, in this research, considering that τd is a variable that changes over time, it is referred to as the time coefficient. From Equations (1)–(3), the expression of τd at different open circuit time can be described as the following equation:
where URLX,k and τd,k are the relaxation voltage and the time coefficient at time tk, respectively.
Figure 3 shows the results of the first group of pretests. The curves are the change value δURLX of the relaxation voltage and therefore the final value of each curve is zero after a long time of rest (more than 2 h). It can be seen that, due to the difference of aging state, SOC, and working condition before relaxation, the relaxation voltage curves exhibit different changing patterns.
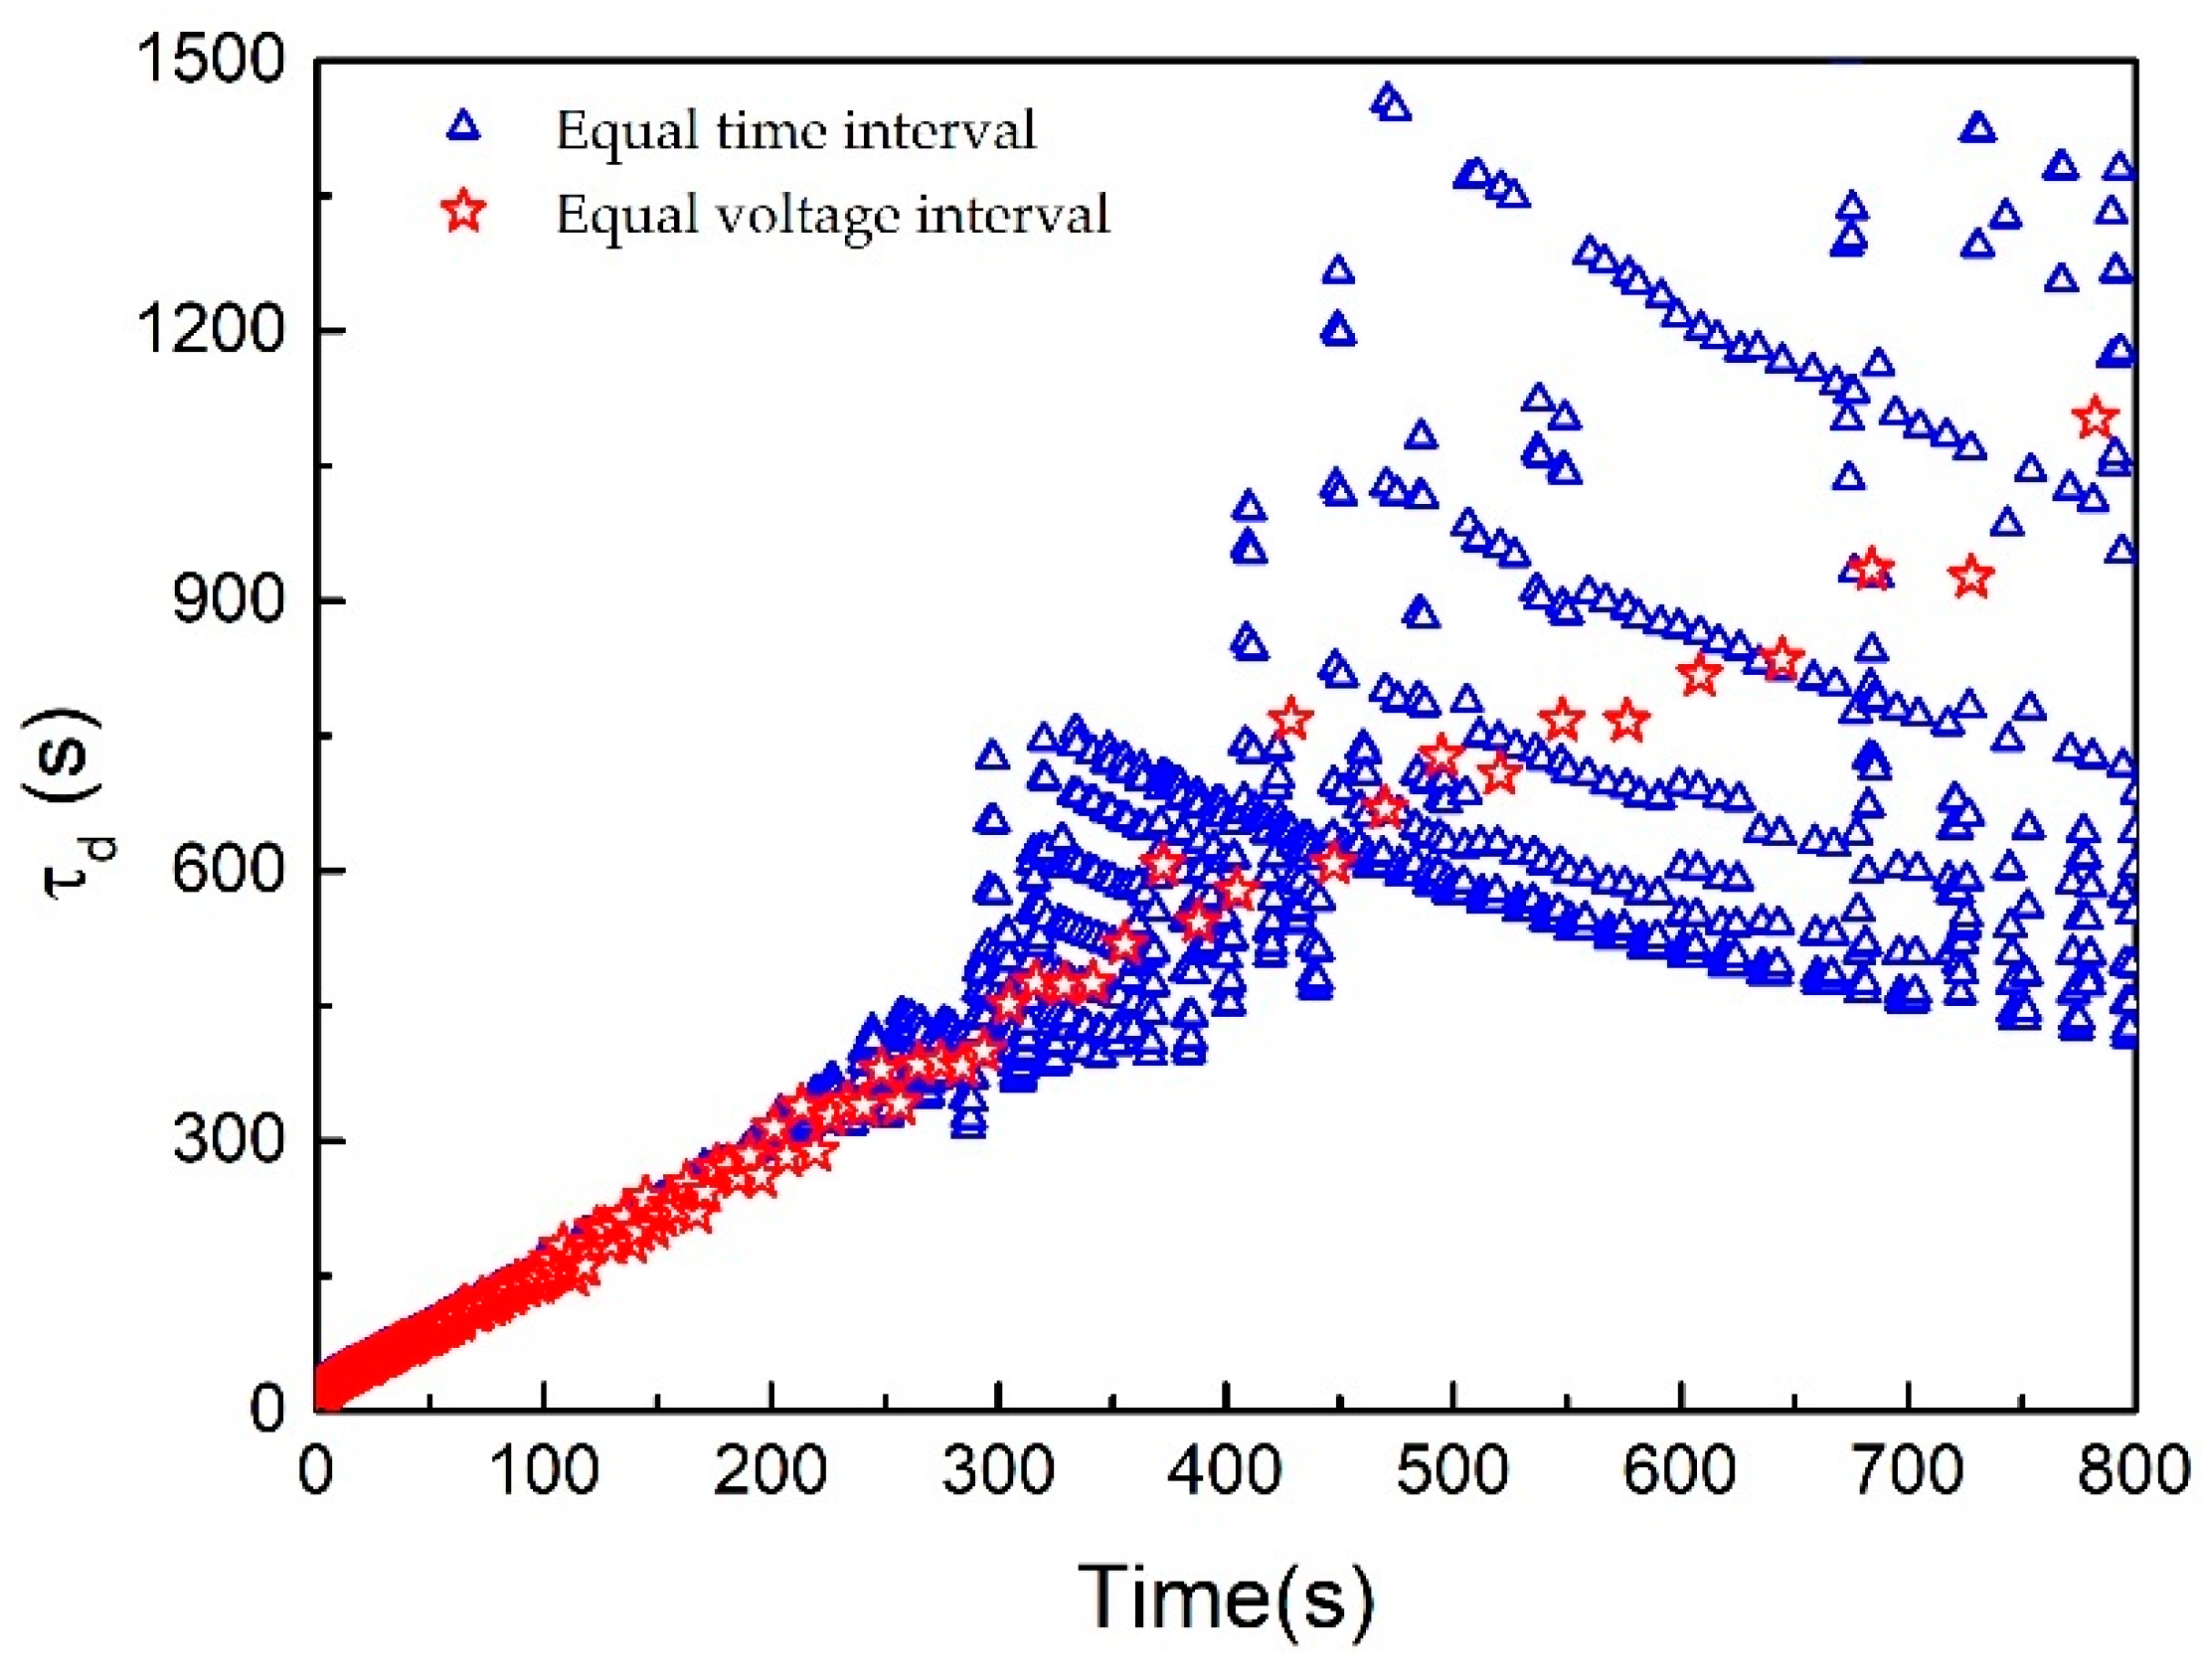
To obtain the time coefficient τd with the open time t, substitute the relaxation voltage data into Equation (4). For the data processing of τd, the following two methods are proposed: an equal time interval (ETI) method and an equal voltage interval (EVI) method. In the ETI method, each time coefficient value is obtained by substituting each sampled voltage data and the voltage data sampled after a fixed time interval into Equation (4). The EVI method selects the voltage data and the corresponding time by using the equal voltage interval, and generates a new voltage sequence first, then the time coefficient values are obtained by using each data in the new sequence. To ensure the accuracy of the results, the time interval and voltage interval of each method should be as small as possible. Considering the computation complexity and the accuracy of the results, a time interval of 10 s and a voltage interval of 0.2 mV is utilized here. The time coefficient obtained by the two methods is shown in Figure 4.
It can be seen from Figure 4 that the amount of data required for the ETI method is large, and the fluctuation significantly increases after 200 s. On the contrary, the EVI method requires a small amount of data, and the data has high stability within 800 s. The results of the two methods are basically similar within 200 s, which verifies the accuracy of the two methods. Therefore, the collected voltage data is processed by the EVI method with a voltage interval of 0.2 mV in this research.
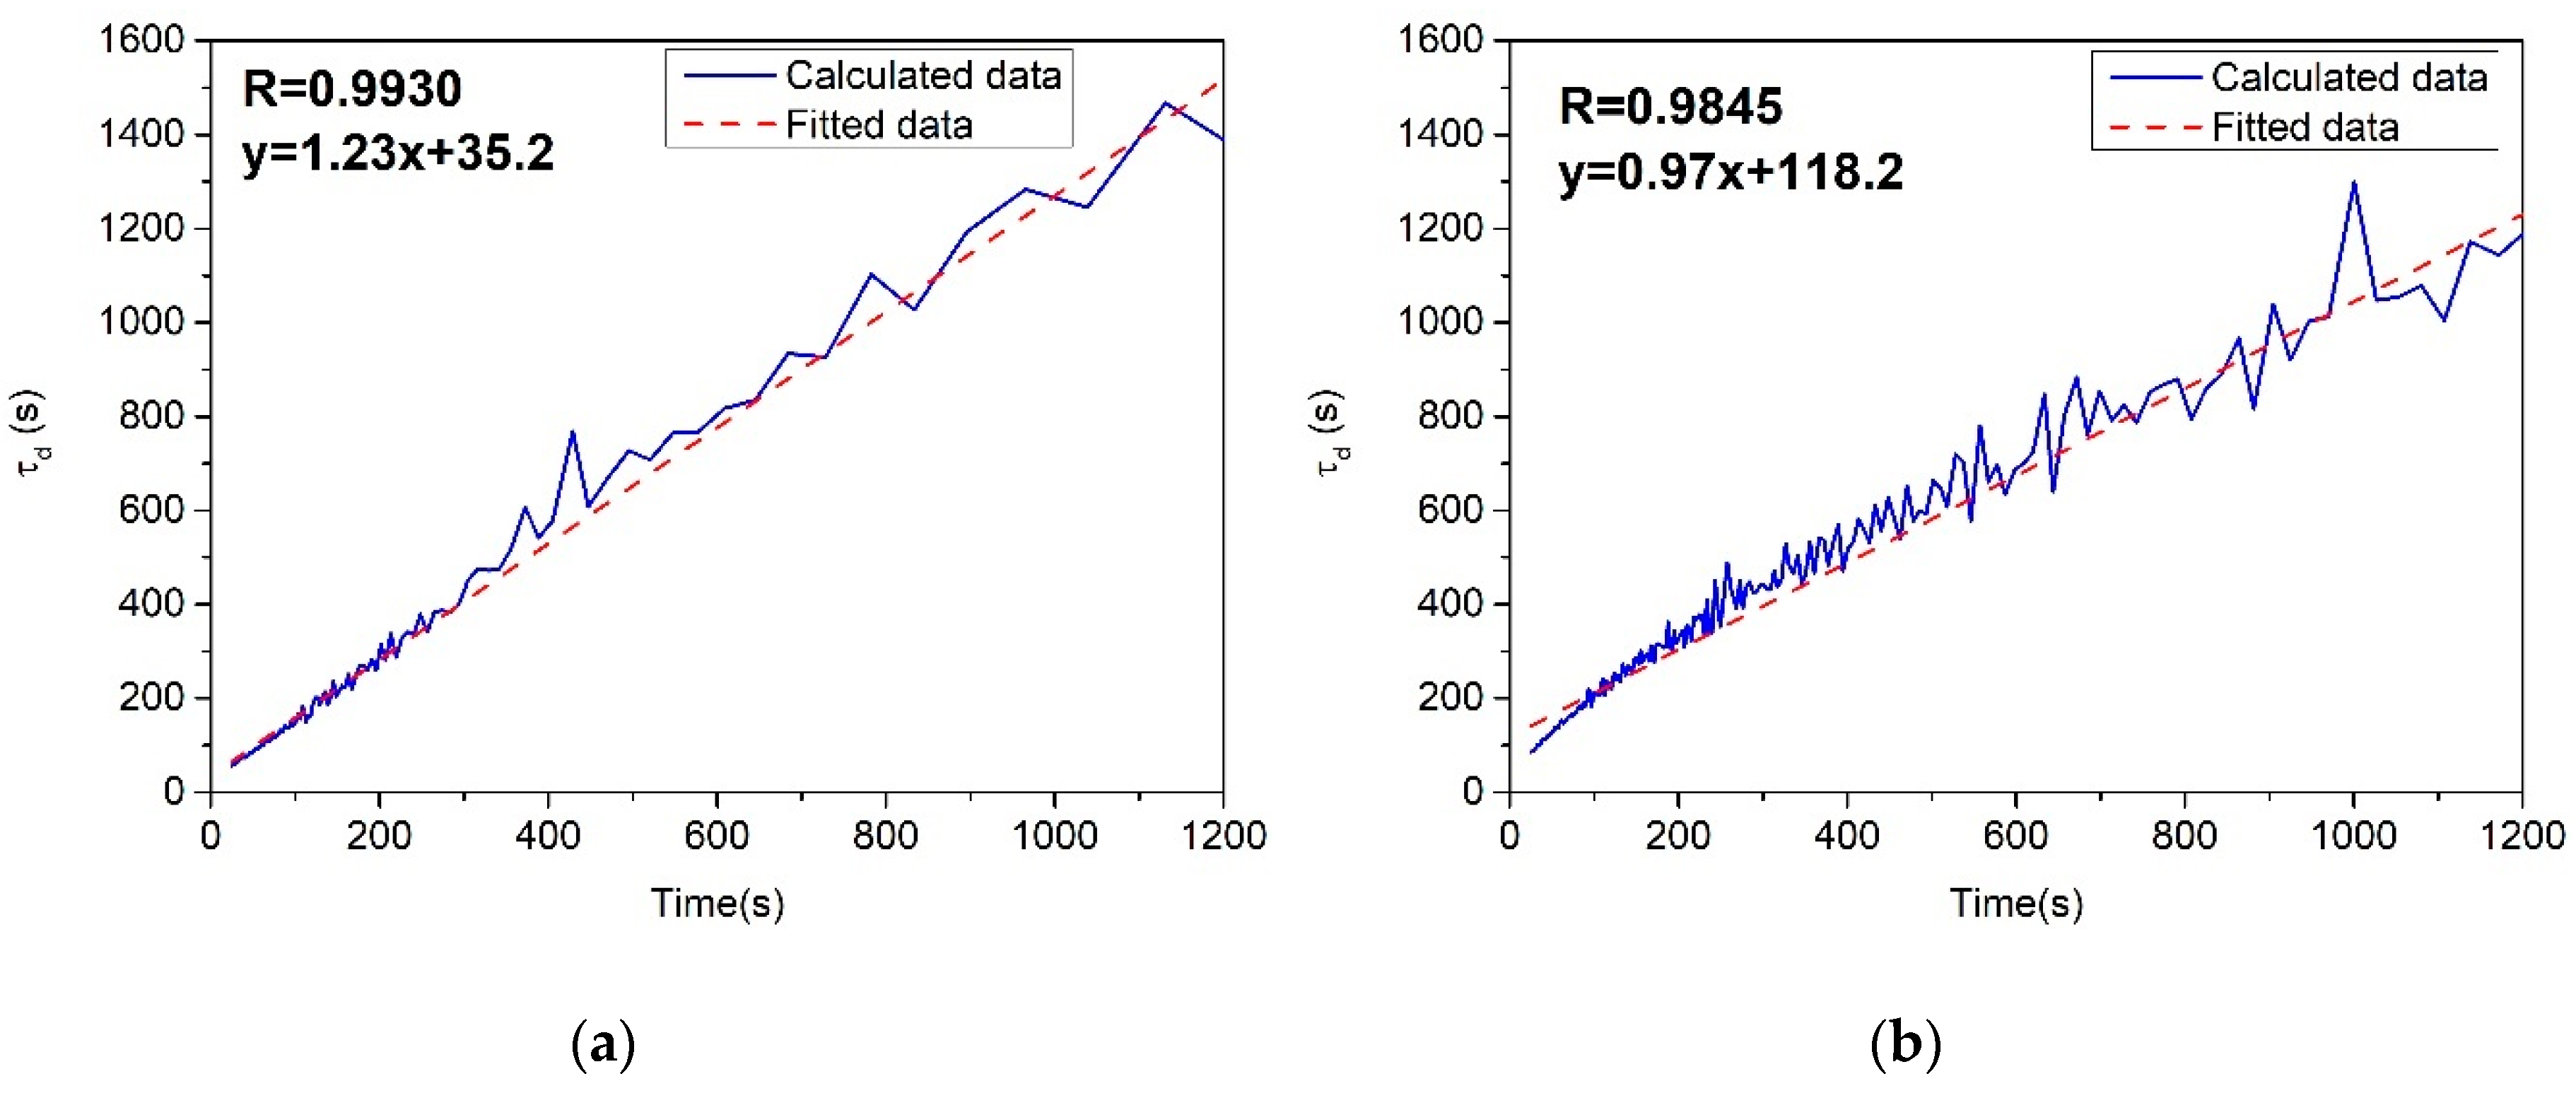
By using the EVI method, the relationships between time coefficient τd with the open time t of the four pretests are obtained, as shown in Figure 5.
It can be seen that the τd under different conditions all increase as the open circuit time increases, and has a significant linear relationship with time t. The correlation coefficients (R) of the four curves are 0.9930, 0.9845, 0.9916, and 0.9908, respectively, which are close enough to 1 and mean that there is a clear linear relationship between t and τd. The fitted curves are also shown in each figure.
Based on the linear relationship between t and τd, τd can be described as:
where α and β are the slope and intercept, respectively.
Substituting Equation (5) into Equation (3), the discrete recursive form of diffusion overpotential can be expressed as:
The voltage relaxation model can then be expressed as:
where UOCV, α, and β are the model parameters of the proposed voltage relaxation model. As mentioned above, UOCV is regarded to be only related to the SOC value and not influenced by the aging state. α and β are considered to be influenced by the aging state and the relationship between the two parameters and the aging state is studied.
Test (a) is selected as the verification of the voltage relaxation model. The time coefficient curve from 10 s to 50 s is linearly fitted, and α and β are 1.23 and 35.2. The terminal voltage after 50 s was calculated by the time coefficient values simulated by the fitting curve, using Equation (7). Figure 6 shows the simulated curve and the experimental curve. Within the measurement time range, the simulated results are in good agreement with the experimental results.
It can be concluded that the linear relationship between time coefficient and time, which has been discovered using LFP batteries, is also true for NCM-NCA battery used in this research. The corresponding voltage relaxation model can also be applied under different aging states and SOC.
3.2. Change Pattern of the Voltage Relaxation Model Parameters
To analyze the results of the systematic experiment, the parameters (i.e., α and β) of each relaxation voltage curve under different SOCs and aging states are identified by using the time coefficient data from 10 s to 50 s, and the results are shown in the following analysis. The results of cell #1 and #2 are shown and compared in Figure 7 and Figure 8. Each curve in the figures denotes the relationship between the parameter and the SOC under a specific aging state. The aging state is represented by the equivalent full cycles (EFC) before calibration tests. Figure 7 shows the results after charging and Figure 8 shows the results after discharging. Figure 7a and Figure 8a show the results of α and Figure 7b, and Figure 8b show the results of β.
It can be seen from Figure 7 and Figure 8 that α and β at different SOCs vary greatly under charge and discharge conditions. The basic pattern is that, as the number of aging cycles increases, both the slope α and the intercept β gradually increase. However, the specific change values at each SOC are different from each other. At some specific SOCs, α and β are sensitive to the aging state and have a large degree of discrimination. For example, under charging condition, the model parameters at SOC 65%, 70%, 75%, and 80% show good discrimination for the aging state. Similarly, under discharging condition, the model parameters at SOC 40%, 45%, 80%, 85%, 90%, and 95% also show good discrimination for the aging state. Meanwhile, as can be seen, the model parameter curve of cell #1 and #2 at 100, 200, and 300 EFCs are almost overlapped under both charging and discharging conditions, therefore verifying that the relationship between model parameters, SOC, and aging state is consistent among the batteries and that the voltage relaxation model is effective to describe the relaxation behavior after aging. The data of the cell #1 is studied to explore the evolution pattern of the model parameters with the aging state. The results between model parameters and EFC of cell #1 at SOC 65%, 70%, 75%, and 80% under charging condition and at SOC 40%, 45%, 75%, and 80% under discharging condition are shown in Figure 9 and Figure 10, respectively.
Theoretically, the practical meaning of slope of the relaxation voltage model corresponds to the change rate of the time coefficient. As the value of α gets larger (when it is positive), the time coefficient increases faster. The intercept corresponds to the time coefficient at the beginning of the relaxation process. The larger the value of β gets, the slower the relaxation voltage at this moment changes. It can be seen from Figure 9 and Figure 10 that as the number of aging cycles increases, both the slope and the intercept show an increasing trend, indicating that the recovery rate of the relaxation voltage slows down as the battery ages. However, according to results shown in Figure 9 and Figure 10, the relationship between the EFC and the model parameters are still not practical for SOH estimation as the relationship is not simple.
3.3. SOH Estiamtion Method Based on Voltage Realxation Model
In order to establish a SOH estimation method based on the voltage relaxation model parameters, the capacity is chosen as the evaluation parameter in this research, and the relationship between the capacity and the model parameters is obtained. According to the capacity calibration test, the correspondence between the capacity Q and the number of EFCs can be obtained. All the results of the six cells are shown in Figure 11. Figure 12 and Figure 13 show the relationship between the model parameters and the capacity. It should be noted that the impedance can also be used to establish the SOH estimation method theoretically.
It can be seen from Figure 12 and Figure 13 that the relationship between capacity and model parameters is basically opposite to the relationship between EFC and model parameters. The capacity decreases with both the increase of α and β. Moreover, both parameters show a good linear relationship with capacity, although the specific curves are different from each other under different SOCs.
In this research, three methods for the capacity estimation are proposed based on the linear relationship between the model parameters and the capacity, namely the α-based method, β-based method, and the parameter–fusion method.
3.3.1. α-Based Capacity Estimation Method
The α-based capacity estimation method can be divided into four steps. First, build up the relationship between the model parameter α and the capacity under a specific SOC according to the calibration result offline. Second, charge/discharge the cell to the specific SOC. Third, estimate the α value by utilizing the relaxation voltage model, and finally, the capacity value is estimated by bringing it into the α-capacity relationship.
The result of cell #1 and #2 are used to establish the parameter–capacity relationship, and the capacity and parameters of cell #3, #4, #5, and #6 are used to verify the capacity estimation method in this research. According to the results shown above, the α-capacity relationships at 70% SOC under charging condition and 40% SOC under discharging condition are utilized to illustrate the performance of the proposed α-based capacity estimation method. The α-capacity relationships are fitted using linear model. The fitted curves are shown in Figure 14a,b, respectively.
As can be seem from the estimation results, the capacity estimation error by using the α-based method is within 1% at most of the cases under both the charging and discharging conditions. The #6 is cycled 650 times and exceeds the largest cycles of cell #1. The results of #6 show the good extrapolation effect of this method.
3.3.2. β-Based Capacity Estimation Method
Similar to the α-based method, the β-based method uses the estimated β value at specific SOCs. The β-capacity relationships at 70% SOC under charging condition and 40% SOC under discharging condition are also utilized to illustrate the performance of the proposed β-based method. The β-capacity relationships are fitted using the linear model. The fitted curves are shown in Figure 15a,b, respectively.
As can be seem from the estimation results, the capacity estimation error by using the β-based method is within 1% at most of the cases under both the charging and discharging conditions. The results of #6 also shows the good extrapolation effect of this method.
3.3.3. Parameter–Fusion Capacity Estimation Method
According to the above analysis, both the α-based and β-based methods are effective for online capacity estimation. However, the estimation results of the two methods are slightly different from each other under the same conditions. Considering that the model parameters α and β are obtained simultaneously during online identification, a simple method to enhance the reliability of the estimation is to combine the results of the two methods together, that is, a parameter–fusion method. In this research, the average value of the estimated capacity by the two methods are calculated as the result of parameter–fusion method, and the results are shown in Table 7 and Table 8, respectively.
As the results show, the performance of capacity estimation is significantly improved, especially at cell #6. The largest error decreases from 3% to 1.8%, and the average error is below 1%.
The reason for the better performance by using parameter–fusion method is that it can reduce the random estimation error of the two parameter–based independent methods. As can be seen from the results, there exists significant correlations between the capacity and the two parameters, α and β, respectively. Therefore, theoretically speaking, both parameters can be independently utilized to estimate an accurate capacity value. However, in practical applications, due to random measurement errors and other factors, there will always be errors in the estimated results, and taking the average of the two results may reduce this random error.
3.4. Limitations and Future Work
In this research, the experiments and the SOH estimation method were established under room temperature, that is, 25 °C only. The future research will focus on the verification at high and low temperatures. The basic idea for adding the temperature into the capacity estimation method is to establish the relationship between the model parameters and the capacity of the battery at different temperatures through experiments, and then to establish a function or table between temperature, model parameters, and capacity. In practical applications, the battery’s temperature is measured, and the parameters of the model are estimated online, and then these values can be brought into the above relationship to estimate the battery capacity accurately. Besides, this method is suitable for the capacity inconsistency estimation within a battery pack and we will carry out related work in the future.
4. Conclusions
In this research, a voltage relaxation model based on the linear relationship between the time coefficient and open circuit time was established for a Li1(NiCoAl)1O2-Li1(NiCoMn)1O2 battery. The feasibility and accuracy of the method are verified by experiments under different states of charge and states of health. The systematic experiments under different states of charge and states of health are conducted to study the relationship between the model parameters and the aging state of the battery. It is found that the model parameters monotonically increase with the degradation of the battery under most states of charges. Three different capacity estimation methods are proposed based on the relationship between model parameters and capacity, namely the α-based, β-based, and parameter–fusion methods. The effectiveness of the three methods is verified using four different cells. The results show that the capacity estimation error under most of the aging states is less than 1%. The largest error drops from 3% under the α-based method to 1.8% under the parameter–fusion method. This study provides a potential indirect method of the state of health estimation during the resting period for battery EVs.
Author Contributions
Conceptualization, Q.F.; Data curation, Q.F., T.L., and J.Z.; Formal analysis, Q.F., X.W., and H.D.; Funding acquisition, X.W.; Investigation, Q.F., T.L., and J.Z.; Methodology, Q.F., X.W., and J.Z.; Project administration, X.W. and H.D.; Resources, Q.F., X.W., and J.Z.; Software, Q.F. and T.L.; Supervision, X.W. and H.D.; Validation, Q.F.; Visualization, Q.F. and T.L.; Writing – original draft, Q.F. and J.Z.; Writing – review and editing, Q.F., X.W., H.D., and J.Z.
Funding
This research was funded by the National Natural Science Foundation of China (NSFC, Grant No. U1764256 and No.51576142).
Conflicts of Interest
The authors declare no conflict of interest. The funders had no role in the design of the study; in the collection, analyses, or interpretation of data; in the writing of the manuscript, or in the decision to publish the results.
References
- Barre, A.; Deguilhem, B.; Grolleau, S.; Gerard, M.; Suard, F.; Riu, D. A review on lithium-ion battery ageing mechanisms and estimations for automotive applications. J. Power Sources 2013, 241, 680–689. [Google Scholar] [CrossRef]
- Lu, L.G.; Han, X.B.; Li, J.Q.; Hua, J.F.; Ouyang, M.G. A review on the key issues for lithium-ion battery management in electric vehicles. J. Power Sources 2013, 226, 272–288. [Google Scholar] [CrossRef]
- Zheng, Y.J.; Ouyang, M.G.; Han, X.B.; Lu, L.G.; Li, J.Q. Investigating the error sources of the online state of charge estimation methods for lithium-ion batteries in electric vehicles. J. Power Sources 2018, 377, 161–188. [Google Scholar] [CrossRef]
- Waag, W.; Fleischer, C.; Sauer, D.U. Critical review of the methods for monitoring of lithium-ion batteries in electric and hybrid vehicles. J. Power Sources 2014, 258, 321–339. [Google Scholar] [CrossRef]
- Rezvanizaniani, S.M.; Liu, Z.C.; Chen, Y.; Lee, J. Review and recent advances in battery health monitoring and prognostics technologies for electric vehicle (EV) safety and mobility. J. Power Sources 2014, 256, 110–124. [Google Scholar] [CrossRef]
- Berecibar, M.; Gandiaga, I.; Villarreal, I.; Omar, N.; Van Mierlo, J.; Van den Bossche, P. Critical review of state of health estimation methods of Li-ion batteries for real applications. Renew. Sust. Energ. Rev. 2016, 56, 572–587. [Google Scholar] [CrossRef]
- Farmann, A.; Waag, W.; Marongiu, A.; Sauer, D.U. Critical review of on-board capacity estimation techniques for lithium-ion batteries in electric and hybrid electric vehicles. J. Power Sources 2015, 281, 114–130. [Google Scholar] [CrossRef]
- Han, X.B.; Ouyang, M.G.; Lu, L.G.; Li, J.Q. A comparative study of commercial lithium ion battery cycle life in electric vehicle: Capacity loss estimation. J. Power Sources 2014, 268, 658–669. [Google Scholar] [CrossRef]
- Wei, Z.B.; Leng, F.; He, Z.J.; Zhang, W.Y.; Li, K.Y. Online State of Charge and State of Health Estimation for a Lithium-Ion Battery Based on a Data-Model Fusion Method. Energies 2018, 11, 16. [Google Scholar] [CrossRef]
- Huang, S.C.; Tseng, K.H.; Liang, J.W.; Chang, C.L.; Pecht, M.G. An Online SOC and SOH Estimation Model for Lithium-Ion Batteries. Energies 2017, 10, 18. [Google Scholar] [CrossRef]
- Tran, N.T.; Khan, A.B.; Choi, W. State of Charge and State of Health Estimation of AGM VRLA Batteries by Employing a Dual Extended Kalman Filter and an ARX Model for Online Parameter Estimation. Energies 2017, 10, 18. [Google Scholar] [CrossRef]
- Hu, C.; Youn, B.D.; Chung, J. A multiscale framework with extended Kalman filter for lithium-ion battery SOC and capacity estimation. Appl. Energy 2012, 92, 694–704. [Google Scholar] [CrossRef]
- Goh, T.; Park, M.; Seo, M.; Kim, J.G.; Kim, S.W. Capacity estimation algorithm with a second-order differential voltage curve for Li-ion batteries with NMC cathodes. Energy 2017, 135, 257–268. [Google Scholar] [CrossRef]
- Weng, C.H.; Cui, Y.J.; Sun, J.; Peng, H. On-board state of health monitoring of lithium-ion batteries using incremental capacity analysis with support vector regression. J. Power Sources 2013, 235, 36–44. [Google Scholar] [CrossRef]
- Yang, J.F.; Xia, B.; Huang, W.X.; Fu, Y.H.; Mi, C. Online state-of-health estimation for lithium-ion batteries using constant-voltage charging current analysis. Appl. Energy 2018, 212, 1589–1600. [Google Scholar] [CrossRef]
- Yu, J.S.; Mo, B.H.; Tang, D.Y.; Yang, J.; Wan, J.Q.; Liu, J.J. Indirect State-of-Health Estimation for Lithium-Ion Batteries under Randomized Use. Energies 2017, 10, 19. [Google Scholar] [CrossRef]
- Boukamp, B.A. Electrochemical impedance spectroscopy in solid state ionics: Recent advances. Solid State Ion. 2004, 169, 65–73. [Google Scholar] [CrossRef]
- Waag, W.; Kabitz, S.; Sauer, D.U. Experimental investigation of the lithium-ion battery impedance characteristic at various conditions and aging states and its influence on the application. Appl. Energy 2013, 102, 885–897. [Google Scholar] [CrossRef]
- Remmlinger, J.; Buchholz, M.; Meiler, M.; Bernreuter, P.; Dietmayer, K. State-of-health monitoring of lithium-ion batteries in electric vehicles by on-board internal resistance estimation. J. Power Sources 2011, 196, 5357–5363. [Google Scholar] [CrossRef]
- Remmlinger, J.; Buchholz, M.; Soczka-Guth, T.; Dietmayer, K. On-board state-of-health monitoring of lithium-ion batteries using linear parameter-varying models. J. Power Sources 2013, 239, 689–695. [Google Scholar] [CrossRef]
- Chiang, Y.H.; Sean, W.Y.; Ke, J.C. Online estimation of internal resistance and open-circuit voltage of lithium-ion batteries in electric vehicles. J. Power Sources 2011, 196, 3921–3932. [Google Scholar] [CrossRef]
- Cui, Y.Z.; Zuo, P.J.; Du, C.Y.; Gao, Y.Z.; Yang, J.; Cheng, X.Q.; Ma, Y.L.; Yin, G.P. State of health diagnosis model for lithium ion batteries based on real-time impedance and open circuit voltage parameters identification method. Energy 2018, 144, 647–656. [Google Scholar] [CrossRef]
- Xia, B.Z.; Huang, R.; Lao, Z.Z.; Zhang, R.F.; Lai, Y.Z.; Zheng, W.W.; Wang, H.W.; Wang, W.; Wang, M.W. Online Parameter Identification of Lithium-Ion Batteries Using a Novel Multiple Forgetting Factor Recursive Least Square Algorithm. Energies 2018, 11, 19. [Google Scholar] [CrossRef]
- Wang, T.S.; Pei, L.; Wang, T.T.; Lu, R.G.; Zhu, C.B. On-Board State-of-Health Estimation at a Wide Ambient Temperature Range in Lithium-Ion Batteries. Energies 2015, 8, 8467–8481. [Google Scholar] [CrossRef]
- Baghdadi, I.; Briat, O.; Gyan, P.; Vinassa, J.M. State of health assessment for lithium batteries based on voltage-time relaxation measure. Electrochim. Acta 2016, 194, 461–472. [Google Scholar] [CrossRef]
- He, L.; Kim, E.; Shin, K.G.; Meng, G.Z.; He, T. Ieee, Battery State-of-Health Estimation for Mobile Devices. In 2017 ACM/IEEE 8th International Conference on Cyber-Physical Systems; IEEE: New York, NY, USA, 2017; pp. 51–60. [Google Scholar]
- Qin, T.C.; Zeng, S.K.; Guo, J.B.; Skaf, Z.W. A Rest Time-Based Prognostic Framework for State of Health Estimation of Lithium-Ion Batteries with Regeneration Phenomena. Energies 2016, 9, 18. [Google Scholar] [CrossRef]
- Huang, K.; Guo, Y.F.; Tseng, M.L.; Wu, K.J.; Li, Z.G. A Novel Health Factor to Predict the Battery’s State-of-Health Using a Support Vector Machine Approach. Appl. Sci. 2018, 8, 21. [Google Scholar] [CrossRef]
- Attidekou, P.S.; Wang, C.; Armstrong, M.; Lambert, S.M.; Christensen, P.A. A New Time Constant Approach to Online Capacity Monitoring and Lifetime Prediction of Lithium Ion Batteries for Electric Vehicles (EV). J. Electrochem. Soc. 2017, 164, A1792–A1801. [Google Scholar] [CrossRef]
- Barai, A.; Chouchelamane, G.H.; Guo, Y.; McGordon, A.; Jennings, P. A study on the impact of lithium-ion cell relaxation on electrochemical impedance spectroscopy. J. Power Sources 2015, 280, 74–80. [Google Scholar] [CrossRef]
- Galushkin, N.E.; Yazvinskaya, N.N.; Galushkin, D.N. Model of Relaxation Processes in Batteries. ECS Electrochem. Lett. 2015, 4, 3. [Google Scholar] [CrossRef]
- Yang, J.; Du, C.Y.; Wang, T.; Gao, Y.Z.; Cheng, X.Q.; Zuo, P.J.; Ma, Y.L.; Wang, J.J.; Yin, G.P.; Xie, J.Y.; Lei, B. Rapid Prediction of the Open-Circuit-Voltage of Lithium Ion Batteries Based on an Effective Voltage Relaxation Model. Energies 2018, 11, 15. [Google Scholar] [CrossRef]
- Li, A.; Pelissier, S.; Venet, P.; Gyan, P. Fast Characterization Method for Modeling Battery Relaxation Voltage. Batteries 2016, 2, 15. [Google Scholar] [CrossRef]
- Pei, L.; Wang, T.S.; Lu, R.G.; Zhu, C.B. Development of a voltage relaxation model for rapid open-circuit voltage prediction in lithium-ion batteries. J. Power Sources 2014, 253, 412–418. [Google Scholar] [CrossRef]
- Tang, X.P.; Zou, C.F.; Yao, K.; Chen, G.H.; Liu, B.Y.; He, Z.W.; Gao, F.R. A fast estimation algorithm for lithium-ion battery state of health. J. Power Sources 2018, 396, 453–458. [Google Scholar] [CrossRef]
- Christensen, J.; Newman, J. Stress generation and fracture in lithium insertion materials. J. Solid State Electrochem. 2006, 10, 293–319. [Google Scholar] [CrossRef]
- Schmidt, C.L.; Skarstad, P.M. Development of an equivalent-circuit model for the lithium/iodine battery. J. Power Sources 1997, 65, 121–128. [Google Scholar] [CrossRef]
Figure 1.
Schematic diagram of N-order Electrical Circuit Model (ECM).

Figure 2.
Fitting curves with different orders of ECM.

Figure 3.
Relaxation voltage curve of pretests.

Figure 4.
Comparison between equal time interval and equal voltage interval method.

Figure 5.
Relationship between time coefficient and time, and fitting curve. (a) results of test (a); (b) results of test (b); (c) results of test (c); (d) results of test (d).
Figure 5.
Relationship between time coefficient and time, and fitting curve. (a) results of test (a); (b) results of test (b); (c) results of test (c); (d) results of test (d).


Figure 6.
Verification of linear relationship between time coefficient and time.

Figure 7.
Relationships between relaxation model parameters and SOC under different aging states after charging condition. (a) results of α; (b) results of β.
Figure 7.
Relationships between relaxation model parameters and SOC under different aging states after charging condition. (a) results of α; (b) results of β.

Figure 8.
Relationships between relaxation model parameters and SOC under different aging states after discharging condition. (a) results of α; (b) results of β.
Figure 8.
Relationships between relaxation model parameters and SOC under different aging states after discharging condition. (a) results of α; (b) results of β.

Figure 9.
Relationship between relaxation voltage model parameters and aging cycles at 65%, 70%, 75%, and 80% SOC under charging condition of cell #1. (a) results of α; (b) results of β.
Figure 9.
Relationship between relaxation voltage model parameters and aging cycles at 65%, 70%, 75%, and 80% SOC under charging condition of cell #1. (a) results of α; (b) results of β.

Figure 10.
Relationship between relaxation voltage model parameters and aging cycles at 40%, 45%, 75%, and 80% SOC under discharging condition of cell #1. (a) results of α; (b) results of β.
Figure 10.
Relationship between relaxation voltage model parameters and aging cycles at 40%, 45%, 75%, and 80% SOC under discharging condition of cell #1. (a) results of α; (b) results of β.

Figure 11.
Relationship between capacity and aging cycle.

Figure 12.
Relationship between relaxation voltage model parameters and capacity at 65%, 70%, 75%, and 80% SOC under charging condition of cell #1 and #2. (a) results of α; (b) results of β.
Figure 12.
Relationship between relaxation voltage model parameters and capacity at 65%, 70%, 75%, and 80% SOC under charging condition of cell #1 and #2. (a) results of α; (b) results of β.

Figure 13.
Relationship between relaxation voltage model parameters and capacity at 40%, 45%, 75%, and 80% SOC under discharging condition of cell #1 and #2. (a) results of α; (b) results of β.
Figure 13.
Relationship between relaxation voltage model parameters and capacity at 40%, 45%, 75%, and 80% SOC under discharging condition of cell #1 and #2. (a) results of α; (b) results of β.

Figure 14.
Fitted linear model of α-based capacity estimation method. (a) 70% SOC under charging condition; (b) 40% SOC under discharging condition.
Figure 14.
Fitted linear model of α-based capacity estimation method. (a) 70% SOC under charging condition; (b) 40% SOC under discharging condition.

Figure 15.
Fitted linear model of β-based capacity estimation method. (a) 70% SOC under charging condition; (b) 40% SOC under discharging condition.
Figure 15.
Fitted linear model of β-based capacity estimation method. (a) 70% SOC under charging condition; (b) 40% SOC under discharging condition.


Table 1.
Four pretests under different working conditions and states.
| Test No. | Temperature/°C | Aging Cycles | Current Rate/C | Working Condition | SOC (Initial) | SOC (End) |
|---|---|---|---|---|---|---|
| (a) | 25 | 100 | 1 | Charge | 80% | 85% |
| (b) | 25 | 450 | 1 | Charge | 80% | 85% |
| (c) | 25 | 100 | 1 | Discharge | 90% | 85% |
| (d) | 25 | 100 | 1 | Charge | 70% | 75% |
Table 2.
Voltage relaxation test procedure under different SOCs.
| Step | Operation |
|---|---|
| 1 | CC discharge at 1C until voltage reaches 2.55 V; |
| 2 | Rest for 2 h; |
| 3 | CC charge at 1C for 180 s; |
| 4 | Rest for 2 h and record the voltage data; |
| 5 | If the number of cycles does not reach the set value of 20, go back to step 3 to continue, otherwise go to step 6; |
| 6 | CCCV charge at 1C until voltage reaches 4.2 V and current reaches 0.05C; |
| 7 | Rest for 2 h; |
| 8 | CC discharge at 1C for 180 s; |
| 9 | Rest for 2 h and record the voltage data; |
| 10 | If the number of cycles does not reach the set value of 20, go back to step 8 to continue, otherwise end. |
Table 3.
Estimated results of α-based capacity estimation method at 70% SOC under charging condition.
Table 3.
Estimated results of α-based capacity estimation method at 70% SOC under charging condition.
| Cell No. | EFC | α | Actual Capacity/Ah | Estimated Capacity/Ah | Absolute Error/Ah | Relative Error/% |
|---|---|---|---|---|---|---|
| #3 | 150 | 1.27631 | 2.4219 | 2.4303 | 0.0084 | 0.3452 |
| #4 | 350 | 1.69099 | 2.3349 | 2.3408 | 0.0059 | 0.2517 |
| #5 | 550 | 2.67328 | 2.1195 | 2.1288 | 0.0093 | 0.4392 |
| #6 | 650 | 2.95165 | 2.062 | 2.0687 | 0.0067 | 0.3269 |
Table 4.
Estimated results of α-based capacity estimation method at 40% SOC under discharging condition.
Table 4.
Estimated results of α-based capacity estimation method at 40% SOC under discharging condition.
| Cell No. | EFC | α | Actual Capacity/Ah | Estimated Capacity/Ah | Absolute Error/Ah | Relative Error/% |
|---|---|---|---|---|---|---|
| #3 | 150 | 1.16597 | 2.4219 | 2.4401 | 0.0182 | 0.7511 |
| #4 | 350 | 1.40985 | 2.3349 | 2.3314 | −0.0035 | −0.1504 |
| #5 | 550 | 1.87548 | 2.1195 | 2.1238 | 0.0043 | 0.2049 |
| #6 | 650 | 1.87160 | 2.062 | 2.1256 | 0.0636 | 3.0831 |
Table 5.
Estimated results of β-based capacity estimation method at 70% SOC under charging condition.
Table 5.
Estimated results of β-based capacity estimation method at 70% SOC under charging condition.
| Cell No. | EFC | β | Actual Capacity/Ah | Estimated Capacity/Ah | Absolute Error/Ah | Relative Error/% |
|---|---|---|---|---|---|---|
| #3 | 150 | 27.205 | 2.4219 | 2.4145 | −0.0074 | −0.3053 |
| #4 | 350 | 34.0138 | 2.3349 | 2.3372 | 0.0023 | 0.0992 |
| #5 | 550 | 52.1348 | 2.1195 | 2.1315 | 0.012 | 0.5672 |
| #6 | 650 | 55.0529 | 2.062 | 2.0984 | 0.0364 | 1.7651 |
Table 6.
Estimated results of β-based capacity estimation method at 40% SOC under discharging condition.
Table 6.
Estimated results of β-based capacity estimation method at 40% SOC under discharging condition.
| Cell No. | EFC | β | Actual Capacity/Ah | Estimated Capacity/Ah | Absolute Error/Ah | Relative Error/% |
|---|---|---|---|---|---|---|
| #3 | 150 | 40.2415 | 2.4219 | 2.441 | 0.0191 | 0.788 |
| #4 | 350 | 45.029 | 2.3349 | 2.3341 | −0.0008 | −0.0334 |
| #5 | 550 | 53.8935 | 2.1195 | 2.1363 | 0.0168 | 0.7906 |
| #6 | 650 | 56.7581 | 2.062 | 2.0723 | 0.0103 | 0.5003 |
Table 7.
Estimated results of parameter–fusion estimation method at 70% SOC under charging condition.
Table 7.
Estimated results of parameter–fusion estimation method at 70% SOC under charging condition.
| Cell No. | EFC | Actual Capacity/Ah | Estimated Capacity/Ah | Absolute Error/Ah | Relative Error/% |
|---|---|---|---|---|---|
| #3 | 150 | 2.4219 | 2.4224 | 0.0005 | 0.0200 |
| #4 | 350 | 2.3349 | 2.3390 | 0.0041 | 0.1755 |
| #5 | 550 | 2.1195 | 2.1302 | 0.0107 | 0.5032 |
| #6 | 650 | 2.062 | 2.0836 | 0.0216 | 1.0460 |
Table 8.
Estimated results of parameter–fusion estimation method at 40% SOC under discharging condition.
Table 8.
Estimated results of parameter–fusion estimation method at 40% SOC under discharging condition.
| Cell No. | EFC | Actual Capacity/Ah | Estimated Capacity/Ah | Absolute Error/Ah | Relative Error/% |
|---|---|---|---|---|---|
| #3 | 150 | 2.4219 | 2.4405 | 0.0186 | 0.7695 |
| #4 | 350 | 2.3349 | 2.3328 | −0.0021 | −0.0919 |
| #5 | 550 | 2.1195 | 2.1301 | 0.0106 | 0.4978 |
| #6 | 650 | 2.062 | 2.0989 | 0.0369 | 1.7917 |
© 2019 by the authors. Licensee MDPI, Basel, Switzerland. This article is an open access article distributed under the terms and conditions of the Creative Commons Attribution (CC BY) license (http://creativecommons.org/licenses/by/4.0/).
Share and Cite
MDPI and ACS Style
Fang, Q.; Wei, X.; Lu, T.; Dai, H.; Zhu, J. A State of Health Estimation Method for Lithium-Ion Batteries Based on Voltage Relaxation Model. Energies 2019, 12, 1349. https://doi.org/10.3390/en12071349
AMA Style
Fang Q, Wei X, Lu T, Dai H, Zhu J. A State of Health Estimation Method for Lithium-Ion Batteries Based on Voltage Relaxation Model. Energies. 2019; 12(7):1349. https://doi.org/10.3390/en12071349
Chicago/Turabian StyleFang, Qiaohua, Xuezhe Wei, Tianyi Lu, Haifeng Dai, and Jiangong Zhu. 2019. "A State of Health Estimation Method for Lithium-Ion Batteries Based on Voltage Relaxation Model" Energies 12, no. 7: 1349. https://doi.org/10.3390/en12071349
Note that from the first issue of 2016, this journal uses article numbers instead of page numbers. See further details here.