Modeling the Total Energy Consumption of Mobile Network Services and Applications
by
 , , , ,
Ming Yan
1,* ,
,
Chien Aun Chan
2,* ,
,
André F. Gygax
2,3,
Jinyao Yan
1,
Leith Campbell
4,
Ampalavanapillai Nirmalathas
4 and
Christopher Leckie
5 1
Faculty of Science and Technology, Communication University of China, Beijing 100024, China
2
Networked Society Institute, University of Melbourne, Melbourne, VIC 3010, Australia
3
Department of Finance, Faculty of Business and Economics, University of Melbourne, Melbourne, VIC 3010, Australia
4
Department of Electrical and Electronic Engineering, University of Melbourne, Melbourne, VIC 3010, Australia
5
School of Computing and Information Systems, University of Melbourne, Melbourne, VIC 3010, Australia
*
Authors to whom correspondence should be addressed.
Energies 2019, 12(1), 184; https://doi.org/10.3390/en12010184
Submission received: 28 November 2018
/
Revised: 26 December 2018
/
Accepted: 3 January 2019
/
Published: 7 January 2019
Abstract
:Reducing the energy consumption of Internet services requires knowledge about the specific traffic and energy consumption characteristics, as well as the associated end-to-end topology and the energy consumption of each network segment. Here, we propose a shift from segment-specific to service-specific end-to-end energy-efficiency modeling to align engineering with activity-based accounting principles. We use the model to assess a range of the most popular instant messaging and video play applications to emerging augmented reality and virtual reality applications. We demonstrate how measurements can be conducted and used in service-specific end-to-end energy consumption assessments. Since the energy consumption is dependent on user behavior, we then conduct a sensitivity analysis on different usage patterns and identify the root causes of service-specific energy consumption. Our main findings show that smartphones are the main energy consumers for web browsing and instant messaging applications, whereas the LTE wireless network is the main consumer for heavy data applications such as video play, video chat and virtual reality applications. By using small cell offloading and mobile edge caching, our results show that the energy consumption of popular and emerging applications could potentially be reduced by over 80%.
1. Introduction
The explosive demand for mobile data has driven a massive deployment of mobile base stations (BSs), higher bandwidth wireline core networks and larger data centers. As a consequence, the overall energy consumption of both smartphones and the end-to-end communication network has rapidly increased. For example, the battery capacity of iPhones has increased from 1880 mAh (iPhone 6) to 2716 mAh for the iPhone X [1], which could indicate higher power requirements for smartphone applications. In addition, the total number of 4G BSs of China Mobile has increased to 1.51 million in 2016 with an annual network energy consumption of around 20,000 GWh, which equates to a 16% increase since 2014 [2]. Furthermore, the data centers of Akamai consumed 233,090 MWh electricity in 2016, which is an increase of around 50% since 2012 [3].
The increasing number of smartphone users together with the emergence of data-heavy mobile applications such as high-definition video play, virtual reality (VR) and augmented reality (AR) are driving the growth in mobile data traffic. These applications typically require very high network bandwidth and smartphone computing resources [4,5,6]. Moreover, the instant messaging (IM) applications, such as WeChat, Twitter, etc., attract a huge number of users because they offer a variety of mobile services including text/picture/voice messages, audio/video chat, moments, etc., and also consume a lot of network resources. Existing research to reduce the overall energy consumption of the Internet, including communication networks, cloud data centers and mobile devices, has focused on segment-specific energy consumption modeling and assessment of the end-to-end delivery of mobile applications, such as power models for smartphones, BSs, and edge and core networks. For example, various power models have been developed for estimating the energy consumption of different smartphone components such as 3G/4G, WiFi, central processing unit (CPU), liquid crystal display (LCD) and global positioning system (GPS). The researches in [7,8,9,10] show that the energy consumption of smartphones is influenced by different traffic characteristics and signaling patterns of mobile applications. Various power models of a long-term evolution (LTE) BS proposed in [11,12,13,14,15] try to assess energy consumption of mobile applications by separating their total energy consumption into data and signaling energy components. On the other hand, the authors in [16] performed a comprehensive review and updated to the radio network energy performance evaluation method proposed by the European EARTH project [17]. The paper provides a new baseline network power consumption based on population density, which is crucial for energy-efficient 5G deployment. The topology of a network between an end-user and a cloud data center and the corresponding energy modeling of such networks is discussed in [18,19,20]. Research has shown that a large data center can consume as much energy as a small city [21,22,23]. However, since mobile data traffic consumes energy in every network segment of the end-to-end link, a better understanding of the service-specific end-to-end energy consumption is critical for application developers, mobile operators and data center providers so that they can jointly improve the overall energy efficiency of mobile services.
Furthermore, although existing energy efficiency models are suited for current network architectures, there is an emerging trend towards using dynamic network architectures for next generation networks such as 5G based on software defined networking, small cell offloading, network function virtualization and mobile edge caching and computing [24,25,26,27]. For example, using mobile edge caching and computing technology, user applications and services could be migrated between distributed servers located anywhere in the network depending on network conditions, service usage patterns and users’ mobility in order to improve the performance of service delivery [28,29,30]. Alternatively, depending on the service type, certain data intensive applications such as video could be offloaded from macro cells to small cells in the 5G network to improve user experience and reduce the load on macro cells [31,32,33]. Therefore, segment-specific energy efficiency models are not sufficient because services could be activated and migrated within the network. Furthermore, by using different emerging technologies such as small-cell offloading and mobile-edge caching, the energy impacts of individual segments of the end-to-end network could change significantly, as shown in this paper. Therefore, we require a service-specific end-to-end energy consumption model in order to understand and reduce the overall energy consumption and carbon emissions of next generation networks and services. Our contributions in this paper are as follows:
- (1)
- We present a comprehensive end-to-end energy consumption model for 15 major mobile services by taking into account the important factors from each network segment from cloud to core network, mobile network and end-user devices;
- (2)
- We then demonstrate how key parameters can be measured for service-specific end-to-end energy assessments and the inter-dependency between key factors in different network segments;
- (3)
- To address usage pattern heterogeneity of mobile users, we conduct a sensitivity analysis for key mobile applications and we show that the difference in energy profiles of mobile services is mainly due to the service type, service data traffic, duration of the service and the type of end-to-end network topology;
- (4)
- Finally, we evaluate how two emerging network technologies, small cell offloading and mobile edge caching, could be used to reduce the overall energy consumption of mobile services.
We begin our investigation by introducing three typical end-to-end network topologies for mobile services to assess service-specific end-to-end energy consumption. The first step is to assess the smartphone energy consumption for different mobile services. Here, we have identified a research gap in understanding the smartphone energy profile for different mobile applications. Therefore, we conduct experiments in assessing the smartphone energy profiles for 15 mobile services running on seven popular mobile applications. Our results show that service-specific energy consumption of a smartphone’s 4G connections is mainly dependent on the 4G signaling duration, while the energy consumption of a smartphone’s CPU is mainly dependent on the type of service. Video play, map navigation, video chat and VR are among the top applications that heavily consume the smartphone’s CPU energy. Our main contribution in this paper is to present the total service-specific end-to-end energy consumption with the energy breakdown for each network segment. Smartphones are the main energy consumer for web browsing and IM applications, whereas the LTE wireless network is the main consumer for heavy data applications such as video play, video chat and VR applications. Our results show that by using small cell offloading and mobile edge caching, the overall energy consumption of applications such as video play and virtual reality could potentially be reduced by over 80%.
2. Related Work
To uncover the impact of mobile and internet services on network energy consumption, the energy consumption models based on mobile data traffic have attracted the attention of a large number of researchers. Most existing researches focus on the single segment of the entire end-to-end network, e.g., end-user devices such as smartphone, wireless access networks, wireline core networks and data centers. In this section, we analyze in more detail the related work in modeling the energy consumption of different segments of the end-to-end network.
Mobile services and applications consume smartphone energy during their executing processes. The energy consumption of an application is highly dependent on the degree of interactions among different smartphone components during application execution process. Smartphone components such as 3G/4G, WiFi, CPU, LCD, Bluetooth, and GPS are the most energy consuming components [7]. In [8], the authors proposed an experimental framework for measuring the Android smartphone power consumption of web pages, including specific components on the page, such as cascade style sheets (CSS), Javascript, images, and plug-in objects. The hardware experimental environment was built to measure the energy consumed by setting up the 3G connection with the base station and the energy consumed by transmitting various payload sizes. Results demonstrated that the energy consumption of 3G upload is usually greater than 3G download with same data size due to power consumption of transmitter to transmit packets to the base station. In [9], a simple model for the radio resource control (RRC) state of a smartphone was developed to reveal the impact of traffic characteristics on the power consumption of the smartphone. Results showed that periodic patterns of RRC connection may cause increased power consumption and signaling overload. To optimize the smartphone energy consumption caused by frequent RRC connection, the authors in [10] have modelled the performance-aware hybrid energy optimization problem of mobile devices in mobile cellular networks.
In our previous work [11,12], the energy assessment models of wireless access network such as 4G LTE BS have been investigated. Based on real network and service measurements, the proposed energy model allocated a proportion of the base station power consumption to each mobile service based on the data traffic and signaling traffic generated by the service. The main difference between signaling duration and data duration is that a radio resource control (RRC) connection needs to be established to allocate mobile radio resources before any data transmission can begin [11,12]. Upon completion of data transmission, the RRC connection needs to be released. The entire time from establishing to releasing the RRC connection is defined as the signaling duration and often is longer than the data duration for small data IM applications [11,12]. Using WeChat as an over-the-top (OTT) IM application example, results showed that WeChat consumes more BS energy than conventional mobile services due to the network signaling energy overhead. In [13], the authors developed power models for different type base stations (e.g., macro and micro) and divided the total power consumption into two parts, the static power consumption which is consumed in an empty base station and the dynamic power consumption depending on the traffic load situation. Besides the data traffic, excessive signaling overhead which is generated by newer applications such as Facebook and Twitter also consumed a large amount of energy consumption of LTE networks [14]. In [15], the authors found that using microcell BSs in LTE network can dramatically reduce the power consumption of the network. Results showed that up to a 31% cost reduction could be obtained when using microcell BSs, without the deterioration of the quality of service.
In [18], the authors developed a power consumption model for interactive cloud applications that reveals the influence of the applications on the power consumption of the network elements in a wireline network between the end-users and the cloud data center. For network equipment such as Ethernet switch, broadband network gateways, edge routers, and core routers in the wireline core network, power consumption was considered as a function of the traffic load, i.e., bits per second of data traffic, and was modelled using energy per bit as the metric. In [19], the authors introduced an energy model to compute the total energy consumption of content delivery networks which is based on a hierarchical network architecture. The authors in [20] also developed a power model that permits quantifying the energy efficiency of core network equipment at the granularity of per-packet processing, and per-byte store and forward packet handling operations.
The increasing demand for storage and computation has driven the deployment and update of large data centers. Research has shown that a large data center can consume as much energy as a small city [21]. To save energy consumption of data centers and reduce the emission of greenhouse gases, the authors in [21] proposed energy efficiency and low carbon enabler green IT framework for these large and complex data centers, and the authors in [22] outlined the major challenges in performing real-time energy efficient management of the distributed resources available at both mobile devices and the remote data centers. Moreover, in [23], the authors developed an analytic framework for modeling total power consumption of a data center and presented parametric power models of data center components.
Despite major energy efficiency research efforts have been dedicated to individual network segment, to the best of the authors’ knowledge, the end-to-end energy consumption model of mobile services including all network components from the end-user devices to the wireless access network, wireline core network and data center, has never been investigated in existing researches. In this paper, we try to develop a service-specific end-to-end energy consumption model based on the traffic characteristics and usage patterns of deferent mobile services. This end-to-end model can help reveal the energy impacts of individual segments of the end-to-end network.
3. Service-Specific End-To-End Energy Consumption Model
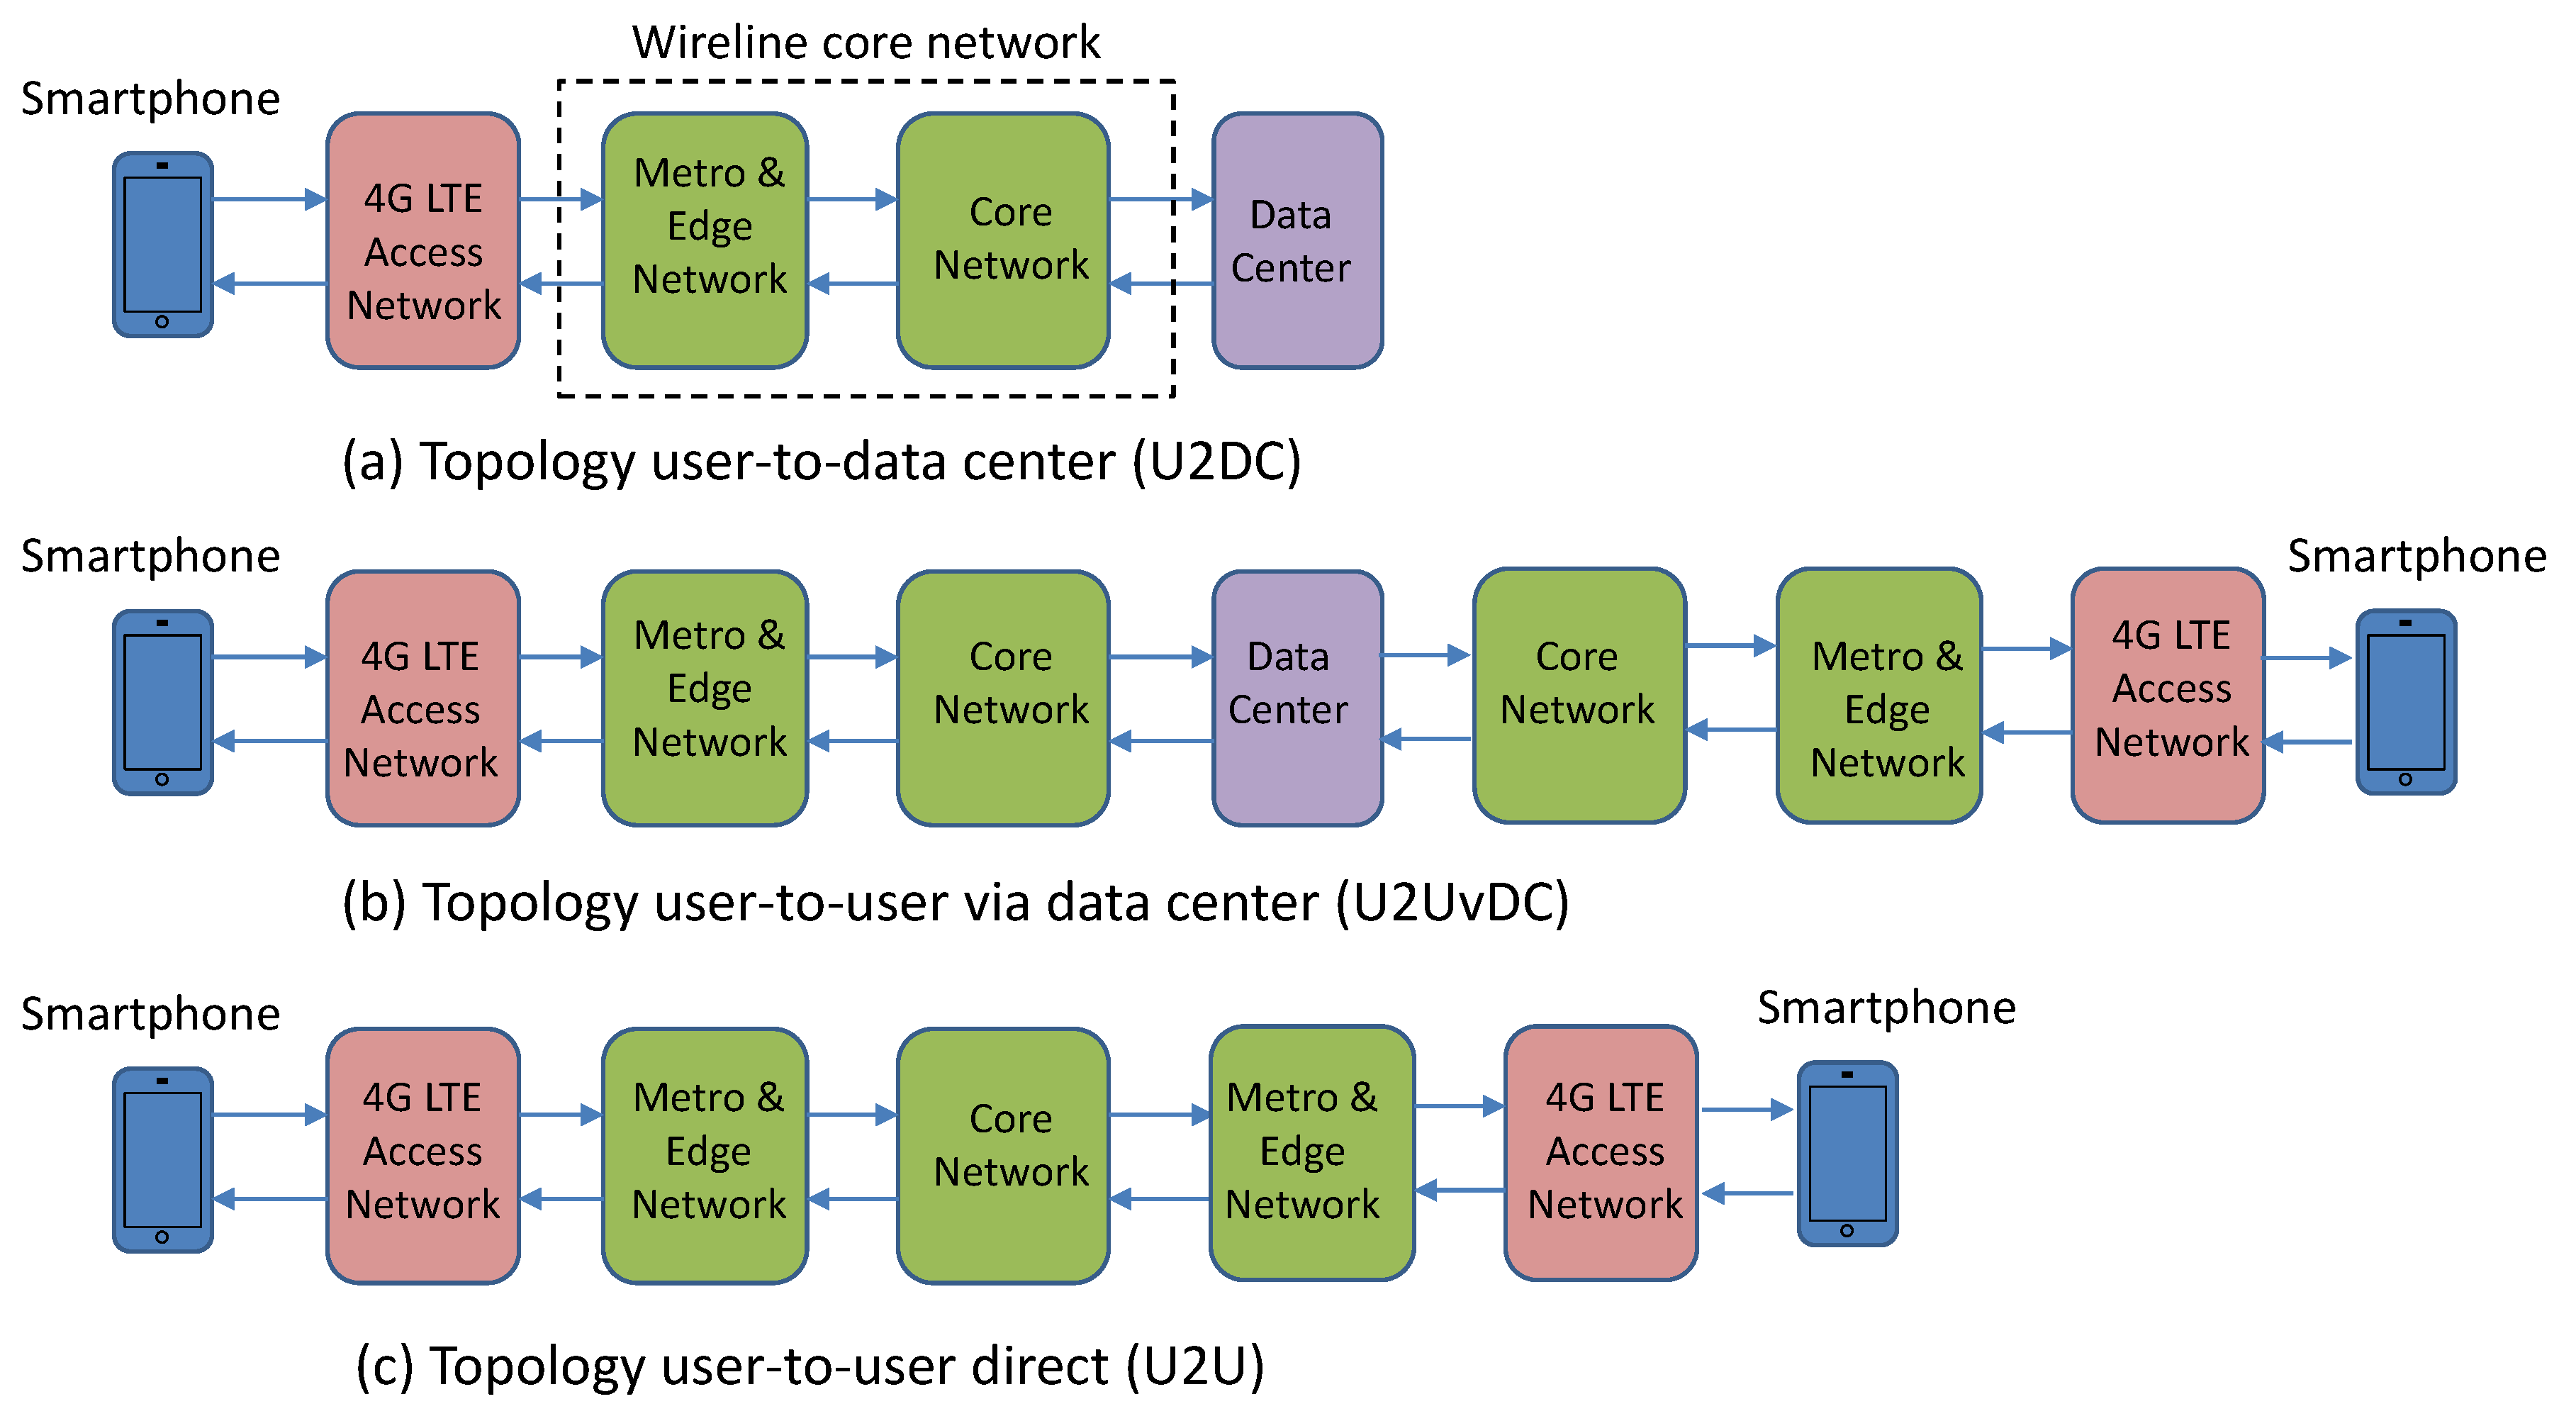
In Figure 1, we categorize major mobile services into three typical end-to-end network topologies. Topology (a), user-to-data center (U2DC), shows the end-to-end communication link between a smartphone and a data center via the 4G LTE access network and the wireline core network [18] for applications such as web browsing, file download/upload, map navigation, video on demand, VR and AR. Here, we analyze the metro, edge and core networks collectively as the wireline core network for comparison with other network segments. Topology (b), user-to-user via data center (U2UvDC), shows the typical end-to-end communication link for some of the currently most-downloaded social networking applications for services such as text, picture and voice messaging. Here, messages are sent from the sender’s smartphone and stored at the data center before being forwarded to the recipient’s smartphone. Topology (c), user-to-user direct (U2U), shows the end-to-end communication link for mobile applications that adopt the peer-to-peer protocol to provide voice, video chats and voice conference calls, which require the establishment of connections between the users before transferring data in real time.
Figure 2 demonstrates the modeling of service-specific end-to-end energy consumption. The end-to-end service energy consumption model includes four sub-models: (1) smartphone, (2) BS, (3) wireline core network and (4) data center. Each of the four sub-models will be described in detail in the following subsections, and the models will be integrated into an end-to-end service energy consumption model.
3.1. Smartphone Energy Consumption Model
This paper mainly investigates the end-to-end energy consumption of mobile services in 4G environment, so we only consider the energy consumption of 4G modules and ignore the WiFi module. In addition, in order to simplify our model, this paper does not consider the smartphone energy consumption caused by modules such as LCD, GPS, etc. In our energy consumption model, real measurements of the smartphone are needed to determine the energy consumption in terms of the 4G connection and CPU, because different mobile services usually have different data and signaling traffic requirements as well as diverse durations of service. Six major parameters need to be measured: data traffic (bps), signaling traffic (bps), data duration (s), signaling duration (s), CPU power consumption (W) and 4G connection power consumption (W). However, limited existing research has focused on evaluating these parameters for different mobile applications, which is crucial for the construction of the end-to-end service energy models. A smartphone’s service-specific energy consumption, (Joule), is the sum of the integrals of the CPU and 4G power consumption over the duration of use, as indicated by ① (in Figure 2).
3.2. BS Energy Consumption Model
In our previous works [11,12], the BS power consumption is measured as a function of resource load (i.e., physical resource block (PRB) utilization). The measured data (bps) and signaling traffic (resource elements) of a mobile service need to be converted into PRBs to determine the service power consumption in terms of data and signaling. Then the BS’s service-specific energy consumption, (Joule), can be determined by summing the integrals of the data and signaling power consumption over the duration of use, as indicated by ② (in Figure 2):
where and are the BS’s power consumption of data traffic and signaling traffic generated by mobile service, respectively:
where and are the power (in watts) consumed by one bit per second of data rate in the radio remote unit (RRU) and baseband unit (BBU) respectively at time , is the data rate (in bits per second) of the mobile service, and are the energy (in Joules) consumed by one resource element (RE) in component RRU and BBU respectively, and is the average signaling REs per second consumed by the mobile service.
Importantly, the BS’s power consumption differs for diverse types of BSs (e.g., macro, micro, pico and femto). In addition, different cell sites have different average throughput-to-PRB utilization ratios even for the same type of BS, so the BS energy consumption to deliver the same mobile service will vary between different BSs [11]. Finally, the service-specific signaling traffic is measured in terms of the number of RE in 4G LTE and its value varies over a small range, i.e., between 120 to 190 RE/s with an average of 144 RE/s [11], later used in the energy consumption assessments.
3.3. Wireline Core Network Energy Consumption Model
Energy per bit (Joules/bit) is a common metric used in determining the energy efficiency of the wireline core network [18]. Usually, the metro and edge networks consist of Ethernet switches, broadband network gateways and edge routers. Edge routers are the gateway to the core network, which consists of many large core routers. The energy per bit of these routers and switches can be calculated from their maximum capacity, maximum power and idle power [18]. For example, a CRS-3 core router has a maximum capacity of 4480 Gbps with a maximum power of 12.3 kW and an idle power of 11.07 kW; this yields an energy per bit of ~8.5 nJ/bit. In addition, the average number of network hops (i.e., routers and switches) along the path from the smartphone to the data center has been investigated in [18]. Then ③ calculates the wireline core network service-specific energy consumption, , of a mobile service as the product of the measured data traffic generated by a mobile service and the energy per bit of the wireline core network:
where and are the number of core and edge routers in the wireline core network, , , , and denote respectively the energy per bit of the core router, edge router, broadband network gateway (BNG), and Ethernet switches.
3.4. Data Center Energy Consumption Model
Usually, a data center comprises of many thousands of servers and can consume as much energy as a small city. The energy consumption of a data center includes not only the electricity consumed by these servers, but also the energy consumed by cooling facilities or dissipated in conversions within the uninterruptible power supplies (UPS) and power distribution unit (PDU) systems [21]. Therefore, it is difficult to directly assess the energy consumption of a data center caused by a mobile application. To assess the impact of data traffic on the energy consumption of a data center, Akamai Technologies Inc., a major cloud platform provider, adopts the intensity metric of electricity (kWh) per unit of network traffic (Gbps) to assess the energy performance of its data centers [3]. This energy metric of a data center, , can be calculated using the following equation:
In the above equation:
- (kWh) is the annual electricity consumption of a data center. For example, the annual electricity consumption of Akamai’s data centers was about 233 × 106 kWh in 2016 [3].
- (bit) is the annual data throughput of a data center, and can be calculated with the average daily web traffic of a data center which exceeded 30 Terabits per second for Akamai [3].
By converting the annual energy consumption of Akamai to power consumption and then dividing by the maximum network traffic, the energy per bit (Joules/bit) of Akamai’s data centers can be calculated. As in the calculation for the wireline core network energy consumption, i.e., multiplying the measured data traffic generated by a mobile service with the energy per bit of the data center, we can determine the data center energy consumption of a mobile service, (Joule), as indicated by ④ (in Figure 2):
where is the ratio of average Internet traffic to busy-hour Internet traffic, and can be assumed around 0.3 according to Cisco [34].
Finally, the total service-specific end-to-end energy consumption, (Joule), is the sum of the energy consumption of each segment used in the end-to-end communication link:
Note that, for different service types, the end-to-end network components may be different, as shown in Figure 1. Hence, the total service-specific end-to-end energy consumption will sum together the energy consumption of different network segments depending on the end-to-end topology.
4. Service-Specific Smartphone Energy and Traffic Measurements
We demonstrate the process to acquire the measurements for the six major parameters of mobile services shown in Figure 2: data traffic (bps), signaling traffic (bps), data duration (s), signaling duration (s), CPU power consumption (W) and 4G connection power consumption (W). These parameters are crucial in developing the end-to-end energy consumption model since service energy consumption of smartphones represents a major portion, yet existing research [7,8,9,10,11,12,13,14,15] has limited insights into this aspect. Therefore, we develop test cases for 15 different mobile services from seven mobile applications, as shown in Table 1. These mobile applications are grouped into (i) conventional applications (web browsing, map navigation, file upload and download); (ii) emerging applications (AR and VR, which generate a large amount of data traffic and require more computational resources from the smartphones); and (iii) popular applications (video play and IM). The video data traffic generated by video-on-demand applications, such as Youku, iQiyi and YouTube, currently dominate total mobile Internet traffic. On the other hand, IM applications such as Wechat, QQ and WhatsApp are among the most downloaded applications in the world. These IM applications provide various communication services such as text, voice, and picture messaging, as well as video and audio chats.
Packet Capture (an Android-based application that can capture communication packets of mobile services) is used to collect the uplink and downlink data traffic when testing a service. The test information for each mobile service is shown in Table 1. A smartphone’s energy consumption and the signaling duration are measured using PowerTutor, an Android-based application that displays the power consumption of major smartphone system components, such as the CPU, network interface, display, and GPS receiver, for different applications running simultaneously on the smartphone. However, PowerTutor has not been updated since October 2011 so we use the built-in power and 4G traffic management function of the Android system for cross validation. In our experiments, we used Huawei KIW-CL00 (Smartphone A in Figure 3 and Figure 4) and Samsung SM-A7100 (Smartphone B in Figure 3 and Figure 4) Android smartphones.
The same testing procedure for each mobile service was repeated five times at different times of the day and on different days. We found small variations in terms of the service data and signaling traffic, the power consumption of the 4G connection and CPU, and the 4G signaling duration. Comparing the measurements between two smartphones, we also found small variations in terms of the measurements of power consumption, as well as data and signaling traffic. The values plotted in Figure 3 and Figure 4 are the average values recorded from five separate measurements.
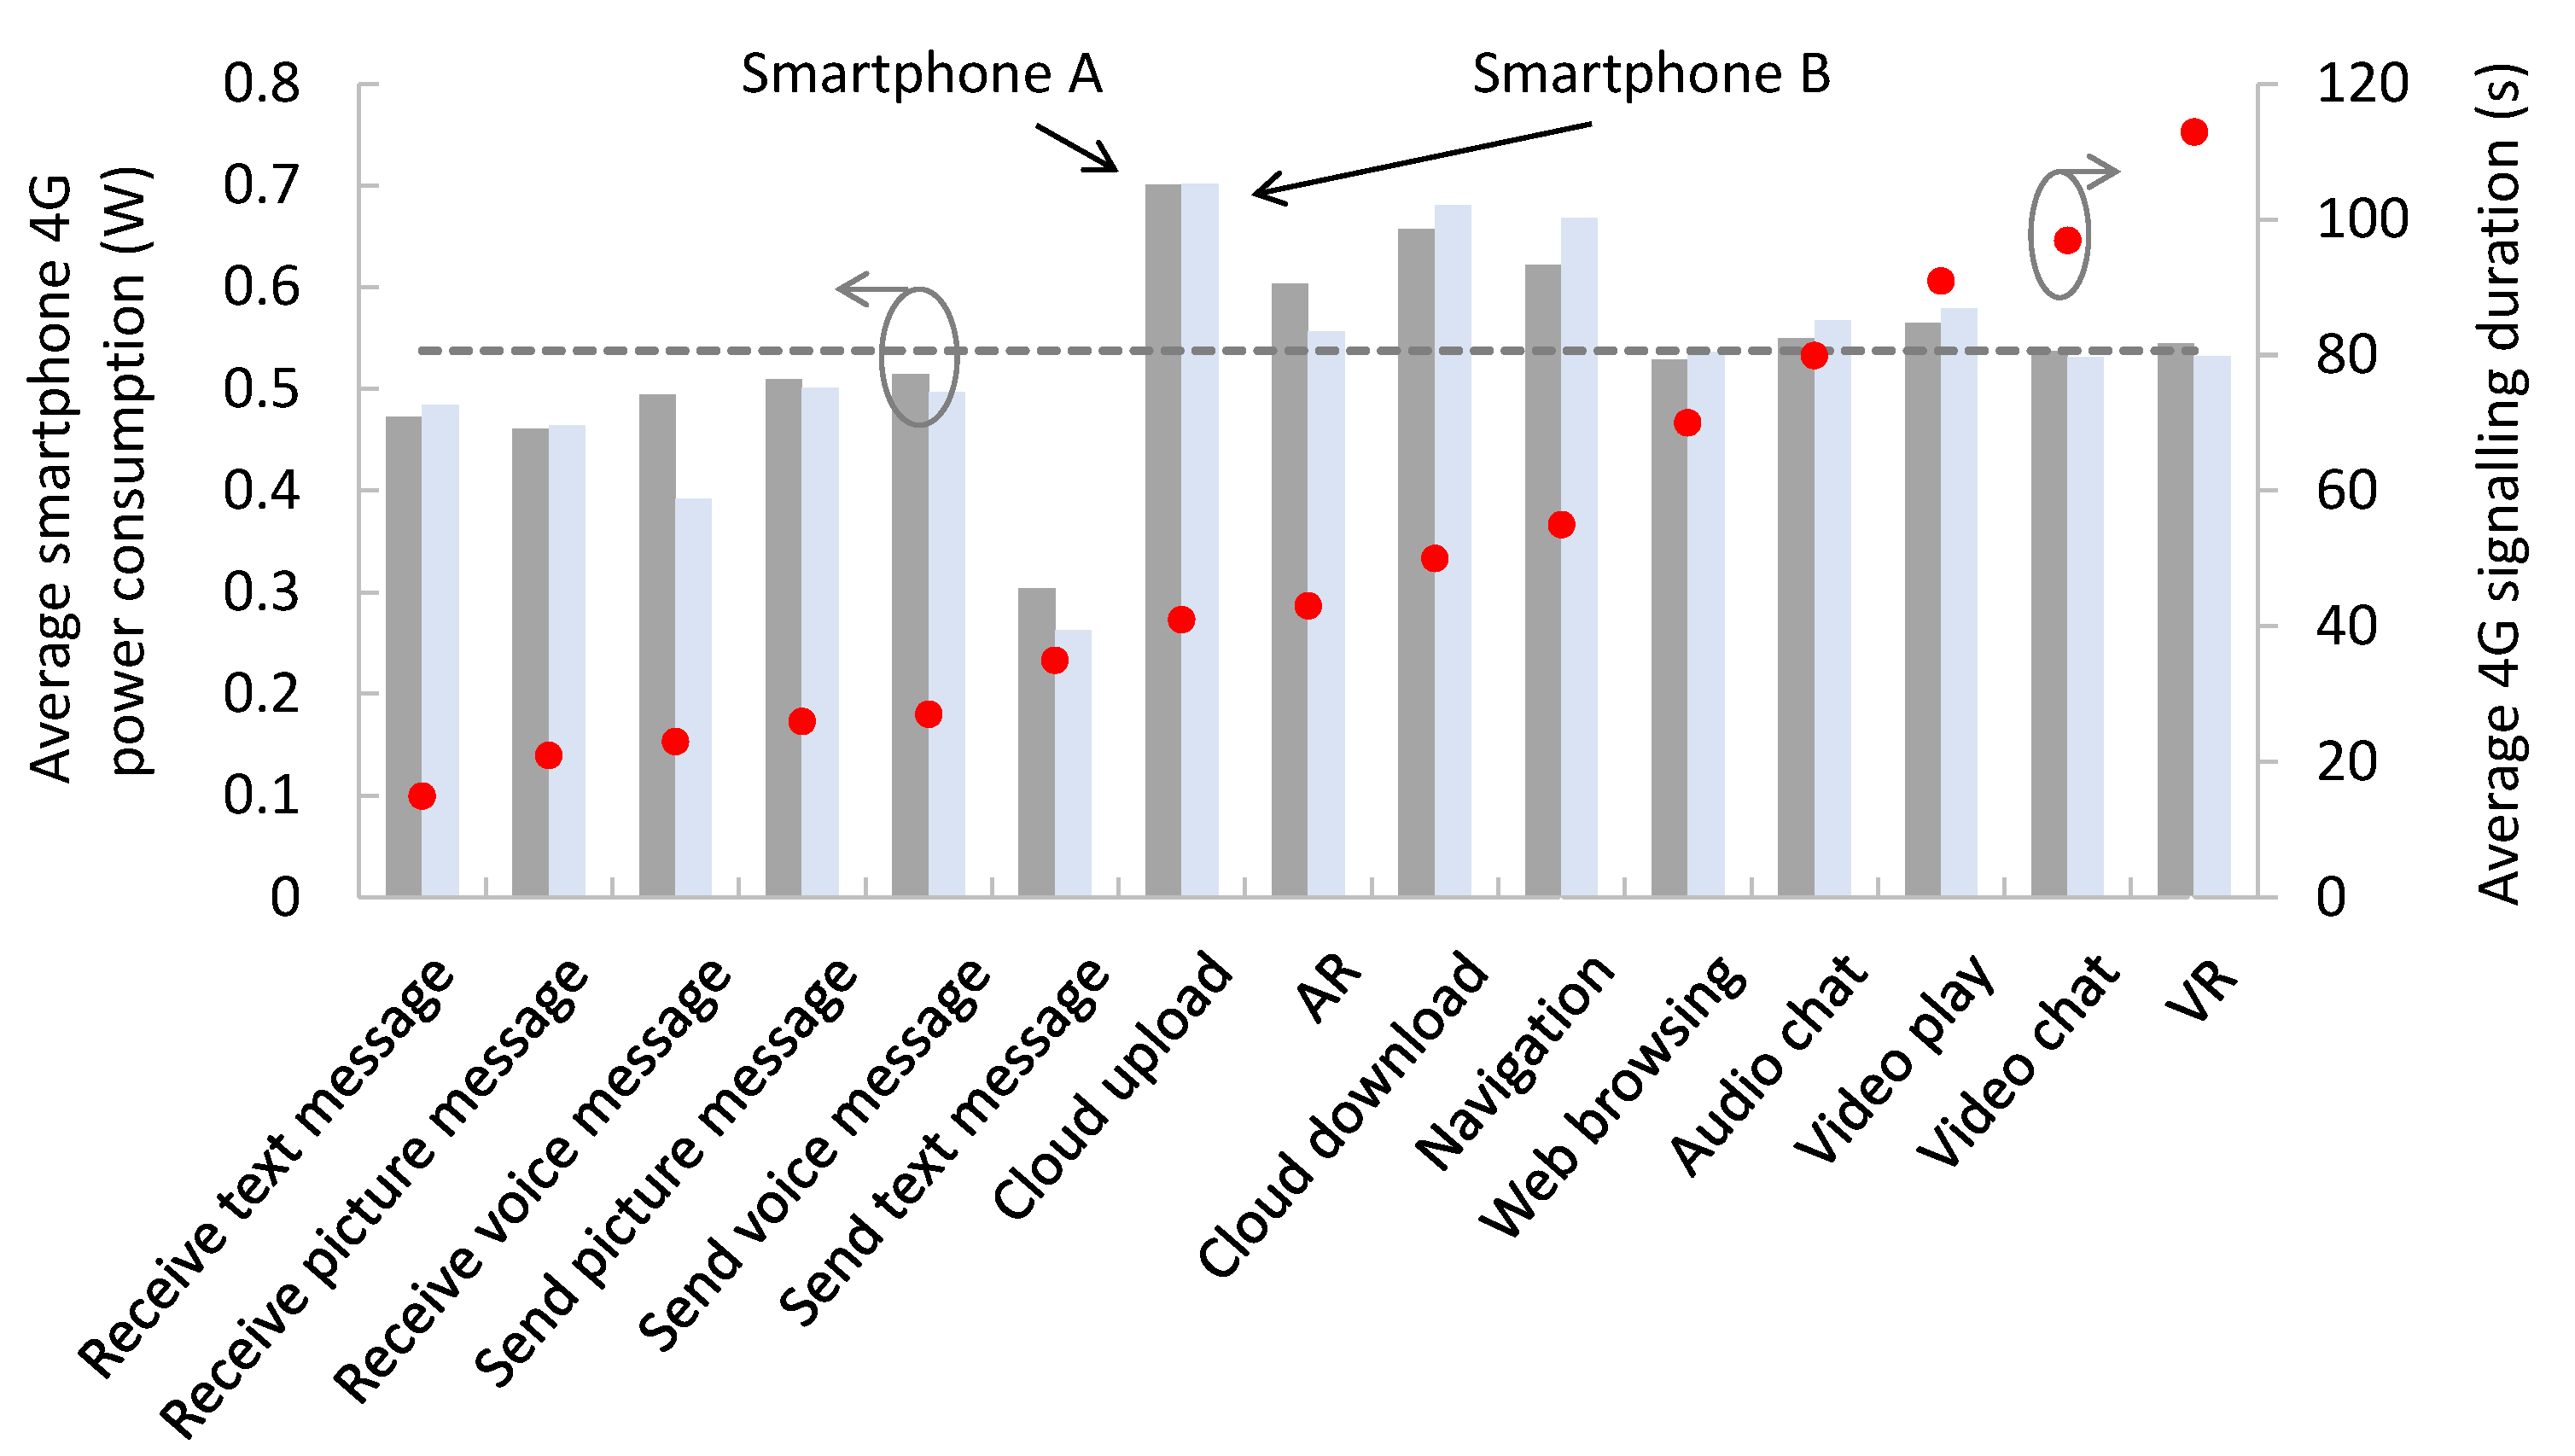
Next, our key findings follow. Figure 3 shows the average power consumption of the 4G connection and the average 4G signaling duration for different mobile services. The dashed line represents the average power consumption of 4G in Smartphone A, while the red dots represent the signaling durations for all 15 mobile services. The bar chart in Figure 3 shows that the power consumption of 4G connections does not vary much for different types of services although the signaling duration for different types of services can vary. Moreover, as shown in Table 1, the average 4G energy consumption and average signaling duration vary proportionally. These findings suggest that the 4G energy consumption of smartphones depends mainly on the signaling duration of the mobile service and is close to independent of the data traffic. Furthermore, the two smartphones’ measurement variations were small.
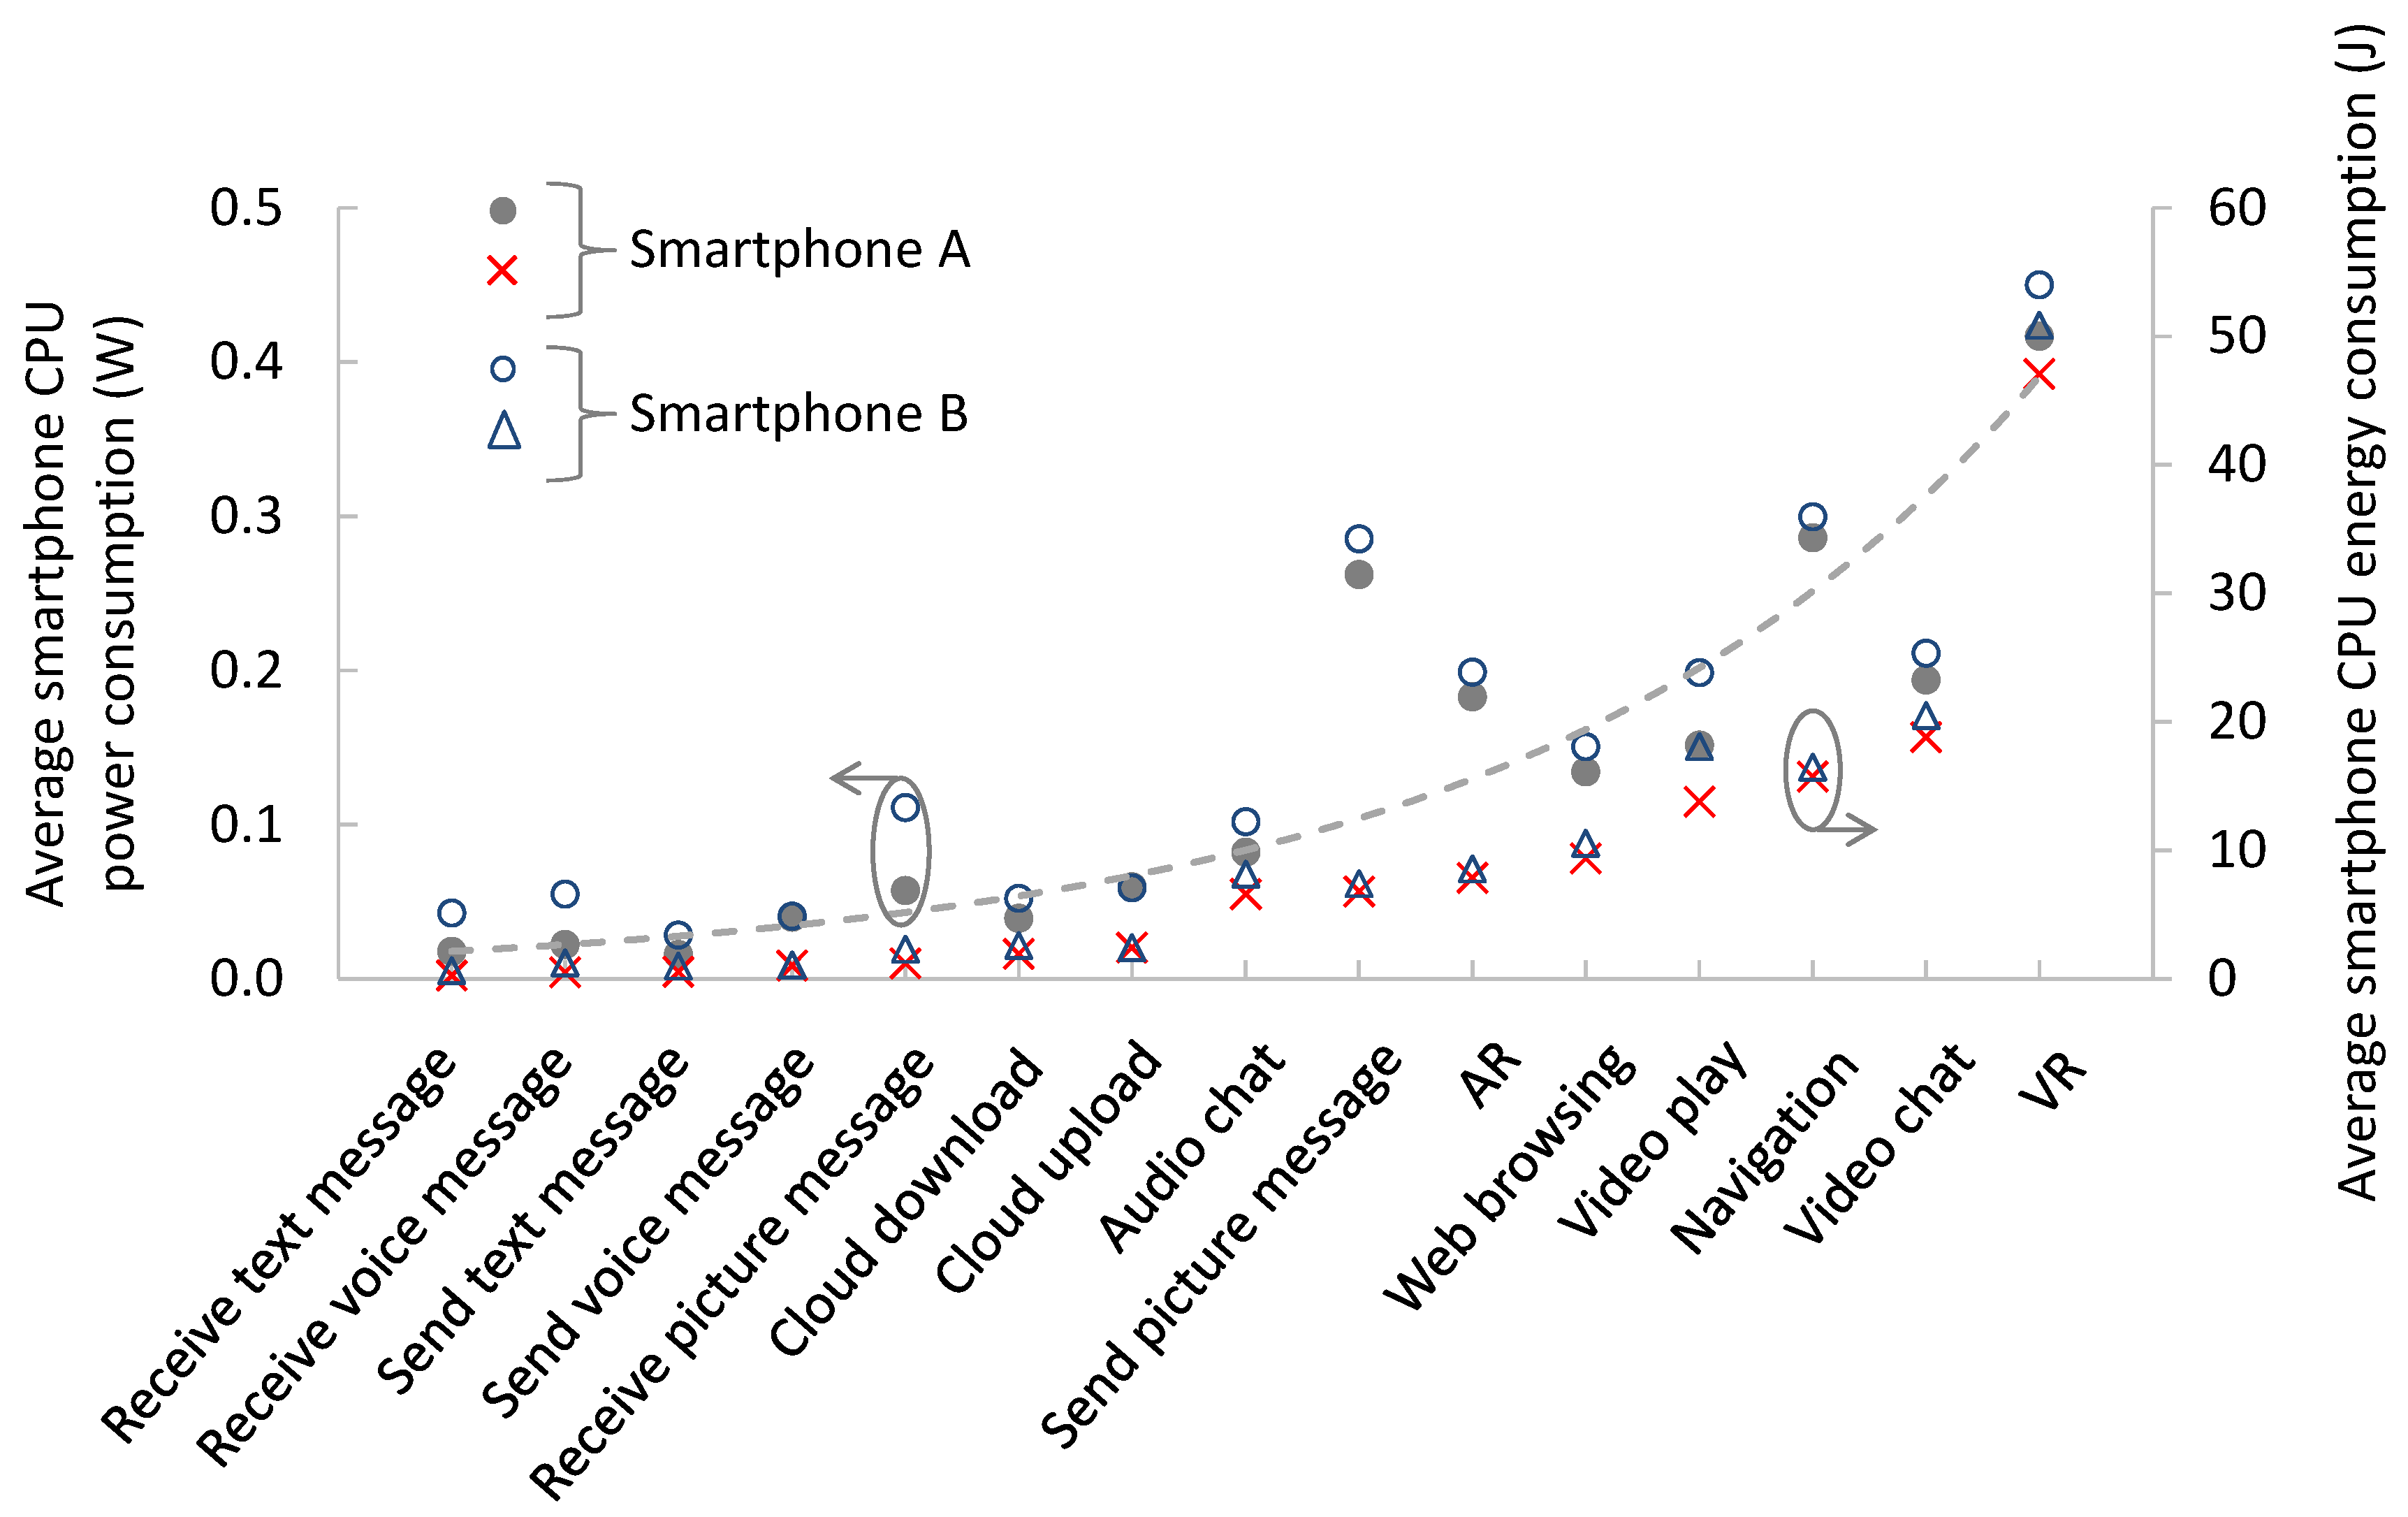
Figure 4 shows the average smartphone CPU power and energy consumption for all services. Again, measurements for smartphones A and B are plotted to indicate the robustness of the measurements. We observed only small variations in the measurements. The dashed line represents the exponential trend of the average smartphone’s CPU service-specific power consumption for smartphone A. Combining the observations from Figure 4 and the measurements in Table 1, we found that the CPU energy consumption of smartphones does not correlate strongly with the data traffic of mobile services. However, the CPU power consumption of the tested smartphones is strongly dependent on the type of application running on them. For example, as shown in Figure 4, IM-type services generally require very little CPU power consumption, while navigation, video chat and VR require relatively high CPU power consumption compared to other mobile services.
5. Total Service-Specific End-To-End Energy Consumption
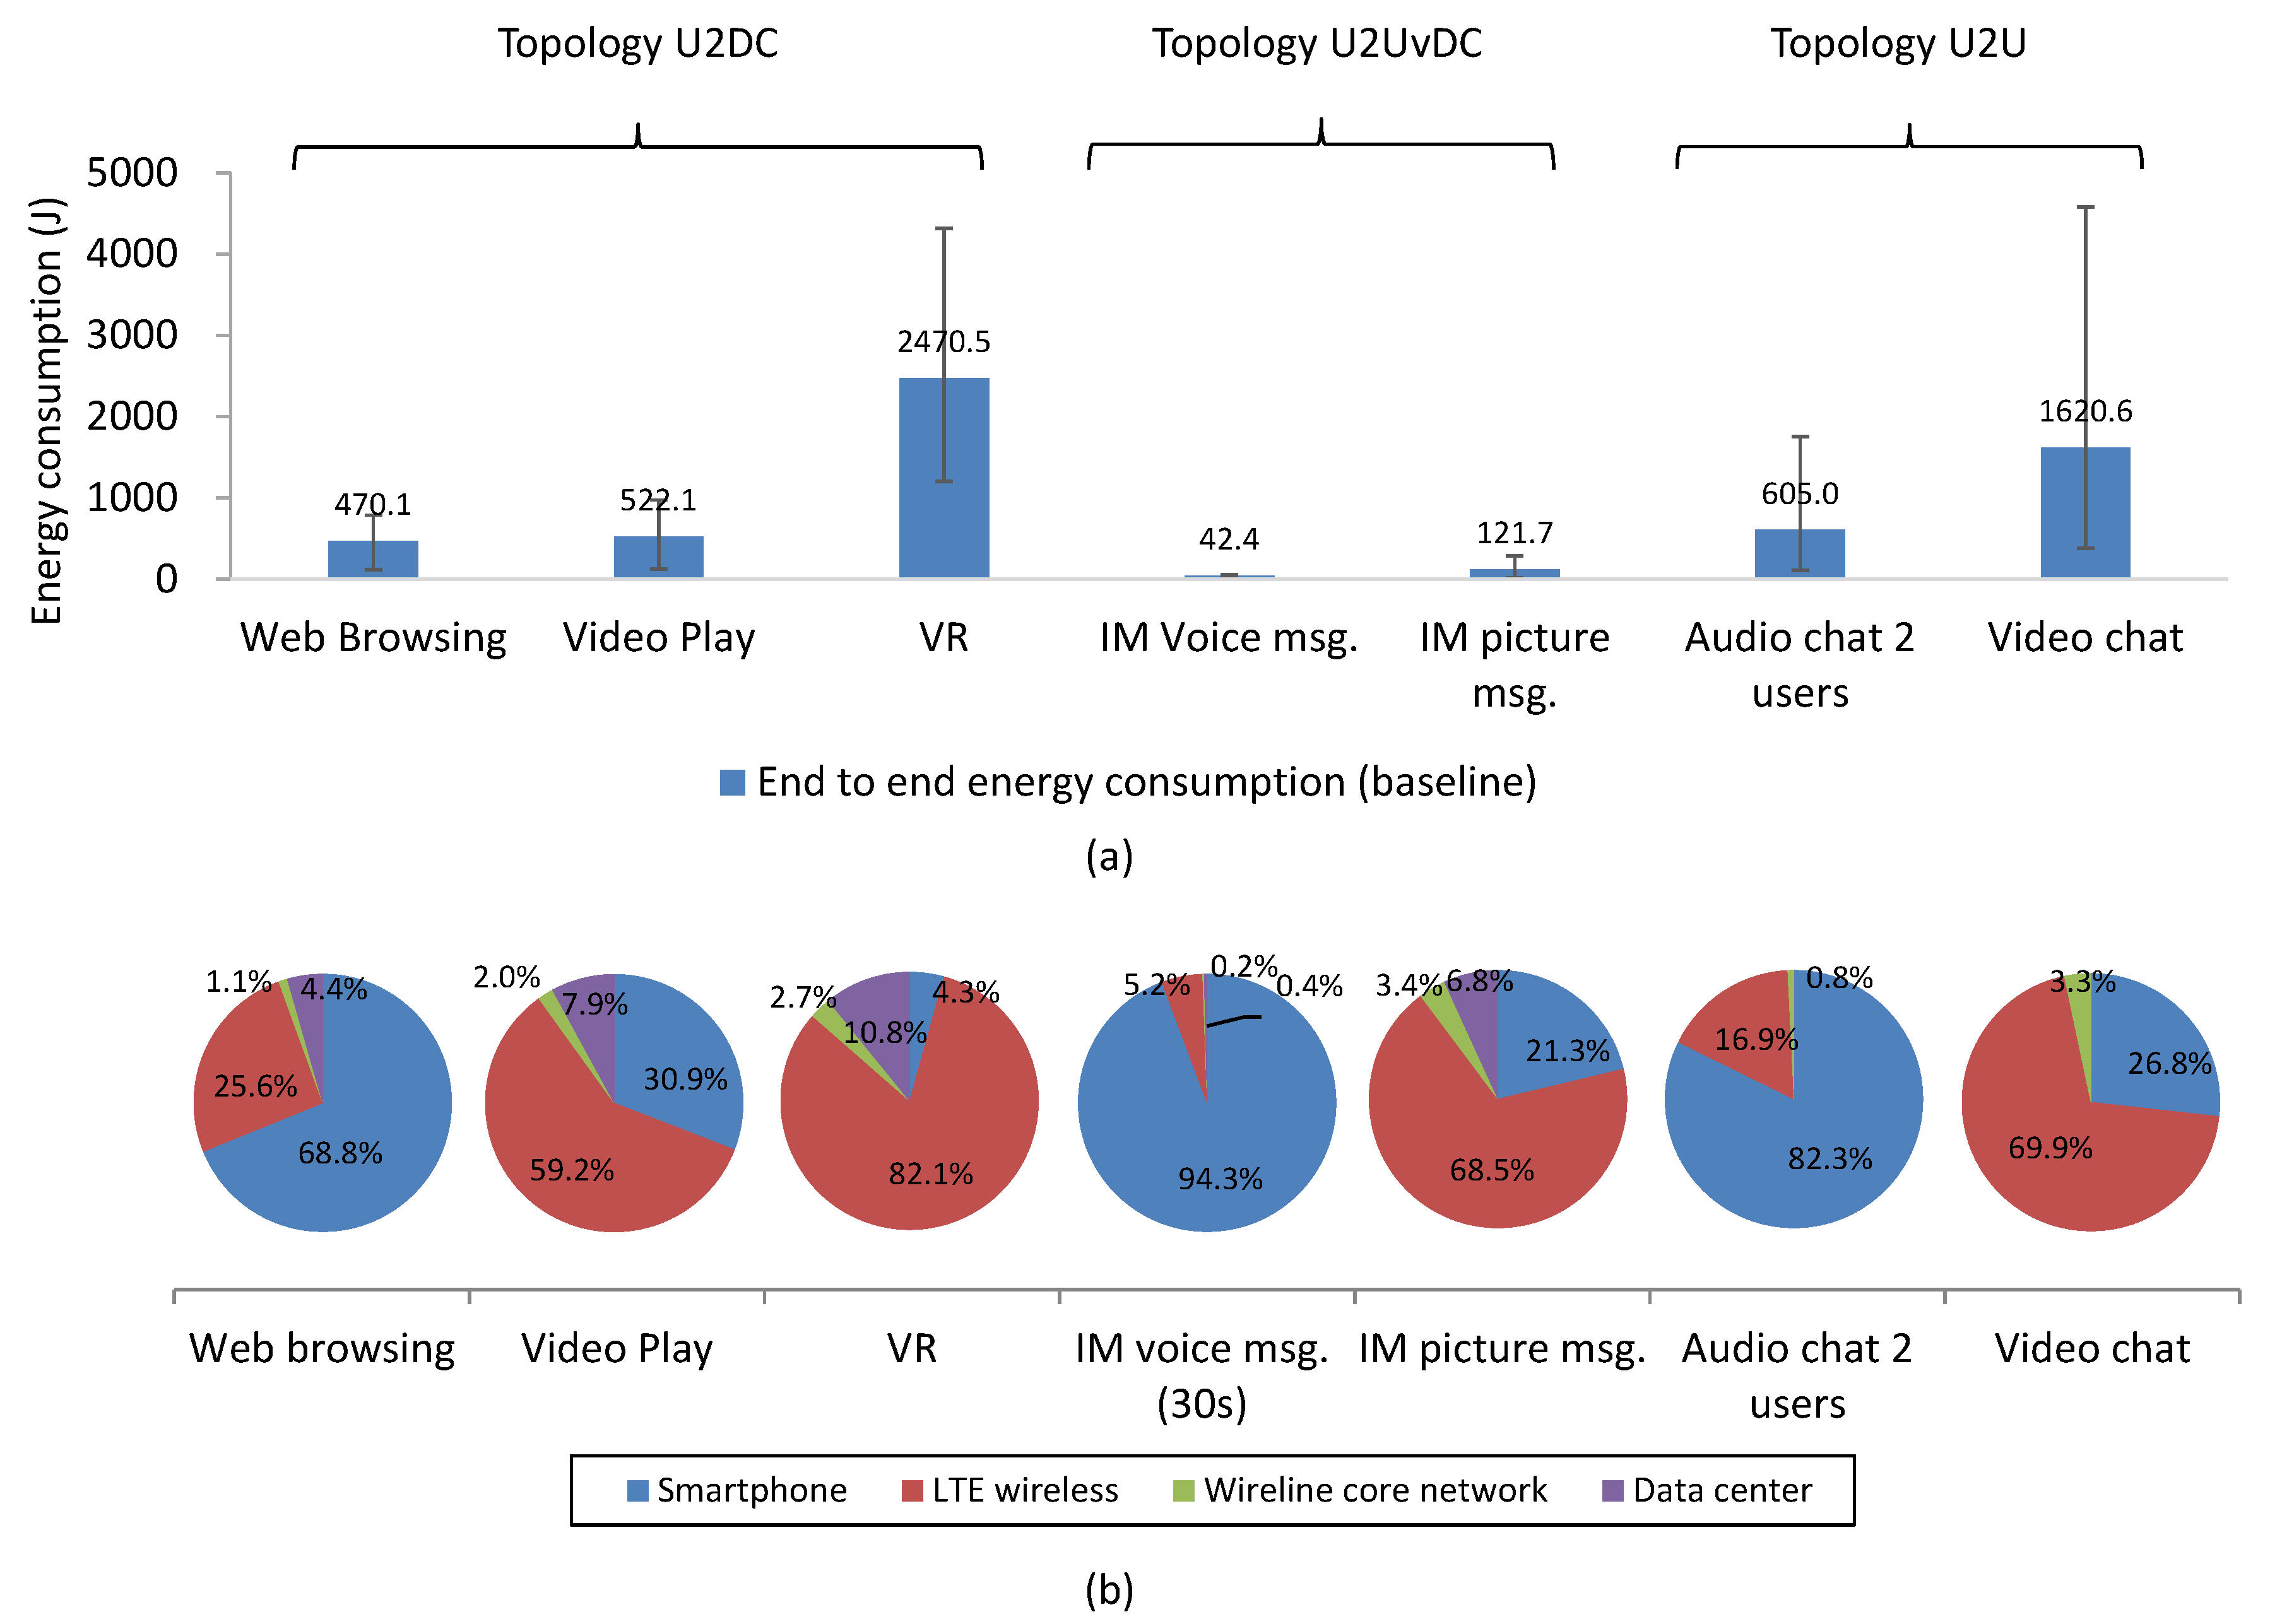
Table 1 presents our key contribution in assessing the total service-specific end-to-end energy consumption by using the methodology shown in Figure 2. It should be noted that different BS cell sites have different power parameters that could affect the BS energy consumption of mobile services. Here, we assume that a macro BS cell site is used in the service energy consumption assessment [12]. Figure 5a shows the baseline end-to-end energy consumption for 7 typical mobile services grouped into 3 different network topologies with different user behaviors. In the baseline, the BS cell site is a macro cell, while the smartphone energy consumption is based on Smartphone A’s measurements.
Furthermore, different users are expected to have heterogenous service usage profiles. Our measurements so far have only considered the typical usage scenarios for evaluating service-specific energy consumption profiles. Here, we expanded the measurements to cover a wide range of usage scenarios for selected services and applications via sensitivity analysis:
- Web browsing: we accessed the website sina.cn with time ranges from 60 s to 500 s to keep refreshing page content.
- Youku video: we viewed different videos with sizes ranging from 7.9 MBytes to 26 MBytes.
- VR: we accessed different videos with sizes ranging from 50 MBytes to 177 MBytes.
- IM voice message: we sent and received voice messages ranging from 10 s to 60 s.
- Audio chat: we tested voice calls from 60 s to 1200 s.
- Video chat: we tested video chats from 60 s to 1200 s.
The service-specific end-to-end energy consumption ranges (minimum to the maximum) are shown in Figure 5a. For example, the end-to-end energy consumption for video chats ranges from 366 Joules to 4580 Joules when the connection duration increases from 1 min to 20 min, with an average value around 1620 Joules.
- (1)
- Topology U2DC: Under this topology, covering web browsing, video play and VR, data are transferred between the smartphone and the cloud server. Therefore, the end-to-end energy consumption of such a service consists of the energy consumed by the smartphone (i.e., 4G and CPU), the 4G LTE access network, the wireline core network, and the data center. Figure 5a shows that the average end-to-end energy consumption of Topology U2DC services could vary significantly from 470.1 Joules (web browsing) to 2470.5 Joules (VR) in the baseline. From the average energy consumption breakdown shown in Figure 5b, we observe that for high energy consumption services (i.e., VR) the LTE wireless network tends to dominate, while for services with low energy consumption services (i.e., web browsing) the smartphone dominates.
- (2)
- Topology U2UvDC: This topology includes IM voice and picture messaging services. Their commonality is that data is transmitted to the cloud server before being forwarded to the intended recipient’s smartphone. Therefore, the end-to-end energy consumption consists of (1) the energy consumed by sending the message from the sender to the cloud server and (2) the transmission of the message from the cloud server to the receiver. Figure 5a shows that voice messages are typically short, resulting in a relatively low service-specific end-to-end energy consumption compared to picture messages. For IM picture messages, because the size of an image can be large (ranging from 0.2 MB to 8 MB for the images used in our tests), the energy consumed in the 4G LTE access network can be higher than in the other network segments. In addition, sending and receiving small messages triggers frequent network reconnections, which generate a large amount of signaling traffic [11]. Therefore, the 4G connection requires more than 90% of the smartphone’s energy use for IM text and voice messages.
- (3)
- Topology U2U: This topology includes voice, audio chat and video chat services. Their commonality is that the users are connected directly by the P2P-like protocol so that the data is transferred directly between smartphones. The end-to-end service energy consumption increases as the usage increases. The total service-specific end-to-end energy consumption consists of the energy consumed by smartphones and the corresponding LTE wireless network and the wireline core network. As depicted in Figure 5, the average end-to-end energy consumption of video chat is around 1620 Joules, with the LTE network accounting for more than 69% of the total service energy consumption, followed by the energy consumed by the smartphones (26.8%). For audio chat services, the average end-to-end energy consumption is around 605 Joules with the smartphone accounting for more than 82% of the total service energy consumption. This is due to the audio chat generating less data traffic than video chat with the same connection duration.
6. Opportunities for Reducing the Energy Consumption of Mobile Services
In this section, we analyze the root cause of the energy consumption in each segment and then suggest strategies to reduce the total network energy consumption of mobile applications.
6.1. Offloading Heavy Mobile Services from Macro Cells to Smaller Cells
To establish the proportions of energy consumptions for different segments of the network, we calculated the energy consumption proportion of each network segment using the four sub-models introduced in Section 3 and the measurements in Table 1. The calculation results are shown in Figure 5b. Figure 5b shows that the smartphone and LTE wireless network are responsible for the majority of energy consumed by all typical mobile services. The high energy consumption of a smartphone is mainly due to the power consumption of the 4G module in the device during the active stage for the entire network connection from RRC connection establishment to data transmission and RRC connection release. Furthermore, the transmission power of a smartphone is related to the distance between itself and its serving BS. When a smartphone is close to the serving BS, it can reduce its transmission power to decrease energy consumption. Related researches show that the energy consumption of a 4G smartphone module can be potentially reduced by approximately 30 to 50% when offloading from a macro to a small cell (e.g., pico and femto) [35,36]. Furthermore, the authors of [37] propose a multi-objective optimization framework to maximize the energy efficiency of small cell offloading while guaranteeing the quality of service under various network traffic loads.
In contrast, the 4G LTE data energy consumption is significant for those services that generate a large amount of data traffic, especially for video applications such as video play, VR video and video chat. Figure 5 shows that the energy consumed by the wireless access network represents 59% to 82% of the total end-to-end energy for various video applications. For these applications one of the most effective ways to reduce the energy consumption of the 4G access network is to offload the heavy data services from macro to small cells, in spite of the fact that femto-cell offloading might cause network signaling overhead due to heterogeneous user mobility [38,39].
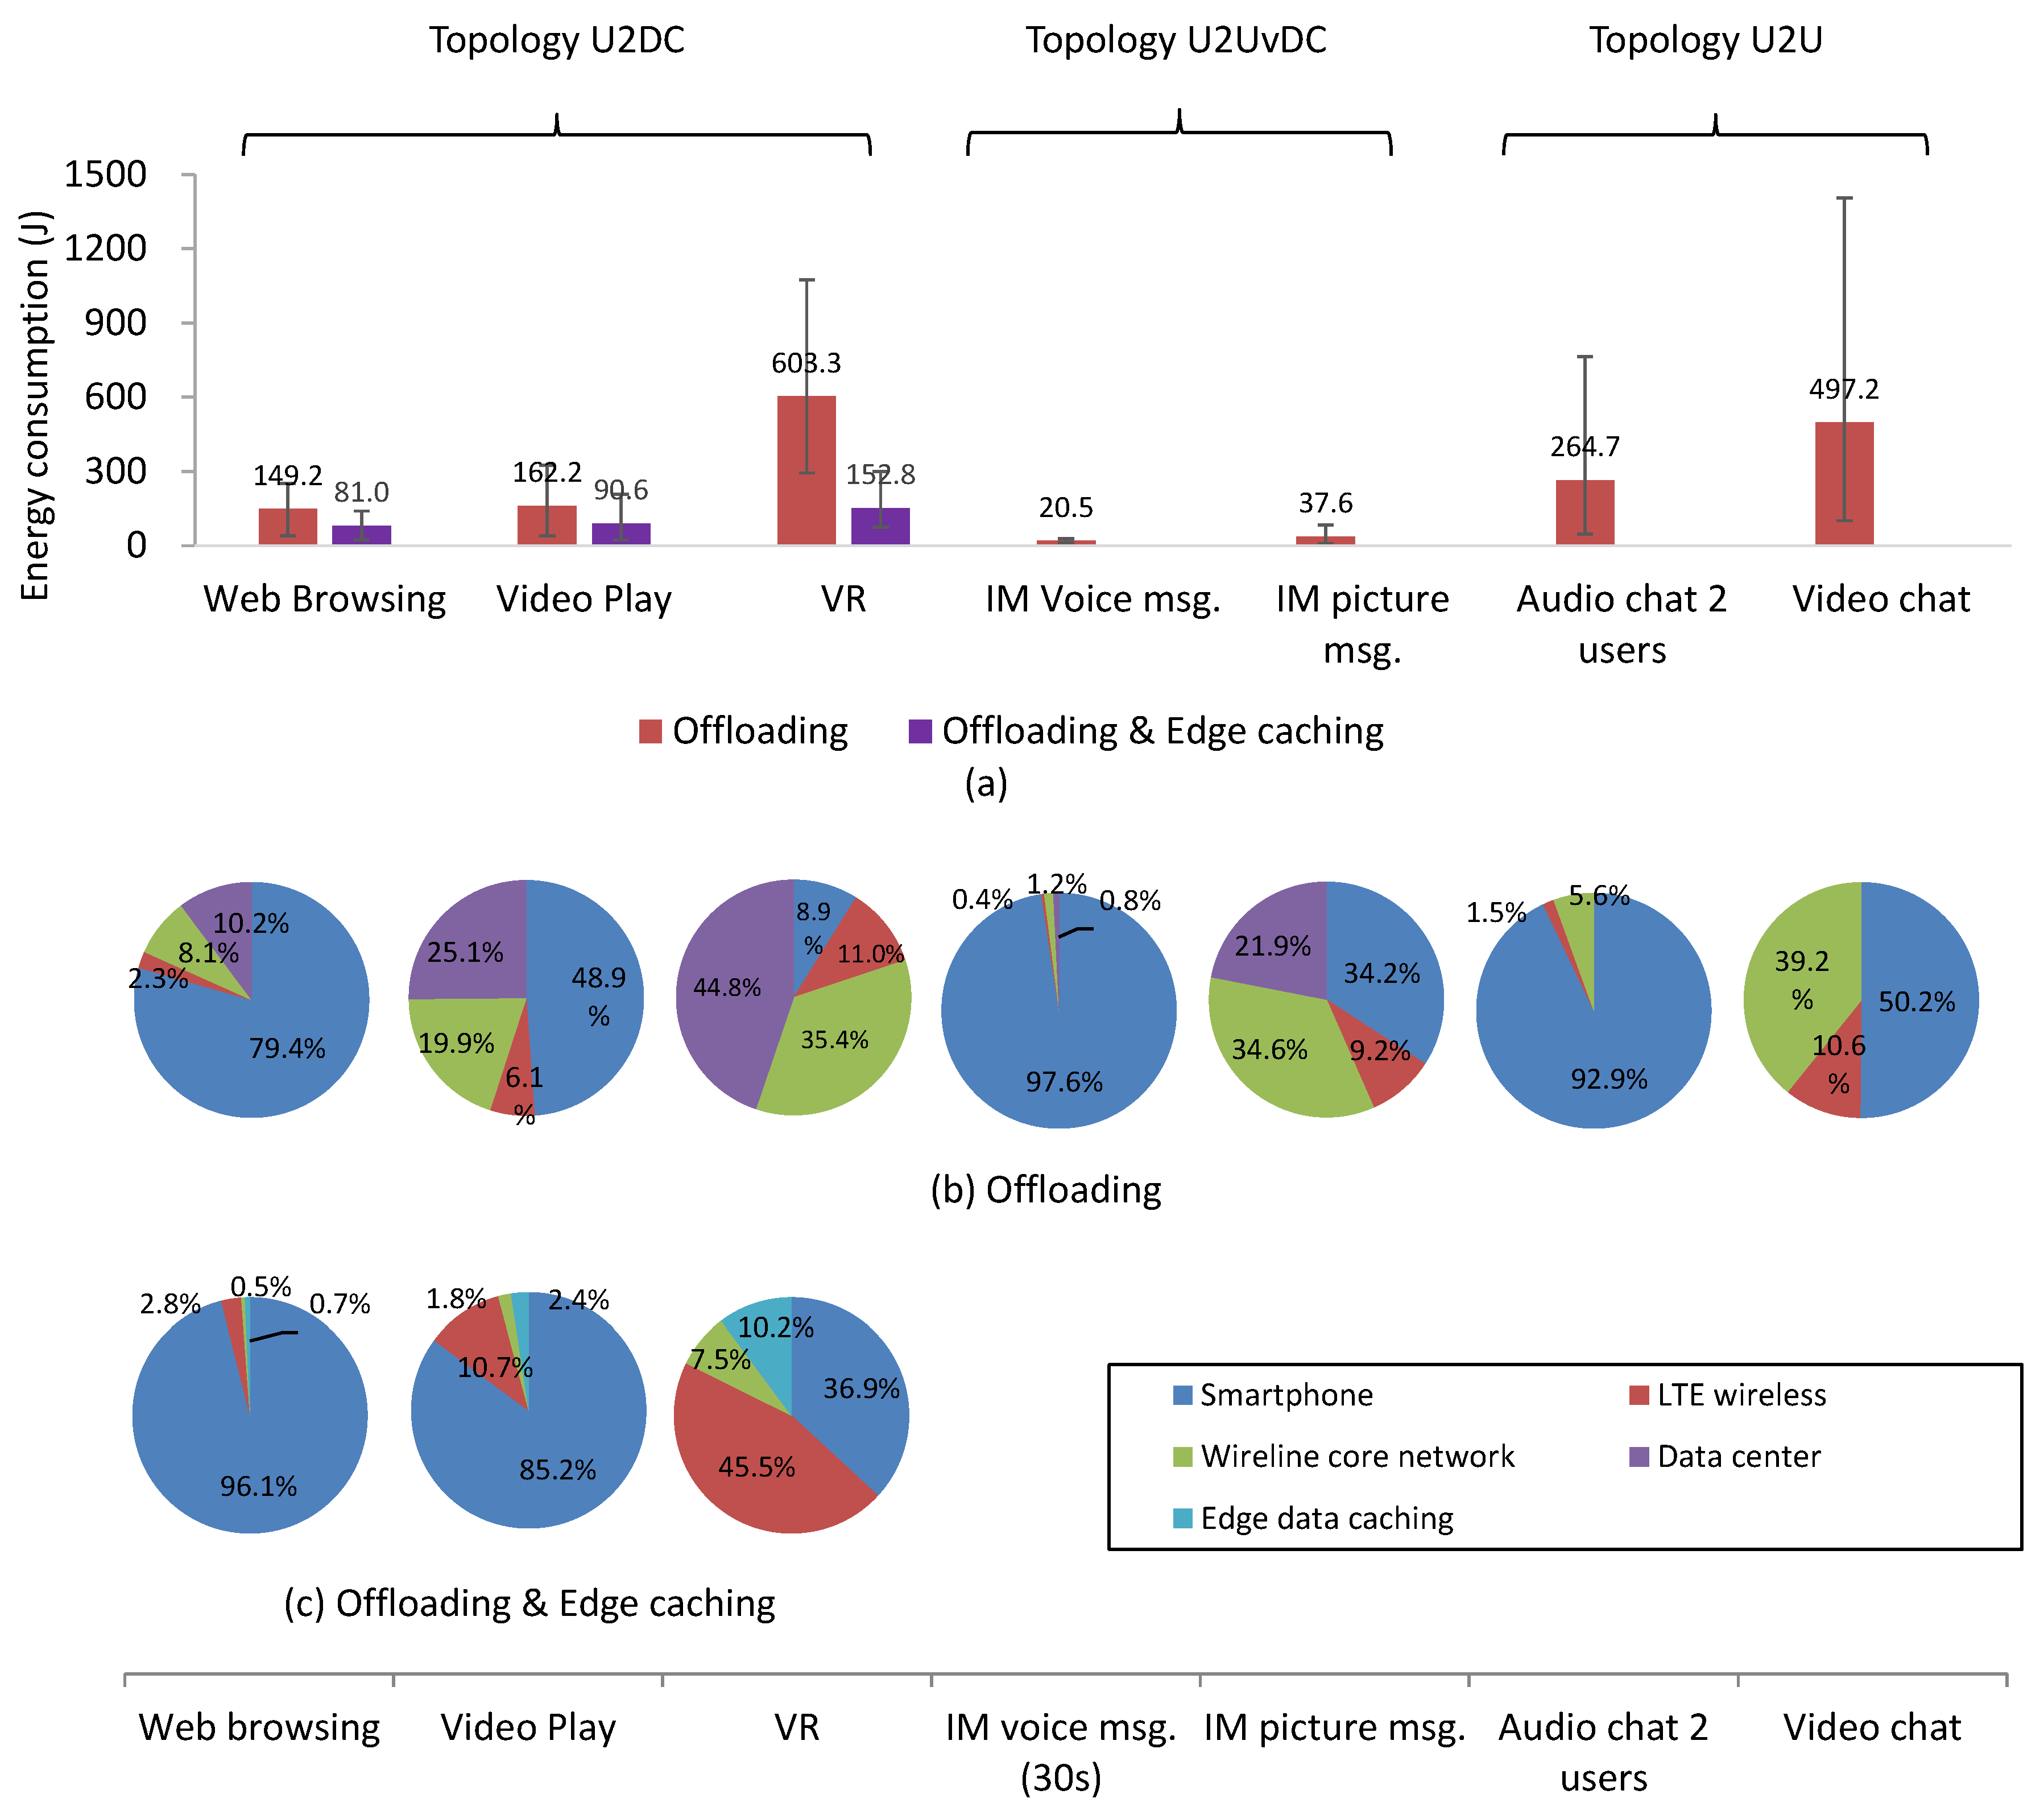
We have evaluated the service-specific end-to-end energy consumption using our energy models to quantify the energy savings by offloading mobile services from a macro to a femto cell. The error bars in Figure 6a show the minimum and maximum values from usage behavior. Figure 6a shows that the service-specific end-to-end energy consumption could potentially be reduced by 30% to 73% compared to the baseline (i.e., service energy consumption using macro cells). In addition, the proportions of the LTE wireless network energy consumption for all mobile services decrease when comparing Figure 6b with Figure 5b. Offloading is particularly effective for heavy data services. For example, for the VR application the average total energy consumption decreases from 2470.5 to 603.3 Joules and the proportion of LTE wireless network energy consumption decreases from 82.1% to 11%.
Challenges: Although our results show that the end-to-end energy consumption of mobile services could be significantly reduced by using small cell offloading, the deployment of a large number of small cells could potentially increase both the capital expenditure and operational expenditure of mobile operators. Furthermore, the energy consumed by a large number of small cells could also increase the total network energy consumption. Therefore, the deployment of small cells should consider the dynamic traffic demand patterns of mobile users. In this context, big data analytics could be used to analyze the dynamic traffic patterns of different parts of the mobile access networks to determine the ideal spots for small cell deployment. Furthermore, by understanding the user behavior and the diurnal cycle of network conditions, small cells could be switched off during low peak hours to save energy.
6.2. Multi-Access Edge Computing and Caching
Interestingly, Figure 6b shows that once heavy data services (particularly for topology U2DC services) are offloaded from macro to small cells the energy consumption proportions of the wireline core network and data center increase substantially to 35.4% and 44.8% of the total energy consumption, respectively. Therefore, how to reduce the service energy consumption of these network segments becomes an important question.
One possible solution is to use multi-access edge computing and caching (MEC). This emerging technology aims to deploy a large number of distributed caches at the edge of the mobile network in close proximity to users to reduce the service latency and mobile backhaul load [40,41]. By using MEC, the necessity of transmitting data from the cloud through the wireline core network can potentially be eliminated by deploying energy-efficient edge caching devices at the LTE mobile edge. Mobile edge caching is mainly effective for Topology U2DC services because these services need to access the content stored in the data server. Based on the energy modeling for a cloud data center, we model the MEC’s energy consumption as a function of the power consumption of edge caching equipment, cache size, content refresh frequency, and the number of users sharing the cache. We assume that power-efficient high-speed solid-state storage is used for edge caching, with power consumption ωca of 6.25 × 10⁻¹² watt/bit [42]. The average caching duration, the data throughput of the service and the average number of users who share the content for the duration of caching are multiplied to obtain the MEC’s energy consumption of a mobile service. Here, we assume that the average caching duration is one day and the average number of users is 30 [43]. We have evaluated the end-to-end energy consumption of Topology U2DC services to quantify the energy savings by using the MEC network architecture.
Figure 6a shows the total energy consumption of Topology U2DC services using femto cells and edge caching. It should be highlighted that the edge caching technology is not suitable for topologies U2UvDC and U2U because the transmission links will not be shortened in these network topologies despite the introduction of small cells and edge caching techniques. Therefore, only the energy consumption of services using Topology U2DC are presented in Figure 6 when using femto cells and edge caching. The bar chart shows that the total service-specific end-to-end energy consumption can be further decreased. The error bars show the values from the minimum and maximum usage behavior. For example, the total energy consumption of the VR application decreases by approximately 94% from 2470.5 to 152.8 Joules by using both MEC and femto cells. Furthermore, Figure 6c shows that the energy consumption proportions of the wireline core network become negligible and the energy consumption proportion of the data source has decreased significantly by replacing the cloud data center with edge caching.
Challenges: The deployment of a large number of distributed MEC servers at the edge of the mobile access networks could potentially increase the overall network energy consumption. Similar to the deployment challenges of small cells, mobile operators could make use of big data analytics in determining the ideal locations for the deployment of MEC servers. However, managing a large number of MEC servers could be challenging for mobile operators since it involves the management of caching and computing resources. Therefore, mobile operators require predictive analytics to understand and forecast local user behaviors and the usage patterns of local applications so that resource orchestration in MEC networks could be optimized in real-time.
7. Conclusions
The ongoing increase in the energy consumption of all network segments of mobile applications and services has become a major concern for all stakeholders, including the smartphone manufacturers, mobile application developers, mobile operators, cloud providers and consumers. However, without a better understanding of service- and application-specific end-to-end energy consumption, effective energy-efficient techniques cannot be developed, because different services exhibit different total energy consumption and have different proportions of energy consumption for each network segment. Therefore, we have developed a service-specific end-to-end energy consumption model to assess the total energy consumption based on 3 different network topologies. We developed test cases for 15 services from 7 mobile applications to assess the service-specific end-to-end total energy consumption. We also conducted sensitivity analysis by assessing the service energy consumption for different user behaviors. For current network topologies, we found that the smartphone and the LTE wireless network are responsible for most of the total service energy consumption. By understanding the root causes of service-specific energy consumption in each network segment, we were able to evaluate two potential energy-efficient solutions for future network topologies: (i) offloading mobile services from macro to smaller cells; and (ii) mobile edge caching. Our results show that these two solutions combined could potentially reduce the service energy consumption by up to 81% and 83% for video play and VR, respectively. Finally, we presented some future challenges and research work for effective deployment and management of small cells and MEC networks.
Author Contributions
M.Y., C.A.C. and A.F.G. conceived of and designed the proposed scheme. M.Y., C.A.C. and A.F.G. conceived, designed and performed the experiments. M.Y., C.A.C., J.Y. and L.C. analyzed the data. A.N. and C.L. supervised the whole project. M.Y. and C.A.C. wrote the manuscript. A.F.G., L.C., A.N. and C.L. reviewed the manuscript. All authors read and approved the final manuscript.
Funding
This research was funded in part by the Fundamental Research Funds for the Central Universities of China, grant number 3132018XNG1816 and 2018CUCTJ078.
Acknowledgments
The authors would like to thank the staff of the School of Communication and Information Engineering, Faculty of Science and Technology, Communication University of China (CUC), for their support during this study.
Conflicts of Interest
The authors declare no conflict of interest.
References
- Device Specifications, Comparison between: Apple iPhone 6, Apple iPhone X, oppoA57, LGG2. Available online: https://www.devicespecifications.com/en/comparison/cf30dbb58 (accessed on 22 November 2018).
- China Mobile Limited Annual Report 2016. Available online: http://www.chinamobileltd.com/en/ir/reports/ar2016.pdf (accessed on 22 November 2018).
- Akamai Technologies Inc. CDP 2017 Climate Change 2017 Information Request. Available online: https://www.akamai.com/us/en/multimedia/documents/sustainability/akamai-2016-cdp-programme-response.pdf (accessed on 22 November 2018).
- Bastug, E.; Bennis, M.; Médard, M.; Debbah, M. Toward interconnected virtual reality: Opportunities, challenges, and enablers. IEEE Commun. Mag. 2017, 55, 110–117. [Google Scholar] [CrossRef]
- Erol-Kantarci, M.; Sukhmani, S. Caching and Computing at the Edge for Mobile Augmented Reality and Virtual Reality (AR/VR) in 5G. In Ad Hoc Networks; Springer: Cham, Switzerland, 2018; pp. 169–177. [Google Scholar]
- Misra, R.; Gudipati, A.; Katti, S. Scaling mobile network capacity aggressively with QuickC. GetMob. Mob. Comput. Commun. 2017, 21, 30–34. [Google Scholar] [CrossRef]
- Ahmad, R.W.; Gani, A.; Hamid, S.H.A.; Shojafar, M.; Ahmed, A.I.A.; Madani, S.A.; Saleem, K.; Rodrigues, J.J. A survey on energy estimation and power modeling schemes for smartphone applications. Int. J. Commun. Syst. 2017, 30, e3234. [Google Scholar] [CrossRef]
- Thiagarajan, N.; Aggarwal, G.; Nicoara, A.; Boneh, D.; Singh, J.P. Who killed my battery: Analyzing mobile browser energy consumption? In Proceedings of the 21st International Conference on World Wide Web, Lyon, France, 16–20 April 2012.
- Schwartz, C.; Lehrieder, F.; Wamser, F.; Hoßfeld, T.; Tran-Gia, P. Smart-phone energy consumption vs 3G signaling load: The influence of application traffic patterns. In Proceedings of the 24th Tyrrhenian International Workshop on Digital Communications-Green ICT (TIWDC), Genoa, Italy, 23–25 September 2013. [Google Scholar]
- Cui, Y.; Xiao, S.; Wang, X.; Lai, Z.; Yang, Z.; Li, M.; Wang, H. Performance-aware energy optimization on mobile devices in cellular network. IEEE Trans. Mob. Comput. 2017, 16, 1073–1089. [Google Scholar] [CrossRef]
- Chan, C.A.; Li, W.; Bian, S.; Chih-Lin, I.; Gygax, A.F.; Leckie, C.; Yan, M.; Hinton, K. Assessing network energy consumption of mobile applications. IEEE Commun. Mag. 2015, 53, 182–191. [Google Scholar] [CrossRef]
- Yan, M.; Chan, C.A.; Li, W.; Chih-Lin, I.; Bian, S.; Gygax, A.F.; Leckie, C.; Hinton, K.; Wong, E.; Nirmalathas, A. Network energy consumption assessment of conventional mobile services and over-the-top instant messaging applications. IEEE J. Sel. Areas Commun. 2016, 34, 3168–3180. [Google Scholar] [CrossRef]
- Arnold, O.; Richter, F.; Fettweis, G.; Blume, O. Power consumption modeling of different base station types in heterogeneous cellular networks. In Proceedings of the Future Network and Mobile Summit, Florence, Italy, 16–18 June 2010. [Google Scholar]
- Gupta, M.; Jha, S.C.; Koc, A.T.; Vannithamby, R. Energy impact of emerging mobile Internet applications on LTE networks: Issues and solutions. IEEE Commun. Mag. 2013, 51, 90–97. [Google Scholar] [CrossRef]
- Vallero, G.; Deruyck, M.; Meo, M.; Joseph, W. Accounting for Energy Cost When Designing Energy-Efficient Wireless Access Networks. Energies 2018, 11, 617. [Google Scholar] [CrossRef]
- Olsson, M.; Tombaz, S.; Gódor, I.; Frenger, P. Energy performance evaluation revisited: Methodology, models and results. In Proceedings of the 2016 IEEE 12th International Conference on Wireless and Mobile Computing, Networking and Communications, New York, NY, USA, 17–19 October 2016; pp. 1–7. [Google Scholar] [CrossRef]
- Auer, G.; Giannini, V.; Desset, C.; Godor, I.; Skillermark, P.; Olsson, M.; Imran, M.A.; Sabella, D.; Gonzalez, M.J.; Blume, O.; et al. How much energy is needed to run a wireless network? IEEE Wirel. Commun. 2011, 18, 40–49. [Google Scholar] [CrossRef] [Green Version]
- Vishwanath, A.; Jalali, F.; Hinton, K.; Alpcan, T.; Ayre, R.W.; Tucker, R.S. Energy consumption comparison of interactive cloud-based and local applications. IEEE J. Sel. Areas Commun. 2015, 33, 616–626. [Google Scholar] [CrossRef]
- Bianco, A.; Mashayekhi, R.; Meo, M. Energy consumption for data distribution in content delivery networks. In Proceedings of the IEEE International Conference on Communications, Kuala Lumpur, Malaysia, 22–27 May 2016. [Google Scholar]
- Vishwanath, A.; Hinton, K.; Ayre, R.W.; Tucker, R.S. Modeling energy consumption in high-capacity routers and switches. IEEE J. Sel. Areas Commun. 2014, 32, 1524–1532. [Google Scholar] [CrossRef]
- Uddin, M.; Rahman, A.A. Energy efficiency and low carbon enabler green IT framework for data centers considering green metrics. Renew. Sustain. Energy Rev. 2012, 16, 4078–4094. [Google Scholar] [CrossRef]
- Baccarelli, E.; Cordeschi, N.; Mei, A.; Panella, M.; Shojafar, M.; Stefa, J. Energy-efficient dynamic traffic offloading and reconfiguration of networked data centers for big data stream mobile computing: Review, challenges, and a case study. IEEE Netw. 2016, 30, 54–61. [Google Scholar] [CrossRef]
- Pelley, S.; Meisner, D.; Wenisch, T.F.; VanGilder, J.W. Understanding and abstracting total data center power. In Proceedings of the Workshop Energy-Efficient Design, Austin, TX, USA, 20 June 2009; pp. 1–6. [Google Scholar]
- Abdelwahab, S.; Hamdaoui, B.; Guizani, M.; Znati, T. Network function virtualization in 5G. IEEE Commun. Mag. 2016, 54, 84–91. [Google Scholar] [CrossRef]
- Datsika, E.; Antonopoulos, A.; Zorba, N.; Verikoukis, C. Software defined network service chaining for OTT service providers in 5G networks. IEEE Commun. Mag. 2017, 55, 124–131. [Google Scholar] [CrossRef]
- Fernández, A.F.F.; Cervelló-Pastor, C.; Ochoa-Aday, L. Energy Efficiency and Network Performance: A Reality Check in SDN-Based 5G Systems. Energies 2017, 10, 2132. [Google Scholar] [CrossRef]
- Chih-Lin, I.; Liu, Y.; Han, S.; Wang, S.; Liu, G. On Big Data Analytics for Greener and Softer RAN. IEEE Access 2015, 3, 3068–3075. [Google Scholar] [CrossRef]
- Tran, T.X.; Hajisami, A.; Pandey, P.; Pompili, D. Collaborative mobile edge computing in 5G networks: New paradigms, scenarios, and challenges. IEEE Commun. Mag. 2017, 55, 54–61. [Google Scholar] [CrossRef]
- Wang, S.; Zhang, X.; Zhang, Y.; Wang, L.; Yang, J.; Wang, W. A survey on mobile edge networks: Convergence of computing, caching and communications. IEEE Access 2017, 5, 6757–6779. [Google Scholar] [CrossRef]
- Gomes, A.S.; Sousa, B.; Palma, D.; Fonseca, V.; Zhao, Z.; Monteiro, E.; Braun, T.; Simoes, P.; Cordeiro, L. Edge caching with mobility prediction in virtualized LTE mobile networks. Future Gener. Comput. Syst. 2017, 70, 148–162. [Google Scholar] [CrossRef]
- Chen, X.; Wu, J.; Cai, Y.; Zhang, H.; Chen, T. Energy-efficiency oriented traffic offloading in wireless networks: A brief survey and a learning approach for heterogeneous cellular networks. IEEE J. Sel. Areas Commun. 2015, 33, 627–640. [Google Scholar] [CrossRef]
- Datsika, E.; Antonopoulos, A.; Yuan, D.; Verikoukis, C. Matching Theory for Over-the-top Service Provision in 5G Networks. IEEE Trans. Wirel. Commun. 2018, 17, 5452–5464. [Google Scholar] [CrossRef]
- Khoda, M.E.; Razzaque, M.A.; Almogren, A.; Hassan, M.M.; Alamri, A.; Alelaiwi, A. Efficient computation offloading decision in mobile cloud computing over 5G network. Mob. Netw. Appl. 2016, 21, 777–792. [Google Scholar] [CrossRef]
- Cisco White Papers, The Zettabyte Era: Trends and Analysis. Available online: https://www.cisco.com/c/en/us/solutions/collateral/service-provider/visual-networking-index-vni/vni-hyperconnectivity-wp.html (accessed on 22 November 2018).
- Zhang, L.; Feng, G.; Nie, W.; Qin, S. A Comparison Study of Coupled and Decoupled Uplink-Downlink Access in Heterogeneous Cellular Networks. In Proceedings of the 2015 IEEE Global Communications Conference, San Diego, CA, USA, 6–10 December 2015. [Google Scholar] [CrossRef]
- Bousia, A.; Kartsakli, E.; Antonopoulos, A.; Alonso, L.; Verikoukis, C. Sharing the small cells for energy efficient networking: How much does it cost? In Proceedings of the 2014 IEEE Global Communications Conference, Austin, TX, USA, 8–12 December 2014; pp. 2649–2654. [Google Scholar]
- Dolfi, M.; Morosi, S.; Cavdar, C.; Re, E.D. Energy efficient optimization of a sleep mode strategy in heterogeneous cellular networks. In Proceedings of the 2017 European Conference on Networks and Communications, Oulu, Finland, 12–15 June 2017; pp. 1–6. [Google Scholar] [CrossRef]
- Cao, D.; Zhou, S.; Niu, Z. Optimal combination of base station densities for energy-efficient two-tier heterogeneous cellular networks. IEEE Trans. Wirel. Commun. 2013, 12, 4350–4362. [Google Scholar] [CrossRef]
- Fu, H.L.; Lin, P.; Lin, Y.B. Reducing signaling overhead for femtocell/macrocell networks. IEEE Trans. Mob. Comput. 2013, 12, 1587–1597. [Google Scholar] [CrossRef]
- Taleb, T.; Samdanis, K.; Mada, B.; Flinck, H.; Dutta, S.; Sabe, D. On multi-access edge computing: A survey of the emerging 5G network edge cloud architecture and orchestration. IEEE Commun. Surv. Tutor. 2017, 19, 1657–1681. [Google Scholar] [CrossRef]
- Liu, D.; Chen, B.; Yang, C.; Molisch, A.F. Caching at the Wireless Edge: Design Aspects, Challenges, and Future Directions. IEEE Commun. Mag. 2016, 54, 22–28. [Google Scholar] [CrossRef]
- Choi, N.; Guan, K.; Kilper, D.C.; Atkinson, G. In-network caching effect on optimal energy consumption in content-centric networking. In Proceedings of the IEEE International Conference on Communications (ICC), Ottawa, ON, Canada, 10–15 June 2012. [Google Scholar]
- Traverso, S.; Ahmed, M.; Garetto, M.; Giaccone, P.; Leonardi, E.; Niccolini, S. Unravelling the impact of temporal and geographical locality in content caching systems. IEEE Trans. Multimed. 2015, 17, 1839–1854. [Google Scholar] [CrossRef]
Figure 1.
Three service and application-specific end-to-end topologies: (a) communications between the user and the data center via 4G LTE access and wireline core networks; (b) communications between two users via the data center; (c) direct communications between two users via the 4G LTE access and the wireline core networks.

Figure 2.
Service-specific end-to-end energy assessment methodology.

Figure 3.
Smartphone’s 4G power consumption and signaling duration for 15 different types of mobile services. Note that the services are sorted by 4G signaling duration and average measurements for 2 types of smartphones are plotted to demonstrate the consistency of the measurements.
Figure 3.
Smartphone’s 4G power consumption and signaling duration for 15 different types of mobile services. Note that the services are sorted by 4G signaling duration and average measurements for 2 types of smartphones are plotted to demonstrate the consistency of the measurements.

Figure 4.
Smartphone’s CPU power and energy consumption for 15 different types of mobile services. Note that the services are sorted by CPU energy consumption and average measurements for two types of smartphones are plotted to demonstrate the consistency of the measurements.
Figure 4.
Smartphone’s CPU power and energy consumption for 15 different types of mobile services. Note that the services are sorted by CPU energy consumption and average measurements for two types of smartphones are plotted to demonstrate the consistency of the measurements.

Figure 5.
Baseline end-to-end energy consumption of typical mobile services. Note that a macro BS is used in the baseline energy consumption assessments. (a) End-to-end energy consumption under different user behaviors; (b) average energy breakdown of baseline. The error bars show the minimum and maximum usages of the services.

Figure 6.
End-to-end energy consumption of typical mobile services under different test scenarios: (1) using offloading from macro cell to femto cell; and (2) using both small cell offloading and mobile edge caching. (a) End-to-end energy consumption under different user behaviors; (b) average energy breakdown when offloading; (c) average energy breakdown when offloading & edge caching. The error bars show the minimum and maximum usages of the services.


Table 1.
Test results for the 15 mobile services under investigation.
| No. | Services | Test Information | Average 4G UL Traffic (kBytes) | Average 4G DL Traffic (kBytes) | Average 4G Energy Consumption (J) | Average CPU Energy Consumption (J) | Average Signaling Duration (s) | Network Topology |
|---|---|---|---|---|---|---|---|---|
| 1 | Web browsing | Built-in browser, open m.sohu.com | 358.4 | 593.92 | 37.02 | 9.4 | 70 | U2DC |
| 2 | Navigation | Baidu Map, Place search and route planning | 184.32 | 440.32 | 34.2 | 15.75 | 55 | |
| 3 | Cloud upload | Baidu Cloud, upload a picture (size = 2.5 MB) | 2580.48 | 92.16 | 28.72 | 2.46 | 41 | |
| 4 | Cloud download | Baidu Cloud, download a picture (size = 2.5 MB) | 102.4 | 2641.92 | 32.86 | 1.98 | 50 | |
| 5 | Video play | Youku, open a video online (length = 60 s, size = 5 MB) | 194.56 | 5089.28 | 51.4 | 13.8 | 91 | |
| 6 | AR | Let’s go, display the store info in the screen | 20.48 | 163.84 | 25.93 | 7.88 | 43 | |
| 7 | VR video | Orange VR, open a video (length = 65 s, size = 58 MB) | 389.12 | 61440 | 61.5 | 47.1 | 113 | |
| 8 | Send text message | Wechat, type & send a 16-Chinese character text message | 0.57 | 0.51 | 10.63 | 0.56 | 35 | U2UvDC |
| 9 | Receive text message | Wechat, receive a 16-Chinese character text message | 0.41 | 0.47 | 7.09 | 0.27 | 15 | |
| 10 | Send voice message | Wechat, send a voice message (length = 10 s) | 18.37 | 2.63 | 13.89 | 1.08 | 27 | |
| 11 | Receive voice message | Wechat, receive a voice message (length = 10 s) | 3 | 26 | 11.37 | 0.52 | 23 | |
| 12 | Send picture message | Wechat, send a picture (size = 2.67 MB) | 2810 | 132 | 13.24 | 6.82 | 26 | |
| 13 | Receive picture message | Wechat, receive a picture (size = 2.67 MB) | 43 | 2793 | 9.67 | 1.21 | 21 | |
| 14 | Audio chat | Wechat, audio chat 60 s | 358.4 | 307.2 | 44 | 6.6 | 80 | U2U |
| 15 | Video chat | Wechat, video chat 60 s | 4321.28 | 5514.24 | 52.075 | 18.825 | 97 |
© 2019 by the authors. Licensee MDPI, Basel, Switzerland. This article is an open access article distributed under the terms and conditions of the Creative Commons Attribution (CC BY) license (http://creativecommons.org/licenses/by/4.0/).
Share and Cite
MDPI and ACS Style
Yan, M.; Chan, C.A.; Gygax, A.F.; Yan, J.; Campbell, L.; Nirmalathas, A.; Leckie, C. Modeling the Total Energy Consumption of Mobile Network Services and Applications. Energies 2019, 12, 184. https://doi.org/10.3390/en12010184
AMA Style
Yan M, Chan CA, Gygax AF, Yan J, Campbell L, Nirmalathas A, Leckie C. Modeling the Total Energy Consumption of Mobile Network Services and Applications. Energies. 2019; 12(1):184. https://doi.org/10.3390/en12010184
Chicago/Turabian StyleYan, Ming, Chien Aun Chan, André F. Gygax, Jinyao Yan, Leith Campbell, Ampalavanapillai Nirmalathas, and Christopher Leckie. 2019. "Modeling the Total Energy Consumption of Mobile Network Services and Applications" Energies 12, no. 1: 184. https://doi.org/10.3390/en12010184
Note that from the first issue of 2016, this journal uses article numbers instead of page numbers. See further details here.