High Impedance Fault Detection in Medium Voltage Distribution Network Using Discrete Wavelet Transform and Adaptive Neuro-Fuzzy Inference System


 ,
,
Abstract
:1. Introduction
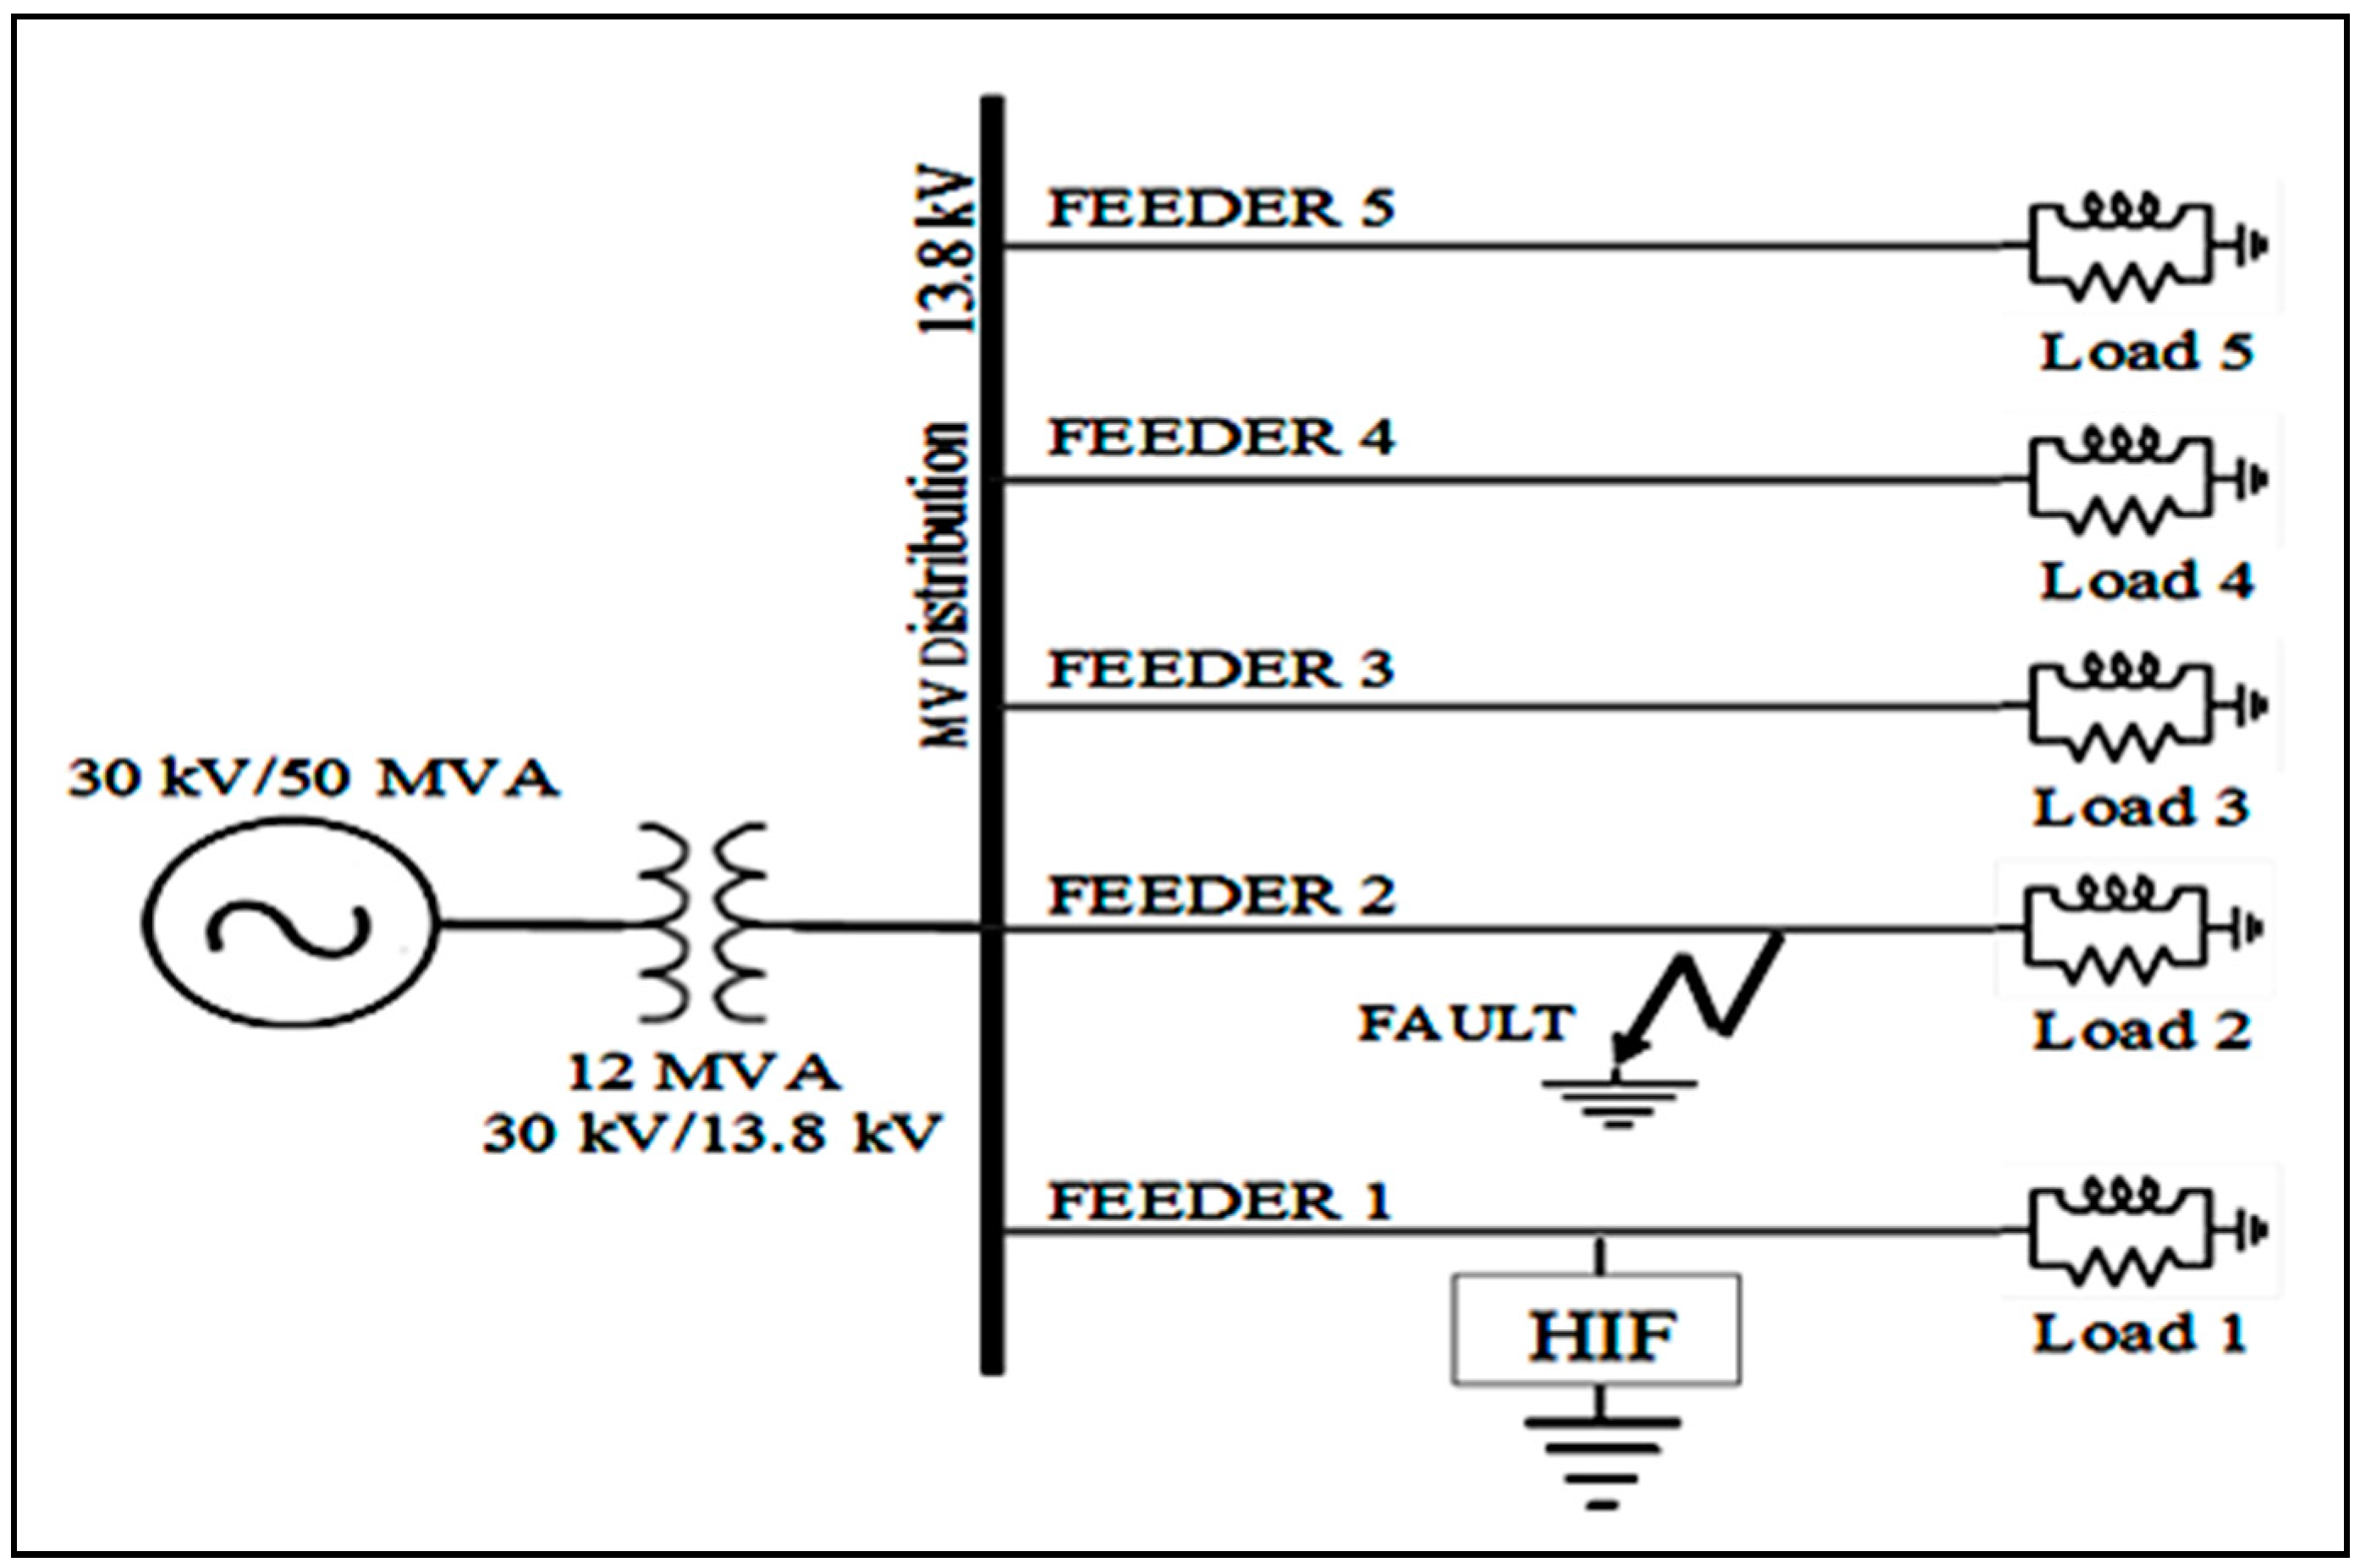
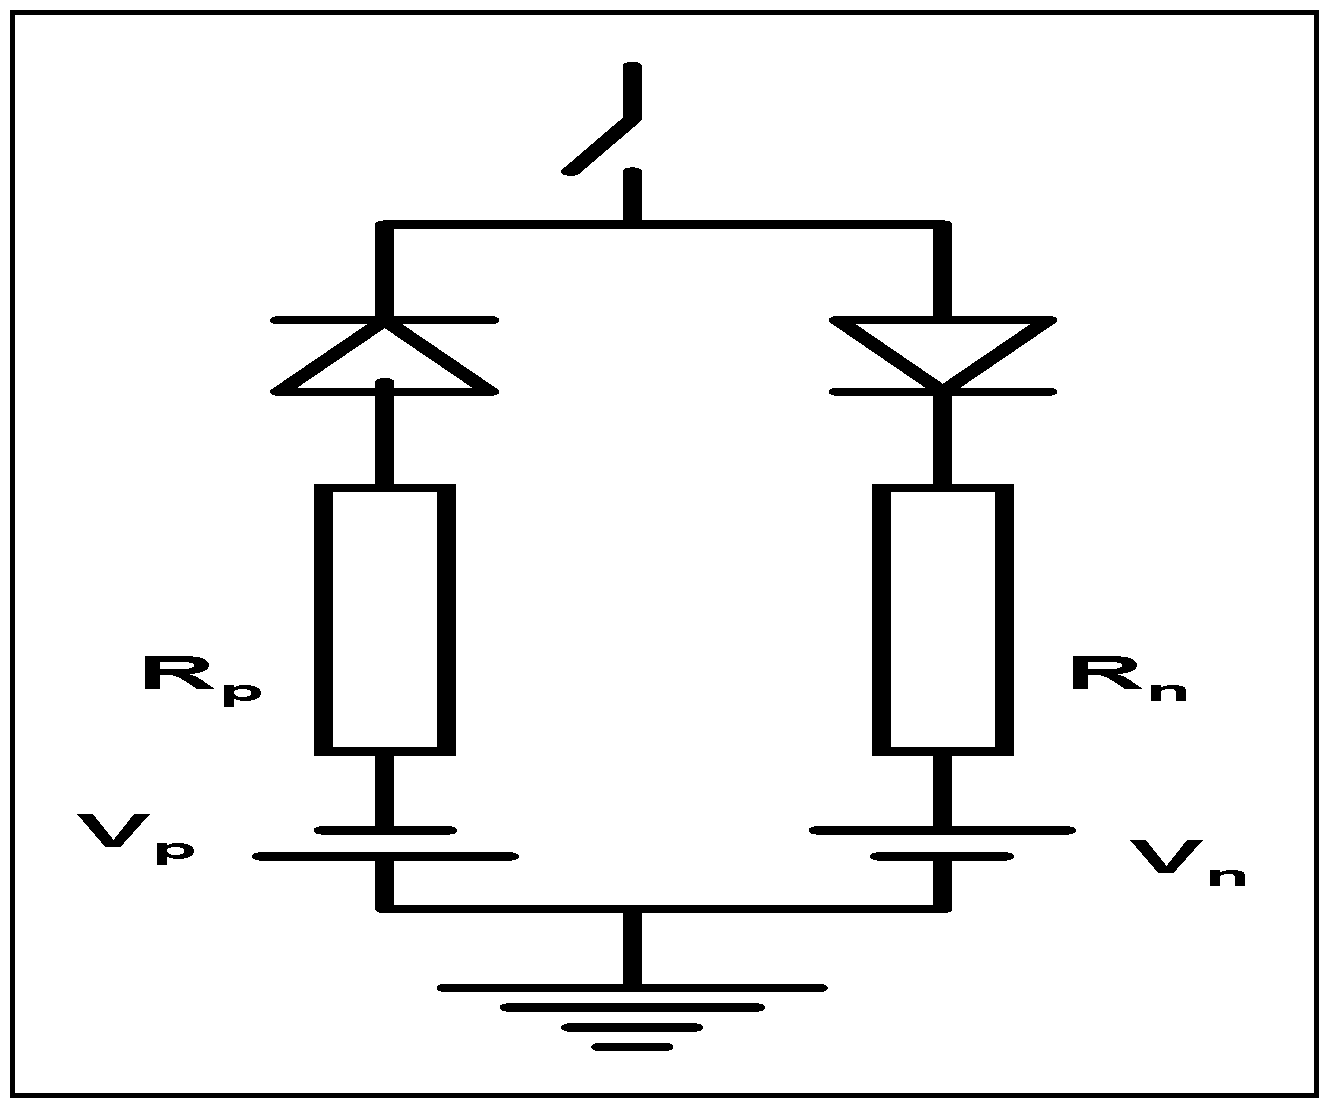
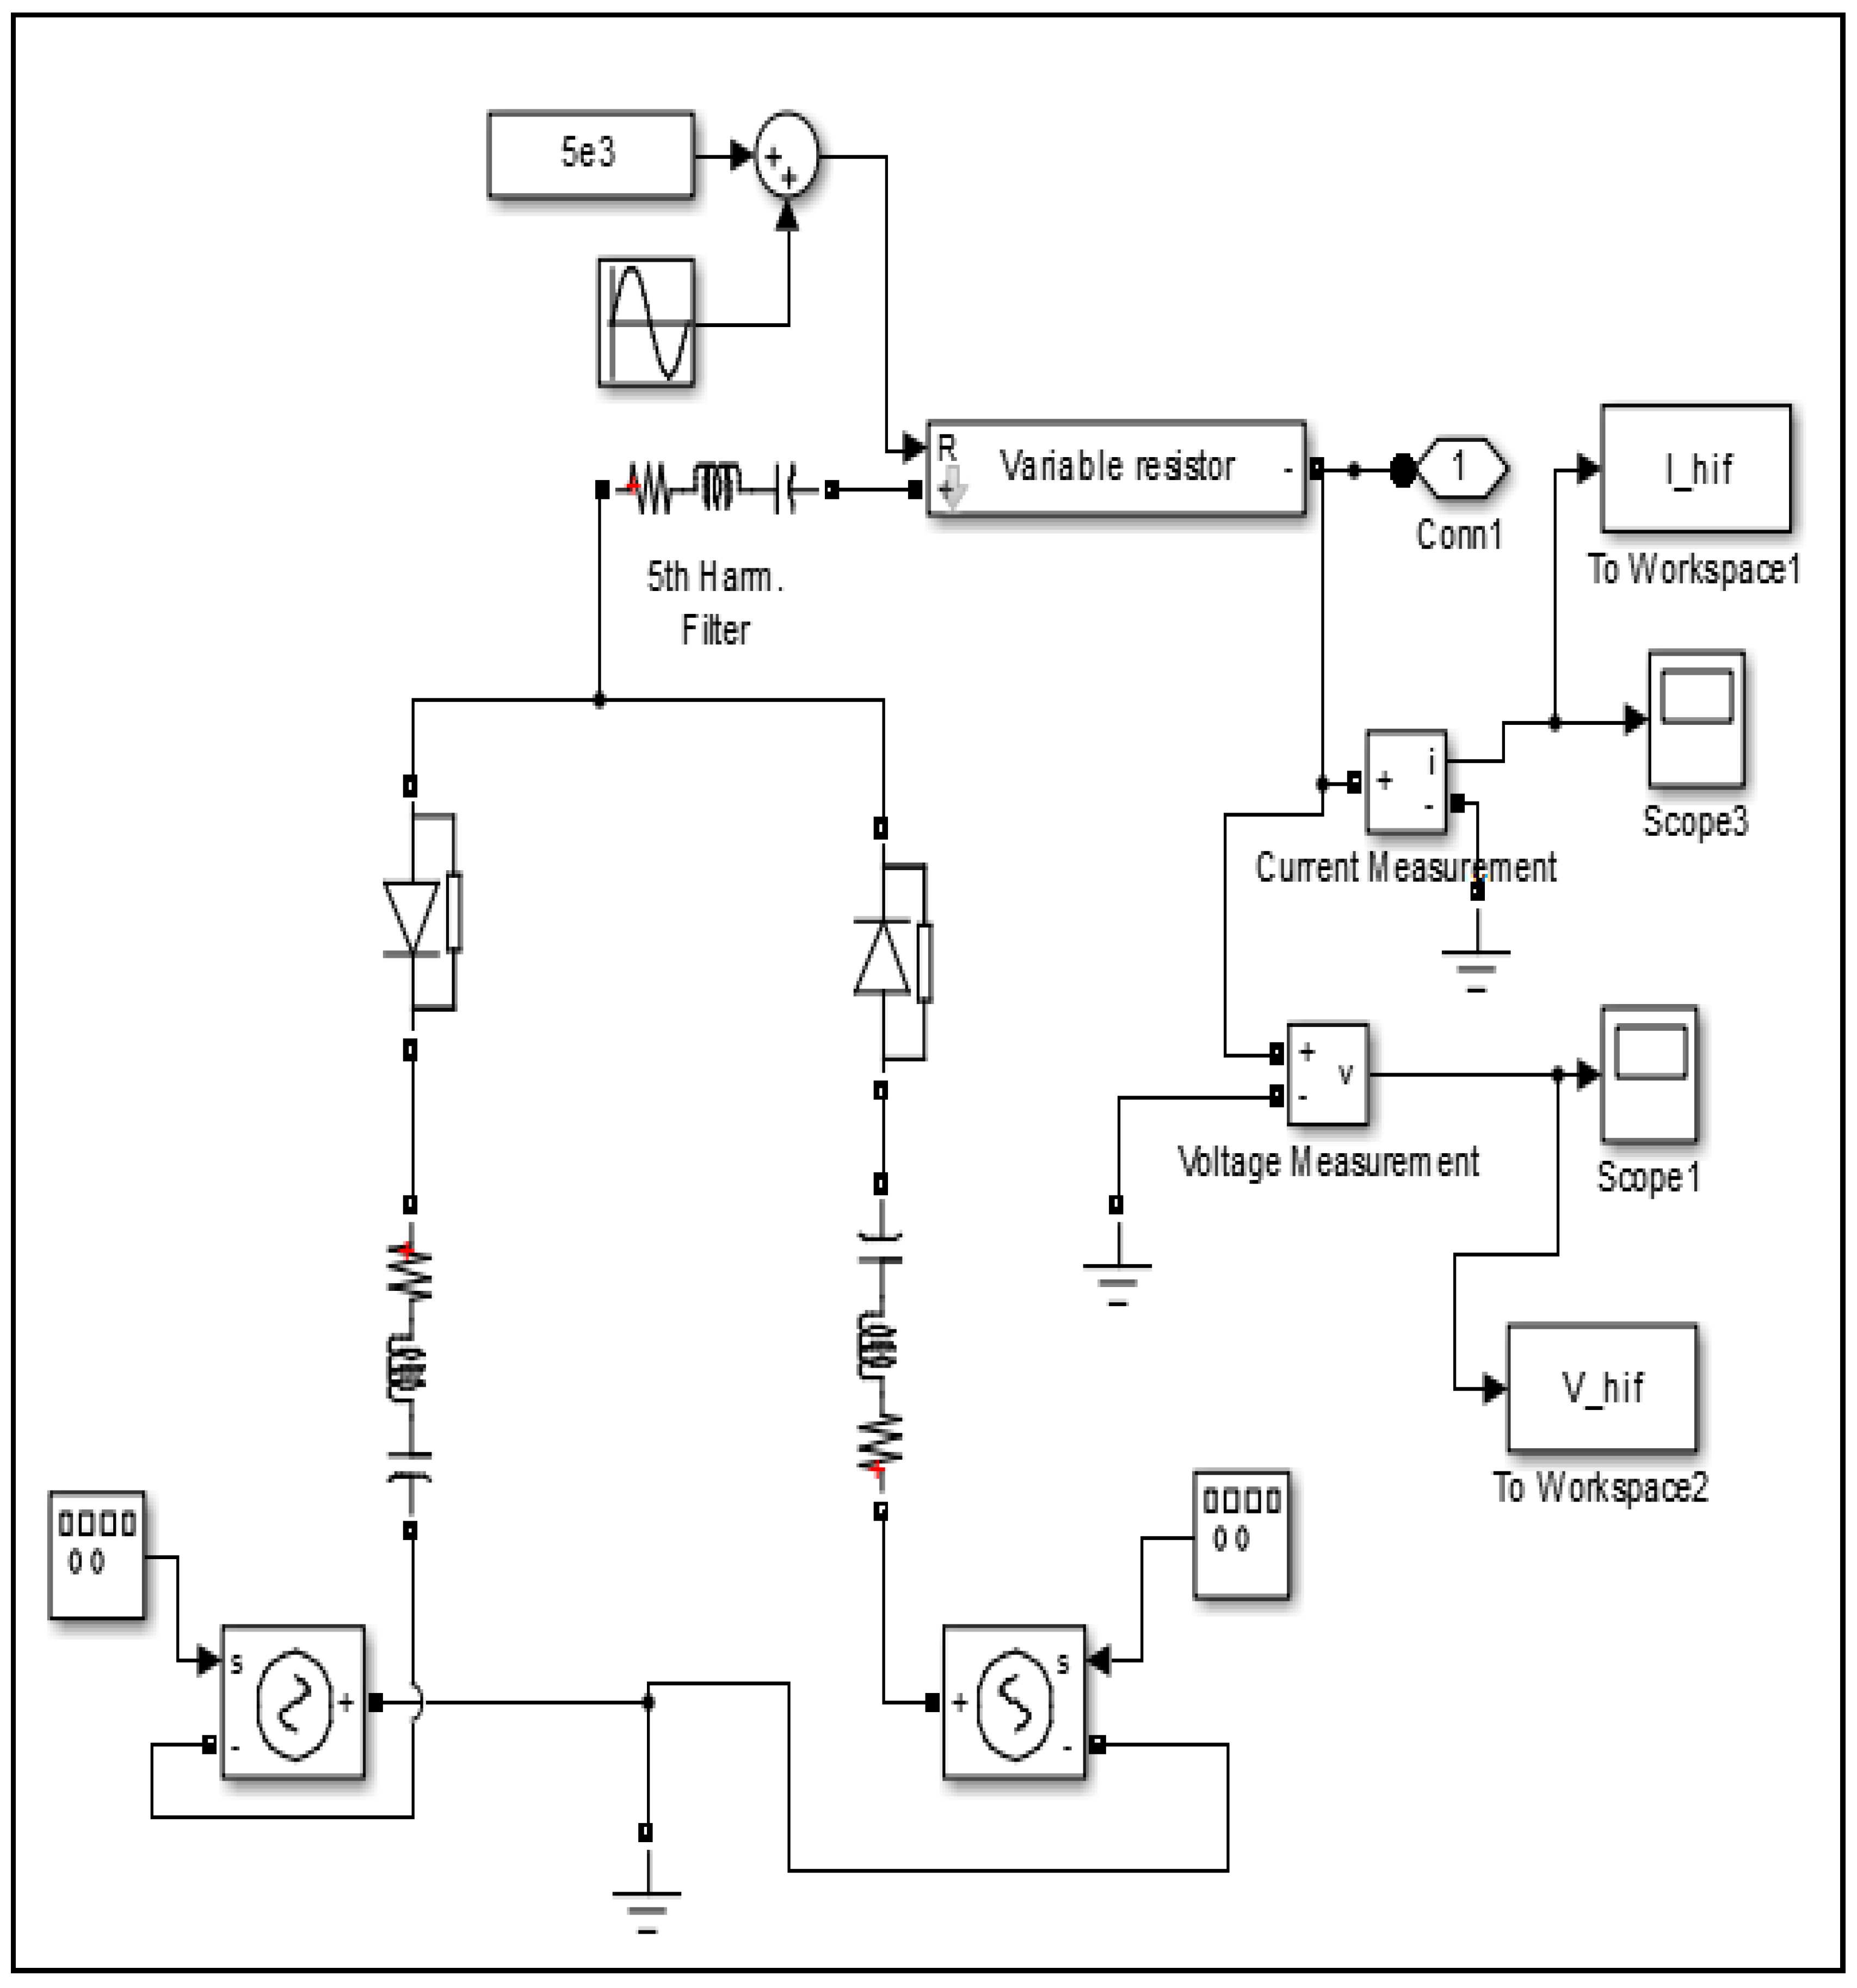
2. System Modelling
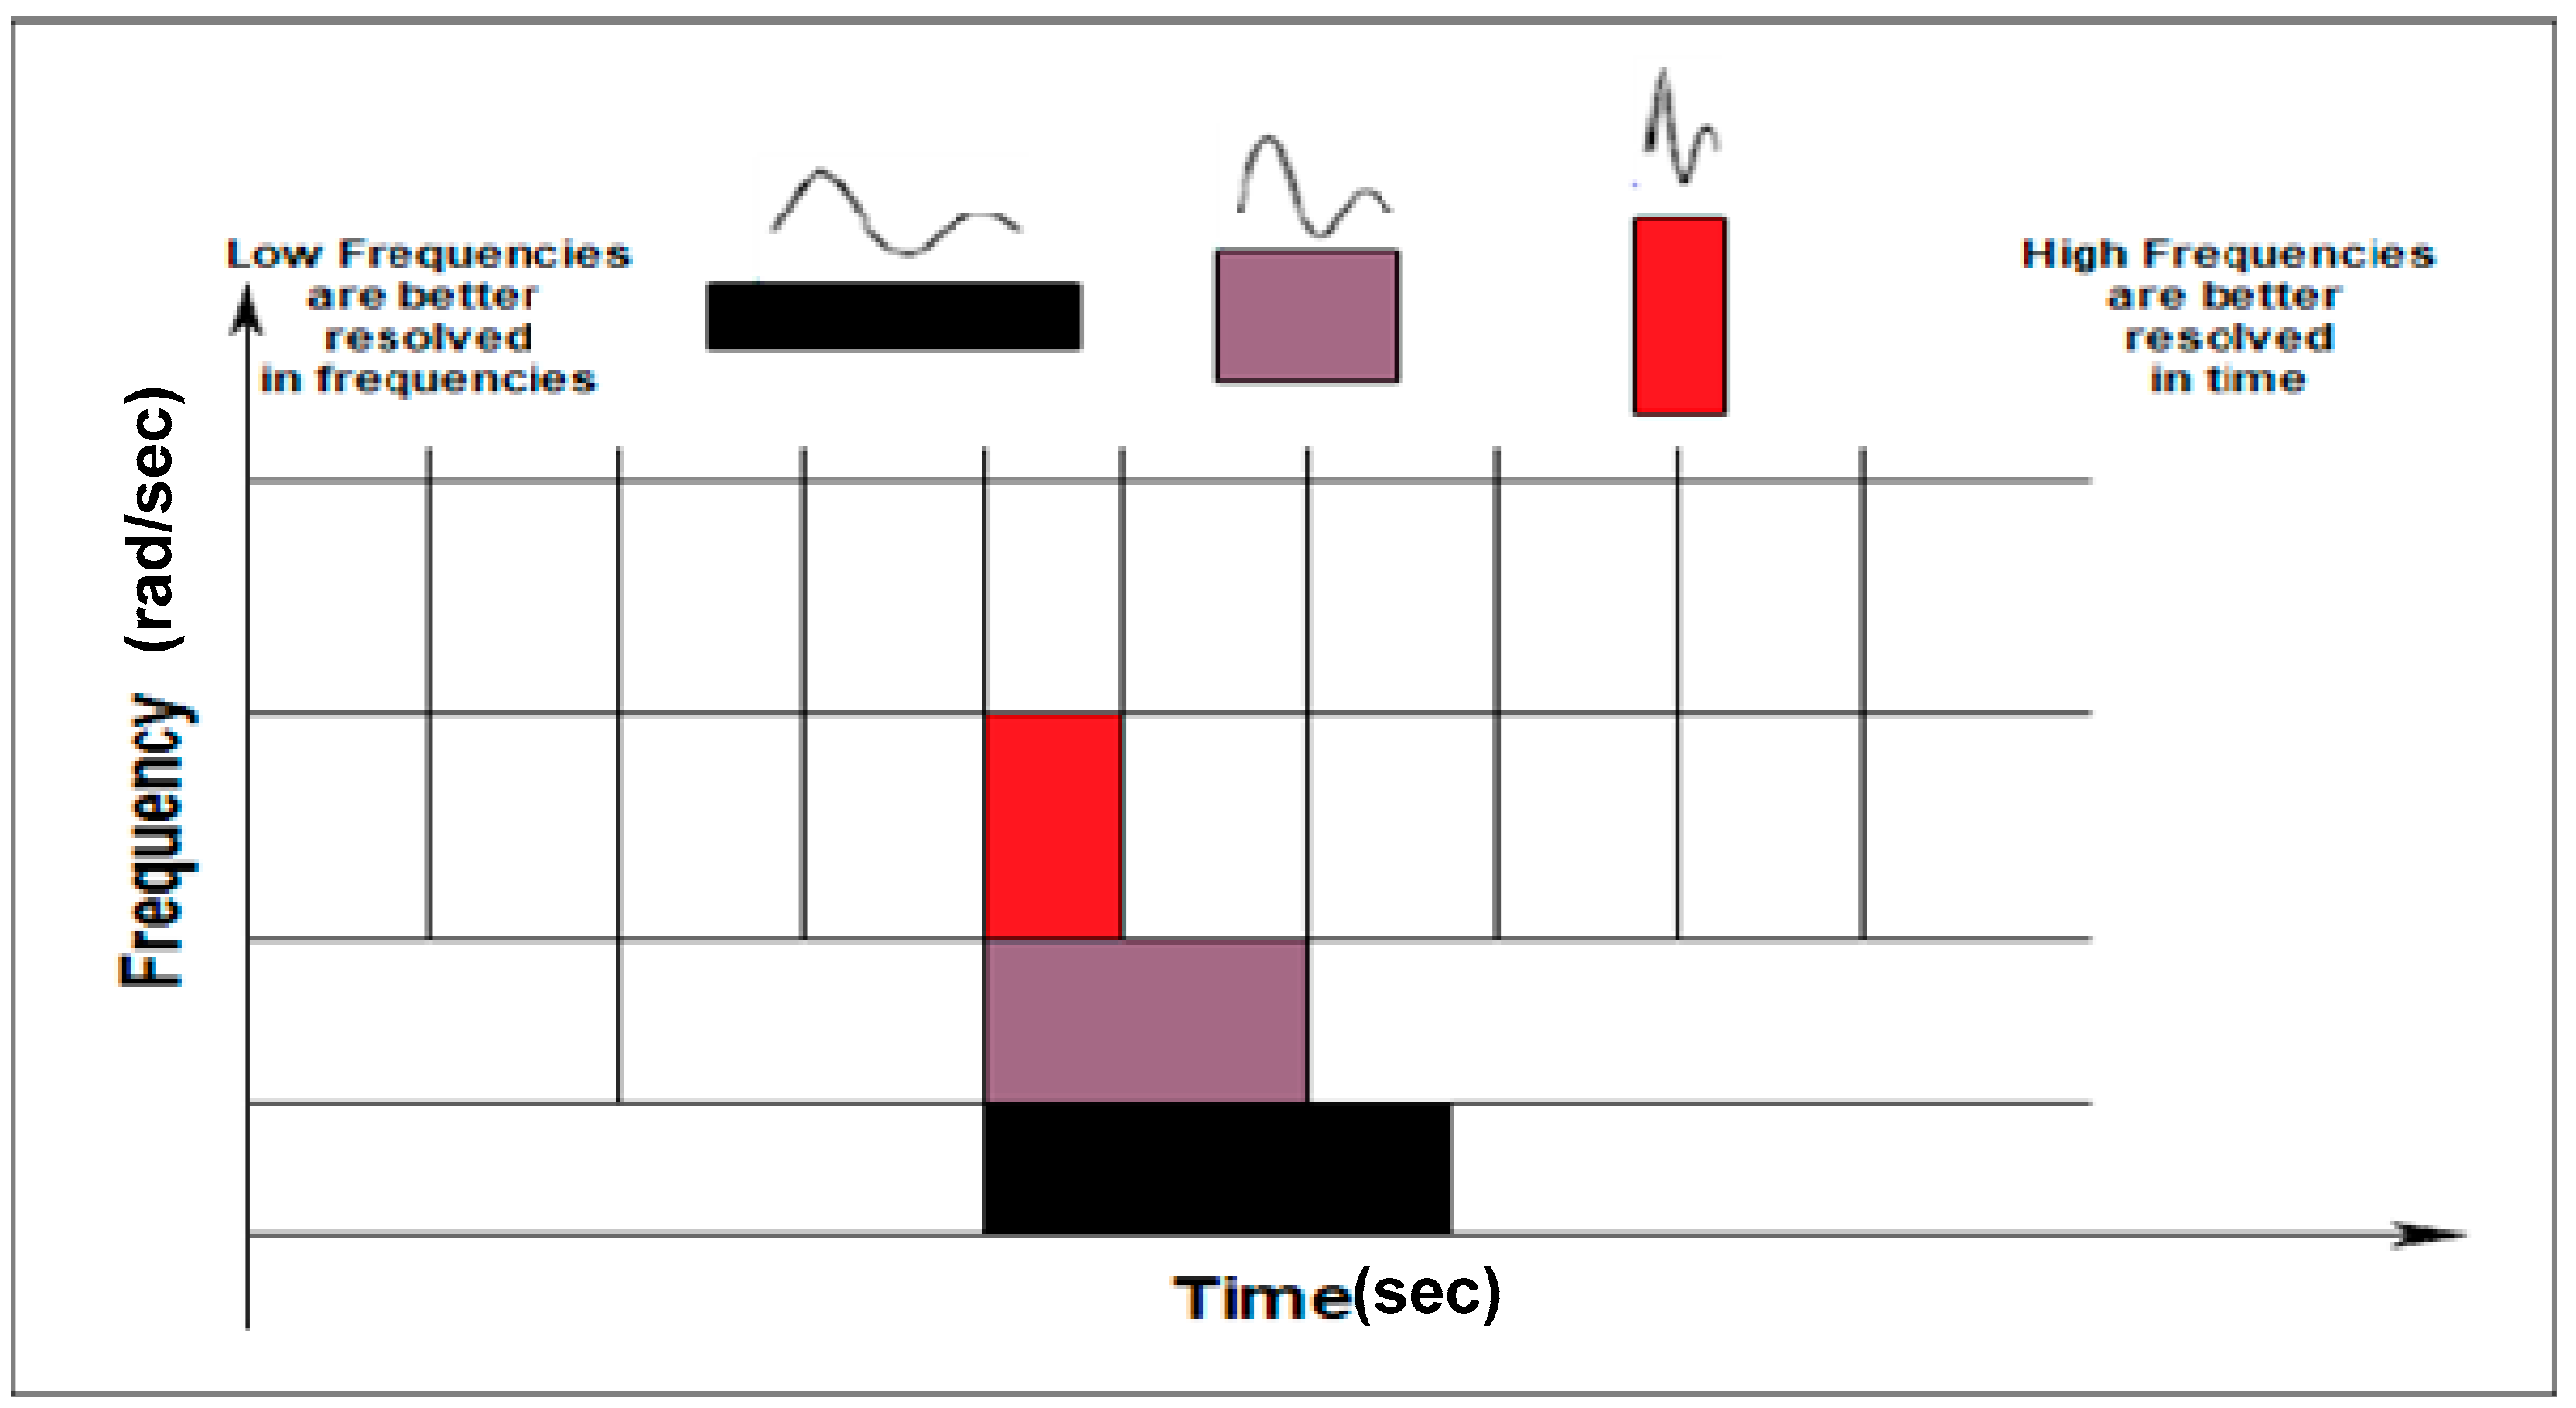
Background of Wavelet Analysis
- CWT requires a large number of scales to show the signal components, which makes it useless for online application.
- CWT is highly redundant transform as its wavelet coefficients contain more information than necessary.
- CWT provides the region where the fault occurs, but DWT localize the fault more efficient.
- DWT preserve all the information of the function with minimum number of wavelet coefficients.
- Computational time is faster for DWT analysis.
- Construction of CWT inverse is more difficult.
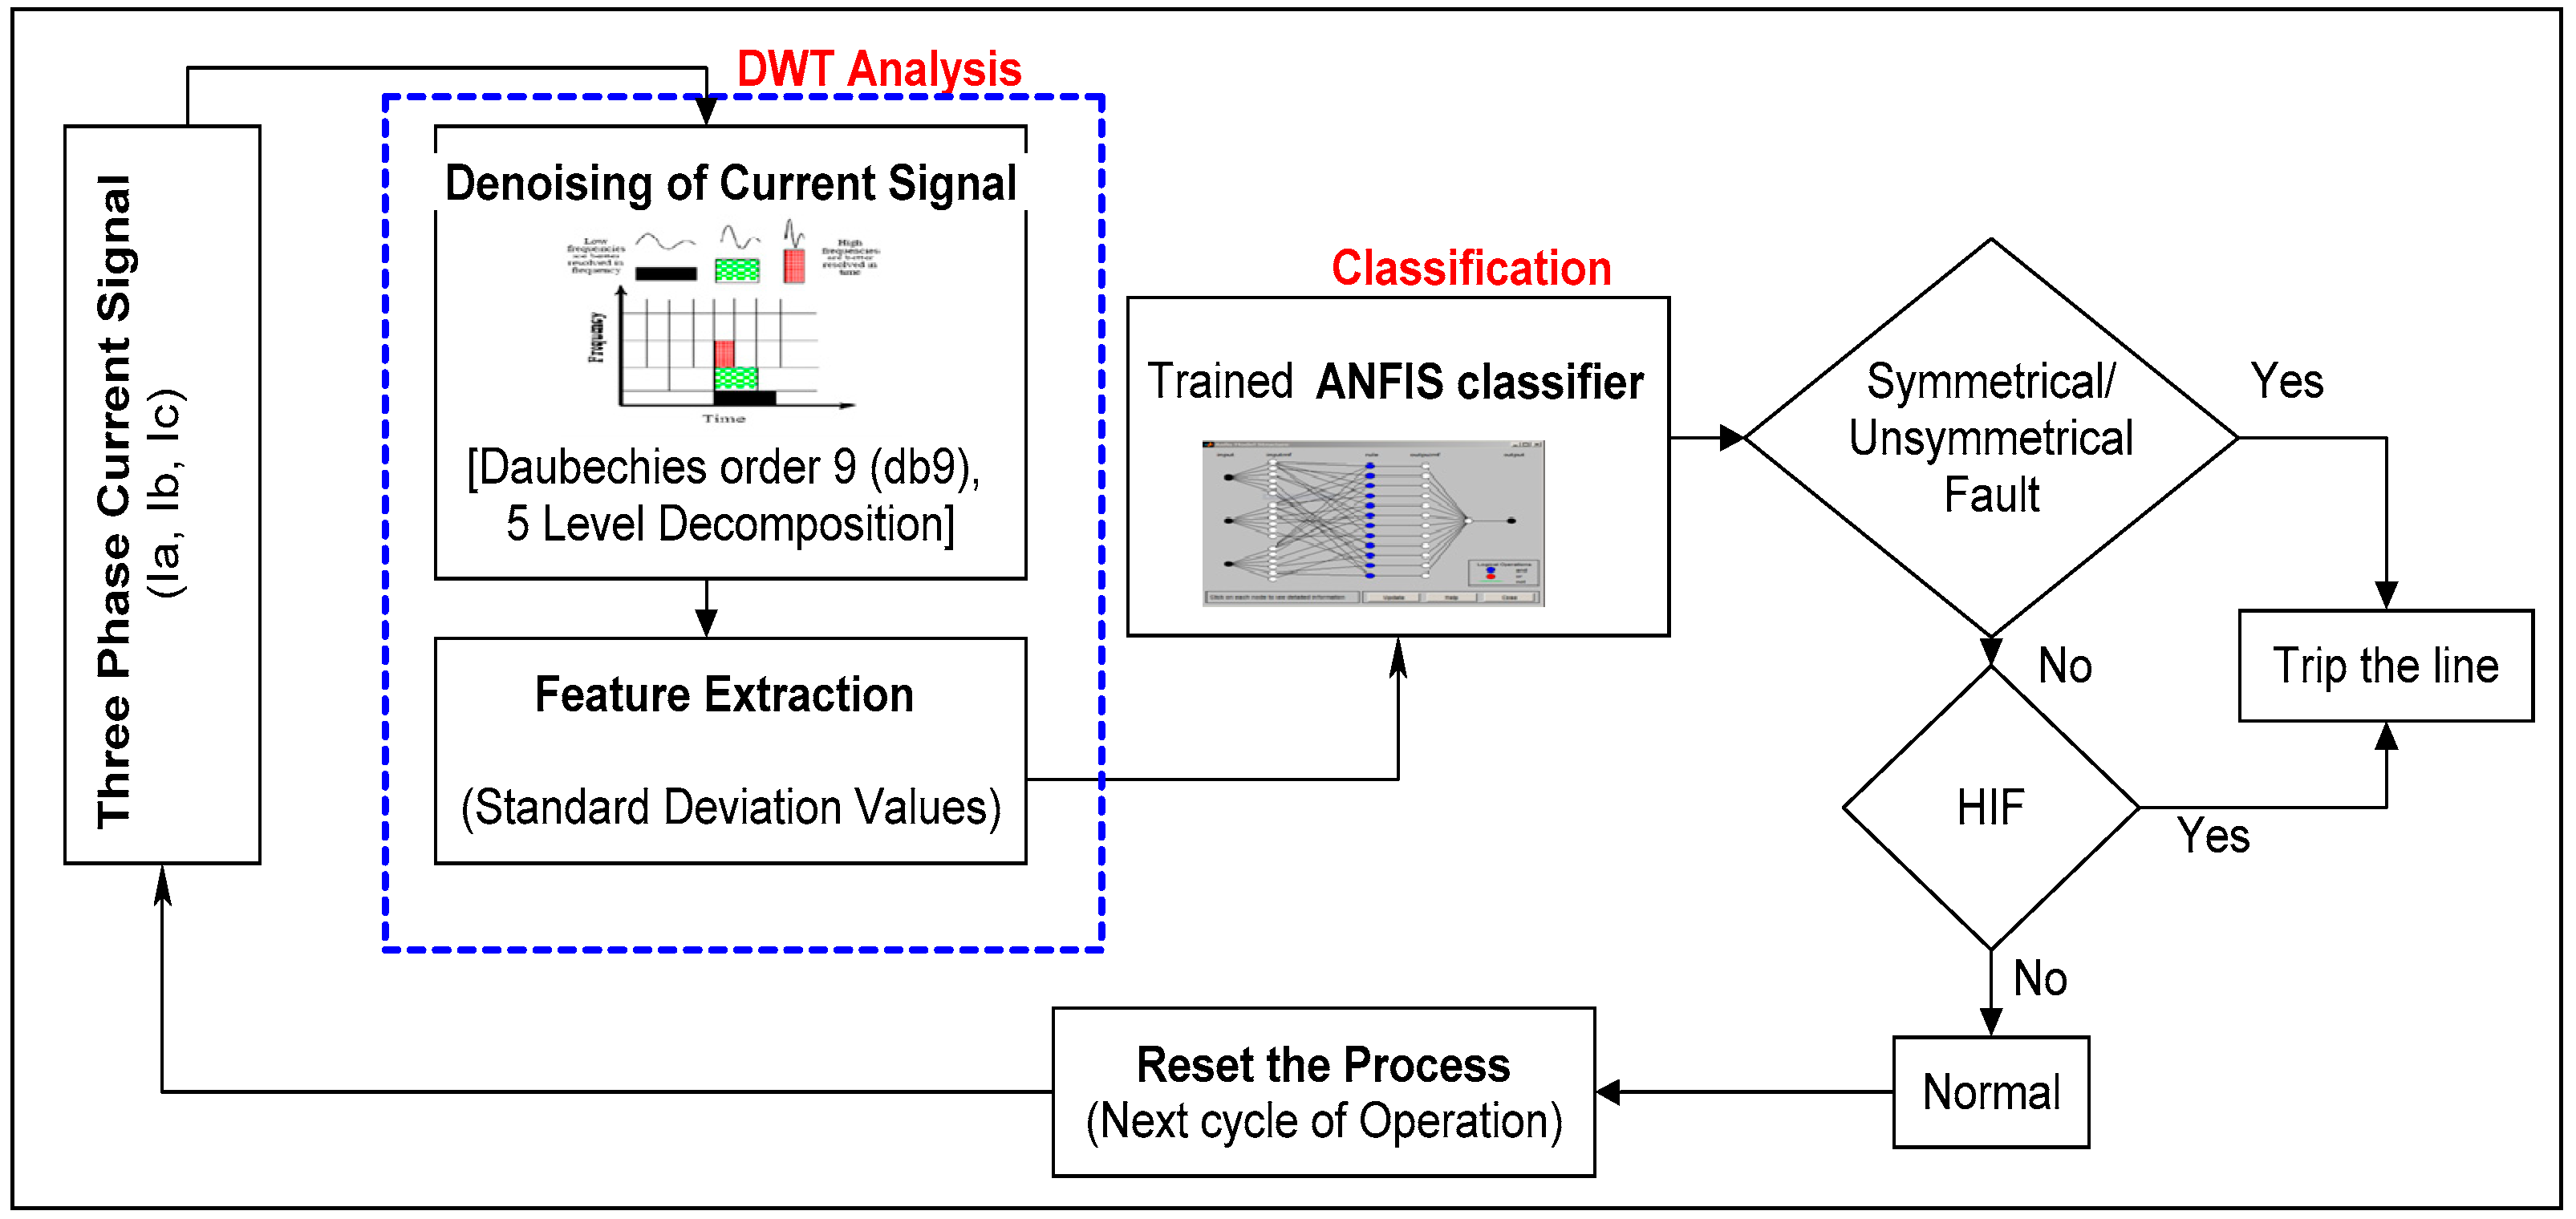
3. Proposed HIF Detection Methodology
3.1. Discrete Wavelet Transform
3.1.1. Choice of Mother Wavelet
3.1.2. Feature Extraction
4. Intelligence-Based Classifier
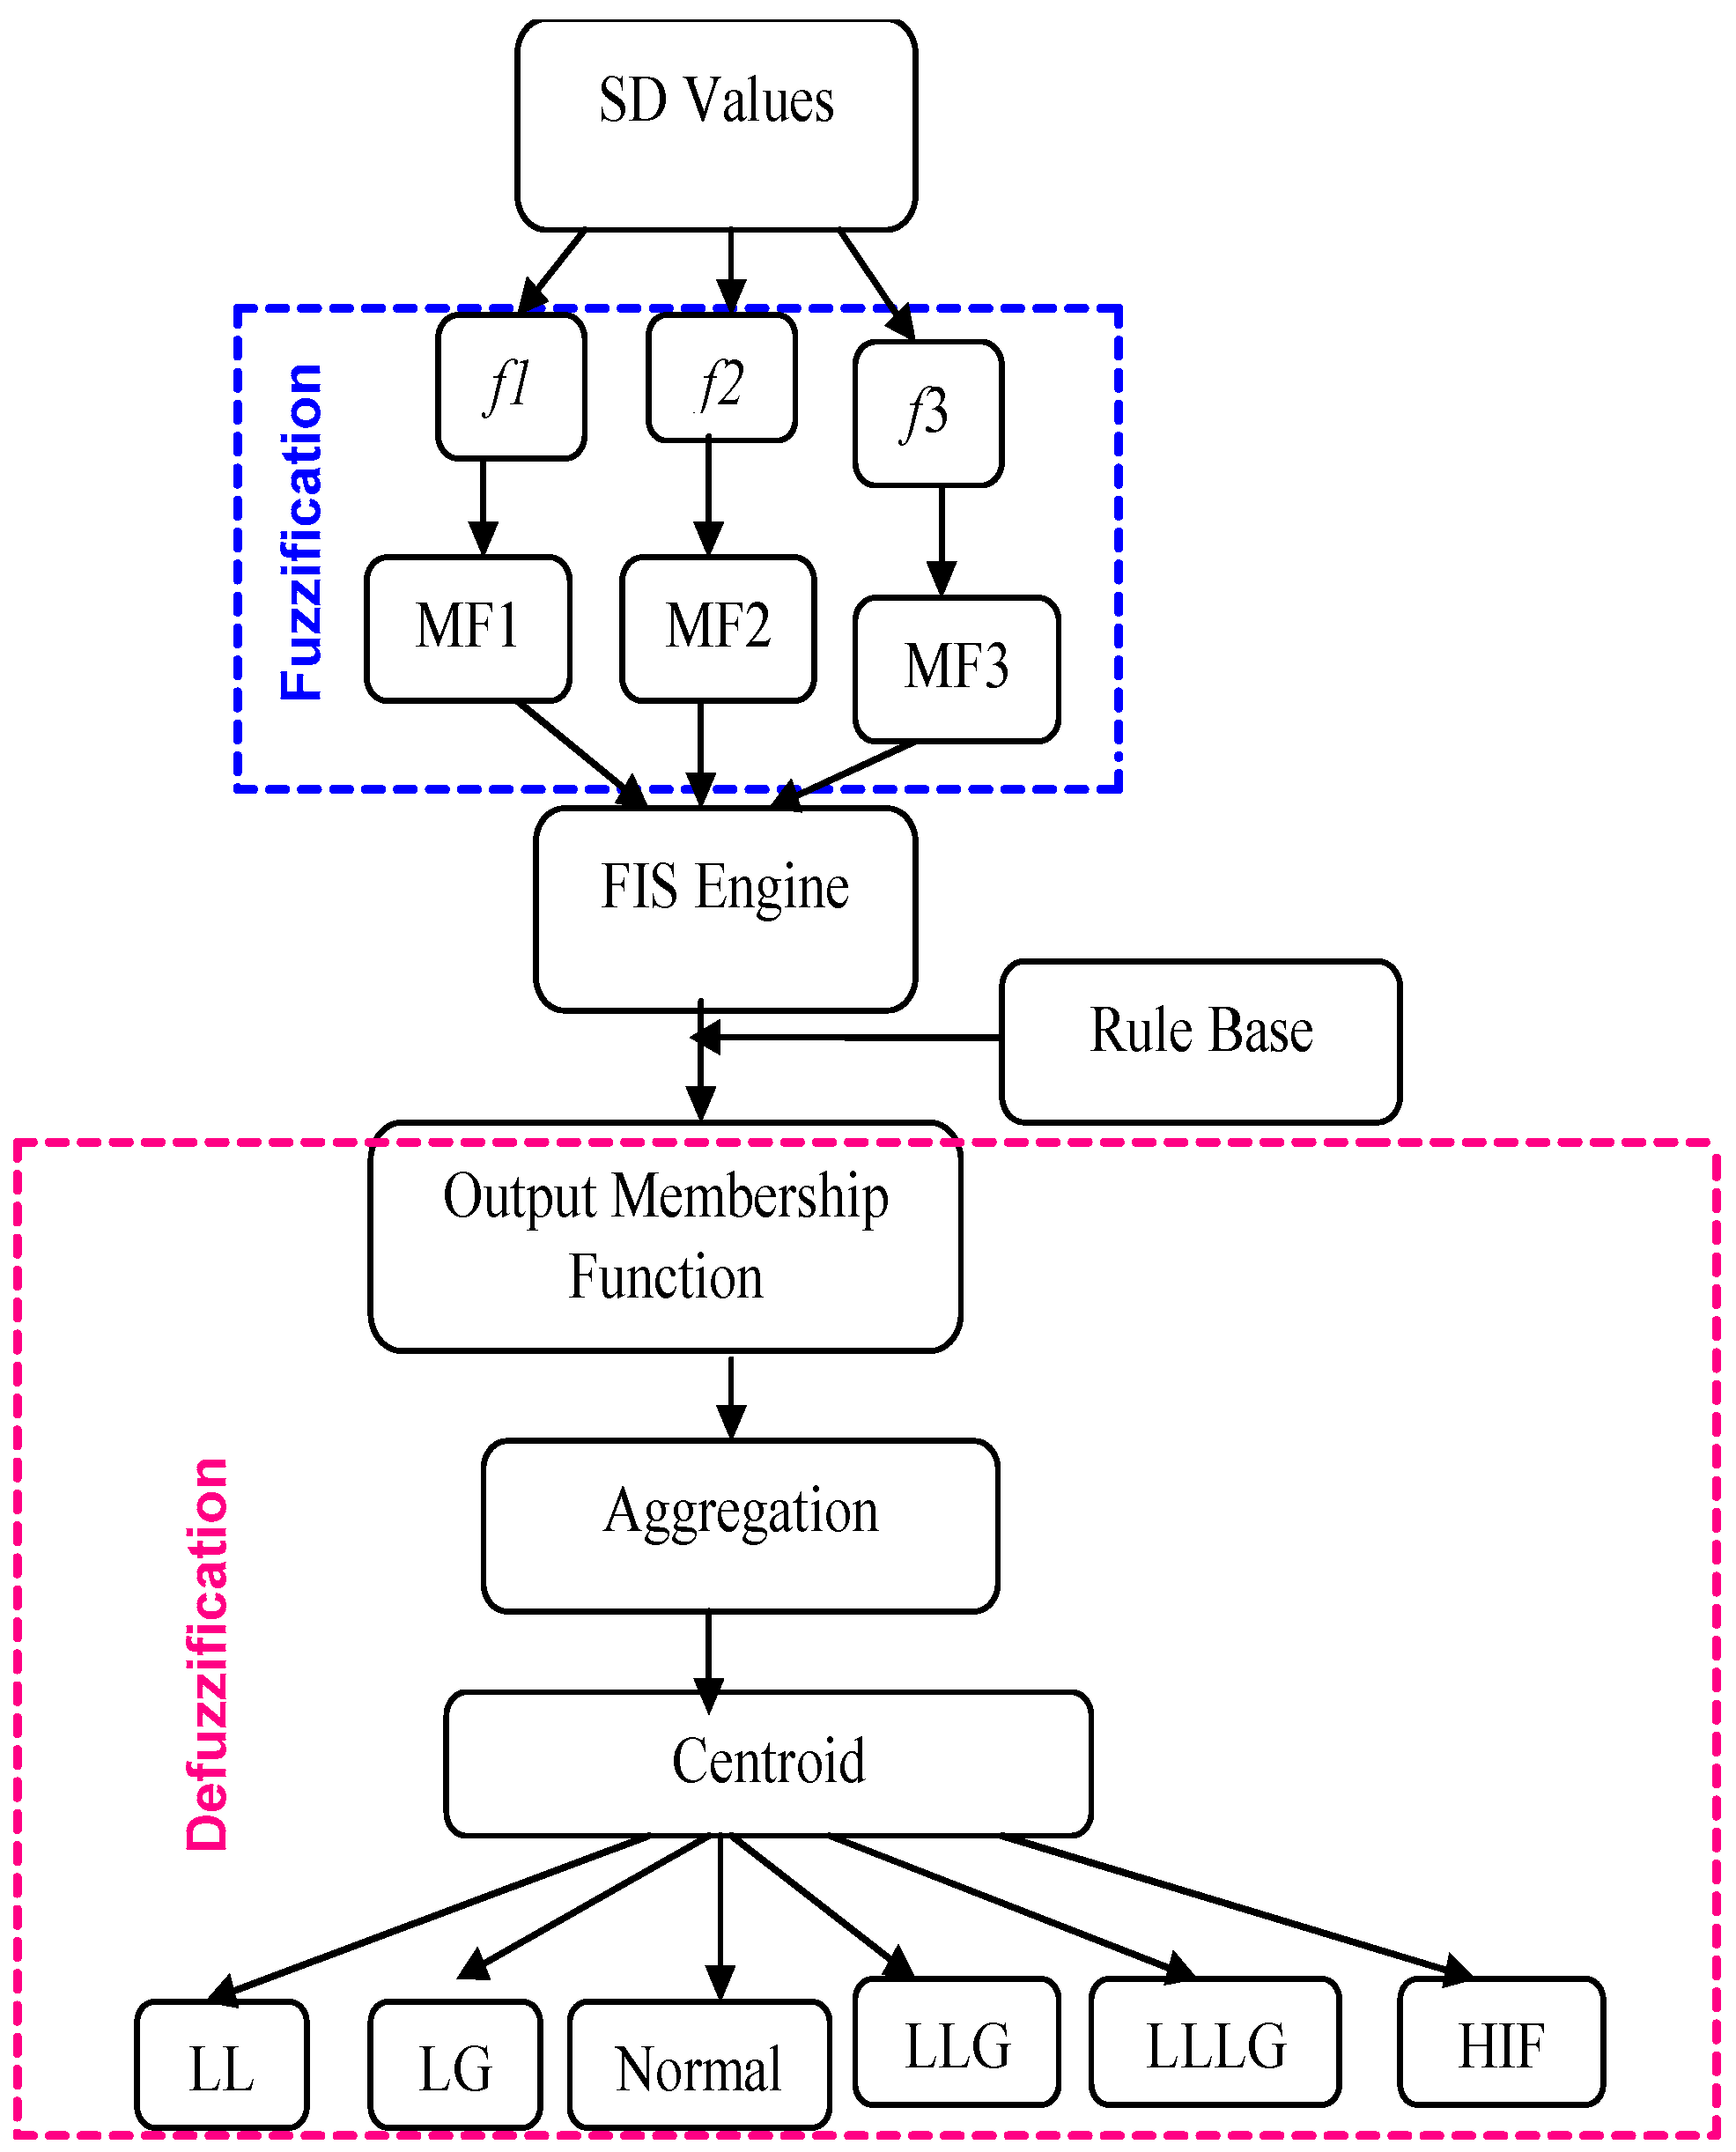
4.1. Fuzzy Logic System
- Step 1:
- Define the problem and classify the data i.e., SD values
- Step 2:
- Define the input and output fuzzy sets with variable name.
- Step 3:
- Define the type of member function for each variable.
- Step 4:
- Frame the rules.
- Step 5:
- Built and test the system.
- Step 6:
- Tune and validate the system.
- If (S1 is normal) and (S2 is normal) and (S3 is normal) then (trip output is Normal)
- If (S1 is fault) and (S2 is fault) and (S3 is fault) then (trip output is ABC fault)
- If (S1 is ground) and (S2 is ground) and (S3 is normal) then (trip output is ABG fault)
- If (S1 is normal) and (S2 is ground) and (S3 is ground) then (trip output is BCG fault)
- If (S1 is ground) and (S2 is normal) and (S3 is ground) then (trip output is ACG fault)
- If (S1 is ground) and (S2 is normal) and (S3 is normal) then (trip output is AG fault)
- If (S1 is normal) and (S2 is ground) and (S3 is normal) then (trip output is BG fault)
- If (S1 is normal) and (S2 is normal) and (S3 is ground) then (trip output is CG fault)
- If (S1 is fault) and (S2 is fault) and (S3 is normal) then (trip output is AB fault)
- If (S1 is normal) and (S2 is fault) and (S3 is fault) then (trip output is BC fault)
- If (S1 is fault) and (S2 is normal) and (S3 is fault) then (trip output is AC fault)
- If (S1 is HIF) and (S2 is normal) and (S3 is normal) then (trip output is HIF fault at Phase A)
- If (S1 is normal) and (S2 is HIF) and (S3 is normal) then (trip output is HIF fault at PhaseB)
- If (S1 is normal) and (S2 is normal) and (S3 is HIF) then (trip output is HIF fault at Phase C)
4.2. Adaptive Neuro Fuzzy Inference System
- It is capable of handling complex and nonlinear problems even if the targets are not given.
- The learning duration of ANFIS is very short than Neural Network (NN) which implies that ANFIS reaches the target faster than neural network.
- Reduces the complexity of the problem, in case of system with huge amount of data.
- In training of the data, ANFIS gives result with minimum total error compared to other type of NN.
- IF x1 is A1
- AND x2 is A2
- AND xm is Am
- THEN y = f (x1, x2, …, xm)
5. Results and Discussion
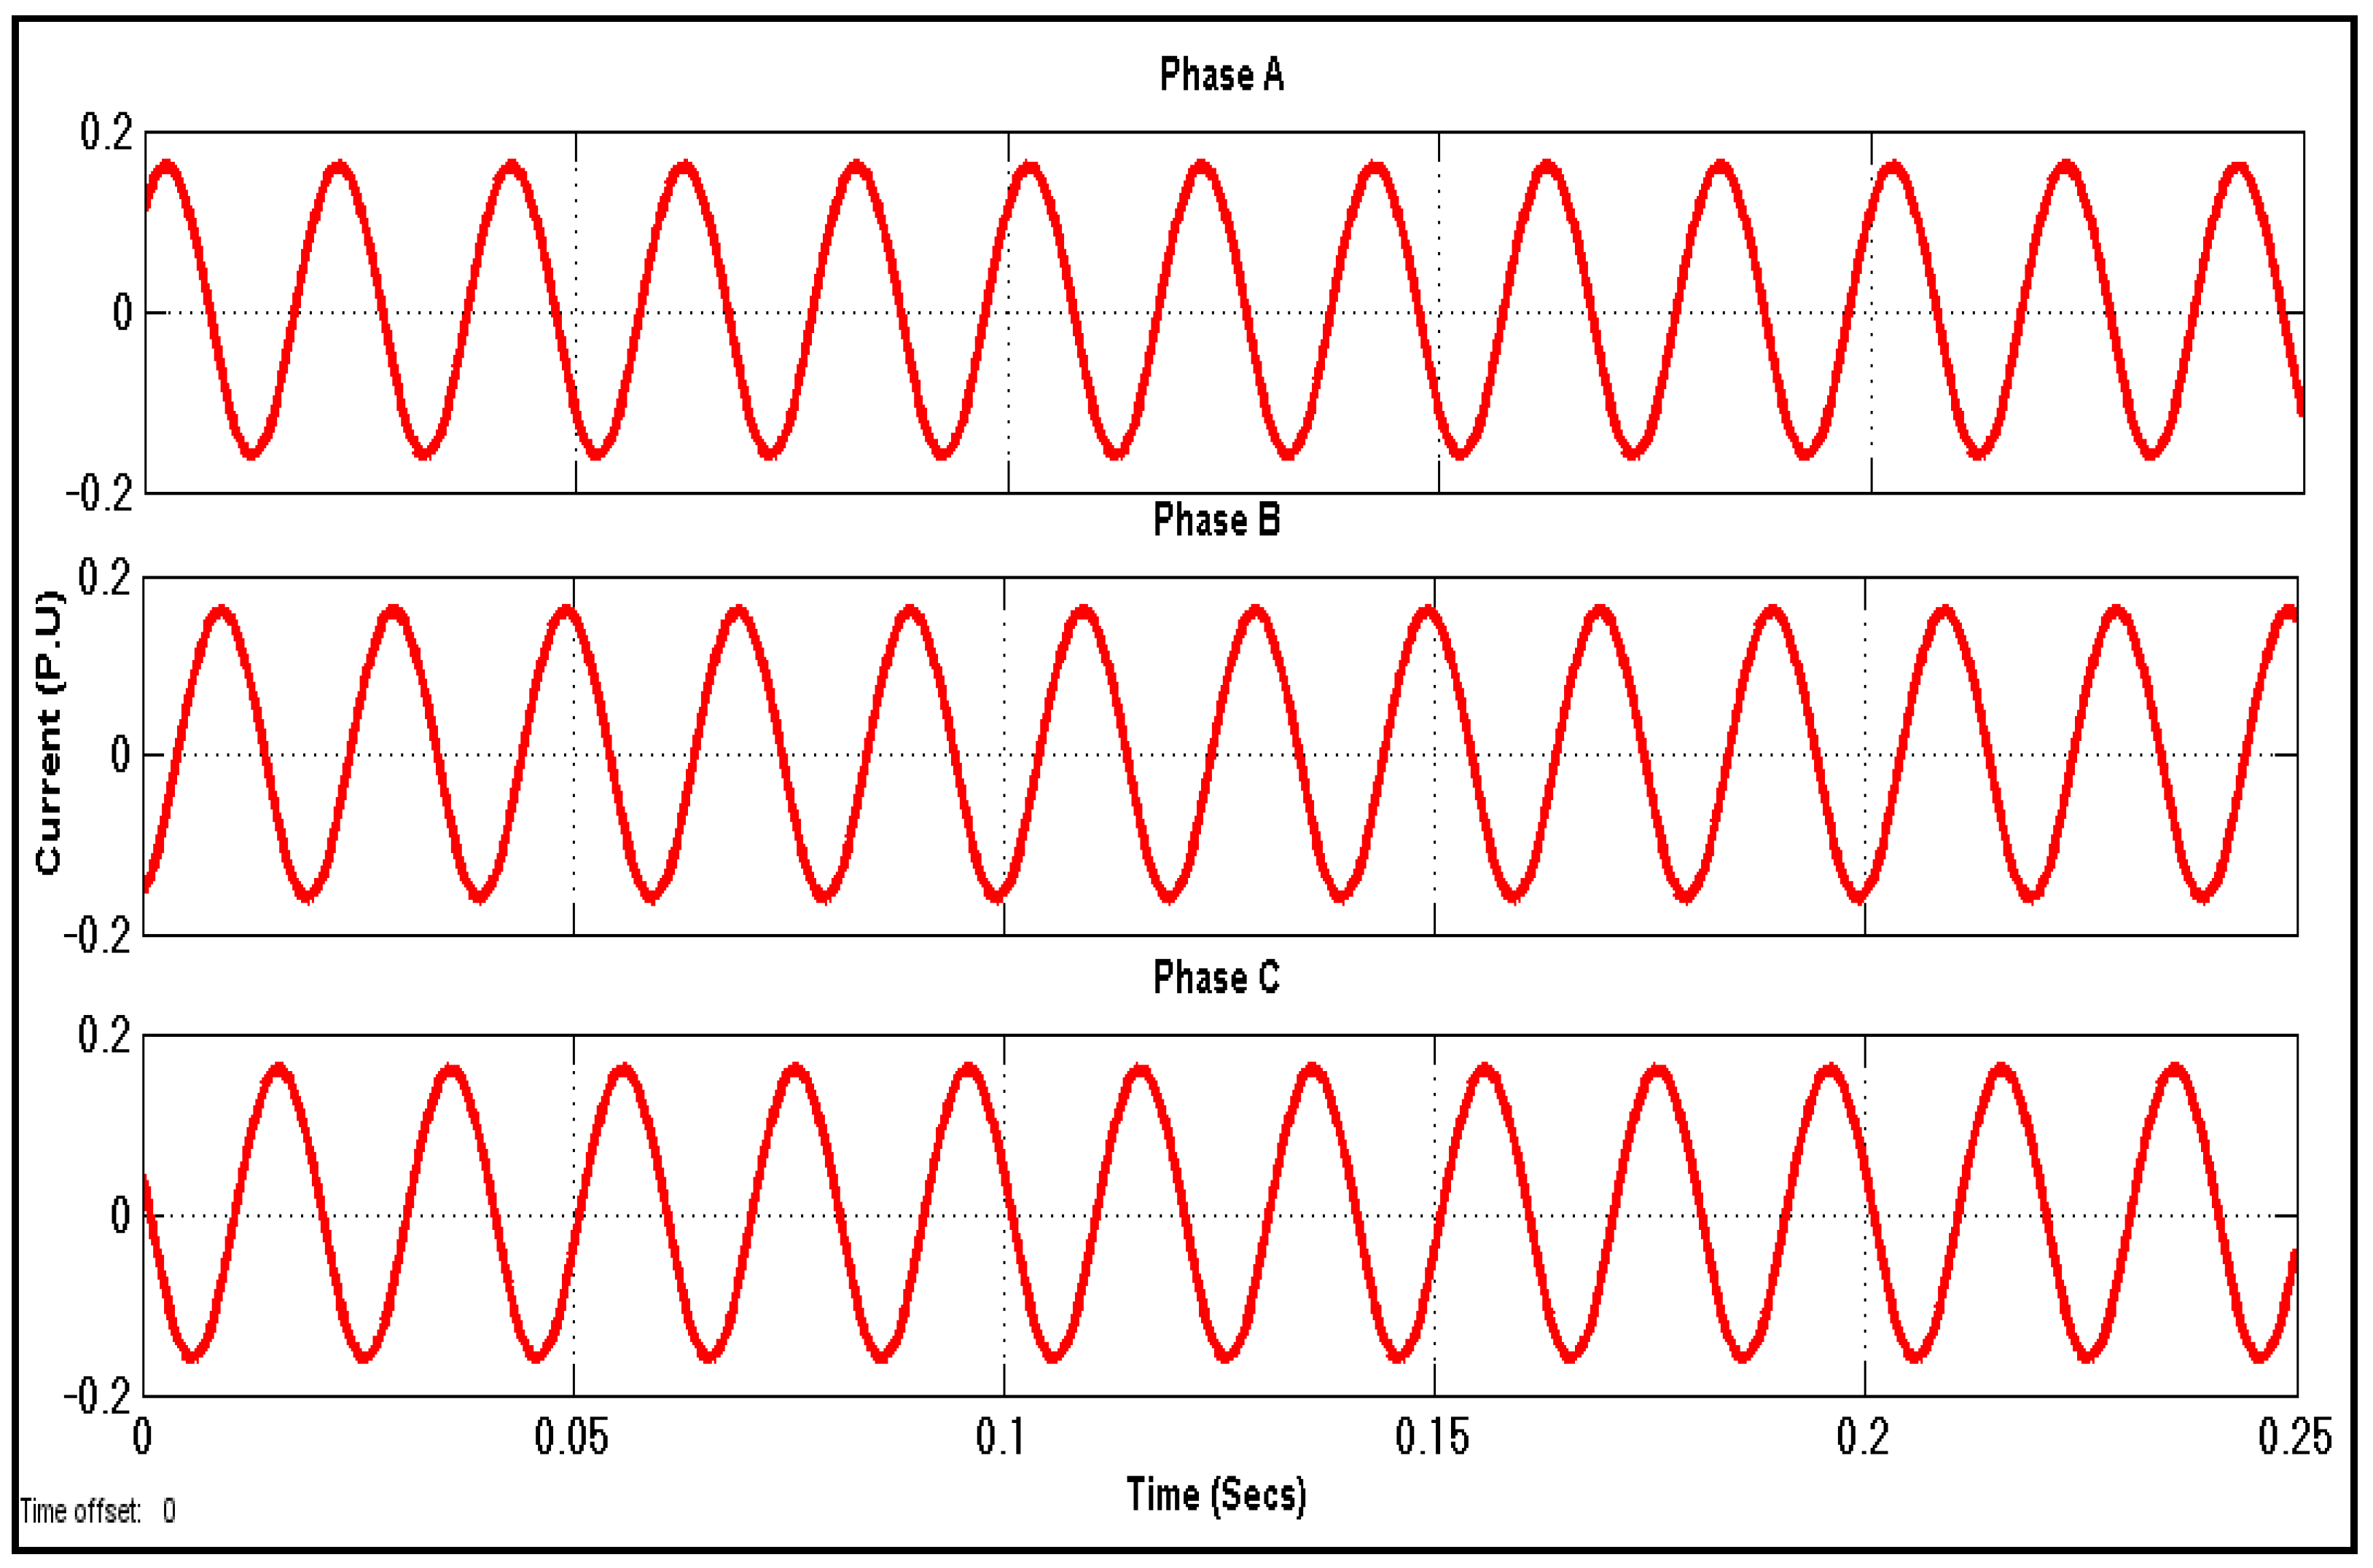
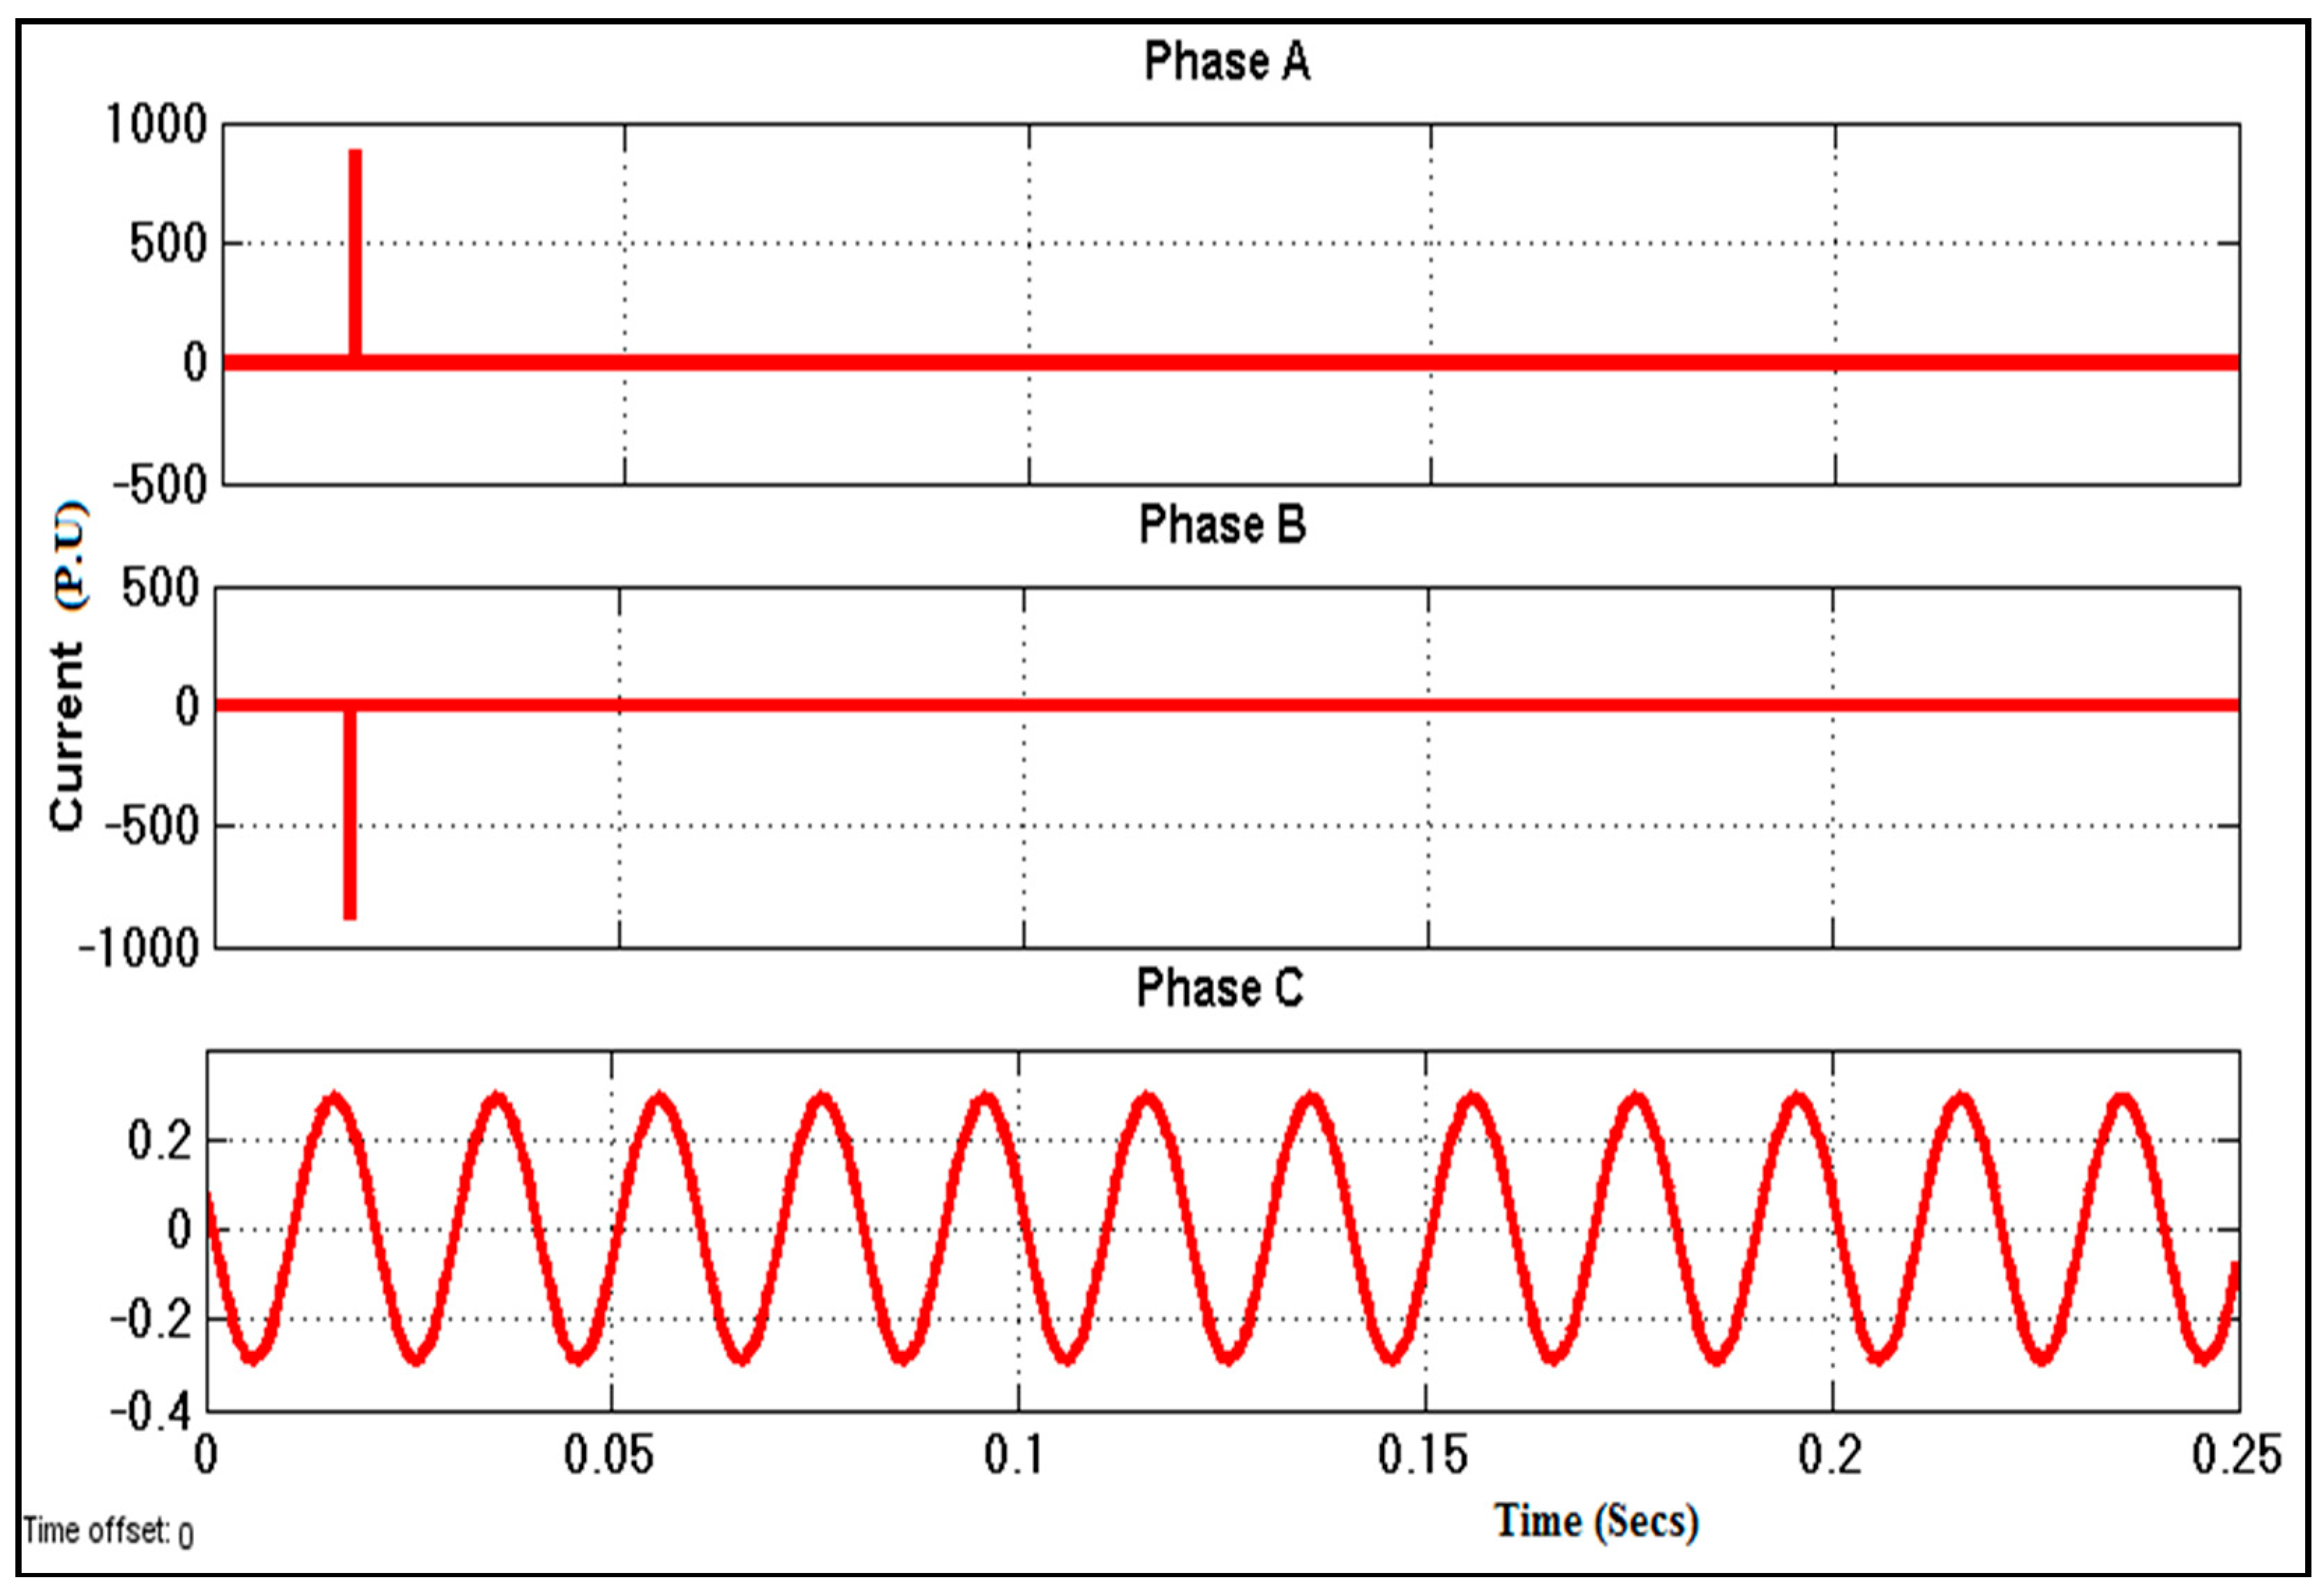
5.1. Matlab Simulation Results for Different Cases
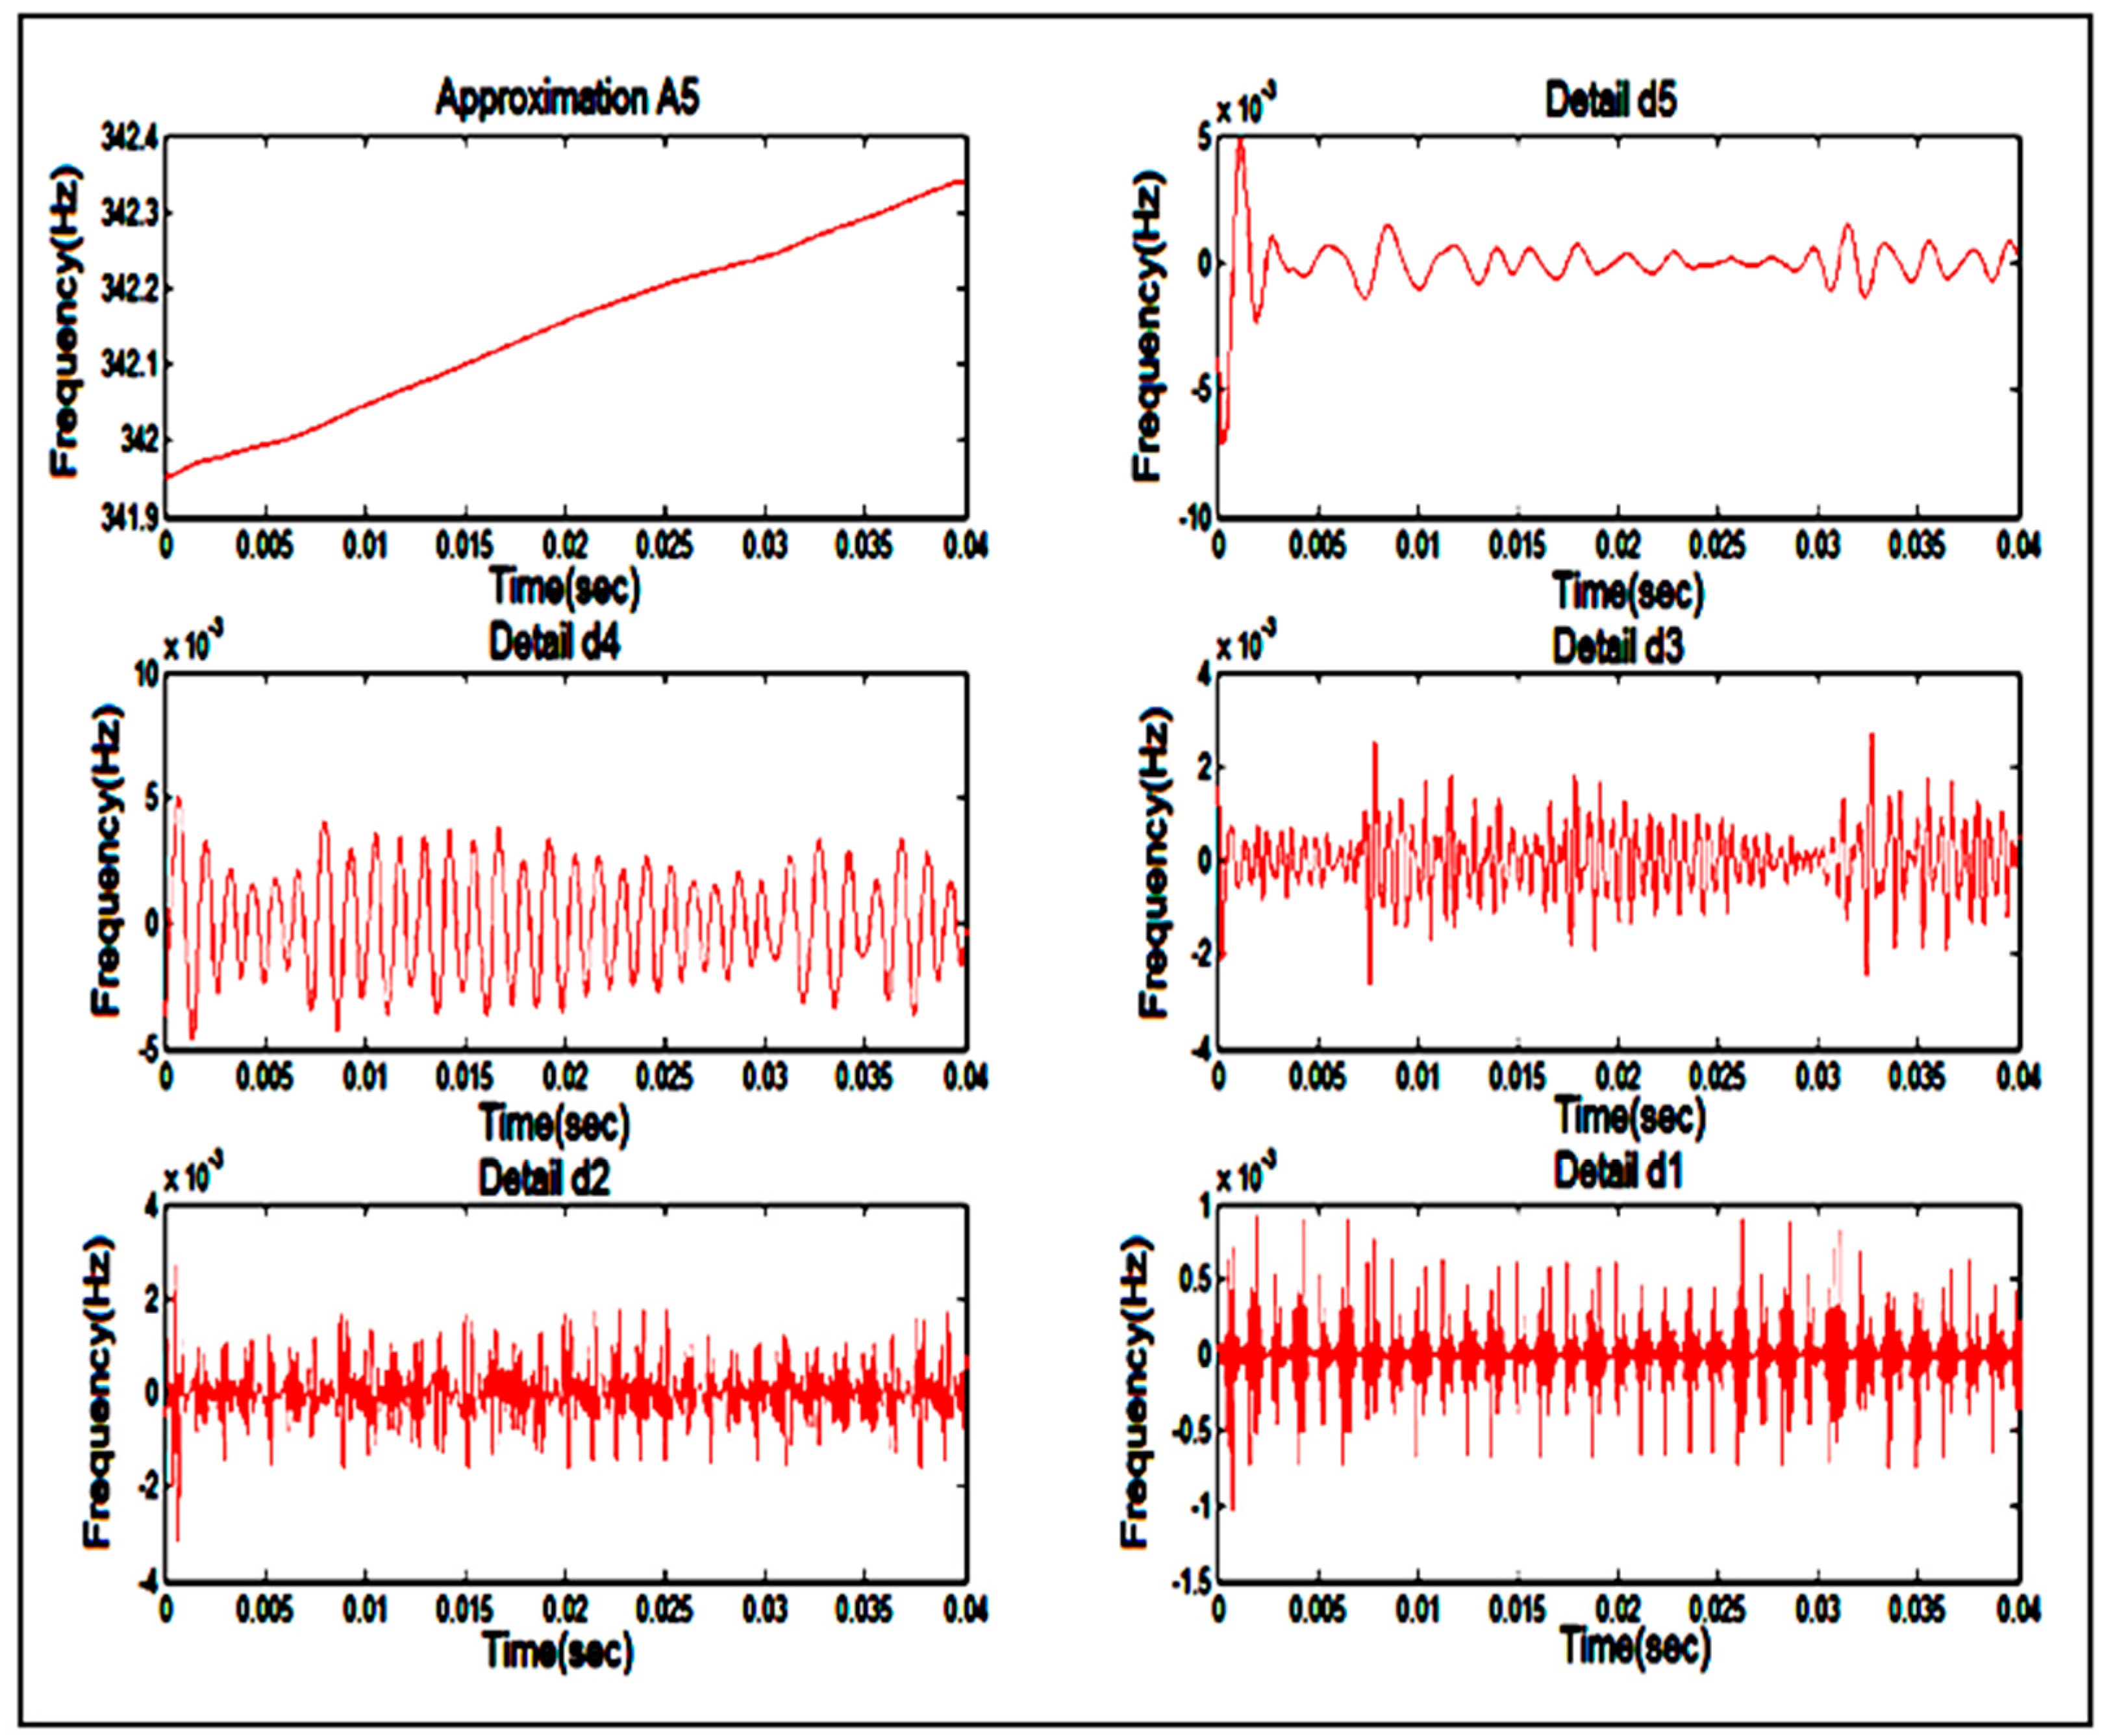
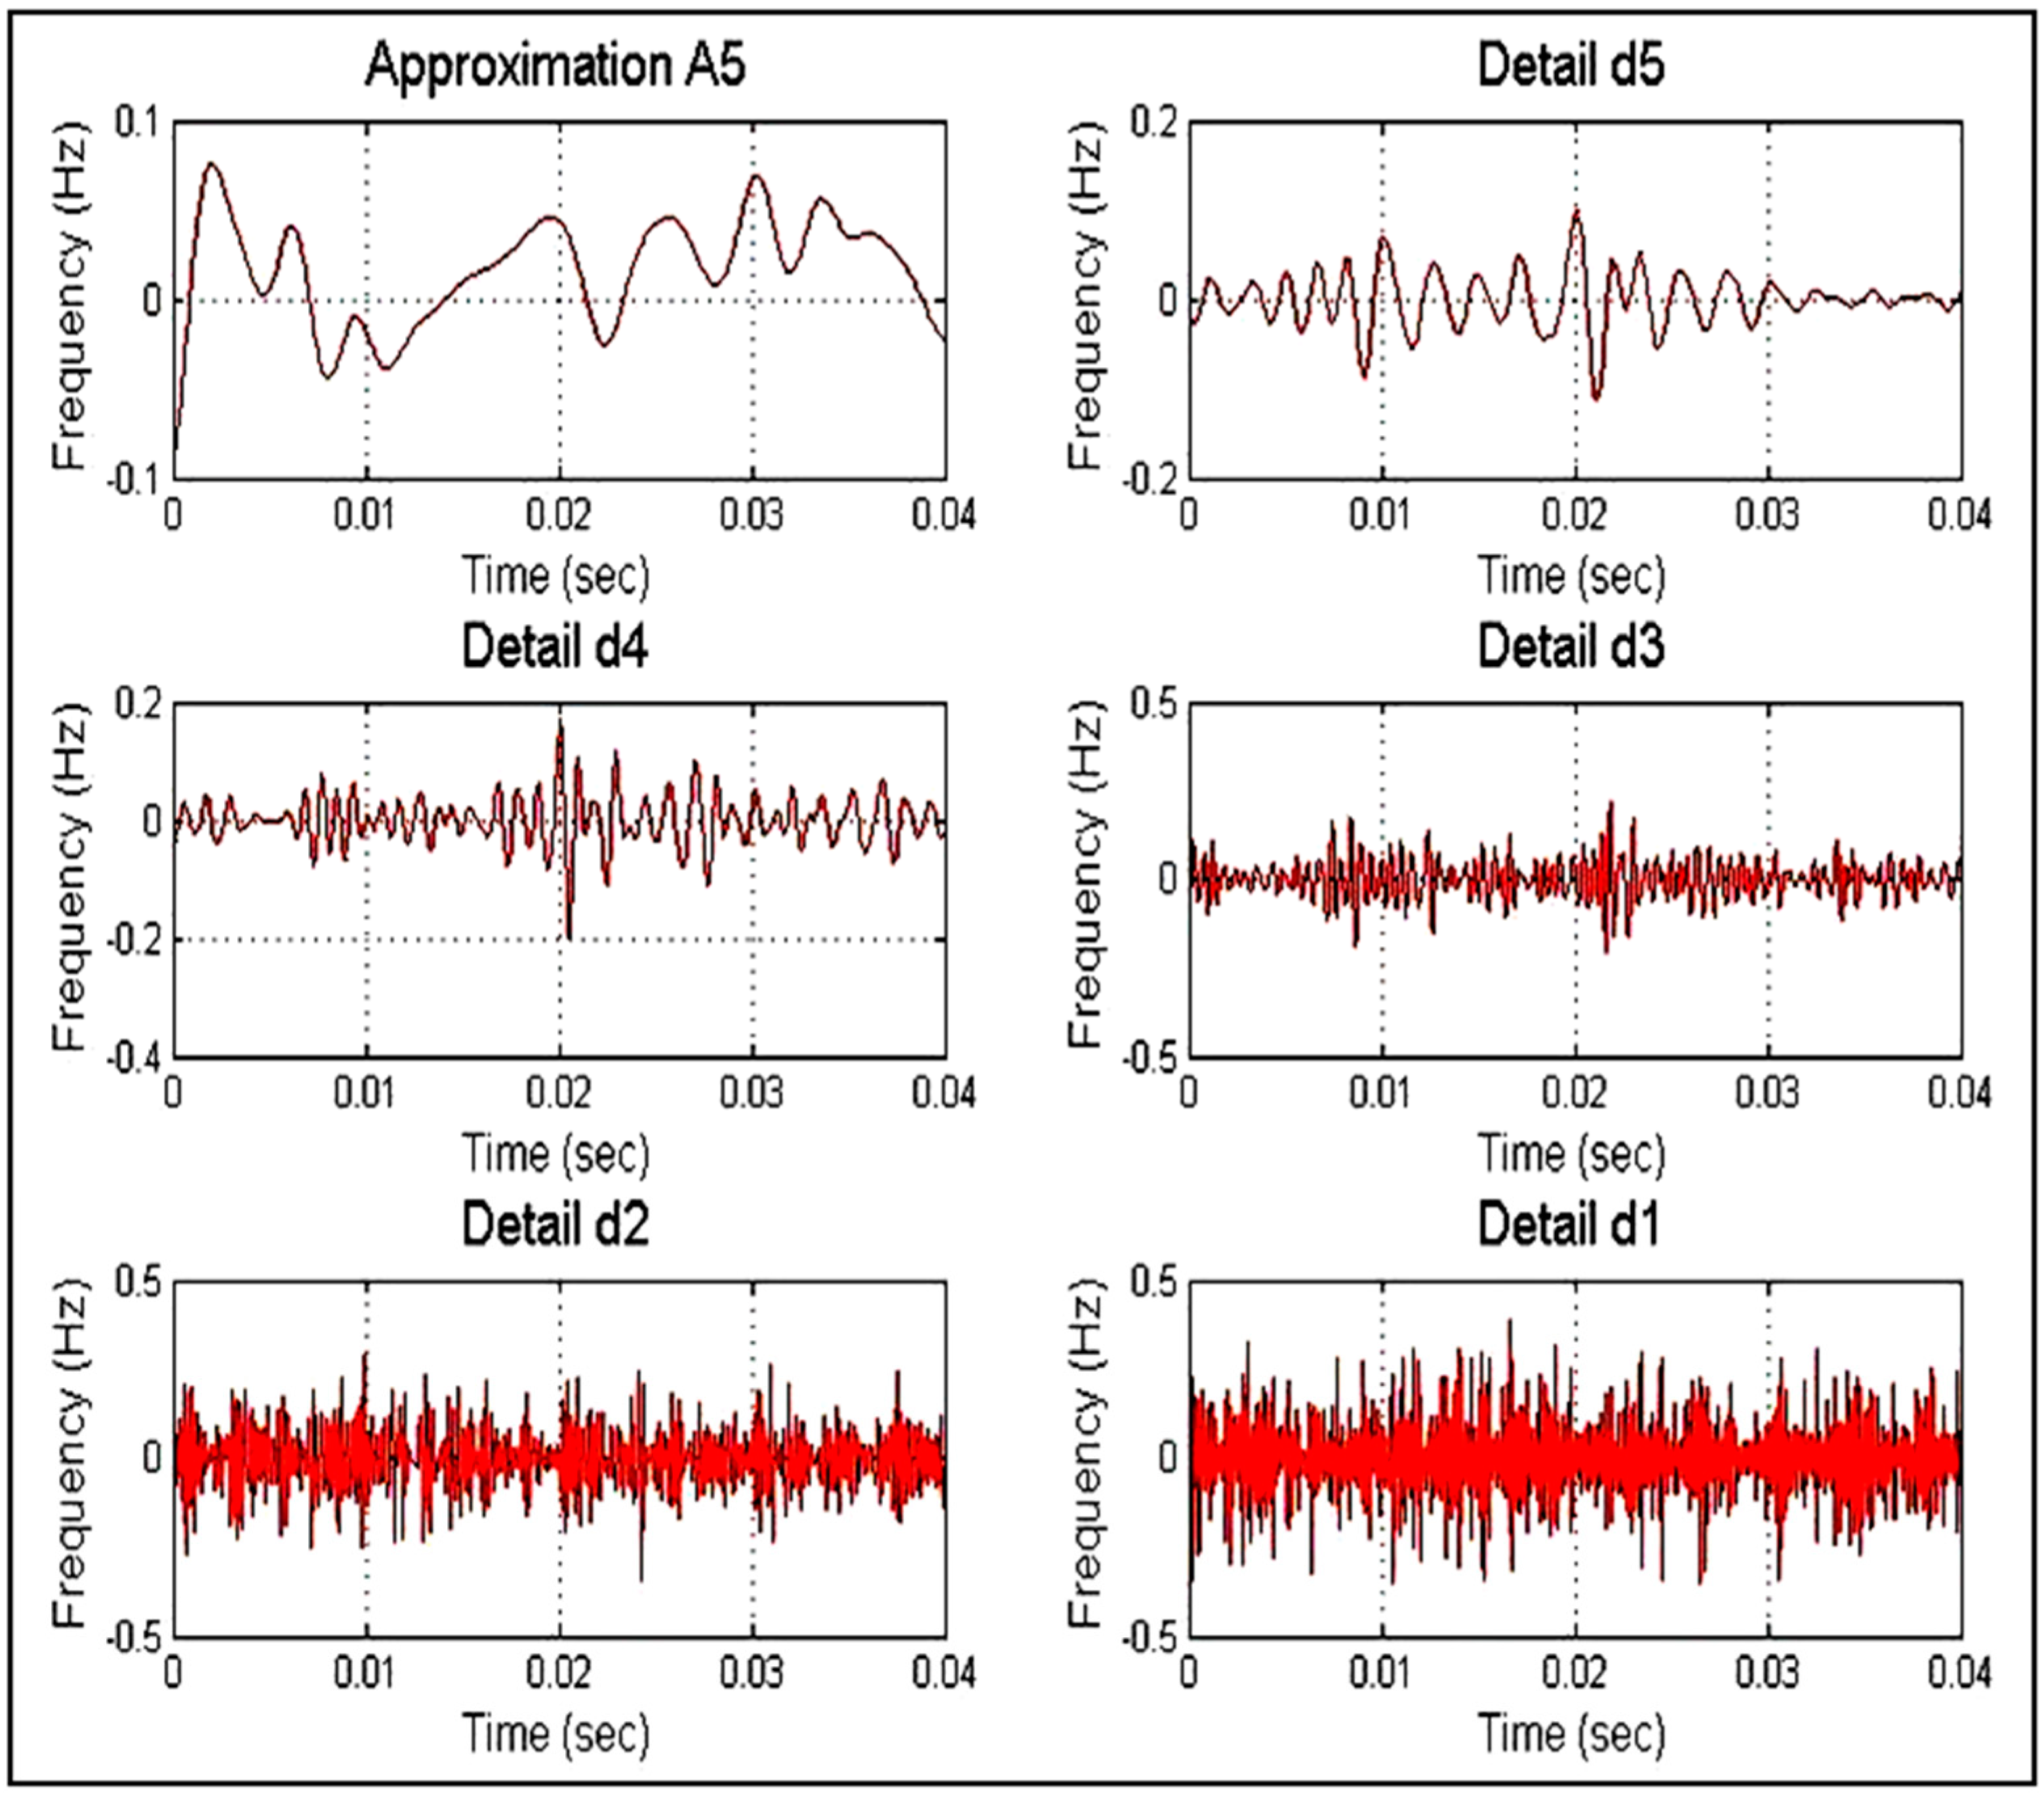
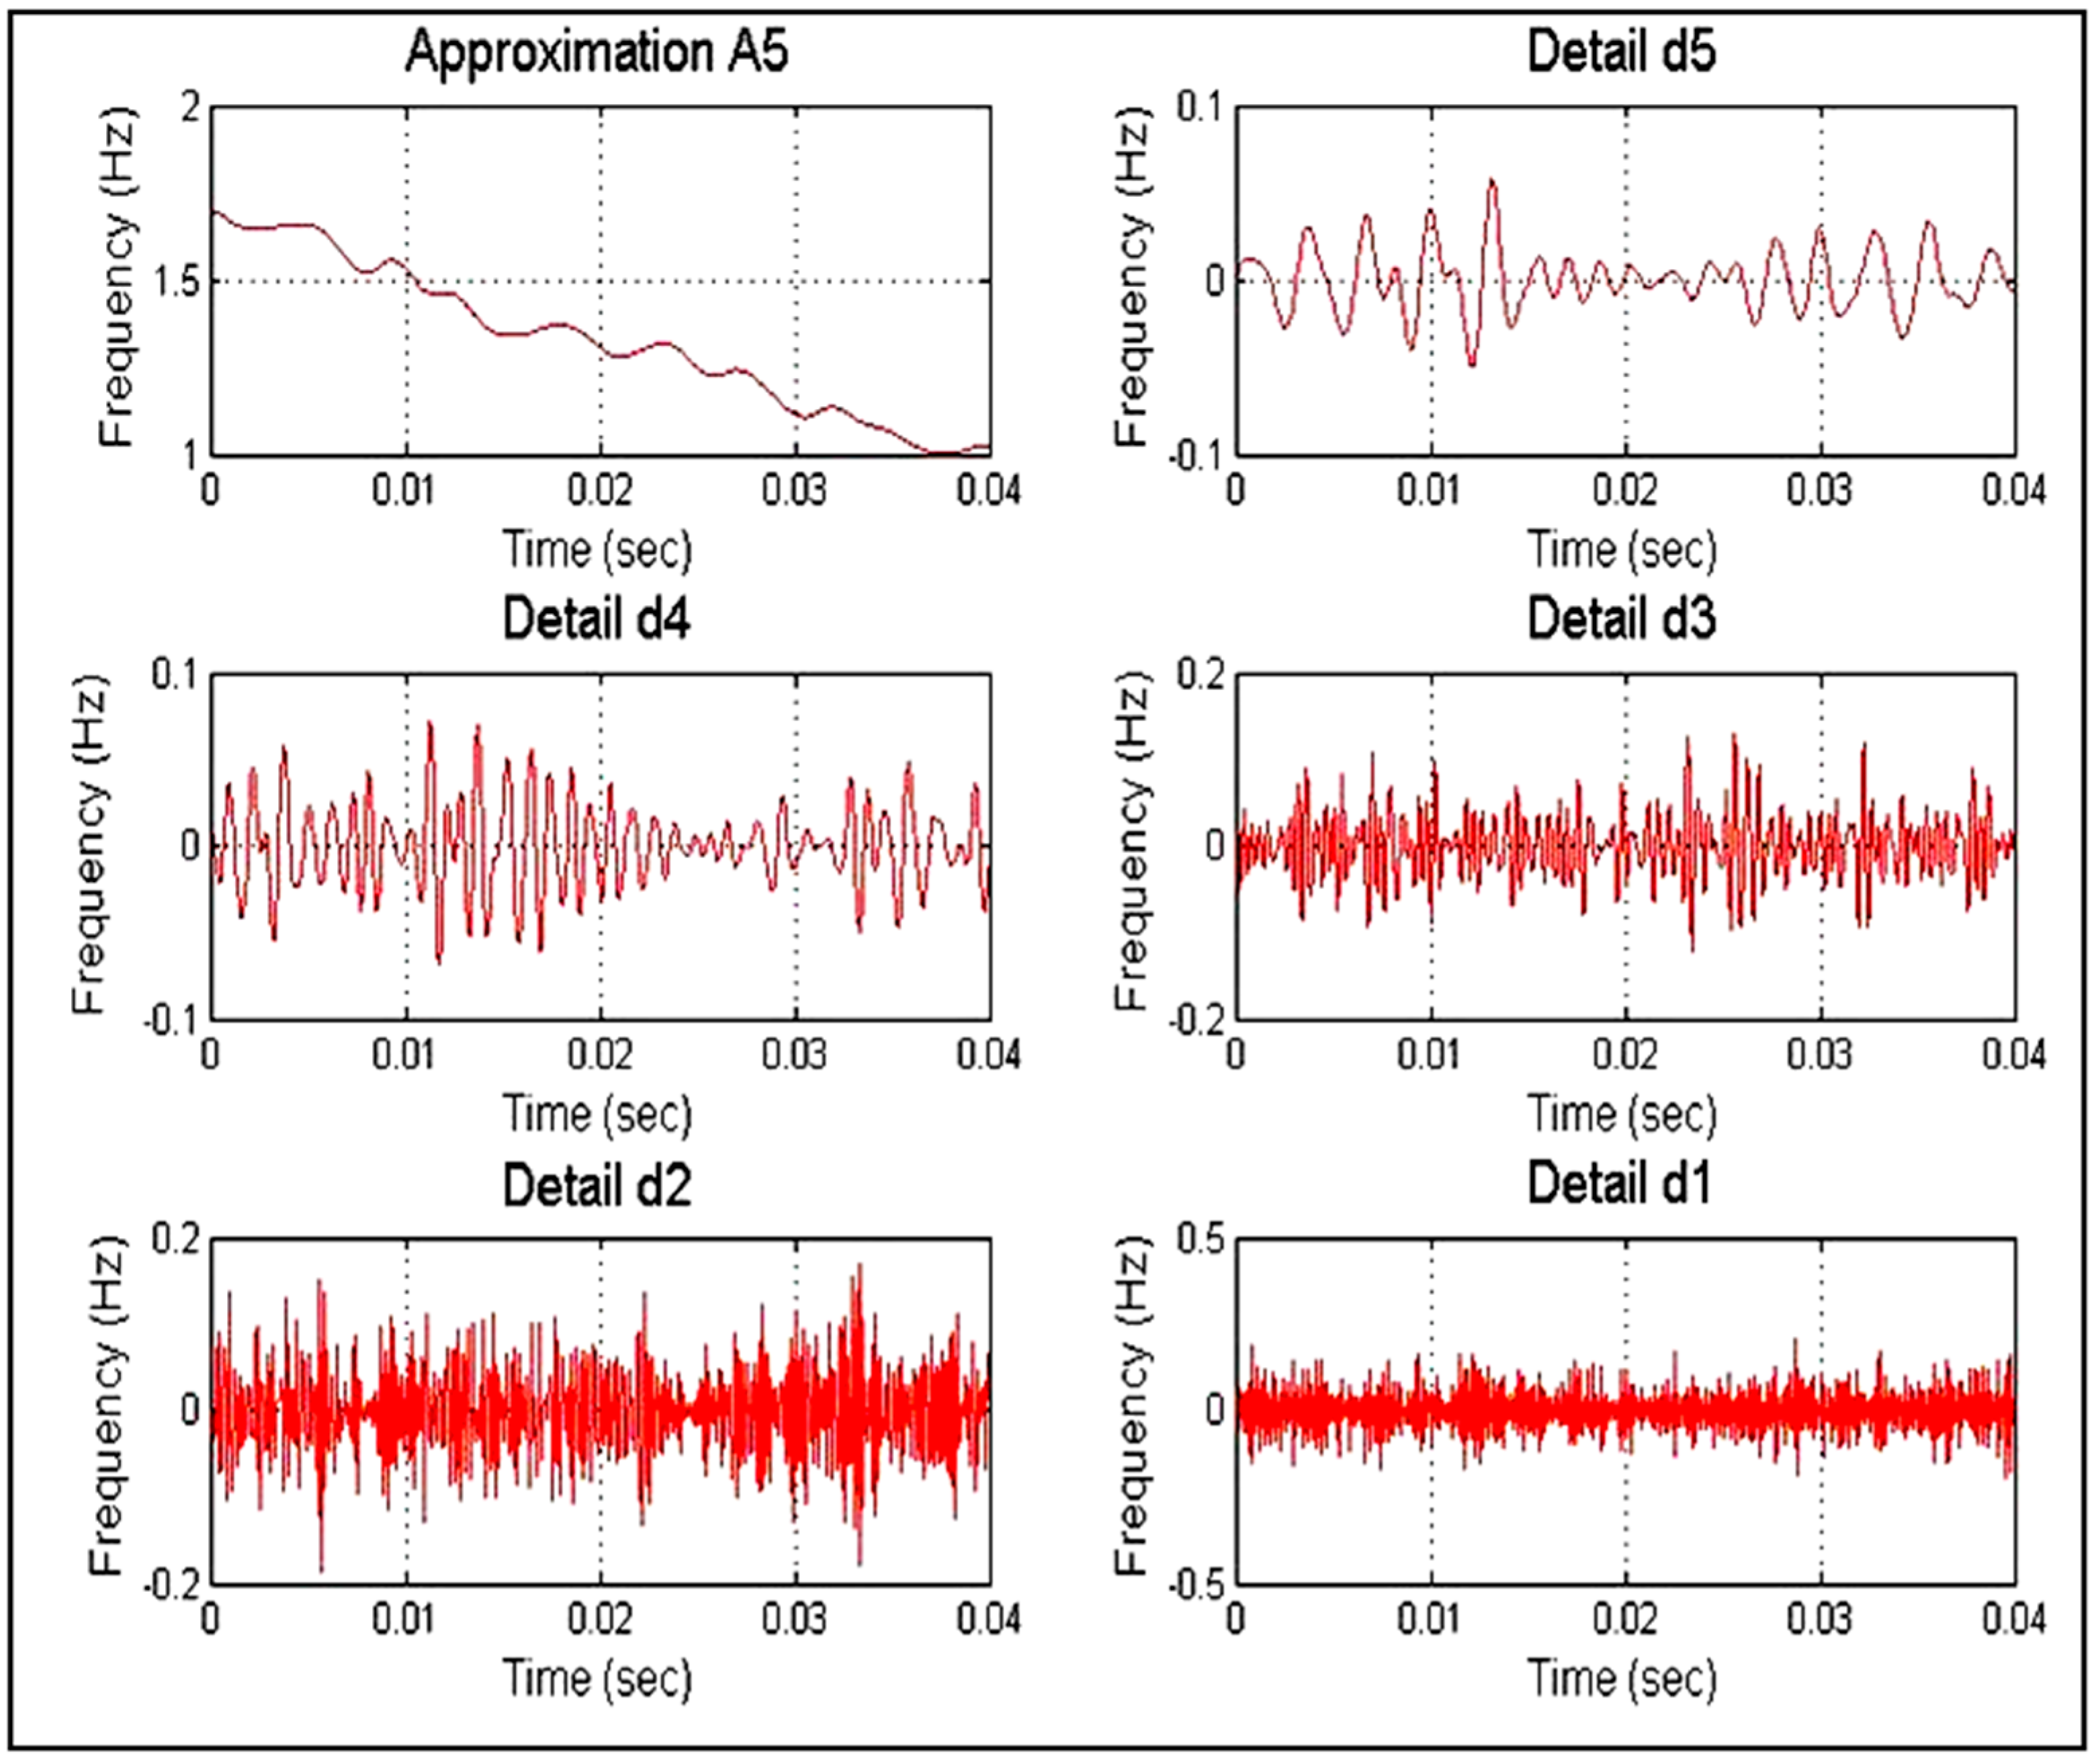
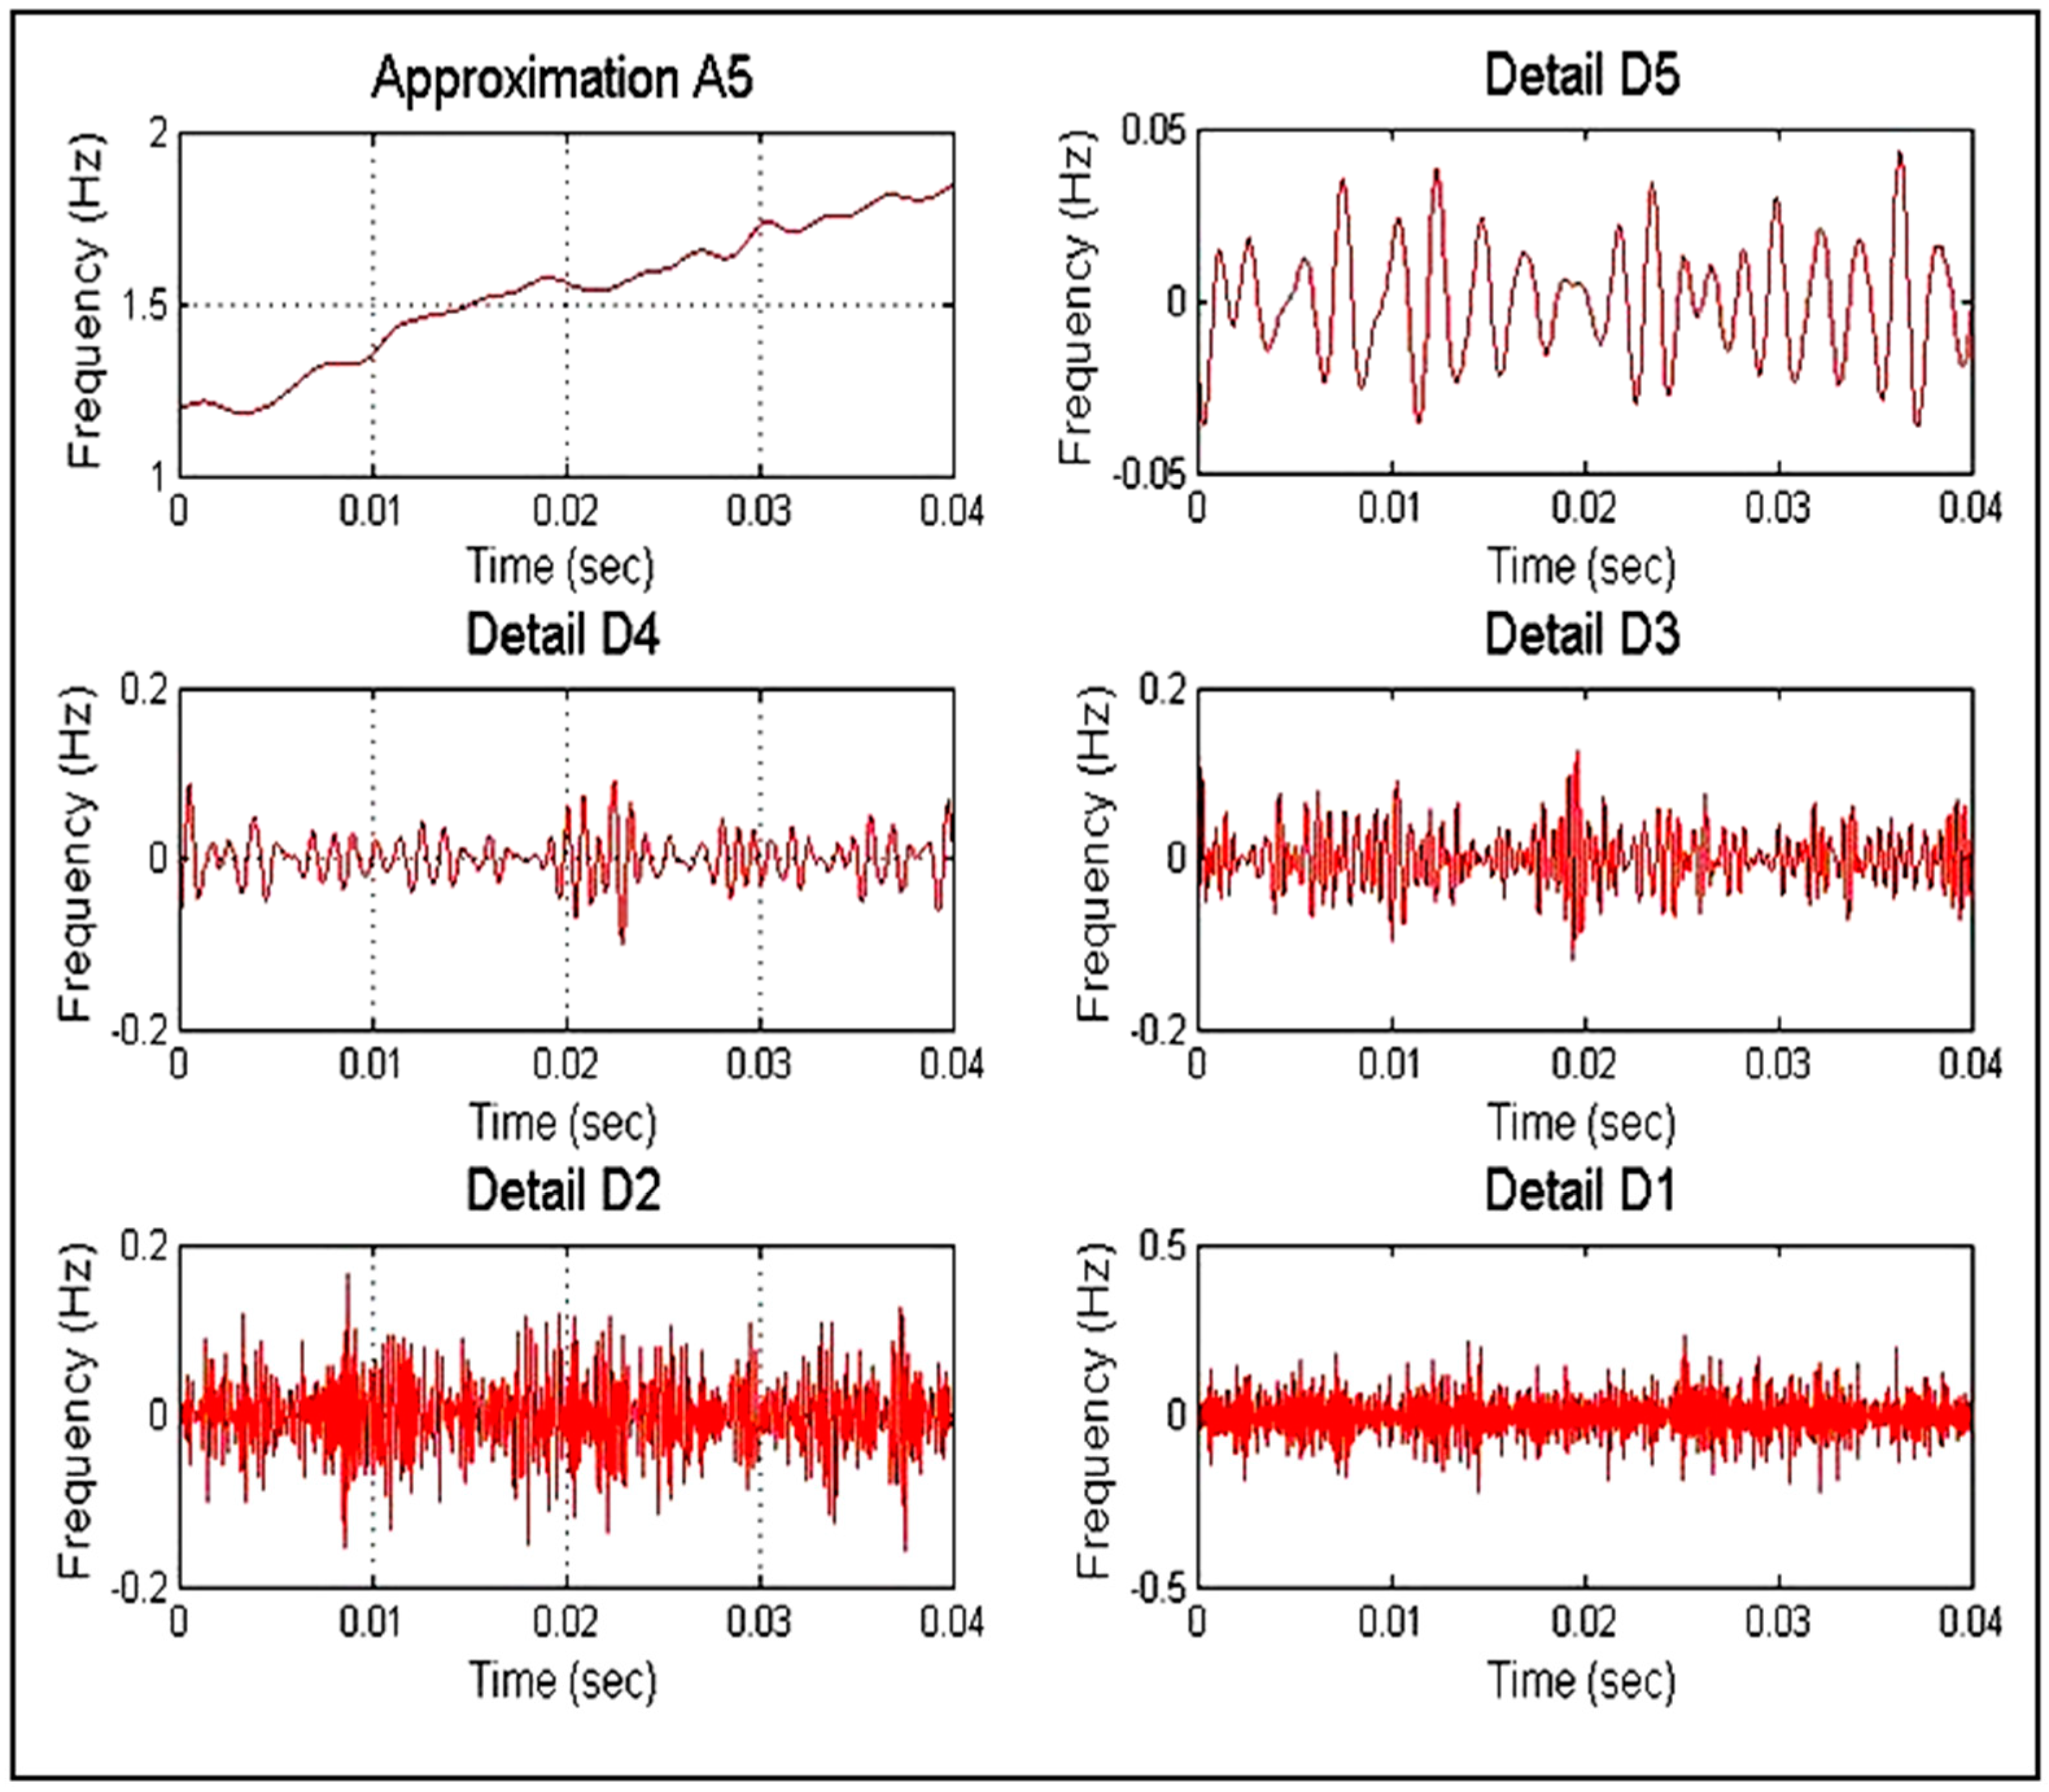
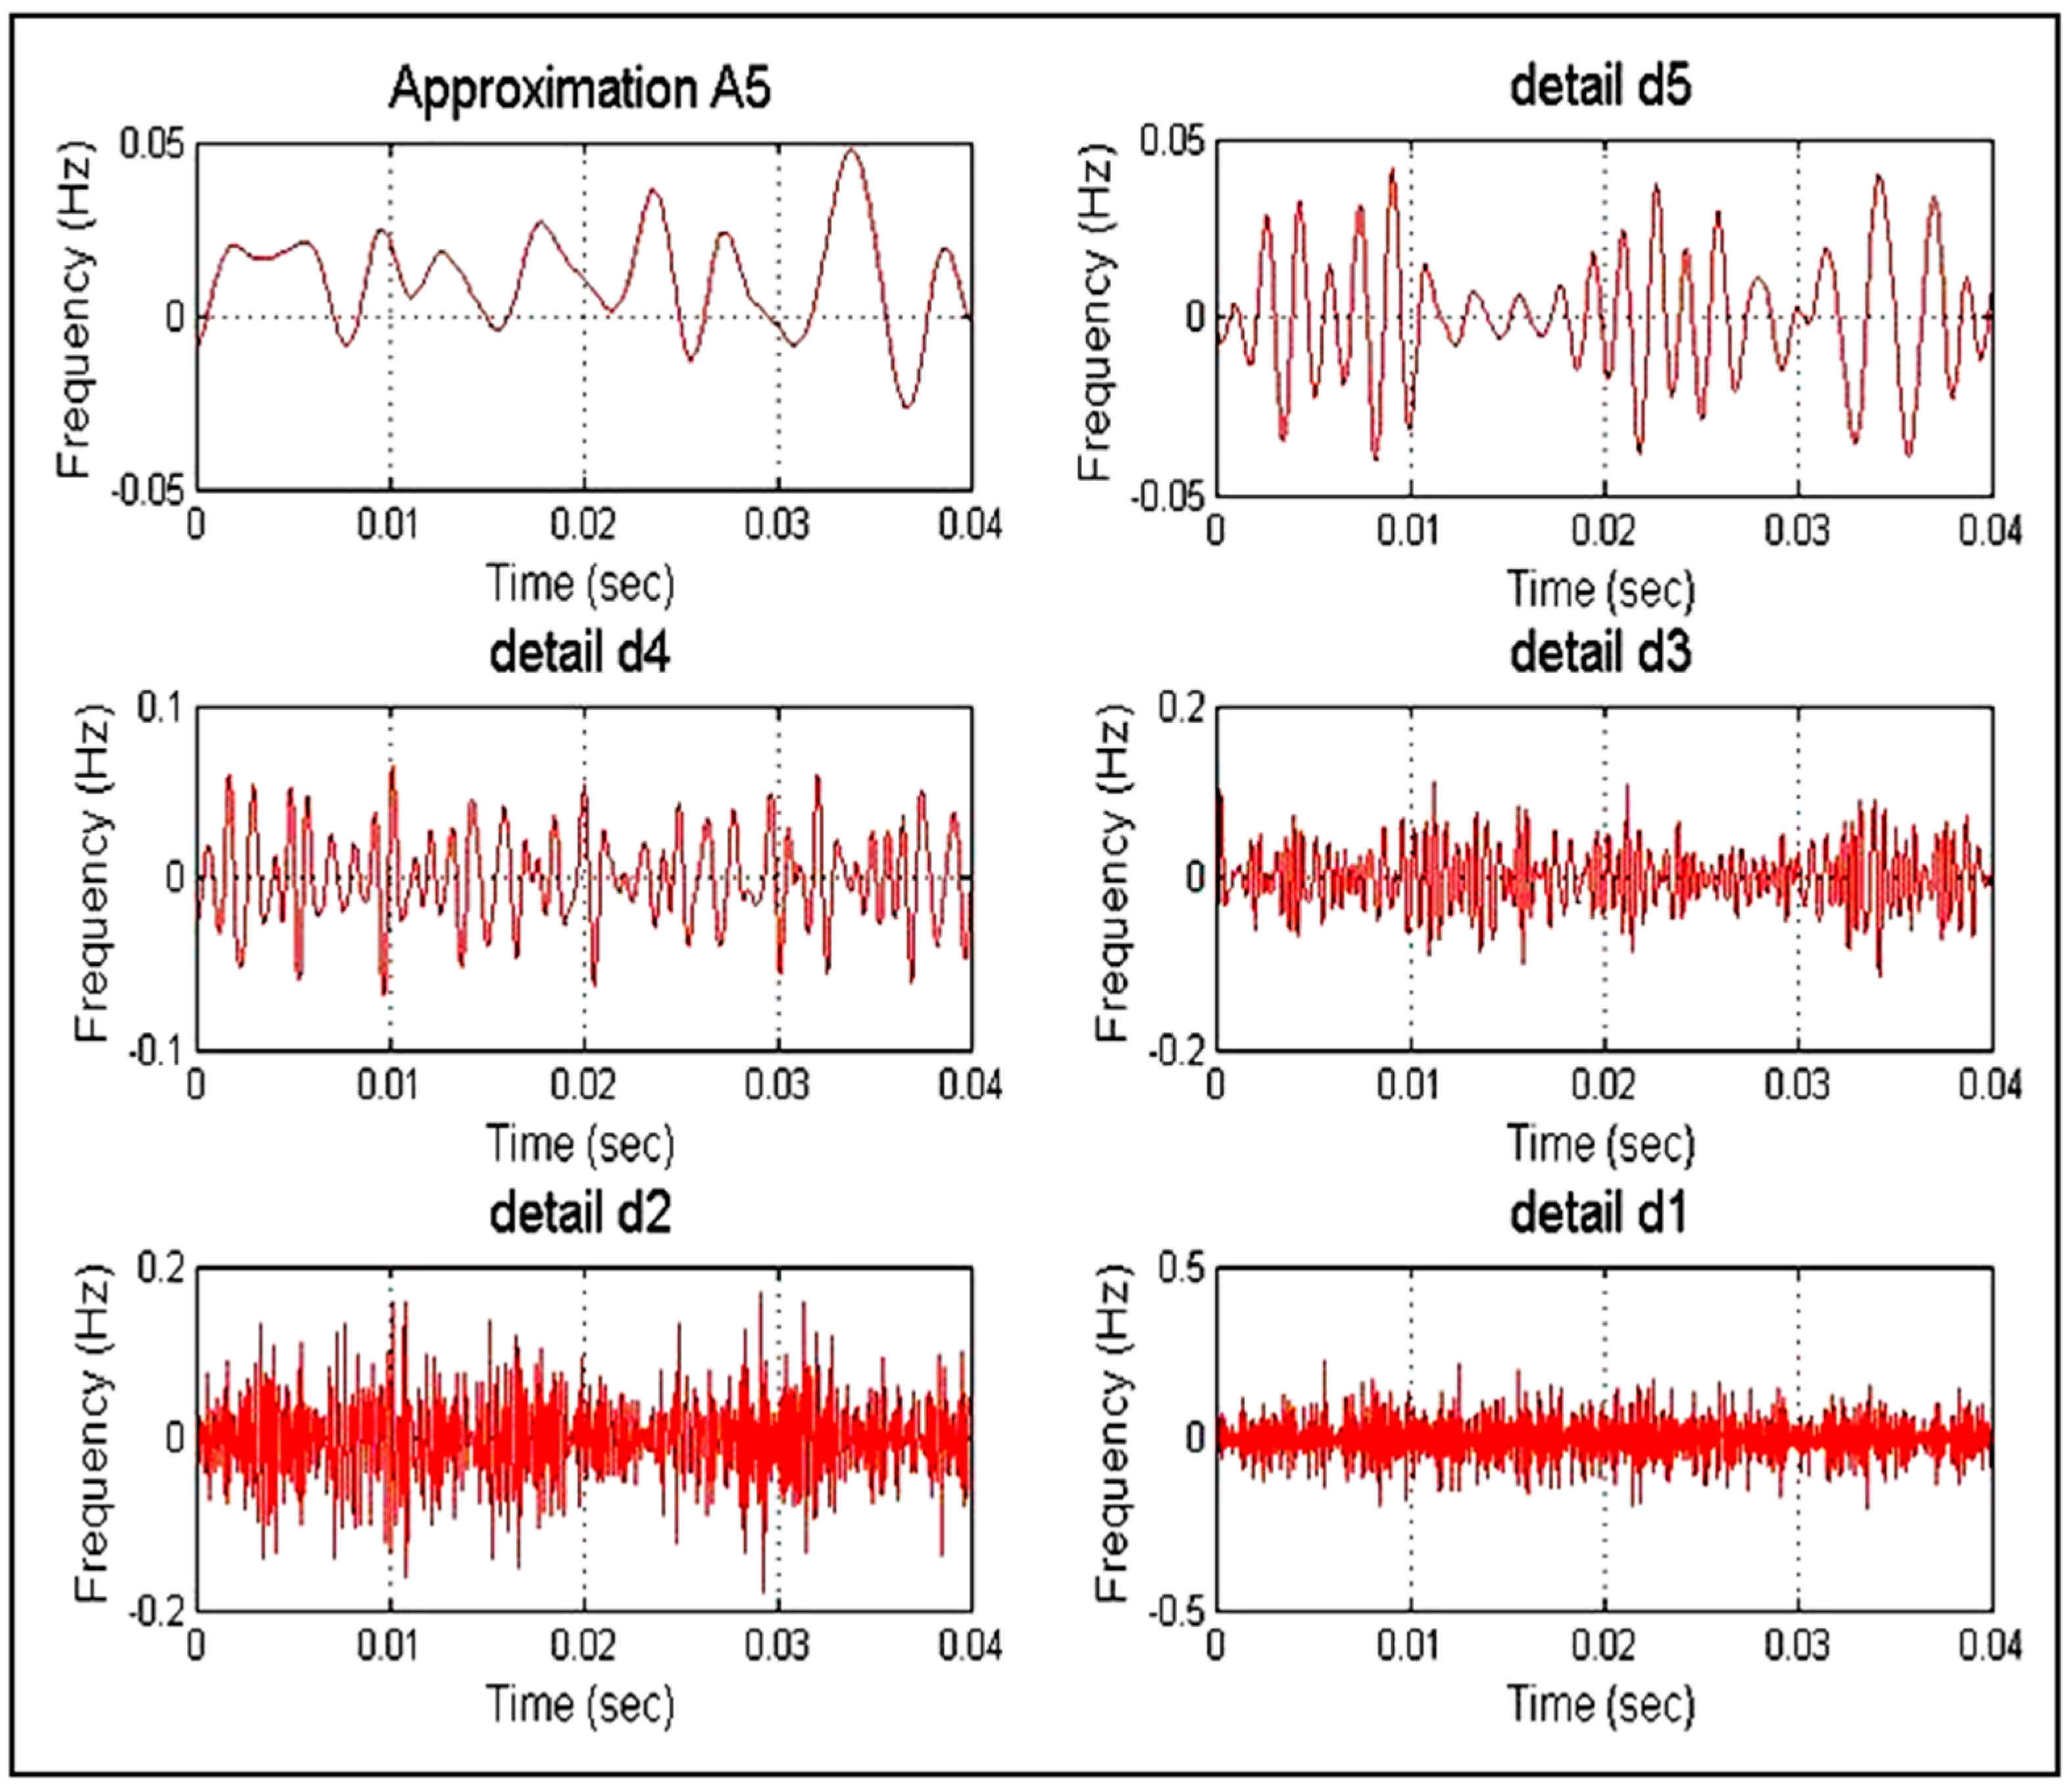
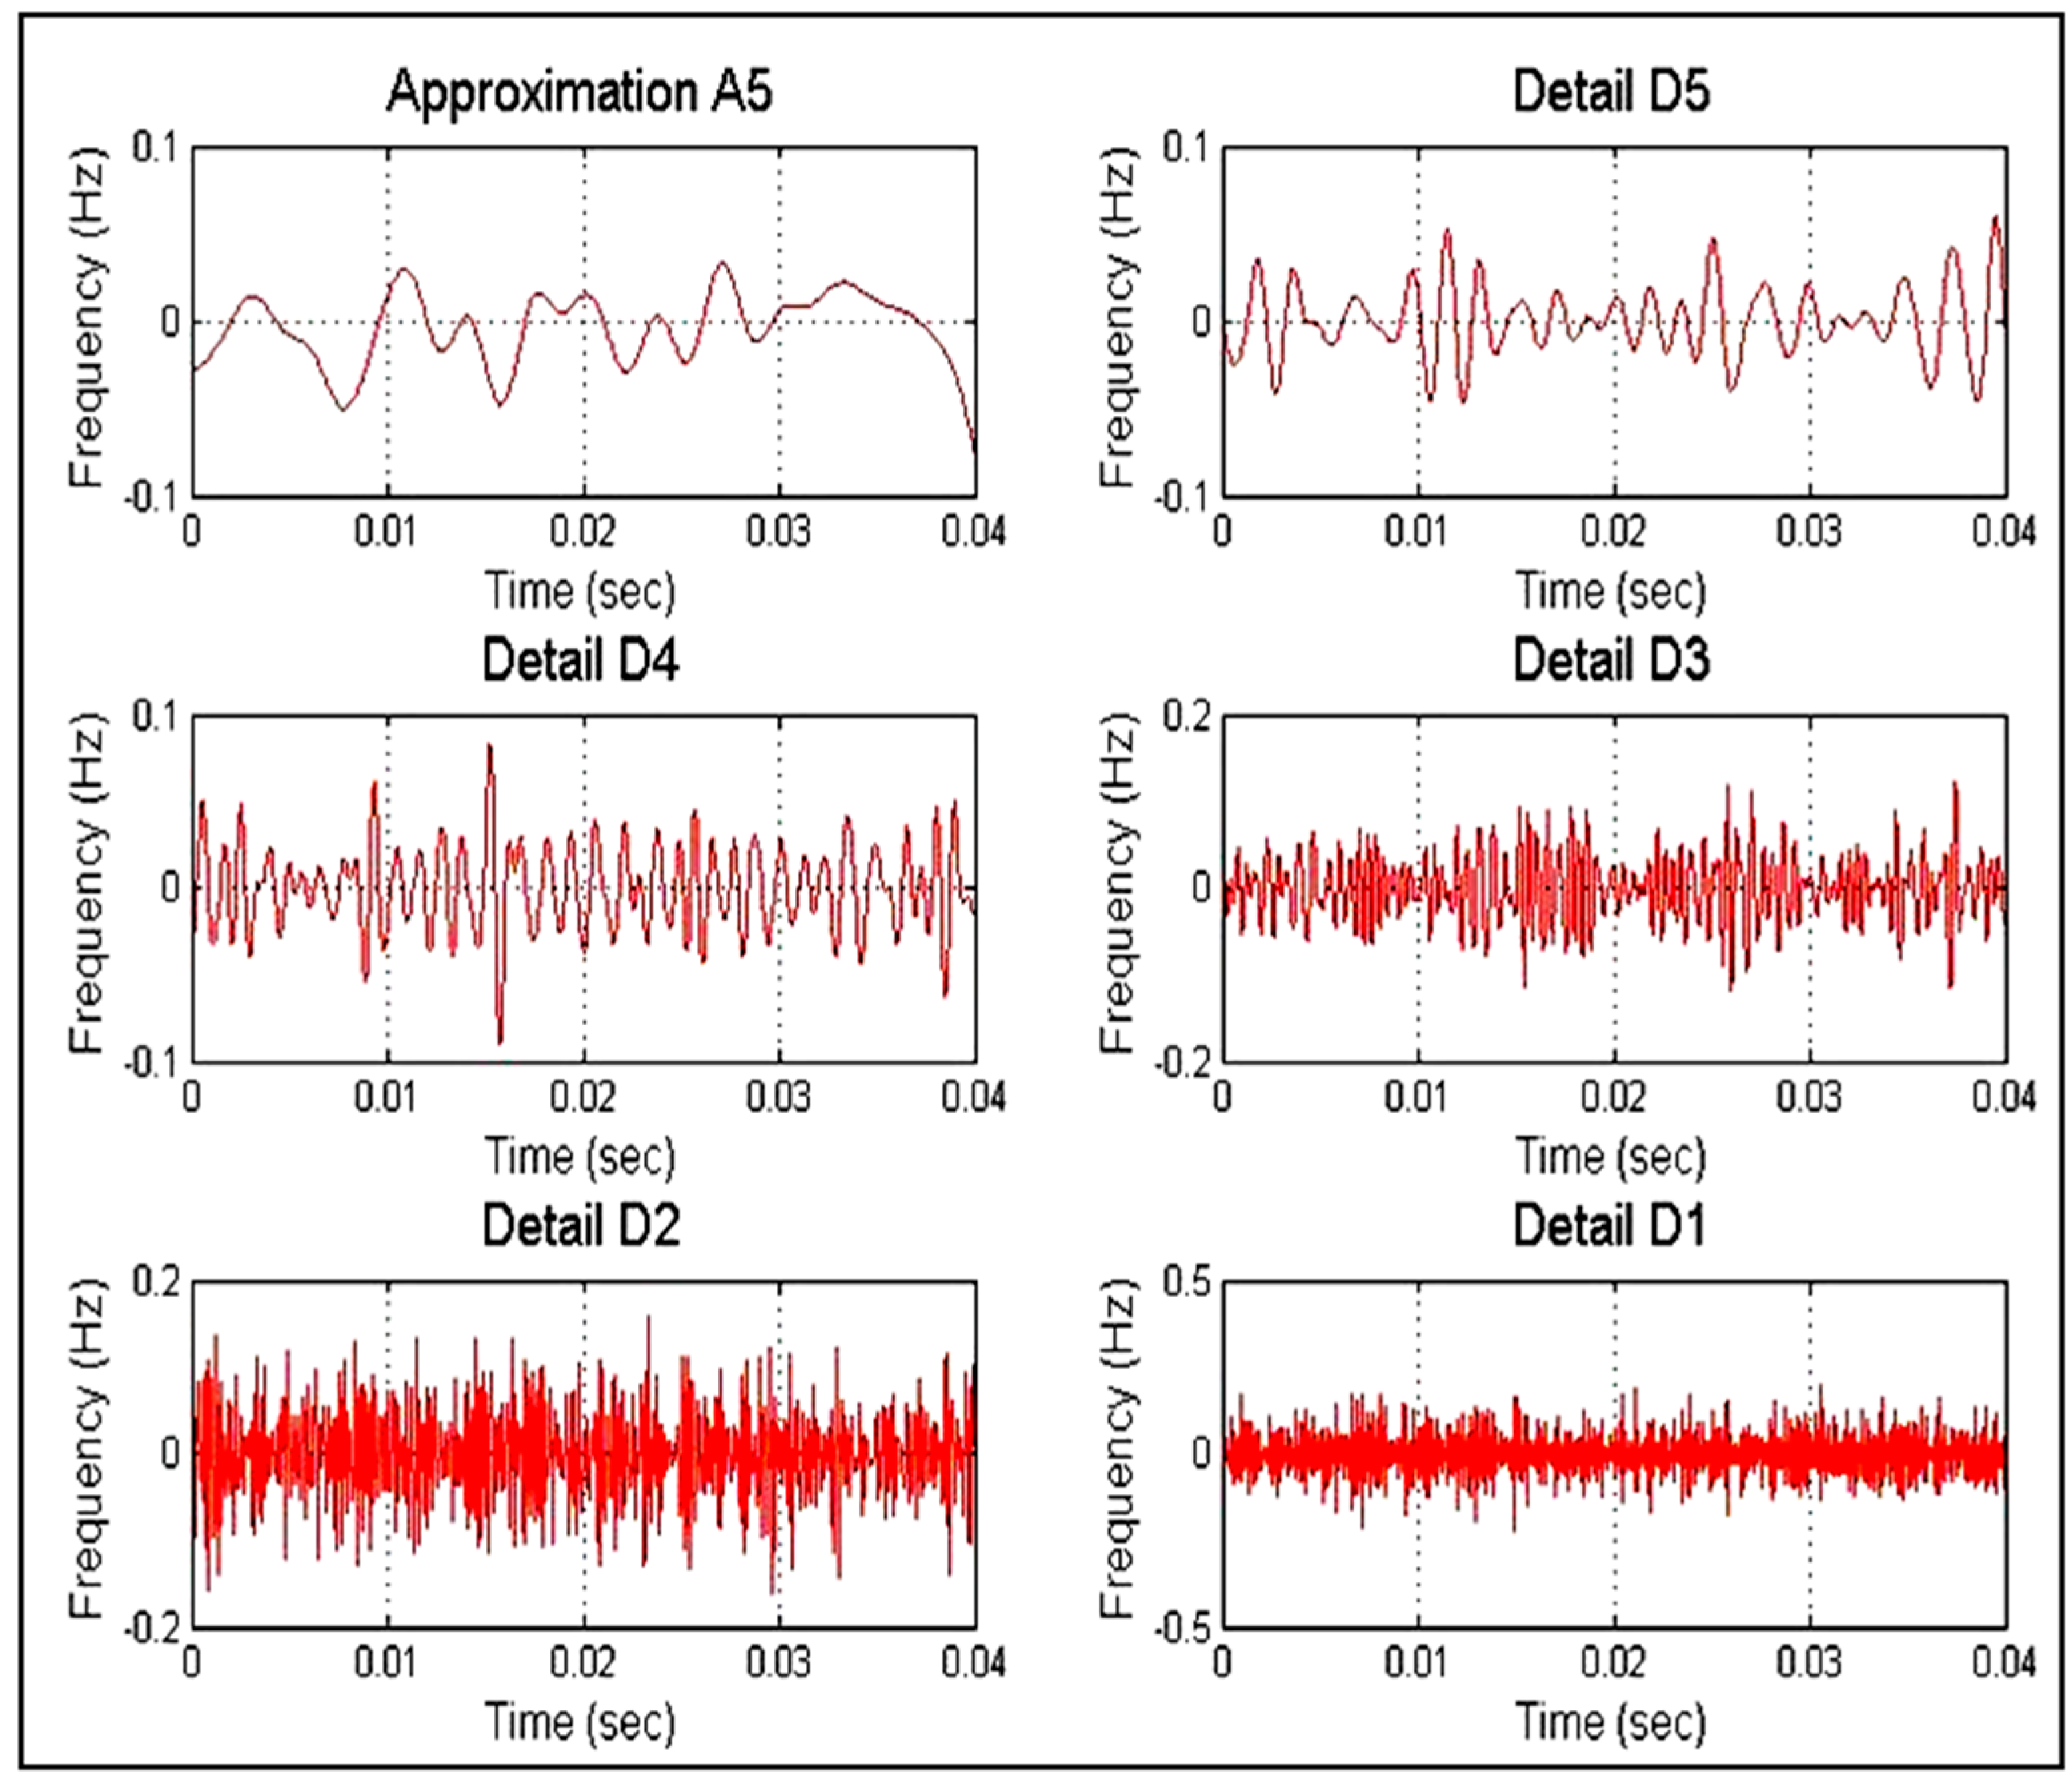
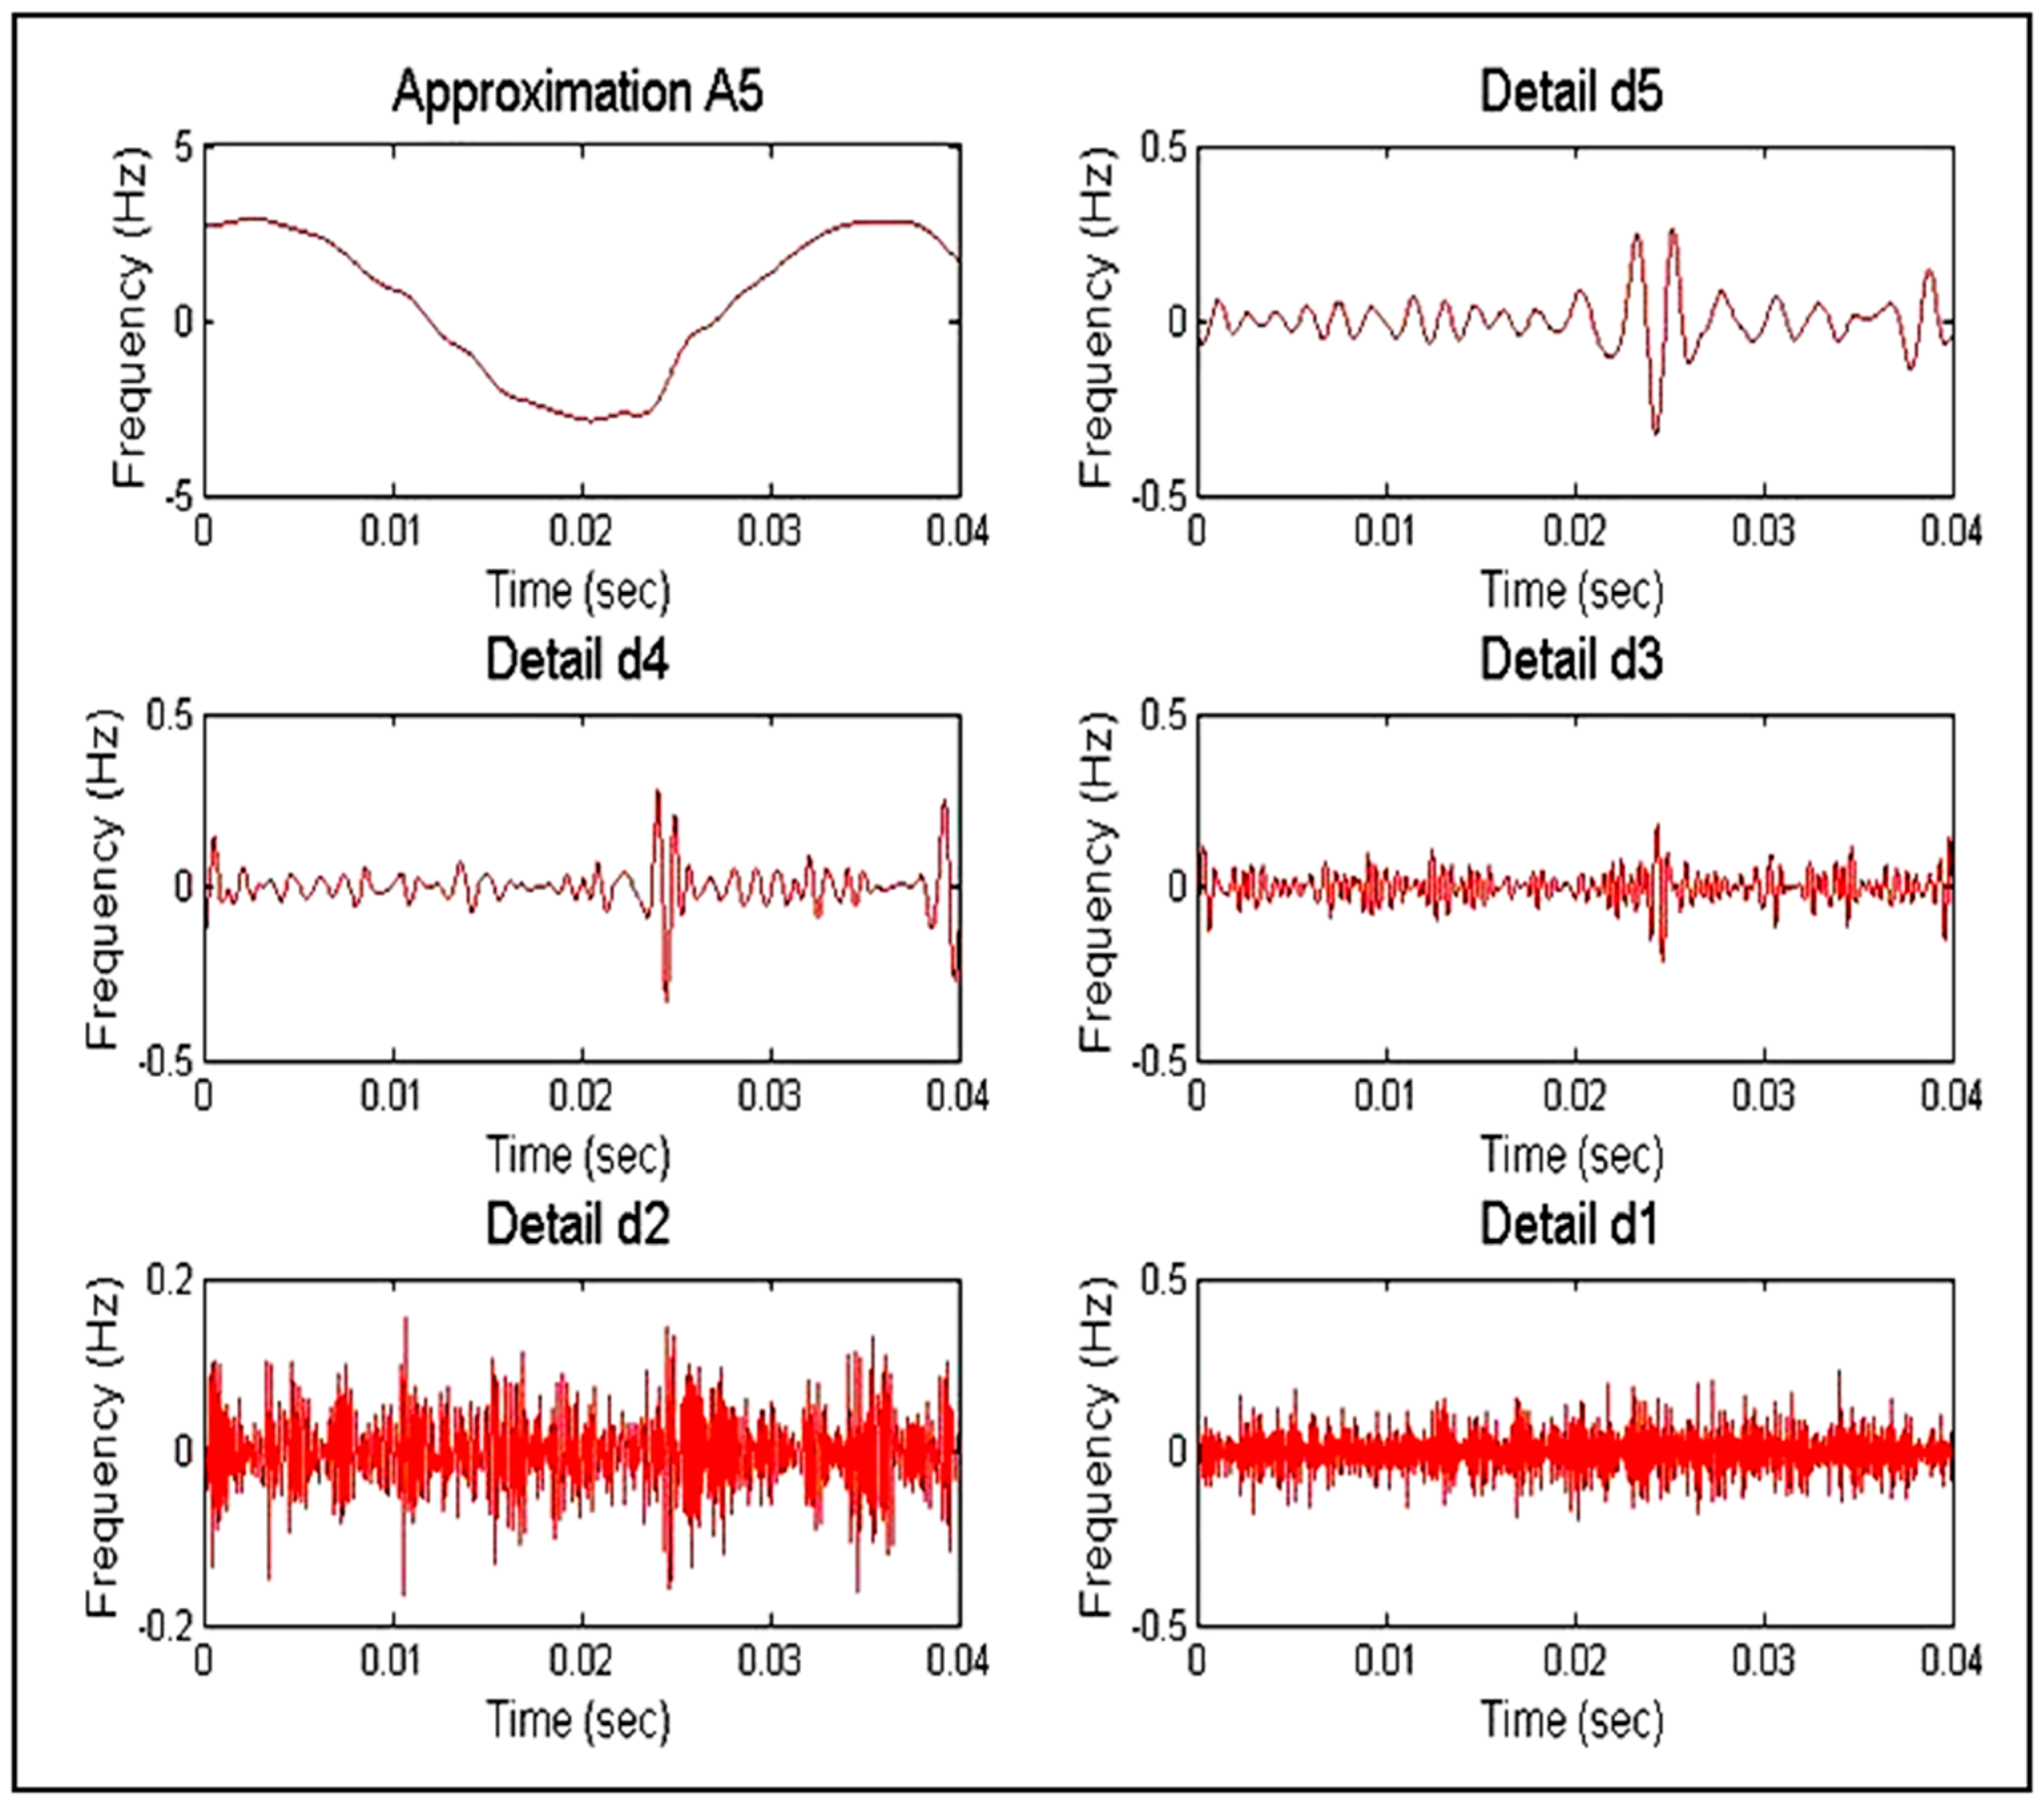
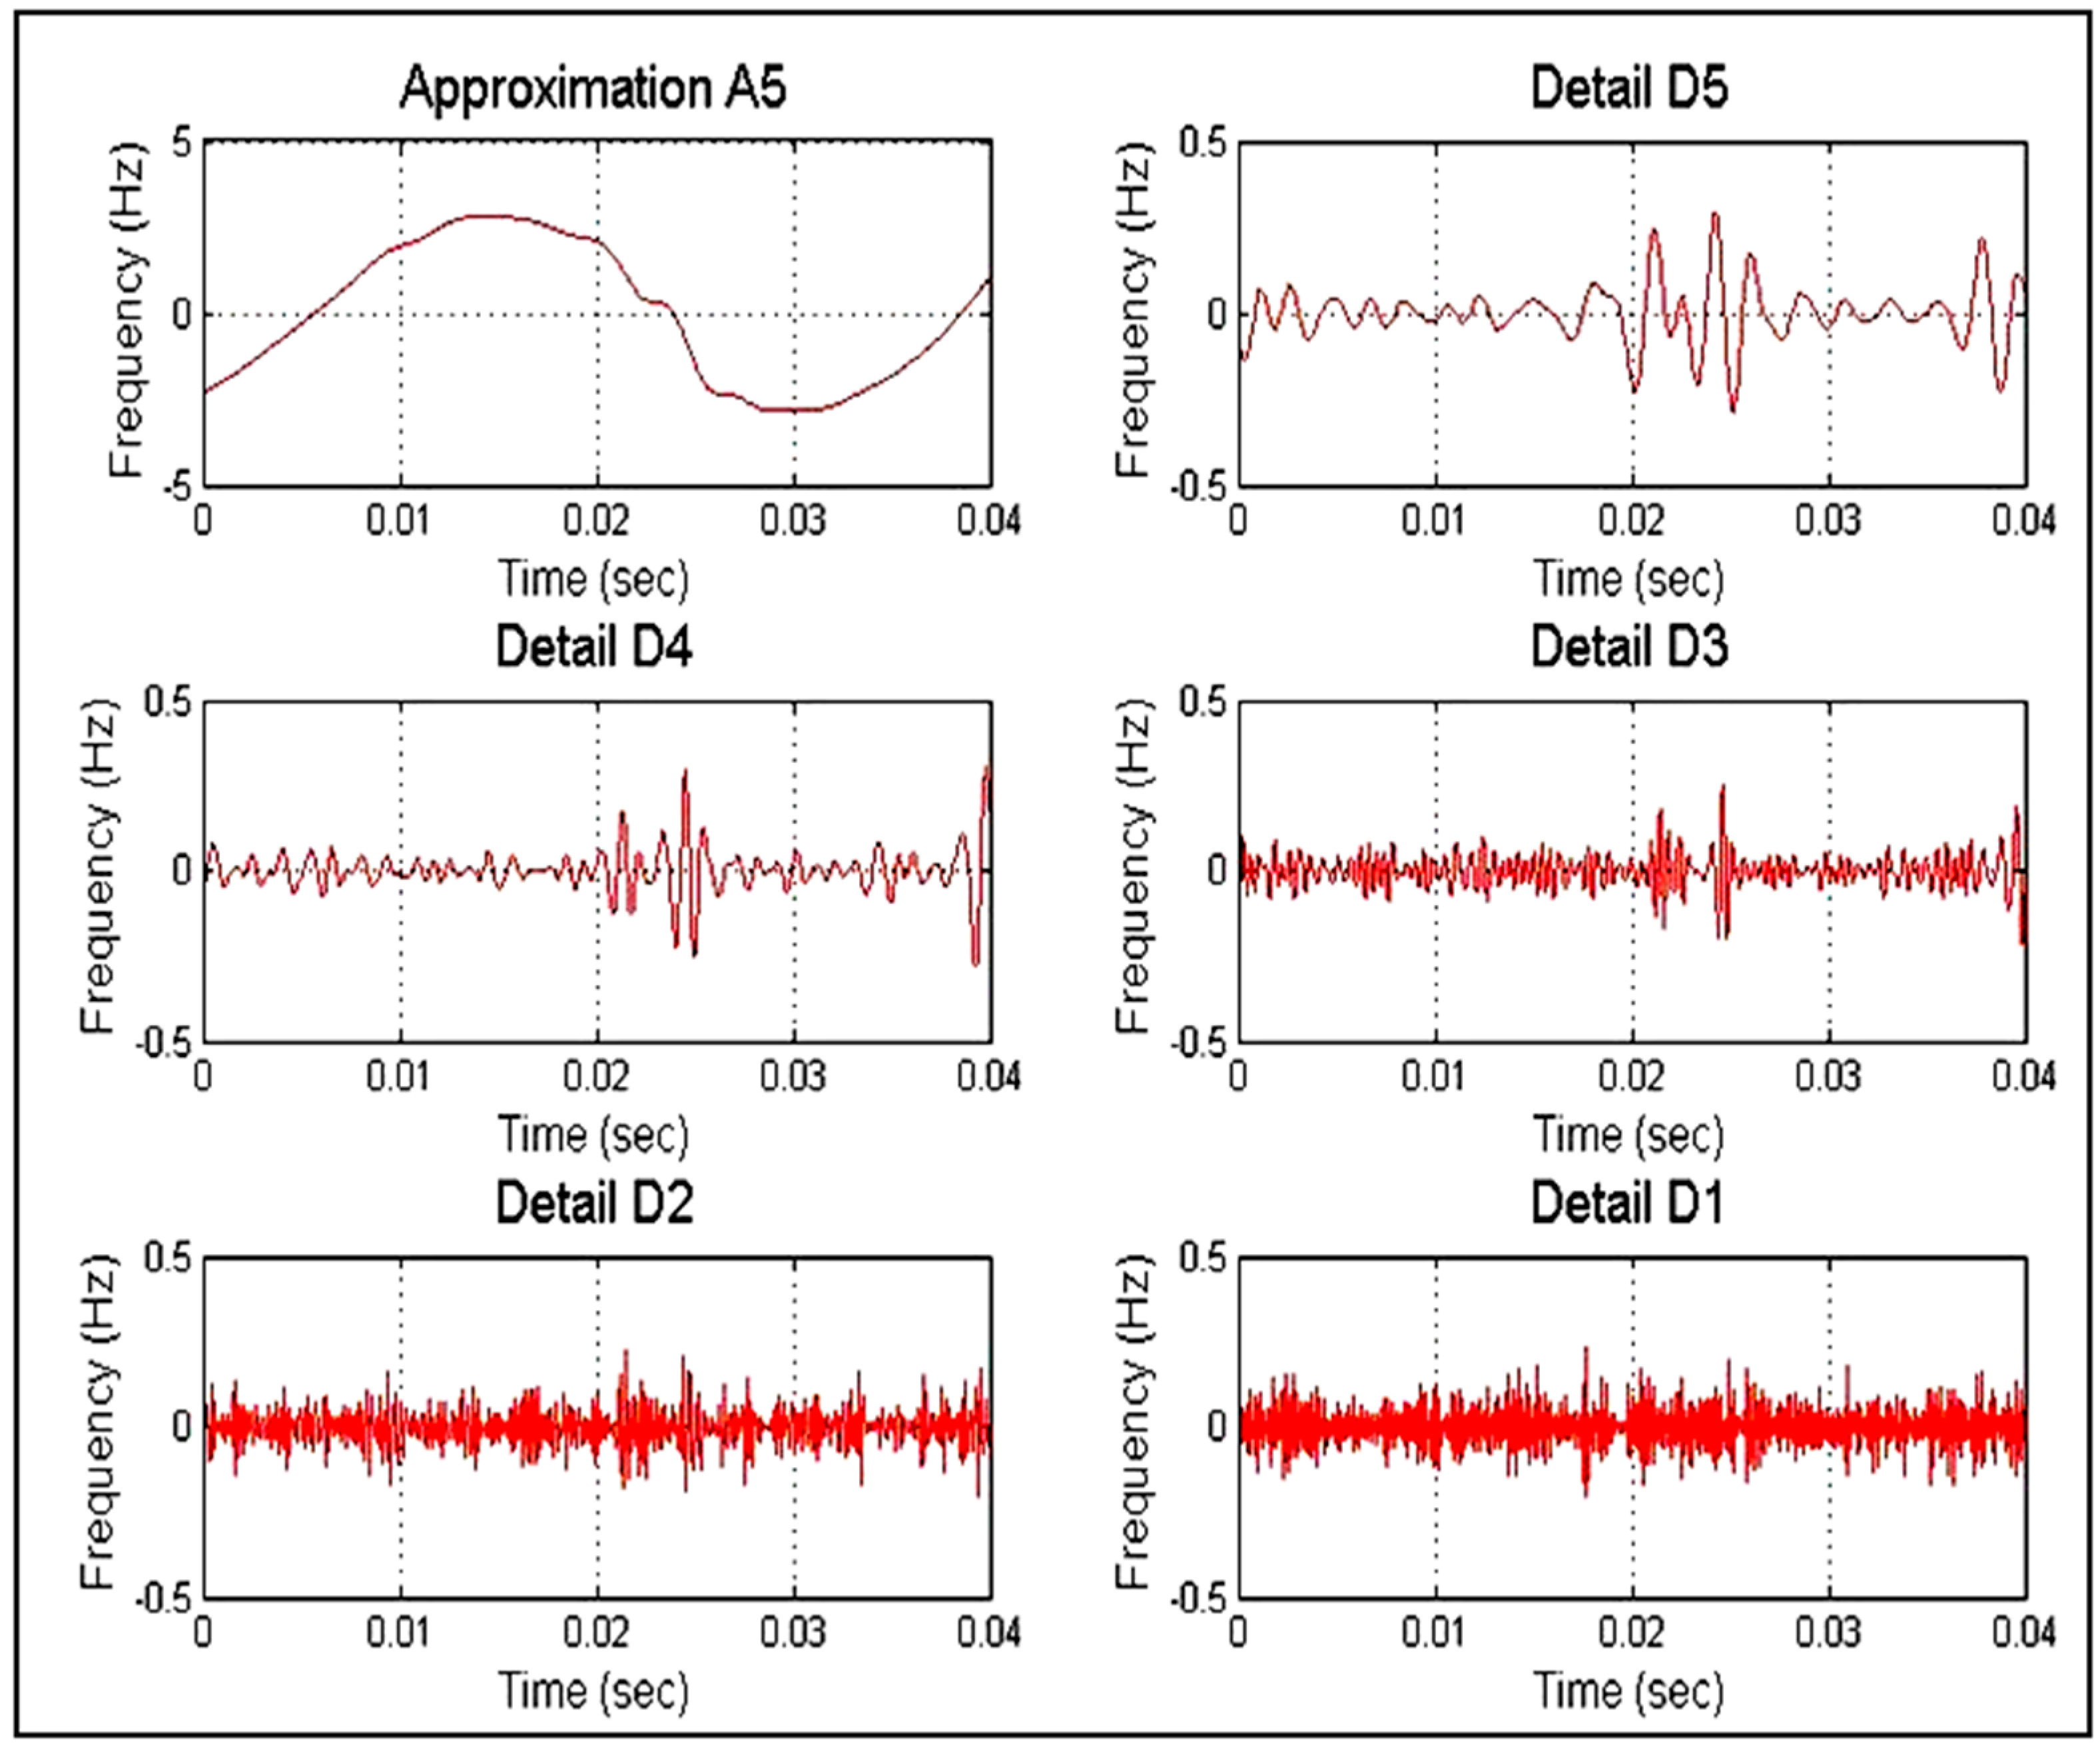
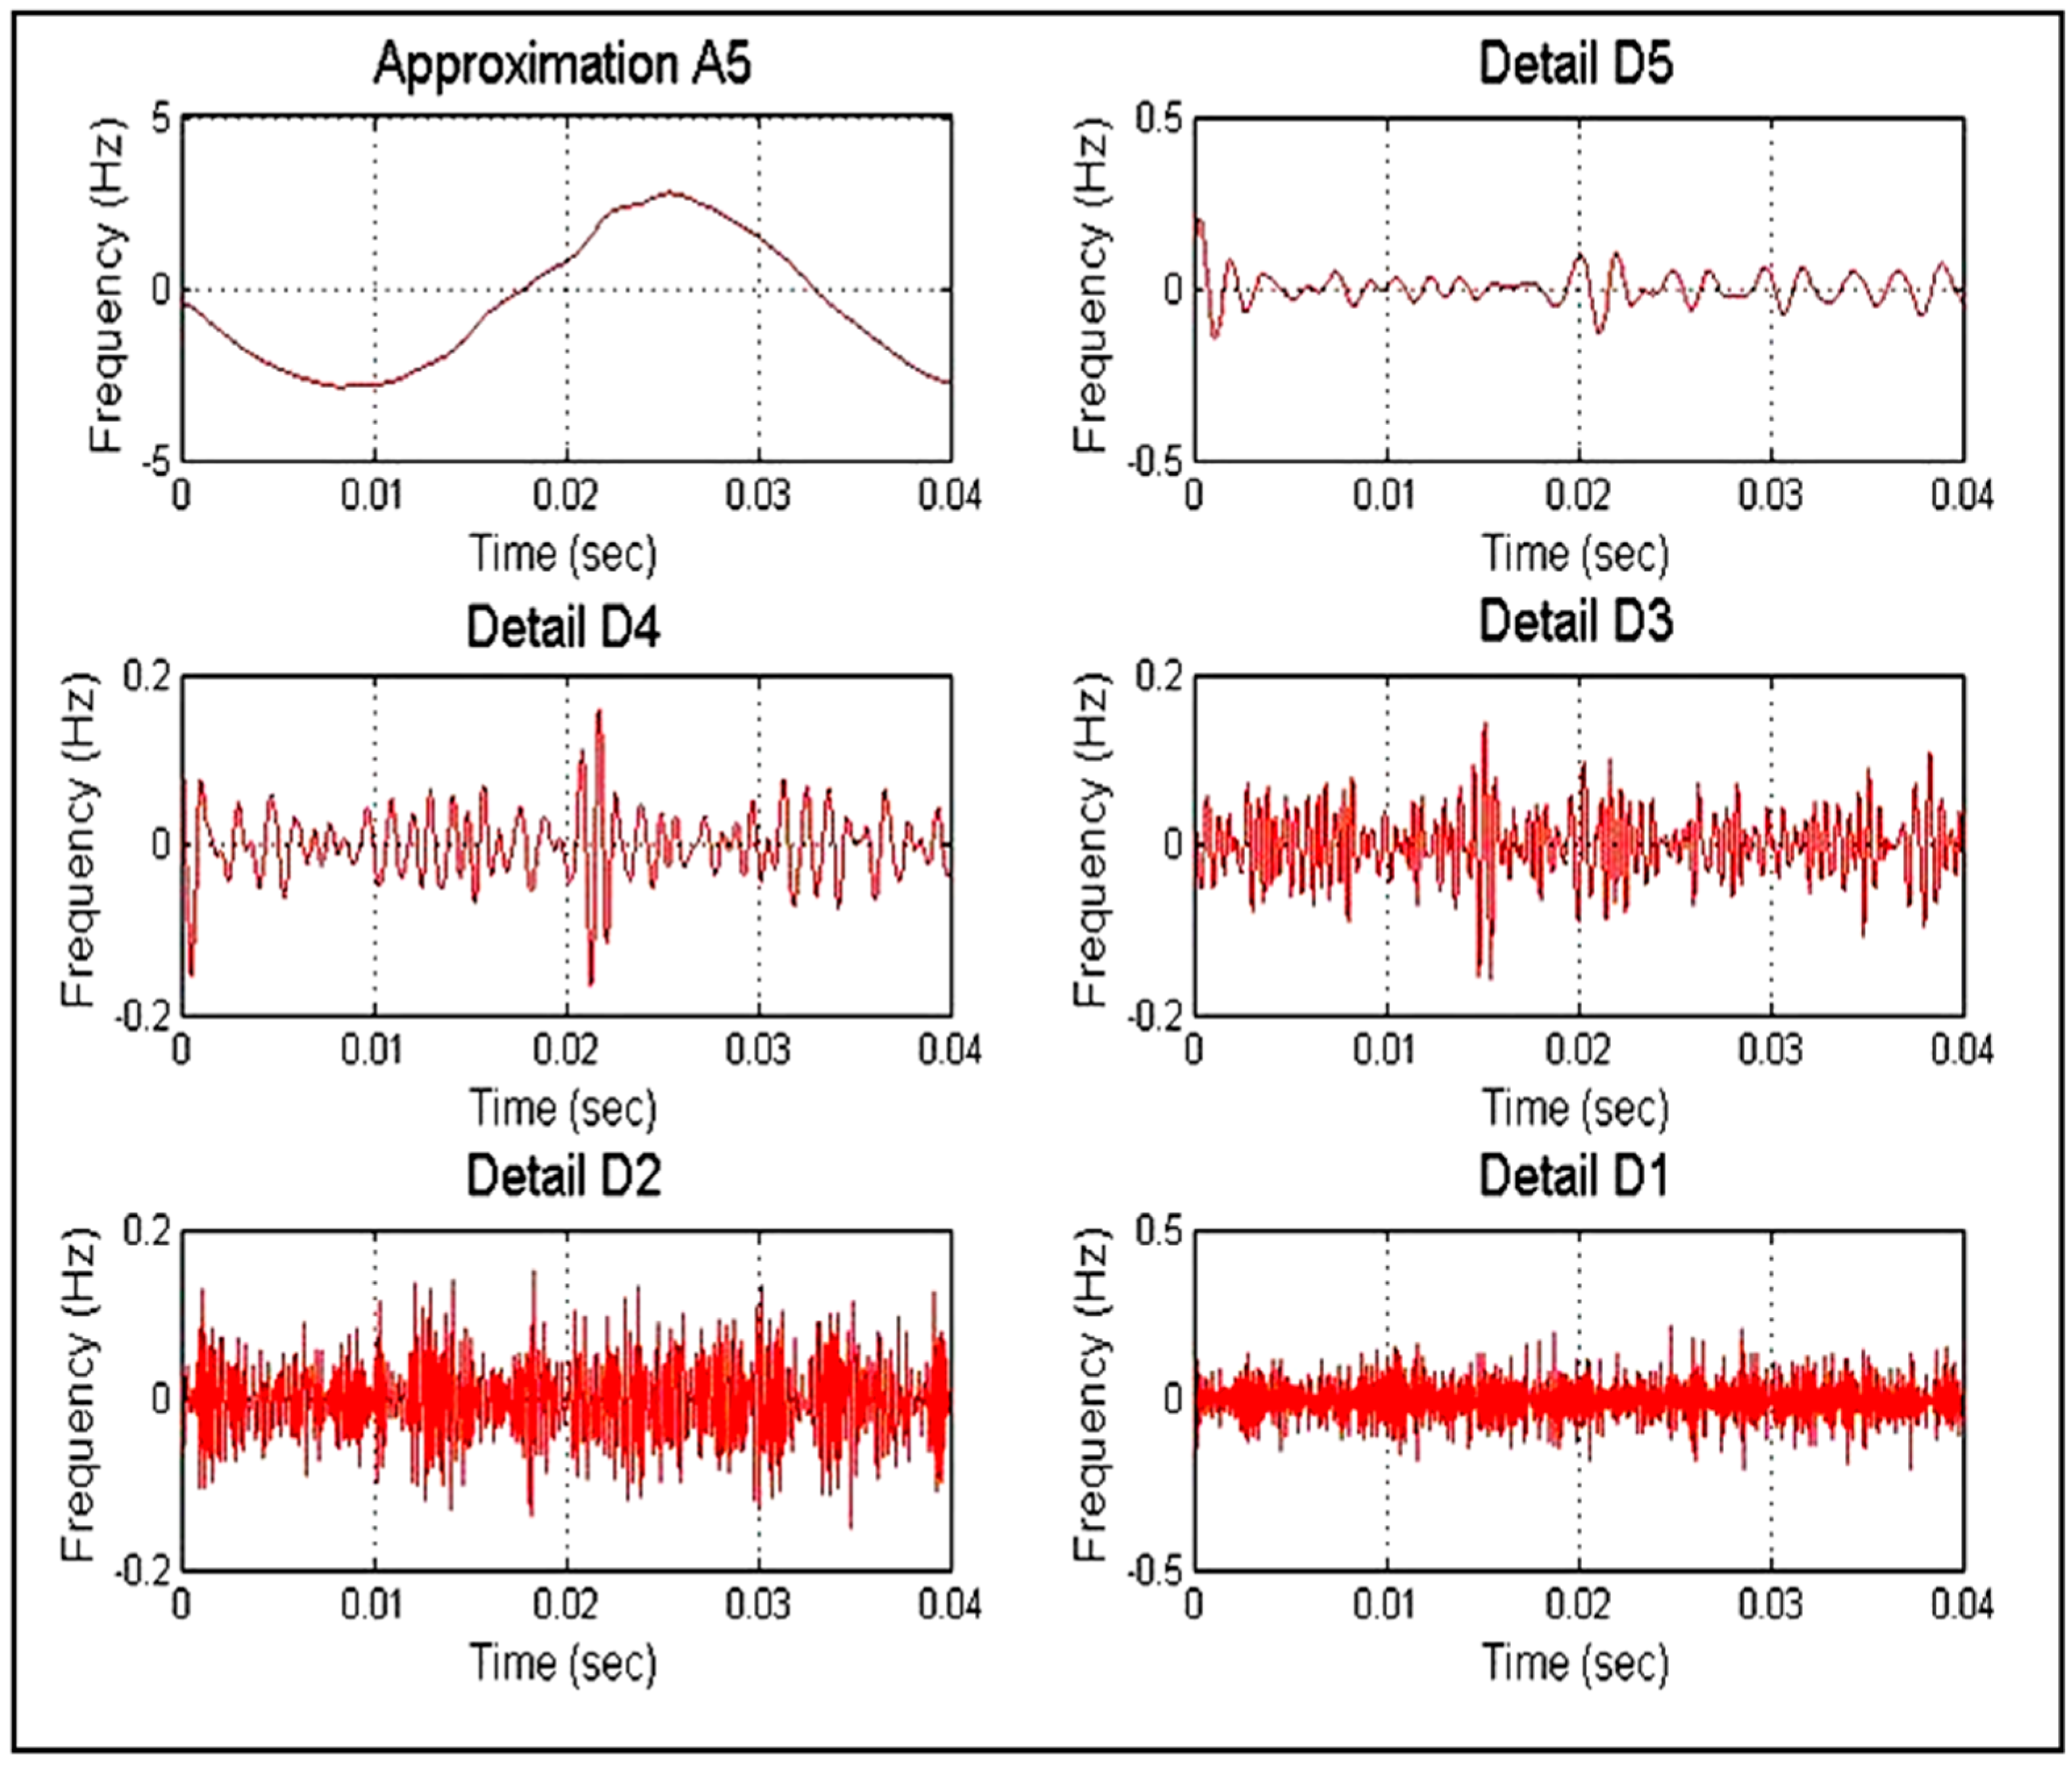
5.2. DWT Analysis
5.3. Comparative Analysis
6. Conclusions
Author Contributions
Funding
Acknowledgments
Conflicts of Interest
Abbreviation
| Variables | Explanation |
| D1 to D5 | Detailed coefficients of level 1 to 5 |
| A5 | Approximate coefficients of level 5 |
| LG | Line to ground fault |
| LL | Line to Line fault |
| LLG | Double line to ground fault |
| LLLG | Three phase fault |
| HIF | High impedance fault |
| SD | Standard Deviation |
| Db9 | Daubichies’s mother wavelet |
References
- Wang, B.; Geng, J.; Dong, X. High-Impedance Fault Detection Based on Nonlinear Voltage-Current Characteristic Profile Identification. IEEE Trans. Smart Grid 2018, 9, 3783–3791. [Google Scholar] [CrossRef]
- Baqui, I.; Zamora, I.; Mazon, J.; Buigues, G. High impedance fault detection methodology using wavelet transform and artificial neural networks. Electr. Power Syst. Res. 2011, 81, 1325–1333. [Google Scholar] [CrossRef]
- Prasad, A.; Belwin Edward, J.; Shashank Roy, C.; Divyansh, G.; Kumar, A. Classification of Faults in Power Transmission Lines using Fuzzy-Logic Technique. Indian J. Sci. Technol. 2015, 8, 1–6. [Google Scholar] [CrossRef]
- Narasimharao, G. High Impedance Fault Detection and Classification of a Distributed System. Int. J. Eng. Res. Technol. 2012, 1, 1–6. [Google Scholar]
- Chang, G.W.; Shih, M.-F.; Chen, Y.-Y.; Liang, Y.-J. A hybrid wavelet transform and neural -network-based approach for modelling dynamic voltage-current characteristics of electric arc furnace. IEEE Trans. Power Deliv. 2014, 29, 815–824. [Google Scholar] [CrossRef]
- Homaei, M.; Mahdi Moosavian, S.; AzilIllias, H. Partial discharge localization in power transformers using Neuro-Fuzzy technique. IEEE Trans. Power Deliv. 2014, 29, 2066–2076. [Google Scholar] [CrossRef]
- Harish Reddy, S.; Garg, R.; Pillai, G.N. High impedance fault classification and section identification using Extreme Learning Machine. Adv. Electr. Electr. Eng. 2013, 3, 839–846. [Google Scholar]
- Sheng, Y.; Rovnyak, S.M. Decision tree methodology for high impedance fault detection. IEEE Trans. Power Deliv. 2004, 19, 533–536. [Google Scholar] [CrossRef]
- Johns, T.; Aggarwal, R.K.; Song, Y.H. Improved techniques for modeling fault arcs on faulted EHV transmission systems. IET Gen. Transm. Distr. 1994, 141, 148–154. [Google Scholar] [CrossRef]
- Ali, M.S.; Abu Bakar, A.H.; Mokhlis, H.; Arof, H.; Illias, H.A.; Aman, M.M. High impedance fault localization in a distribution network using the discrete wavelet transform. In Proceedings of the 2012 IEEE International Power Engineering and Optimization Conference, Melaka, Malaysia, 6–7 June 2012; pp. 349–354. [Google Scholar]
- Yang, M.-T.; Guan, J.-L.; Gu, J.-C. High impedance faults detection technique based on wavelet transform. Int. J. Electr. Robot. Electr. Commun. Eng. 2007, 4, 681–685. [Google Scholar]
- Sedighi, A.R.; Haghifam, M.R.; Malik, O.P. High Impedance fault detection based on wavelet transform and statistical pattern recognition. IEEE Trans. Power Deliv. 2005, 20, 2414–2421. [Google Scholar] [CrossRef]
- Michalik, M.; Rebizant, W.; Lukowicz, M.; Lee, S.-J.; Kang, S.-H. High-Impedance Fault Detection in Distribution Networks with Use of Wavelet-Based Algorithm. IEEE Trans. Power Deliv. 2006, 21, 1793–1802. [Google Scholar]
- Elkalashy, N.I.; Lehtonen, M.; Darwish, H.A.; Taalab, A.M.I.; Izzularab, M.A. DWT-Based Detection and Transient Power Direction-Based Location of High-Impedance Faults Due to Leaning Trees in Unearthed MV Networks. IEEE Trans. Power Deliv. 2008, 23, 94–101. [Google Scholar] [CrossRef]
- Shafiullah, M.; Abido, M.A.; Abdel-Fattah, T. Distribution Grids Fault Location employing ST based Optimized Machine Learning Approach. Energies 2018, 11, 2328. [Google Scholar] [CrossRef]
- Zhou, Z.; Lin, R.; Wang, L.; Wang, Y.; Li, H. Research on Discrete Fourier Transform-Based Phasor Measurement Algorithm for Distribution Network under High Frequency Sampling. Energies 2018, 11, 2203. [Google Scholar] [CrossRef]
- Almalki, M.M.; Hatziadoniu, C.J. Classification of Many Abnormal Events in Radial Distribution Feeders Using the Complex Morlet Wavelet and Decision Trees. Energies 2018, 11, 546. [Google Scholar] [CrossRef]
- Badran, E.A.; Abdallah, E.; Kamal, M.; Shebl, A. A Complete General Logic-Based Intelligent Approach for HIF Detection and Classification in Distribution Systems. J. Am. Sci. 2011, 7, 320–328. [Google Scholar]
- AsghariGovar, S.; Seyedi, H. Adaptive CWT-based transformation line differential protection scheme considering cross-country faults and CT saturation. IET Gen. Trans. Distr. 2016, 10, 2035–2041. [Google Scholar] [CrossRef]
- Gopakumar, P.; Jaya Bharata Reddy, M.; Kumar Mohanta, D. Adaptive fault identification and classification methodology for smart power grids usingsynchronousphasor angle measurement. IET Gen. Trans. Distr. 2015, 9, 133–145. [Google Scholar] [CrossRef]
- Xiao, Y.; Hong, Y.; Chen, X.; Chen, W. The Application of Dual-Tree Complex Wavelet Transform (DTCWT) Energy Entropy in Misalignment Fault Diagnosis of Doubly-Fed Wind Turbine (DFWT). Entropy 2017, 19, 587. [Google Scholar] [CrossRef]
- Kuai, M.; Cheng, G.; Pang, Y.; Li, Y. Research of Planetary Gear Fault Diagnosis Based on Permutation Entropy of CEEMDAN and ANFIS. Sensors 2018, 18, 782. [Google Scholar] [CrossRef] [PubMed]
- Gupta, P.; Mahanty, R.N. An approach for detection and classification of transmission line faults by wavelet analysis. Int. J. Appl. Eng. Res. 2016, 11, 6290–6296. [Google Scholar]
- Nalley, D.; Adamowski, J.; Khalil, B. Using discrete wavelet transforms to analyze trends in streamflow and precipitation in Quebec and Ontario (1954–2008). J. Hydrol. 2012, 475, 204–228. [Google Scholar] [CrossRef]
- Deekshit, K.K.C.; Chaitanya Kumar, A.N.; Supraja, B.; Sumanth, M.; Prudvi Raju, K.; Venu Gopala Rao, M. Comparison of DWT and WPT to detect bearing faults in 3 phase Induction Motor using Current Signature analysis. J. Electr. Eng. 2017, 2017, 1–9. [Google Scholar]
- Ahmadipour, M.; Hizam, H.; Lutfi Othman, M.; Amran Mohd Radzi, M. An Anti-Islanding Protection Technique Using a Wavelet Packet Transform and a Probabilistic Neural Network. Energies 2018, 11, 2701. [Google Scholar] [CrossRef]
- Liu, Z.; Cui, Y.; Li, W. Combined Power Quality Disturbances Recognition Using Wavelet Packet Entropies and S-Transform. Entropy 2015, 17, 5811–5828. [Google Scholar] [CrossRef] [Green Version]
- Wang, X.; Xu, J.; Zhao, Y. Wavelet Based Denoising for the Estimation of the State of Charge for Lithium-Ion Batteries. Energies 2018, 11, 1144. [Google Scholar] [CrossRef]
- Costa, D.G.; Guedes, L.A. A Discrete Wavelet Transform (DWT)-Based Energy-Efficient Selective Retransmission Mechanism for Wireless Image Sensor Networks. J. Sens. Actuator Netw. 2012, 1, 3–35. [Google Scholar] [CrossRef] [Green Version]
- Peilin, L.M.; Aggarwal, R.K. A Novel Approach to the Classification of the Transient Phenomena in Power Transformers Using Combined Wavelet Transform and Neural Network. IEEE Trans. Power Deliv. 2001, 16, 654–660. [Google Scholar]
- Yi, Z.; Amir, H.E. Fault detection for photovoltaic systems based on multi-resolution signal decomposition and Fuzzy Inference systems. IEEE Trans. Smart Grid 2017, 8, 1274–1283. [Google Scholar] [CrossRef]
- Weron, R. Electricity price forecasting: A review of the state-of-the-art with a look into the future. Int. J. Forecast. 2014, 30, 1030–1081. [Google Scholar] [CrossRef]
- Cincotti, S.; Gallo, G.; Ponta, L.; Raberto, M. Modelling and forecasting of electricity spot-prices: Computational intelligence vs classical econometrics. AI Commun. 2014, 27, 301–314. [Google Scholar]
- Hong, Y.-Y.; Wei, Y.-H.; Chang, Y.-R.; Lee, Y.-D.; Liu, P.-W. Fault Detection and Location by Static Switches in Microgrids Using Wavelet Transform and Adaptive Network-Based Fuzzy Inference System. Energies 2014, 7, 2658–2675. [Google Scholar] [CrossRef] [Green Version]
- Hadi Abdulwahid, A.; Wang, S. A Novel Approach for Microgrid Protection Based upon Combined ANFIS and Hilbert Space-Based Power Setting. Energies 2016, 9, 1042. [Google Scholar] [CrossRef]
- Elena Dragomir, O.; Dragomir, F.; Stefan, V.; Minca, E. Adaptive Neuro-Fuzzy Inference Systems as a Strategy for Predicting and Controling the Energy Produced from Renewable Sources. Energies 2015, 8, 13047–13061. [Google Scholar] [CrossRef] [Green Version]


| Detailed Coefficient Levels | Frequency Band kHz |
|---|---|
| D1 | 5 to 2.5 |
| D2 | 2.5 to 1.25 |
| D3 | 1.25 to 0.625 |
| D4 | 0.625 to 0.3125 |
| D5 | 0.3125 to 0.15625 |
| S.No | Fault Type | Assigned Output |
|---|---|---|
| 1 | No fault | 0 |
| 2 | HIF in phase C | 0.2 |
| 3 | HIF in phase B | 0.3 |
| 4 | HIF in phase A | 0.4 |
| 5 | LLL-G | 0.5 |
| 6 | LG (AG) | 0.6 |
| 7 | LG (BG) | 0.7 |
| 8 | LG (CG) | 0.8 |
| 9 | LL (AB) | 0.9 |
| 10 | LL (BC) | 1.0 |
| 11 | LL (AC) | 1.1 |
| 12 | LLG (ABG) | 1.2 |
| 13 | LLG (BCG) | 1.3 |
| 14 | LLG (ACG) | 1.4 |
| Cases | Power System Distribution | SD Values of If |
|---|---|---|
| 1 | Normal Case | |
| Phase A | 21 | |
| Phase B | 20.3 | |
| Phase C | 19.0 | |
| 2 | HIF | |
| Phase A | 20.33 | |
| Phase B | 19.0 | |
| Phase C | 0.264 | |
| 3 | Three Phase Fault | |
| Phase A | 0.3467 | |
| Phase B | 0.3477 | |
| Phase C | 0.341 | |
| 4 | LL Fault | |
| Phase A | 0.0113 | |
| Phase B | 0.0132 | |
| Phase C | 0.0105 | |
| 5 | LG Fault | |
| Phase A | 0.0127 | |
| Phase B | 0.02 | |
| Phase C | 0.0227 | |
| 6 | LLG Fault | |
| Phase A | 0.0115 | |
| Phase B | 0.0143 | |
| Phase C | 0.0255 |
| State | Fault with Various Rf | S1 | S2 | S3 | FUZZY Output | Remarks | ANFIS Output | Remarks |
|---|---|---|---|---|---|---|---|---|
| Normal | Normal | 20.33 | 21.22 | 23 | Normal | ✓ | Normal | ✓ |
| 3 Phase Fault | ABC/20 Ohm | 40.33 | 41.54 | 46 | ABC | ✓ | ABC | ✓ |
| ABC/40 Ohm | 31.38 | 33 | 35.98 | ABC | ✓ | ABC | ✓ | |
| ABC/60 Ohm | 28 | 27.74 | 27 | ABC | ✓ | ABC | ✓ | |
| LLG Fault | ABG/20 Ohm | 30 | 34.5 | 23 | ABG | ✓ | ABG | ✓ |
| ABG/40 Ohm | 29 | 30 | 22.45 | ABG | ✓ | ABG | ✓ | |
| ABG/60 Ohm | 28.42 | 28.88 | 21 | ABG | ✓ | ABG | ✓ | |
| BCG/20 Ohm | 20.03 | 34.76 | 34 | BCG | ✓ | BCG | ✓ | |
| BCG/40 Ohm | 20 | 32 | 31 | BCG | ✓ | BCG | ✓ | |
| BCG/60 Ohm | 19.55 | 27 | 29 | BCG | ✓ | BCG | ✓ | |
| ACG/20 Ohm | 34.45 | 23.33 | 35.1 | ACG | ✓ | ACG | ✓ | |
| ACG/40 Ohm | 32 | 22.3 | 31 | ACG | ✓ | ACG | ✓ | |
| ACG/60 Ohm | 29 | 20 | 28 | ACG | ✓ | ACG | ✓ | |
| LG fault | AG/20 Ohm | 40.33 | 23 | 22.64 | AG | ✓ | AG | ✓ |
| AG/40 Ohm | 35 | 21 | 20.06 | AG | ✓ | AG | ✓ | |
| AG/60 Ohm | 29.98 | 19 | 20 | AG | ✓ | AG | ✓ | |
| BG/20 Ohm | 21 | 47 | 20.06 | BG | ✓ | BG | ✓ | |
| BG/40 OHMS | 18 | 37 | 18.63 | BG | ✓ | BG | ✓ | |
| BG/60 Ohm | 19.73 | 30 | 22 | BG | ✓ | BG | ✓ | |
| CG/20 Ohm | 18.6 | 23 | 47 | CG | ✓ | CG | ✓ | |
| CG/40 Ohm | 19.18 | 22 | 34.98 | CG | ✓ | CG | ✓ | |
| CG/60 Ohm | 21 | 20.87 | 29.61 | CG | ✓ | CG | ✓ | |
| LL Fault | AB/20 Ohm | 45.55 | 46.7 | 21 | AB | ✓ | AB | ✓ |
| AB/40 Ohm | 40 | 37 | 20.1 | AB | ✓ | AB | ✓ | |
| AB/60 Ohm | 34 | 32 | 23 | ABG | ✕ | AB | ✓ | |
| BC/20 Ohm | 21 | 45 | 44 | BC | ✓ | BC | ✓ | |
| BC/40 Ohm | 20.45 | 36 | 37 | BC | ✓ | BC | ✓ | |
| BC/60 Ohm | 24 | 32 | 29.24 | BCG | ✕ | BC | ✓ | |
| AC/20 Ohm | 45 | 23 | 46.9 | AC | ✓ | AC | ✓ | |
| AC/40 Ohm | 35.55 | 22.1 | 36 | AC | ✓ | AC | ✓ | |
| AC/60 Ohm | 32 | 21 | 29 | ACG | ✕ | AC | ✓ | |
| HIF Fault | HIF A/75 Ohm | 8 | 21 | 22.2 | HIF A | ✓ | HIF A | ✓ |
| HIF A/50 Ohm | 11 | 20.09 | 23.4 | HIF A | ✓ | HIF A | ✓ | |
| HIF A/40 ohm | 14.5 | 19 | 24 | NORMAL | ✕ | HIF A | ✓ | |
| HIF B/75 Ohm | 21 | 9 | 20.01 | HIF B | ✓ | HIF B | ✓ | |
| HIF B/50 Ohm | 20.09 | 12.4 | 23.05 | HIF B | ✓ | HIF B | ✓ | |
| HIF B/ 40 Ohm | 19 | 14 | 22 | Normal | ✕ | HIF B | ✓ | |
| HIF C/75 Ohm | 18.76 | 21 | 8.13 | HIF C | ✓ | HIF C | ✓ | |
| HIF C/50 Ohm | 19.61 | 20.19 | 12.09 | HIF C | ✓ | HIF C | ✓ | |
| HIF C/40 Ohm | 20.08 | 19.89 | 15.5 | Normal | ✕ | HIF C | ✓ |
© 2018 by the authors. Licensee MDPI, Basel, Switzerland. This article is an open access article distributed under the terms and conditions of the Creative Commons Attribution (CC BY) license (http://creativecommons.org/licenses/by/4.0/).
Share and Cite
Veerasamy, V.; Abdul Wahab, N.I.; Ramachandran, R.; Mansoor, M.; Thirumeni, M.; Lutfi Othman, M. High Impedance Fault Detection in Medium Voltage Distribution Network Using Discrete Wavelet Transform and Adaptive Neuro-Fuzzy Inference System. Energies 2018, 11, 3330. https://doi.org/10.3390/en11123330
Veerasamy V, Abdul Wahab NI, Ramachandran R, Mansoor M, Thirumeni M, Lutfi Othman M. High Impedance Fault Detection in Medium Voltage Distribution Network Using Discrete Wavelet Transform and Adaptive Neuro-Fuzzy Inference System. Energies. 2018; 11(12):3330. https://doi.org/10.3390/en11123330
Chicago/Turabian StyleVeerasamy, Veerapandiyan, Noor Izzri Abdul Wahab, Rajeswari Ramachandran, Muhammad Mansoor, Mariammal Thirumeni, and Mohammad Lutfi Othman. 2018. "High Impedance Fault Detection in Medium Voltage Distribution Network Using Discrete Wavelet Transform and Adaptive Neuro-Fuzzy Inference System" Energies 11, no. 12: 3330. https://doi.org/10.3390/en11123330