The Influence of Energy Renovation on the Change of Indoor Temperature and Energy Use


Nearly Zero Energy Research Group, Tallinn University of Technology, Tallinn 19086, Estonia
*
Author to whom correspondence should be addressed.
Energies 2018, 11(11), 3179; https://doi.org/10.3390/en11113179
Submission received: 26 September 2018
/
Revised: 8 November 2018
/
Accepted: 12 November 2018
/
Published: 16 November 2018
(This article belongs to the Special Issue Energy Performance and Indoor Climate Analysis in Buildings)
Abstract
:The aim of the renovation of apartment buildings is to lower the energy consumption of those buildings, mainly the heating energy consumption. There are few analyses regarding those other energy consumptions which are also related to the primary energy need for calculating the energy efficiency class, including the primary energy need of calculated heating, domestic hot water (DHW), and household electricity. Indoor temperature is directly connected with heating energy consumption, but it is not known yet how much it will change after renovation. One of the research issues relates to the change of electricity and DHW usage after renovation and to the question of whether this change is related to the users’ behavior or to changes to technical solutions. Thirty-five renovated apartment buildings have been analyzed in this study, where the data of indoor temperature, airflow, and energy consumption for DHW with and without circulation and electricity use in apartments and common rooms has been measured. During research, it turned out that the usage of DHW without circulation and the usage of household electricity do not change after renovation. Yet there is a major increase in indoor temperature and DHW energy use in buildings that did not have circulation before the renovation. In addition, a small increase in the use of electricity in common areas was discovered. This study will offer changes in calculations for the energy efficiency number.
1. Introduction
Buildings are responsible for approximately 40% of energy consumption in the European Union countries. Final energy use in Estonia is 33.0 TWh/a and the share of buildings is 50% [1]. The Energy Performance of Buildings Directive (EPBD) [2], the Energy Efficiency Directive (EED) [3], and the Renewable Energy Directive (RED) [4] define a framework for long-term improvements in the energy performance of Europe’s building stock.
To decrease energy use, EU Member States shall establish a long-term renovation strategy to support the renovation of the national stock, into a highly energy efficient and decarbonized building stock by 2050, facilitating the cost-effective transformation of existing buildings into nearly zero-energy buildings (nZEB) [2]. D’Agostino et al. [5] provide an overview of the status of implementation of nZEBs in Europe and showed that building retrofit is one of the biggest challenges that Europe is facing.
Energy renovation is one of the most effective and cost-efficient ways to improve indoor climate and achieve energy savings. Indoor climate and energy modeling have estimated the savings potential to be in the range of 40–80% of energy use [6,7,8,9]. Modeling has usually been done on the standard use of buildings [10]. In reality, the use of user-related energy can be different compared with the standard use because of the density of occupants or the number of apartments in a building [11]. The use of standardized user profiles for modeling is good for comparing similar buildings and to work out the building stock level. To work out cost effective energy renovation measures for specific buildings, this peculiarity has to be taken into account. That is why it is important to investigate user-related indoor climate and energy consumptions before renovation and to compare that with standard use energy.
The rebound effect has been investigated by Sorrell [12]. He has found that most governments are seeking solutions to improve energy efficiency to fulfill their energy policy goals. But measured energy savings generally turn out to be appreciably lower. He postulates that one explanation could be that improvements in energy efficiency encourage a higher use of those services which are provided by the energy supply. This situation where the calculated energy savings are not being achieved due to behavioral responses has come to be known as the energy efficiency ‘rebound effect’. In some cases this rebound effect is high enough to lead to an overall increase in energy consumption, an outcome termed as ‘backfire’ [13]. In general, the rebound effect is not taken in to account in energy efficiency calculations, which may lead to an overestimation of the future energy savings [12]. The occupants’ behavior has also been identified as one of the reasons for the energy performance gap in other studies [14,15]. The systematic review of the literature on occupant and building energy performance by Zhang et al. [16] estimated that the occupant behavior-related energy-saving potential could be in the range of 10–25% for residential buildings. Menezes et al. [17] highlighted the need for a better understanding of occupancy behavior patterns and the use of more realistic input parameters in energy models; needed to bring the predicted figures closer to reality.
This study investigates indoor climate and energy consumption, which is connected with occupant behavior before and after renovation. Energy renovated apartment buildings in Estonia are used as an example. The research questions of the study are the following:
- Whether and how much does energy renovation influence indoor climate and human related energy use?
- How well do real indoor climate parameters correspond to the standard use of a building before and after the renovation?
- Is it appropriate to use a different standard use for the energy certification process for apartment buildings?
2. Methods
2.1. Studied Buildings
In Estonia, the majority of apartment buildings that have been constructed between WWII and 1990 have the same typical problems: high energy-consumption levels, insufficient ventilation (natural ventilation without any outdoor air inlets), uneven indoor temperatures, and insufficient thermal comfort levels [18,19,20]. From the year 2010, more than 1000 apartment buildings have undergone renovation, the majority of them supported by Fund KredEx. The energy renovation of 663 apartment buildings resulted in average energy savings of 43% [21]. The main challenge was to achieve the same level of heating energy consumptions as estimated by modeling before renovation [22].
The energy use and indoor climate were investigated in 35 apartment buildings (Table 1).
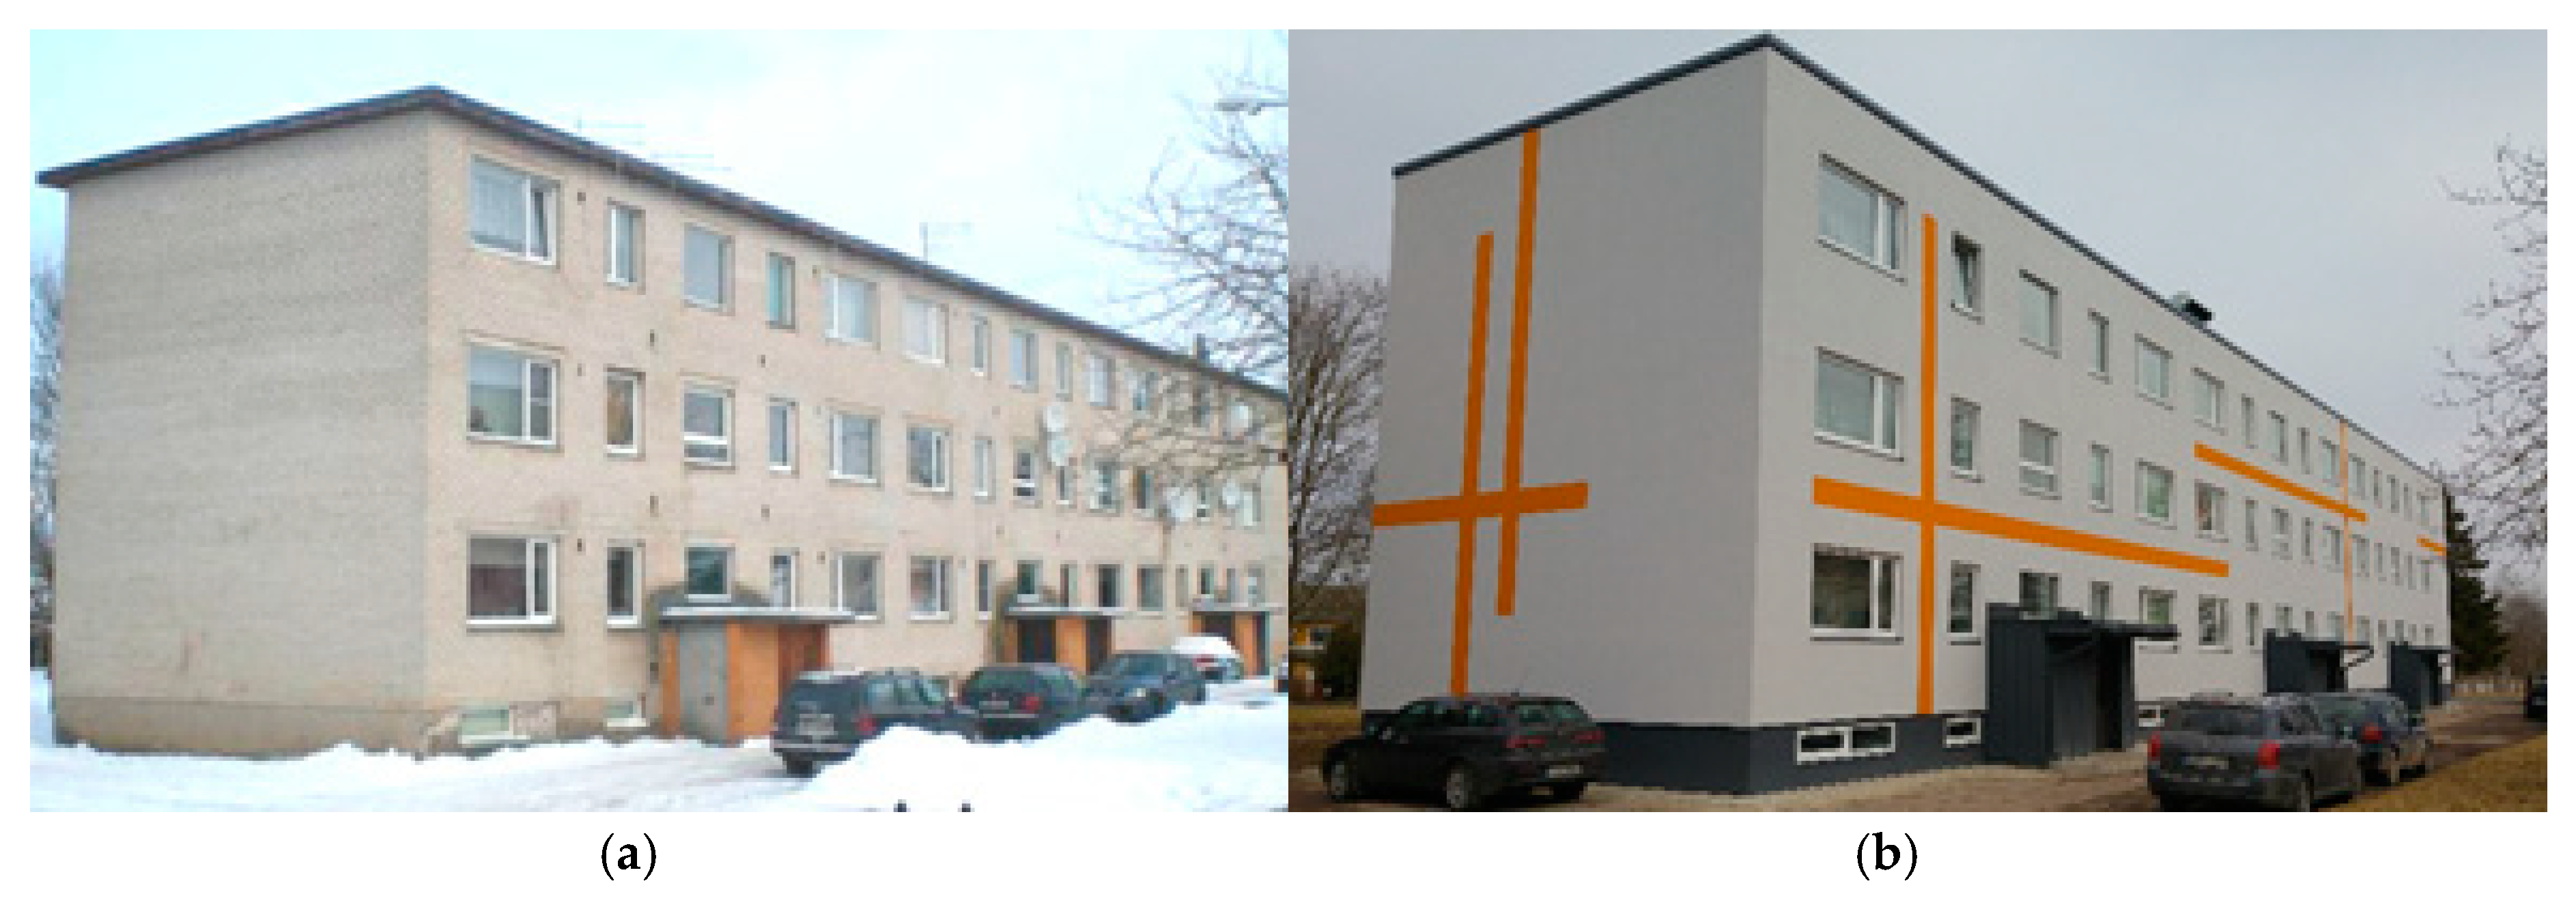
The average number of apartments in one building was 27 (varied between 12 and 72, standard deviation is 17), average heated area was 1757 m2 (varied between 550 m2 and 5030 m2, standard deviation is 1046). Average occupancy in one apartment was 2.2 persons (varied between 1.1 and 3.3, standard deviation is 0.5) and the average area per person was 31 m2/person (varied between 16 m2/person and 55 m2/person, standard deviation is 7.7).
An example of a building before (a) and after (b); a renovation is shown in the following Figure 1.
All 35 buildings have district heating for space heating. The heating system was renovated in all of the buildings: a hydronic radiator with thermostat valves (TRV) was installed in all apartment buildings, (before renovation, the existing one pipe system didn’t have TRV). In ten buildings, the performance of natural ventilation was improved by adding outdoor air inlets. In 11 buildings, centralized exhaust ventilation (without ventilation heat recovery (VHR)) was installed. In eight buildings, the exhaust ventilation was equipped with an exhaust air heat pump (EXHP) for heat recovery. Supply and exhaust ventilation with heat recovery was installed in 14 buildings: four apartment buildings had supply-exhaust room units (SERU) and ten buildings had central air handling units (AHU).
In 11 buildings, DHW was heated by electrical boilers, located in apartments, as before renovation. In nine apartment buildings, the DHW heating by local electric boilers was changed into a central system heated by district heating after renovation (installing DHW and DHW circulation pipes). In all other buildings, district heating for DHW was used before and after the renovation. In all those buildings where DHW is heated by district heating there also exists DHW circulation, (Table 1 shows where DHW circulation was in use before renovation and how the situation is after renovation).
2.2. Evaluating Energy Consumption before and after Renovation
Energy audits before renovation were done for each building by professional energy auditors. Energy audits are documents which show the energy consumption of a building for different requirements and how to renovate the building to decrease energy usage. There were no special standards or guides for auditing in existence during that period in Estonia. The majority of energy auditors were educated through special courses and most of auditors used the same audit methodology and form. From year 2015, a new energy audit procedure was developed by Fund Kredex [23]. The information about energy consumption (electricity, space heating together with ventilation air heating (heat) and domestic hot water (DHW)) and indoor temperature before renovation was taken from an energy audit. Energy consumption after renovation was measured and data was collected from building managers. In apartment buildings with district heating, where heat for space heating and DHW was measured together, the heat for DHW was calculated based on the assumption that 40% of the total water used is hot water [24] and the difference between the temperatures is 50 °C. Circulation heat loss was calculated by using the difference between theoretical (energy consumption from water use and temperature difference) and measured energy use for DHW during the summer months.
2.3. Indoor Climate Measurements
We measured indoor temperature and ventilation airflow as the most important parameters to guaranteeing thermal comfort and indoor air quality. Measurements were conducted in all buildings in at least 3–4 apartments (altogether 120 apartments) after the renovation during the heating period between the beginning of December until the end of February, (buildings coded from 15.1 to 35.10 during the period December 2013 until February 2014, and coded 1.1 to 2.12 during the period December 2016 until February 2017).
Temperatures were measured at fifteen-minute intervals. The temperature was measured with portable data loggers (EVIKON E6226, measurement range −10–50 °C with an accuracy of ±0.6 °C) (Evikon MCI OÜ, Tartu, Estonia). The data loggers were located on the separating walls mainly in master bedrooms.
Airflow was measured in apartments twice, generally at the beginning of December and again at the end of February. In all apartments we measured exhaust air outlet airflow. The criteria for the selection of apartments was that they should be located on different floors and that in the selected apartments there should be living more persons than there are bedrooms. Ventilation airflow was measured with a Testo 435 hot wire anemometer sensor (measurement range 0–20 m/s, with an accuracy ±0.03 + 5% m/s) (Testo SE & Co. KGaA, Lenzkirch, Germany) together with a volume flow funnel Testovent 410 (∅ 340 mm).
In every apartment, where indoor temperature and ventilation airflow were measured, we collected data regarding the appropriateness of the indoor temperature via a questionnaire (5 step scale: rather cool, slightly cool, neutral, slightly warm, and rather warm). Also, we asked a question on how they feel temperature after renovation (5 step scale: warmer, slightly warmer, neutral, slightly cooler, and cooler). In most buildings the ventilation system has been renovated. That is why we asked also how they evaluated ventilation air quality (5 step scale: fresh, rather fresh, neutral, rather stuffy, and stuffy).
Thermal comfort was calculated based on ISO 7730 standard [25] by using Excel based tool [26]. Air temperature and relative humidity values were taken from measurements from all 120 apartments. The surface temperature of external wall (1/5 from all surface area) was calculated based on its thermal resistance (taken from design documentation) and typical surface resistance (0.13 m2∙K/W). For other input parameters (clothing = 1.0 clo, activity level = 1.2 met, and air velocity = 0.1 m/s) we used values recommended in EN 15,251 standard [27] for indoor climate category Indoor climat calss (ICC) II.
2.4. Standard Use of Buildings and Performance Gap
Pursuant to an Estonian regulation [28], the standard use of a building (indoor climate, water and electricity use, and heat gains) for indoor climate and energy modeling of an apartment building are the following:
- Indoor temperature during heating period: 21 °C;
- Ventilation airflow: 0.42 L/(s∙m2) for apartments with a local air handling unit and 0.5 L/(s∙m2) for apartments with central air handling unit. The minimum requirement for renovation is 0.35 L/(s∙ m2);
- The use of DHW:520 L/(m2∙a), i.e., 30 kWh/(m2∙a);
- The use of electricity for appliances, lighting, and circulation pumps is 30 kWh/(m2∙a).
The performance gap is calculated as a relative difference between the measured and standard use values according to Equation (1):
3. Results
3.1. Indoor Climate
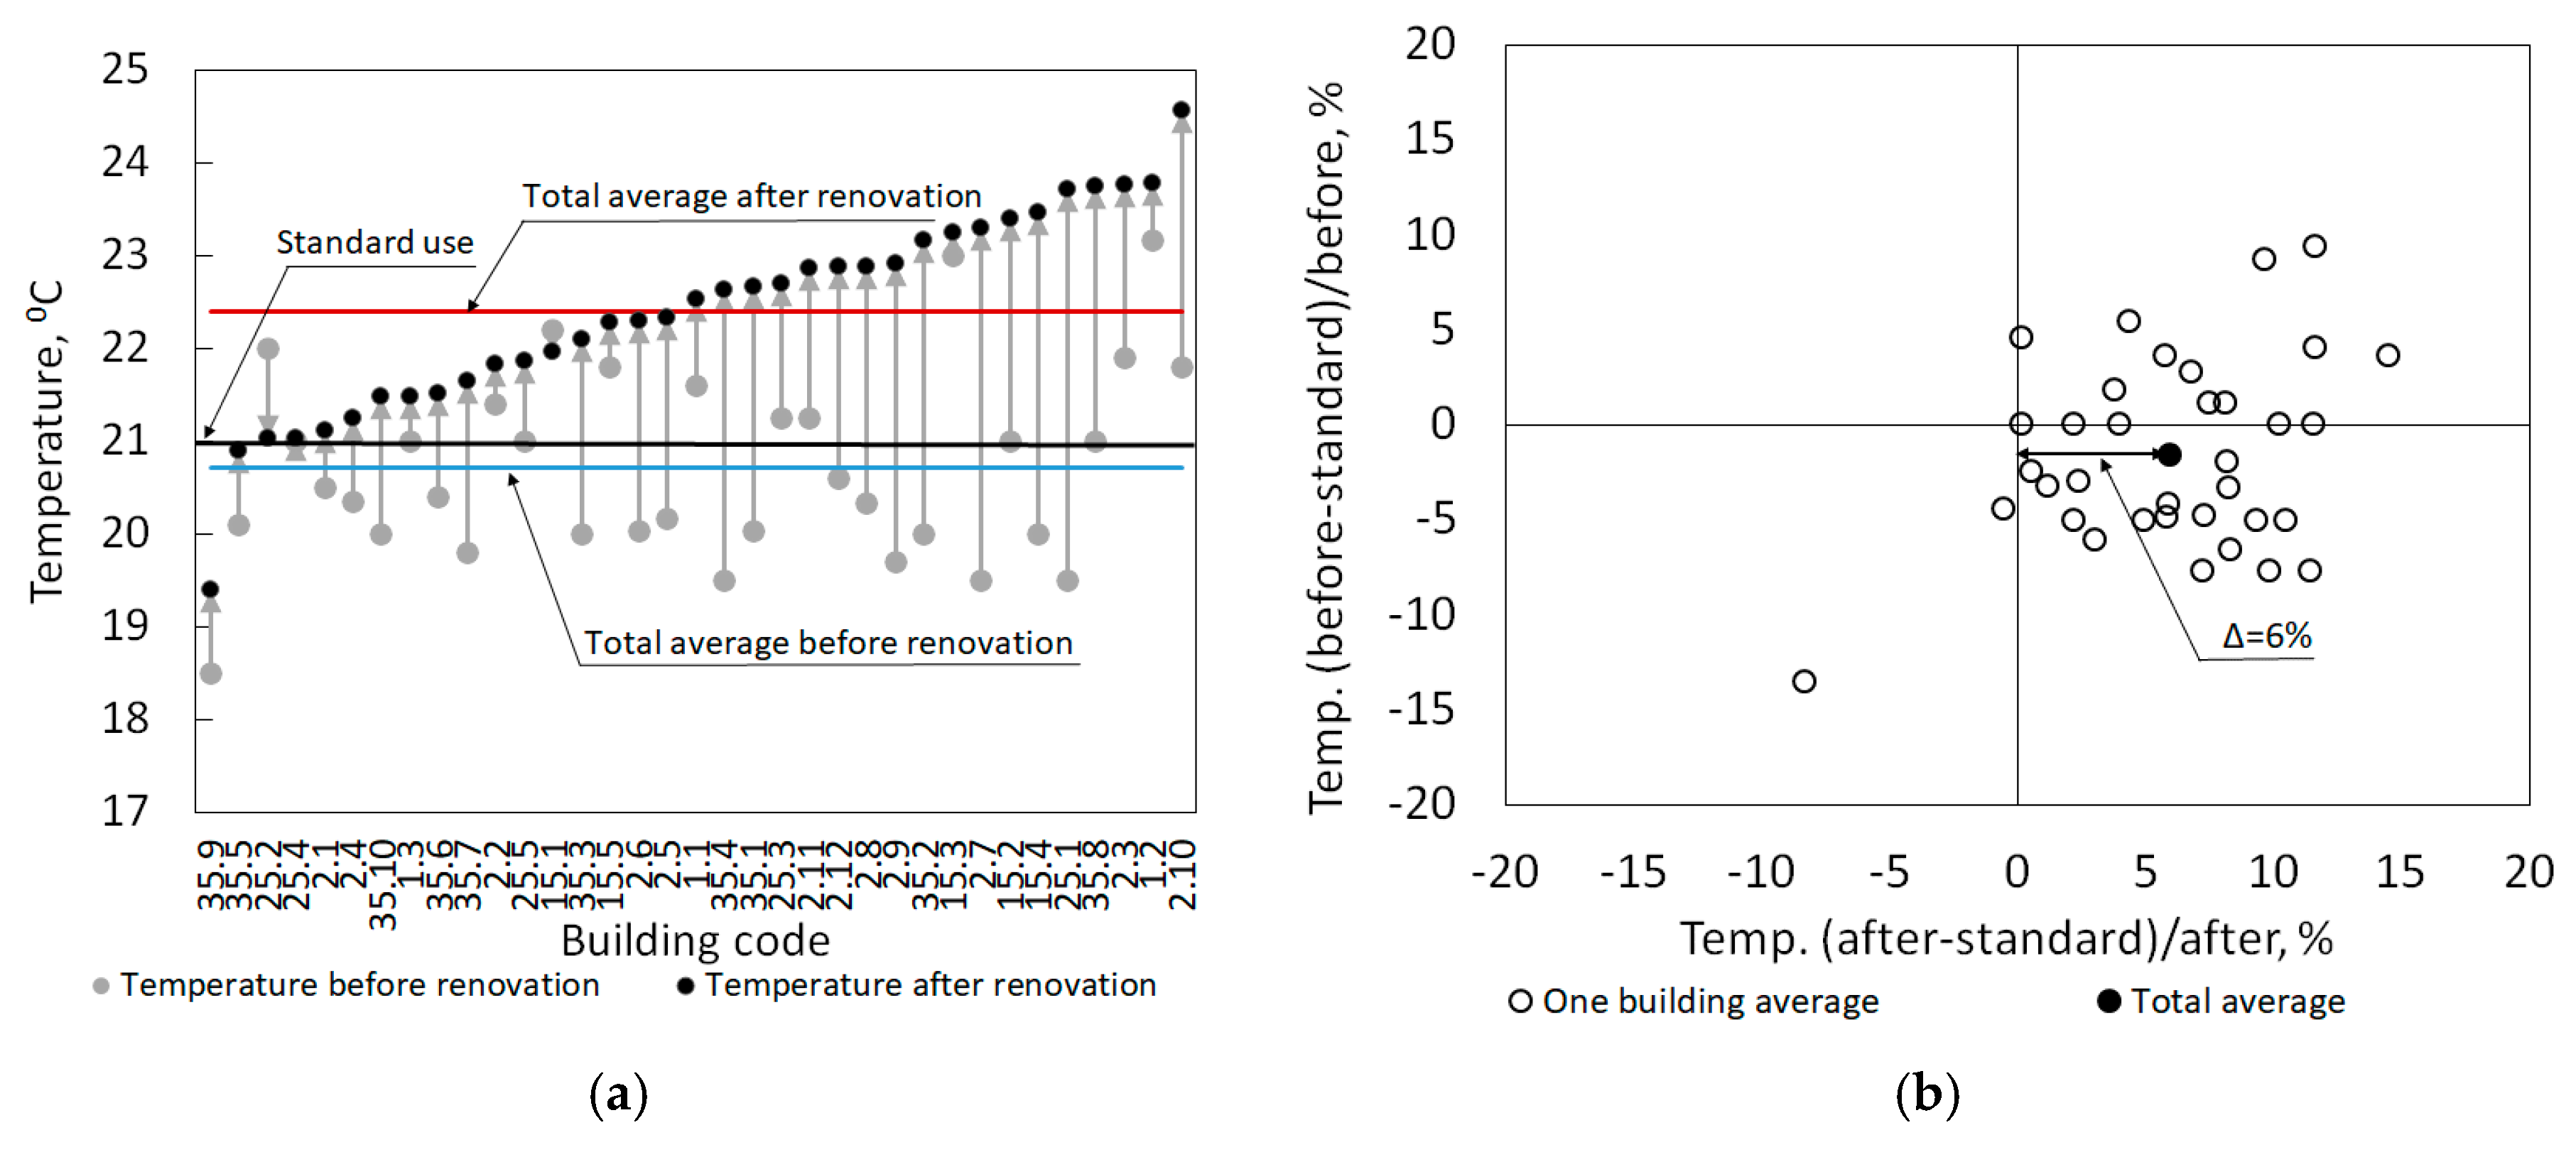
Before renovation, the indoor temperature during the heating period was 20.8 °C on average, which is slightly lower than the standard value [28] for energy simulations (21 °C). After renovation, the indoor temperature was higher than the standard value in almost all buildings: 22.4 °C on average (varied between 19.4 °C and 24.5 °C), Figure 2a, i.e., 1.6 °C higher than before renovation, on average. In Figure 2a, on the right Figure 2b, we can see that after renovation the room temperature is 1.4 °C on average (relative difference 6%) higher than the value for standard use.
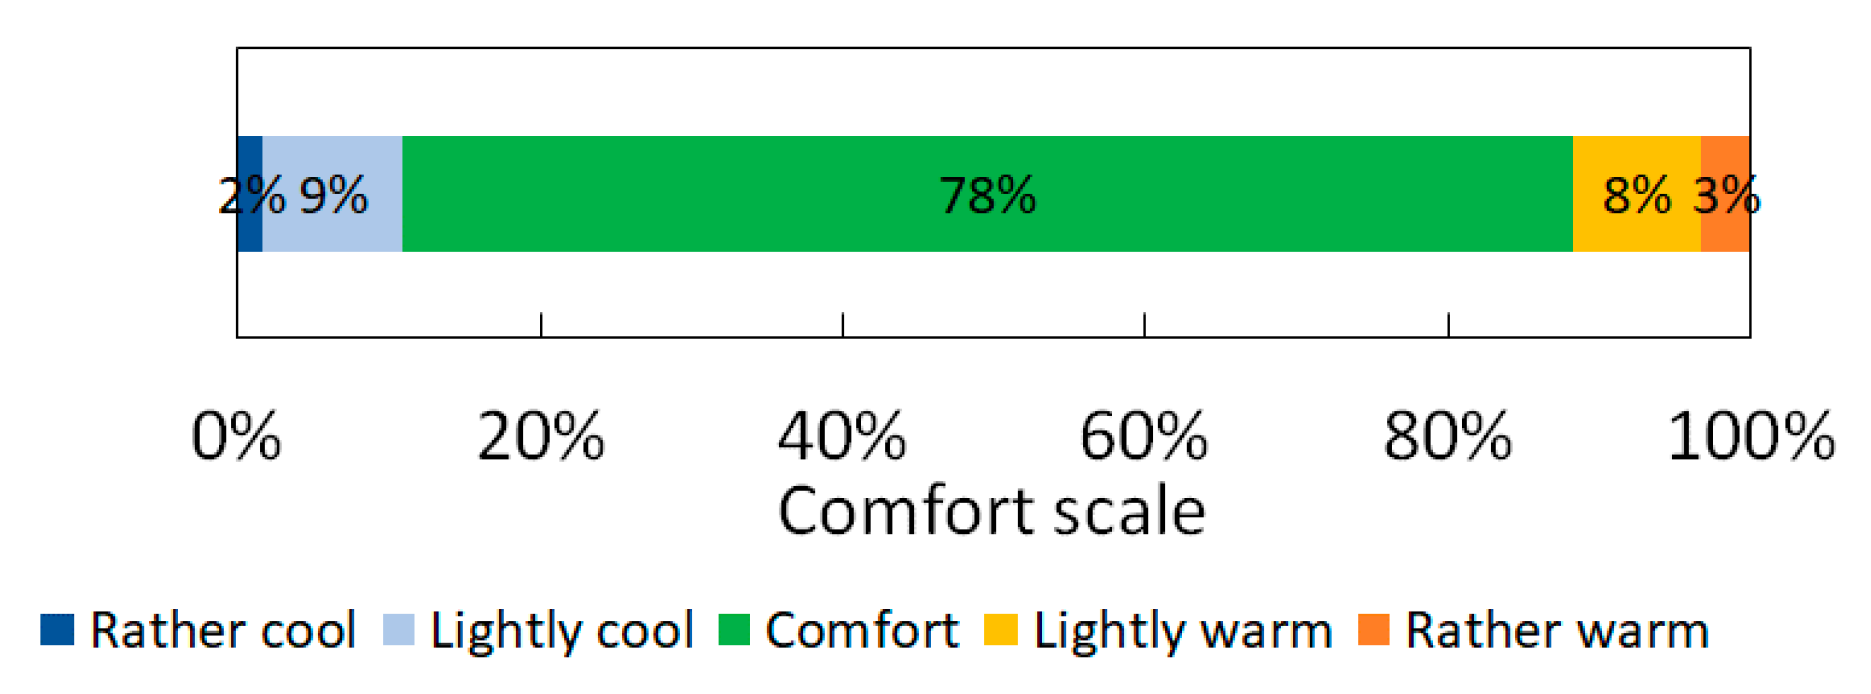
Based on the questionnaire, occupants were satisfied with the indoor temperature. 78% from 120 occupants answered that indoor temperature was comfortable (Figure 3). Only 11% of the occupants said that the temperature is lightly or rather warm.
The lower and higher calculated Predicted Mean Vote (PMV) (values are −0.66 and 0.67 and maximum Predicted Percentage of Dissatisfied (PPD) value is 14.4%. From 120 apartments 10 are outside from neutral thermal comfort (−0.5 < PMV < 0.5) zone. Based on calculations 89.8% of apartments inside of comfort zone are satisfied. Based on this we can conclude that there was not large difference between the reported satisfaction and the satisfaction calculated based on measurements (Figure 4).
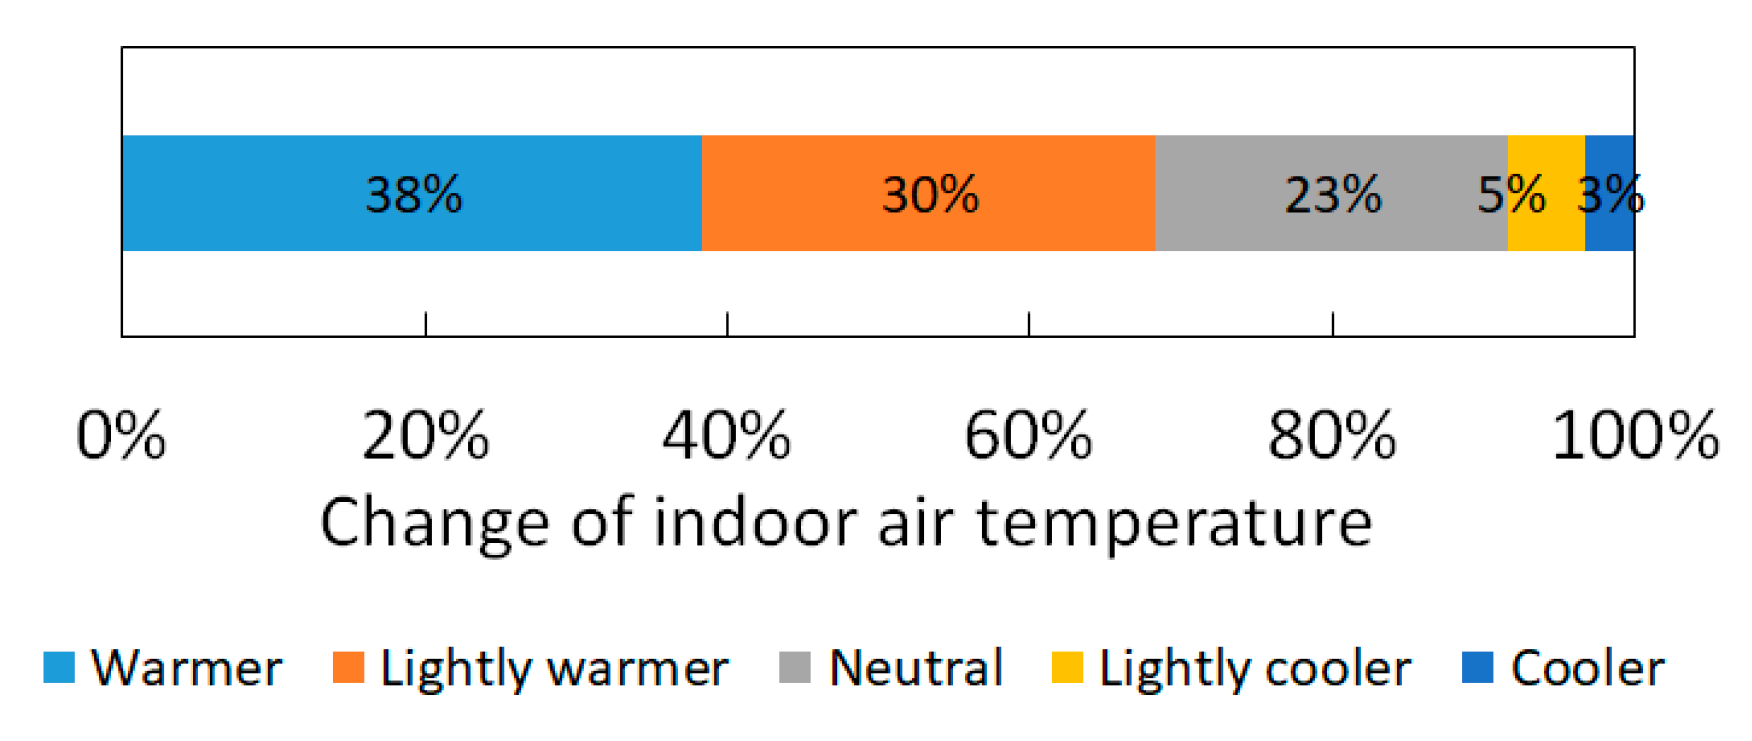
Also, in Figure 5 we can see that 68% of occupants understand that the indoor temperature has increased after renovation. Only 8% of occupants said that the temperature has decreased.
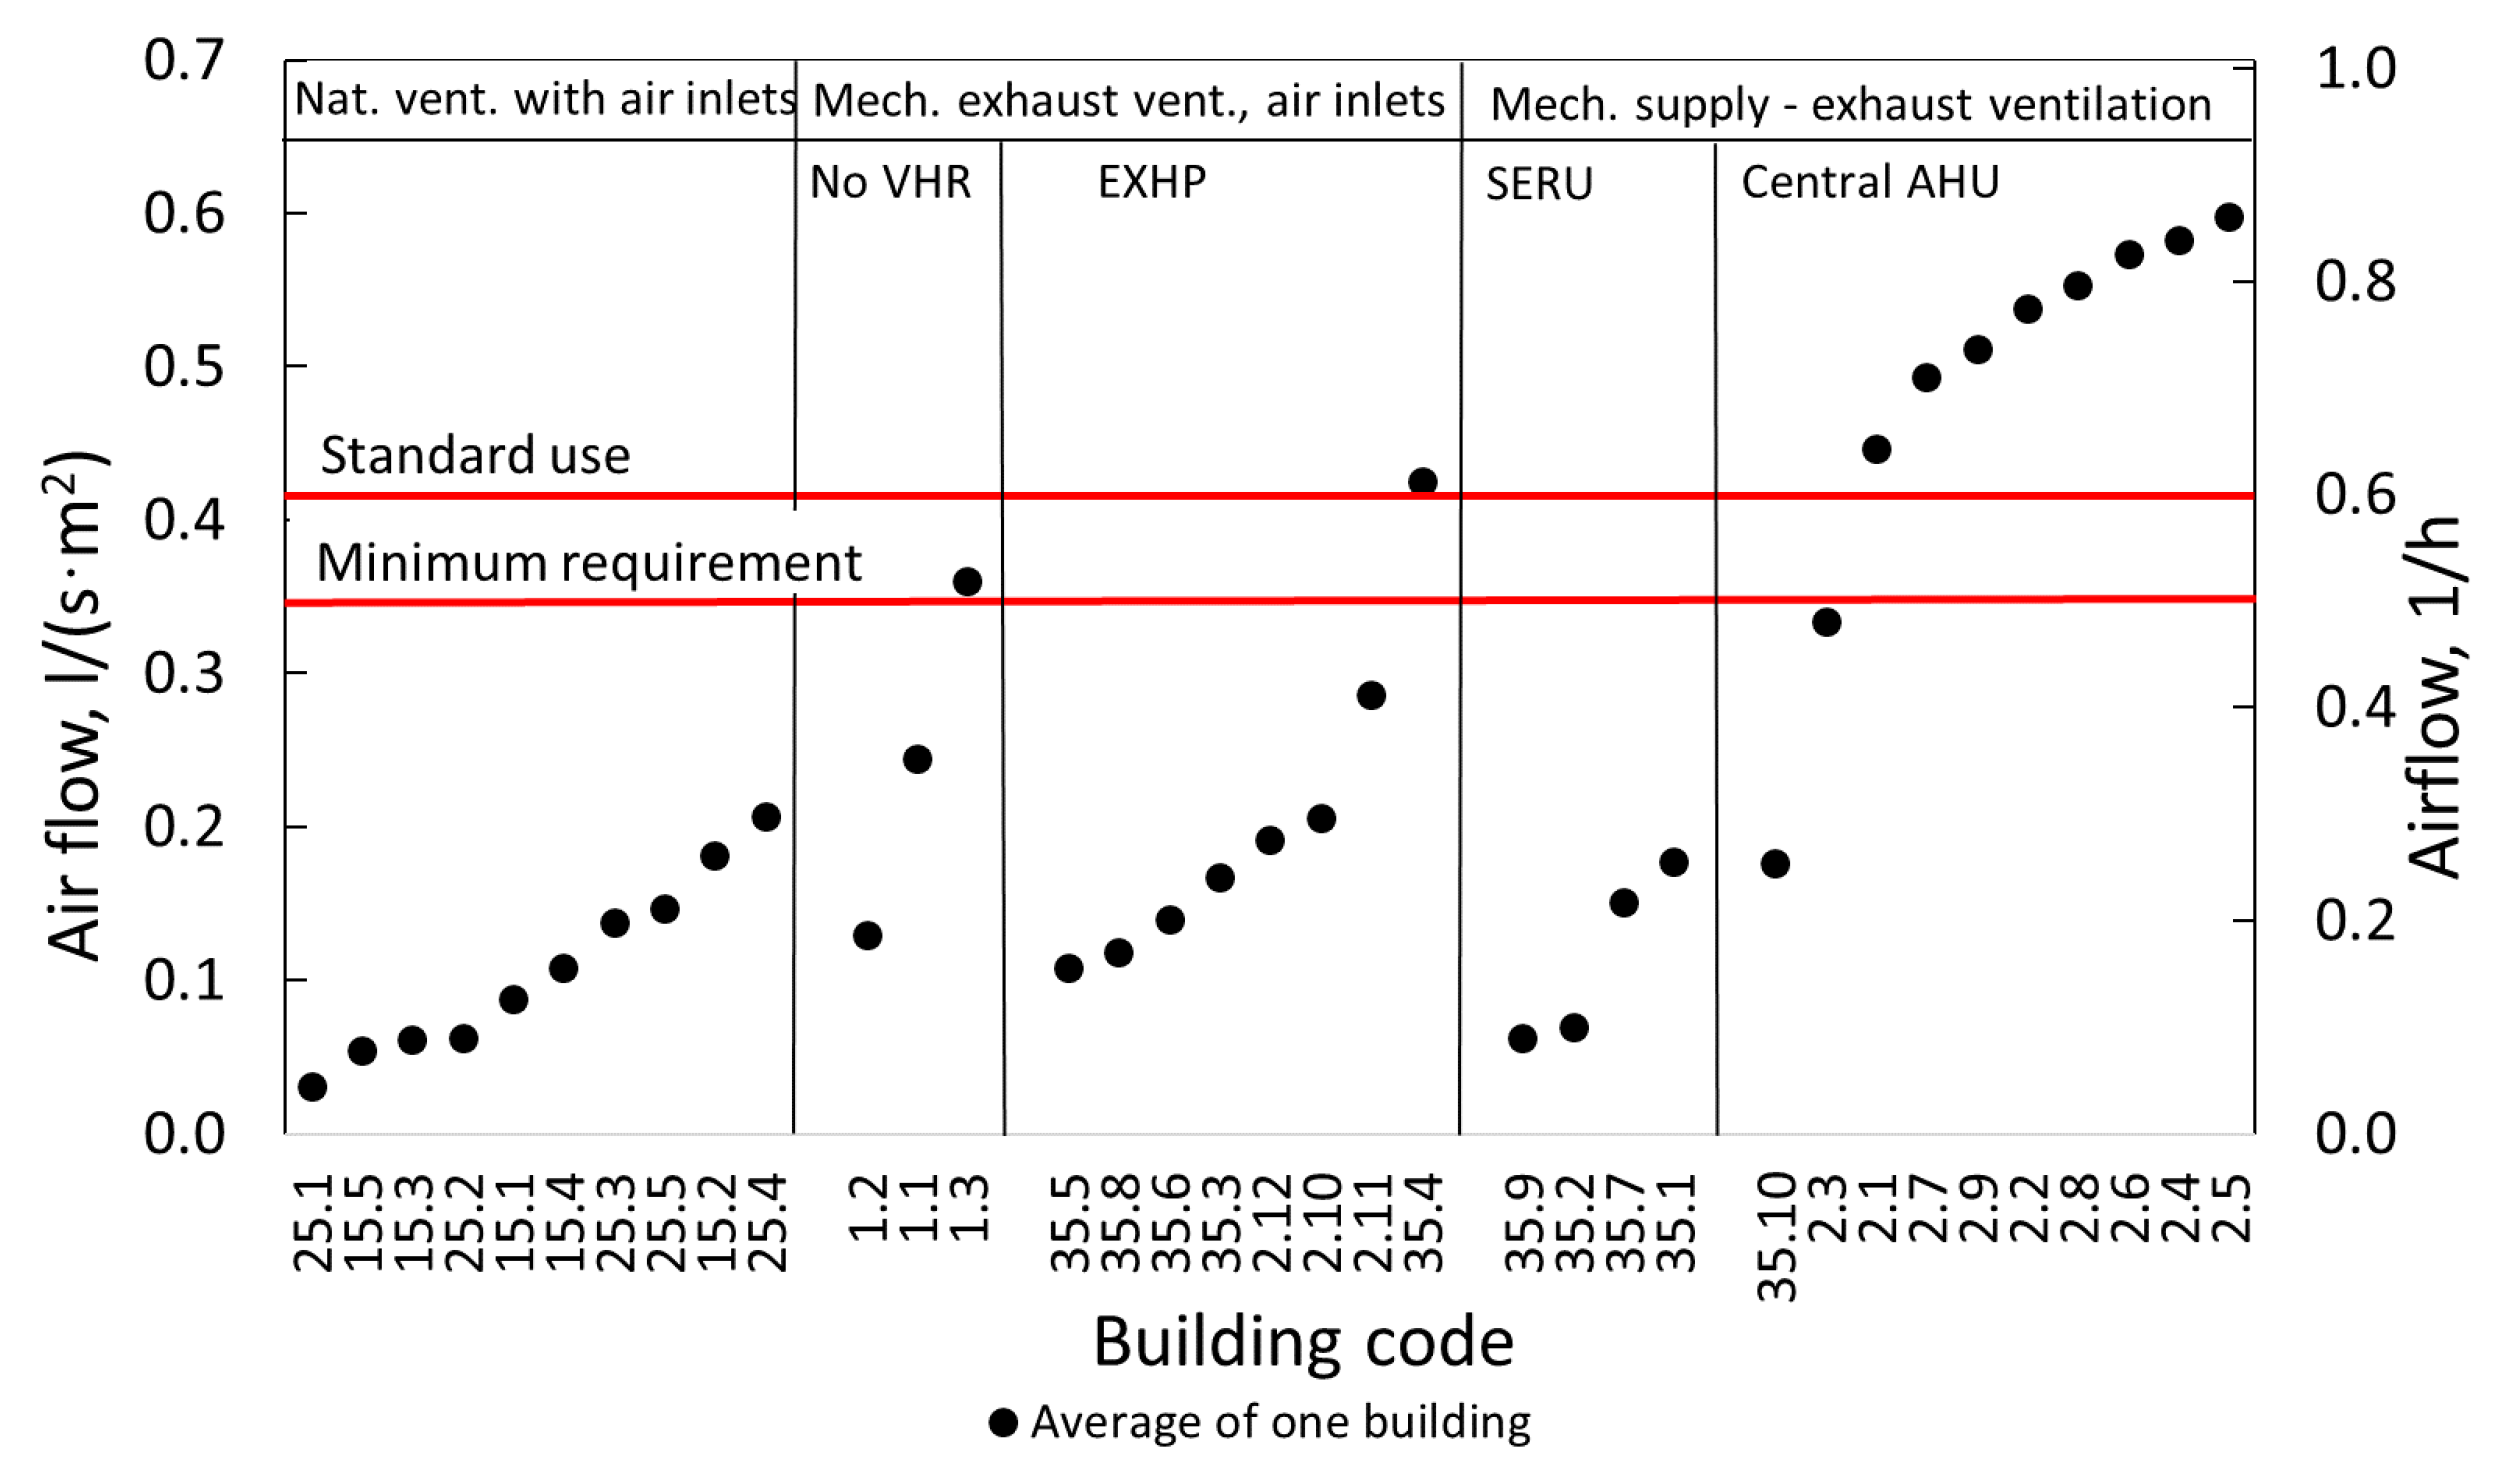
The average ventilation air change rate of old Estonian apartments with natural ventilation before renovation was 0.24 h−1 and 0.17 L/(s∙m2) [20]. The ventilation airflow after renovation of 0.36 h−1, 0.25 L/(s∙m2) (varied between 0.05 h−1 and 0.86 h−1, 0.03 L/(s∙m2) and 0.60 L/(s∙m2)) on average was much less than the standard value [28] for energy simulations 0.5–0.6 h−1; 0.35–0.42 L/(s∙m2) (Figure 6).
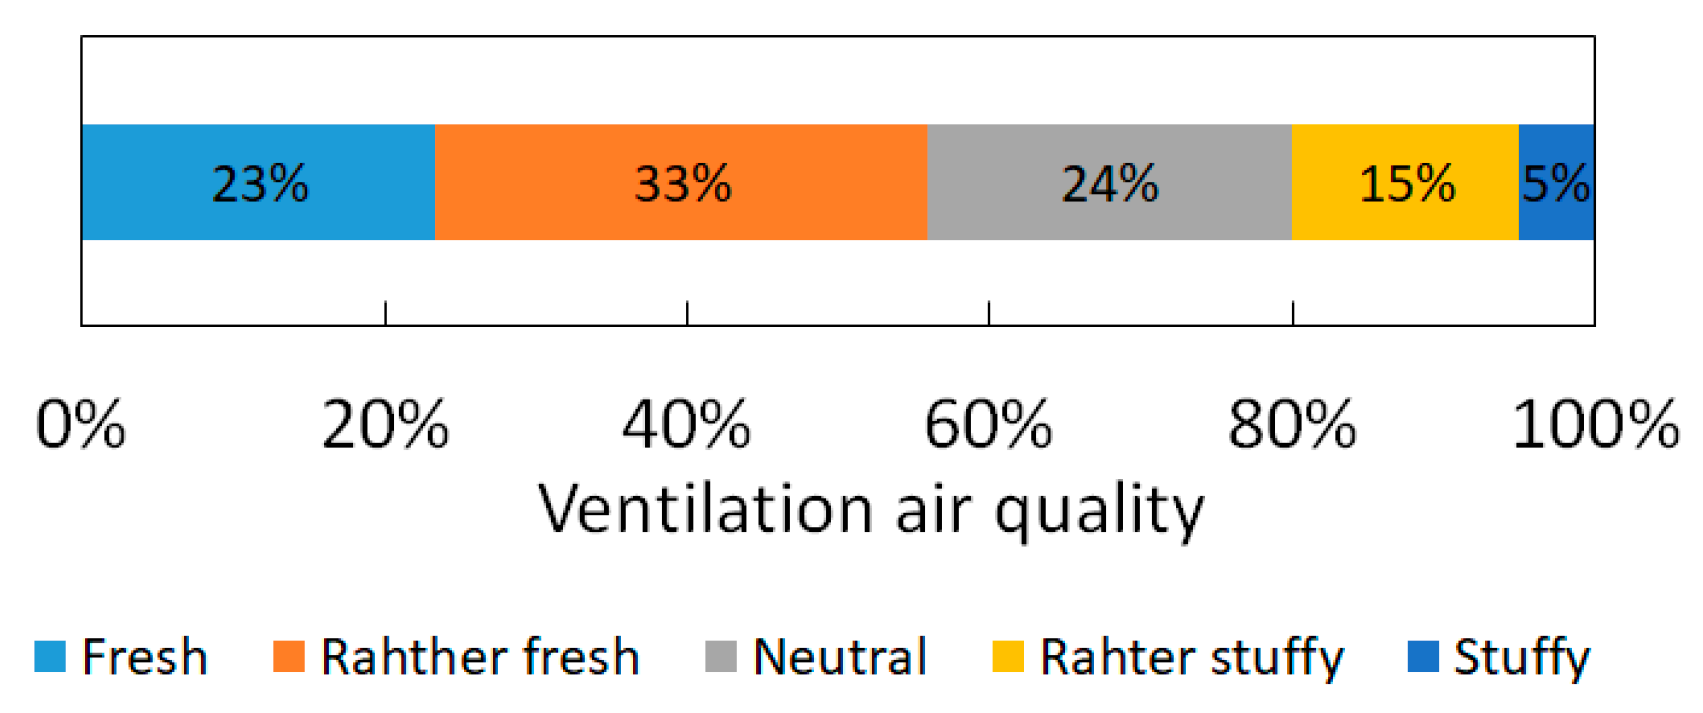
In our study we asked how the occupants rated also ventilation air quality after renovation. Based on the results of the measurements it can be said that airflows in most of building can be improved, but the questionnaire showed (Figure 7) that 56% of occupants feel that air is rather fresh after renovation.
3.2. Domestic Hot Water Use
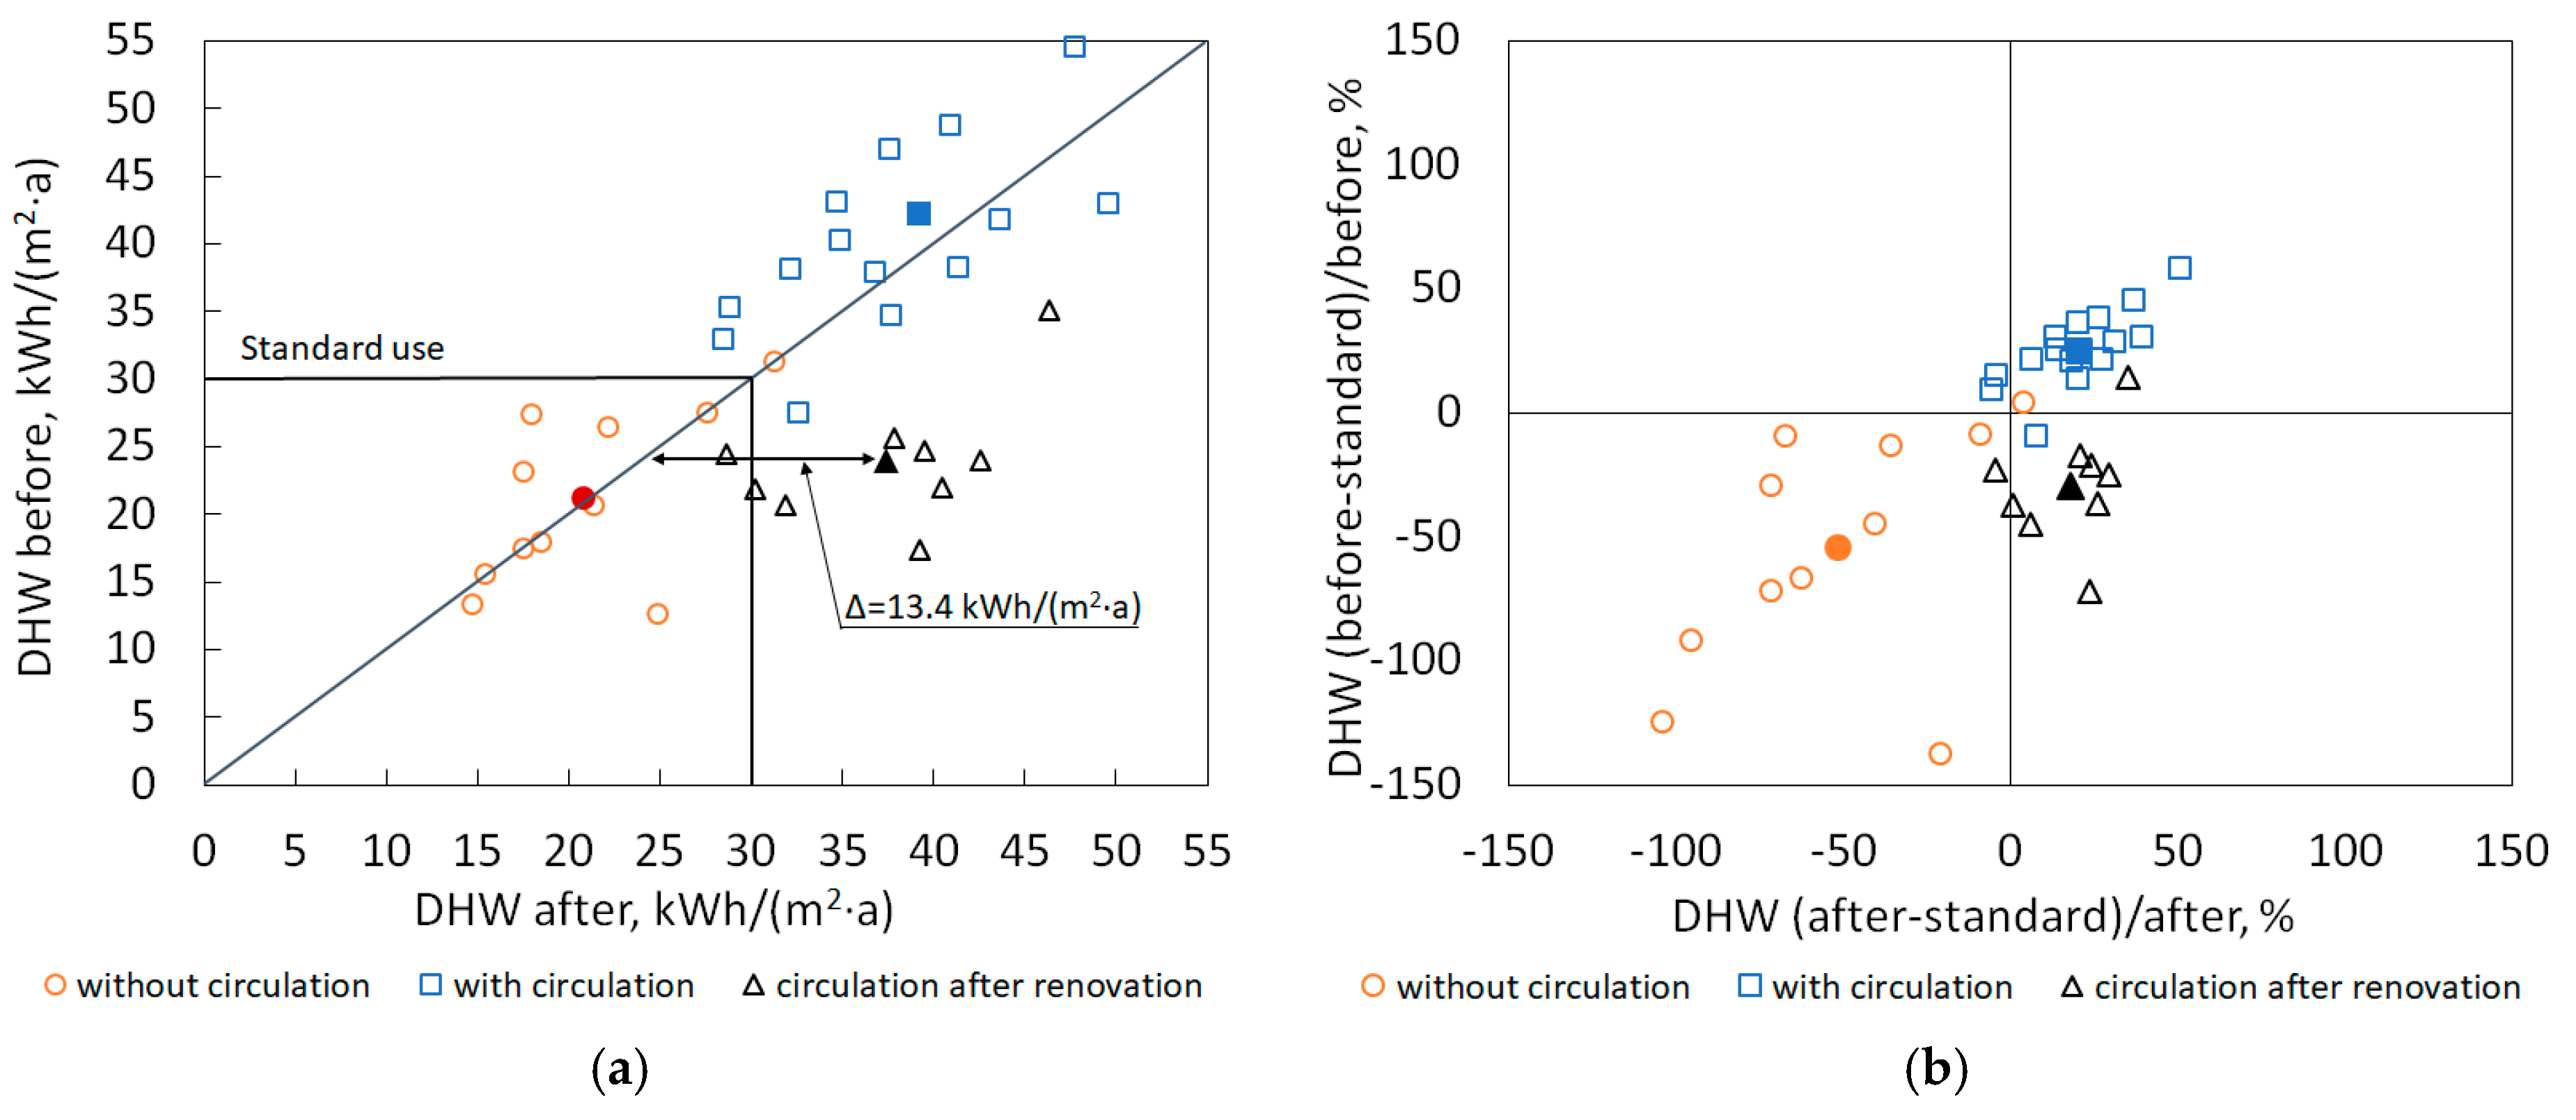
The average DHW use in studied buildings was, on average, 31 L/(pers.·d) before renovation and 28 L/(pers.·d) after renovation (without circulation losses 24 L/(pers.·d) and 22 kWh/(m2·a) correspondingly). DHW use with circulation losses was in all buildings, on average, 31 kWh/(m2·a) before renovation and 33 kWh/(m2·a) after renovation. We divided houses in three groups depending on DHW circulation. Table 2 features DHW energy use before and after renovation. Buildings with DHW circulation have an average DHW use of 38 kWh/(m2·a) after renovation and without circulation, 21 kWh/(m2·a). In buildings where circulation was installed during the renovation, the average increase of energy consumption for DHW was 13.4 kWh/(m2·a) (Figure 8a).
Figure 8b shows the gap between the measured and standard use of DHW. Almost all buildings where there was no DHW circulation before and after the renovation used less DHW energy compared to the standard use. The relative difference between the measured energy and standard use was 54% before renovation and 52% after renovation. On the other hand, buildings with DHW circulation had a higher DHW energy use compared with standard use: before renovation 26% and after renovation 20%. Hence, independently from the availability of DHW, the energy for DHW decreased a little. The main difference in the change in DHW use was apparent in buildings where DHW circulation was installed during renovation: energy for DHW increased 56%.
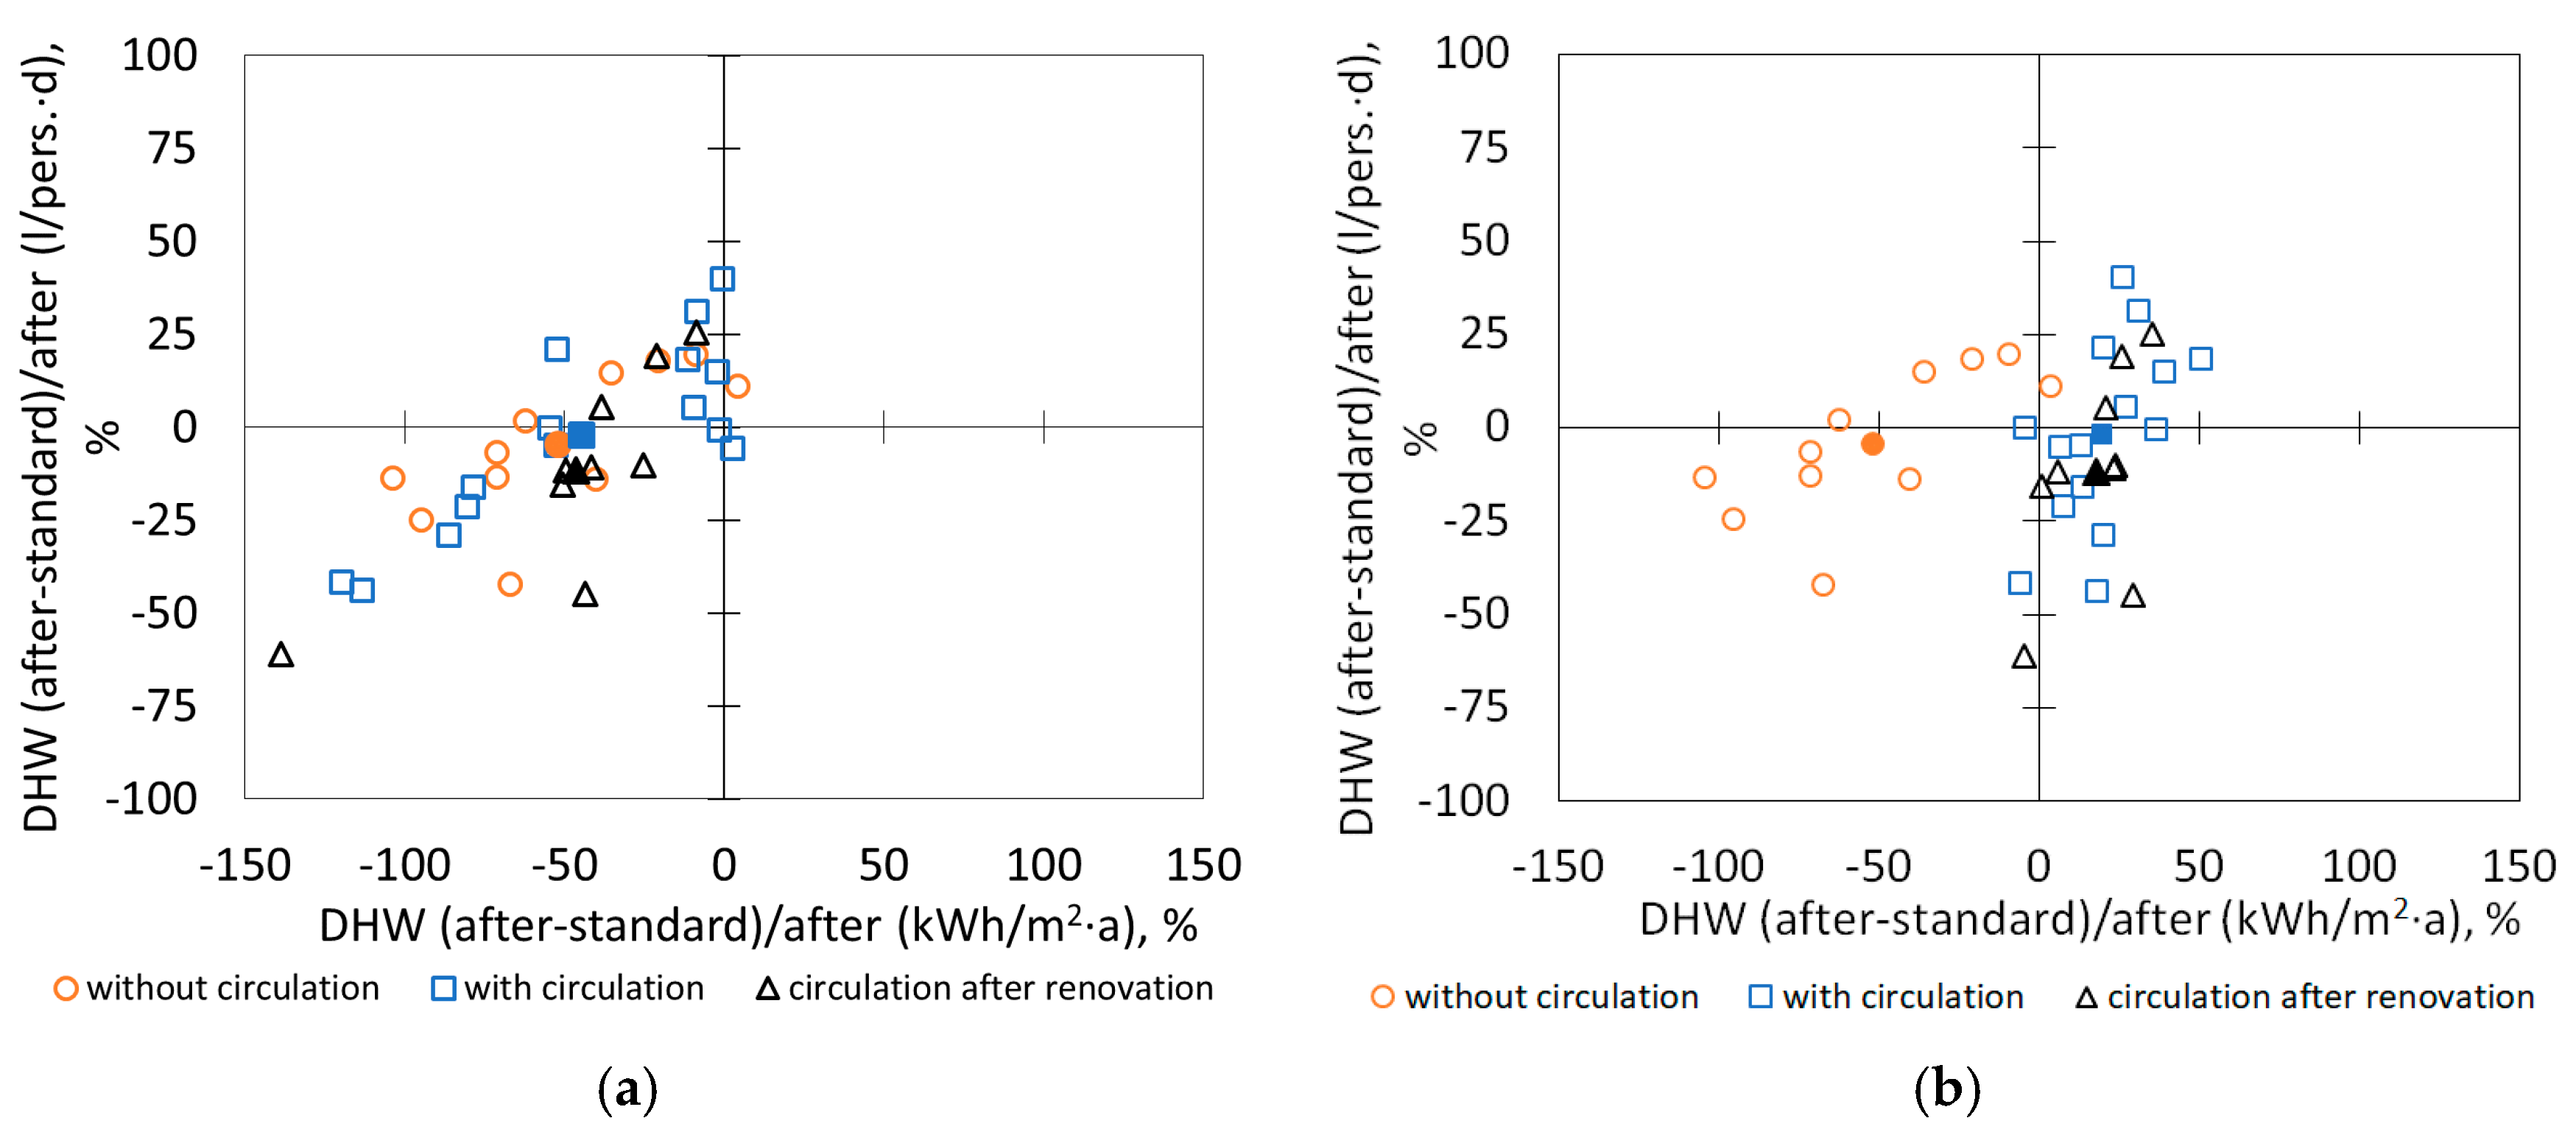
In the regulations, DHW use is defined as water use per heated area. In reality, an area does not use the water; it is the occupants in the building who do it. To analyze what is the better DHW use presenting unit—L/(pers.·d) or kWh/(m2·a), we measured energy use with average DHW usage per person (28 L/(pers.·d)) and with standard usage (30 kWh/(m2·a)) with and without DHW circulation (Figure 8a). We can see that in most cases, DHW use without circulation compared with standard use per heated area is lower; the average gap from the standard use in all buildings is −48% (Figure 9a). The gap between the standard use (kWh/(m2·a)) is −140% to +4%; from DHW use per person (L/(pers.·d)), it is between −61 and 40%. When we take into account DHW circulation, then we can see that the average use from standard use per heated area moves to the positive side and when hot water circulation is considered, then the average difference with standard use after renovation is +19%, which is between −5 and +50% (Figure 9b).
3.3. Household Electricity
The renovation did not influence the average use of household electricity (apartments + common spaces): before renovation, it was 30.1 kWh/(m2·a), and after renovation, approximately the same, 29.5 kWh/(m2·a) (Figure 10a). In general, we see that the renovation did not change the use of electricity that much. The gap between the standard use, which has been taken without electricity use for ventilation (30 kWh/(m2·a)), is, on average, −3% before renovation (between −54 until 35%) and after renovation −4% (between −29 until 30%) (Figure 10b).
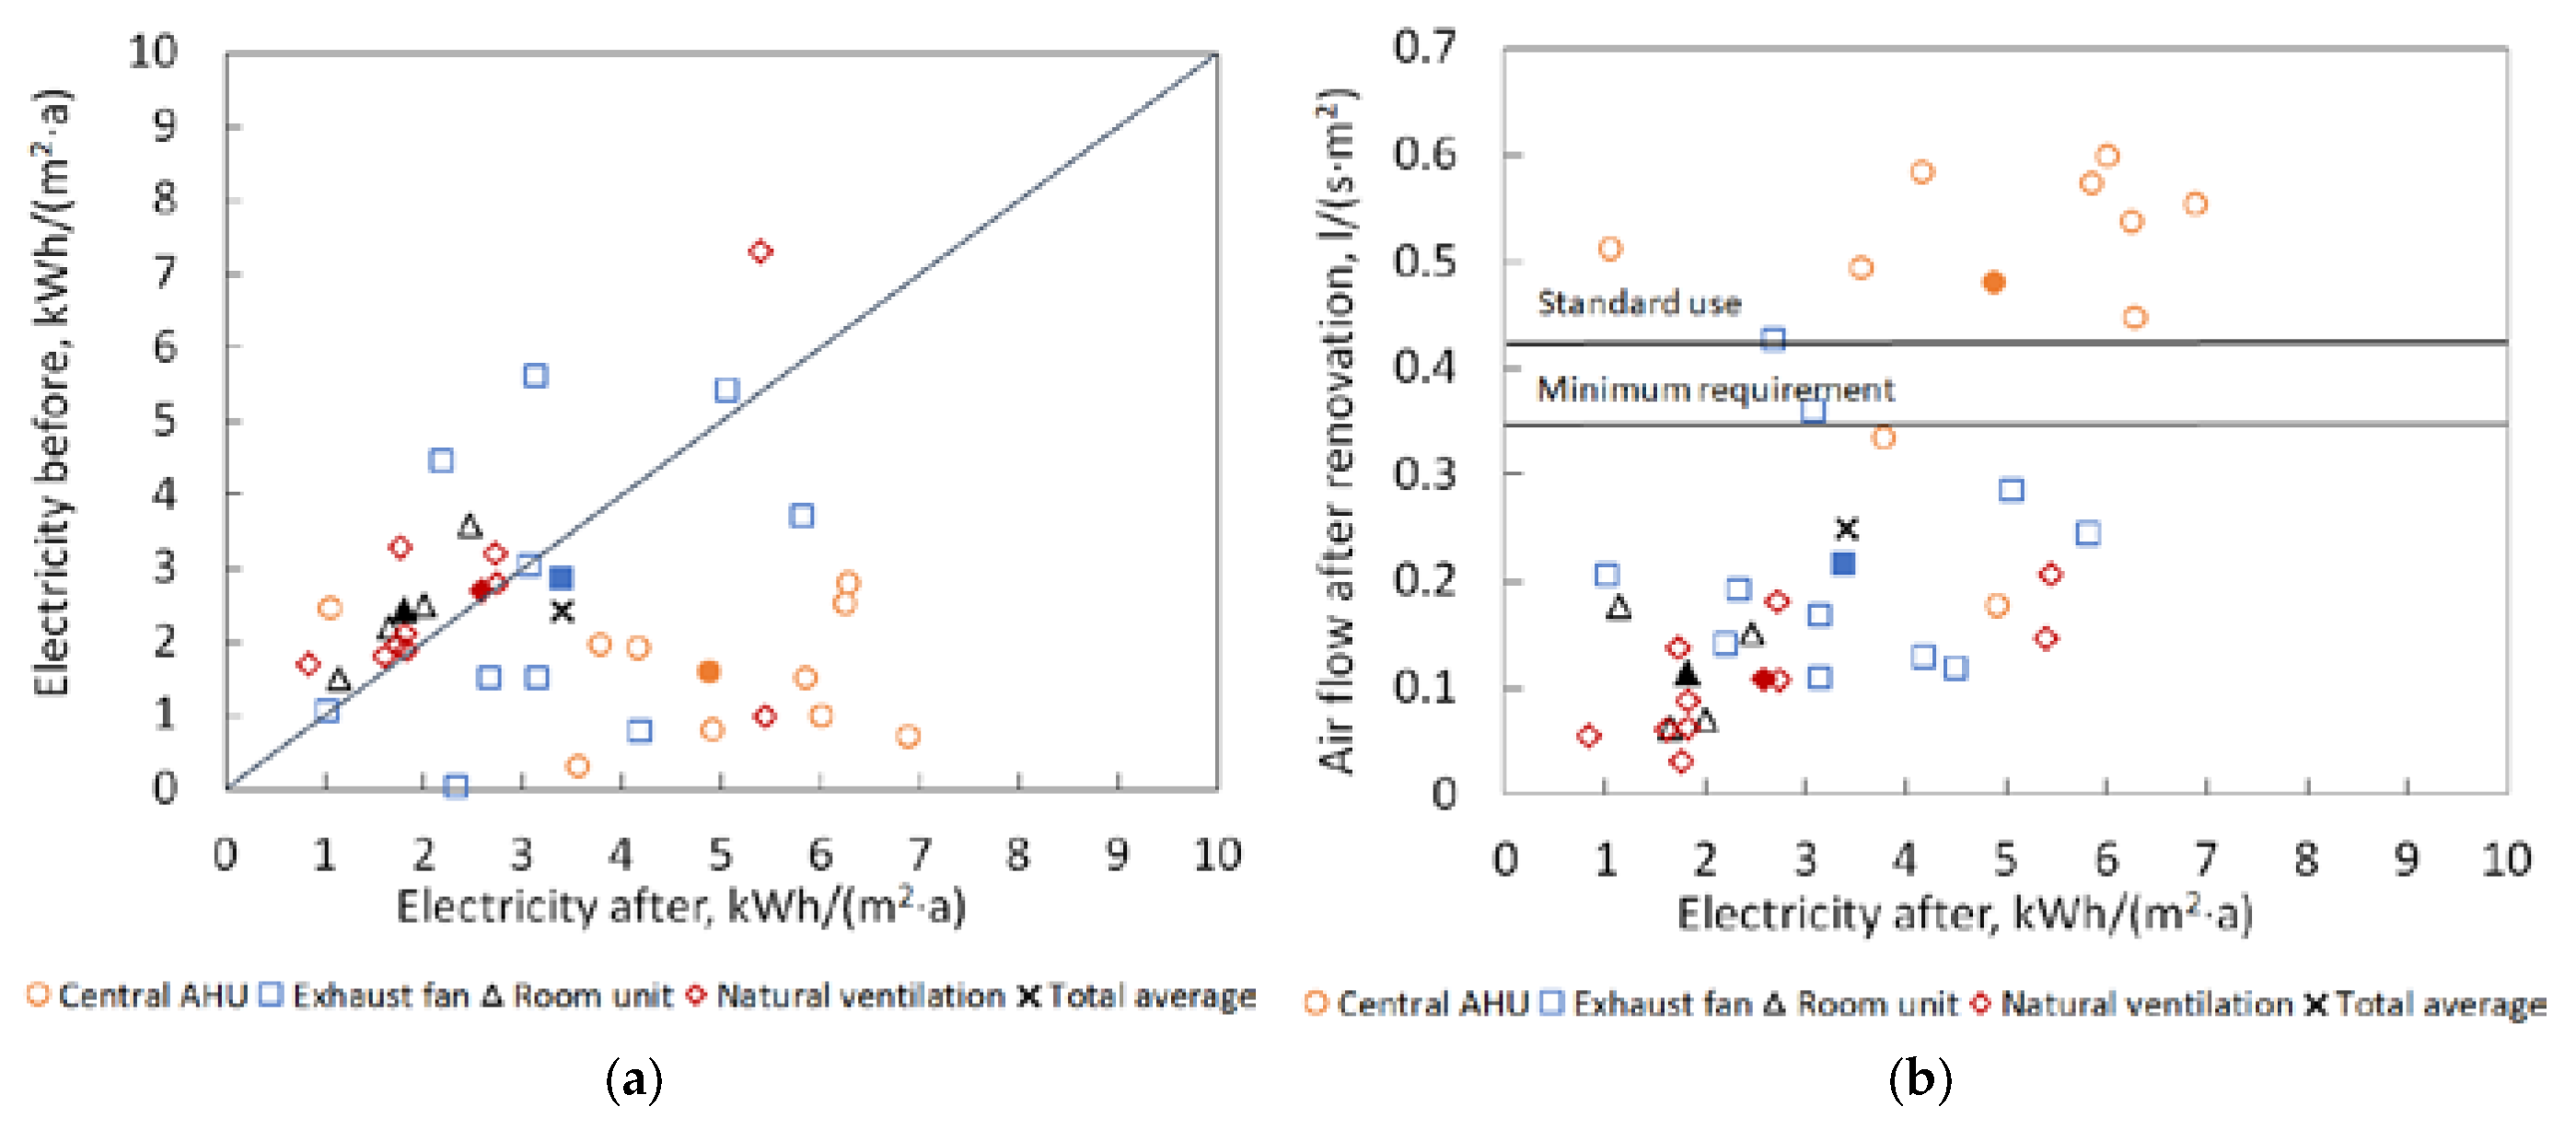
The use of electricity in common spaces (includes circulation pumps for DHW and heating, and electricity for central ventilation units) in all buildings was, after renovation, 0.9 kWh/(m2·a) higher (Figure 11a) than before renovation. The increase of the use of electricity in common spaces was significantly higher (p = 0.001) in buildings with central AHU compared with buildings with other ventilation types. Figure 11a, shows that in buildings with a central AHU, the average electricity use increased from 1.6 kWh/(m2·a) before renovation to 4.9 kWh/(m2·a) after renovation. Figure 11b, shows that after the renovation, airflow in these buildings was also higher than in other buildings (average 0.5 L/(s·m2)). An increase in the use of electricity in general spaces after the renovation was very small in buildings with other ventilation systems.
4. Discussion
Indoor temperature was, on average, 1.6 °C higher after renovation (22.4 °C), which is 1.4 °C higher than the value used for indoor climate and energy modeling. If thermostatic valves were installed during the renovation, inhabitants now had the possibility to regulate their living temperature. This could be a reason for higher indoor temperatures. After renovation, the building is well insulated and should use less energy for space heating. As the heating bill is now not so high for occupants, they enjoy a higher temperature. This phenomenon can be described by the rebound effect. Higher room temperatures after renovation have been shown in other studies [29,30,31,32]. Higher room temperature also causes higher heating energy consumption. Földveary et al. [33] showed that a room temperature increase of 1 °C increases the heating energy consumption in energy efficient buildings by 16.8%. Based on the questionnaire, occupant satisfaction about indoor temperatures was good. Some difference existed between the reported and the calculated PMV based on measurements values in the rage outside of neutral zone. Occupants reported very severe conditions than we may calculate based on measurements. This may be caused on different clothing and activity levels and there always exist some unsatisfied persons [34].
This situation is much better than previous cross-sectional studies about the building’s technical condition and occupant behavior have shown. Kalamees at al. [35] showed the main problems related to building physics, indoor climate, HVAC systems, and energy efficiency. Typical indoor climate related problems have been stuffy air, uneven temperature in different rooms, problems with temperature regulation possibility, etc.
Based on our questionnaire, occupants were satisfied with the indoor temperature even though the temperature was more than 1 °C higher than that used for energy modeling. To achieve realistic estimates for energy use after renovation, we suggest increasing the room temperature to 22 °C.
It is proposed that an individual heating metering system in apartments could motivate occupants to avoid a too high room temperature. Hamburg et al. [36,37] showed that instead of lowering the room temperature, occupants started decreasing the ventilation airflow and neighboring heating in well-insulated buildings.
Ventilation airflow was lower than designed in buildings with natural ventilation, mechanical exhaust ventilation, and supply-exhaust room units. In apartments with outdoor air inlets, drafts occur during the cold period. Therefore, occupants start closing the ventilation air inlets, thereby also decreasing exhaust airflow. In apartments with room-based supply and exhaust ventilation units, the drawbacks of using designed airflow are a high noise level, low pressure drop, operation management, and inefficient heat recovery. To achieve the designed airflows, we recommend using, in the renovation of residential buildings, central supply and exhaust ventilation units with heat recovery or apartment-based supply and exhaust ventilation units with heat recovery that showed a satisfactory performance in detached houses in a cold climate [38]. Based on questionnaire only 20% of occupants were dissatisfied with indoor air quality even when required ventilation airflows were not guaranteed after renovation. This shows that occupants adapted to the worsened air quality.
We measured that the use of DHW was similar with other Estonian apartment buildings [39,40] but higher than in other countries: the EU average is 25 kWh/(m2·a), Sweden 29 kWh/(m2·a), and Norway 30 kWh/(m2·a) [10]. Our study showed a difference in the use of energy in buildings with and without DHW circulation. A difference in the energy use for DHW with and without circulation shows the need to calculate DHW circulation losses separately. Cali [14] has also showed that DHW distribution losses can be very high. We recommend calculating DHW circulation separately from DHW to get comparable values with standard use.
The use of electricity in buildings showed a good match between the use before and after the renovation. This shows that it does not influence occupant behavior too much. Liu [41] showed that household electricity can increase after renovation, but this was related to new installations. When comparing the use of household electricity with standard use, we can see a large variation between buildings. The relative difference varied between −54% until +35% but average difference between after and before renovation is 3.1 kWh/(m2·a). In three buildings the electricity use difference was more than 5 kWh/(m2·a). In the same buildings the difference in electricity use was also apparent for a three-year period before the renovations.
The installation of mechanical ventilation increased the use of electricity due to electric fans. The increase was significantly higher in buildings with a central air-handling unit. Compared with other ventilation systems, the higher values were due to the better performance of ventilation, as the ventilation airflow was much lower than required in buildings with other ventilation systems. Even though the electricity use increases when installing mechanical ventilation, the total energy balance is positive in cold climate conditions. Many studies have shown that installation of mechanical ventilation with heat recovery in cold climates is cost-effective in total [39,40,42].
5. Conclusions
Our study room temperature increased after the renovation. Temperature after the renovation is, on average, 1.6 °C higher than before the renovation, which shows a rebound effect during the renovation. Even though the indoor temperature was higher compared to the standard use; occupants were satisfied with the temperature. To achieve a realistic estimation for energy use after the renovation, we suggest increasing the room temperature in simulations to 22 °C.
The current study confirmed that the current standard electricity and DHW use in Estonian energy-modeling regulations are correct. We showed that installation DHW circulation significantly influences the energy use for DHW (p ≤ 0.001). We recommend in the future separating DHW energy use for heating and circulation energy use. The electricity usage before and after renovation depends in most cases only whether a central AHU is installed or not and on the ventilation airflow.
Ventilation airflow was lower than designed in buildings with natural ventilation, mechanical exhaust ventilation, and supply-exhaust room units. In the majority of buildings with central supply and balanced ventilation with heat recovery, ventilation airflow was as designed. To achieve required airflows, we recommend using, in the renovation of residential buildings, central or apartment-based supply and exhaust ventilation units with heat recovery.
Our study also showed that the behavior of people is more or less the same as it was before renovation. Even for energy performance certification, the standard use of buildings is unavoidable; for cost-efficient energy renovation measures we recommend taking into account building-specific user profiles.
In future studies it will be important to analyze DHW circulation losses more deeply, as our study showed that in renovated apartment buildings which are using less energy, distribution losses have an impact on energy efficiency. As after renovation the total energy use decreases, all deviation from target values makes large relative difference for more energy efficient buildings. As user behavior become more and more important topic in constructing new and renovating existing energy efficient buildings, it is important to analyze occupants behavior more deeply.
Author Contributions
Analyses of the measured data was carried out by A.H. The research principles of the study were developed together with T.K.
Funding
This research was funded by the Estonian Centre of Excellence in Zero Energy and Resource Efficient Smart Buildings and Districts, ZEBE, grant number TK146, funded by the European Regional Development Fund, and by the Estonian Research Council, with Institutional research funding grant IUT1–15.
Acknowledgments
Authors would also like to thank Fund Kredex for cooperation and financial support for our research work.
Conflicts of Interest
The authors declare no conflict of interest.
References
- Kurnitski, J.; Kuusk, K.; Tark, T.; Uutar, A.; Kalamees, T.; Pikas, E. Energy and investment intensity of integrated renovation and 2030 cost optimal savings. Energy Build. 2014, 75, 51–59. [Google Scholar] [CrossRef]
- Directive (EU) 2018/844 of the European Parliament and of the Council of 30 May 2018 Amending Directive 2010/31/EU on the Energy Performance of Buildings and Directive 2012/27/EU on Energy Efficiency. Off. J. Eur. Union 2018. Available online: https://eur-lex.europa.eu/legal-content/EN/TXT/?uri=OJ:L:2018:156:TOC (accessed on 15 November 2018).
- EED. Directive 2012/27/EU of the European Parliament and of the Council of 25 October 2012 on Energy Efficiency, Amending Directives 2009/125/EC and 2010/30/EU and Repealing Directives 2004/8/EC and 2006/32/EC. Off. J. Eur. Union 2012. Available online: https://eur-lex.europa.eu/legal-content/EN/TXT/?uri=OJ:L:2012:315:TOC (accessed on 15 November 2018).
- RED, Directive 2009/28/EC of the European Parliament and of the Council of 23 April 2009 on the Promotion of the Use of Energy from renewable sources and amending and subsequently repealing Directives 2001/77/EC and 2003/30/EC. Off. J. Eur. Union 2009. Available online: https://eur-lex.europa.eu/legal-content/EN/TXT/?uri=OJ:L:2009:140:TOC (accessed on 15 November 2018).
- D’Agostino, D.; Zangheri, P.; Castellazzi, L. Towards Nearly Zero Energy Buildings in Europe: A Focus on Retrofit in Non-Residential Buildings. Energies 2017, 10, 117. [Google Scholar] [CrossRef]
- Pombo, O.; Allacker, K.; Rivela, B.; Neila, J. Sustainability assessment of energy saving measures: A multi-criteria approach for residential buildings retrofitting—A case study of the Spanish housing stock. Energy Build. 2016, 116, 384–394. [Google Scholar] [CrossRef] [Green Version]
- Paiho, S.; Pinto, I.S.; Jimenez, C. An energetic analysis of a multifunctional façade system for energy efficient retrofitting of residential buildings in cold climates of Finland and Russia. Sustain. Cities Soc. 2015, 15, 75–85. [Google Scholar] [CrossRef]
- Thomsen, K.E.; Rose, J.; Mørck, O.; Jensen, S.Ø.; Østergaard, I.; Knudsen, H.N.; Bergsøe, N.C. Energy consumption and indoor climate in a residential building before and after comprehensive energy retrofitting. Energy Build. 2016, 123, 8–16. [Google Scholar] [CrossRef]
- Kuusk, K.; Kalamees, T. nZEB Retrofit of a Concrete Large Panel Apartment Building. Energy Procedia 2015, 78, 985–990. [Google Scholar] [CrossRef]
- Kurnitski, J.; Ahmed, K.; Hasu, T.; Kalamees, T.; Lolli, N.; Lien, A.; Jan, J. Nzeb Energy Performance Requirements in Four Countries vs. European Commission Recommendations. In Proceedings of the REHVA Annual Meeting Conference, Brussels, Belgium, 23 April 2018; pp. 1–8. [Google Scholar]
- Ahmed, K.; Pylsy, P.; Kurnitski, J. Monthly domestic hot water profiles for energy calculation in Finnish apartment buildings. Energy Build. 2015, 97, 77–85. [Google Scholar] [CrossRef]
- Sorrell, S. Energy Substitution, Technical Change and Rebound Effects. Energies 2014, 7, 2850–2873. [Google Scholar] [CrossRef] [Green Version]
- Sorrell, S. The Rebound Effect: An Assessment of the Evidence for Economy-Wide Energy Savings from Improved Energy Efficiency; UKERC: London, UK, 2007; ISBN 1-903144-0-35. [Google Scholar]
- Calì, D.; Osterhage, T.; Streblow, R.; Müller, D. Energy performance gap in refurbished German dwellings: Lesson learned from a field test. Energy Build. 2016, 127, 1146–1158. [Google Scholar] [CrossRef]
- Mohareb, E.; Hashemi, A.; Shahrestani, M.; Sunikka-Blank, M. Retrofit Planning for the Performance Gap: Results of a Workshop on Addressing Energy, Health and Comfort Needs in a Protected Building. Energies 2017, 10, 1177. [Google Scholar] [CrossRef]
- Zhang, Y.; Bai, X.; Mills, F.P.; Pezzey, J.C.V. Rethinking the role of occupant behavior in building energy performance: A review. Energy Build. 2018, 172, 279–294. [Google Scholar] [CrossRef]
- Desideri, U.; Yan, J.; Menezes, A.C.; Cripps, A.; Bouchlaghem, D.; Buswell, R. Predicted vs. actual energy performance of non-domestic buildings: Using post-occupancy evaluation data to reduce the performance gap. Appl. Energy 2012, 97, 355–364. [Google Scholar] [Green Version]
- Ilomets, S.; Kuusk, K.; Paap, L.; Arumägi, E.; Kalamees, T. Impact of linear thermal bridges on thermal transmittance of renovated apartment buildings. J. Civ. Eng. Manag. 2017, 23, 96–104. [Google Scholar] [CrossRef]
- Ilomets, S.; Kalamees, T.; Vinha, J. Indoor hygrothermal loads for the deterministic and stochastic design of the building envelope for dwellings in cold climates. J. Build. Phys. 2017. [Google Scholar] [CrossRef]
- Mikola, A.; Kalamees, T.; Kõiv, T.-A. Performance of ventilation in Estonian apartment buildings. Energy Procedia 2017, 132, 963–968. [Google Scholar] [CrossRef]
- Kuusk, K.; Kalamees, T. Estonian Grant Scheme for Renovating Apartment Buildings. Energy Procedia 2016, 96, 628–637. [Google Scholar] [CrossRef]
- Hamburg, A.; Kalamees, T. Improving the indoor climate and energy saving in renovated apartment buildings in Estonia. In Proceedings of the 9th International Cold Climate HVAC 2018, Kiruna, Sweden, 12–15 March 2018. [Google Scholar]
- Jõesaar, T.; Hamburg, A. Korterelamute Energiaauditite Koostamise Juhend (Guideline for Energy Audits of Apartment Buildings); SA KredEx: Tallinn, Estonia, 2015. [Google Scholar]
- Toode, A.; Kõiv, T.-A. Investigation of the Domestic Hot Water Consumption in the Apartment Building. Proc. Est. Acad. Sci. Eng. 2005, 11, 207–214. [Google Scholar]
- ISO 7730. Moderate Thermal Environments—Determination of the PMV and PPD Indices and Specification of the Conditions for Thermal Comfort; ISO: Geneva, Switzerland, 1994. [Google Scholar]
- Da Silva, M.C.G. Spreadsheets for Calculation of Thermal Comfort Indices PMV and PPD; University of Coimbra: Coimbra, Portugal, 2014. [Google Scholar] [CrossRef]
- EN 15251. Indoor Environmental Input Parameters for Design and Assessment of Energy Performance of Buildings Addressing Indoor Air Quality, Thermal Environment, Lighting and Acoustics; CEN: Brussels, Belgium, 2007. [Google Scholar]
- 7 RT I, 19.01.2018, MKM määrus nr. 58, Hoonete Energiatõhususe Arvutamise Metoodika (Minister of Economic Affairs and Communications Regulation nr. 58, Methodology for Calculating the Energy Performance of Buildings). 2018. Available online: https://www.riigiteataja.ee/akt/119012018007 (accessed on 15 November 2018).
- Branco, G.; Lachal, B.; Gallinelli, P.; Weber, W. Predicted versus observed heat consumption of a low energy multifamily complex in Switzerland based on long-term experimental data. Energy Build. 2004, 36, 543–555. [Google Scholar] [CrossRef]
- La Fleur, L.; Moshfegh, B.; Rohdin, P. Measured and predicted energy use and indoor climate before and after a major renovation of an apartment building in Sweden. Energy Build. 2017, 146, 98–110. [Google Scholar] [CrossRef]
- Földváry, V.; Bukovianska, H.P.; Petráš, D. Analysis of Energy Performance and Indoor Climate Conditions of the Slovak Housing Stock before and after its Renovation. Energy Procedia 2015, 78, 2184–2189. [Google Scholar] [CrossRef]
- Broderick, Á.; Byrne, M.; Armstrong, S.; Sheahan, J.; Coggins, A.M. A pre and post evaluation of indoor air quality, ventilation, and thermal comfort in retrofitted co-operative social housing. Build. Environ. 2017, 122, 126–133. [Google Scholar] [CrossRef]
- Földváry, V.; Bekö, G.; Langer, S.; Arrhenius, K.; Petráš, D. Effect of energy renovation on indoor air quality in multifamily residential buildings in Slovakia. Build. Environ. 2017, 122, 363–372. [Google Scholar] [CrossRef]
- Fabbri, K. Thermal comfort evaluation in kindergarten: PMV and PPD measurement through datalogger and questionnaire. Build. Environ. 2013, 68, 202–214. [Google Scholar] [CrossRef]
- Kalamees, T.; Ilomets, S.; Arumägi, E.; Kuusk, K.; Liias, R.; Kõiv, T.-A.; Õier, K. Research demand of old apartment buildings in Estonia. In Proceedings of the IEA Annex 55 (RAP-RETRO), Working Meeting, Holzkirchen, Germany, 15–16 April 2010. [Google Scholar]
- Hamburg, A.; Kalamees, T. Method to divide heating energy in energy efficient building without direct measuring. Energy Procedia 2017. [CrossRef]
- Hamburg, A.; Thalfeldt, M.; Kõiv, T.; Mikola, A. Investigation of heat transfer between neighbouring apartments. In Proceedings of the 9th International Conference “Environmental Engineering”, Vilnius, Lithuania, 22–23 May 2014. [Google Scholar]
- Kurnitski, J.; Eskola, L.; Palonen, J. Ventilation in 102 Finnish single-family houses. In Proceedings of the 8th REHVA World Congress High Tech, Low Energy: Experience the Future of Building Technologies, Lausanne, Sweden, 9–12 October 2005; p. 6. [Google Scholar]
- Kuusk, K.; Kalamees, T.; Maivel, M. Cost effectiveness of energy performance improvements in Estonian brick apartment buildings. Energy Build. 2014, 77. [Google Scholar] [CrossRef]
- Arumägi, E.; Kalamees, T. Analysis of energy economic renovation for historic wooden apartment buildings in cold climates. Appl. Energy 2014, 115, 540–548. [Google Scholar] [CrossRef]
- Liu, L.; Rohdin, P.; Moshfegh, B. Evaluating indoor environment of a retrofitted multi-family building with improved energy performance in Sweden. Energy Build. 2015, 102, 32–44. [Google Scholar] [CrossRef]
- Alev, Ü.; Allikmaa, A.; Kalamees, T. Potential for financial- and energy saving of detached houses in Estonia. Energy Procedia 2015, 78, 907–912. [Google Scholar] [CrossRef]
Figure 1.
An example of a building (a) before and (b) after the renovation.

Figure 2.
(a) Indoor temperature before and after renovation; (b) Indoor temperature performance gap from standard.
Figure 2.
(a) Indoor temperature before and after renovation; (b) Indoor temperature performance gap from standard.

Figure 3.
Occupant satisfaction with the room temperature in apartments.

Figure 4.
Calculated PMV index and PMV index by questionnaire.

Figure 5.
Occupant evaluation on the change of room air temperature after renovation.

Figure 6.
Ventilation airflow after renovation in studied buildings.

Figure 7.
Occupant evaluation of ventilation quality.

Figure 8.
(a) DHW use before and after renovation; (b) DHW performance gap from standard (one building parameter is with hole and group average is filled).
Figure 8.
(a) DHW use before and after renovation; (b) DHW performance gap from standard (one building parameter is with hole and group average is filled).

Figure 9.
(a) DHW use gap from average usage per person (L/(pers.·d)) and use gap from standard use per heated area (kWh/(m2·a)) without DHW circulation and (b) with DHW circulation.
Figure 9.
(a) DHW use gap from average usage per person (L/(pers.·d)) and use gap from standard use per heated area (kWh/(m2·a)) without DHW circulation and (b) with DHW circulation.

Figure 10.
(a) Electricity use before and after renovation; (b) Electricity performance gap from standard use.
Figure 10.
(a) Electricity use before and after renovation; (b) Electricity performance gap from standard use.

Figure 11.
(a) Electricity use in common spaces (including pumps and ventilators) before and after renovation; (b) Electricity use in common spaces (including pumps and fans) after renovation compared with airflow.
Figure 11.
(a) Electricity use in common spaces (including pumps and ventilators) before and after renovation; (b) Electricity use in common spaces (including pumps and fans) after renovation compared with airflow.


Table 1.
Studied buildings. DHW: domestic hot water.
| Code | No. of Apartments | Heated Net Area, m2 | No. of People | Ventilation | DHW Circulation before/after Renovation | Additional Insulation, cm/Thermal Transmittance (U W/(m²·K)) | ||
|---|---|---|---|---|---|---|---|---|
| Walls | Roof | Windows | ||||||
| 1.1 | 25 | 1665 | 47 | Exhaust fan | −/+ | +20/0.16 | +30/0.10 | ≤1.1 |
| 1.2 | 18 | 1673 | 45 | Exhaust fan | −/+ | +15/0.18 | +45/0.10 | ≤1.6 |
| 1.3 | 18 | 1592 | 44 | Exhaust fan | +/+ | +15/0.18 | +30/0.12 | ≤1.5 |
| Target: EPC “D”, PE ≤ 180 kWh/(m2∙a) (DHW with electrical boilers). 40% grant. | ||||||||
| 2.1 | 12 | 1029 | 40 | Central AHU | −/− | +15–20/0.21 | +23/0.13 | ≤1.4 |
| 2.2 | 18 | 1490 | 27 | Central AHU | −/− | +15–20/0.20 | +30/0.11 | ≤1.3 |
| 2.3 | 18 | 1508 | 40 | Central AHU | −/− | +15/0.24 | +21/0.15 | ≤1.1 |
| 2.4 | 24 | 1370 | 41 | Central AHU | −/− | +15/0.20 | +30/0.12 | ≤1.3 |
| 2.7 | 18 | 1180 | 40 | Central AHU | −/− | +15/0.21 | +40/0.09 | ≤1.1 |
| Target: EPC “C” PE ≤ 150 kWh/(m2∙a) (with central Air Handling Unit (AHU)). 40% grant. | ||||||||
| 2.5 | 18 | 1306 | 45 | Central AHU | −/+ | +15/0.20 | +28/0.11 | ≤0.9 |
| 2.6 | 18 | 1306 | 35 | Central AHU | −/+ | +15/0.21 | +28/0.12 | ≤1.1 |
| 2.8 | 18 | 886 | 25 | Central AHU | −/+ | +15/0.21 | +35/0.09 | ≤1.1 |
| 2.9 | 12 | 903 | 24 | Central AHU | +/+ | +15/0.20 | +28/0.12 | ≤1.3 |
| Target: EPC “C” PE ≤ 150 kWh/(m2∙a) (with exhaust air heat pump). 40% grant. | ||||||||
| 2.10 | 55 | 3378 | 89 | Exhaust fan | +/+ | +20/0.16 | +25/0.16 | ≤1.1 |
| 2.11 | 32 | 1505 | 96 | Exhaust fan | +/+ | +15/0.21 | +30/0.12 | ≤0.9 |
| 2.12 | 50 | 3904 | 130 | Exhaust fan | +/+ | +20/0.19 | +35/0.15 | ≤1.1 |
| Target: Heating energy saving 30% (with natural ventilation and extra outdoor air inlets (FAI)). 15% grant. | ||||||||
| 15.1 | 60 | 3163 | 150 | NAT | −/− | +10/0.38 | +15/0.20 | ≤1.8 |
| 15.2 | 36 | 1718 | 61 | NAT+FAI | +/+ | +15–20/0.21 | +0/0.4 | ≤2.0 |
| 15.3 | 60 | 2959 | 150 | NAT | +/+ | +0–10/0.75 | +23/0.15 | ≤2.0 |
| 15.4 | 24 | 1737 | 60 | NAT+FAI | +/+ | +15/0.21 | +20/0.17 | ≤1.8 |
| 15.5 | 40 | 3075 | 100 | NAT | +/+ | +0–10/0.75 | +10/0.25 | ≤2.0 |
| Target: Heating energy saving 40% (with natural ventilation (NAT) and extra outdoor air inlets (FAI)). 25% grant. | ||||||||
| 25.1 | 12 | 777 | 27 | NAT+FAI | −/− | +15/0.21 | +25/0.13 | ≤1.6 |
| 25.2 | 40 | 2623 | 80 | NAT+FAI | +/+ | +10–15/0.30 | +25/0.13 | ≤1.4 |
| 25.3 | 60 | 3519 | 150 | NAT+FAI | +/+ | +15/0.21 | +20/0.17 | ≤1.6 |
| 25.4 | 12 | 550 | 24 | NAT | −/− | +15/0.21 | +25/0.13 | ≤1.6 |
| 25.5 | 16 | 1903 | 38 | NAT+FAI | −/− | +10–15/0.28 | +30/0.11 | ≤1.6 |
| Target: Heating energy saving 50% (supply-exhaust room units (SERU)). 35% grant. | ||||||||
| 35.1 | 18 | 1064 | 40 | SERU | −/+ | +10–15/0.30 | +13/0.20 | ≤1.4 |
| 35.2 | 18 | 1285 | 44 | SERU | −/+ | +15/0.21 | +13/0.20 | ≤1.6 |
| 35.7 | 18 | 1026 | 34 | SERU | +/+ | +5–15/0.28 | +23/0.15 | ≤1.6 |
| 35.9 | 12 | 940 | 30 | SERU | −/− | +15–20/0.20 | +20/0.17 | ≤1.6 |
| Target: Heating energy saving 50% (with exhaust air heat pump). 35% grant. | ||||||||
| 35.3 | 21 | 1527 | 60 | Exhaust fan | −/+ | +15/0.21 | +25/0.15 | ≤1.6 |
| 35.4 | 18 | 1041 | 40 | Exhaust fan | −/+ | +15/0.21 | +23/0.16 | ≤1.6 |
| 35.5 | 18 | 1162 | 40 | Exhaust fan | +/+ | +10/0.28 | +23/0.16 | ≤1.6 |
| 35.6 | 15 | 1151 | 38 | Exhaust fan | +/+ | +15/0.21 | +23/0.16 | ≤1.6 |
| 35.8 | 72 | 5030 | 200 | Exhaust fan | +/+ | +15/0.21 | +23/0.16 | ≤1.6 |
| Target: Heating energy saving 50% (with central Air Handling Unit (AHU)). 35% grant. | ||||||||
| 35.10 | 15 | 561 | 16 | Central AHU | −/− | +15/0.21 | +10/0.25 | ≤1.6 |
Table 2.
The influence of DHW energy consumption on circulation and renovation.
| DHW before and after Renovation | DHW Circulation after Renovation | ||
|---|---|---|---|
| Yes | No | ||
| DHW circulation before renovation | Yes | Before renovation: 42 kWh/(m2·a) After renovation: 39 kWh/(m2·a) | - |
| No | Before renovation: 24 kWh/(m2·a) After renovation: 37 kWh/(m2·a) | Before renovation: 21 kWh/(m2·a) After renovation: 21 kWh/(m2·a) | |
© 2018 by the authors. Licensee MDPI, Basel, Switzerland. This article is an open access article distributed under the terms and conditions of the Creative Commons Attribution (CC BY) license (http://creativecommons.org/licenses/by/4.0/).
Share and Cite
MDPI and ACS Style
Hamburg, A.; Kalamees, T. The Influence of Energy Renovation on the Change of Indoor Temperature and Energy Use. Energies 2018, 11, 3179. https://doi.org/10.3390/en11113179
AMA Style
Hamburg A, Kalamees T. The Influence of Energy Renovation on the Change of Indoor Temperature and Energy Use. Energies. 2018; 11(11):3179. https://doi.org/10.3390/en11113179
Chicago/Turabian StyleHamburg, Anti, and Targo Kalamees. 2018. "The Influence of Energy Renovation on the Change of Indoor Temperature and Energy Use" Energies 11, no. 11: 3179. https://doi.org/10.3390/en11113179
Note that from the first issue of 2016, this journal uses article numbers instead of page numbers. See further details here.