Economic Feasibility of Wave Energy Farms in Portugal


1
Departamento de Enxeñaría Naval e Industrial, Universidade da Coruña, Escola Politécnica Superior, Esteiro, 15471 Ferrol, Spain
2
Centre for Marine Technology and Ocean Engineering (CENTEC), Instituto Superior Técnico, Universidade de Lisboa, 1049-001 Lisboa, Portugal
*
Author to whom correspondence should be addressed.
Energies 2018, 11(11), 3149; https://doi.org/10.3390/en11113149
Submission received: 22 September 2018
/
Revised: 3 November 2018
/
Accepted: 6 November 2018
/
Published: 14 November 2018
(This article belongs to the Special Issue Wave and Tidal Energy)
Abstract
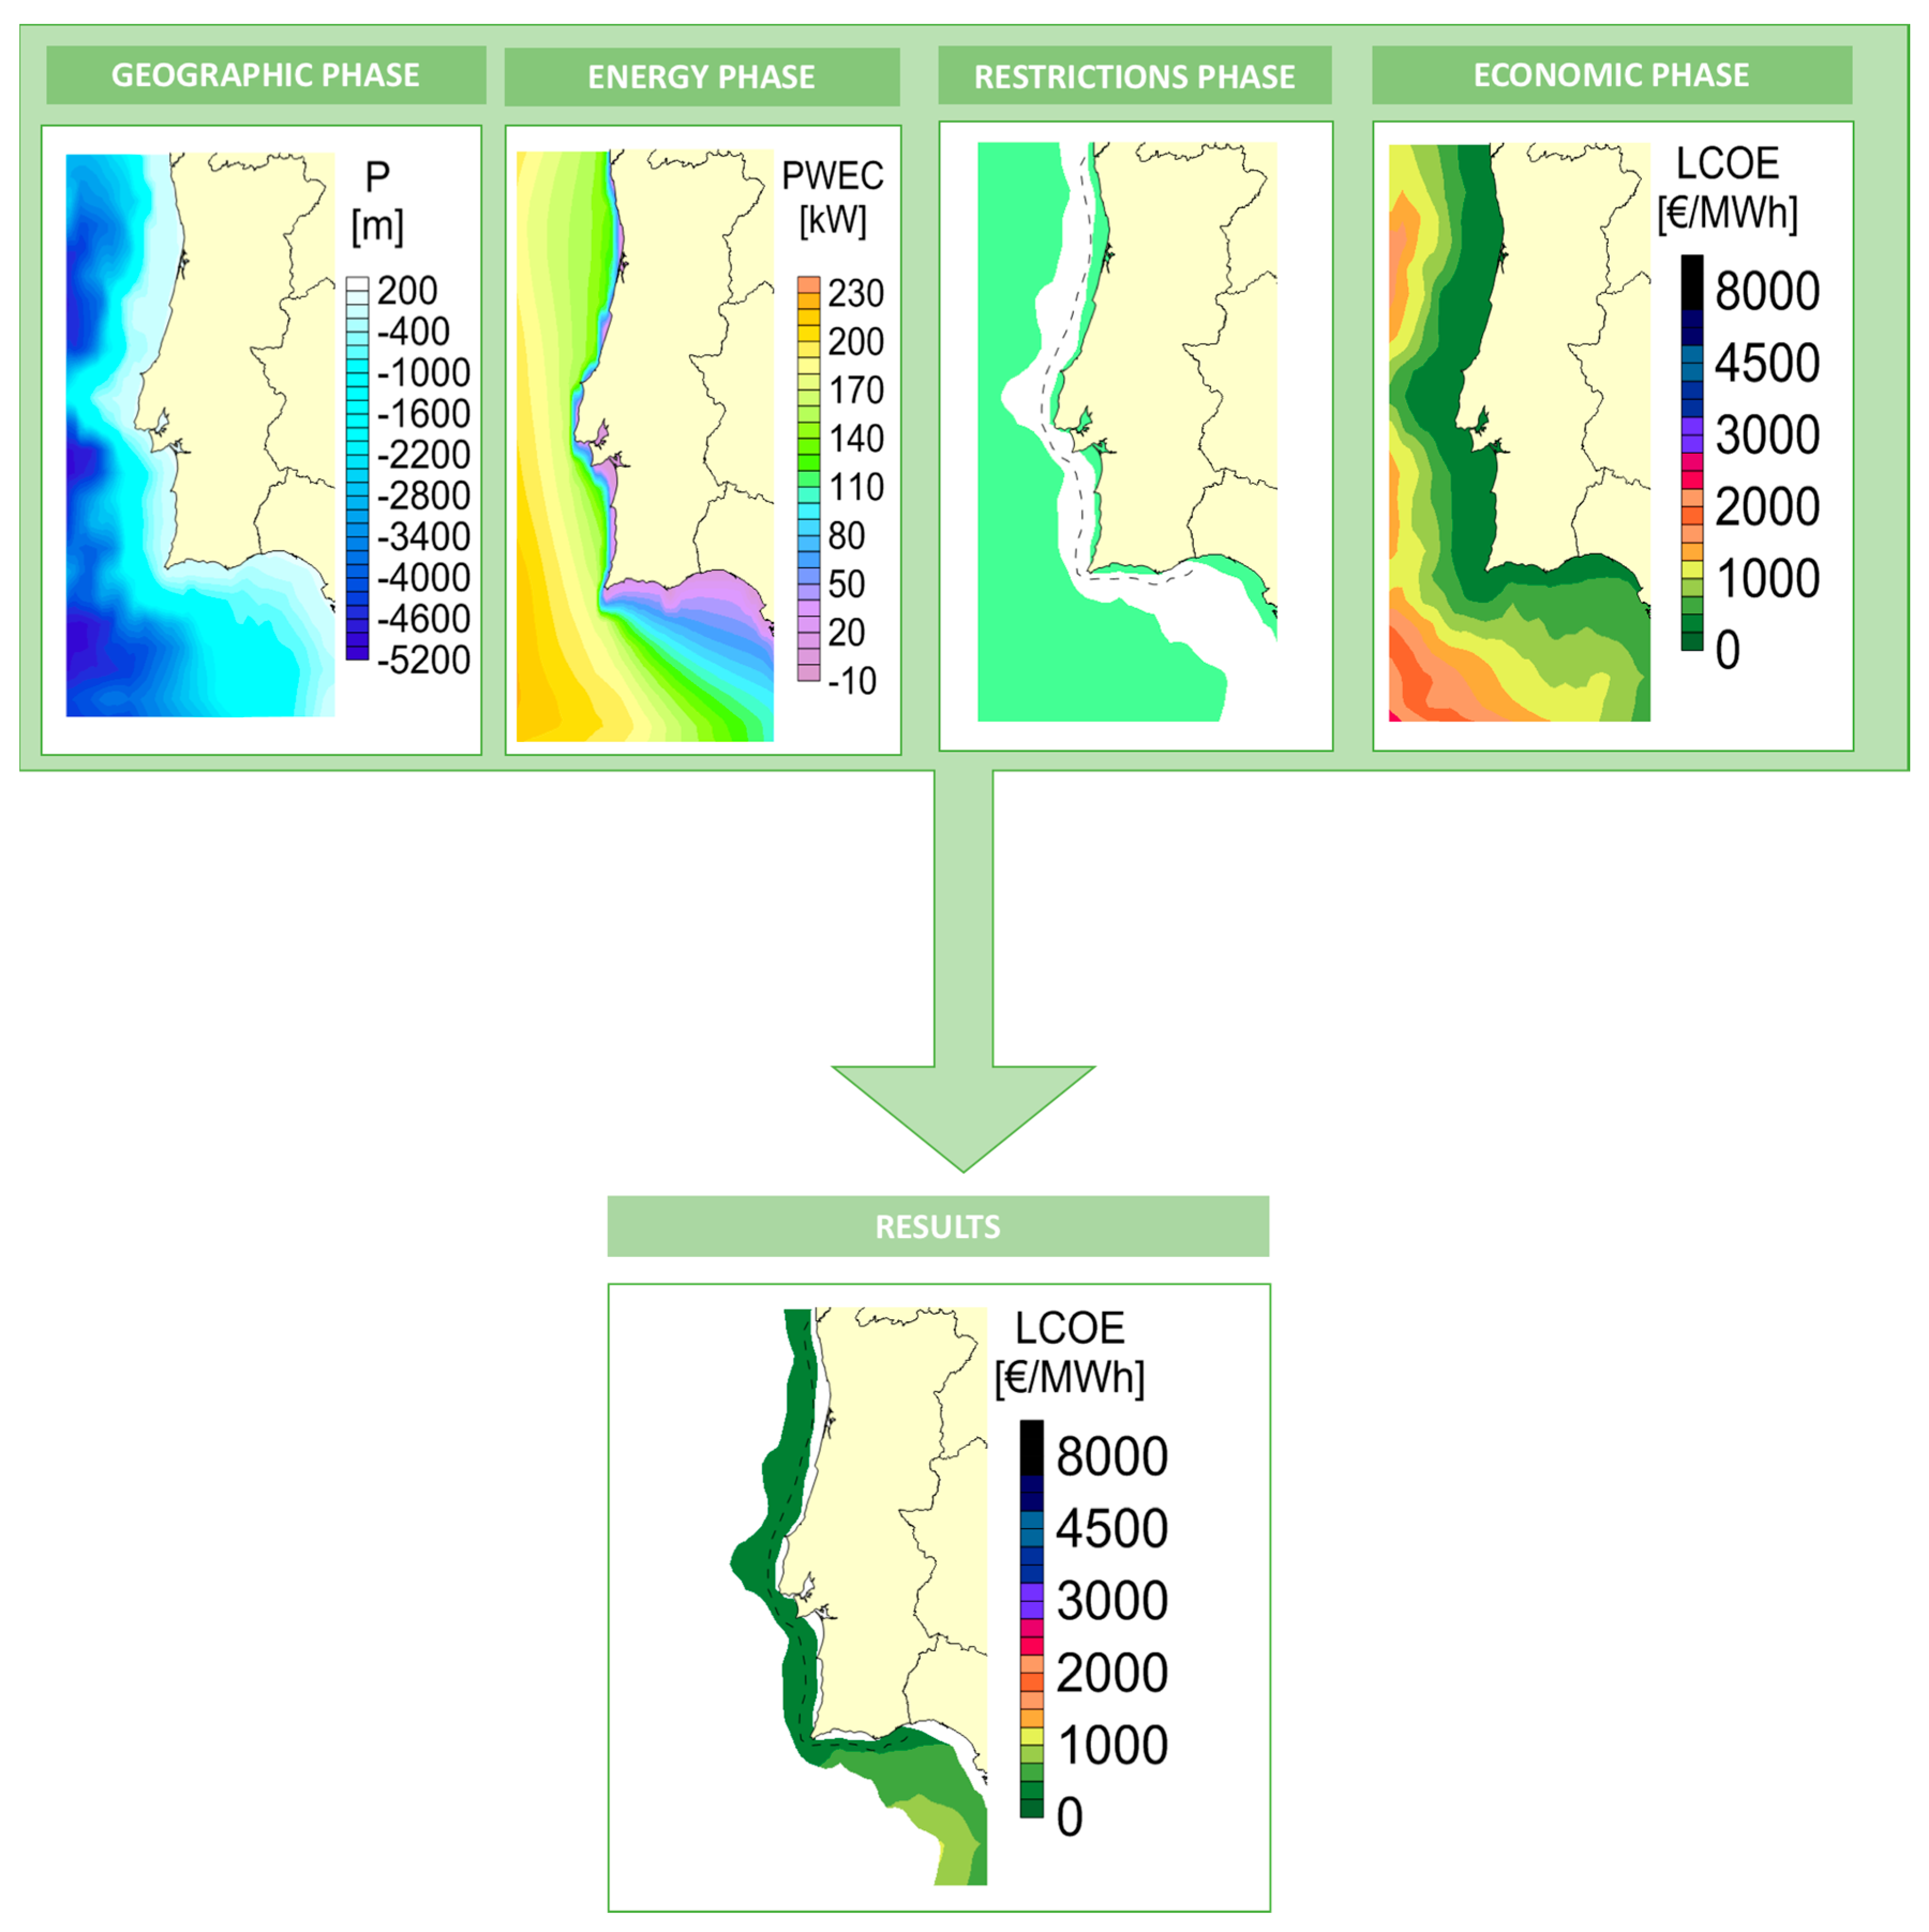
:This paper develops a methodology to determine the economic feasibility of implementing offshore wave energy farms on the Portuguese continental coast. This methodology follows several phases: the geographic phase, the energy phase, the economic phase, and the restrictions phase. First, in the geographic phase, the height and the period of the waves, the bathymetry, the distance from the farm to the shore, from farm to shipyard, and from farm to port, are calculated. In the energy phase the energy produced by each wave energy converter is determined, and in the economic phase, the parameters calculated in the previous phases are used as input to find the economic parameters. Finally, in the restrictions phase, a limitation by the bathymetry will be added to the economic maps, whose value will be different depending on the floating offshore wave energy converter (WEC). In this study, three wave energy converters have been considered, Pelamis, AquaBuOY, and Wave Dragon, and several scenarios for electric tariffs have been taken into account. The results obtained indicate what the best WEC is for this study in terms of its levelized cost of energy (LCOE), internal rate of return (IRR), and net present value (NPV), and where the best area is to install wave energy farms.
Keywords:
feasibility study; floating offshore wave farm; WEC; IRR; LCOE; ocean energy; marine energy1. Introduction
The first wave power patent was from the 18th century and during the centuries, lots of types of devices have been developed [1]. Wave energy converters (WEC) are the devices that can extract the energy from ocean waves. There are many ways the WECs can be classified. However, depending on their working principle, they can be classified as oscillating water columns, oscillating bodies, and overtopping devices [2,3]. The oscillating water column device works using an air turbine (Pico [4], LIMPET, Sakata, Mutriku [5], Mighty Whale [6], Ocean Energy, SPERBOY [7], Oceanlinx [8], and REWEC3 [9]); the oscillating bodies work with a hydraulic motor, a hydraulic turbine, and a linear electrical generator (AquaBuOY [10], IPS Buoy [11], FO3 [12], PowerBuoy [12], Wavebob [13], Pelamis [14,15], PS Frog [16], SEAREV [17], AWS (Archimedes Waveswing Submerged) [18], WaveRoller [19], and Oyster [20]); and the overtopping concept works with a low-head hydraulic turbine (TAPCHAN [21], SSG (Sea Slot-cone Generator) [22], and Wave Dragon [23]). They can also be classified by considering the water depth that they were designed to operate in; fixed (less than 50 m of depth or onshore) or floating (more than 50 m of depth) or the distance to shore [24]. Other WECs are: the Wavestar, which produces electricity due to the motion of the floats that are attached by arms to the platform [25]; the SeaBeavl, which is a “taut-moored dual-body” WEC designed to improve the maintenance process [26]; and Falcão et al. analyze the hydrodynamics of IPS Buoy [27]. This paper will be focused on floating WECs, which have the advantage of operating in deep water where more wave energy can be found and in a larger range of water depths, increasing the number of locations where they can be deployed. Veigas et al. [28] studied the wave and offshore wind energy potential of a Spanish island located in the Atlantic Ocean. This study is important because it presents maps of the areas selected. Liu et al. [29] studied the energy conversion of a prototype WEC buoy in China and they considered a farm of buoys. Martinelli et al. [30] developed a method to select the design power of WECs in the first steps of the development of the product. In addition, Martinelli et al. develop an analysis based on statistic aspects of the power from OWC (Oscillating Water Column) [31]. Zanuttigh et al. [32] analyze the feasibility of the use of WECs for coastal protection and they consider the Adriatic coast. Arena et al. [33] analyze the resonant WECs. In 2011, Portugal had an experimental project for wave energy: the WaveRoller prototype, with a budget of five million euros [13]. This is the country selected to develop the case study because it is a country very involved with ocean energies, having a pilot area in its north-west coast.
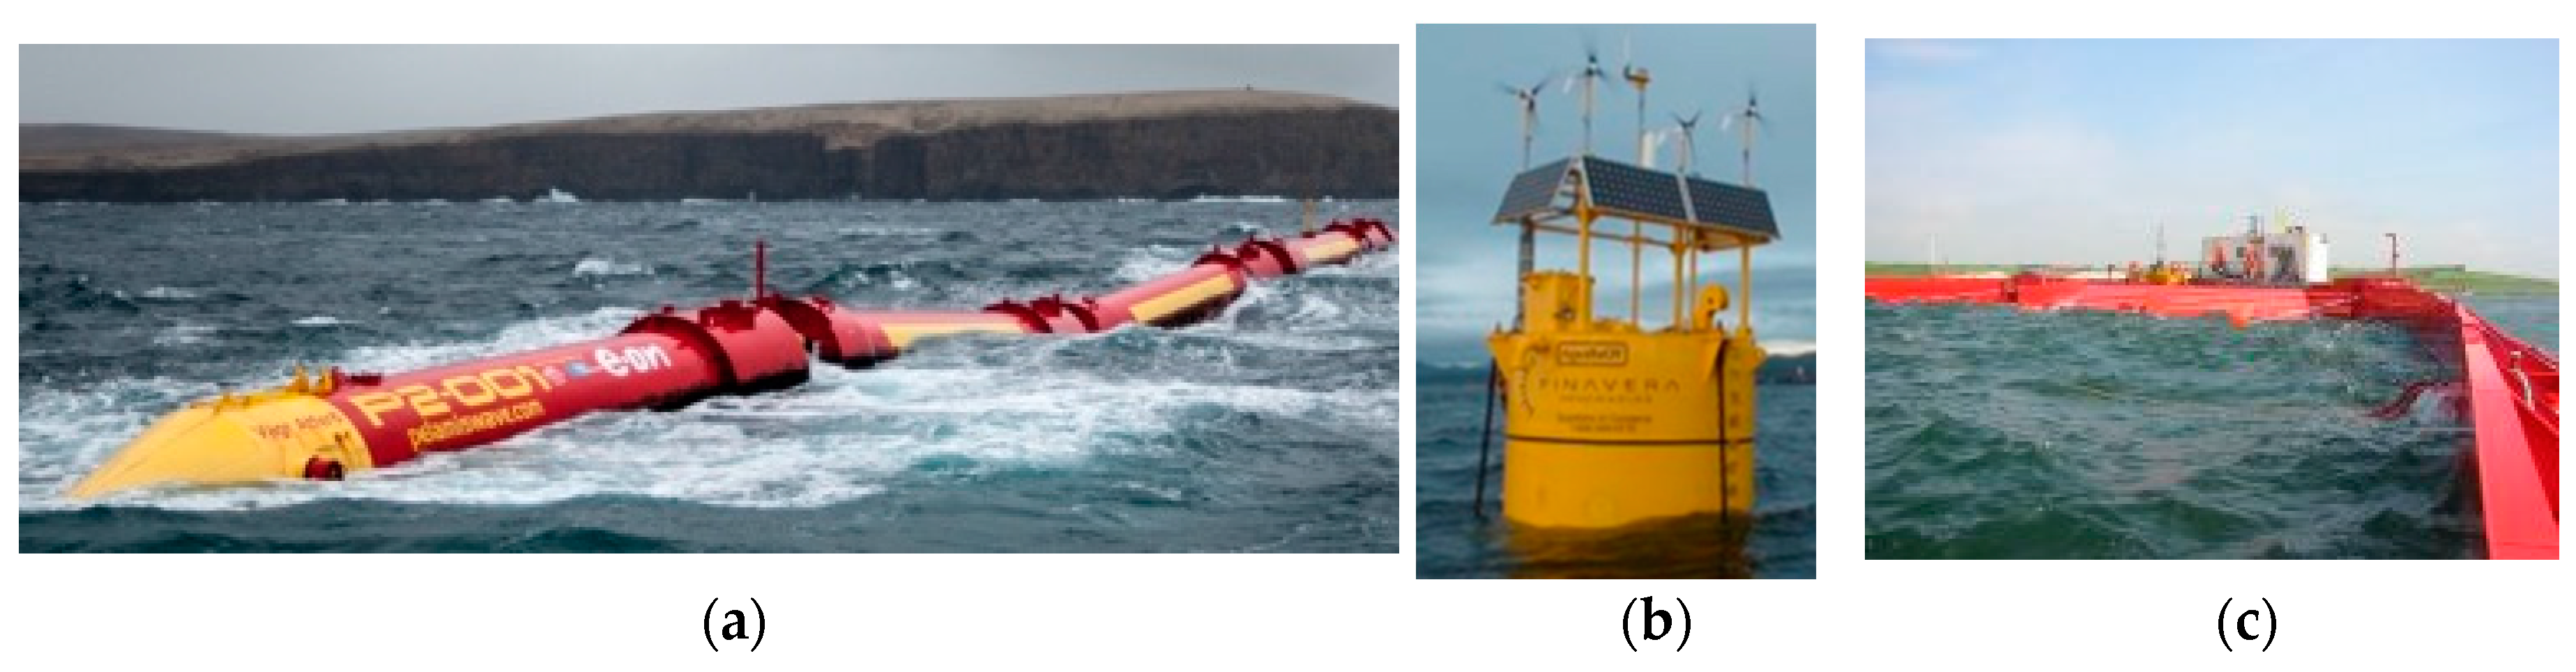
The present paper will be focused on three wave energy converters: Pelamis, AquaBuOY, and Wave Dragon. These devices are not in commercial exploration and the main reason for their selection is that they represent different types of devices, different sizes, and different energy outputs. The Pelamis is an articulated structure similar to a snake and has “cylindrical sections linked by hinged joints” [2]. It has been developed in the UK and it should be installed aligned with waves [2]. It has been tested in several sizes from 1998 to 2011 [34,35]. The AquaBuOY combines the hose-pump and the IPS Buoy, being a small and modular WEC. Wave Dragon is based on the principle of wave overtopping and has “two wave reflectors focusing the incoming waves towards a doubly curved ramp, a reservoir and a set of low-head hydraulic turbines” [2,36].
Regarding the assessment, performance, and feasibility analysis: Rusu et al. [37] developed the wave energy resource for Portugal; Bozzi et al. [38] analyzed the wave energy feasibility in Italy considering three WECs: AquaBuOY, Pelamis, and Wave Dragon; Iuppa et al. [39] analyzed the case of Sicily; Guedes Soares et al. [40] considered several coastal locations to determine their efficiency; Vannucchi et al. [41] considered several Italian coasts: “Tuscany, Sardinia, Liguria et Sicily”; Dalton [42] analyzed the “non-technical barriers of wave energy in Europe”; Dalton et al. [43] considered the Pelamis in three different scenarios in Europe and the USA; and O’Connor et al. [44] analyzed the analysis of Pelamis and Wavestar in Europe.
Bozzi et al. [38] decided on the offshore location of a wave farm in Italy only by considering a particular set of points of the geography, while in the present paper all points of a particular geography are considered (in this case Portugal). Iglesias et al. [45] and Veigas et al. [46] considered several points of the geography (in this case, Galicia) but only the available energy was considered, while in the present paper the economic aspects of each point of the geography is considered (Portugal). Beels et al. [47] did not take into account the maps of the geography, and the economic calculations were very elementary, while in the present paper detailed economic aspects are calculated for all locations producing economic maps. O’Connor et al. [48] considered some economic aspects of wave energy but they did not consider the map of all the locations of the selected region, however, the present paper shows the map of all the locations. In the present method, all points of the geography are calculated, and this is very important because, for example, in a point where the wave resource is very good it may not be possible to install wave energy farms because there are restrictions. In this sense, the present method allows the addition of restrictions (in this paper only bathymetry is considered, but other restrictions can also be added).
The aim of the present paper is to develop a methodology to calculate the economic feasibility of floating offshore wave energy farms following several phases: geographic phase, energy phase, economic phase, and restrictions phase. In the geographic phase, some parameters (the height and the period of the waves [49,50], the bathymetry and the distance farm to shore, farm to shipyard, and farm to port) are calculated to be used as input values in the economic phase. The energy phase determines the energy produced by each wave energy converter (WEC). It can be calculated considering several methods, depending on the data available and the precision wanted. Afterwards, in the economic phase, the economic parameters are calculated considering the inputs provided in the previous phases. Finally, the restriction phase, imposed by the bathymetry, will be added to the economic maps, whose value will be different depending on the floating offshore WEC. The WECs considered for this study are Pelamis, AquaBuOY, and Wave Dragon, whose energy yields are calculated using several scenarios for electric tariffs. They have been selected because they represent several types of devices, although some of them are not in operation nowadays. Results indicate what the best WEC is in terms of its LCOE (levelized cost of energy), IRR (internal rate of return), and NPV (net present value) and where the best area to implement a floating offshore wave energy farm is located. The method proposed was applied to Portugal, where a high wave energy resource can be found.
2. Materials and Methods
2.1. Procedure
The method proposed is based on four phases, as shown in Figure 1: geographic phase (inputs in the figure), energy phase (power matrix and sea state location in the figure), economic phase (LCOE calculation in the figure), and restrictions phase (restriction of bathymetry in figure).
2.2. Geographic Phase
The geographic phase is the first stage of this methodology. The parameters that have been used as input maps to generate output economic maps were calculated in this phase. The parameters were the significant wave height and the energy period of the waves, the bathymetry, the distance from farm to shore [51], farm to shipyard, and farm to port.
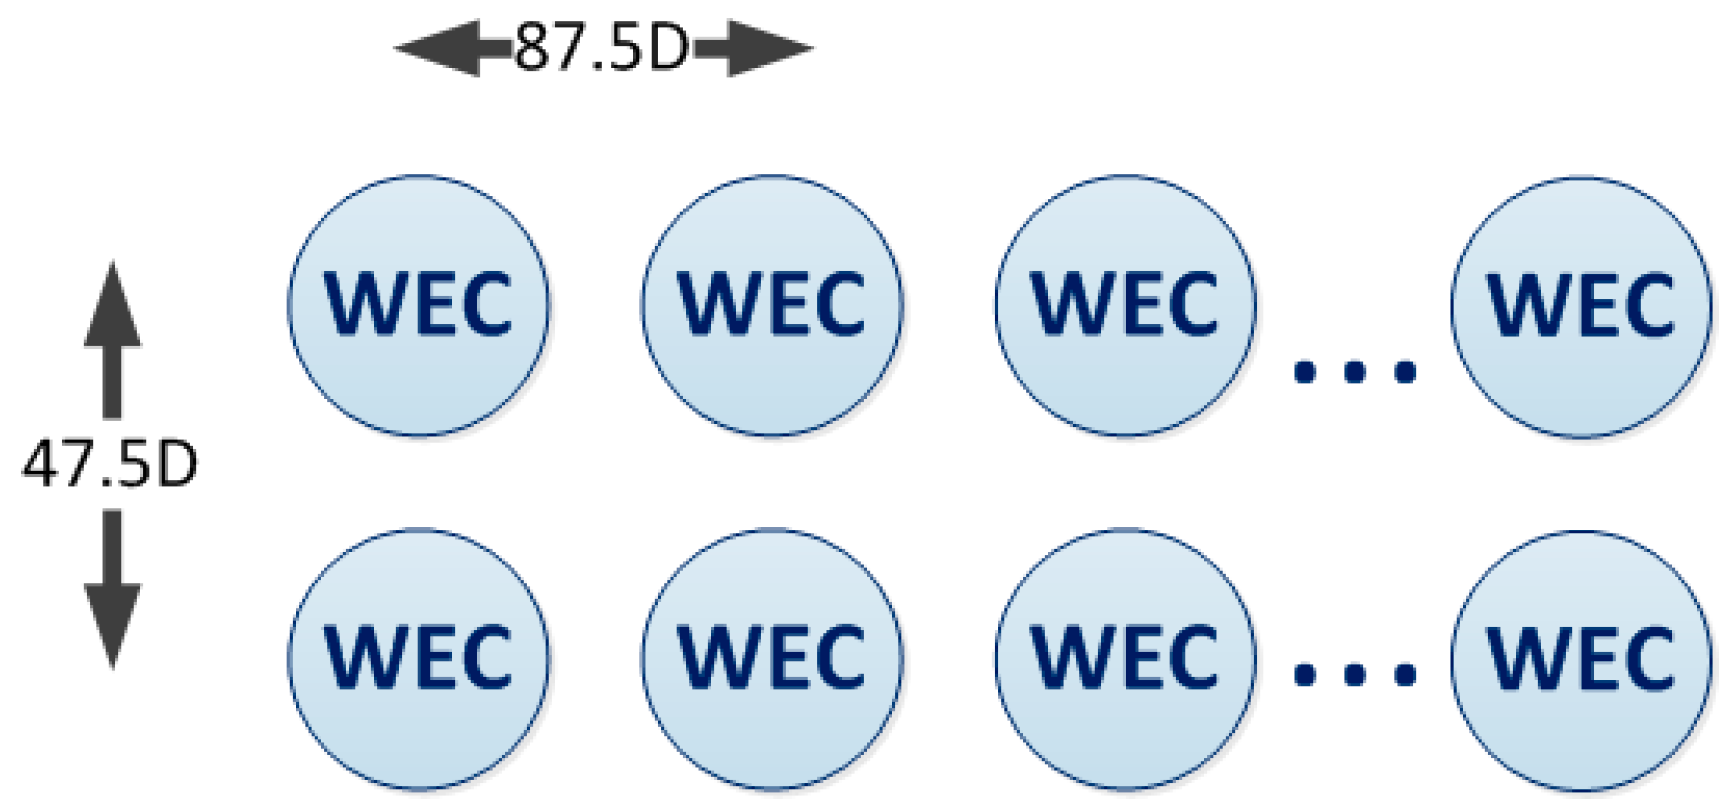
The wave parameters—significant wave height (Hs) and wave period (Tm)—were obtained from a previous hindcast study [49,50] using WW III (Wave Watch III) and SWAN (Simulating Waves Nearshore) in a coupled system. In terms of the size of the grid, it is important that a floating offshore wave energy farm can be located inside the cell. The distance between offshore WECs is 87.5 times the diameter (D) of the WEC and the distance between lines of WECs is 47.5 times the diameter (D) of the WEC, as Figure 2 shows. In the WECs considered, the main dimension is the diameter of the device.
The restriction assessment was done using the bathymetry from GEBCO (General Bathymetric Chart of the Oceans), which was also used in the SWAN simulations of the hindcast study mentioned above.
The grid maps of the bathymetry and the parameters Hs and Tm were interpolated so as to have the size recommended for the wave energy farm implementation. The interpolation was from a resolution of 0.05° × 0.1° in the case of Hs, Tm and bathymetry, and 0.5° × 0.5° in the case of wind to a resolution of 0.15° × 0.3°. The function interp2 of MATLAB was applied to the data in a linear interpolation.
2.3. Energy Phase
In the energy phase, the energy produced by each WEC () is calculated by Equation (1).
This calculation depends on the number of hours per year (), the WEC electric power generated (), the availability () and the losses due to transmission (). The is calculated by Equation (2).
The power matrix of the WEC is associated with the sea state probability of occurrence in the study location. In this equation, the nT is the number of period and nH is the number of wave height in the table, the is the probability of occurrence of the sea state corresponding to the bin defined by the line and the column and is the electric power corresponding to the same sea state or energy bin for the WEC considered [21]. Therefore, it is necessary to have the power matrix of the WEC, given by the supplier of the WEC considered, and the probability distribution matrix of the sea states for each point of the geography of the region of analysis. The devices studied here have their power matrices given in open literature.
2.4. Economic Phase
In the economic phase, two types of parameters were calculated to measure the economic viability of a wave energy farm deployment: the life-cycle cost of the wave energy farm and the economic parameters. For that, the values calculated in the geographic phase (the height of the waves, the period of the waves, the bathymetry, the distance from farm to shore, farm to shipyard, and farm to port) and energy phase (energy produced by the WEC) were used as inputs, which have different values for different points in the map (k).
The calculation of the life-cycle cost of the floating offshore wave energy farm () was based on the methodology developed in previous studies [22,23]. The methodology was based on the life-cycle process of floating offshore renewable energy devices, composed by six phases, attributing to each phase of the process the inherent costs, called the Life-cycle Cost System (LCS).
The phases along the life-cycle process and whose costs will be taken into account are [52]: the concept definition (C1), the design and development (C2), the manufacturing (C3), the installation (C4), the exploitation (C5), and the dismantling (C6). The Life-cycle cost system (LCS) of a floating offshore wave energy farm (FOWEF) was then calculated as Equation (3) shows:
Another measure of costs is the levelized cost of energy (), which takes into account the Life-cycle costs (), the energy produced by the wave energy farm () (without considering losses due to individual WEC efficiency or near field effects) in MWh/year and the capital cost of the project () [53,54]. The formula to calculate LCOE is Equation (4).
Also important is the parameter NPV (net present value, Equation (5)), which consists of the net value of the cash flows of the floating offshore wave farm, considering its discount from the beginning of the investment [54,55].
The NPV depends on the cash flow ( where is the expenses on year and the revenues on year), the life-cycle years (t), the initial investment (), and the discount rate (r) [26].
When the NPV is equal to zero, the IRR (internal rate of return) is calculated from Equation (6) [25,27].
The WACC (weighted average cost of capital) has been developed based on Equation (7).
It is dependent on the variables of total equity () and its costs (), total debt () and its costs (), and the tax shield ().The floating offshore wave energy farm (FOWEF) studied is economically feasible if the NPV > 0, the IRR > WACC, and LCOE presents low values.
2.5. Restrictions Phase
Once all the economic maps have been calculated, it is important to restrict the area where the wave energy farm is to be installed. This is due to the fact that there could be a good region in economic terms (IRR, NPV, and LCOE), but with limitations of usage (seismic fault lines, environmental protected areas, offshore electric cable lines, navigation areas, etc.). In this paper, the bathymetry is the only restriction taken into account.
The bathymetry restriction will be from (), being the maximum draft of all the floating offshore WECs considered, to 1000 m of depth, which is considered an adequate value to install this type of wave farm. The type of floating offshore wave platform also restricts the economic maps.
Finally, territorial waters (22.2 km) will also be shown in the maps because there is no law about the offshore space for offshore waves at the moment.
2.6. Case Study
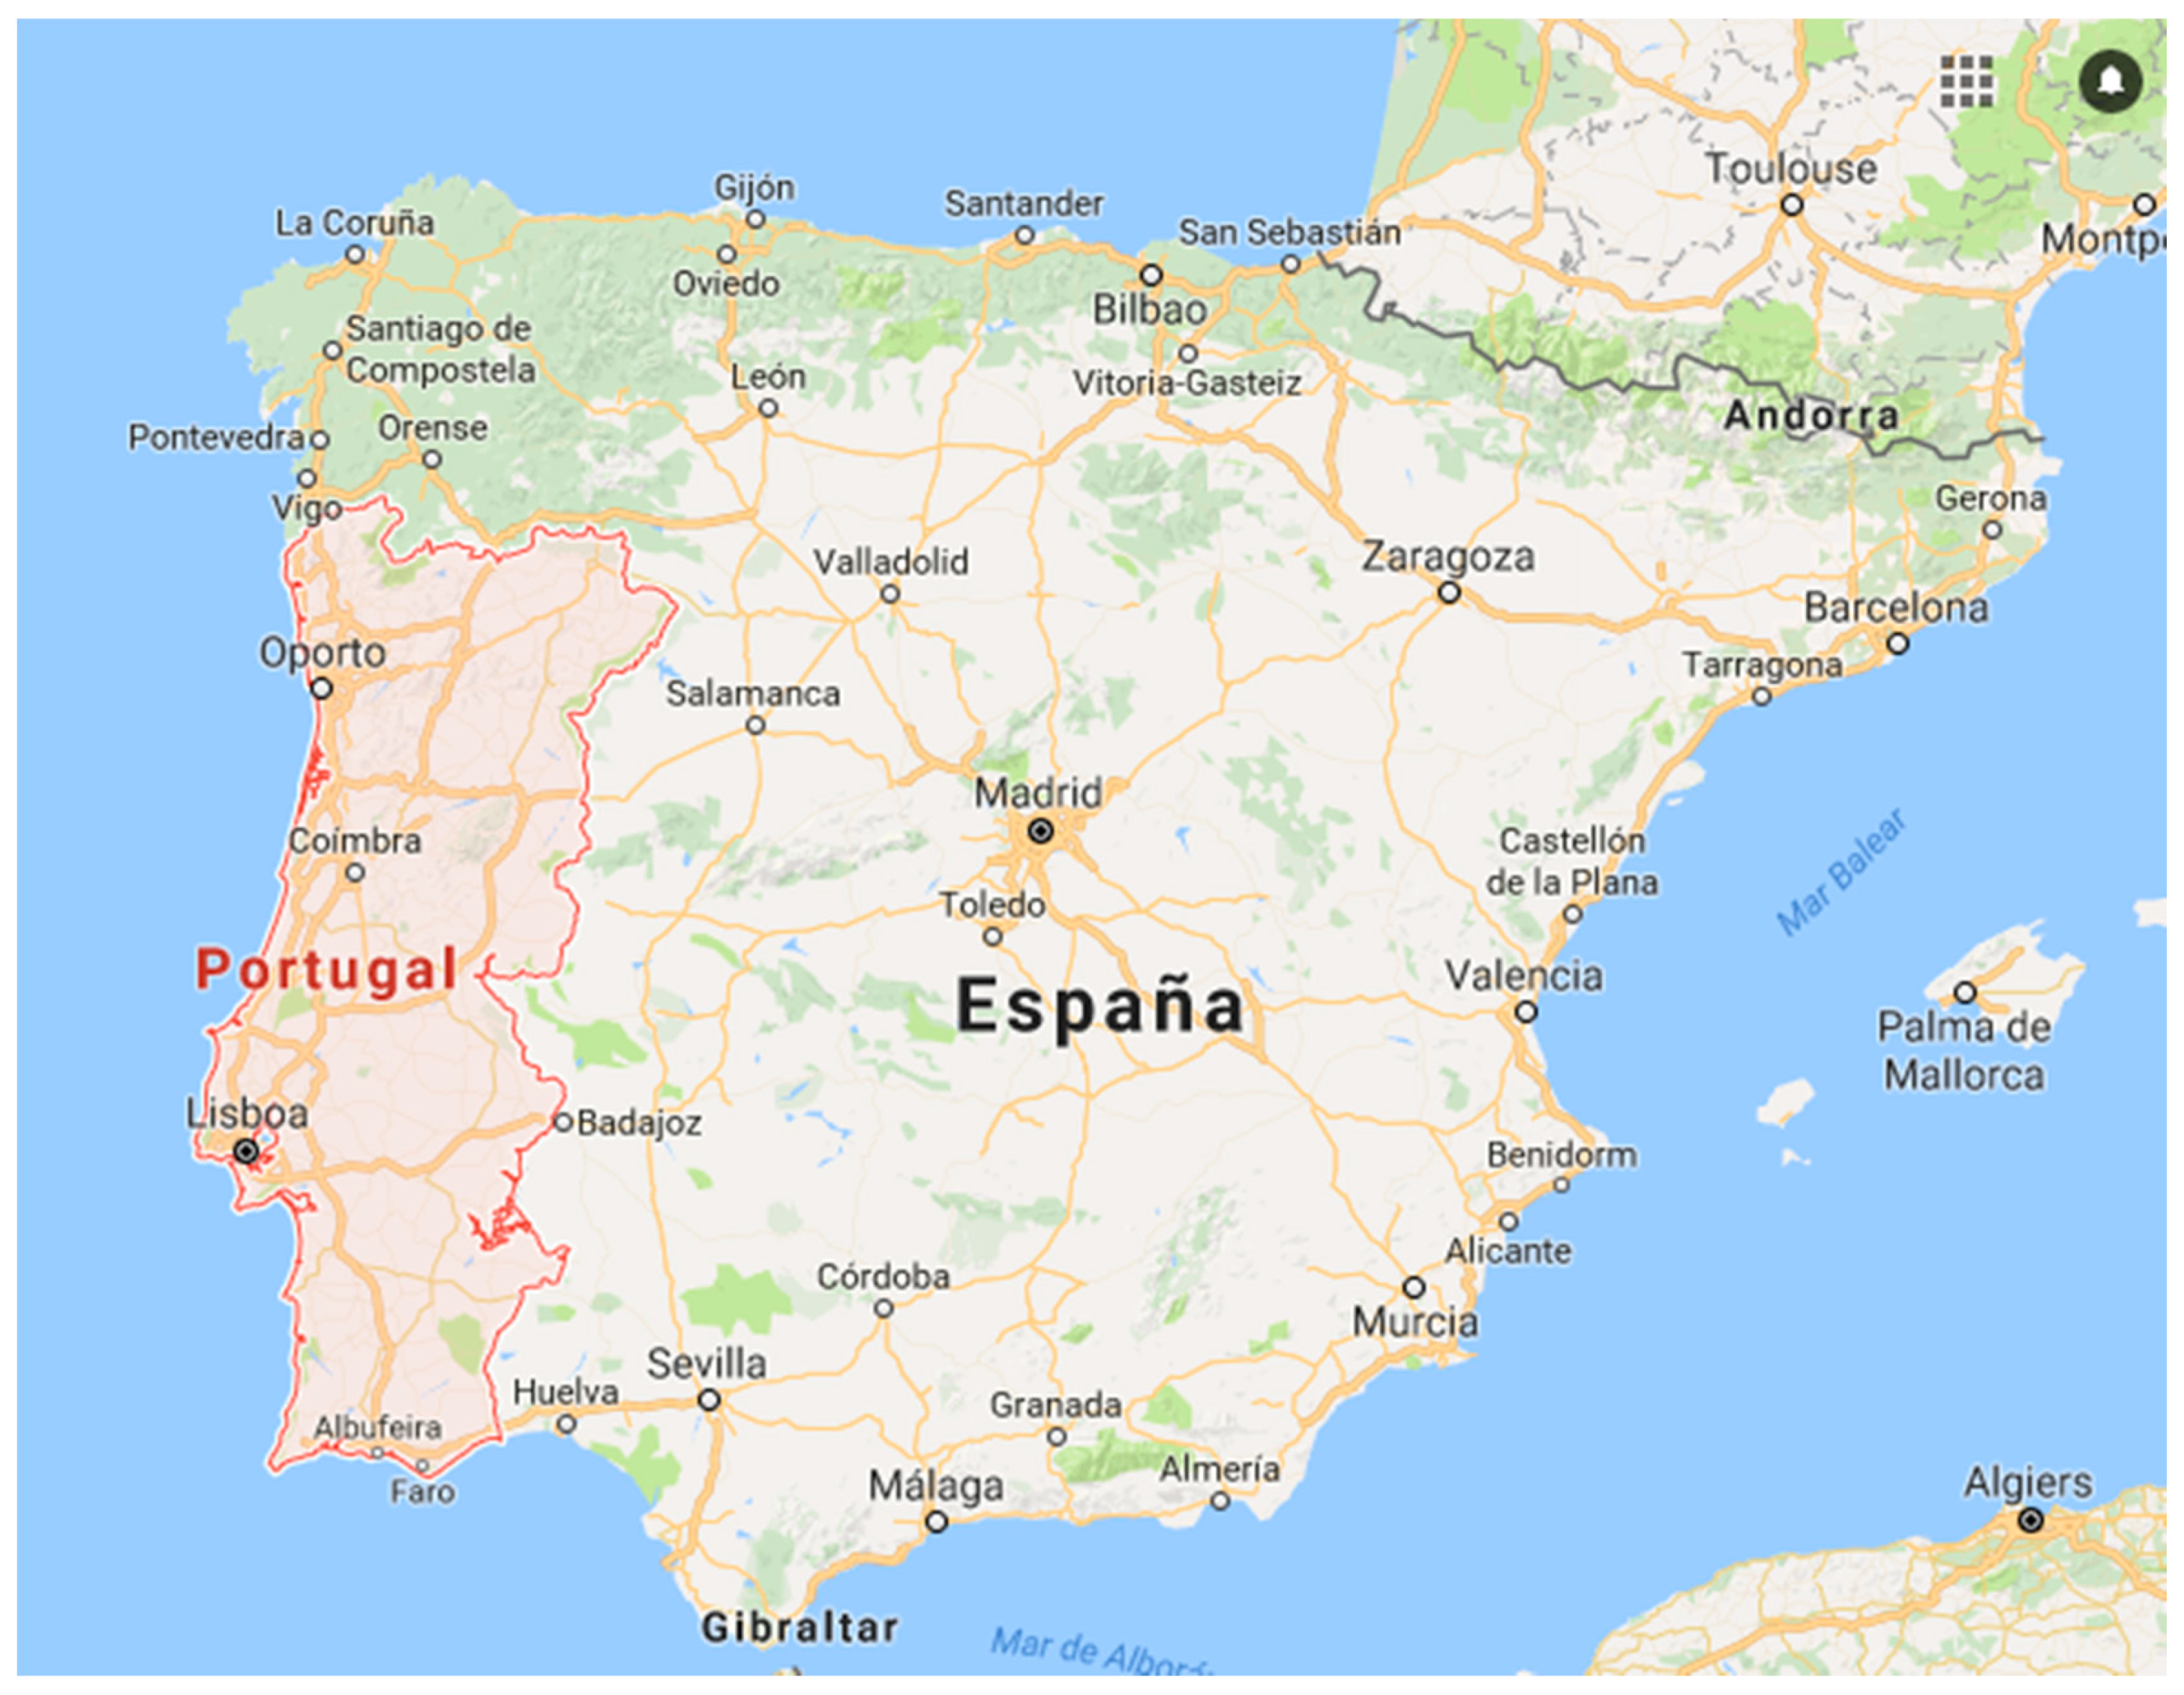
The case study is the offshore area of Portugal, as shown in Figure 3, characterized by deep waters, as shown in Figure 4, and good wave energy resources.
It is important to know the life-cycle of the project, which is considered 20 years, and the size of the grid, which is considered 16 km × 33 km.
Several floating offshore wave energy platforms have been taken into consideration: Pelamis, AquaBuOY, and Wave Dragon, as shown in Figure 5. The characteristics of the wave farm will depend on the type of WEC considered, as Table 1 shows. The final configuration (number of WECs per line, number of lines, total number of WECs in the farm) was assembled considering the total power of the farm, which in all the cases is close to 110 MW.
Due to the fact that Portugal does not have a specific electric tariff for wave energy, several tariffs were considered and are presented in Table 2.
The restriction considered for bathymetry was 50 m, based on adding +20 m to the maximum draft of all the WECs considered, as shown in Figure 6.
The energy produced by a particular WEC is dependent on its power matrix, as shown in Table 3, Table 4 and Table 5, and on the number of occurrences of each sea state at the point considered, as shown in Table 6.
The electric power generated by each WEC, considering the power matrix of each WEC and the number of occurrences for different sea states for each point of the geography, are presented in Figure 7.
3. Results
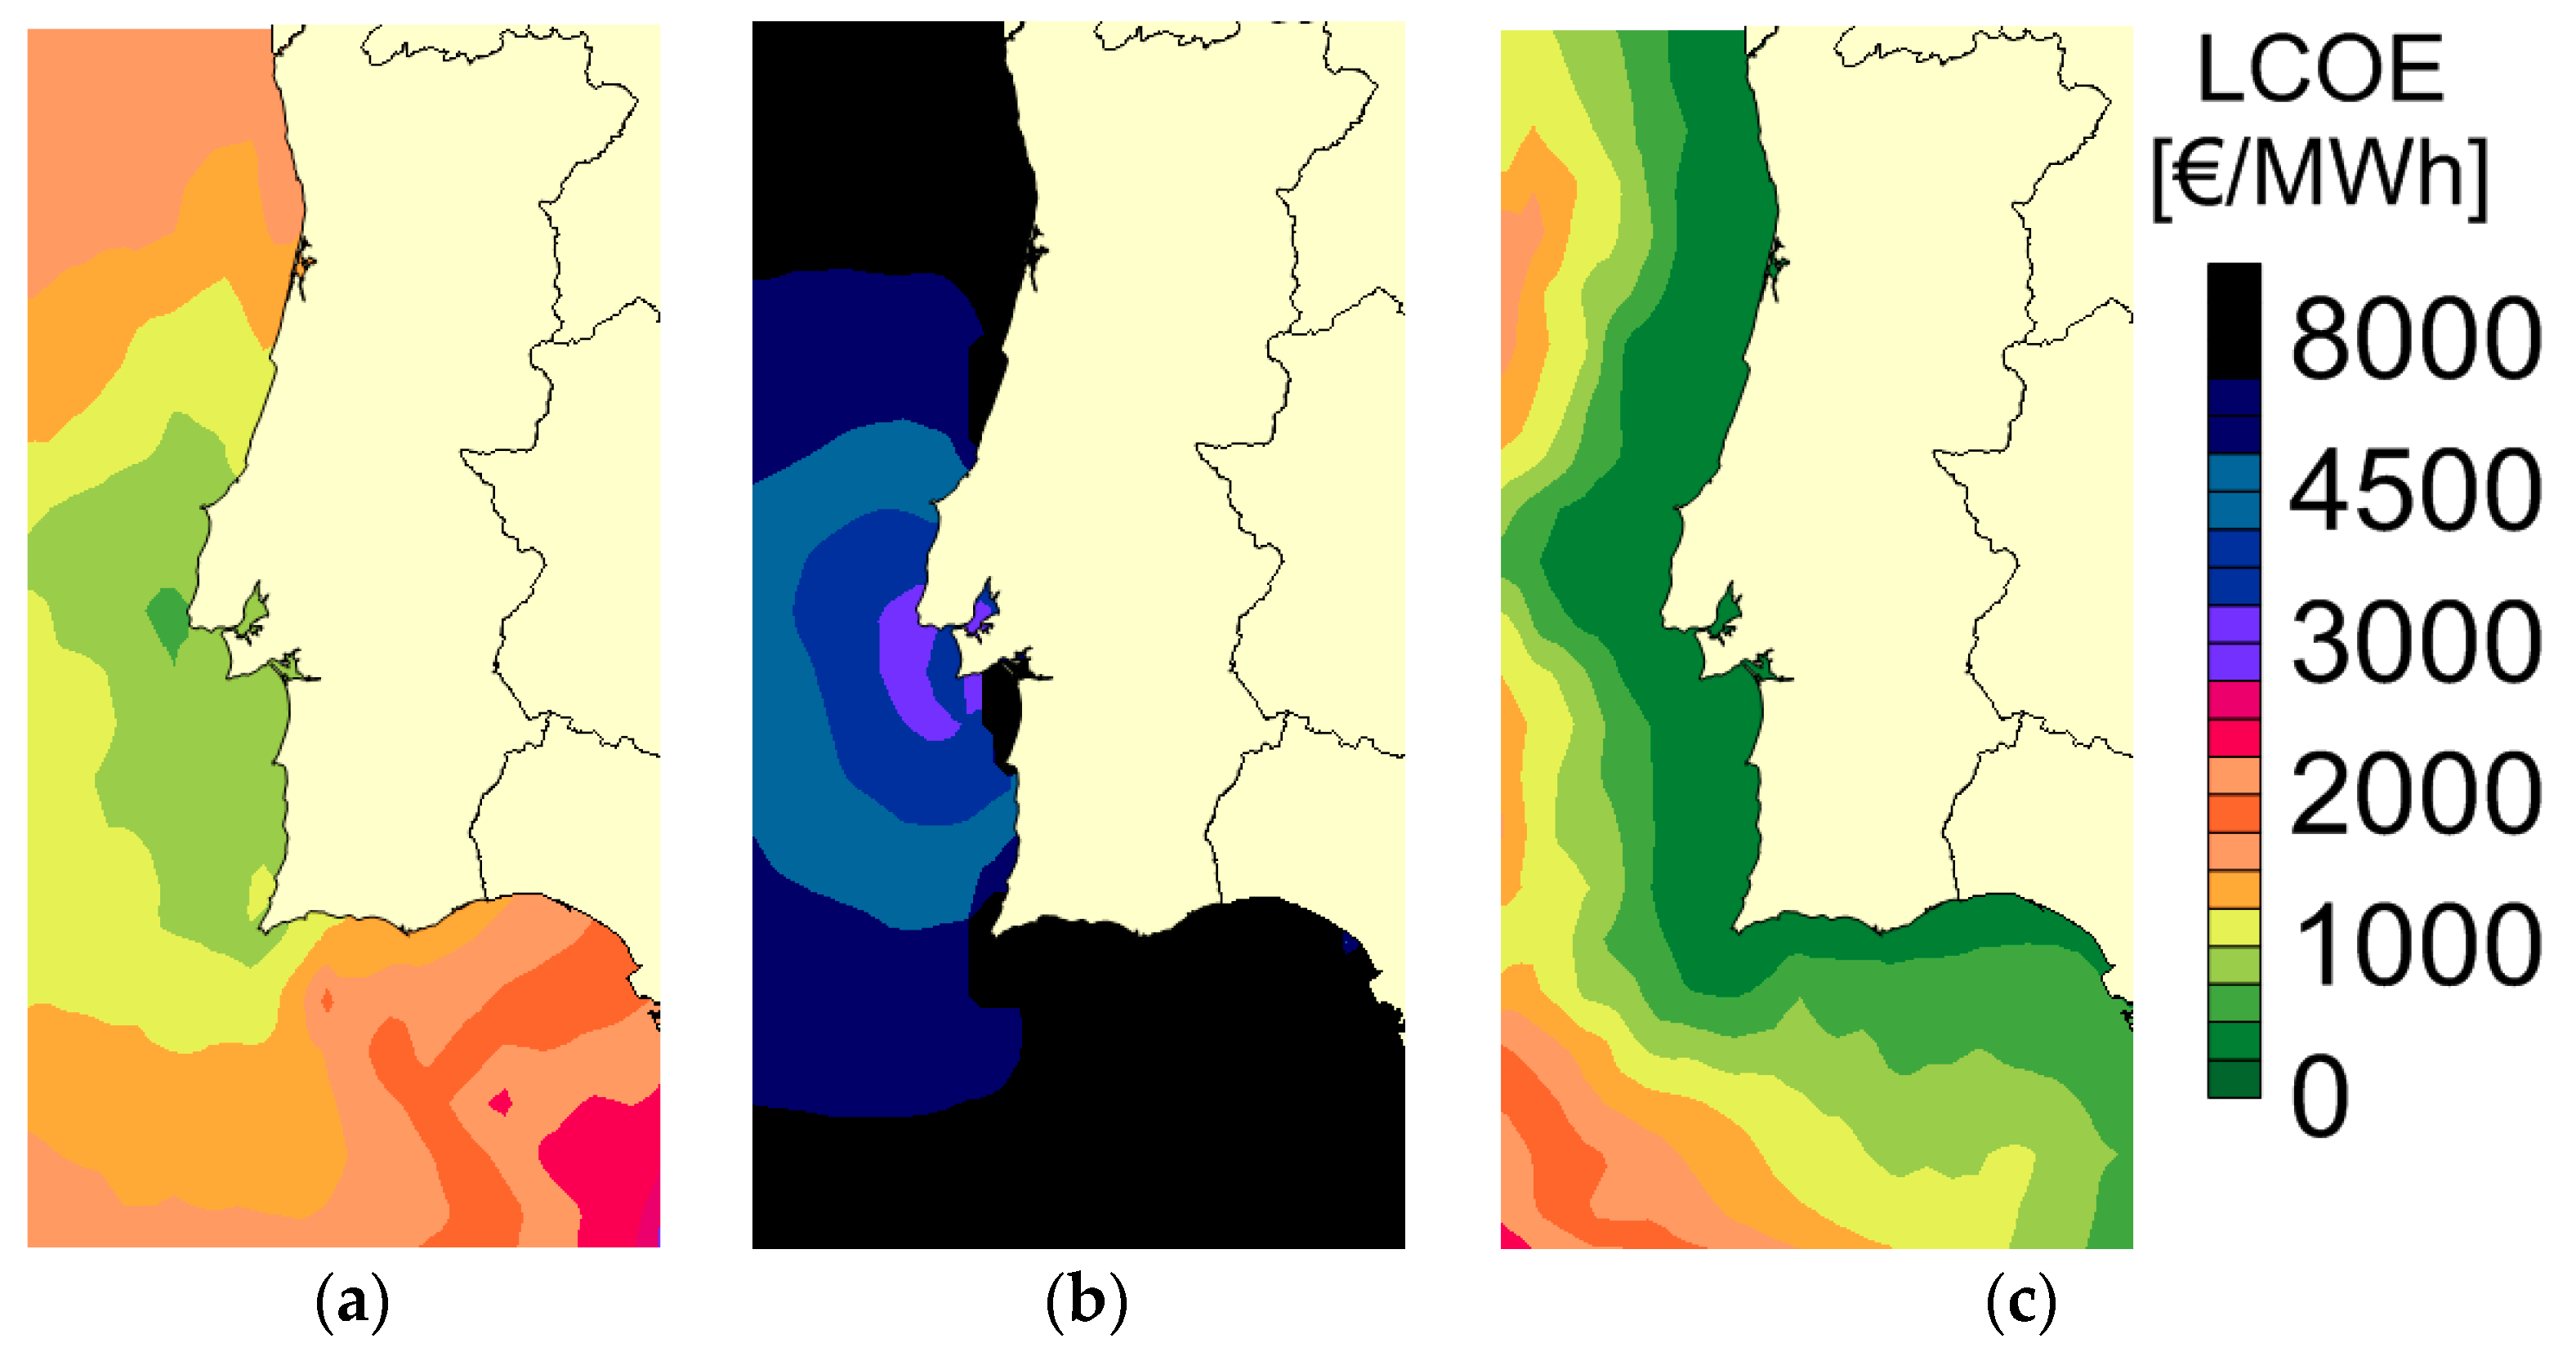
The results obtained for each WEC in terms of LCOE, but without the bathymetry restriction, are displayed in Figure 8a–c. The Wave Dragon, as shown in Figure 8c, was the one that presents the best value for this parameter, with 316.90 €/MWh, followed by 735.94 €/MWh for the Pelamis, as shown in Figure 8a, and 2967.85 €/MWh for the AquaBuOY, as shown in Figure 8b.
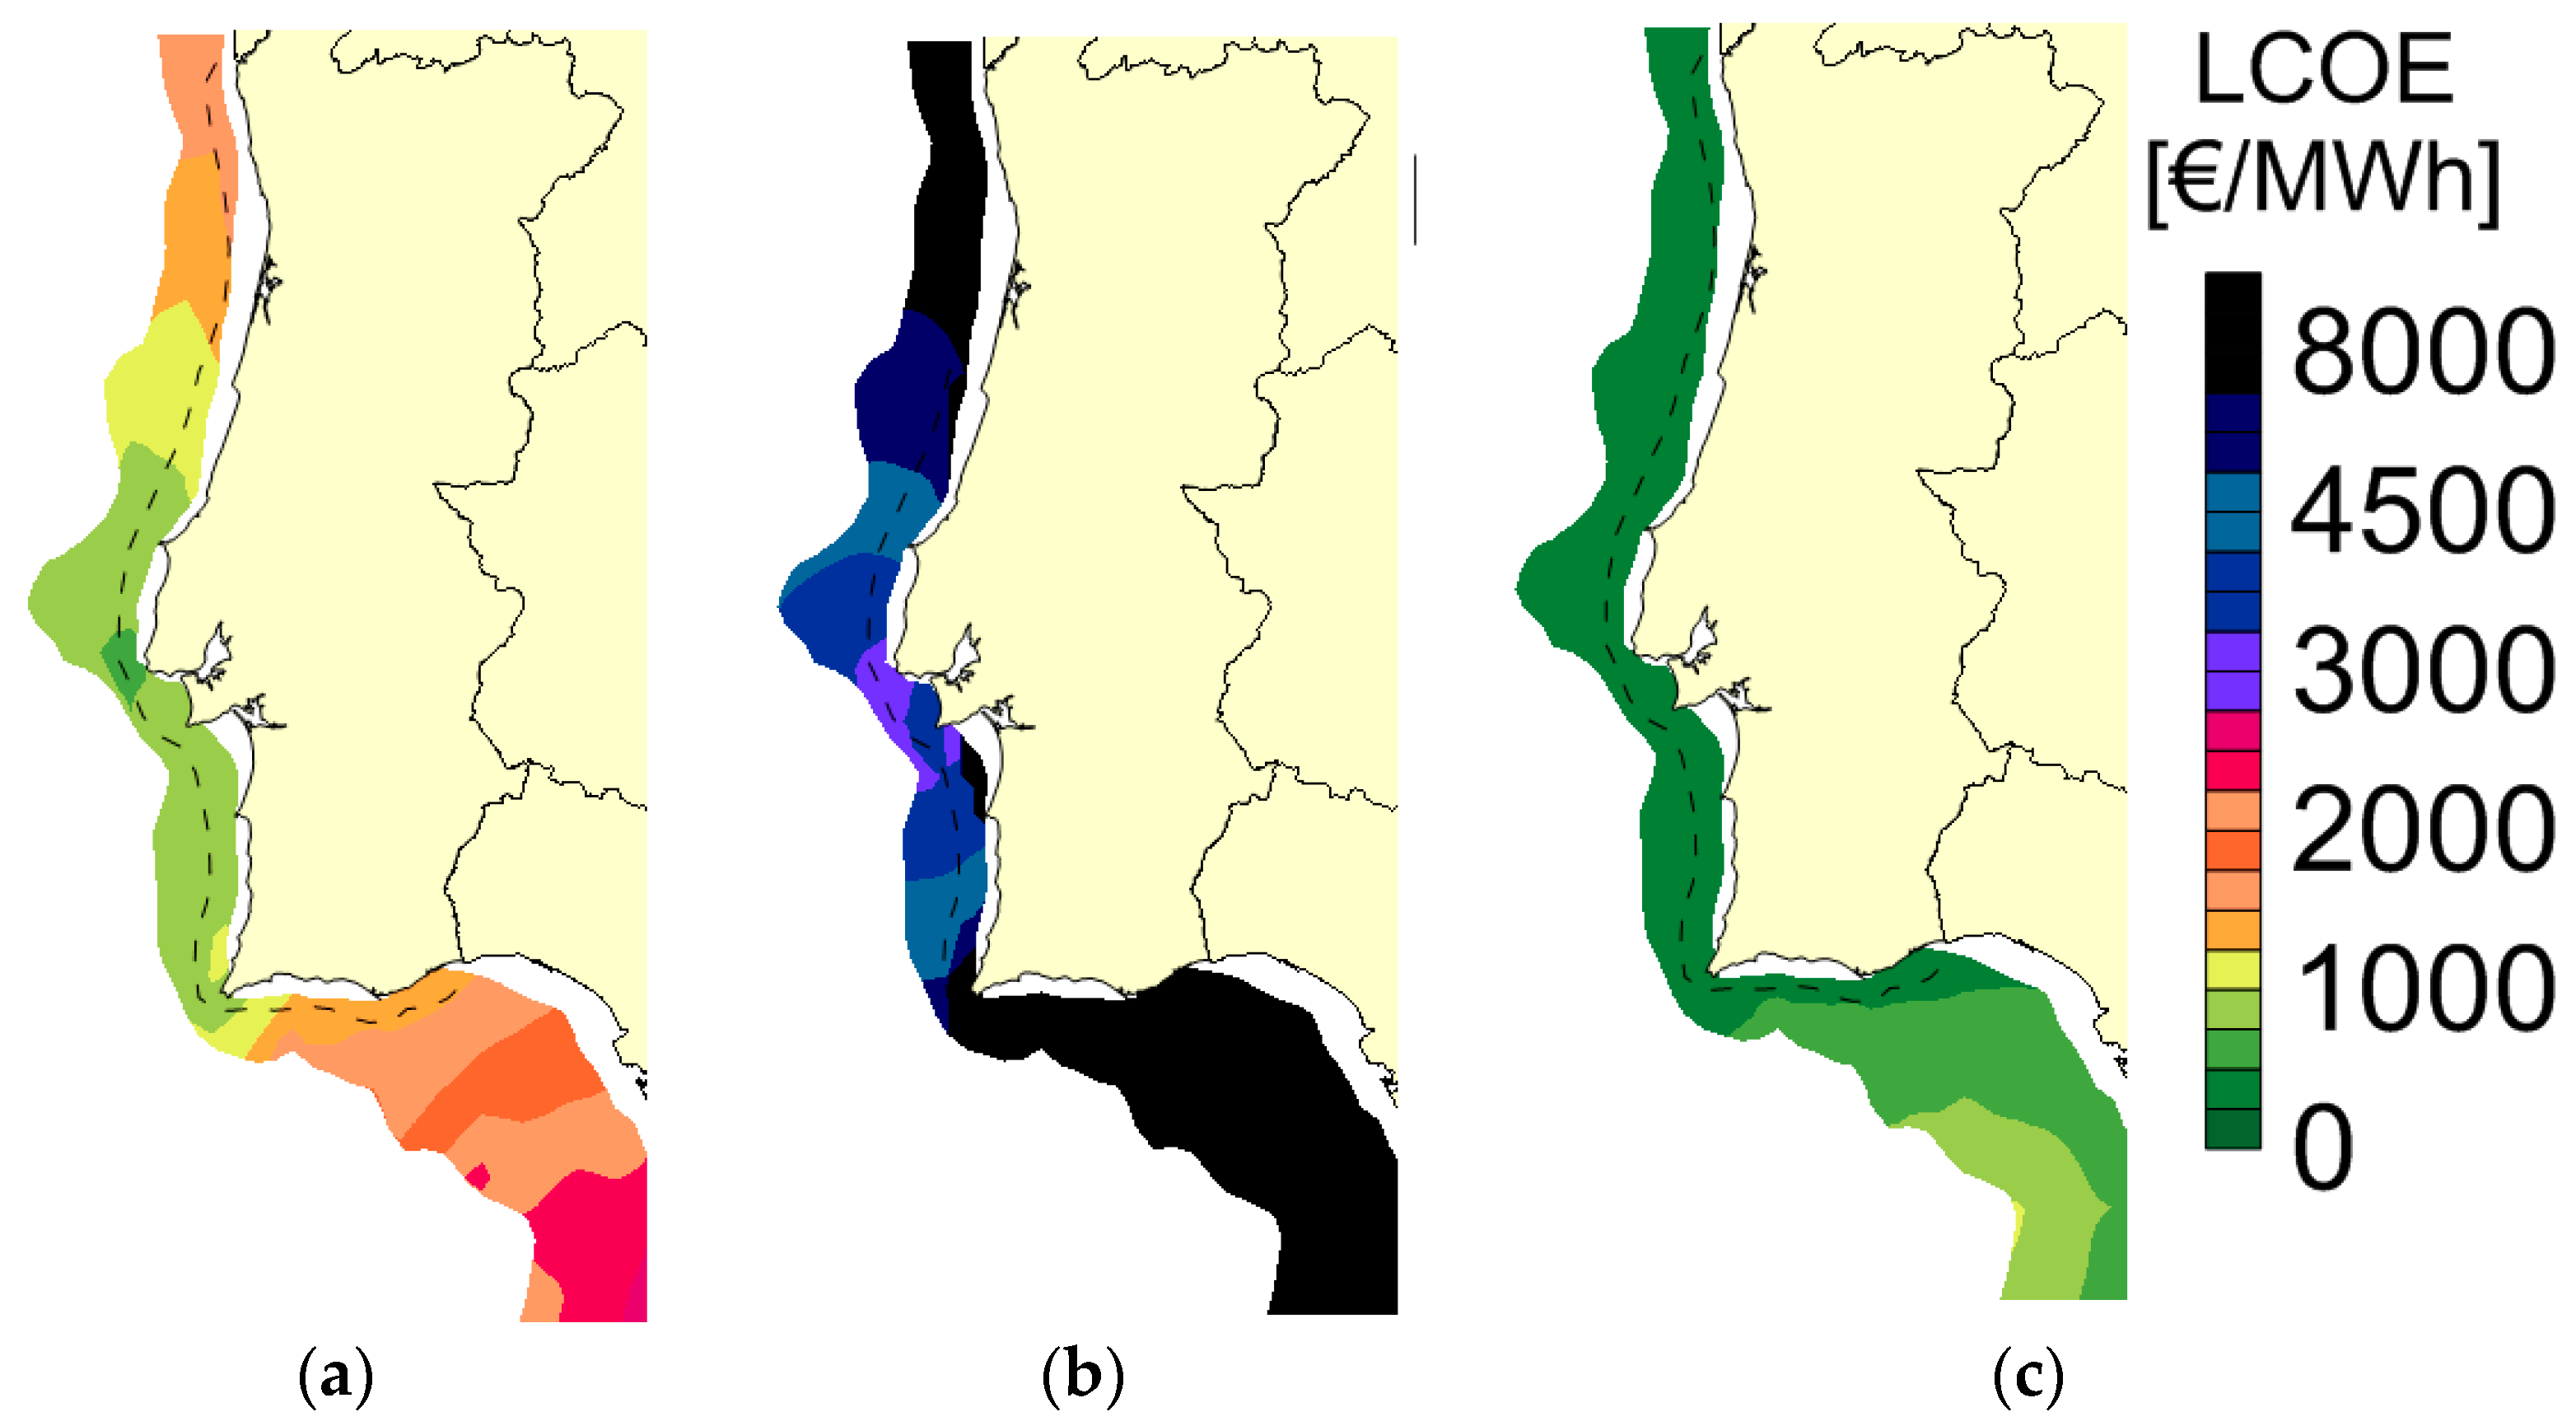
However, it is important to notice that the installation of the WEC depends on the bathymetry, so the previous maps shown in Figure 9 cannot be used in their totality for the choice of the best deployment place. In this context, a restriction for bathymetry has been considered, as shown in Figure 9a–c. However, in this study, this will not affect the results for the best LCOE.
Considering Scenario 1 for the electric tariff with 300 €/MWh, the implementation of a wave farm is not economically feasible whatever the WEC used. The values of IRR for all the WECs considered are lower than the WACC value, and the values of NPV are less than zero, the opposite of the feasibility conditions. For IRR, the values are around 4.74% for Wave Dragon, 11.94% for Pelamis, and −50.94% for the AquaBuOY. In terms of NPV, the Wave Dragon had −67.56 M€, the Pelamis −561.52 M€, and the AquaBuOY 2732.93 M€, as shown in Table 7.
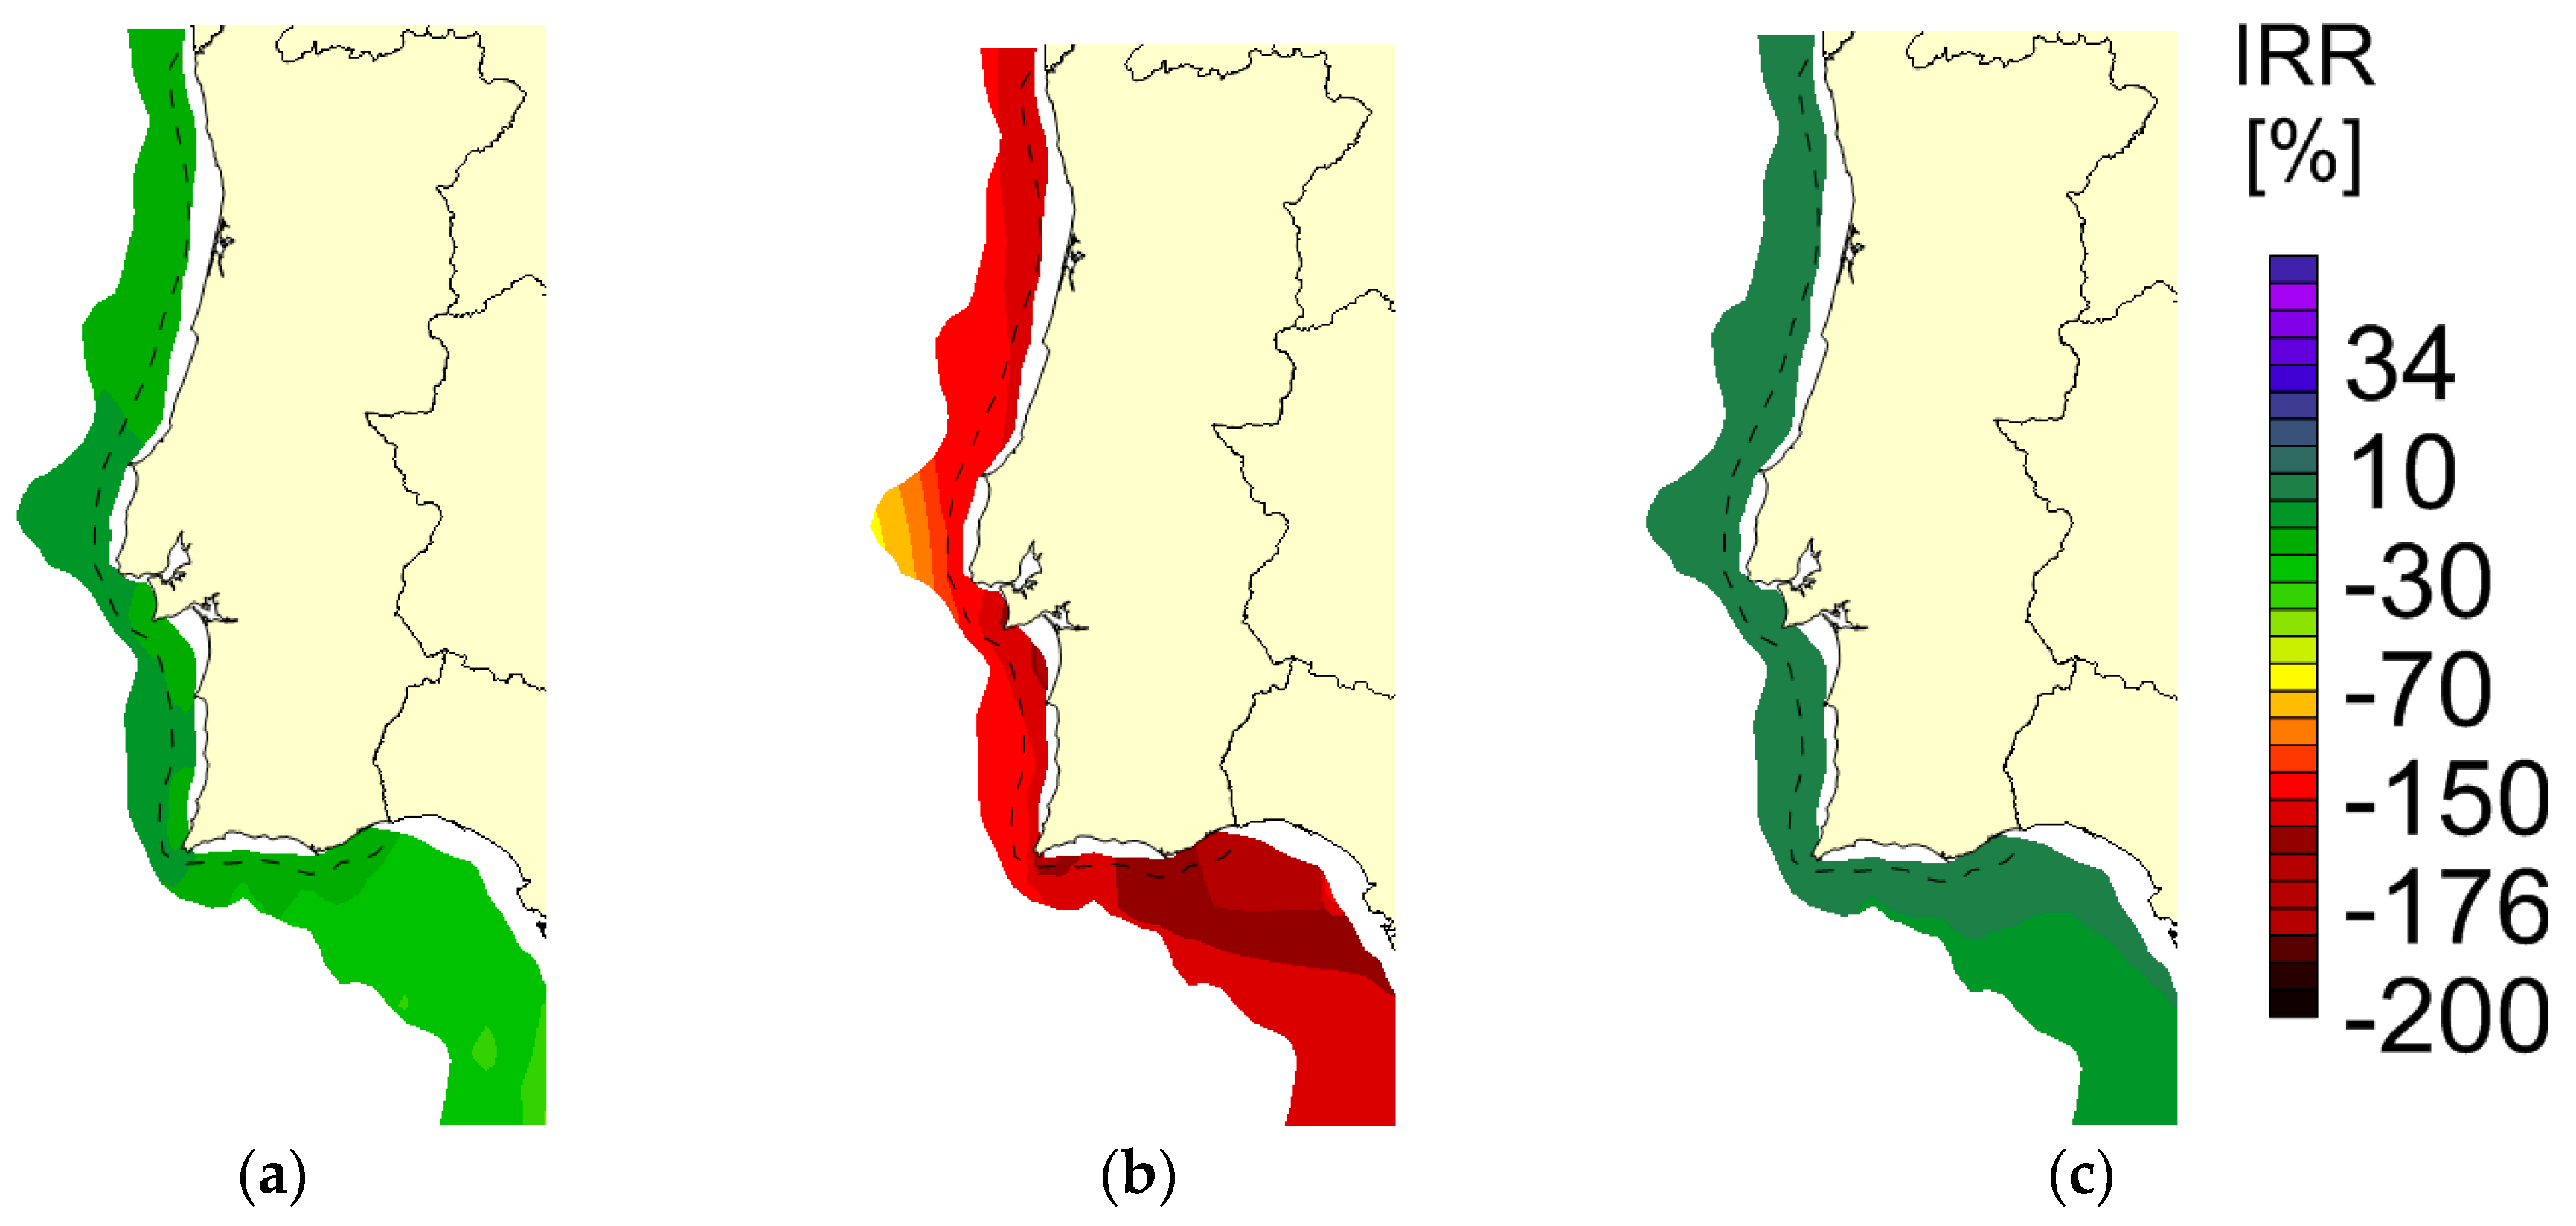
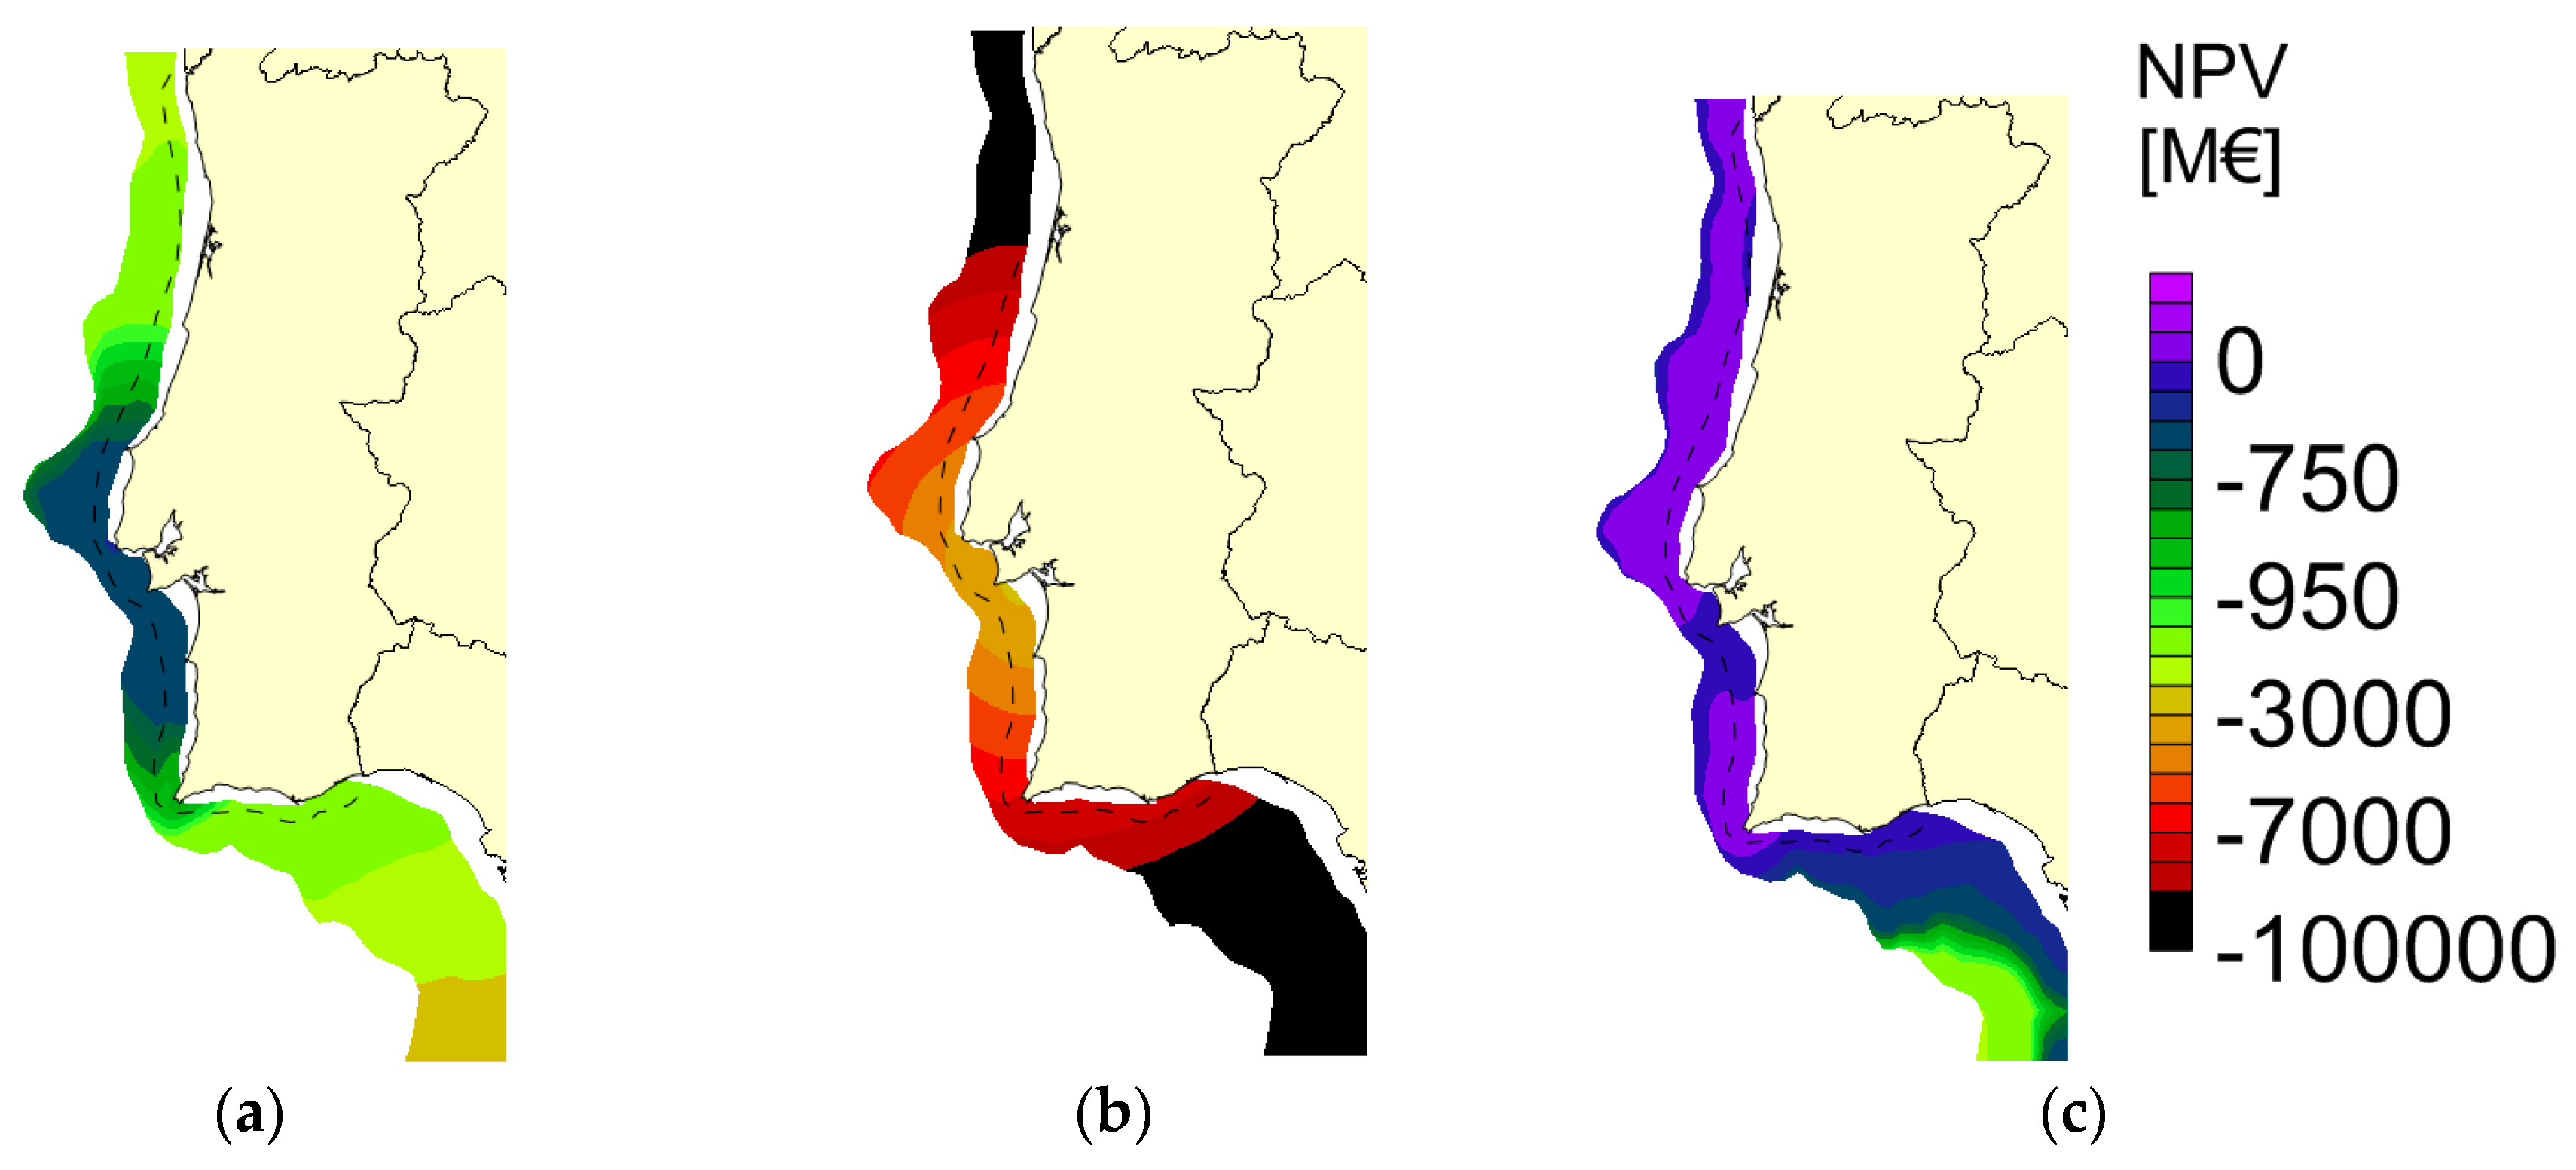
Scenario 2, which takes into account a 400 €/MWh electric tariff, has better results than the previous one. The WACC, which is dependent of the location (the total equity () and the total debt () depends of the life-cycle costs of each location), has values from 6% to 7%, which is lower than the IRR value of Wave Dragon, as shown in Figure 10c, with 9.35%. For Pelamis, as shown in Figure 10a, this parameter assumes the value of −5.67% and for AquaBuOY, as shown in Figure 10b, a value of −36.29%. For the NPV, the Wave Dragon, as shown in Figure 11c, has a value of 246.80 M€ (NPV > 0), the Pelamis, as shown in Figure 11a, a value of −429.67 M€, and AquaBuOY, as shown in Figure 11b, a value of 2637.39 M€. Looking at the results, the Wave Dragon is the WEC that encompasses all the requirements for a viable wave farm project.
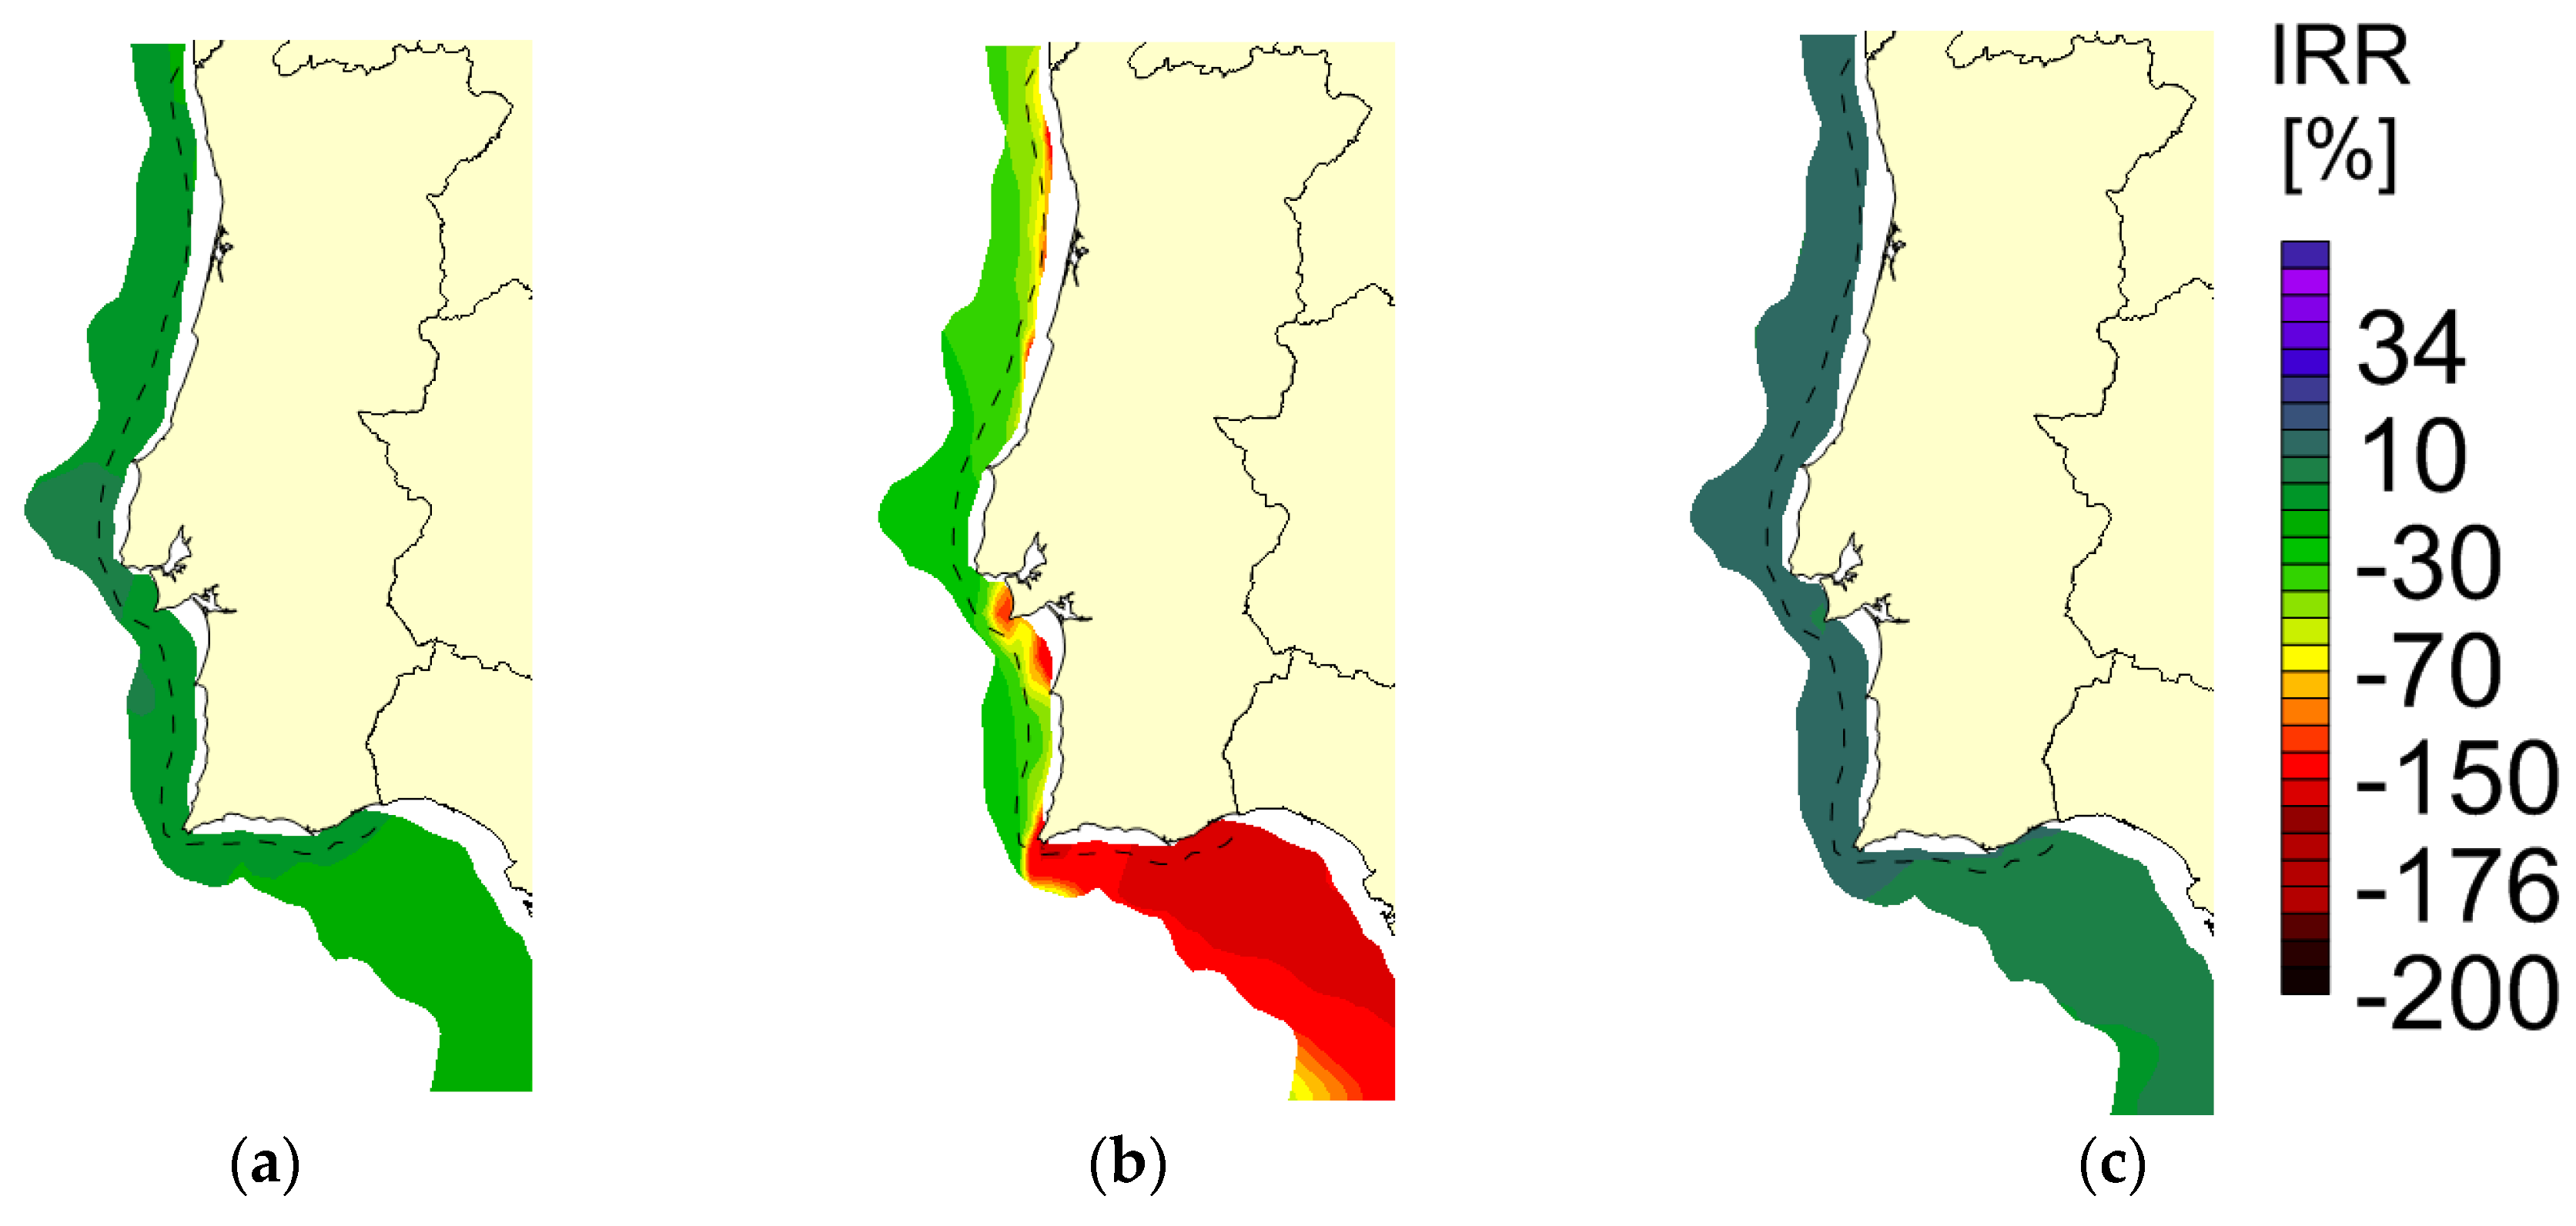
The last scenario, Scenario 3, which takes into consideration a 600 €/MWh electric tariff, gives the best results of all the three scenarios. For IRR, the Wave Dragon, as shown in Figure 12c, presents the best value with 17.25%, followed by Pelamis, as shown in Figure 12a, with 2.49%, and AquaBuOY, as shown in Figure 12b, with −22.97%.
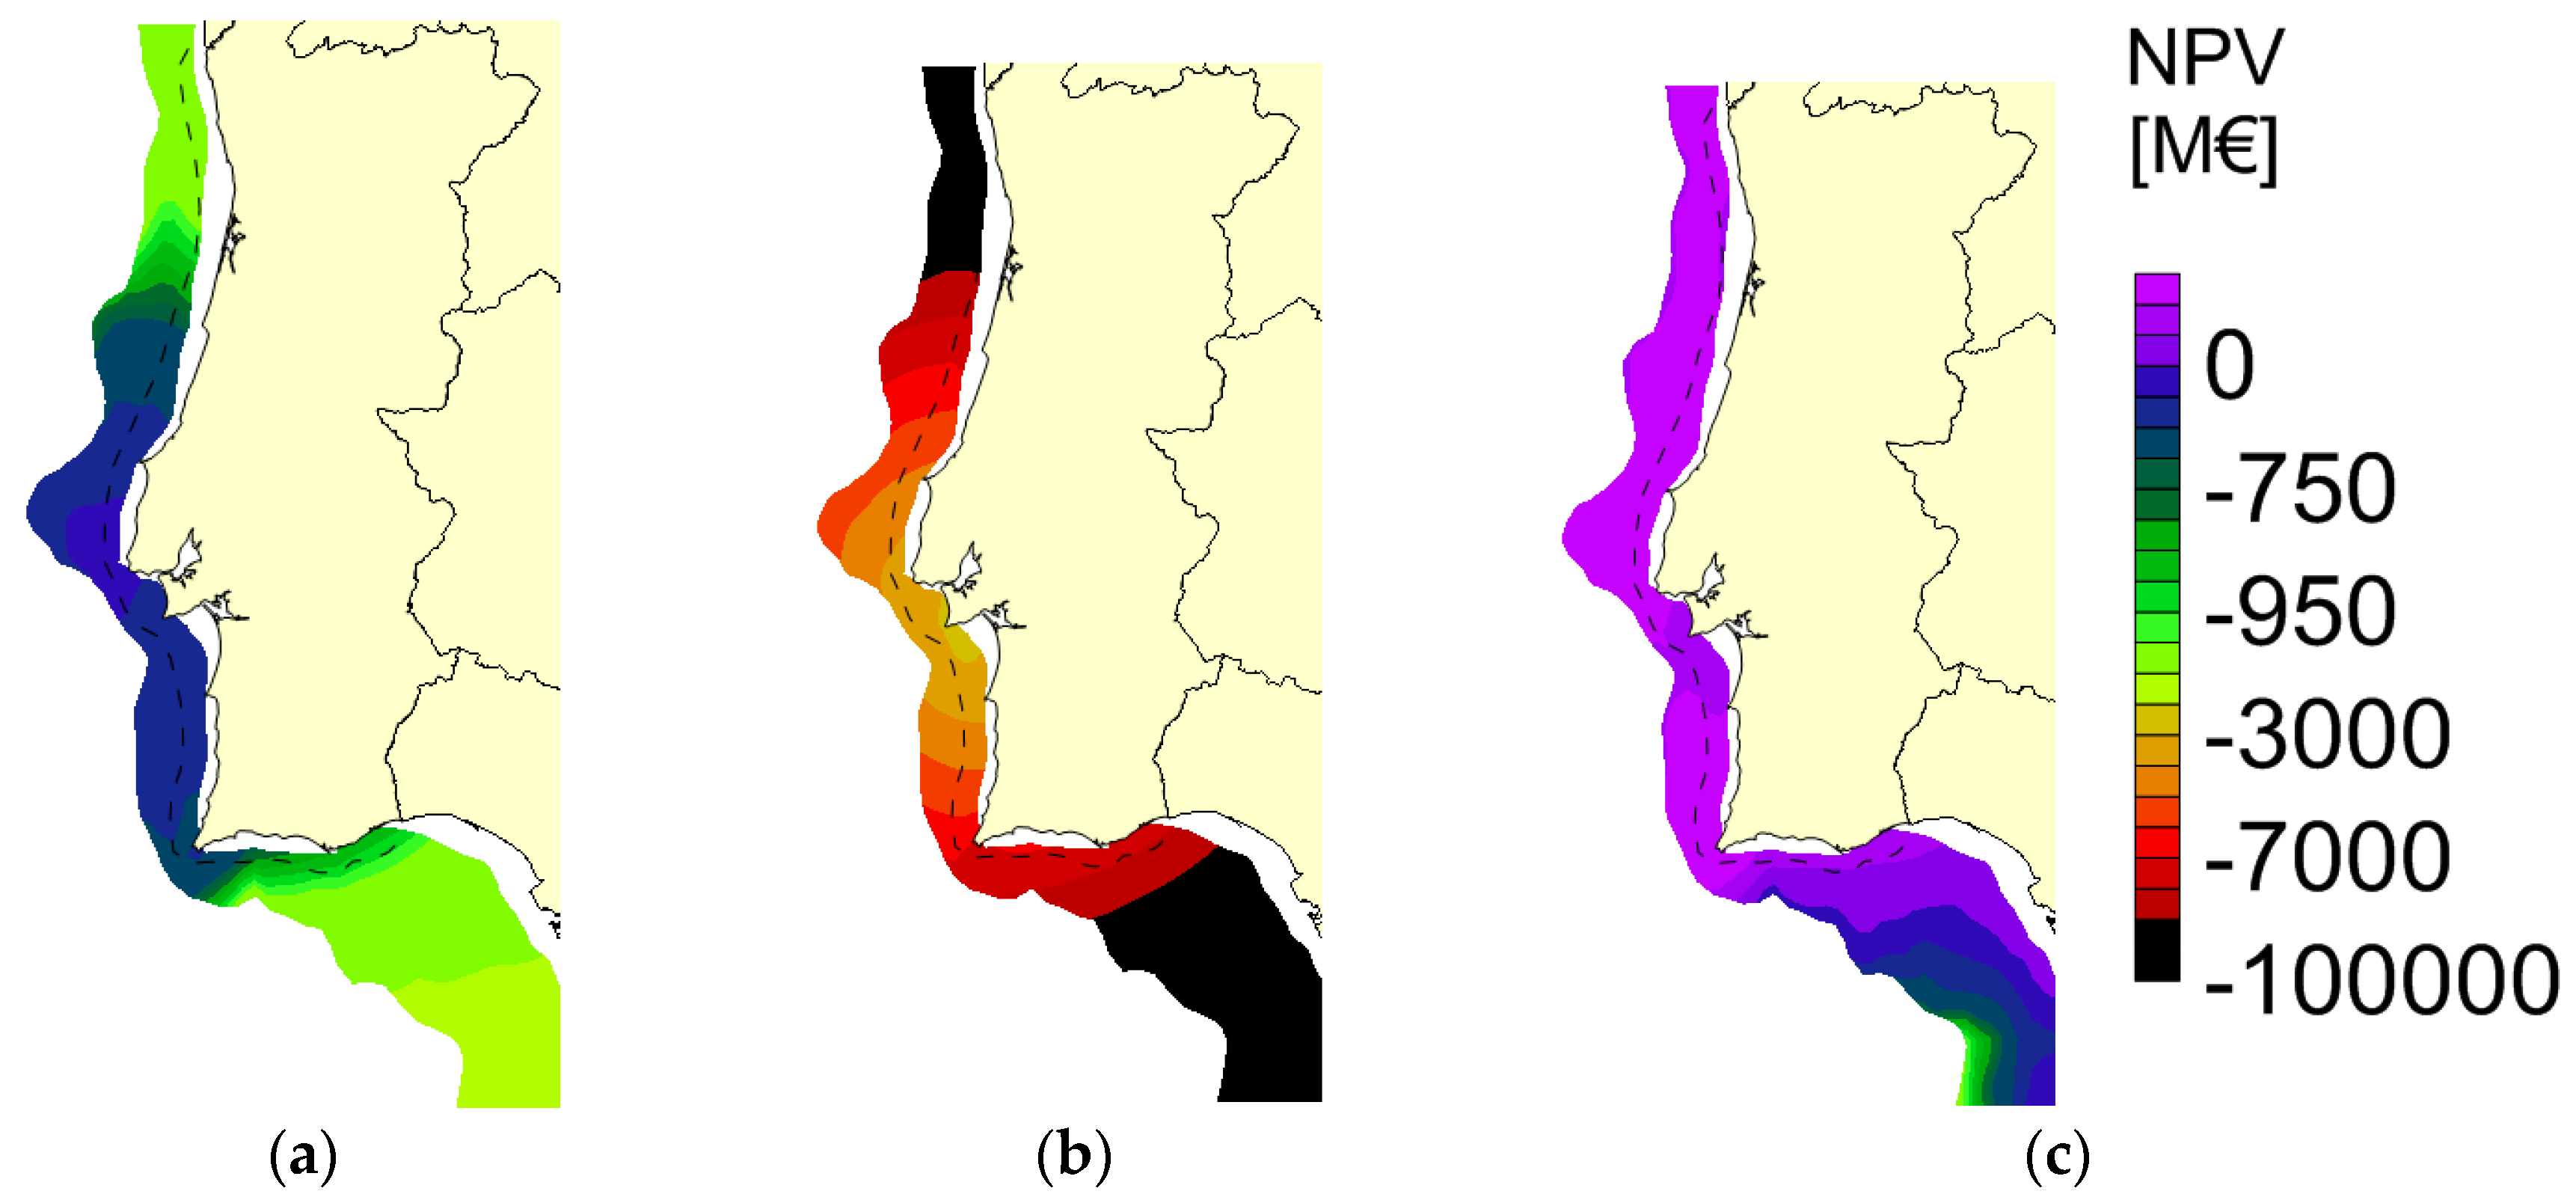
In terms of NPV, the best value for Scenario 3 is 881.24 M€ for the Wave Dragon, as shown in Figure 13c, followed by −168.38 M€ for the Pelamis, as shown in Figure 13a, and −244.73 M€ for the AquaBuOY, as shown in Figure 13b. Therefore, with this electric tariff, a wave farm project with Wave Dragon WECs would be economically feasible.
With respect to the best area for the wave farm installation, the area located close to Lisbon, in the center of Portugal, seems to be the better choice, as can be seen in all the economic maps with bathymetry restrictions. In the future, this would be a good location to install this type of offshore wave energy technology, when the reduction of costs, due to the commercial phase, guarantees the economic feasibility of the project.
4. Conclusions
The goal of this paper was to develop a method to calculate the economic feasibility of floating offshore wave energy farms. Therefore, their internal rate of return (IRR), net present value (NPV), and levelized cost of energy (LCOE) have been calculated. The method proposed has four phases: geographic phase, energy phase, economic phase, and bathymetry restriction phase. The aim of the geographic phase is to calculate the input values that will be used in the economic phase: the significant height of the waves, the period of the waves, the bathymetry, the distance from farm to shore, farm to shipyard, and farm to port. The second phase is the energy phase, which determines the energy produced by each WEC. This can be calculated by several methods, depending on the data available and the precision required. The next phase is the economic phase, where the economic parameters are calculated using the parameter results of the previous phases as inputs. Finally, there is the bathymetry restriction phase, where the restriction by bathymetry will be added to the economic maps, whose value will be different depending on the floating offshore WEC.
The case study was the Portuguese continental coast, which has a good wave energy resource. Different WECs were used for the evaluation: the Pelamis, AquaBuOY, and Wave Dragon, as well as different scenarios for electric tariffs.
The results of LCOE, IRR, and NPV indicate what the best WEC to use in a wave farm is and what the best location is to install it. The Wave Dragon has the best LCOE, with 316.90 €/MWh, followed by Pelamis, with 735.94 €/MWh, and AquaBuOY, with 2967.85 €/MWh. This is due to the fact that Wave Dragon generates more energy for the location selected, as its power matrix shows. This is a result of being a larger device and benefiting from the effect of the scale of the energy produced, which then makes it cheaper. According to the IRR and the NPV results, only Scenario 2 (400 €/MWh) and 3 (600 €/MWh) for the electric tariff are economically feasible when using a Wave Dragon platform.
The layout considered is similar for all the WECs, considering that each device is separated from the other, taking into account the main dimensions of the platform. In the future, it can be improved considering the different energy production systems that each WEC has.
This study presents a novelty compared to other studies because it takes into account the economic aspects of wave energy, not only their technical aspects. It is very important to know the areas where the farms can be installed in economic terms, and whose use can help to analyze maritime planning of the countries in the future.
Portugal has good wave energy potential. In the future, areas close to Lisbon would be good locations to install this type of offshore technology, when the reduction of costs, due to the commercial phase, guarantees the economic feasibility of the project.
Author Contributions
All authors have been involved in either calculations or writing, as follows: Introduction, L.C.-S., D.S. and C.G.S.; Methodology, L.C.-S.; Case study, L.C.-S., D.S., A.R.B., N.S. and C.G.S.; Results, L.C.-S.; Discussion, L.C.-S., D.S., A.R.B., N.S. and C.G.S.
Funding
This research received no external funding.
Conflicts of Interest
The authors declare no conflict of interest.
References
- Lindroth, S.; Leijon, M. Offshore wave power measurements—A review. Renew. Sustain. Energy Rev. 2011, 15, 4274–4285. [Google Scholar] [CrossRef]
- Falcão, A.F.O. Wave energy utilization: A review of the technologies. Renew. Sustain. Energy Rev. 2010, 14, 899–918. [Google Scholar] [CrossRef]
- Guedes Soares, C.; Bhattacharjee, J.; Tello, M.; Pietra, L. Review and Classification of Wave Energy Converters; Guedes Soares, C., Garbatov, Y., Sutulo, S., Santos, T.A., Eds.; Taylor & Francis Group: Oxfordshire, UK, 2012. [Google Scholar]
- OWC Pico Plant Web Page OWC Pico Plant. Available online: http://www.pico-owc.net/cms.php?page=542&wnsid=dbb177dd9668f08318207830330904df (accessed on 5 September 2018).
- Caballero Santos, C. Estudio de Plantas de Producción de Energías Renovables con Aprovechamiento de la Energía del Mar. Bachelor’s Thesis, Universidad Carlos III de Madrid, Madrid, Spain, 2011. [Google Scholar]
- Clément, A.; McCullen, P.; Falcão, A.F.O. Wave energy in Europe: Current status and perspectives. Renew. Sustain. Energy Rev. 2002, 6, 405–431. [Google Scholar] [CrossRef]
- Sperboy Sperboy Webpage. Available online: http://www.sperboy.com (accessed on 1 September 2018).
- Ocean Linx Ocean Linx Wavepage. Available online: http://www.oceanlinx.com/ (accessed on 5 September 2018).
- Arena, F.; Romolo, A.; Malara, G.; Fiamma, V.; Laface, V. The First Full Operative U-OWC Plants in the Port of Civitavecchia. In ASME 2017 36th International Conference on Ocean Offshore & Arctic Engineering, Volume 10: Ocean Renewable Energy; ASME: New York, NY, USA, 2017; p. V010T09A022. [Google Scholar]
- Weinstein, A.; Fredrikson, G.; Jane, M.; Group, P.; Denmark, K.N.R. AquaBuOY—The Offshore Wave Energy Converter Numerical Modeling and Optimization; IEEE: San Diego, USA, 2003; pp. 1854–1859. [Google Scholar]
- Baddour, E. Energy from Waves and Tidal Currents. Available online: http://s3.amazonaws.com/zanran_storage/tecnet.pte.enel.it/ContentPages/106131895.pdf (accessed on 18 September 2018).
- Magagna, D.; Uihlein, A. Ocean energy development in Europe: Current status and future perspectives. Int. J. Mar. Energy 2015, 11, 84–104. [Google Scholar] [CrossRef]
- Wavebob Wavebob Webpage. Available online: http://www.wavebob.com (accessed on 1 September 2018).
- Carcas, M.C. The OPD Pelamis WEC: Current status and onward programme. Int. J. Ambient. Energy 2003, 24, 21–28. [Google Scholar] [CrossRef]
- Rusu, E.; Guedes Soares, C. Coastal impact induced by a Pelamis wave farm operating in the Portuguese nearshore. Renew. Energy 2013, 58, 34–49. [Google Scholar] [CrossRef]
- McCabe, A.P.; Bradshaw, A.; Meadowcroft, J.A.C.; Aggidis, G. Developments in the design of the PS Frog Mk 5 wave energy converter. Renew. Energy 2006, 31, 141–151. [Google Scholar] [CrossRef]
- Ruellan, M.; Ben Ahmed, H.; Multon, B.; Josset, C.; Babarit, A.; Clement, A. Design Methodology for a SEAREV Wave Energy Converter. IEE Trans. Energy Convers. 2010, 25, 760–767. [Google Scholar] [CrossRef]
- Awsocean Awsocean Webpage. Available online: http://www.awsocean.com/ (accessed on 1 September 2018).
- AW-Energy Web Page AW-Energy. Available online: http://aw-energy.com/about-waveroller/wave-farms (accessed on 1 September 2018).
- Babarit, A.; Hals, J.; Muliawan, M.J.; Kurniawan, A.; Moan, T.; Krokstad, J. Numerical benchmarking study of a selection of wave energy converters. Renew. Energy 2012, 41, 44–63. [Google Scholar] [CrossRef]
- Pérez-Collazo, C.; Greaves, D.; Iglesias, G. A review of combined wave and offshore wind energy. Renew. Sustain. Energy Rev. 2015, 42, 141–153. [Google Scholar] [CrossRef]
- Veigas, M.; López, M.; Iglesias, G. Assessing the optimal location for a shoreline wave energy converter. Appl. Energy 2014, 132, 404–411. [Google Scholar] [CrossRef]
- Page, W.D.W. Wave Dragon Technology. Available online: http://www.wavedragon.net (accessed on 7 September 2016).
- Ram, K.; Narayan, S.; Ahmed, M.R.; Nakavulevu, P.; Lee, Y.H. In situ near-shore wave resource assessment in the Fiji Islands. Energy Sustain. Dev. 2014, 23, 170–178. [Google Scholar] [CrossRef]
- Kramer, M.M.; Marquis, L.; Frigaard, P. Performance Evaluation of the Wavestar Prototype. In Proceedings of the 9th EWTEC 2011: Proceedings of the 9th European Wave and Tidal Conference, Southampton, UK, 5–9 September 2011. [Google Scholar]
- Elwood, D.; Yim, S.C.; Prudell, J.; Stillinger, C.; von Jouanne, A.; Brekken, T.; Brown, A.; Paasch, R. Design, construction, and ocean testing of a taut-moored dual-body wave energy converter with a linear generator power take-off. Renew. Energy 2010, 35, 348–354. [Google Scholar] [CrossRef]
- Falcão, A.F.O.; Cândido, J.J.; Justino, P.A.P.; Henriques, J.C.C. Hydrodynamics of the IPS buoy wave energy converter including the effect of non-uniform acceleration tube cross section. Renew. Energy 2012, 41, 105–114. [Google Scholar] [CrossRef]
- Veigas, M.; Carballo, R.; Iglesias, G. Wave and offshore wind energy on an island. Energy Sustain. Dev. 2014, 22, 57–65. [Google Scholar] [CrossRef]
- Liu, Z.; Qu, N.; Han, Z.; Zhang, J.; Zhang, S.; Li, M.; Shi, H. Study on energy conversion and storage system for a prototype buoys-array wave energy converter. Energy Sustain. Dev. 2016, 34, 100–110. [Google Scholar] [CrossRef]
- Martinelli, L.; Zanuttigh, B.; Kofoed, J.P. Selection of design power of wave energy converters based on wave basin experiments. Renew. Energy 2011, 36, 3124–3132. [Google Scholar] [CrossRef]
- Martinelli, L.; Zanuttigh, B.; Kofoed, J.P. Statistical analysis of power production from OWC type wave energy converters. In Proceedings of the 8th European Wave and Tidal Energy Conference, Uppsala, Sweden, 7–10 September 2009; pp. 295–303. [Google Scholar]
- Zanuttigh, B.; Martinelli, L.; Castagnetti, M.; Ruol, P.; Kofoed, J.P.; Frigaard, P. Integration of wave energy converters into coastal protection schemes. In Proceedings of the 3rd International Conference on Ocean Energy, Bilbao, Spain, 6–8 October 2010; pp. 1–7. [Google Scholar]
- Arena, F.; Barbaro, G.; Fiamma, V.; Laface, V.; Malara, G.; Romolo, A.; Strati, F.M. Resonant Wave Energy Converters: Concept development. Energia Ambiente e Innovazione 2015, 61, 52–57. [Google Scholar]
- Pizer, D.J.; Retzler, C.; Henderson, R.M.; Cowieson, F.L.; Shaw, M.G.; Dickens, B.; Hart, R. Pelamis WEC—Recent advances in the numerical and experimental modelling programme. In Proceedings of the 6th European Wave and Tidal Energy Conference, Glasgow, UK, 29 August–2 September 2005. [Google Scholar]
- Yemm, R.; Pizer, D.; Retzler, C.; Henderson, R. Pelamis: Experience from concept to connection. Philos. Trans. A. Math. Phys. Eng. Sci. 2012, 370, 365–380. [Google Scholar] [CrossRef] [PubMed]
- Kofoed, J.P.; Frigaard, P.; Friis-Madsen, E.; Sørensen, H.C. Prototype testing of the wave energy converter wave dragon. Renew. Energy 2006, 31, 181–189. [Google Scholar] [CrossRef] [Green Version]
- Rusu, E.; Guedes Soares, C. Numerical Modelling to Estimate the Spatial Distribution of the Wave Energy in the Portuguese Nearshore. Renew. Energy 2009, 34, 1501–1516. [Google Scholar] [CrossRef]
- Bozzi, S.; Archetti, R.; Passoni, G. Wave electricity production in Italian offshore: A preliminary investigation. Renew. Energy 2014, 62, 407–416. [Google Scholar] [CrossRef]
- Iuppa, C.; Cavallaro, L.; Foti, E.; Vicinanza, D. Potential wave energy production by different wave energy converters around Sicily. J. Renew. Sustain. Energy 2015, 7, 061701. [Google Scholar] [CrossRef]
- Guedes Soares, C.; Bento, A.R.; Goncalves, M.; Silva, D.; Martinho, P. Numerical evaluation of the wave energy resource along the Atlantic European coast. Comput. Geosci. 2014, 71, 37–49. [Google Scholar] [CrossRef]
- Vannucchi, V.; Cappietti, L. Wave energy assessment and performance estimation of state of the artwave energy converters in italian hotspots. Sustainability 2016, 8, 1300. [Google Scholar] [CrossRef]
- Dalton, G.J. Non-technical barriers to wave energy in Europe. In Proceedings of the 8th European Wave and Tidal Energy Conference, Uppsala, Sweden, 7–10 September 2009; pp. 1–28. [Google Scholar]
- Dalton, G.J.; Alcorn, R.; Lewis, T. Case study feasibility analysis of the Pelamis wave energy convertor in Ireland, Portugal and North America. Renew. Energy 2010, 35, 443–455. [Google Scholar] [CrossRef]
- O’Connor, M.; Lewis, T.; Dalton, G. Techno-economic performance of the Pelamis P1 and Wavestar at different ratings and various locations in Europe. Renew. Energy 2013, 50, 889–900. [Google Scholar] [CrossRef]
- Iglesias, G.; López, M.; Carballo, R.; Castro, A.; Fraguela, J.A.; Frigaard, P. Wave energy potential in Galicia (NW Spain). Renew. Energy 2009, 34, 2323–2333. [Google Scholar] [CrossRef]
- Veigas, M.; López, M.; Romillo, P.; Carballo, R.; Castro, A.; Iglesias, G. A proposed wave farm on the Galician coast. Energy Convers. Manag. 2015, 99, 102–111. [Google Scholar] [CrossRef]
- Beels, C.; Troch, P.; Kofoed, J.P.; Frigaard, P.; Vindahl Kringelum, J.; Carsten Kromann, P.; Heyman Donovan, M.; De Rouck, J.; De Backer, G. A methodology for production and cost assessment of a farm of wave energy converters. Renew. Energy 2011, 36, 3402–3416. [Google Scholar] [CrossRef]
- O’Connor, M.; Lewis, T.; Dalton, G. Operational expenditure costs for wave energy projects and impacts on financial returns. Renew. Energy 2013, 50, 1119–1131. [Google Scholar] [CrossRef] [Green Version]
- Silva, D.; Bento, A.R.; Martinho, P.; Guedes Soares, C. High Resolution local wave energy modelling in the Iberian Peninsula. Energy 2015, 91, 1099–1112. [Google Scholar] [CrossRef]
- Silva, D.; Martinho, P.; Guedes Soares, C. Wave energy distribution along the Portuguese continental coast based on a thirty three years hindcast. Renew. Energy 2018, 127, 1064–1075. [Google Scholar] [CrossRef]
- Bento, A.R.; Rusu, E.; Martinho, P.; Guedes Soares, C. Assessment of the changes induced by a wave farm in the nearshore wave conditions. Comput. Geosci. 2014, 71, 50–61. [Google Scholar] [CrossRef]
- Castro-Santos, L.; Filgueira-Vizoso, A.; Carral-Couce, L.; Formoso, J.Á.F. Economic feasibility of floating offshore wind farms. Energy 2016, 112, 868–882. [Google Scholar] [CrossRef]
- Castro-Santos, L.; Diaz-Casas, V. Economic influence of location in floating offshore wind farms. Ocean Eng. 2015, 107, 13–22. [Google Scholar] [CrossRef]
- Short, W.; Packey, D.; Holt, T. A Manual for the Economic Evaluation of Energy Efficiency and Renewable Energy Technologies; National Renewable Energy Laboratory (NREL): Golden, CO, USA, 1995. [Google Scholar]
- Hertenstein, J.H.; Mckinnon, S.M. Solving the puzzle of the cash flow statement. Bus. Horiz. 1997, 40, 69–76. [Google Scholar] [CrossRef]
- Castro-Santos, L.; Prado, G.; Costa, P.; Estanqueiro, A. Methodology to design an economic and strategic offshore wind energy Roadmap in Portugal. In Proceedings of the 10th Deep Sea Wind R&D Conference, Trondheim, Norway, 24–25 January 2013; pp. 168–176. [Google Scholar]
- EMEC Pelamis Wave Power. Available online: http://www.emec.org.uk/about-us/wave-clients/pelamis-wave-power/ (accessed on 7 September 2016).
- Finavera Finavera Webpage. Available online: http://www.finavera.com/ (accessed on 1 September 2018).
- Silva, D.; Rusu, E.; Guedes Soares, C. Evaluation of Various Technologies for Wave Energy Conversion in the Portuguese Nearshore. Energies 2013, 6, 1344–1364. [Google Scholar] [CrossRef] [Green Version]
Figure 1.
Method adopted [source: own]. P: depth in meters; PWEC: wave energy converter (WEC) electric power generated; LCOE: levelized cost of energy.
Figure 1.
Method adopted [source: own]. P: depth in meters; PWEC: wave energy converter (WEC) electric power generated; LCOE: levelized cost of energy.

Figure 2.
Distance between wave energy converters (WECs) (87.5D) and distance between lines of WECs (47.5D). [Source: own].
Figure 2.
Distance between wave energy converters (WECs) (87.5D) and distance between lines of WECs (47.5D). [Source: own].

Figure 3.
Portugal and Spain.

Figure 4.
Bathymetry of Portugal, with P being the depth in meters [56].
Figure 4.
Bathymetry of Portugal, with P being the depth in meters [56].


Figure 6.
Bathymetry restriction. The white area represents the region selected considering the bathymetry restriction. The dashed line represents the territorial waters. [Source: own].
Figure 6.
Bathymetry restriction. The white area represents the region selected considering the bathymetry restriction. The dashed line represents the territorial waters. [Source: own].

Figure 7.
Power of Pelamis (a), AquaBuOY (b), and Wave Dragon (c). [Source: own].

Figure 8.
Results for LCOE without bathymetry restrictions for Pelamis (a), AquaBuOY (b), and Wave Dragon (c) platform. [Source: own].
Figure 8.
Results for LCOE without bathymetry restrictions for Pelamis (a), AquaBuOY (b), and Wave Dragon (c) platform. [Source: own].

Figure 9.
Results for LCOE with bathymetry restrictions for Pelamis (a), AquaBuOY (b), and Wave Dragon (c). [Source: own].
Figure 9.
Results for LCOE with bathymetry restrictions for Pelamis (a), AquaBuOY (b), and Wave Dragon (c). [Source: own].

Figure 10.
Results for IRR considering a tariff of 400 €/MWh and the bathymetry restriction for Pelamis (a), AquaBuOY (b), and Wave Dragon (c). [Source: own].
Figure 10.
Results for IRR considering a tariff of 400 €/MWh and the bathymetry restriction for Pelamis (a), AquaBuOY (b), and Wave Dragon (c). [Source: own].

Figure 11.
Results for NPV considering a tariff of 400 €/MWh and the bathymetry restriction for Pelamis (a), AquaBuOY (b), and Wave Dragon (c). [Source: own].
Figure 11.
Results for NPV considering a tariff of 400 €/MWh and the bathymetry restriction for Pelamis (a), AquaBuOY (b), and Wave Dragon (c). [Source: own].

Figure 12.
Results for IRR considering a tariff of 600 €/MWh and the bathymetry restriction for Pelamis (a), AquaBuOY (b), and Wave Dragon (c). [Source: own].
Figure 12.
Results for IRR considering a tariff of 600 €/MWh and the bathymetry restriction for Pelamis (a), AquaBuOY (b), and Wave Dragon (c). [Source: own].

Figure 13.
Results for NPV considering a tariff of 600 €/MWh and the bathymetry restriction for Pelamis (a), AquaBuOY (b), and Wave Dragon (c). [Source: own].
Figure 13.
Results for NPV considering a tariff of 600 €/MWh and the bathymetry restriction for Pelamis (a), AquaBuOY (b), and Wave Dragon (c). [Source: own].


Table 1.
Characteristics of the wave energy farms depending on the WEC taken into consideration.
| Concept | Pelamis | AquaBuOY | Wave Dragon | Units | |
|---|---|---|---|---|---|
| Number of WECs per line | 7 | 21 | 3 | WECs/line | |
| Number of lines | 21 | 21 | 9 | lines | |
| Total number of WECs in the farm | 147 | 441 | 27 | - | |
| Main dimension | 4 | 6 | 54 | m | |
| Power of each WEC | 0.75 | 0.25 | 4 | MW | |
| Total power of the farm | 110.25 | 110.25 | 108.00 | MW | |
| 110,250 | 110,250 | 108,000 | kW | ||
Table 2.
Electric tariffs considered for a floating offshore wave energy farm.
| Scenario | Electric Tariff (€/MWh) |
|---|---|
| Scenario 1 | 300 |
| Scenario 2 | 400 |
| Scenario 3 | 600 |
| Te (s) Hs (m) | Power Matrix (in kW) | ||||||||||||||||
|---|---|---|---|---|---|---|---|---|---|---|---|---|---|---|---|---|---|
| 5 | 5.5 | 6 | 6.5 | 7 | 7.5 | 8 | 8.5 | 9 | 9.5 | 10 | 10.5 | 11 | 11.5 | 12 | 12.5 | 13 | |
| 0.5 | 0 | 0 | 0 | 0 | 0 | 0 | 0 | 0 | 0 | 0 | 0 | 0 | 0 | 0 | 0 | 0 | 0 |
| 1 | 0 | 22 | 29 | 34 | 37 | 38 | 38 | 37 | 35 | 32 | 29 | 26 | 23 | 21 | 0 | 0 | 0 |
| 1.5 | 32 | 50 | 65 | 76 | 83 | 86 | 86 | 83 | 78 | 72 | 65 | 59 | 53 | 47 | 42 | 37 | 33 |
| 2 | 57 | 88 | 115 | 136 | 148 | 153 | 152 | 147 | 138 | 127 | 116 | 104 | 93 | 83 | 74 | 66 | 59 |
| 2.5 | 89 | 138 | 180 | 212 | 231 | 238 | 238 | 230 | 216 | 199 | 181 | 163 | 146 | 130 | 116 | 103 | 92 |
| 3 | 129 | 198 | 260 | 305 | 332 | 340 | 332 | 315 | 292 | 266 | 240 | 219 | 210 | 188 | 167 | 149 | 132 |
| 3.5 | 0 | 270 | 354 | 415 | 438 | 440 | 424 | 404 | 377 | 362 | 326 | 292 | 260 | 230 | 215 | 202 | 180 |
| 4 | 0 | 0 | 462 | 502 | 540 | 546 | 530 | 499 | 475 | 429 | 384 | 366 | 339 | 301 | 267 | 237 | 213 |
| 4.5 | 0 | 0 | 544 | 635 | 642 | 648 | 628 | 590 | 562 | 528 | 473 | 432 | 382 | 356 | 338 | 300 | 266 |
| 5 | 0 | 0 | 0 | 739 | 726 | 731 | 707 | 687 | 670 | 607 | 557 | 521 | 472 | 417 | 369 | 348 | 328 |
| 5.5 | 0 | 0 | 0 | 750 | 750 | 750 | 750 | 750 | 737 | 667 | 658 | 586 | 530 | 496 | 446 | 395 | 355 |
| 6 | 0 | 0 | 0 | 0 | 750 | 750 | 750 | 750 | 750 | 750 | 711 | 633 | 619 | 558 | 512 | 470 | 415 |
| 6.5 | 0 | 0 | 0 | 0 | 750 | 750 | 750 | 750 | 750 | 750 | 750 | 743 | 658 | 621 | 579 | 512 | 481 |
| 7 | 0 | 0 | 0 | 0 | 0 | 750 | 750 | 750 | 750 | 750 | 750 | 750 | 750 | 676 | 613 | 584 | 525 |
| 7.5 | 0 | 0 | 0 | 0 | 0 | 0 | 750 | 750 | 750 | 750 | 750 | 750 | 750 | 750 | 686 | 622 | 593 |
| 8 | 0 | 0 | 0 | 0 | 0 | 0 | 0 | 750 | 750 | 750 | 750 | 750 | 750 | 750 | 750 | 690 | 625 |
| Tp (s) Hs (m) | Power Matrix (in kW) | ||||||||||||
|---|---|---|---|---|---|---|---|---|---|---|---|---|---|
| 5 | 6 | 7 | 8 | 9 | 10 | 11 | 12 | 13 | 14 | 15 | 16 | 17 | |
| 1 | 0 | 0 | 8 | 11 | 12 | 11 | 10 | 8 | 7 | 0 | 0 | 0 | 0 |
| 1.5 | 0 | 13 | 17 | 25 | 27 | 26 | 23 | 19 | 15 | 12 | 12 | 12 | 7 |
| 2 | 0 | 24 | 30 | 44 | 49 | 47 | 41 | 34 | 28 | 23 | 23 | 23 | 12 |
| 2.5 | 0 | 37 | 47 | 69 | 77 | 73 | 64 | 54 | 43 | 36 | 36 | 36 | 19 |
| 3 | 0 | 54 | 68 | 99 | 111 | 106 | 92 | 77 | 63 | 51 | 51 | 51 | 27 |
| 3.5 | 0 | 0 | 93 | 135 | 152 | 144 | 126 | 105 | 86 | 70 | 70 | 70 | 38 |
| 4 | 0 | 0 | 0 | 122 | 176 | 198 | 188 | 164 | 137 | 112 | 91 | 91 | 49 |
| 4.5 | 0 | 0 | 0 | 223 | 250 | 239 | 208 | 173 | 142 | 115 | 115 | 115 | 62 |
| 5 | 0 | 0 | 0 | 250 | 250 | 250 | 250 | 214 | 175 | 142 | 142 | 142 | 77 |
| 5.5 | 0 | 0 | 0 | 250 | 250 | 250 | 250 | 250 | 211 | 172 | 172 | 172 | 92 |
| Tp (s) Hs (m) | Power Matrix (in kW) | ||||||||||||
|---|---|---|---|---|---|---|---|---|---|---|---|---|---|
| 5 | 6 | 7 | 8 | 9 | 10 | 11 | 12 | 13 | 14 | 15 | 16 | 17 | |
| 1 | 160 | 250 | 360 | 360 | 360 | 360 | 360 | 360 | 320 | 280 | 250 | 220 | 180 |
| 2 | 640 | 700 | 840 | 900 | 1190 | 1190 | 1190 | 1190 | 1070 | 950 | 830 | 710 | 590 |
| 3 | 0 | 1450 | 1610 | 1750 | 2000 | 2620 | 2620 | 2620 | 2360 | 2100 | 1840 | 1570 | 1310 |
| 4 | 0 | 0 | 2840 | 3220 | 3710 | 4200 | 5320 | 5320 | 4430 | 3930 | 3440 | 2950 | 2460 |
| 5 | 0 | 0 | 0 | 4610 | 5320 | 6020 | 7000 | 7000 | 6790 | 6090 | 5250 | 3950 | 3300 |
| 6 | 0 | 0 | 0 | 0 | 6720 | 7000 | 7000 | 7000 | 7000 | 7000 | 6860 | 5110 | 4200 |
| 7 | 0 | 0 | 0 | 0 | 0 | 7000 | 7000 | 7000 | 7000 | 7000 | 7000 | 6650 | 5740 |
Table 6.
Example of the number of occurrences for different sea states (in % from the total) for a point of Portugal. Hs: wave height; Tp: wave peak period.
Table 6.
Example of the number of occurrences for different sea states (in % from the total) for a point of Portugal. Hs: wave height; Tp: wave peak period.
| Tp (s) Hs (m) | 5 | 6 | 7 | 8 | 9 | 10 | 11 | 12 | 13 | 14 | 15 | 16 | 17 |
|---|---|---|---|---|---|---|---|---|---|---|---|---|---|
| 1 | 0.63 | 0.41 | 0.93 | 1.26 | 0.70 | 0.38 | 0.11 | 0.06 | 0 | 0.03 | 0.02 | 0 | 0 |
| 2 | 2.43 | 5.93 | 3.38 | 5.67 | 6.77 | 8.50 | 7.23 | 2.68 | 0.06 | 0.77 | 0.22 | 0.06 | 0.02 |
| 3 | 0.01 | 1.27 | 6.20 | 2.07 | 1.10 | 2.79 | 7.73 | 6.05 | 0.07 | 2.19 | 0.41 | 0.22 | 0.04 |
| 4 | 0 | 0 | 0.44 | 2.98 | 0.58 | 0.38 | 1.55 | 3.66 | 0.07 | 2.28 | 0.39 | 0.24 | 0.03 |
| 5 | 0 | 0 | 0 | 0.53 | 1.10 | 0.30 | 0.25 | 1.11 | 0.03 | 1.57 | 0.30 | 0.24 | 0.01 |
| 6 | 0 | 0 | 0 | 0.02 | 0.23 | 0.54 | 0.09 | 0.13 | 0.01 | 0.68 | 0.47 | 0.19 | 0.05 |
| 7 | 0 | 0 | 0 | 0 | 0.02 | 0.16 | 0.20 | 0.03 | 0.01 | 0.09 | 0.11 | 0.22 | 0.04 |
Table 7.
Results for the 300 €/MWh tariff. IRR: internal rate of return; NPV: net present value.
| Type of WEC | IRR | NPV |
|---|---|---|
| Wave Dragon | 4.74% | −67.56 M€ |
| Pelamis | 11.94% | −561.52 M€ |
| AquaBuOY | −50.94% | 2732.93 M€ |
© 2018 by the authors. Licensee MDPI, Basel, Switzerland. This article is an open access article distributed under the terms and conditions of the Creative Commons Attribution (CC BY) license (http://creativecommons.org/licenses/by/4.0/).
Share and Cite
MDPI and ACS Style
Castro-Santos, L.; Silva, D.; Bento, A.R.; Salvação, N.; Guedes Soares, C. Economic Feasibility of Wave Energy Farms in Portugal. Energies 2018, 11, 3149. https://doi.org/10.3390/en11113149
AMA Style
Castro-Santos L, Silva D, Bento AR, Salvação N, Guedes Soares C. Economic Feasibility of Wave Energy Farms in Portugal. Energies. 2018; 11(11):3149. https://doi.org/10.3390/en11113149
Chicago/Turabian StyleCastro-Santos, Laura, Dina Silva, A. Rute Bento, Nadia Salvação, and C. Guedes Soares. 2018. "Economic Feasibility of Wave Energy Farms in Portugal" Energies 11, no. 11: 3149. https://doi.org/10.3390/en11113149
Note that from the first issue of 2016, this journal uses article numbers instead of page numbers. See further details here.