Article

Relationship between Torrefaction Parameters and Physicochemical Properties of Torrefied Products Obtained from Selected Plant Biomass

Department of Bioenergetics and Food Analysis, Faculty of Biology and Agriculture, University of Rzeszow, Zelwerowicza 4, 35-601 Rzeszow, Poland
*
Author to whom correspondence should be addressed.
Energies 2018, 11(11), 2919; https://doi.org/10.3390/en11112919
Submission received: 26 September 2018 / Revised: 18 October 2018 / Accepted: 24 October 2018 / Published: 26 October 2018

Abstract

:
Waste biomass from plant production is an important raw material for producing energy from renewable sources. Capabilities and technologies of processing are still being improved and modernized in order to achieve the highest energy efficiency. This study assesses energetic properties of wheat straw, rapeseed, and willow. The material was subjected to heat treatment, i.e., torrefaction process at temperatures of 220, 260, and 300 °C for the duration of 60, 75, and 90 min. Measurements were performed to compare parameters of raw biomass and the torrefied products. The materials were examined and compared for the contents of moisture; biogenic elements N, C, and H; as well as calorific value, ash, and volatiles. Measurements were also performed to assess the composition of biomass in terms of particle sizes. Analysis of the results made it possible to determine optimal parameters for carrying out the torrefaction process. The use of the torrefaction process made it possible to obtain a material with an increased calorific value by more than 20%, and a 2–3 times higher content of elements in the powdered material, as well as to improve the grinding of the material. This information will enable the development of biomass thermal treatment technologies towards the use of waste biomass from agricultural production.

1. Introduction

Many research institutions and corporations involved in production of energy from biomass currently in their research focus on the development of and improvements in the technologies of energy conversion, process effectiveness, and the enhancement of the energy properties of the fuels obtained as a result of thermochemical transformation. Agro-type raw materials have significant potential, i.e., production residues from forestry and agriculture sectors contribute to the development of such research, which directly translates into improved energy security, reduced negative climate changes, and growth of local markets [1]. Many countries have introduced a special energy policy to reduce greenhouse gas emissions. In the case of heating applications, this has led to increased use of biomass-fired furnaces. In many cases, these devices use a single combustion chamber originally designed to burn coal, and often the combustion process is poorly controlled. New combustion technologies designed specifically for biomass fuels allow one to reduce dust emissions as well as organic compounds to the environment [2].
In the group of thermochemical transformation processes, the most commonly applied techniques include direct combustion, pyrolysis, gasification of biomass [3,4], and processes of co-combustion with coal [5]. Significant problems associated with these processes include high moisture contents in biomass and low energy density, which adversely affect the attractiveness of this fuel. Additionally, during storage biomass is exposed to microorganisms, destroying the material and damaging its quality [6].
One of the ways to improve the energy properties of biomass involves the torrefaction process. This technology of thermal processing is applied mainly to biomass of plant origin, i.e., lignocellulosics, in order to transform it into the form of solid fuel; torrefied products, otherwise known as biocoal, have properties similar to those of hard coal [7,8]. The temperatures used in this process are in the range of 200–300 °C. Torrefaction is carried out in inert atmosphere and at pressure similar or equal to atmospheric pressure [9,10]. The use of higher temperatures, exceeding 350 °C, leads to production of charcoal, which is an undesired effect of torrefaction process [11]. Changes in biomass structure result from the destruction of its fibrous framework due to the decomposition of polymer structures, which leads to a decrease in the mechanical strength of the obtained material and consequently enables the reduction of costs related to the grinding of the torrefied products [12]. In a classic torrefaction process, the material is partially degassed, which leads to loss of mass, yet the simultaneous decrease in energy is lower in comparison to weight loss [13]. Unreleased energy from volatile compounds is densified and retained in the solid products of the process. This biomass processing technology enables reduction of weight by 30%, while preserving 90% of the original energy [9].
The characteristics of the torrefaction process, particularly in terms of physicochemical changes, are affected by a number of factors. The torrefaction process can be carried out in stationary fluidized bed reactors as well as in pressure reactors. According to Brachi et al. [14], the fluidized torrefaction technology is better in the context of heat transfer during the process. The authors also prove that fluidized beds have proven to be more effective in providing uniform and consistent quality of torrefied biomass [15]. These include biomass composition; fragmentation of the input product; the temperature of the process and the pace of its increase, composition, and pressure of process gas; and the total duration of the process. The physicochemical phenomena occurring during the process of heating lignocellulosic biomass include drying, depolymerization, carbonization, as well as extensive devolatilization and further carbonization [16]. The quality of the torrefaction process is reflected by the degree of mass and energy loss. The latter values characterize, in quantitative terms, the change in weight and chemical energy of biomass, mainly due to dehydration and devolatilization. Mass loss increases with higher final temperature and time the longer the biomass is kept in a reactor [17]. Loss of energy, due to devolatilization, generally does not exceed 10% in temperatures up to 250 °C and 15–20% in temperatures up to 300 °C [18]. In comparison to other available technologies of thermal biomass conversion, torrefaction is not a complicated process. The conditions that must be met in order to effectively carry out the treatment are possible to achieve by many commercial users [19].
Straws of these two-plant species are the most common waste biomass from crop production of agricultural origin. Energy willow is most commonly grown from energy plants. The high availability of such materials was the premise for choosing this biomass for research. The purpose of the study was to examine the influence of temperatures applied during torrefaction on the properties of the torrefied products obtained in specific conditions and to compare them with properties of raw biomass, as well as to assess the practicality of the torrefaction process and the usefulness of torrefied products as fuel in the energy sector.

2. Material and Methods

2.1. Parameters of The Torrefaction Process

Detailed laboratory tests examining the effect of temperature used during torrefaction process in distribution and physicochemical properties of the products were conducted for rapeseed straw, wheat straw, and willow grown for biomass. From the cultivation area of 0.5 hectare for each plant, 20 primary samples weighing 0.5 kg each were collected. Then, the collected material was combined into a total sample, the total mass of which was 10 kg. The same procedure was applied for all analyzed materials. After transporting the examined biomass to the laboratory, it was brought to the air-dry state, and then it was subjected to the homogenization process. During the grinding process, a sieve with a mesh size of 10 mm was used. This size allowed free analysis of biomass in other laboratory equipment. The homogenised material was divided into two equal parts. The first part was marked as raw biomass, while the second part was designated for the torrefaction process. Torrefaction process was carried out in TGA stationary bed reactor. The use of a resistance furnace producing temperatures up to 1000 °C allows the monitoring of mass loss as a function of temperature in a controlled atmosphere. After selecting the analysis method, empty ceramic crucibles are loaded into a ceramic plate placed inside the furnace, allowing simultaneous analysis of 19 samples, weighing up to 7 g each. The initial sample mass is measured and stored automatically. After loading all samples, analysis according to the program of the chosen method starts. Each of the crucibles is weighted successively, and the current readings are collected in a mellow. The cycle is repeated until all the samples meet the condition of completing the given analysis stage (reaching a constant mass or a specific time). The torrefaction of willow, wheat straw, and rapeseed straw was carried out at 220, 260, and 300 °C for the duration of 60, 75, and 90 min. Each torrefaction test contained 100 g of the material tested. The process was conducted in nitrogen atmosphere with 99.99% purity (Air Products, Warsaw City, Poland), and with a gas flow rate of 10 L/min, with temperature increases of 30 °C/min. After the process was completed, the material was homogenized, and the aggregate sample prepared this way was subjected to laboratory tests in order to determine its basic calorific and physicochemical properties.

2.2. Evaluation of Energy Parameters

The qualitative assessment of biomass and torrefied products was designed to focus on parameters connected with chemical composition and energy properties. Moisture content was measured in accordance with standard [20], and total ash in accordance with standard [21] with LECO TGA 701 (LECO Corporation, Saint Joseph, MI, USA) apparatus. The contents of C, H, N, and S were measured with LECO TrueSpec (LECO Corporation, Saint Joseph, MI, USA) apparatus, in accordance with the respective standards [22,23]. Calorific value of pellets was determined with calorimeter LECO AC500 (LECO Corporation, Saint Joseph, MI, USA), according to [24]. The raw materials and the torrefied products were also examined for their granulometric composition. The relevant material was subjected to grinding in a high-speed lab mill. Each specimen was ground for 5 s. As a consequence, it was possible to determine percentage value of the mass of a given specimen that was captured by the sieves.

2.3. Mineralization and Determination of Elements in the Analyzed Biomass

The samples of biomass and torrefied were subjected to mineralisation under high pressure, in super pure 65% HNO3. 5 g samples were weighed and placed in Teflon vessels, which were then filled with 8 mL of nitric acid and sealed tightly. For each group of nine samples, the rotor of the digestion system was also filled with a blank sample. The samples were digested with the algorithm of temperature increase applied as specified for biological samples, without exceeding 200 °C. This was carried out using an Ethos One microwave digestion system from Milestone (Sorisole (BG)–Italy). The vessels were opened after the mineralisation process had been completed and the samples with acid had been brought to room temperature. The samples were cooled down to room temperature and supplemented with water to a volume of 50 mL. The detection threshold obtained for each element was not lower than 0.01 mg kg−1 (with an assumed detection capacity of the measuring apparatus at a level exceeding 1 ppb). The measurements were performed with an ICP-OES spectrometer, Thermo iCAP Dual 6500 (Thermo Fisher Scientific, Schaumburg, IL, USA) with horizontal plasma, and with the capacity of detection being determined both along and across the plasma flame.

2.4. Determination of Organic Compounds in Biomass

Additionally, examination of raw biomass for its chemical composition included measurement of cellulose contents based on Seifert method, with the use of acetylacetone-dioxane mixture [25]; lignin contents with Tappi method, with the use of concentrated sulphuric acid [26]; and hemicellulose contents with the use of sodium chlorite, in accordance with standard [27].

2.5. Statistical Methods

The verification of the influence of the experimental factors used on the parameters analysed and existing dependencies was performed using ANOVA statistical analysis by means of the Bonferroni post hoc test. A materiality level of α ≤ 0.05 was applied. Statistical analyses were performed using Statistica 12 software (StatSoft Polska, Krakow, Poland).

3. Results and Discussion

3.1. Content of Lignin, Cellulose, and Hemicellulose in the Analyzed Biomass.

Table 1 presents proportional contents of the selected polymers in the examined biomass. The highest cellulose content was identified in willow 44.6%; lignin at the level of 21.3% was found in wheat straw, and hemicellulose at the level of 32.1% was found in willow biomass [28]. Of all the examined polymers, the proportional content of lignin was at the lowest level. Proportional contents of the polymers are important from the viewpoint of energy-related application of the material and the technologies, as well as processing effectiveness, particularly during thermochemical conversion as presented by Kumar et al. in their research [29]. The use of lignocellulosic biomass as a raw material for fuel production has many advantages, such as non-food raw materials, high availability, and a relatively lower cost, which is confirmed by numerous studies [30,31].

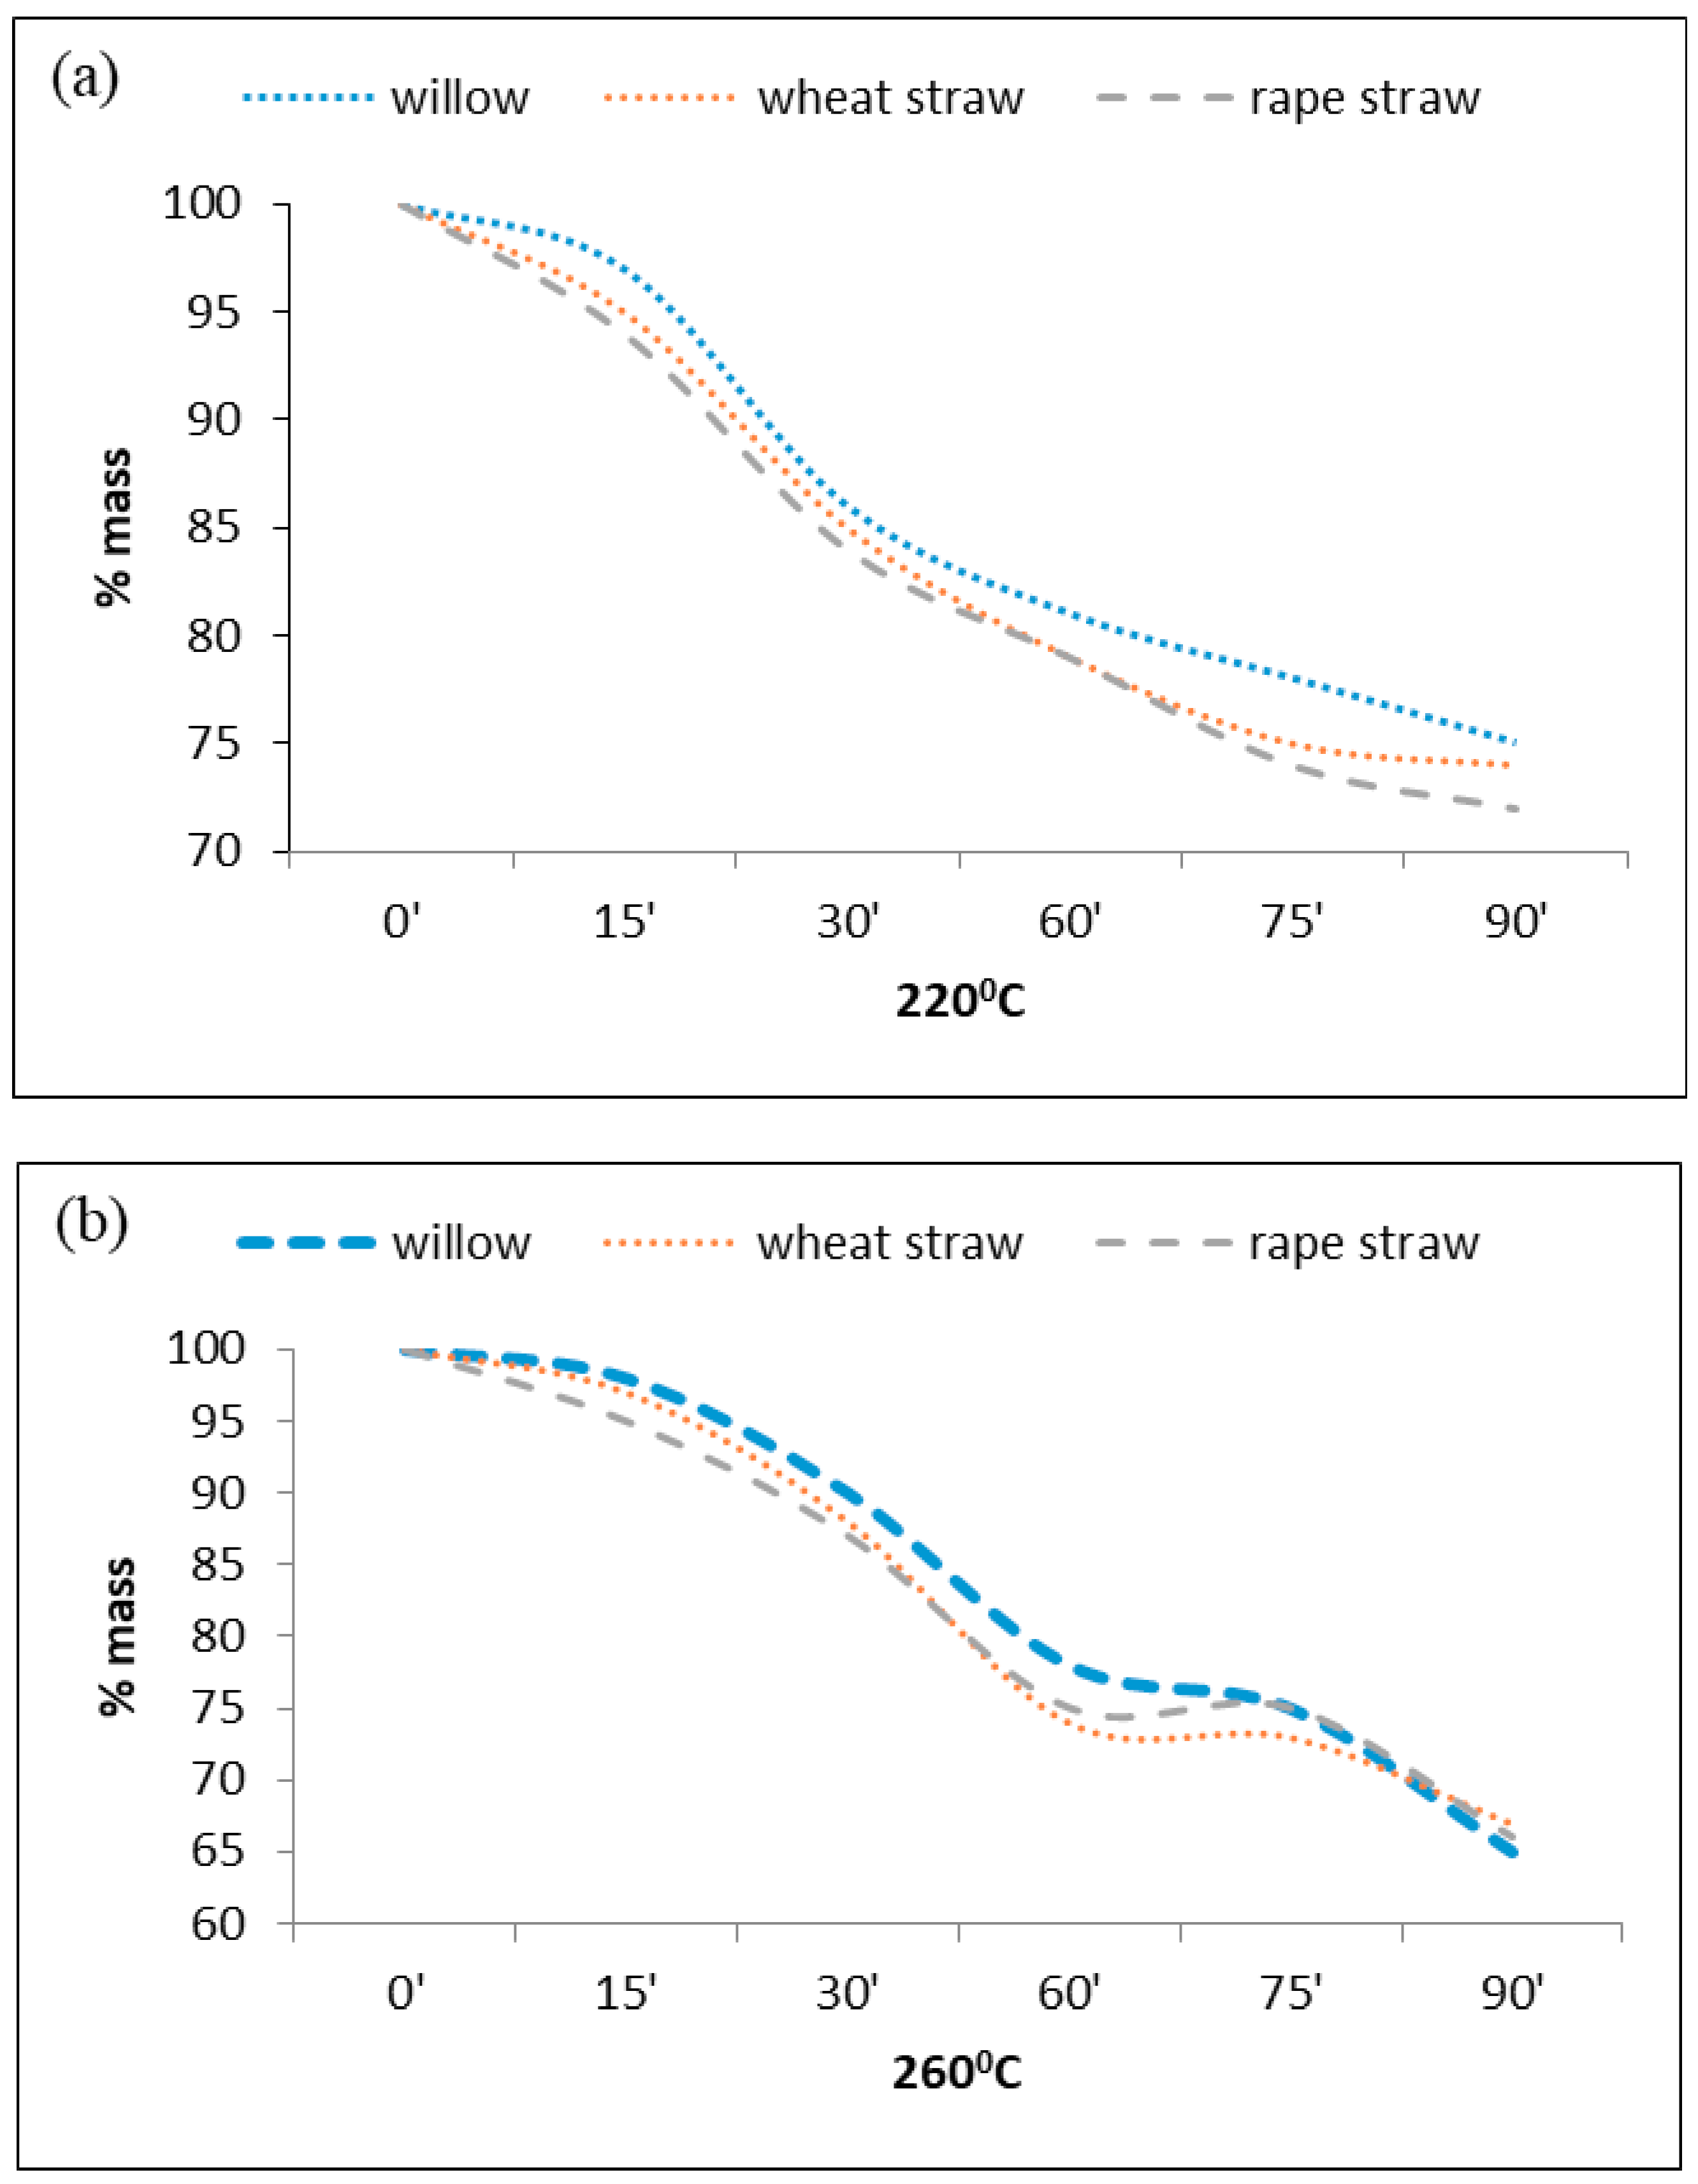
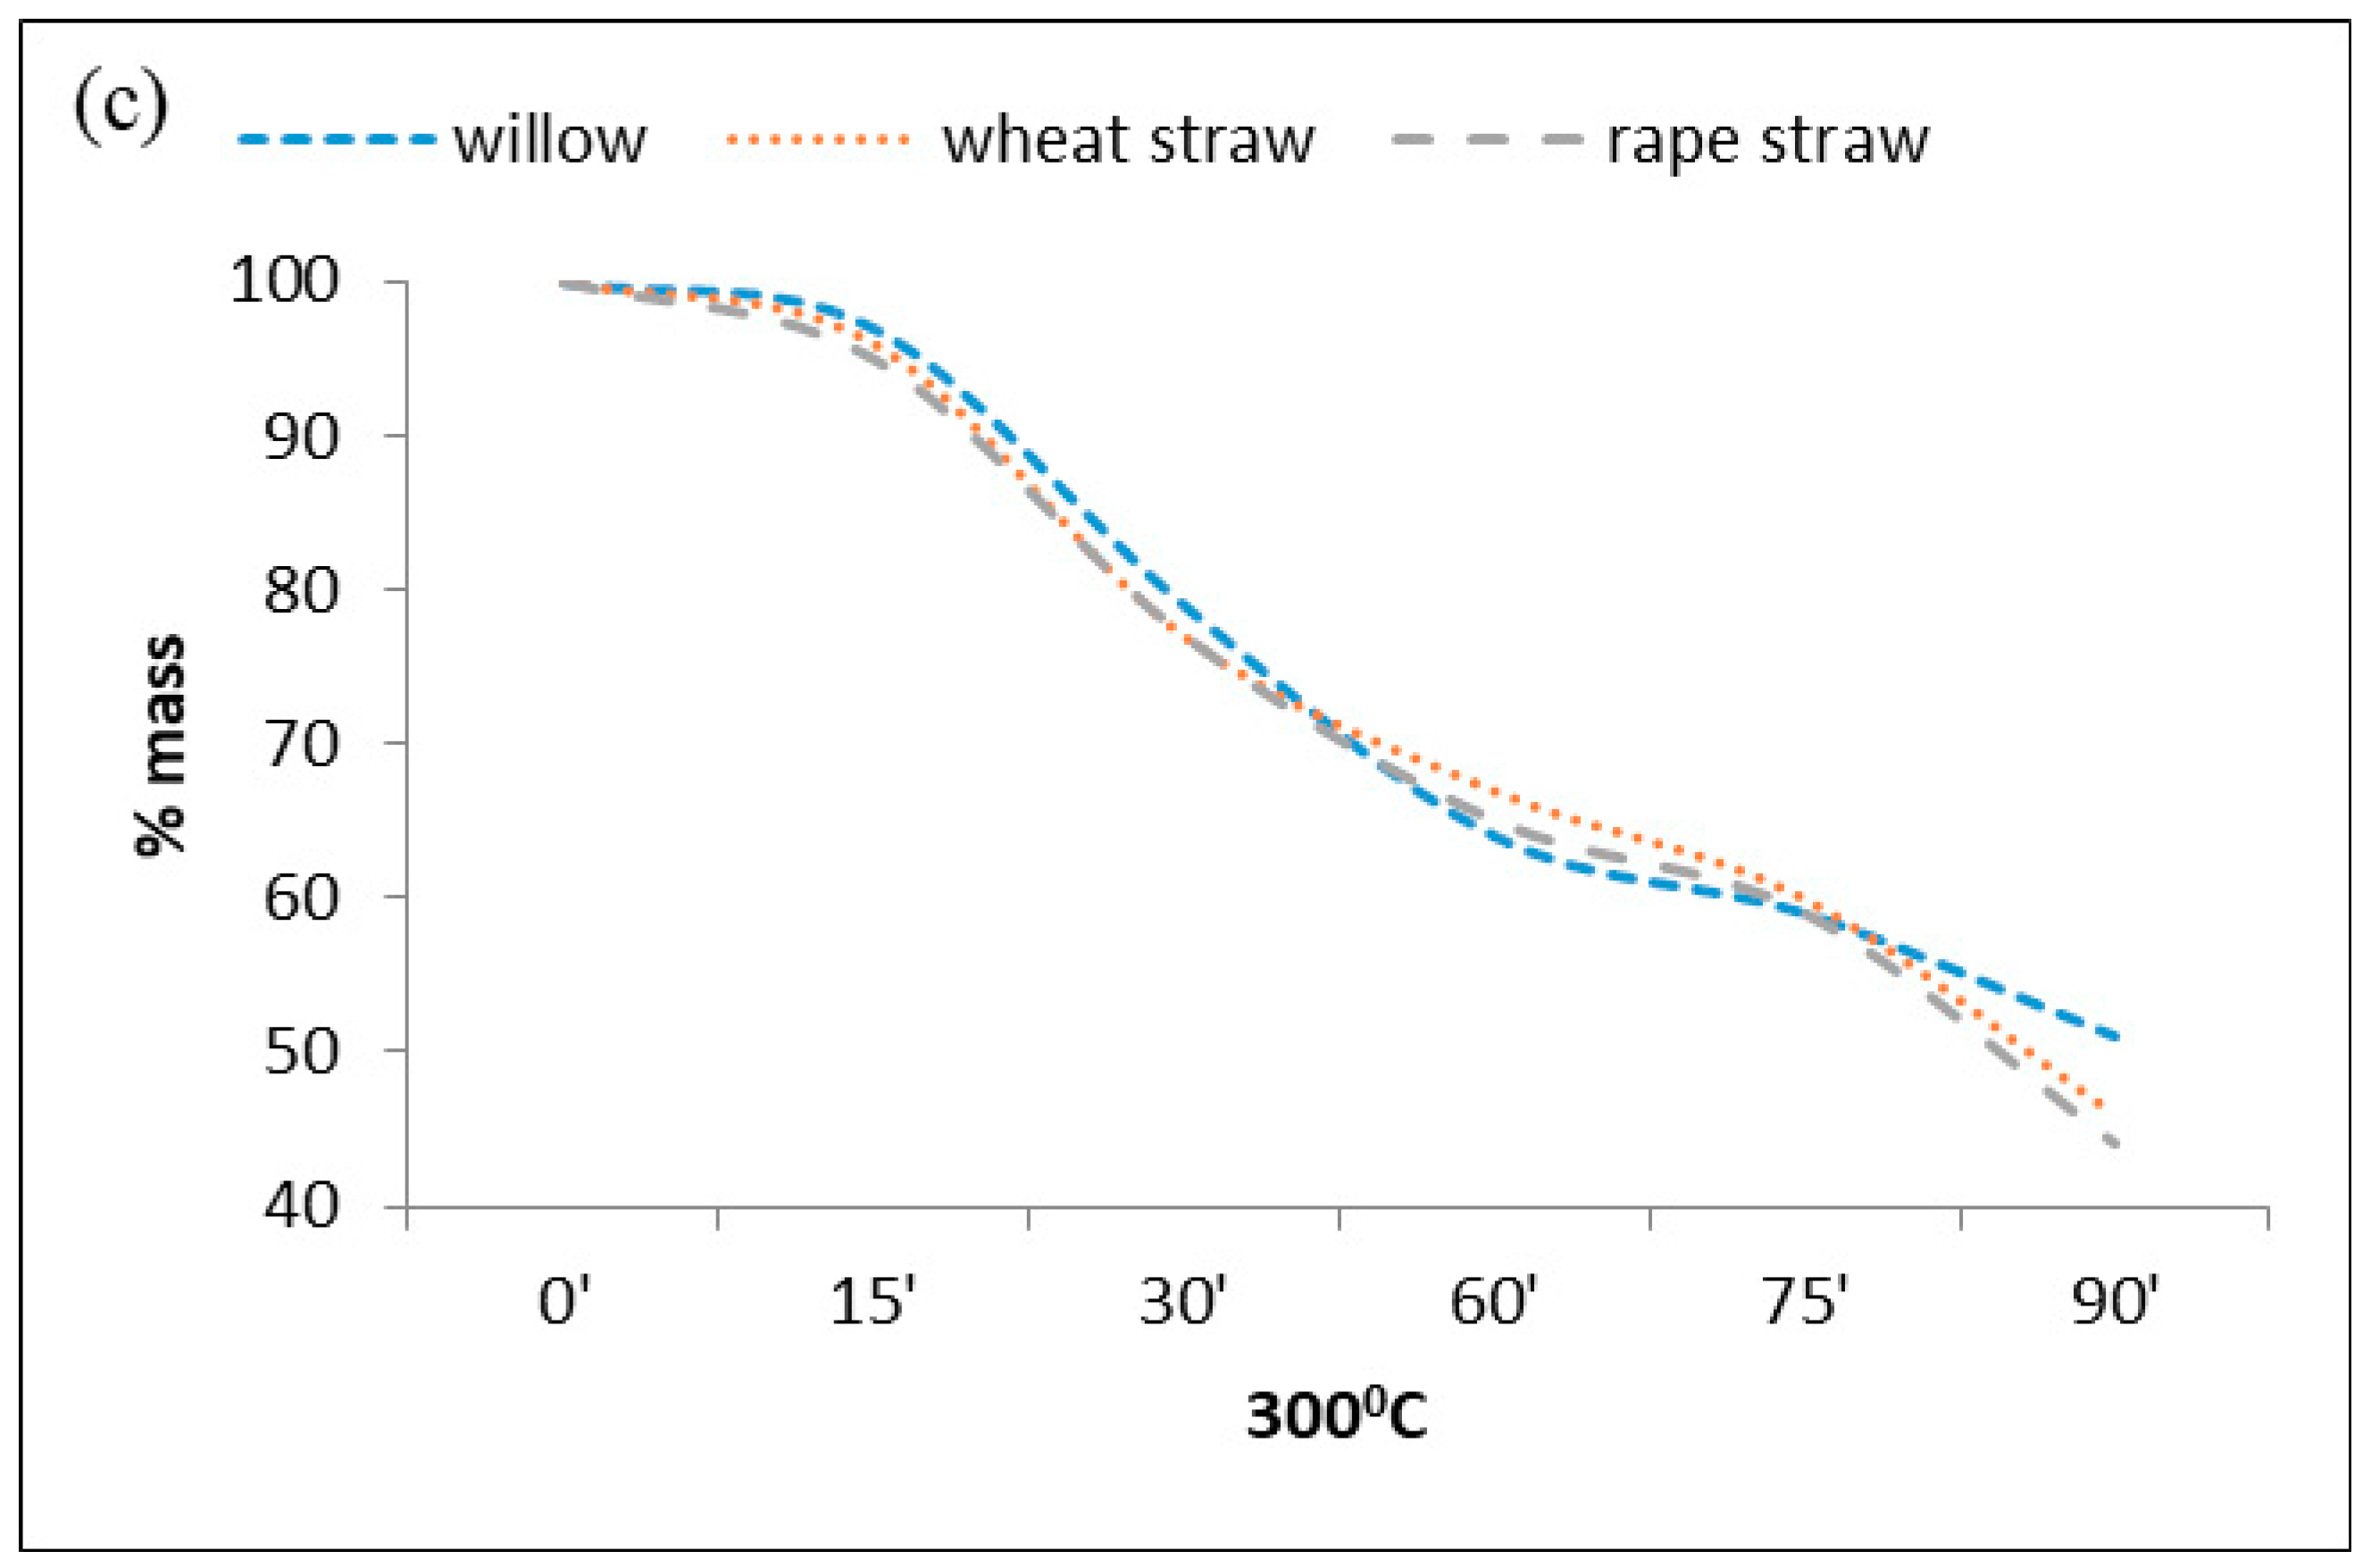
3.2. Assessment of the Impact of Torrefaction Temperature on Mass and Energy Efficiency

Data in Table 2 confirm the necessity of research and analysis of process conditions aimed at optimizing the process parameters. The objective of the process is to obtain top-quality fuel to be used in industrial and commercial power engineering. By obtaining the most effective process in optimal conditions, it will be possible to minimize costs. As expected, the mass yield of torrefied biomass decreased when torrefaction temperature increased. The loss of mass during torrefaction results from the drying process and biomass of thermal degradation components, which Chen, Hill, and others have presented in their research [10,32]. According to Poudel and other authors [33], the loss of mass can reach the point where the torrefaction process is considered economically unprofitable. Therefore, the research carried out by many authors is aimed at providing an optimal range of temperatures that completely benefits the torrefaction process.
Figure 1 shows changes in the weight of the material depending on temperature and duration of torrefaction process resulting from changes in the chemical structure, water loss, and degassing of the material. Increase in the parameters was associated with a significantly greater mass loss in the materials. The most pronounced mass losses were recorded at the temperature of 300 °C, with timing over 60 min. Similar trends have been observed by other authors [1].

3.3. Mineralization and Determination of Elements in the Analyzed Biomass

Table 3 presents a summary of the basic parameters describing quality of the examined materials, in terms of their applicability for power engineering purposes. A comparison of raw biomass and the torrefied products shows differences, which are significantly impacted by the process temperature. It was observed there was a significant increase in carbon and nitrogen contents and in calorific value in comparison with raw biomass. These changes ranged from a few to a dozen or so percent.
The highest LHV (lower heating value) was recorded in the torrefied product obtained from willow biomass, processed at 300 °C, for 60 min. The above time and temperature parameters were found to be most effective for each of the examined materials, as they made it possible to obtain the highest calorific value. Changes in the process parameters (increase in temperature and process duration) in each case resulted in an increase or decrease of the examined parameter. The changes that occurred during torrefaction explain the mechanism of increasing carbon contents in the material. Many studies have shown that the temperature impact of the torrefaction process is more significant than the residence time. Chin and others [32] found in their studies that the MJ kg−1 ratio increased both with residence time and temperature, but larger changes were noted at the temperature of the torrefaction process. An increase in process temperature coincides with a change in the chemical structure of the material, i.e., decomposition of cellulose and processes of hemicellulose structures carbonization at temperatures in the range of 220–320 °C. Besides improving physical attributes, torrefaction also results in significant changes in composition of biomass and makes it more suitable for fuel applications, as in Werkelin et al. [34].
In the analyzed materials, the phenomenon of accumulation of the studied elements was observed. In each analyzed material, similar trends of changes in the content of elements were observed. Both the increase of the temperature and time of the torrefaction process affected the increased concentration (from a few to more than 300%) of Ca, K, Mg, P, and S (with the exception of rape straw, in which the trend changes were reversed) in torrefied products. The exception was Fe, Mn, and Zn, in which their share in the torrefaction in comparison to raw biomass did not change significantly. The elements selected for analysis are important in the context of the use of biomass materials in the further use cycle in the environment. The result of transformations occurring during the torrefaction process is the densification of the chemical composition of the analyzed biomass. Higher concentration of elements in the final product is an important argument confirming the possibility of using torrefied in many processes of alternative use in agriculture, e.g., as ash fertilizers. Analyzing literature data, one can observe the wide use of torrefactors in soil fertilization processes, in order to improve its physical properties, e.g., water–air relations, use as an addition to composting processes that positively influence the parameters of the obtained compost as a material for removing pollutants from the soil and water environment.
The result of transformations occurring during the torrefaction process is the concentration of the chemical composition of the analyzed material. In wheat straw, the calcium content was 12.7 mg g−1. The highest calcium content was recorded for torrefaction parameters 300 °C and 90 min, and it amounted to 18.6 mg g−1. The potassium content in the straw was 8.34 mg g−1. The highest potassium content was noted for torrefaction parameters 300 °C and 90 min, and it amounted to 24.4 mg g−1. A similar trend was noted for the magnesium content. The highest magnesium content was noted for torrefaction parameters 300 °C and 90 min, and it amounted to mg g−1. Significant changes were also observed for phosphorus content, which for raw biomass was 0.97 mg g−1. The highest content of phosphorus was noted for the parameters of torrefaction process 300 °C and 90 min, and it amounted to 3.03 mg g−1. In the raw biomass, the sulfur content was at the level of 0.97 mg g−1. The highest sulfur content was noted for torrefaction parameters 300 °C and 90 min, and it amounted to 1.98 mg g−1. The levels of iron, manganese, and zinc concentrations were below 0.16 mg g−1 and showed an upward trend during the whole range of the torrefaction process (Table 4). According to Prince et al., changes in chemical composition result from the transformation of structure caused by the action of temperature on biomass during torrefaction [35].
In raw rape straw, the calcium content was 17.4 mg g−1. The highest calcium content was noted for the torrefaction parameters 300 °C and 90 min, and it amounted to 36.9 mg g−1. The content of potassium in the raw straw was 6.92 mg g−1. The highest potassium content was noted for torrefaction parameters 300 °C and 90 min, and it amounted to 17.8 mg g−1. A similar trend was noted for the magnesium content, which was 1.03 mg g−1. The highest magnesium content was noted for torrefaction parameters 300 °C and 90 min, and it amounted to 3.21 mg g−1. Significant changes were also observed for phosphorus content, which for raw biomass was 1.77 mg g−1. The highest phosphorus content was recorded for the parameters of torrefaction process 300 °C and 90 min, and it amounted to 3.89 mg g−1. In the raw biomass, the sulfur content was at the level of 0.98 mg g−1. The highest sulfur content was recorded for torrefaction parameters 300 °C and 90 min, and it amounted to 2.01 mg g−1. The levels of iron, manganese, and zinc concentrations were below 0.34 mg g−1 and also showed an upward trend during the whole range of the torrefaction process, as shown in Table 5.
In the analyzed material, as in the case of wheat and rape straw, the phenomenon of accumulation of the studied elements was observed. The result of transformations occurring during the torrefaction process is the densification of the chemical composition of the analyzed biomass. In willow raw, the calcium content was 14.8 mg g−1. The highest calcium content was recorded for torrefaction parameters 300 °C and 90 min, and it was 31.4 mg g−1. The content of potassium in the raw willow was 5.88 mg g−1. The highest potassium content was noted for torrefaction parameters 300 °C and 90 min, and it amounted to 15.2 mg g−1. A similar trend was noted for the magnesium content, which was 0.88 mg g−1 for the crude material. The highest magnesium content was noted for the 300 °C torrefaction process parameters and 90 min, and it amounted to 2.73 mg g−1. Significant changes were also observed for the phosphorus content, which was 1.5 mg g−1. The highest phosphorus content was noted for the parameters of torrefaction process 300 °C and 90 min, and it amounted to 3.31 mg g−1. In the willow raw, the sulfur content was at the level of 0.2 mg g−1. The highest sulfur content was recorded for torrefaction parameters 300 °C and 90 min, and it amounted on average to 0.31 mg g−1. The levels of iron, manganese, and zinc concentrations were below 0.29 mg g−1 and also showed an upward trend during the whole range of the torrefaction process, as shown in Table 6.
Biomass contains many significant cations important for plants and the environment, and is an excellent material that is a valuable source in fertilizing plants, as described by Werkelin et al. [33]. The roasting process has an impact on improving its properties and obtaining bio preparations that can be used for fertilizing plants.

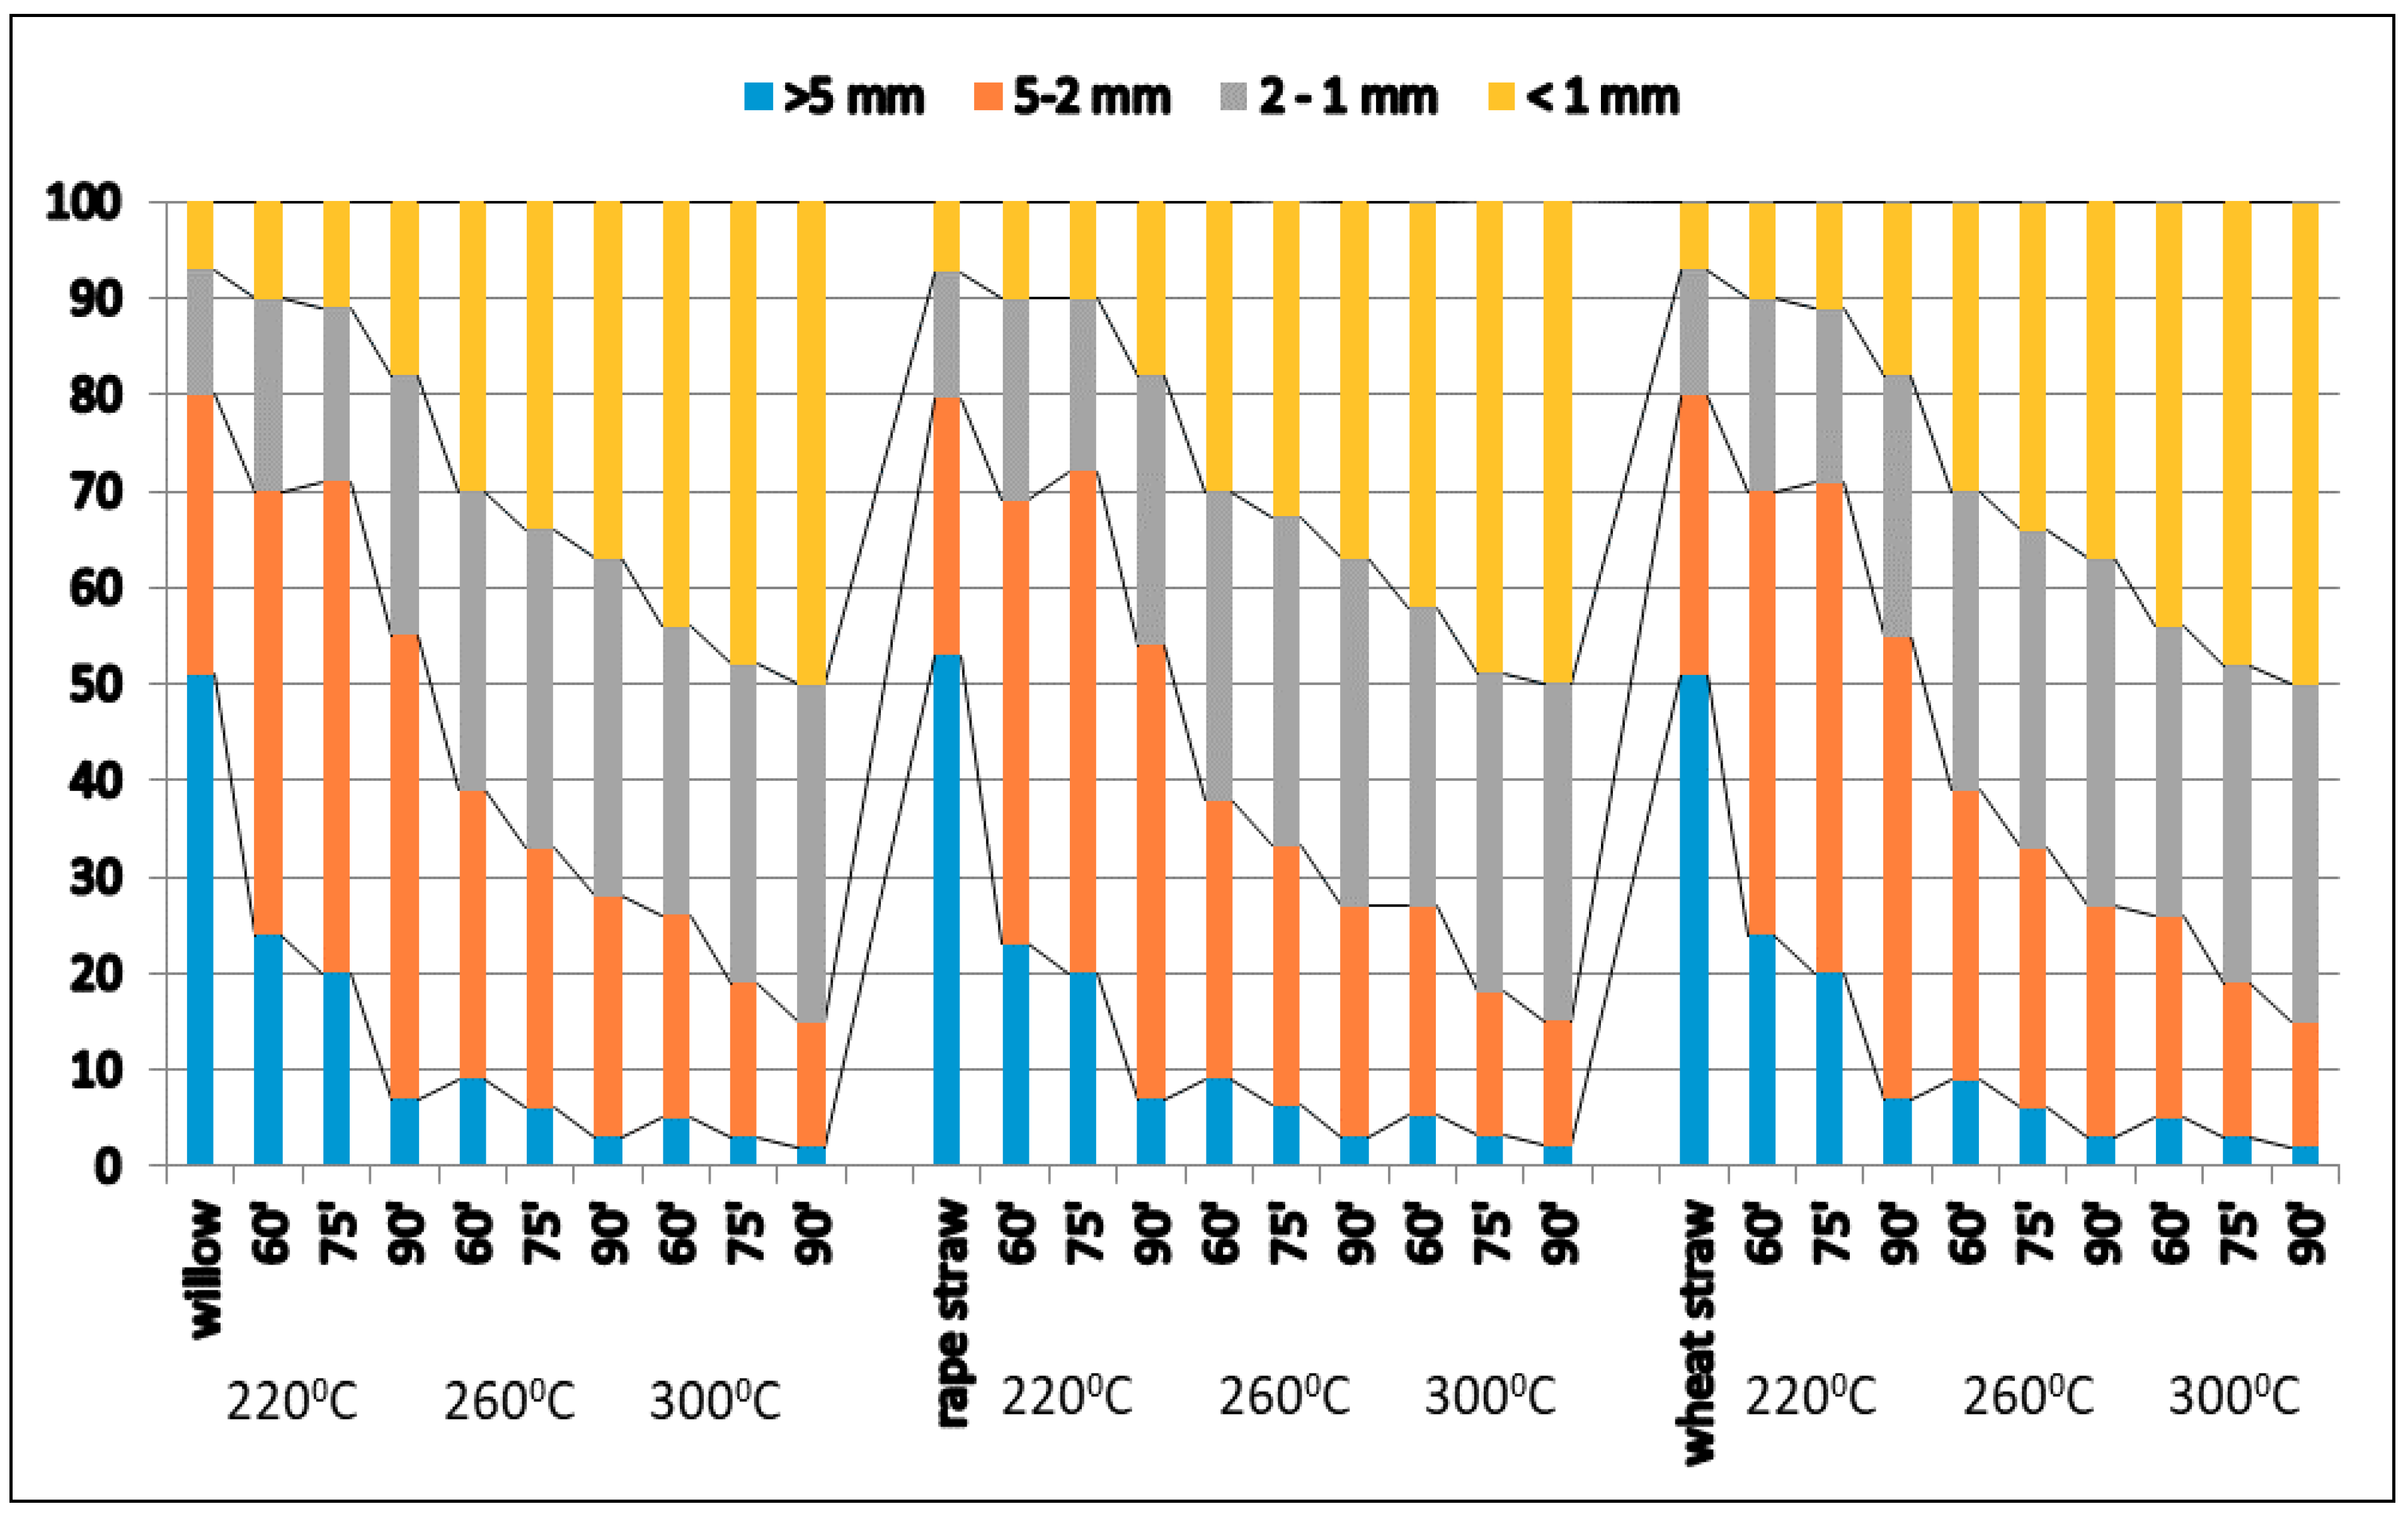
3.4. Assessment of the Granulometric Composition Depending on the Parameters of the Torrefaction Process

The analysis of granulometric composition of biomass from willow, rapeseed straw, and wheat straw, as well as torrefied products, explicitly confirms their improved grindability. The more brittle biomass is an easy material in the grinding process. This has a direct meaning in the economic balancing of the energy use of biomass. Grinding the fragile biomass allows you to reduce energy expenditure during the processing of it. The torrefaction process positively affects this analyzed parameter. Changes in the properties of the biomass is shown in Figure 2.
In raw biomass, the size fraction under 1 mm accounted for less than 8%, while the size fraction over 5 mm accounted for over 50% of the total mass. With an increase in temperature and duration of torrefaction process, there was a change in the tendency of this parameter. In the products of torrefaction process carried out at 300 °C for 90 min, the proportional contents of the specific size fractions were nearly reversed in comparison to the feedstock, whereby the smallest size fraction accounted for approx. 50% and the size fraction over 5 mm accounted for 5% of the total mass. The process of biomass torrefaction has a significant impact on its structure. Greater brittleness affects the beneficial economic effect. These improved properties mean that the torrefacted biomass is particularly suitable for in power plants, as stated by Tumuluru et al. [36]. Bridgeman, Sadaka, and other authors confirm that grinding of biomass increases with torrefaction and reduces the energy required. This process is an advantage for many energy-related applications such as co-firing [37,38].

4. Conclusions

Plant biomass can successfully be used in the torrefaction process. The obtained torrefied products have far better properties in comparison to unprocessed biomass. The torrefaction process enables the production of fuels from various types of lignocellulosic biomass. Of key importance is the parameter of temperature, which significantly affects the properties of the obtained fuel. Increasing the temperature caused the increase of such parameters as total carbon content, the calorific value of the material, ash content, volatile substances, nitrogen, and losses in the mass of the material. However, a reduction in content was noted for hydrogen, oxygen, and moisture. The level of carbon, volatile substances, and caloric content in torrefaction products was several times higher than in the case of raw biomass. Torrefaction carried out at temperatures ranging from 200 to 300 °C for the duration of 60 min enables processing of many types of lignocellulosic biomass, despite the fact that similar chemical composition changes occur in varied ways during the process. Therefore, it is necessary to optimize the process for each material to ensure the optimum parameters of the obtained biofuels. The optimization of the torrefaction process is important from the perspective of economic analysis. The torrefaction process on a laboratory scale was aimed at assessing and comparing the tested parameters and determining the range of values of temperatures and time of the torrefaction process for the biomass under study. The tests have shown a significant increase in the energy value of torrefactors compared to raw biomass. It should be noted, however, that a full assessment of the torrefaction process and processes taking place during its lifetime can be described after it has been carried out in larger installations.

Author Contributions

Conceptualization, M.B.; Data curation, M.B.; Formal analysis, M.B., G.Z., B.S. and M.T.; Funding acquisition, C.P.; Methodology, M.B., G.Z., B.S. and M.T.; Project administration, M.B.; Writing–original draft, M.B.; Writing–review & editing, G.Z., B.S. and C.P.

Funding

This research received no external funding.

Conflicts of Interest

The authors declare no conflict of interest.

References

  1. Phanphanich, M.; Mani, S. Impact of torrefaction on the grindability and fuel characteristics of forest biomass. Bioresour. Technol. 2011, 102, 1246–1253. [Google Scholar] [CrossRef] [PubMed]
  2. Williams, A.; Jones, J.A.; Ma, L.; Pourkashanian, M. Pollutants from the combustion of solid biomass fuels. Prog. Energy Combust. Sci. 2012, 38, 113–137. [Google Scholar] [CrossRef]
  3. Pröll, T.; Hofbauer, H. H2 rich syngas by selective CO2 removal from biomass gasification in a dual fluidized bed system—Process modelling approach. Fuel Process. Technol. 2008, 89, 1207–1217. [Google Scholar] [CrossRef]
  4. Elliott, D.C. Historical developments in hydroprocessing bio-oils. Energy Fuel 2007, 21, 1792–1815. [Google Scholar] [CrossRef]
  5. Chen, W.H.; Wu, J.S. An evaluation on rice husk and pulverized coal blends using a drop tube furnace and a thermogravimetric analyzer for application to a blast furnace. Energy 2009, 34, 1458–1466. [Google Scholar] [CrossRef]
  6. Yan, W.; Acharjee, T.C.; Coronella, C.J.; Vaquez, R.V. Thermal pretreatment of lignocellulosic biomass. Environ. Prog. Sustain. 2009, 28, 435–440. [Google Scholar] [CrossRef]
  7. Ratte, J.; Fardet, E.; Mateos, D.; Hery, J.S. Mathematical modelling of a continuous biomass torrefaction reactor: TORSPYD (TM) column. Biomass Bioenergy 2011, 35, 3481–3495. [Google Scholar] [CrossRef]
  8. Uslu, A.; Faaij, A.P.C.; Bergman, P.C.A. Pre-treatment technologies, and their effect on international bioenergy supply chain logistics. Techno-economic evaluation of torrefaction, fast pyrolysis and pelletisation. Energy 2008, 33, 1206–1223. [Google Scholar] [CrossRef]
  9. Bergman, P.C.A.; Kiel, J.H.A. Torrefaction for biomass upgrading. In Proceedings of the 14th European Biomass Conference & Exhibition, Paris, France, 17–21 October 2005. [Google Scholar]
  10. Chen, W.; Kuo, P. A study on torrefaction of various biomass materials and its impact on lignocellulosic structure simulated by a thermogravimetry. Energy 2010, 35, 2580–2586. [Google Scholar] [CrossRef]
  11. Arcate, J. New Process for Torrefied Wood Manufacturing. Available online: http://www.techtp.com/Bioenergy%20Update%20.pdf (accessed on 15 July 2018).
  12. Bridgeman, T.G.; Jones, J.M.; Shield, I.; Williams, P.T. Torrefaction of reed canary grass, wheat straw and willow to enhance solid fuel qualities and combustion properties. Fuel 2008, 87, 844–856. [Google Scholar] [CrossRef]
  13. Arias, B.; Pevida, C.; Fermoso, J.; Plaza, M.G.; Rubeira, F.; Pis, J.J. Influence of torrefaction on the grindability and reactivity of woody biomass. Fuel Process. Technol. 2008, 89, 169–175. [Google Scholar] [CrossRef] [Green Version]
  14. Brachi, P.; Miccio, F.; Miccio, M.; Ruoppolo, G. Torrefaction of Tomato Peel Residues in a Fluidized Bed of Inert Particles and a Fixed-Bed Reactor. Energy Fuel 2016, 30, 4858–4868. [Google Scholar] [CrossRef]
  15. Brachi, P.; Miccio, F.; Ruoppolo, G.; Stanzione, F.; Miccio, M. Pressurized steam torrefaction of wet agroindustrial residues. Chem. Eng. Trans. 2018, 65, 49–54. [Google Scholar]
  16. Bergman, P.C.A.; Boersma, A.R.; Zwart, R.W.R.; Kiel, J.H.A. Torrefaction for Biomass Existing Coal-Fired Power Stations. ECN Publication. ECN-C.-05-013. 2005. Available online: https://www.ecn.nl/publicaties/PdfFetch.aspx?nr=ECN-C--05-013 (accessed on 15 July 2018).
  17. Prins, M.J.; Ptasinski, K.; Janssen, F. Torrefaction of wood. Part 2: Analysis of products. J. Anal. Appl. Pyrol. 2006, 77, 35–40. [Google Scholar] [CrossRef]
  18. Kasparbauer, R.D. The Effects of Biomass Pretreatments on the Products of Fast Pyrolysis. Master’s Thesis, Iowa State University, Ames, IA, USA, 2009. [Google Scholar]
  19. Medic, D.; Darr, M.; Shah, A.; Potter, B.; Zimmerman, J. Effects of torrefaction process parameters on biomass feedstock upgrading. Fuel 2012, 91, 147–154. [Google Scholar] [CrossRef]
  20. PN-EN 14774-3: 2010. Solid Biofuels—Determination of Moisture Content—Drying Method—Part 3: Moisture in the General Test Sample. Available online: http://sklep.pkn.pl/pn-en-14774-3-2010e.html (accessed on 10 June 2015).
  21. PN-EN 14775: 2010. Solid Biofuels—Determination of Ash Content. Available online: http://sklep.pkn.pl/pn-en-14775-2010e.html (accessed on 10 June 2015).
  22. PN-EN 15104: 2011. Solid Biofuels—Determination of Total Carbon, Hydrogen and Nitrogen Content—Instrumental Methods. Available online: http://sklep.pkn.pl/pn-en-15104-2011e.html (accessed on 10 June 2015).
  23. PN-EN 15289: 2011. Solid Biofuels—Determination of Total Sulfur Content. Available online: http://sklep.pkn.pl/pn-en-15289-2011e.html (accessed on 10 June 2015).
  24. PN-EN 14918: 2010. Solid Biofuels—Determination of Calorific Value. Available online: http://sklep.pkn.pl/pn-en-14918-2010e.html (accessed on 10 June 2015).
  25. Lima, I.M.; Marshall, W.E. Granular Activated Carbons from Broiler Manure: Physical, Chemical and Adsorptive Properties. Bioresour. Technol. 2005, 96, 699–706. [Google Scholar] [CrossRef] [PubMed]
  26. Dence, C.W.; Lin, S.Y. The determination of lignin. In Methods in Lignin Chemistry; Lin, S.Y., Dence, C.W., Eds.; Springer: Berlin/Heidelberg, Germany, 1992; pp. 33–61. [Google Scholar]
  27. PN-92/P-50092. Raw Materials for the Paper Industry. Wood-Chemical Analysis. Available online: http://sklep.pkn.pl/pn-p-50092-1992p.html (accessed on 10 June 2015).
  28. Binti-Saleh, S.; Brun-Hansen, B.; Arendt-Jensen, P.; Dam-Johansen, K. Influence of Biomass Chemical Properties on Torrefaction Characteristics. Energy Fuel 2013, 27, 7541–7548. [Google Scholar] [CrossRef]
  29. Kumar, P.; Barrett, D.M.; Delwiche, M.J.; Stroeve, P. Methods for pretreatment of lignocellulosic biomass for efficient hydrolysis and biofuel production. Ind. Eng. Chem. Res. 2009, 48, 3713–3729. [Google Scholar] [CrossRef]
  30. Alizadeh, H.; Teymouri, F.; Gilbert, T.I.; Dale, B.E. Pretreatment of switchgrass by ammonia fiber explosion. Appl. Biochem. Biotechnol. 2005, 124, 1133–1141. [Google Scholar] [CrossRef]
  31. Hill, S.J.; Grigsby, W.J.; Hall, P.W. Chemical and cellulose crystallite changes in Pinus radiata during torrefaction. Biomass Bioenergy 2013, 56, 92–98. [Google Scholar] [CrossRef]
  32. Chin, K.; H’ng, P.; Go, W.; Wong, W.; Lim, T.; Maminski, M.; Paridah, M.; Luqman, A. Optimization of torrefaction conditions for high energy density solid biofuel from oil palm biomass and fast growing species available in Malaysia. Ind. Crops Prod. 2013, 49, 768–774. [Google Scholar] [CrossRef]
  33. Poudel, J.; Karki, S.; Oh, S.C. Valorization of Waste Wood as a Solid Fuel by Torrefaction. Energies 2018, 11, 1641. [Google Scholar] [CrossRef]
  34. Werkelin, J.; Skrifvars, B.J.; Hupa, M. Ash-forming elements in four Scandinavian wood species. Part 1: Summer harvest. Biomass Bioenergy 2005, 29, 451–466. [Google Scholar] [CrossRef]
  35. Prins, M.J.; Ptasinski, K.J.; Janssen, F.J. More efficient biomass gasification via torrefaction. Energy 2006, 31, 3458–3470. [Google Scholar] [CrossRef]
  36. Tumuluru, J.S.; Sokhansanj, S.; Hess, R.J.; Wright, C.T.; Boardman, R.D. A review on biomass torrefaction process and product properties for energy applications. Ind. Biotechnol. 2011, 7, 384–401. [Google Scholar] [CrossRef]
  37. Bridgeman, T.; Jones, J.; Williams, A.; Waldron, D. An investigation of the grindability of two torrefied energy crops. Fuel 2010, 89, 3911–3918. [Google Scholar] [CrossRef] [Green Version]
  38. Sadaka, S.; Negi, S. Improvements of biomass physical and thermochemical characteristics via torrefaction process. Environ. Prog. Sustain. 2009, 28, 427–434. [Google Scholar] [CrossRef]
Figure 1. Loss in weight of biomass at different times: 220 °C (a), 260 °C (b), and 300 °C (c).
Energies 11 02919 g001aEnergies 11 02919 g001b
Figure 2. Grain size distribution in biomass and torrefied products depending on the parameters of the torrefaction process.
Energies 11 02919 g002
Table 1. Lignin, hemicellulose, and cellulose contents in raw biomass.
BiomassLigninCellulose %Hemicellulose
Willow14.544.632.1
Rapeseed straw18.641.129.8
Wheat straw21.338.130.6
Table 2. Effect of torrefaction temperature in mass and energy yield.
BiomassTemperature °CYield MassYield Energy
%
Willow22083.191.3
26078.495.8
30065.380.1
Rapeseed straw22081.487.1
26076.788.5
30067.279.5
Wheat straw22081.483.2
26074.186.9
30069.382.6
Table 3. Summary of examined parameters for biomass, raw, and torrefied for 60 min.
ParametersRawTorrefaction Temperature (°C)
220260300
x ± SD
WILLOW
C %48.1 c ± 0.148.2 c ± 0.3552.1 b ± 0.3155.5 a ± 0.14
H %5.55 ab ± 0.035.87 a ± 0.034.42 c ± 0.123.64 d ± 0.02
N %0.55 d ± 0.021.48 a ± 0.061.15 c ± 0.021.30 b ± 0.06
O %53.1 a ± 0.1444.9 b ± 0.1243.6 b ± 0.1442.2 b ± 0.25
LHV MJ kg−117.5 c ± 0.2519.2 b ± 0.0621.4 a ± 0.2221.5 a ± 0.09
Moisture content %10.3 a ± 0.19.12 b ± 0.078.42 bc ± 0.17.96 c ± 0.1
Ash content %3.15 ab ± 0.13.17 ab ± 0.13.52 a ± 0.13.72 a ± 0.13
Volatile matter %25.5 c ± 0.3423.1 d ± 0.2531.6 b ± 0.4144.9 a ± 0.31
RAPESEED STRAW
C %46.9 c ± 0.0947.2 c ± 0.255.0 b ± 0.458.5 a ± 0.24
H %7.92 a ± 0.015.26 b ± 0.085.28 b ± 0.074.24 c ± 0.06
N %0.17 d ± 0.011.03 c ± 0.131.59 b ± 0.091.74 a ± 0.13
O %51.1 a ± 0.1643.0 c ± 0.2150.1 a ± 0.1745.5 b ± 0.12
LHV MJ kg−116.8 d ± 0.2418.3 c ± 0.119.1 b ± 0.0819.9 a ± 0.09
Moisture content %8.91 a ± 0.088.74 a ± 0.106.02 b ± 0.135.40 c ± 0.01
Ash content %3.80 c ± 0.073.02 d ± 0.115.48 b ± 0.126.37 a ± 0.08
Volatile matter %20.6 d ± 0.2423.9 c ± 0.2641.4 b ± 0.2352.2 a ± 0.16
WHEAT STRAW
C %45.3 d ± 0.0748.2 c ± 0.1552.1 b ± 0.2155.5 a ± 0.04
H %7.10 a ± 0.055.87 b ± 0.044.42 c ± 0.123.64 d ± 0.02
N %0.15 d ± 0.011.05 c ± 0.061.15 b ± 0.021.30 a ± 0.06
O %54.6 a ± 0.2244.1 b ± 0.144.0 b ± 0.1444.7 b ± 0.14
LHV MJ kg−117.6 d ± 0.118.8 c ± 0.0919.8 b ± 0.3121.0 a ± 0.31
Moisture content %9.18 a ± 0.128.50 b ± 0.146.32 c ± 0.114.52 d ± 0.1
Ash content %4.56 d ± 0.126.27 c ± 0.138.66 b ± 0.19.25 a ± 0.1
Volatile matter %17.7 d ± 0.1920.5 c ± 0.336.4 b ± 0.2647.9 a ± 0.25
x—Average, SD—Standard deviation. Differences between average values marked with the same Arabic letters (a–d) are not statistically significant at the level of α ≤ 0.05 according to the Bonferroni test.
Table 4. The content of Ca, K, Mg, P, S, Fe, Mn, and Zn in wheat straw and torrefied products.
ParametersCaKMgPSFeMnZn
x ± SD
mg g−1
Wheat straw12.7 g
± 0.09
8.34 h
± 0.13
1.42 ef
± 0.10
0.97 f
± 0.07
0.97 a
± 0.08
0.10 a
± 0.01
0.03 b
± 0.01
0.01 b
± 0.004
TORREFACTION220°/60′13.1 f
± 0.12
9.68 fg
± 0.22
1.64 e
± 0.08
0.99 f
± 0.10
0.12 bc
± 0.01
0.04 d
± 0.01
0.02 b
± 0.01
0.02 b
± 0.01
220°/75′12.8 fg
± 0.07
9.42 fg
± 0.11
1.62 e
± 0.09
1.04 f
± 0.07
0.09 c
± 0.01
0.04 d
± 0.01
0.04 a
± 0.01
0.04 a
± 0.01
220°/90′13.1 f
± 0.12
10.4 f
± 0.22
1.54 e
± 0.08
1.00 f
± 0.08
0.10 c
± 0.01
0.04 d
± 0.01
0.02 b
± 0.01
0.02 b
± 0.01
260°/60′14.4 e
± 0.20
13.9 e
± 0.14
2.43 cd
± 0.11
1.02 f
± 0.02
0.11 c
± 0.02
0.05 d
± 0.01
0.02 b
± 0.004
0.02 b
± 0.004
260°/75′15.1 d
± 0.22
15.8 d
± 0.18
2.82 c
± 0.21
1.42 de
± 0.05
0.10 c
± 0.02
0.07 c
± 0.004
0.03 b
± 0.01
0.03 a
± 0.01
260°/90′15.5 d
± 0.26
17.5 c
± 0.34
2.88 c
± 0.12
1.52 d
± 0.06
0.09 c
± 0.01
0.07 c
± 0.01
0.04 a
± 0.01
0.04 a
± 0.01
300°/60′16.3 c
± 0.22
20.2 b
± 0.21
3.75 b
± 0.22
1.70 c
± 0.07
0.13 b
± 0.04
0.09 ab
± 0.01
0.05 a
± 0.01
0.05 a
± 0.01
300°/75′17.6 b
± 0.25
24.4 a
± 0.33
4.09 a
± 0.21
1.83 ab
± 0.07
0.14 b
± 0.06
0.10 a
± 0.01
0.04 a
± 0.01
0.04 a
± 0.01
300°/90′18.6 a
± 0.21
24.4 a
± 0.46
4.14 a
± 0.01
1.98 a
± 0.69
0.16 b
± 0.07
0.10 a
± 0.02
0.04 a
± 0.04
0.04 a
± 0.04
x—Average, SD—Standard deviation. Differences between average values marked with the same Arabic letters (a–h) are not statistically significant at the level of α ≤ 0.05 according to the Bonferroni test.
Table 5. The content of Ca, K, Mg, P, S, Fe, Mn, and Zn in rape straw and torrefied products.
ParametersCaKMgPSFeMnZn
x ± SD
mg g−1
Rape straw17.4 c
± 0.11
6.92 e
± 0.10
1.03 f
± 0.13
1.77 e
± 0.05
0.98 e
± 0.08
0.24 c
± 0.02
0.02 a
± 0.01
0.01 a
± 0.003
TORREFACTION220°/60′15.3 c
± 0.12
6.21 e
± 0.10
1.33 de
± 0.15
1.73 e
± 0.10
1.00 e
± 0.10
0.22 c
± 0.06
0.02 a
± 0.07
0.01 a
± 0.003
220°/75′17.7 c
± 0.30
6.44 e
± 0.10
1.49 d
± 0.08
1.86 e
± 0.07
1.13 d
± 0.06
0.17 c
± 0.03
0.02 a
± 0.004
0.01 a
± 0.001
220°/90′17.9 c
± 0.21
6.54 e
± 0.14
1.51 d
± 0.10
1.88 e
± 0.21
1.37 c
± 0.06
0.19 c
± 0.06
0.02 a
± 0.004
0.01 a
± 0.002
260°/60′26.3 b
± 0.27
10.7 d
± 0.13
2.01 c
± 0.10
2.46 cd
± 0.18
1.02 e
± 0.08
0.10 d
± 0.05
0.02 a
± 0.01
0.01 a
± 0.004
260°/75′27.8 b
± 0.17
12.0 c
± 0.28
1.95 c
± 0.14
2.89 c
± 0.12
1.44 c
± 0.06
0.24 b
± 0.08
0.02 a
± 0.004
0.01 a
± 0.002
260°/90′28.5 b
± 0.27
12.7 c
± 0.25
2.01 c
± 0.09
2.91 c
± 0.12
1.73 b
± 0.07
0.24 b
± 0.09
0.02 a
± 0.01
0.01 a
± 0.004
300°/60′37.3 a
± 0.43
15.8 b
± 0.32
3.35 a
± 0.20
4.13 a
± 0.11
1.32 c
± 0.06
0.31 a
± 0.06
0.03 a
± 0.01
0.02 a
± 0.01
300°/75′36.1 a
± 0.17
17.3 a
± 0.22
3.01 ab
± 0.11
3.66 b
± 0.18
1.61 b
± 0.05
0.31 a
± 0.09
0.02 a
± 0.01
0.02 a
± 0.01
300°/90′36.9 a
± 1.01
17.8 a
± 0.21
3.21 a
± 0.11
3.89 ab
± 0.27
2.01 a
± 0.70
0.34 a
± 0.10
0.02 a
± 0.003
0.02 a
± 0.01
x—Average. SD—Standard deviation. Differences between average values marked with the same Arabic letters (a–f) are not statistically significant at the level of α ≤ 0.05 according to the Bonferroni test.
Table 6. The content of Ca, K, Mg, P, S, Fe, Mn, and Zn in willow and torrefied products.
ParametersCaKMgPSFeMnZn
X ± SD
mg g−1
Willow14.8 c
± 0.09
5.88 d
± 0.09
0.88 e
± 0.11
1.50 e
± 0.04
0.20 c
± 0.01
0.02 d
± 0.01
0.02 a
± 0.01
0.01 a
± 0.003
TORREFACTION220°/60′13.0 d
± 0.10
5.28 d
± 0.09
1.13 d
± 0.13
1.47 e
± 0.09
0.22 bc
± 0.01
0.06 d
± 0.01
0.02 a
± 0.01
0.01 a
± 0.003
220°/75′15.1 c
± 0.26
5.47 d
± 0.09
1.27 d
± 0.07
1.58 e
± 0.06
0.22 bc
± 0.004
0.14 c
± 0.03
0.02 a
± 0.003
0.01 a
± 0.001
220°/90′15.2 c
± 0.18
5.56 d
± 0.12
1.28 d
± 0.09
1.60 e
± 0.18
0.23 b
± 0.004
0.16 c
± 0.03
0.02 a
± 0.003
0.01 a
± 0.002
260°/60′22.4 b
± 0.23
9.09 c
± 0.11
1.71 c
± 0.09
2.09 d
± 0.15
0.25 b
± 0.01
0.15 c
± 0.04
0.02 a
± 0.01
0.01 a
± 0.003
260°/75′23.7 b
± 0.14
10.2 c
± 0.24
1.66 c
± 0.12
2.46 c
± 0.10
0.26 ab
± 0.004
0.20 b
± 0.03
0.02 a
± 0.003
0.01 a
± 0.002
260°/90′24.3 b
± 0.23
10.8 c
± 0.21
1.71 c
± 0.08
2.47 c
± 0.10
0.27 ab
± 0.01
0.20 b
± 0.02
0.02 a
± 0.01
0.01 a
± 0.003
300°/60′31.7 a
± 0.37
13.4 b
± 0.27
2.85 a
± 0.17
3.51 a
± 0.09
0.30 a
± 0.01
0.26 a
± 0.05
0.03 a
± 0.01
0.02 a
± 0.01
300°/75′30.7 a
± 0.14
14.7 a
± 0.19
2.56 ab
± 0.09
3.11 ab
± 0.15
0.31 a
± 0.01
0.26 a
± 0.03
0.02 a
± 0.004
0.02 a
± 0.01
300°/90′31.4 a
± 0.86
15.2 a
± 0.18
2.73 a
± 0.09
3.31 a
± 0.23
0.33 a
± 0.003
0.29 a
± 0.04
0.02 a
± 0.003
0.02 a
± 0.01
x—Average. SD—Standard deviation. Differences between average values marked with the same Arabic letters (a–e) are not statistically significant at the level of α ≤ 0.05 according to the Bonferroni test.

