1. Introduction
The resiliency of networks against extreme weather conditions has been studied e.g., in [
1]. There are many methods and measures that can be taken to improve the resilience of an electric system such as underground cabling [
2], emergency power systems, smart grid technologies, etc. As distributed generation and electricity storages are becoming more common and economic, microgrids are turning into an interesting alternative for improving the reliability and resilience of the electricity system against disturbances and blackouts, e.g., [
3,
4,
5,
6]. In addition, microgrids can also offer economic and societal value [
7,
8].
In Finland, extreme weather has caused many severe power outages in recent years and the government has set stricter limits for the outage duration. The Electricity Market Act limits the maximum allowable supply interruptions due to storms or snow load to 36 h in rural areas. Most of the distribution system operators (DSO) have chosen underground cabling as the main solution for improving the reliability of electricity distribution. While an efficient solution for decreasing tree-related faults in the distribution network, underground cabling is also very expensive compared to installing overhead lines (OHL) as it requires digging trenches and may often be complicated by rough terrain or other utility service lines. In some cases, cabling could be unnecessary and electricity storage or a microgrid could very well prove to be a more feasible option.
DSOs, e.g., in Finland, are currently not allowed to own electric storages. Studies, however, have proven that electric storages could be an economically feasible option for increasing the reliability of power supply in rural areas over underground cabling [
9,
10]. European Union (EU) “winter package” suggests changes in network owner’s right to own storages in the future.
Overall, local small-scale generation capacity and bulk power system connected microgrids could have several benefits in the whole electricity system context. Benefits in the system level—as numerous small streams creating large quantities—could be e.g.,
providing the consumer/prosumer a possibility to influence their own electricity acquisition and its cost;
increasing the reliability of power supply of the individual consumer;
increasing the power system total generation capacity;
slowing down the need to increase network transmission capacity (if electric energy consumption increases, and/or the instantaneous power consumption increases);
increasing the capacity of units capable of power system and network support, e.g., voltage and reactive power support, frequency control support etc.
decreasing power transmission losses as generation is located closer to the consumption points.
This study applies the method presented in [
11] for a microgrid consisting of a single electricity consumer in a detached house with own partially controllable power production. A full year of hourly data is analysed in order to assess the capability for a suddenly occurring islanded operation during network outage. The duration of the islanded operation capability is also determined for the microgrid in terms of power supply adequacy. The analysis method is here extended to evaluate different microgrid investment cost-sharing options in order to find a break-even investment solution. In addition, sensitivities of the system’s feasible technical and economic parameter values are assessed.
The layout principle of the relevant network topology is presented in [
10], and the BESS connection topology is presented in [
9].
2. Assessment Method
The method used in this paper has been presented in [
11]. Normal grid-connected operation of the microgrid is calculated for each hour of the year. A network outage could take place at any time, i.e., any hour of the year. The duration of feasible islanded operation with adequate power supply without adjusting the microgrid electricity consumption for each hour of the year is analysed.
As in [
11], the costs of an underground investment and microgrid investment are calculated and compared. The method is used here for demonstrating different cost-sharing strategies for the microgrid investment alternative, as well as assessing the influence of uncertainty and variability of the study case parameters through a sensitivity analysis.
Traditionally the power distribution networks have been the only means of electricity supply to consumers. Distribution network companies’ responsibility is to provide the consumers access to the network, as well as guarantee an adequate reliability of power supply.
Over the recent years, the consumers’ interest in own power production has increased at the same time the small-scale power generation technologies have developed and become more economic options. Solar power generation is popular already today among small-scale consumers, but its drawbacks are the variability of the production. It is not possible to be controlled in order to balance power production with the electricity demand at all times—instantaneously, nor seasonally. Electricity storage would be needed for balancing the power in short-term (within an hour to within a day) in order to enable the usage of own production of variable generation. Battery energy storage system (BESS) technologies have become more economic over the recent years, and the trend is expected to continue.
The calculation method assumes a minimum charge level in the BESS to be maintained in normal grid connected operation state for the preparation of a sudden and unexpected network outage. During a network outage, the BESS capacity would be fully exploitable.
As seen in the results presented in [
11], an electric heated detached house with a battery storage and solar PV production only, would not be a reasonable solution alternative for a microgrid as a means to increase the reliability of supply. In order to enable a relatively long capability of power supply for un-reduced power demand during the network outage and microgrid islanded operation, a PV-BESS combination only, would be a very expensive option if all the equipment was paid by the prosumer. Thus, the prosumer most likely will have to have controllable electricity production capacity.
This paper proposes the BESS investment sharing option as an alternative to DSO underground cabling in those cases when it could be mutually agreed upon and an economic solution for both, the DSO and the consumer/prosumer.
Different BESS investment and ownership strategies could be
“Ownership” signifies participation on the investment, ownership of the equipment related responsibilities over the equipment lifetime, as well as beneficiary of the equipment related income. In option 4 above the DSO would remunerate 50% of the BESS procurement to the consumer in order to avoid more expensive underground cabling. An additional prerequisite would be an appropriate determination of the microgrid characteristics, and minimum BESS charging (strategy) for the preparation of the microgrid islanded operation for a sufficient length of time due to OHL network outages.
The method does not consider compensations payable by DSO to the consumer in the case of possible outages because of the related uncertainties.
3. Case Study
The case study analyses a detached house customer in sparsely populated area in rural distribution network.
For the case study, hourly data for a full year is used. As in [
11], this time resolution is considered adequate for the purpose of the analysis method.
The major aspects or individual components of the study case are covered in respective sections below. All the parameters are determined a “base case” value, assessed to be the typical or best estimate value.
The sensitivities of the influence of most of the parameters or characteristics on the results are analysed. The varied parameter values for sensitivity analysis are presented in
Appendix A.
When relevant, 24% value added tax is used (as typical in Finland). Interest rate of 2% is used for the base case in the investment calculations presented in this paper. The interest rate is varied for sensitivity analysis as specified in
Appendix A.
3.1. Network Connection and Underground Cabling
The appropriate distribution network customer in the focus of the study is located in sparsely populated countryside at the end of a rather long-distance distribution network connection. The distance could be a few kilometres. The analysis could be easily applied to a group of customers on a distribution network branch.
The customer is currently supplied with an OHL connection, which is prone to weather-dependent interruptions. The present strategy for increasing the reliability of electricity supply is underground cabling of the network. Underground cabling of individual customers’ connections is not in the interest of the DSOs, but the DSOs assess the economic profitability of underground cabling under the network regulation framework. In addition, the return of electricity supply to a single customer is not in the priority of the DSO in major interruption events when the DSO network experiences a large number of outages in a wide area. Thus, individual customer interruption could be extended for a rather long duration of time, i.e., for several hours and even up to a few days.
Actual costs related to underground cabling investments are very case dependent. Here the cabling costs are estimated by assuming ordinary cable trench cost of 25,000 €/km in Finland and 0.4 kV underground cable cost of 10,000 €/km with lifetime of 40 years, approximately in accordance to the regulation price list. The cable length is used as a variable in the simulations determining the total cost of the cable investment. Instead of the cable length, the total cabling investment cost actually is significant in the calculations done in this paper. In the base case, the cable length of 1 km is used, corresponding to 35,000 € cabling investment. The investment cost is varied for the sensitivity analysis by varying the cable length as specified in
Appendix A.
3.2. A Detached House Consumer
In this case study, a modern detached house of 150 m2 in Central Finland (Jyväskylä) is considered. Heating of the house is assumed to be implemented either in the conventional onsite manner or using single house micro-CHP (combined heat and power plant). Thus, the detached house electricity production capability from micro-CHP is dependent on the whole micro-CHP plant characteristics, as well as the momentary heat production of the micro-CHP plant.
The detached house heat demand data series was created by using dynamic building energy simulation. IDA ICE (version 4.7.1, EQUA Simulation AB, Sweden) [
12] is a whole-year detailed and dynamic multi-zone simulation application for study of thermal indoor climate as well as the sub-hourly energy consumption of the entire building. The total heat demand for the house amounts to 15.5 MWh/a.
The household electricity consumption (i.e., excluding heating) data series was created by using electric customer type load profiles. The load profiles based on [
13], have been partially updated by VTT Technical Research Centre of Finland in 2003 using new measurements. The household annual electricity consumption is a varied parameter (see
Appendix A) for the sensitivity analysis, and approximately 5500 kWh/a in the base case.
3.3. Detached House Micro-CHP
Micro-CHP plants in the lower end of the capacity range have not proven profitable yet today in Finland. However, there are ongoing research studies aiming at finding solutions to increase the profitability, especially for the detached houses in distant locations, i.e., the type of houses being in the focus of this study.
The investment cost for a micro-CHP plant is a significant factor in the overall profitability calculations and contains uncertainty. For the base case, 1200 €/kW is assumed for the whole micro-CHP plant in the respective capacity class, and the investment cost is varied for the sensitivity analysis as specified in
Appendix A. The electricity share of the costs is assumed according to the electric power share of the plant. A lifetime of 15 years is assumed for the micro-CHP plant and it is varied for sensitivity analysis.
The micro-CHP plant electricity production is assumed to be 20% of the power plant total energy production each hour. Thus, the heat demand determines the electricity production. The micro-CHP is assumed to not have a minimum power, and it is operating throughout the year even at low heat consumption.
The fuel costs for the whole micro-CHP plant (i.e., heat and electricity combined) are assumed a fixed value 1200 €/a, independent of total energy production. The total power production with micro-CHP does not vary significantly in different calculation cases, and thus the fixed annual fuel cost assumption should be acceptable. The fuel costs are, however, varied for the sensitivity analysis, as specified in
Appendix A.
By assuming some heat storage capability in the heating system of the house, micro-CHP heating time series was created as 24 h sliding average in order to smooth the heating dynamics. Electricity production time series was derived as a constant 20% share of the total micro-CHP power production in the base case. The required micro-CHP plant total capacity is thus estimated to approximately 8 kW. Also, the option of 30% electricity production share is calculated of a micro-CHP plant with 9 kW total capacity.
In the base case, the micro-CHP microgrid operation is assumed to be continuing similarly to normal grid connected state. During a network outage and microgrid islanded operation, the micro-CHP plant generation could possibly be used differently from normal in order to supply the needed electricity. In this case, the possible excess heat production might need to be dissipated. Thus, for the sensitivity analysis, the micro-CHP electricity generation is varied as specified in
Appendix A, allowing a different level of constant electric power production. In these simulations, this specific islanded operation electrical power production is the same value for the whole year in order to illustrate the influence of the parameter setting. In reality, the possible power production level may be dependent on the time of the year and the power might be controllable during the islanded operation.
3.4. Solar PV Production
PV production data series were created for the study case in Central Finland using PV GIS Tool [
14]. Crystal-Silicon PVs with 14% system losses are assumed as the most plausible technology. PV panels installed on roof-top are assumed to be facing towards South (i.e., azimuth 0 degr.) and adjacent to the roof, assuming thus a fixed 25 degr. tilt slope installation for the PVs.
A cost of 1800 €/kWp is assumed for the PV panels in the base case, and 25 years as the lifetime for the panels. The PV panel cost and lifetime are varied for the sensitivity analysis.
The data series were created for a number of years and using data of different solar radiation databases. The base case data was created with SARAH solar radiation database. 2015 as an average solar production year is used in the base case. Annual PV production difference between the datasets (i.e., the best production year 2006 and the worst 2008) is almost 20%.
The simulations are done with different PV capacities, and 1.5 kWp capacity is used in the base case. The values for varied parameters are specified in
Appendix A.
3.5. Battery Energy Storage, BESS
The BESS is assumed for the study according to the technology available today for a single house scale. The maximum charging ramp of 5 kW is assumed irrespective of the BESS total storage capacity which is varied as specified in
Appendix A, and with base case capacity of 13.5 kWh. The BESS minimum charge level is assumed to be 6 kWh in the base case, and it is varied for the sensitivity analysis.
The BESS is assumed to consist of a fixed cost for the installation and system-related equipment, and a capacity dependent investment cost for the batteries. The fixed cost is assumed to be 600 €, and the capacity dependent cost 500 €/kWh in the base case. The BESS lifetime is assumed to be 10 years. The BESS capacity dependent cost and the BESS lifetime are varied for the sensitivity analysis.
The losses in the BESS are omitted. In reality, the losses, i.e., self-discharge of the battery, would be in the order of 1–5 percent per month for Li-ion batteries [
15]. Thus, for a 6-kWh permanent minimum charge of the BESS, the annual losses would amount approximately only to 1 kWh. In addition, with Li-ion batteries, up to almost a 100% efficiency could be achieved according to [
15].
An annual maintenance cost of 100 €/a is assumed for the microgrid covering any random small cost items.
3.6. Electricity Market Aspects
The consumer electricity purchase from the network is calculated for the electricity price of 5 c/kWh and distribution fee (including electricity tax 2.8 c/kWh, etc.) of 6.5 c/kWh. Electricity price and distribution fee are varied for the sensitivity analysis.
The prosumer can sell their excess power generation to the network. For small-scale producers the present compensation for sold electricity to network in Finland is approximately 2.7 c/kWh and the transmission fee for electricity fed to the grid 0.7 c/kWh. The value in small-scale production is mainly in covering own electricity need by own production, whereas selling electricity to the system is not cost-effective. Furthermore, the compensation for sold electricity is quite marginal and would need to change significantly in order to influence the overall results. Thus, the parameters of sold electricity and related transmission fees were not varied for sensitivity analysis.
The BESS in this study maintains a certain minimum charge at all times in preparation for a sudden and unexpected network outage. Such outage occurrences are very rare. The required minimum charge might vary throughout the year, depending on the microgrid capability of supplying the demand by power production in real-time. Transmission system operator (TSO) acquires frequency containment reserve capacity for disturbances (FCR-D), and this market would be profitable as well as suitable for the microgrid BESS. FCR-D reserve is started to be activated at a certain threshold of the system frequency deviation, and at a specific larger frequency deviation the full FCR-D reserve capacity power would be supplied. The market price of 4.7 €/MWh is assumed in this study for FCR-D capacity.
Avoiding a complex analysis, this study assumes the full BESS power capacity (5 kW) to be able to be sold to the FCR-D market via an aggregator a certain number of hours per year. In the base case, the BESS is assumed to be sold 7000 h/a to the FCR-D market, and the number of hours is varied for the sensitivity analysis as specified in
Appendix A.
4. Results
4.1. Base Case Results
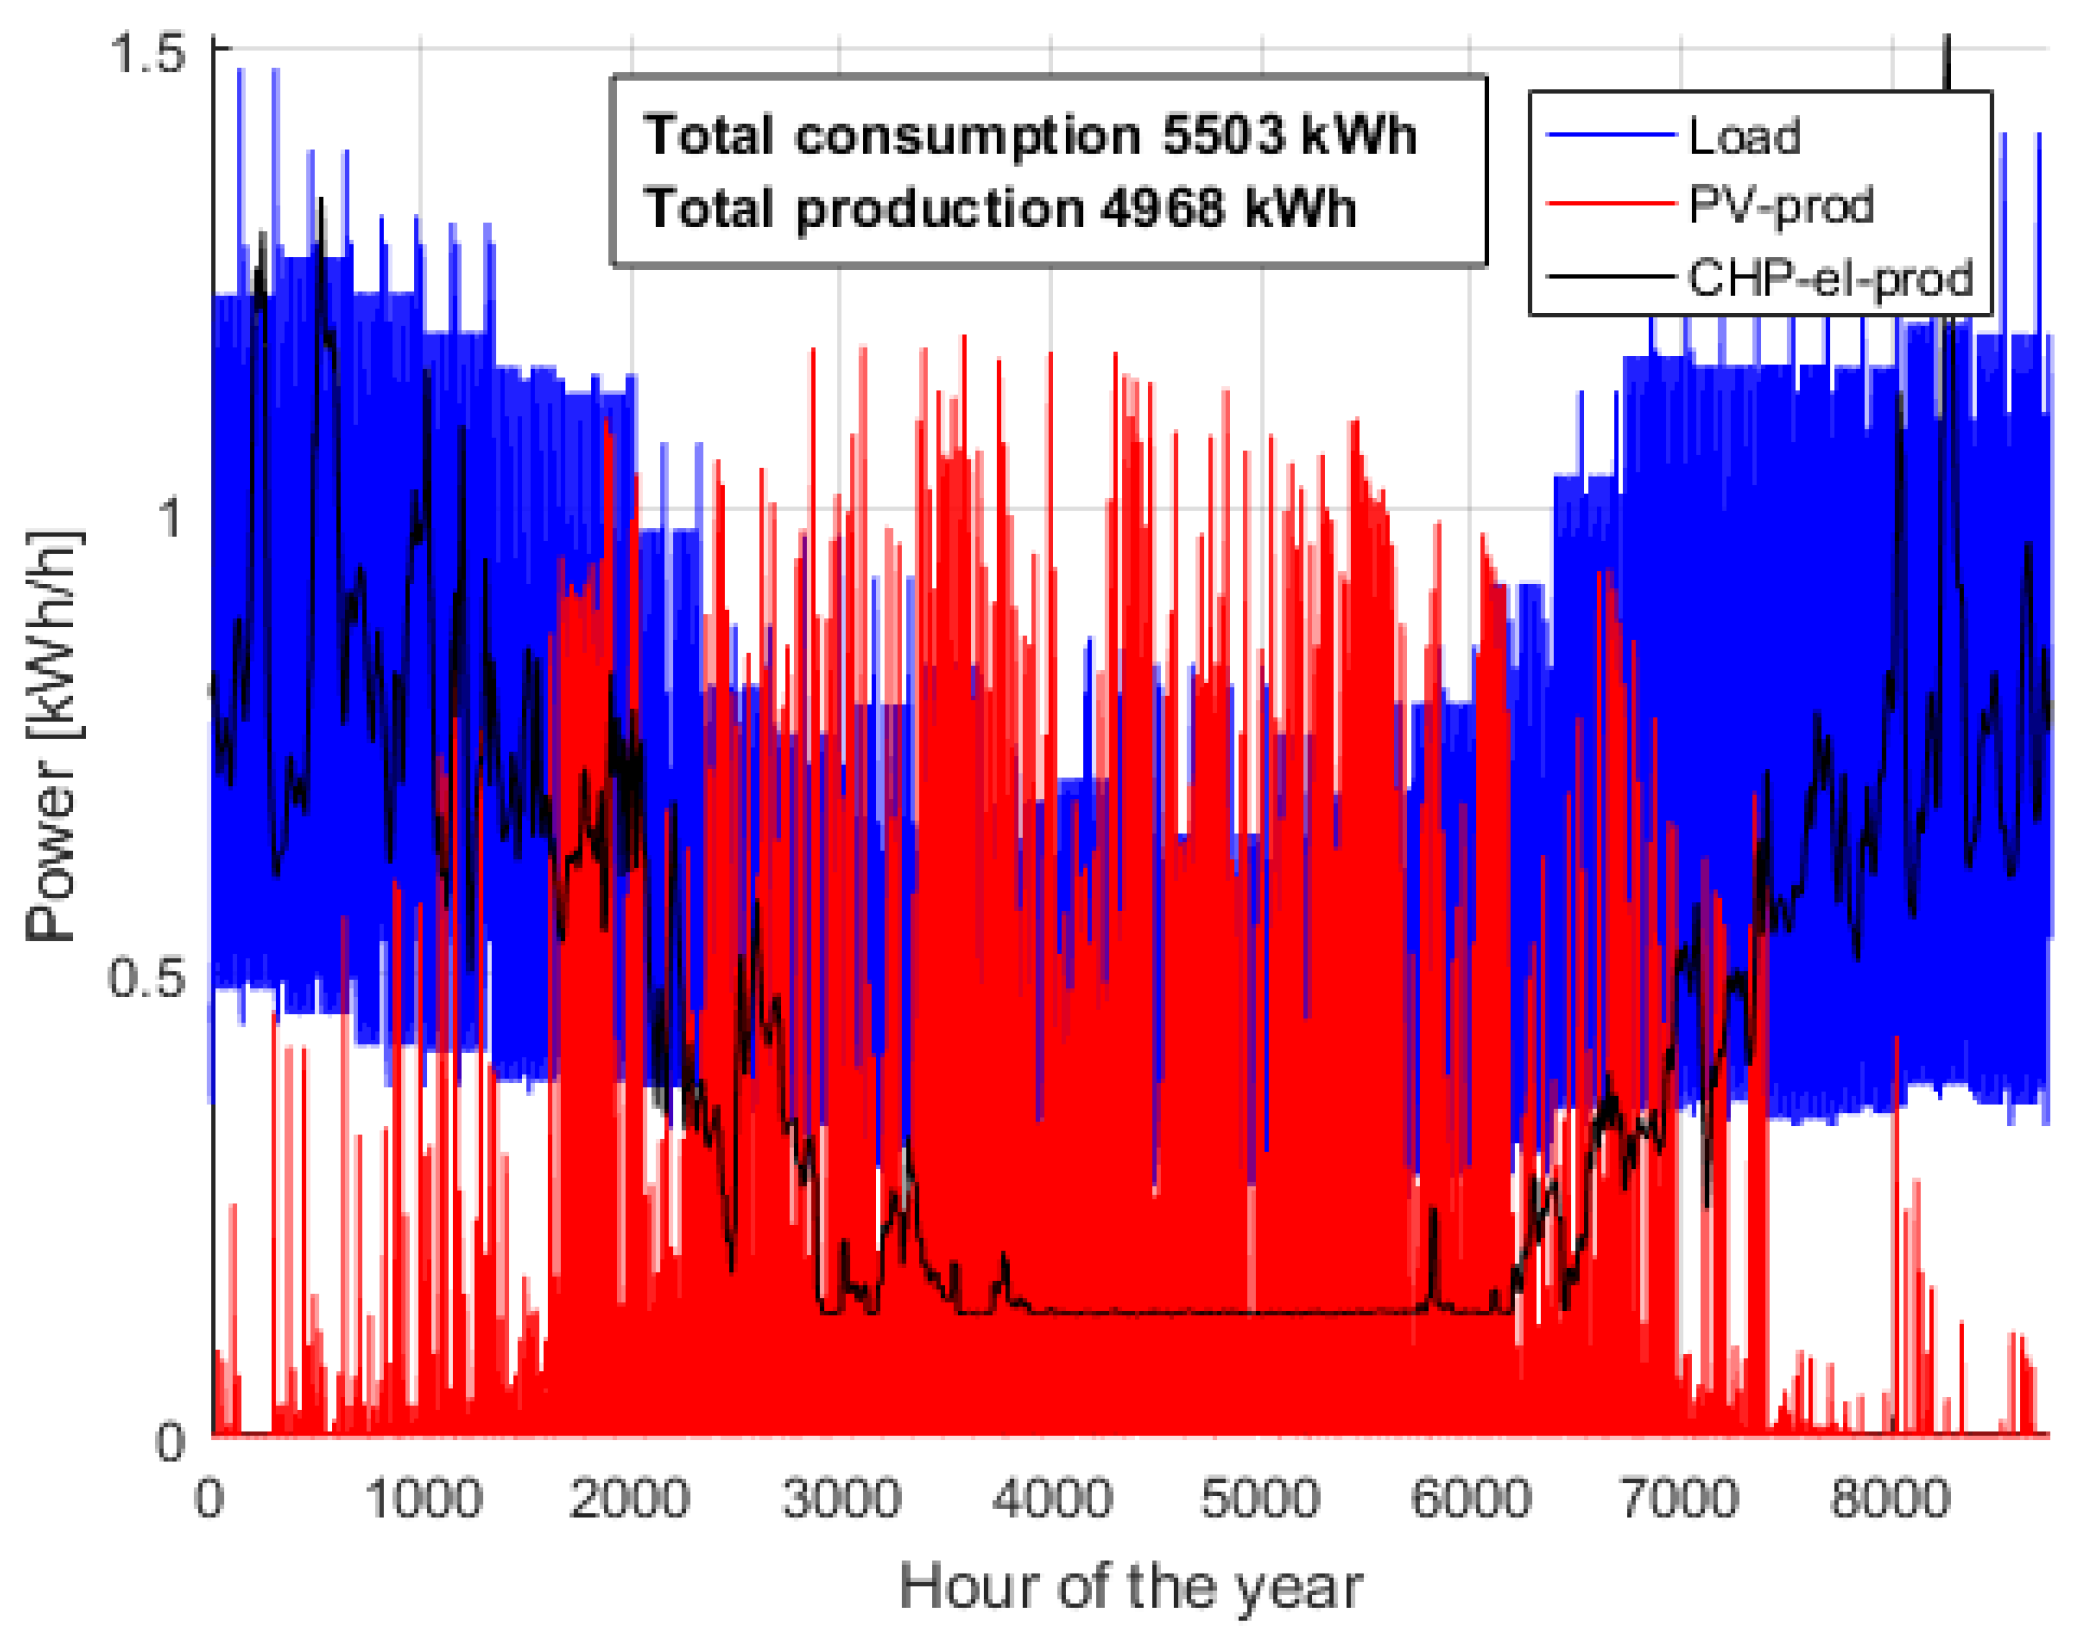
For the microgrid with base case parameter values and settings, the power production and consumption are presented in
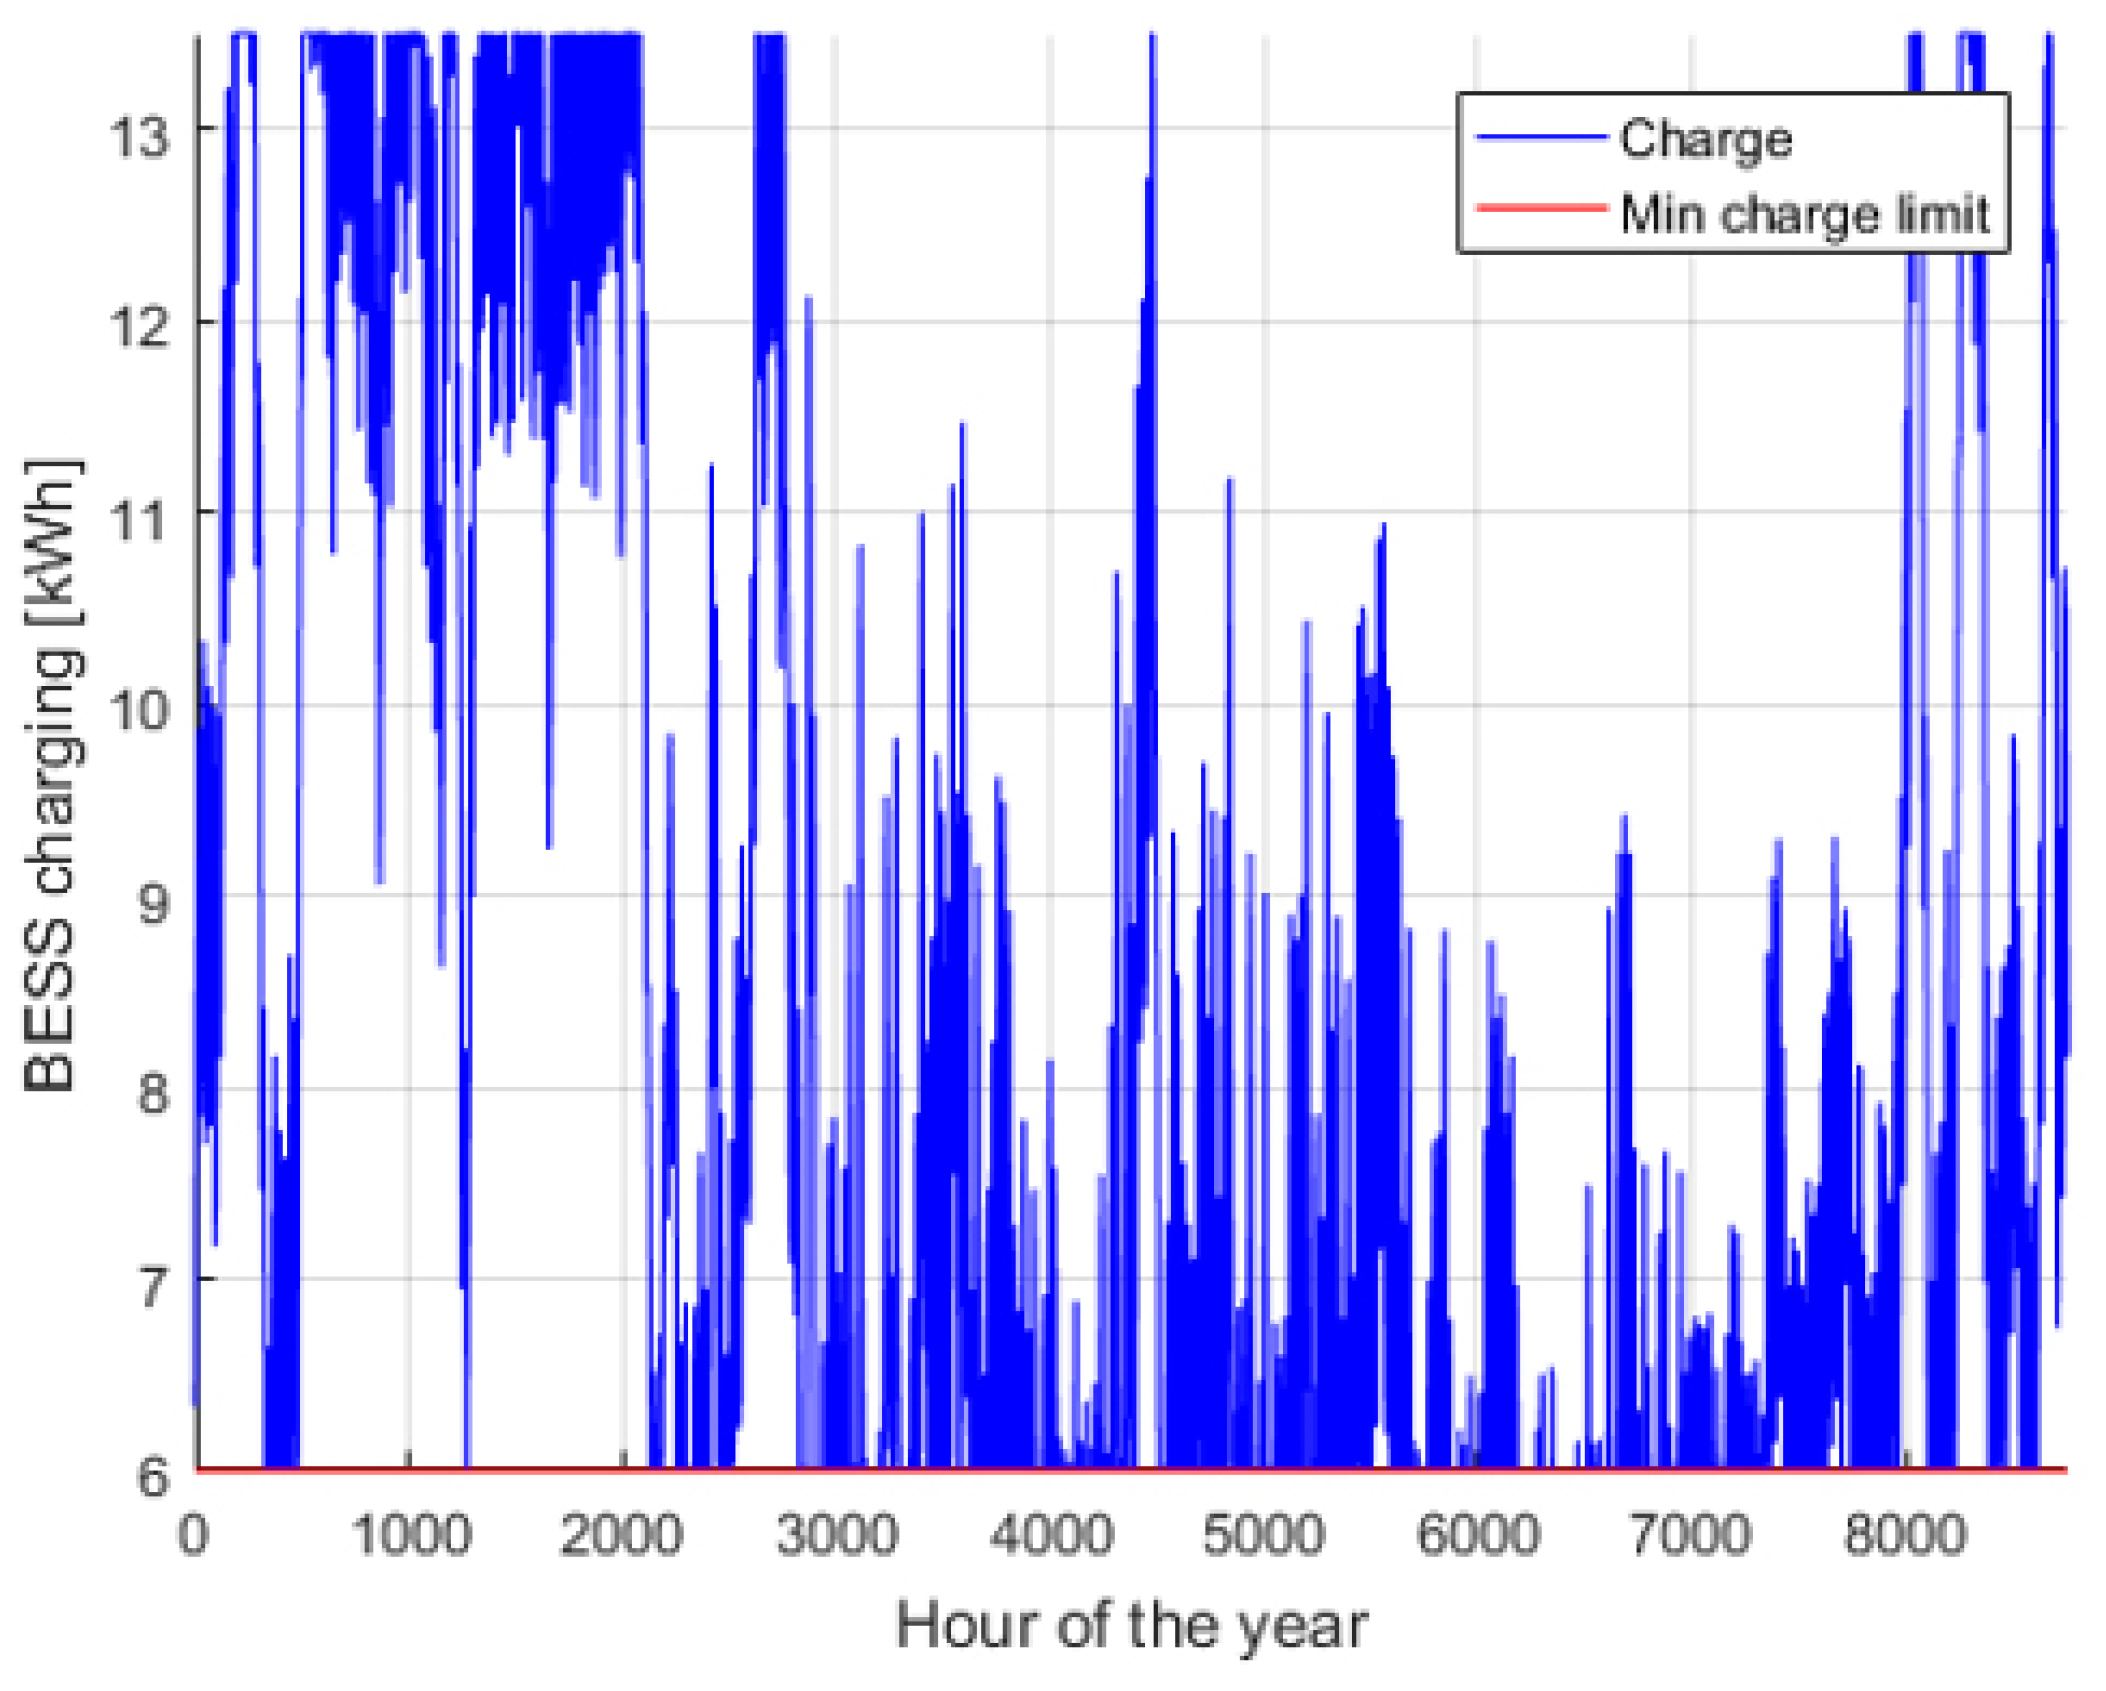
Figure 1, the BESS charging in
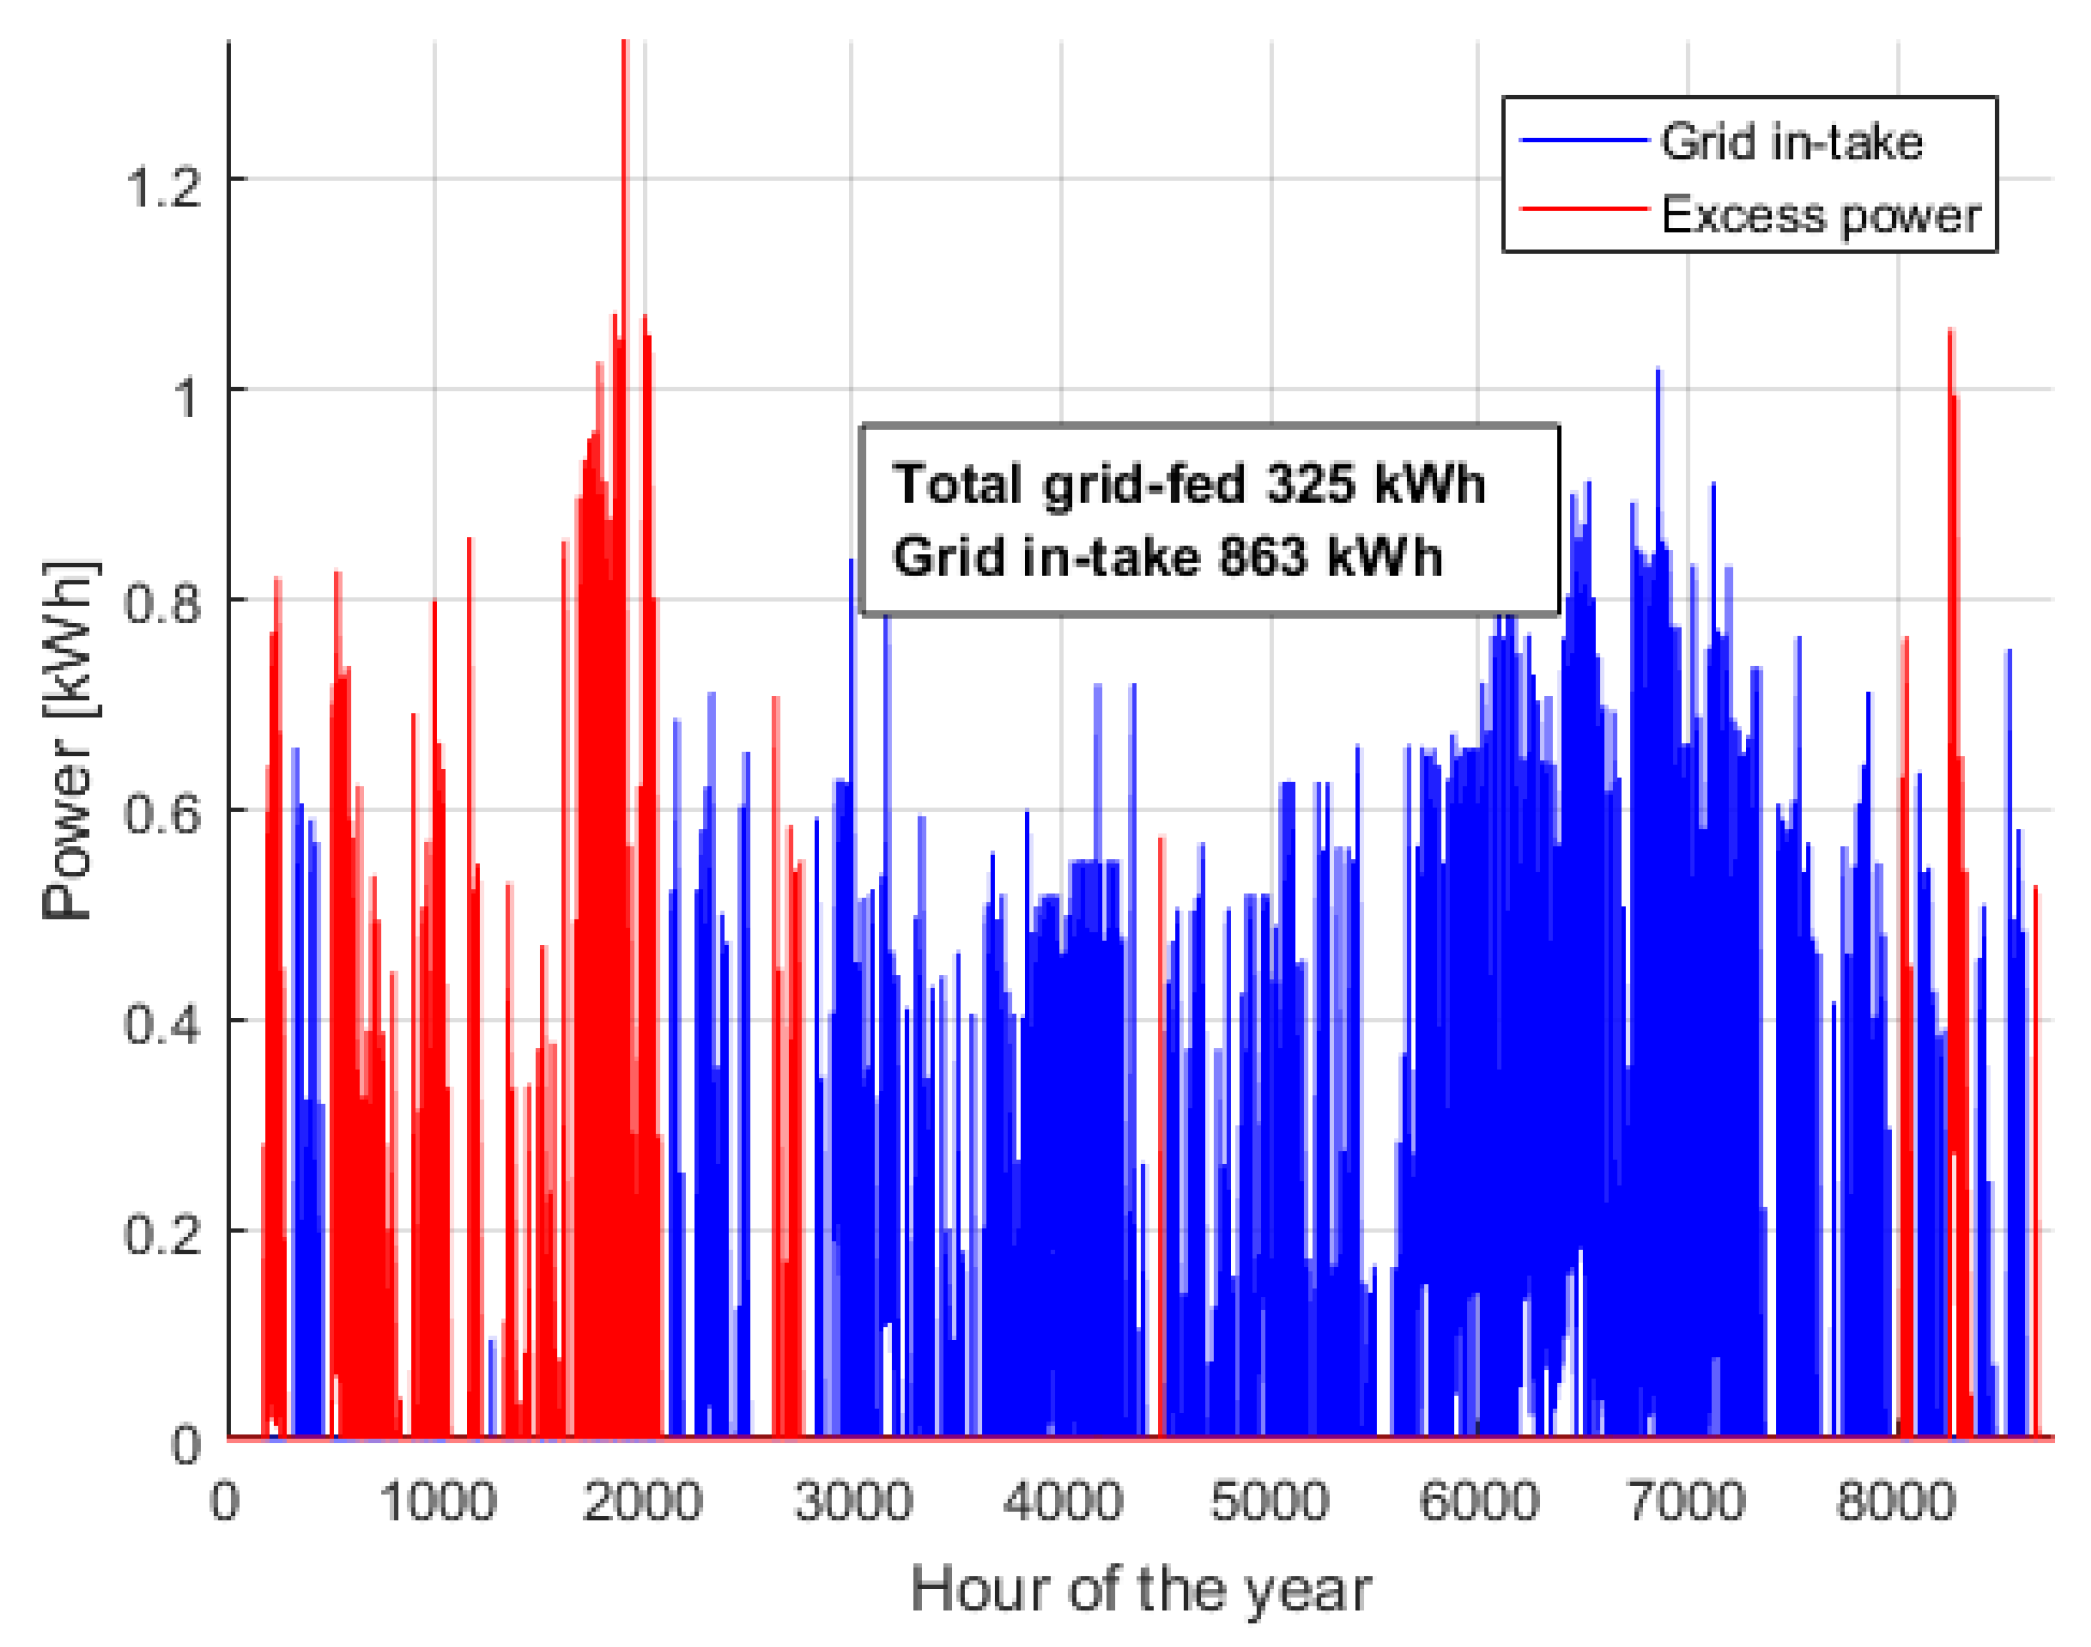
Figure 2 and microgrid excess power production, i.e., grid fed power, and power take from the grid in
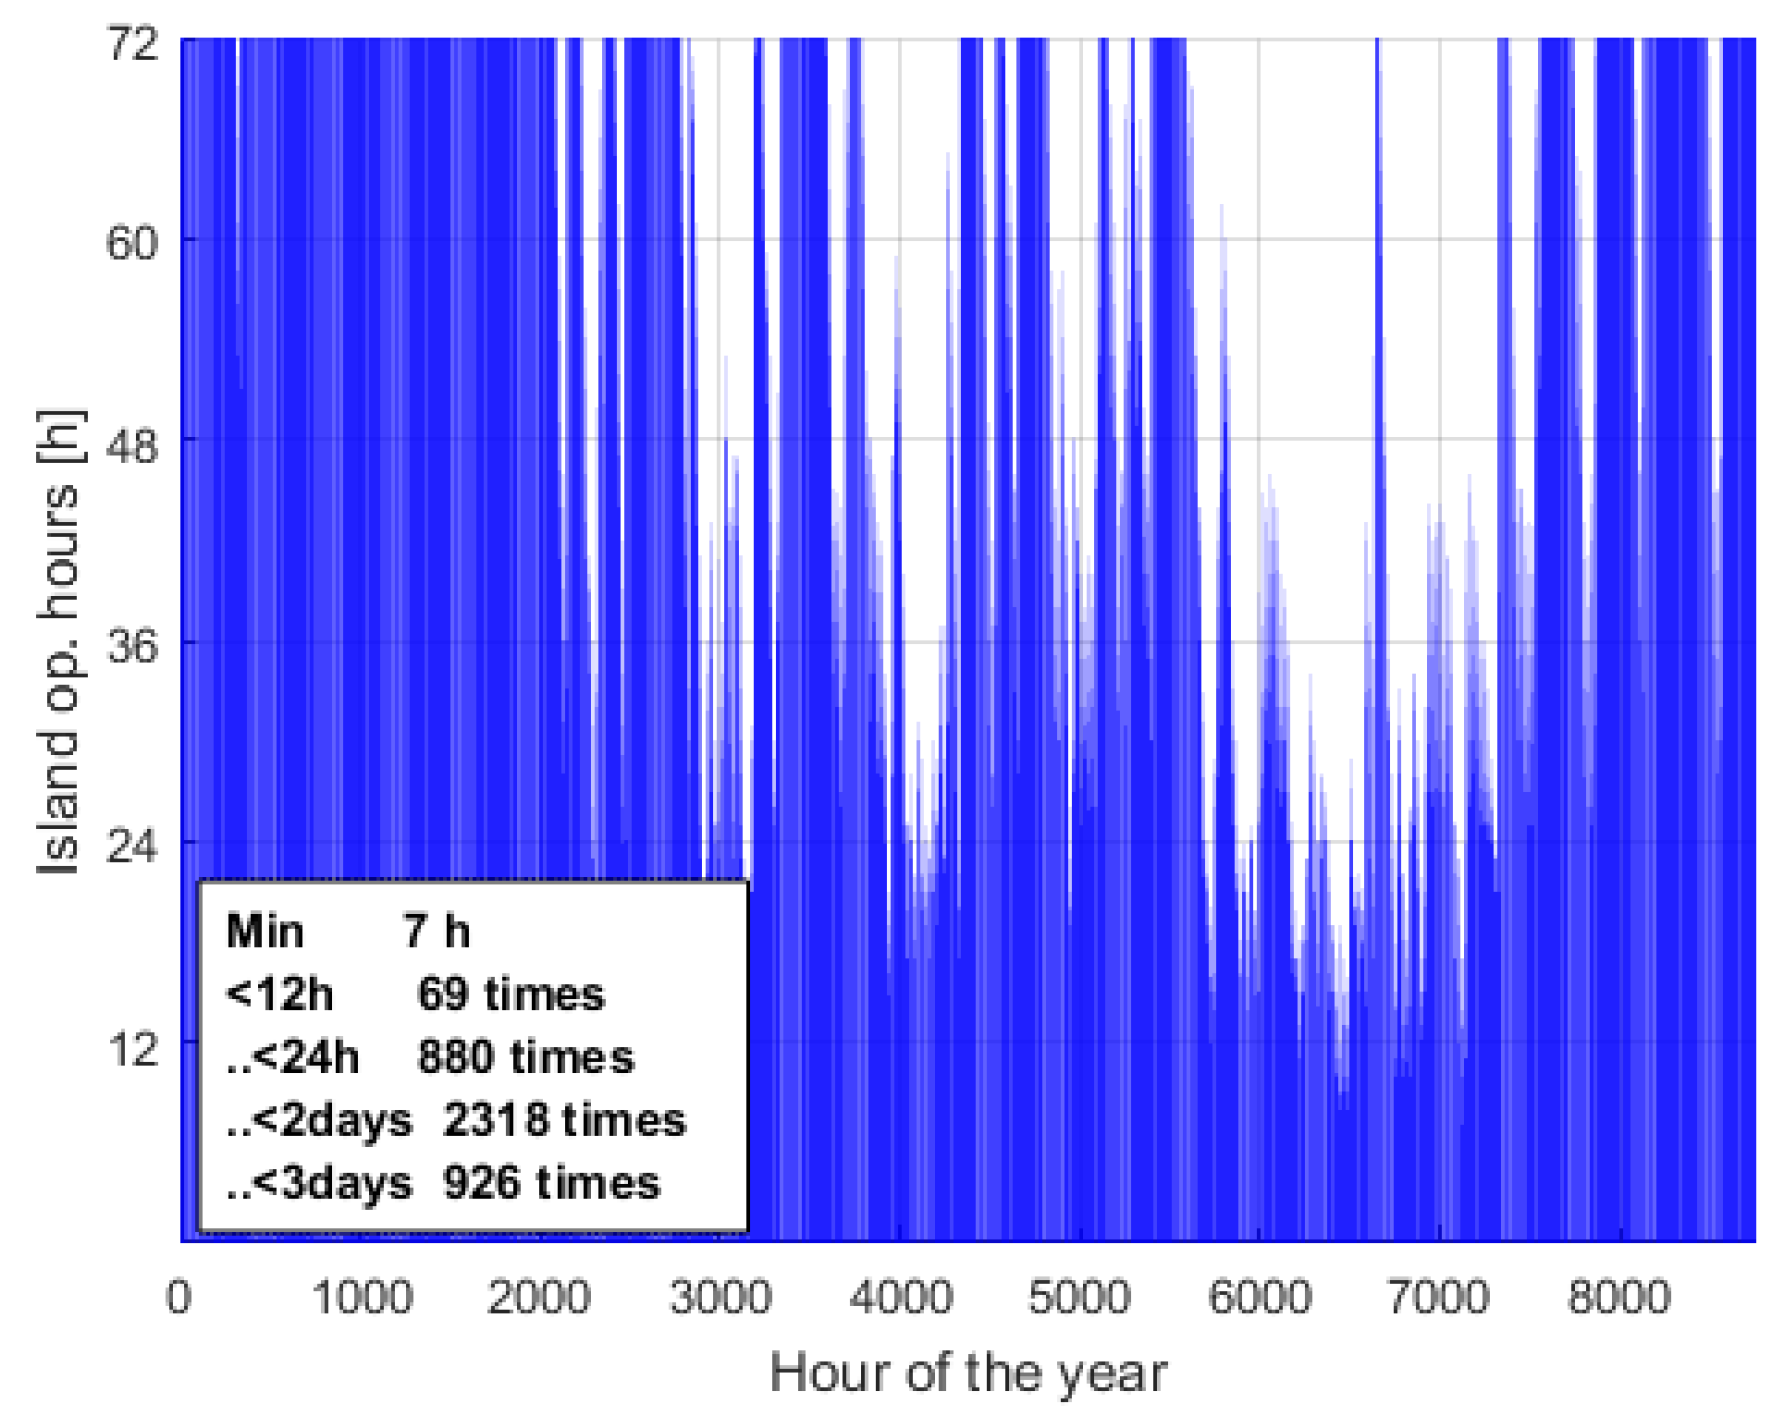
Figure 3. The islanded operation capability duration throughout the year are presented in
Figure 4.
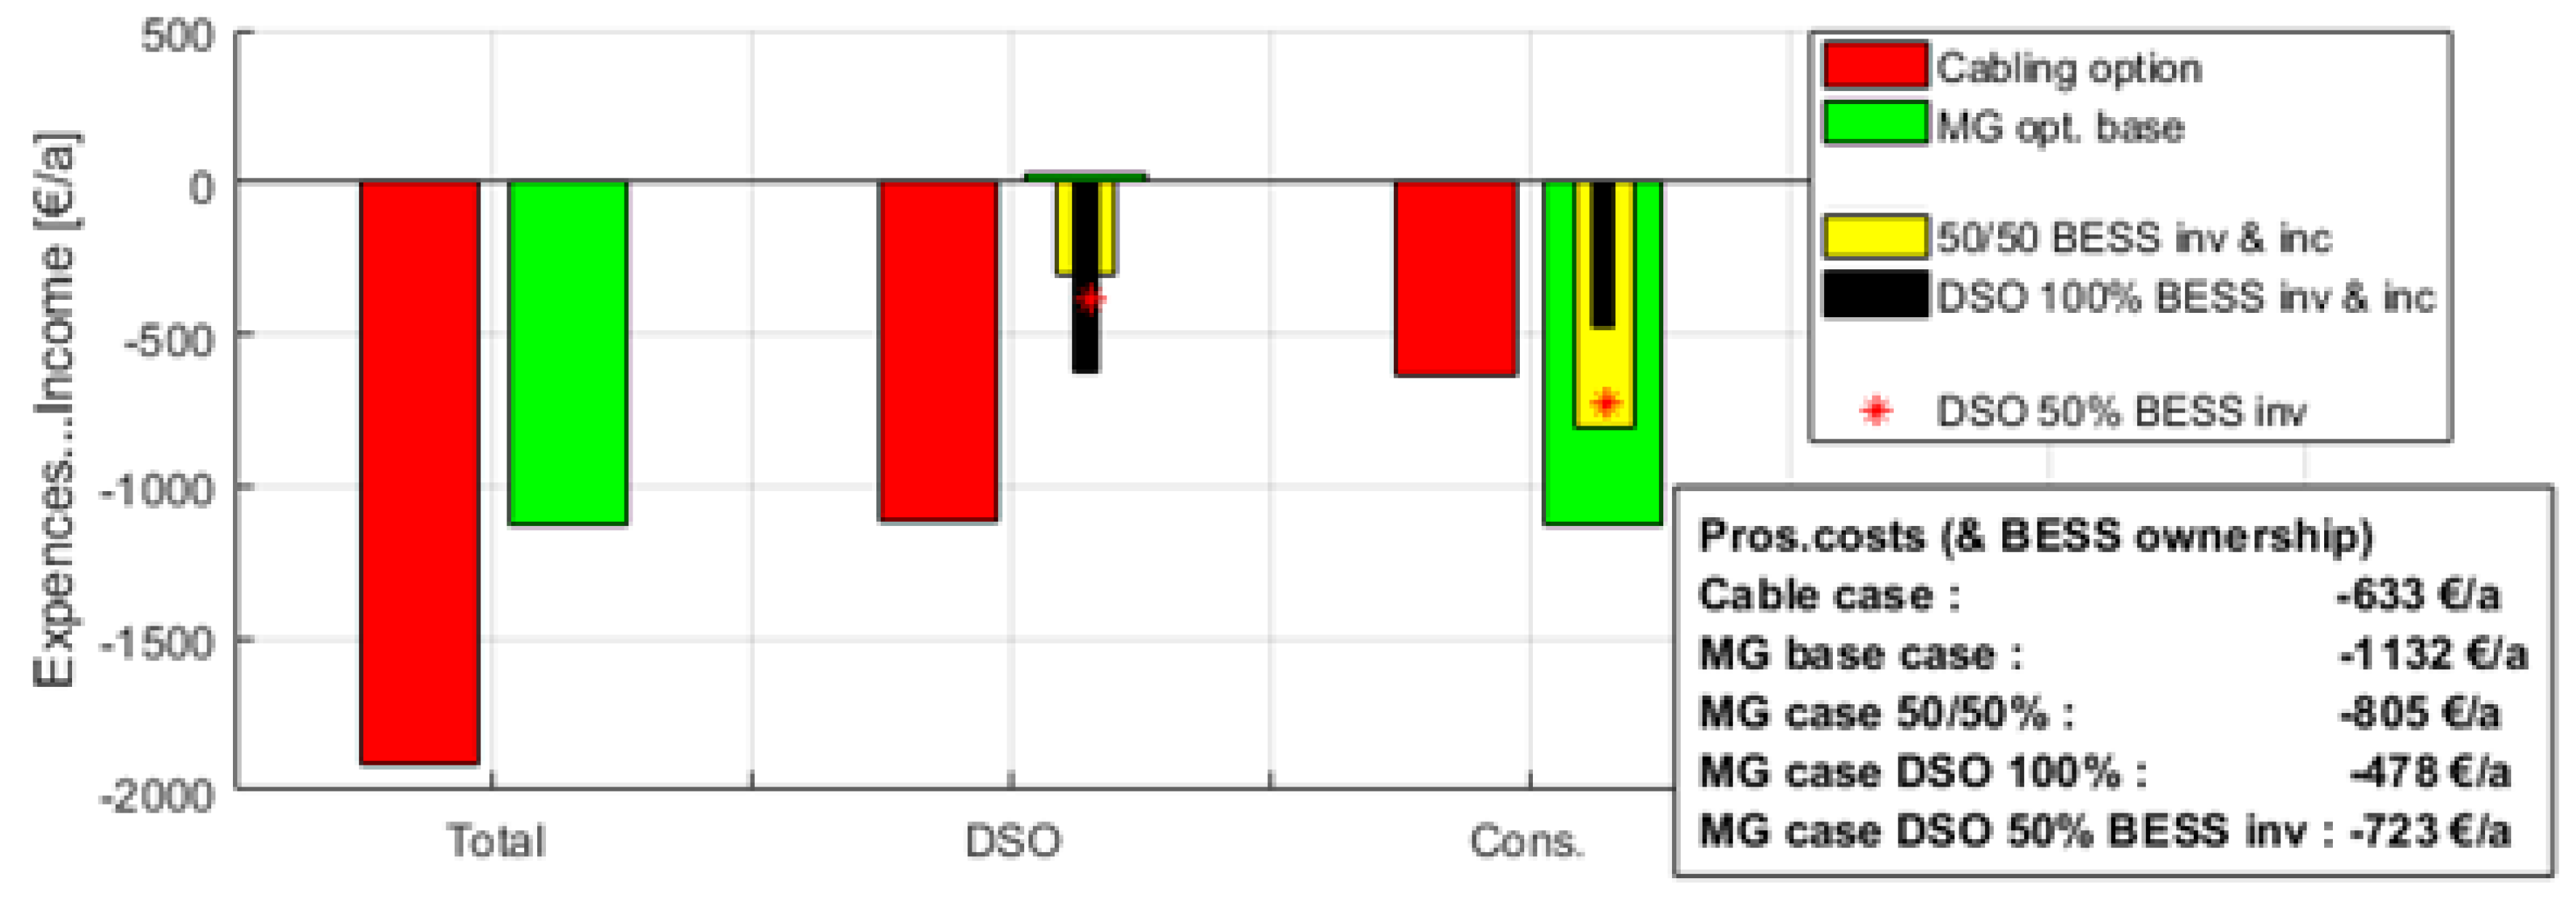
The base case economics assessment and comparison of the underground cabling and the microgrid options with different cost-sharing alternatives are presented in
Figure 5.
4.2. Sensitivity Analysis of Parameters
The influence of different PV database data and different PV production year data in the consumer economic balance is within less than 20 €/a between the high and low PV annual production. Thus, the selection of the PV generation data set to be used in the calculations is not significant.
Islanded operation capability duration depends on the minimum charge of the BESS, and the micro-CHP power production capability during islanded operation. If the micro-CHP is able to produce electricity at the maximum of the rated total capacity (i.e., 1.6 kW electric power), the islanded operation duration, in theory, has no limitations. The maximum power decreased down to 0.7 kW, the minimum islanded operation duration in the calculations was 50 h. This, in many cases, should be quite an acceptable repair time of a network outage even in the case of severe and widespread storm damages.
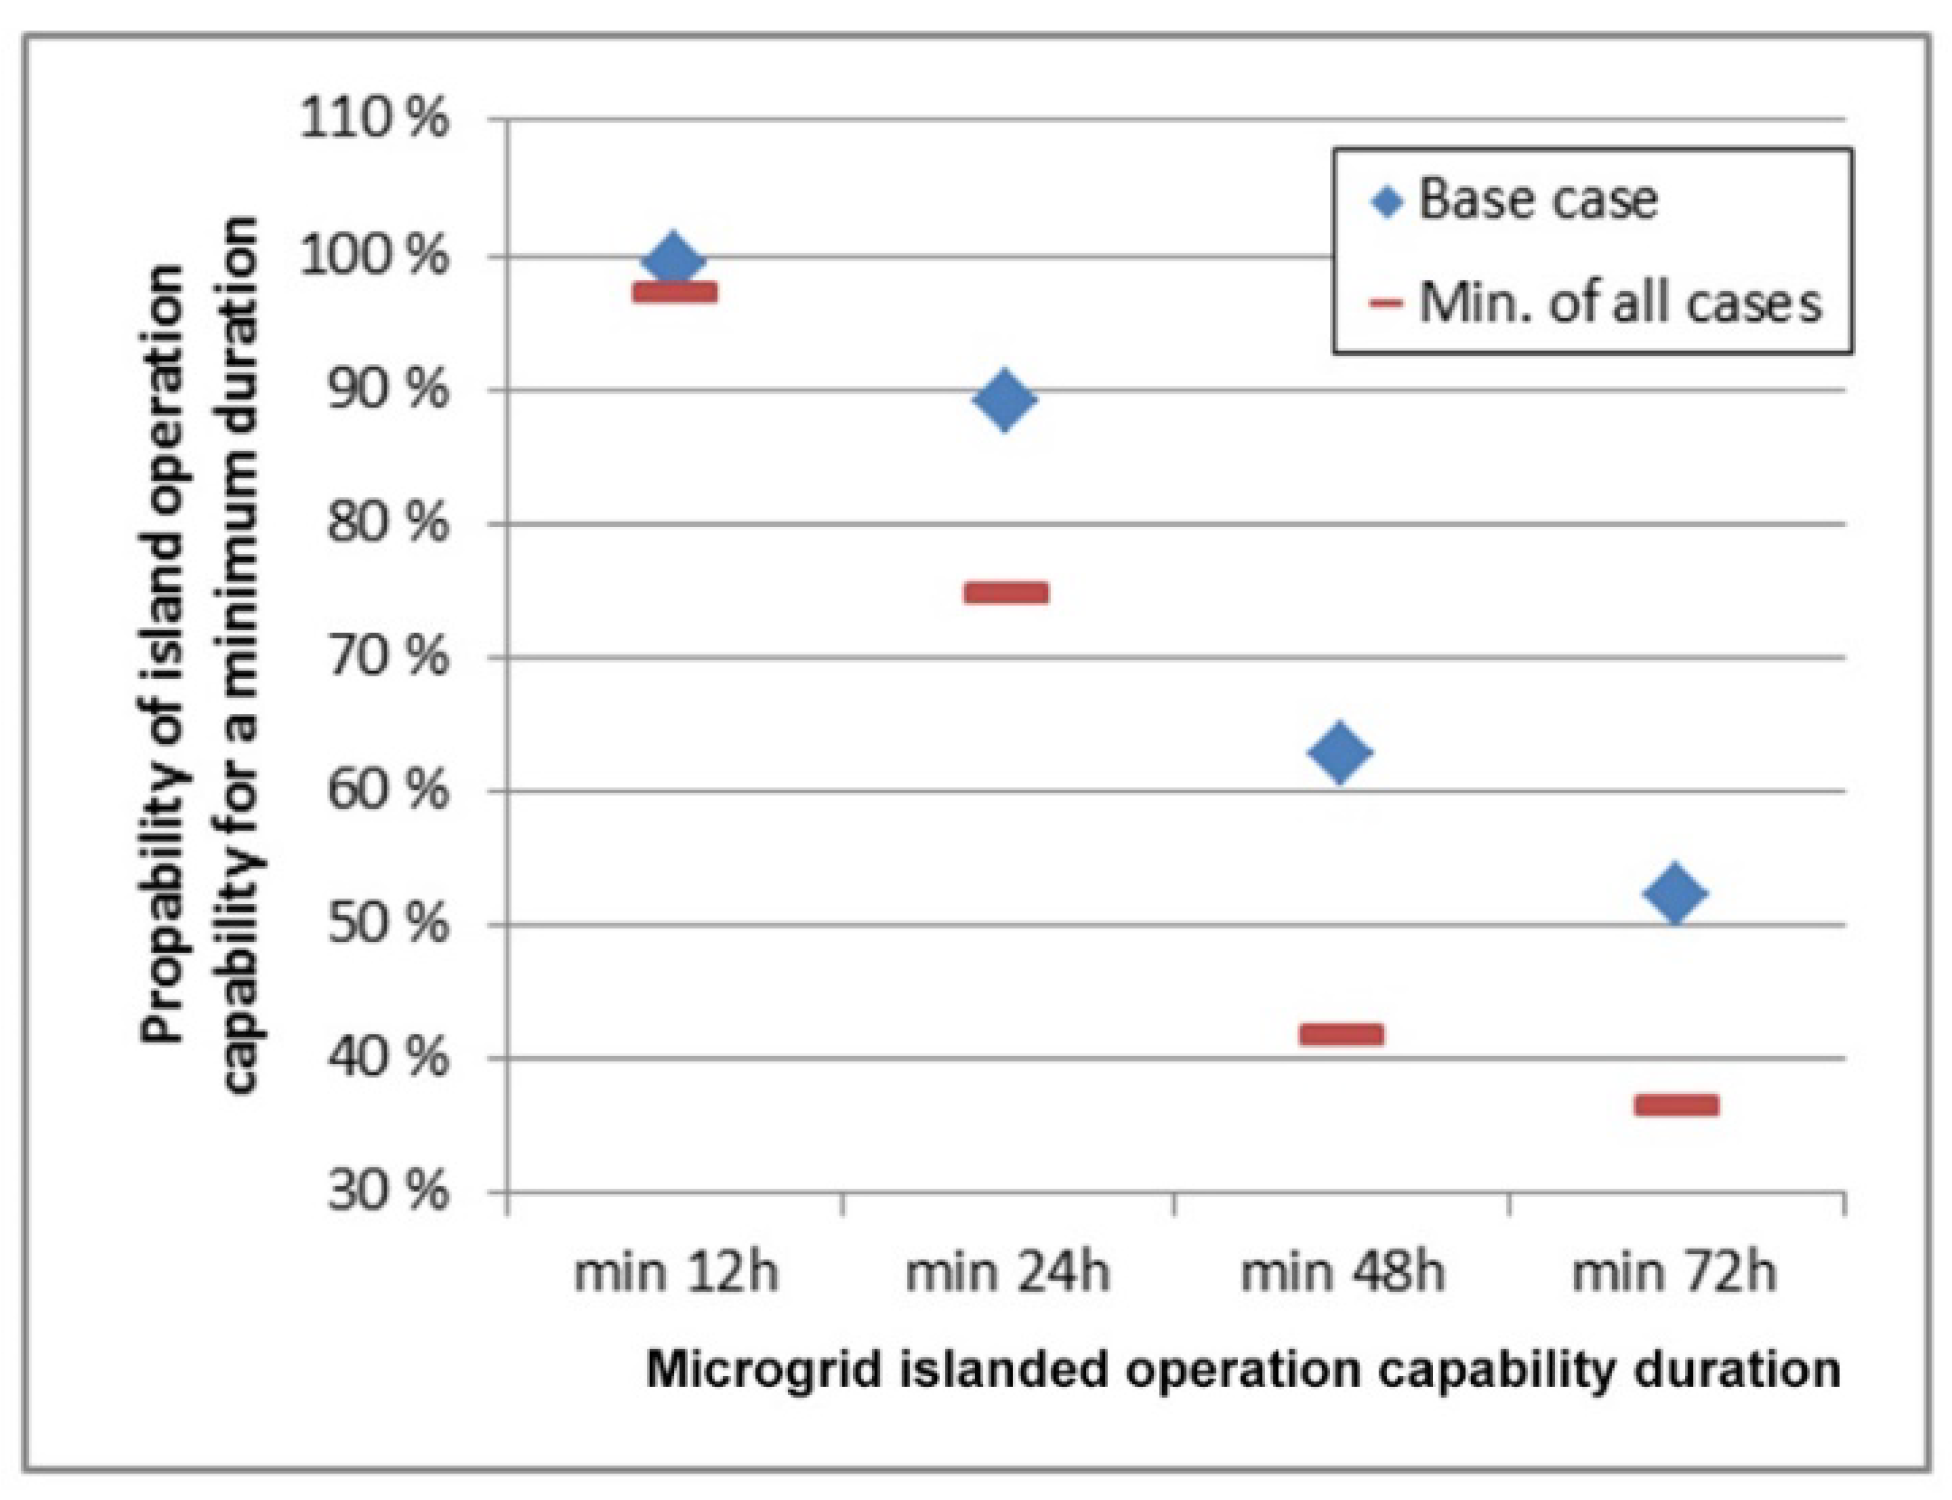
Islanded operation capability durations vary from case to case depending on the parameters varied for the sensitivity analysis. The probabilities for minimum islanded operation duration categories are presented in
Figure 6. The base case values correspond to those values also presented in the text box in
Figure 4.
In the simulation cases, the largest change in the BESS charge between consecutive hours (i.e., average power for the hour) was 1.5 kW, and thus significantly smaller even at largest, than the BESS nominal power 5 kW.
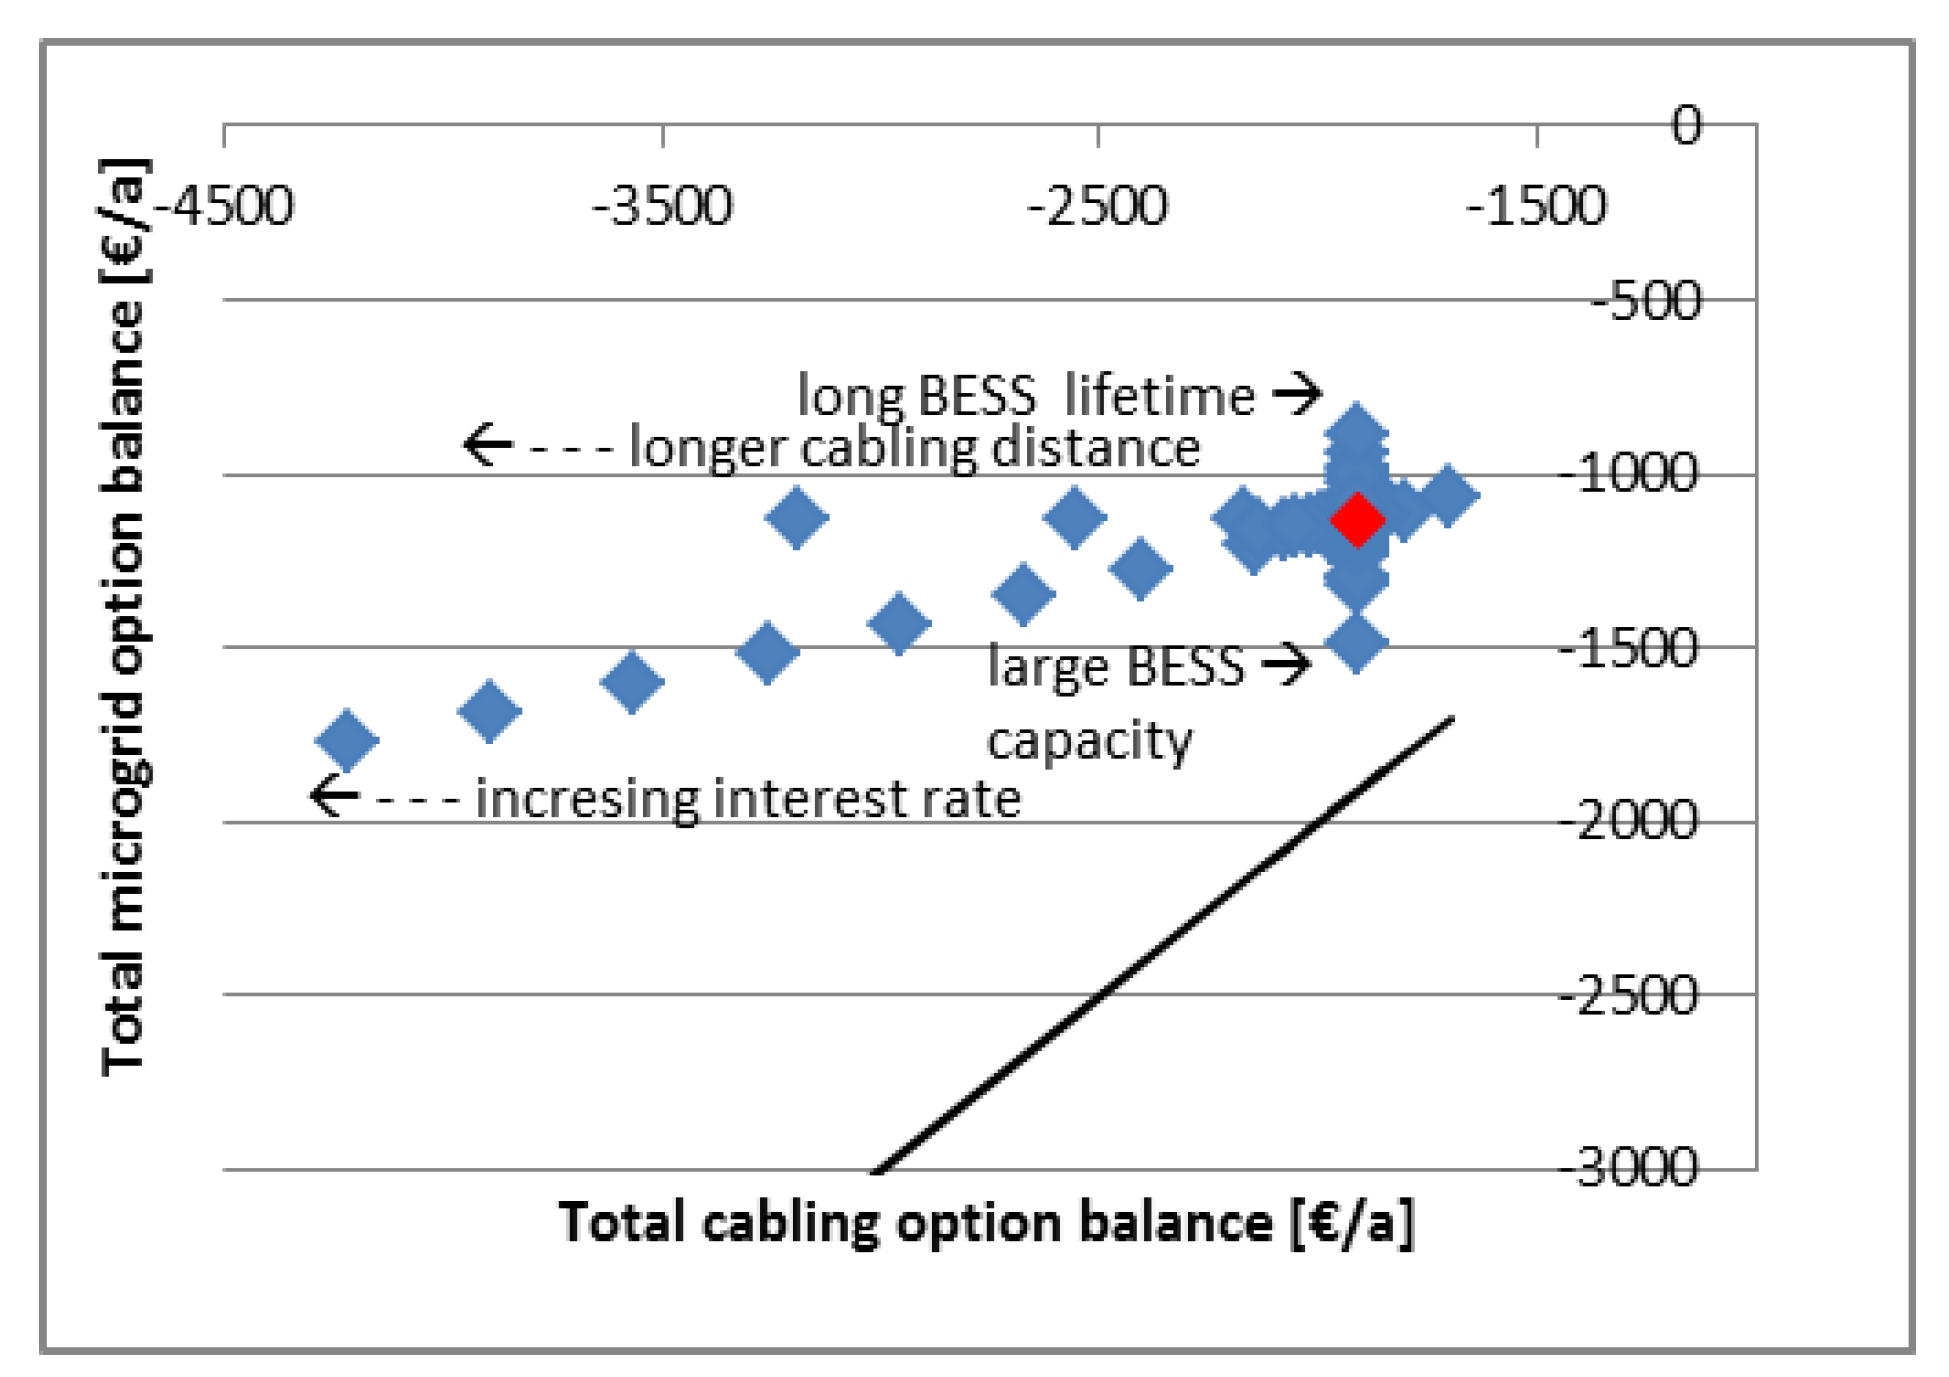
The total costs, i.e., the overall DSO and consumer combined costs, are compared in the cabling option and the microgrid option in all studied cases with varied parameters in
Figure 7. The results show that the microgrid option is in all studied cases more cost-efficient than cabling. The interest rate and cable length (i.e., the total cable investment cost) have obvious influence on the costs. The more expensive the cabling option is, the more cost effective the microgrid option seems to be.
The case when microgrid option is closest to the cabling option investment expenses is with largest storage capacity (BESS capacity 20 kWh), i.e., with larger storage investment. The lowest microgrid option costs are in the case with the longest BESS lifetime.
Figure 8 and
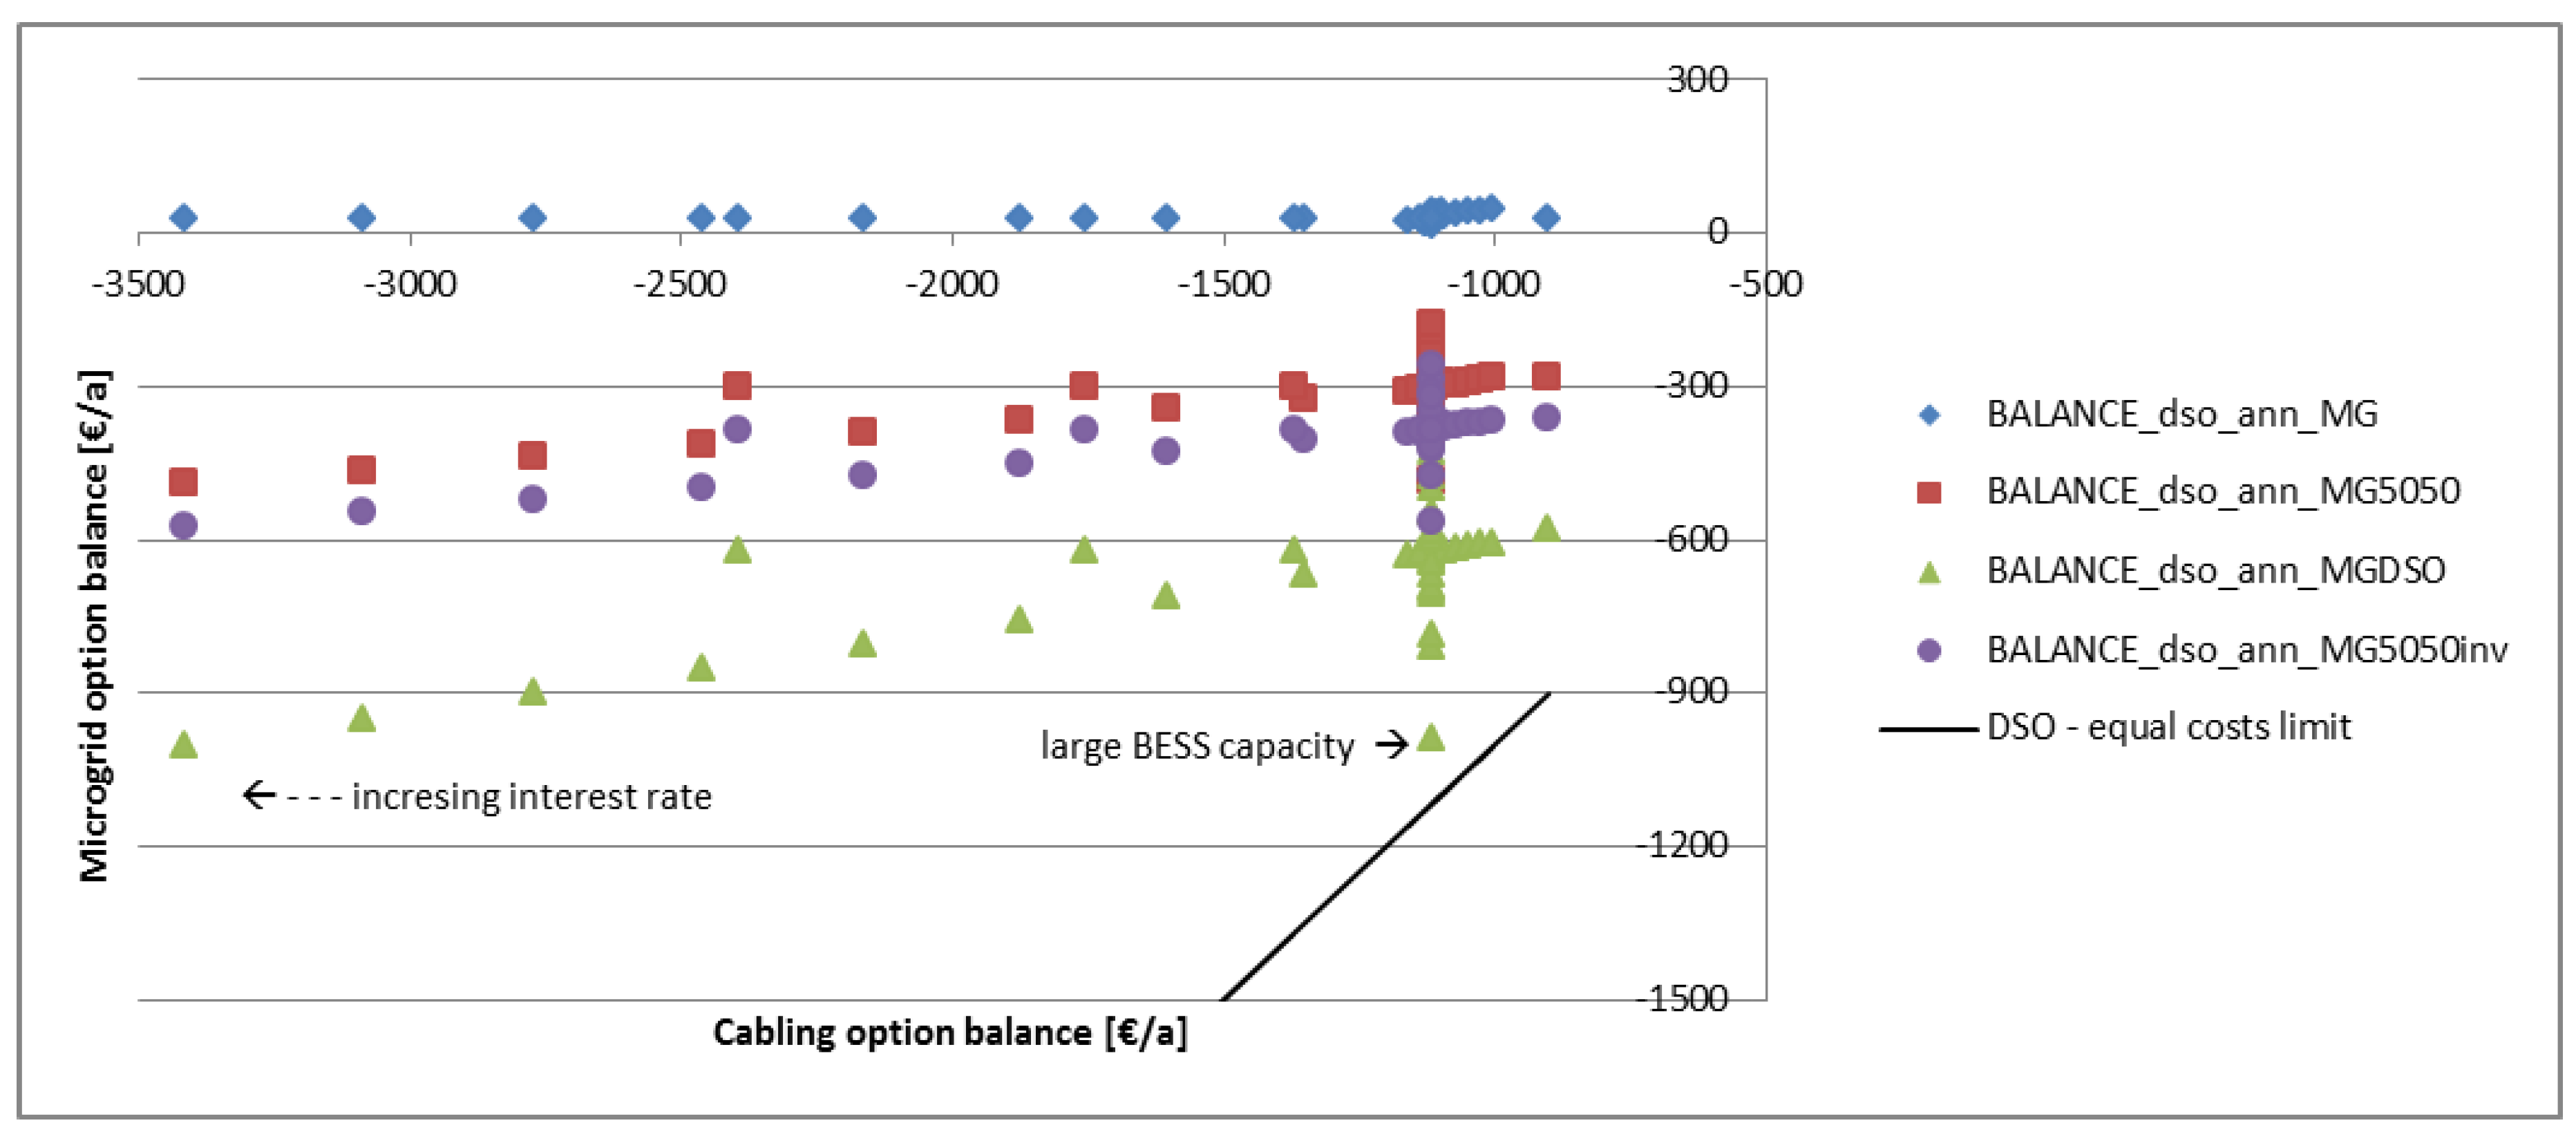
Figure 9 present the comparison of the cabling option and the microgrid option costs for the DSO and the consumer (i.e., the microgrid owner) respectively. The results show that the microgrid option is the most cost-efficient solution for the DSO in all cases, and for the consumer only in cases when the BESS would either be owned by the DSO, or the DSO compensating a part of the BESS investment.
5. Conclusions
A single detached house microgrid located in rural sparsely populated distribution network was studied as an alternative to underground cabling in order to increase the reliability of power supply. The results demonstrate that with a carefully planned composition of microgrid generation and storage components, a reasonable level of reliability of power supply could be met in an islanded operation during possible unexpected network outages.
The economic calculation results presented in this paper show clearly that an underground cabling option is likely to be overall more expensive an option in a rural sparsely populated network over a microgrid when considering the consumer and DSO costs together.
When cabling is the most expensive option over all, it is clearly the most expensive option also for the DSO alone. The microgrid option, in turn, was more expensive in all cases to the consumer/microgrid owner if the microgrid-related expenses are to be covered solely by the consumer.
Alternative microgrid investment strategies were proposed for cost-sharing between an electric customer, i.e., a microgrid owner, and a DSO. A few shared investment options of the BESS between the customer and the DSO were considered. The overall most cost-efficient microgrid option could be made by cost-sharing an economical option for the consumer/microgrid owner and enable the DSO to avoid a more expensive cabling investment.
A microgrid could be an alternative for rural network underground cabling, provided it was made an optional practice in distribution network planning and operations, and that it was permitted by regulations. In addition, its application would require a willing electricity customer and mutual agreement and cooperation between the customer and DSO.
Author Contributions
The literature review, modeling, simulations, and analysis were done by S.U.; K.F. collected information on micro-CHP-power plants and network resilience; J.S. created the detached house heat demand data series and provided the relevant description for the manuscript; S.U. prepared the manuscript, and K.F. contributed to the editing and revision of the manuscript.
Funding
This work has been supported by the Strategic Research Council at the Academy of Finland, project Transition to a resource efficient and climate neutral electricity system (EL-TRAN) grant number 314319.
Acknowledgments
The authors thank Göran Koreneff for providing advice on the household electric customer load profiles and the used profile data.
Conflicts of Interest
The authors declare no conflict of interest. The funders had no role in the design of the study; in the collection, analyses, or interpretation of data; in the writing of the manuscript; or in the decision to publish the results.
Appendix A
The varied parameter values for the sensitivity analysis are listed here as follows, the bolded value being the base case value.
Cable length [km]:
1.0; 1.2; 1.5; 2.0
Electricity consumption [kWh/a] (in the level of):
5000; 5100; 5200; 5300; 5400; 5500; 5600; 5700; 5800; 5900; 6000
Micro-CHP total capacity [kW] and share of electric power of total production capacity [%]:
8 kW, 20%; 9 kW, 30%
Micro-CHP production capability during microgrid islanded operation [kW]:
scheduled power; 1.6 (rated/maximum power); 0.8; 0.7; 0.6; 0.5
Micro-CHP power plant investment cost [€/kW]:
800; 1000; 1200; 1500; 2000; 2500
Micro-CHP energy generation fuel cost [€/a]:
800; 1000; 1200; 1500; 2000; 2500
Micro-CHP power plant lifetime [a]:
10; 15; 20
PV capacity [kW]:
0.8; 1.0; 1.2; 1.5; 1.7; 2.0; 2.2
PV data source solar radiation database:
SARAH; ERA5; COSMO
PV data year:
2005; 2006; 2007; 2008; 2009; 2010; 2011; 2012; 2013; 2014; 2015; 2016
PV investment cost [€/kW]:
800; 1000; 1200; 1500; 1800; 2000
PV panels’ lifetime [a]:
15; 20; 25; 30
BESS energy storage capacity [kWh]:
10; 13.5; 15; 20
BESS minimum charge [kWh]:
5; 6; 7; 8; 9; 10; 11; 12
BESS lifetime [a]:
8; 10; 12; 15
Capacity dependent share of BESS investment cost [€/kWh]:
400; 450; 500; 550
Interest rate [%]:
1; 2; 3; 4; 5; 6; 7; 8; 9; 10
Electricity retail purchase price [c/kWh]:
3; 4; 5; 6; 7; 8; 9
Electricity distribution fee [c/kWh]:
5.5; 6.0; 6.5; 7.0; 7.5; 8.0; 8.5; 9.0
BESS power capacity sold to FCR-D market [h/a]:
0; 4000; 5000; 6000; 7000; 8000; 8760
References
- Forssén, K. Resilience of Finnish Electricity Distribution Networks against Extreme Weather Conditions. Master’s Thesis, Aalto University, Helsinki, Finland, 2016. [Google Scholar]
- Haakana, J. Impact of Reliability of Supply on Long-Term Development Approaches to Electricity Distribution Networks. Ph.D. Thesis, Lappeenranta University of Technology, Lappeenranta, Finland, 2013. [Google Scholar]
- Li, Z.; Shahidehpour, M.; Aminifar, F.; Alabdulwahab, A.; Al-Turki, Y. Networked Microgrids for Enhancing the Power System Resilience. Proc. IEEE 2017, 105, 1289–1310. [Google Scholar] [CrossRef]
- Liu, X.; Shahidehpour, M.; Li, Z.; Liu, X.; Cao, Y.; Bie, Z. Microgrids for Enhancing the Power Grid Resilience in Extreme Conditions. IEEE Trans. Smart Grid 2017, 8, 589–597. [Google Scholar] [CrossRef]
- Costa, P.; Matos, M. Assessing the contribution of microgrids to the reliability of distribution networks. Electr. Power Syst. Res. 2009, 79, 382–389. [Google Scholar] [CrossRef]
- Schneider, K.P.; Tuffner, F.K.; Elizondo, M.A.; Liu, C.-C.; Xu, Y.; Ton, D. Evaluating the Feasibility to Use Microgrids as a Resiliency Resource. IEEE Trans. Smart Grid 2017, 8, 687–696. [Google Scholar] [CrossRef]
- Stadler, M.; Cardoso, G.; Mashayekh, S.; Forget, T.; DeForest, N.; Agarwal, A.; Schönbein, A. Value streams in microgrids: A literature review. Appl. Energy 2016, 162, 980–989. [Google Scholar] [CrossRef] [Green Version]
- Schwaegerl, C.; Tao, L. Quantification of Technical, Economic, Environmental and Social Benefits of Microgird Operation; Wiley-IEEE Press: Hoboken, NJ, USA, 2013; Chapter 7; p. 344. ISBN 9781118720677. [Google Scholar] [CrossRef]
- Vilppo, O.; Markkula, J.; Järventausta, P. Energy Storage in Low Voltage (LV) Network for Decreasing Customer Interruption Cost (CIC); Tampere University of Technology: Tampere, Finland, 2016. [Google Scholar]
- Haakana, J.; Lassila, J.; Kaipia, T.; Partanen, J. Utilisation of energy storages to secure electricity supply in electricity distribution networks. In Proceedings of the CIRED—22nd International Conference on Electricity Distribution, Stockholm, Sweden, 10–13 June 2013; pp. 1–4. [Google Scholar] [CrossRef]
- Uski, S.; Rinne, E.; Sarsama, J. Microgrid as a Cost-Effective Alternative for Rural Network Underground Cabling for Adequate Reliability. Energies 2018, 11, 1978. [Google Scholar] [CrossRef]
- IDA Indoor Climate and Energy Building Energy Simulation Tool, EQUA Simulations, Sweden. Available online: https://www.equa.se/en/ida-ice (accessed on 1 December 2017).
- SLY. Suomen Sähkölaitosyhdistys r.y; Kuormitustutkimus 1992: Helsinki, Finland, 1992; p. 172. [Google Scholar]
- European Commission PV GIS Tool. Available online: http://re.jrc.ec.europa.eu/pvg_tools/en/tools.html (accessed on 1 December 2017).
- Mousazadeh, H.; Keyhani, A.; Javadi, A.; Mobli, H.; Abrinia, K.; Sharifi, A. Evaluation of alternative battery technologies for a solar assist plug-in hybrid electric tractor. Transp. Res. Part D 2010, 15, 507–512. [Google Scholar] [CrossRef]
Figure 1.
Detached house electricity consumption (Load) and power production (photovoltaics (PV)-prod and combined heat and power (CHP)-el-prod) hourly data series for a year in the base case, as well as the annual totals.
Figure 1.
Detached house electricity consumption (Load) and power production (photovoltaics (PV)-prod and combined heat and power (CHP)-el-prod) hourly data series for a year in the base case, as well as the annual totals.
Figure 2.
Battery energy storage system (BESS) charging hourly data series in the base case.
Figure 2.
Battery energy storage system (BESS) charging hourly data series in the base case.
Figure 3.
Hourly data series of electricity taken from the network (Grid in-take) and excess electricity fed to the network (Excess power) in the base case, as well as the annual totals.
Figure 3.
Hourly data series of electricity taken from the network (Grid in-take) and excess electricity fed to the network (Excess power) in the base case, as well as the annual totals.
Figure 4.
The base case results for microgrid islanded operation capability duration each hour of the year in the case of unexpected network outage taking place at any hour.
Figure 4.
The base case results for microgrid islanded operation capability duration each hour of the year in the case of unexpected network outage taking place at any hour.
Figure 5.
The base case results of economic calculations for the cabling option and microgrid option in different BESS investment and ownership strategies. The comparison of total overall costs, the distribution system operator (DSO) costs, and the consumer/microgrid owner costs in case of different BESS cost-sharing strategies.
Figure 6.
The probabilities of microgrid islanded operation capability duration of the base case and the minimums of all the cases analysed for sensitivity analysis.
Figure 6.
The probabilities of microgrid islanded operation capability duration of the base case and the minimums of all the cases analysed for sensitivity analysis.
Figure 7.
The cabling option and microgrid option total cost comparison with the varied parameter values. The black line represents the equal cost limit, and the base case is marked in red.
Figure 7.
The cabling option and microgrid option total cost comparison with the varied parameter values. The black line represents the equal cost limit, and the base case is marked in red.
Figure 8.
The cabling option and microgrid option DSO cost comparison with the varied parameter values considering different cost-sharing strategies of the microgrid investments. The black line represents the equal cost limit, i.e., when the cabling costs and microgrid costs would be equal. BALANCE_dso_ann_MG, BALANCE_dso_ann_MG5050, BALANCE_dso_ann_MGDSO and BALANCE_dso_ann_MG5050inv refer to prosumer 100% ownership, prosumer/DSO 50/50% ownership, DSO 100% ownership and prosumer/DSO 50/50% investment respectively.
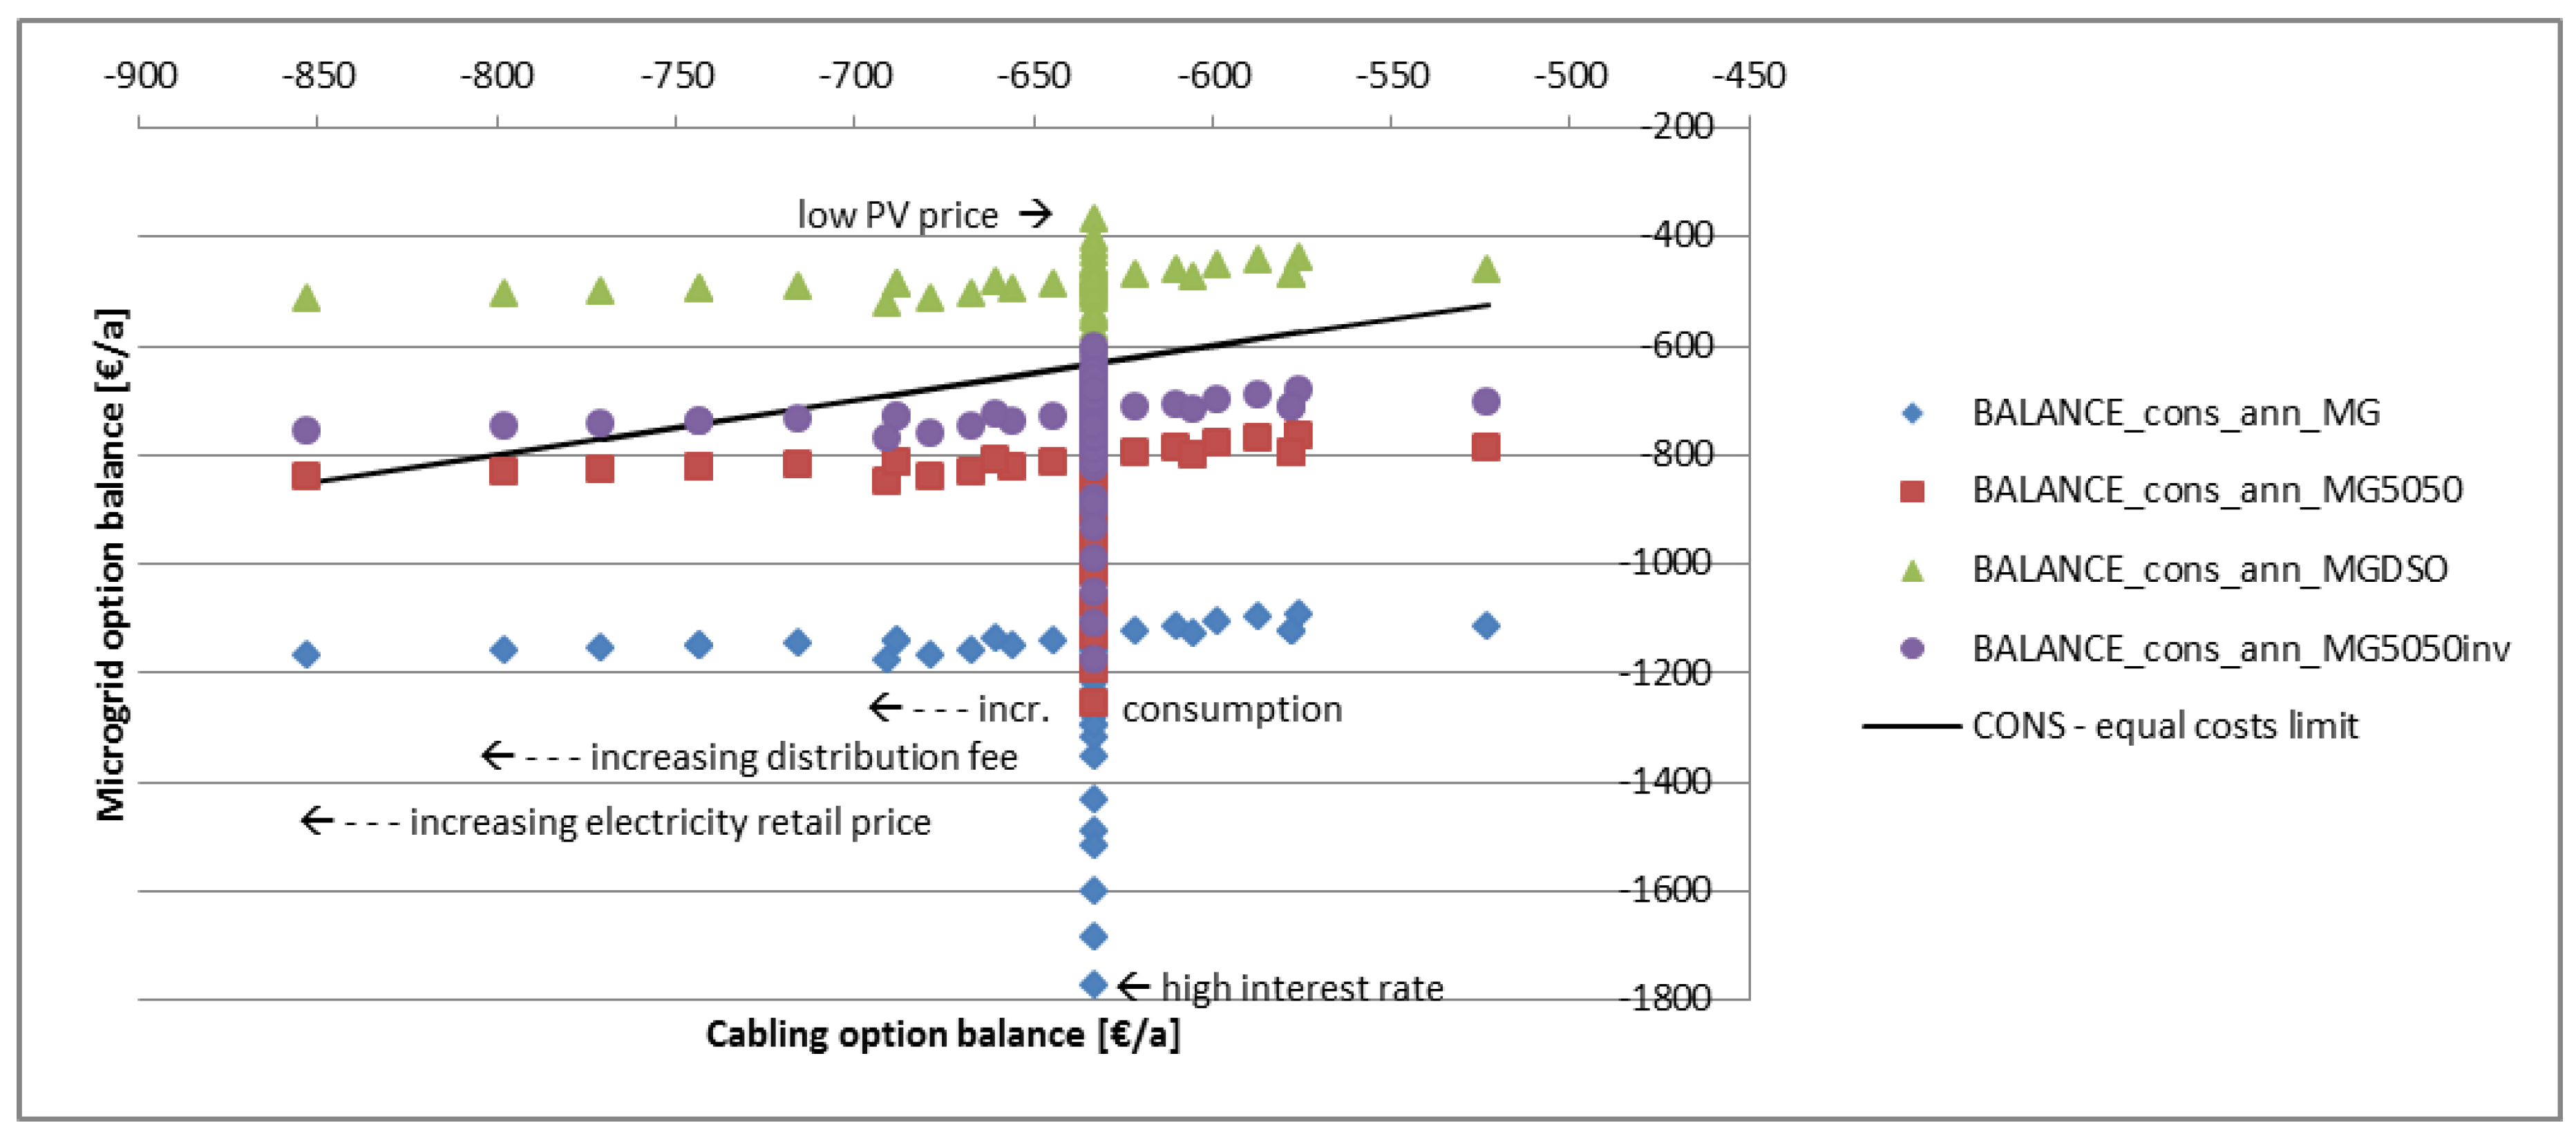
Figure 9.
The cabling option and microgrid option consumer/microgrid owner cost comparison with the varied parameter values considering different cost-sharing strategies of the microgrid investments. The black line represents the equal cost limit, i.e., when the cabling costs and microgrid costs would be equal. BALANCE_dso_ann_MG, BALANCE_dso_ann_MG5050, BALANCE_dso_ann_MGDSO and BALANCE_dso_ann_MG5050inv refer to prosumer 100% ownership, prosumer/DSO 50/50% ownership, DSO 100% ownership and prosumer/DSO 50/50% investment respectively.
© 2018 by the authors. Licensee MDPI, Basel, Switzerland. This article is an open access article distributed under the terms and conditions of the Creative Commons Attribution (CC BY) license (http://creativecommons.org/licenses/by/4.0/).


