Daylight Spectrum Index: A New Metric to Assess the Affinity of Light Sources with Daylighting


Instituto Universitario de Arquitectura y Ciencias de la Construcción, Universidad de Sevilla, 41001 Sevilla, Spain
*
Author to whom correspondence should be addressed.
Energies 2018, 11(10), 2545; https://doi.org/10.3390/en11102545
Submission received: 3 September 2018
/
Revised: 19 September 2018
/
Accepted: 20 September 2018
/
Published: 24 September 2018
Abstract
:The current scenario of colorimetry shows a wide variety of different metrics which do not converge in the assessment of the color rendering of light sources. The limitations of the Color Rendering Index have promoted the emergence of new metrics, such as the Color Quality Scale. As in the case of the previous metric, these new concepts are based on the analysis of the deviation of different color samples in a color space, contrasting the results with those obtained with a light source reference, which can vary depending on the color temperature. Within this context, the Daylight Spectrum Index is proposed. This new concept aims to determine the affinity with daylighting of electric light sources, comparing the resulting spectral power distributions of the lamps studied and that observed under natural light. The affinity of an electric light source with daylighting allows for lower energy consumption due to the better performance of human vision. The new metric proposed is evaluated following the results obtained from 80 surveys, demonstrating the usefulness of this new concept in the quantification of color rendering of LED lamps and the affinity of electric light sources with daylighting.
1. Introduction and Objectives
1.1. State of the Art
Nowadays, cutting-edge technology in electric lighting is promoting new metrics for the assessment of the color rendering of light sources currently used. LED lamps, with a wide presence in the market today, produce a different spectral distribution and color perception compared to the older incandescent and halogen luminaires, prompting a need for the proper assessment of these new lamps [1].
However, at present, the Color Rendering Index (CRI) is the only metric widely used to determine the hue performance of electric light sources. This definition, proposed in 1974 and recognized by the Commission Internationale de l’Eclairage (CIE) [2], came about as a procedure for quantifying the color perception produced by fluorescent lamps. Its calculation is articulated around the assessment of eight low saturated color samples in the CIE diagram 1960 u,v. A light source reference with a theoretically perfect rendering is used to select the samples which are subsequently compared with those observed for the case of a studied lamp. The deviation of these samples in the color space determines the quantification of this metric. However, some deficiencies can be noted in the CRI calculation procedure, mostly the nonuniform color distribution of the color space [3], the limitations of the color sample [4], and the selection of the light source reference [5].
Taking the previous scenario into consideration, the CRI metric was reaffirmed in 1995 and subsequently updated in 1999, including six new illuminants [6]. However, despite improvements in this definition, the scientific community was not fully satisfied with the results obtained with CRI and new metrics were developed to evaluate color rendering.
In an attempt to improve the understanding of color perception provided by light sources, Rea et al. defined the Gamut Area Index (GAI) [7], which can be determined as the ratio between the areas bounded by the color samples of CRI for the light source studied and a reference. The authors concluded that GAI predicts a better color discrimination on the Farnsworth-Munsell 100 Hue Test than CRI [8].
In order to achieve an accurate calculation of color rendering for LED lamps, the Color Quality Scale (CQS) was proposed [9]. This metric established 15 new color samples—with a higher saturation than in CRI—an updated color space, and a new chromatic adaptation to CMCCAT2000.
Subsequently, Smet et al. proposed a redefinition of CRI called CRI2012 [10]- based on 210 real reflectance samples and on the colorimetric color difference model CRI-CAM02UCS [11]. Although CRI2012 is still based on a color space, the results of this metric are more accurate than in the original definition.
One of the most up-to-date methods is TM-30-15, developed by the Illuminating Engineering Society of North America (IESNA) [12]. This procedure analyzes 99 color samples and uses a continuous illuminant reference depending on the color temperature of the light source studied. At present, IESNA is encouraging the widespread use of this new metric among luminaire manufacturers [13]. Based on this metric, the CIE developed the Color Fidelity Index in 2017 (Rf) [14] to improve the results provided by CRI. This new concept does not address the need for color quality measures relating to perception other than fidelity, although it incorporates most of the improvements proposed by TM-30-15.
Chromatic preference can vary depending on context, and the assessment of the color rendering can therefore be affected by the boundary conditions [15]. In keeping with this, Schanda et al. [16] studied the color fidelity for a picture gallery and finally selected a multilight-emitting diode for this particular case study. Most recently, Lin et al. [17] analyzed the color preference in a restaurant, a retail display, and a supermarket, obtaining different results in each case study. Other studies, such as that by Hegde et al. [18], demonstrate that the saturation of colors also varies depending on the age of the observer.
The best method to determine the accuracy of color rendering metrics relies on the analysis of surveys. Houser et al. [19] analyzed 40 surveys to ascertain whiteness perception under different LED lamps. Jost-Boissard et al. [20] assessed the color quality of LED lamps, analyzing 9 warm light sources using 45 surveys and 8 cool luminaires based on the results of 36 observers. Dangol et al. [21] investigated the performance of CRI, CQS, and CRI2012, evaluating 20 surveys relating to 3 LED lamps with different color temperatures. The authors concluded that the three metrics had a high correlation with a noticeable difference in color temperature. Moreover, Chen et al. [22] demonstrated eight kinds of optimal white OLEDs spectra using a similar methodology. Gu et al. [23] analyzed different metrics using 10 surveys, concluding that the CAM02-UCS color space is one of the best for the assessment of the deviation of the color samples.
The color quality of the environment also affects circadian rhythm [24], which determines the cycles between alertness and sleepiness, and thus affects the health and wellbeing of individuals [25]. Therefore, color rendering is also crucial to our health and performance.
As deduced from this introduction, colorimetry definitions are constantly being updated, which means there are no solid, unified criteria regarding the color rendering of a light source. In addition, most of the new metrics attempting to quantify the color performance of a light source are based on a color space chart, which always depends on a subjective interpretation of the color distribution [26]. However, color rendering can also be determined analyzing the spectral power distribution (SPD) [27], which describes the power per unit wavelength of a light source, or using the subjective analysis of the color of familiar objects [28], such as the Memory Color Quality Index (Rm).
Finally, it must be highlighted that daylighting represents a perfect color rendering of our environment [29] and could be considered as a suitable reference to determine the color rendition of a light source.
1.2. Aim and Objectives
The aim of this study is to assess a new metric which serves to quantify the affinity of electric light sources to daylighting. This new concept can be particularly interesting in those contexts where color perception must be close to that observed under natural light conditions, such as clothing stores, car dealers, galleries, or textile factories [30].
The new metric is based on a sole light source reference, regardless of the color temperature of the light source studied. This sole reference is daylighting, as its color rendering can be considered perfect [31,32,33]. Therefore, the calculation of this new concept relies on the comparison of the perceived spectral distributions provided both by daylighting and by the studied light source.
Accordingly, the Daylight Spectrum Index is defined [34] in order to provide an objective definition to assess the affinity of the electric light source with the natural light. This new concept can serve to complement other current procedures, such as TM-30-15 or CIE 2017 [12,13], giving information about the fidelity of the studied light source with respect to daylighting.
Once the new metric is determined, its accuracy is evaluated using a light source testing box. Although this methodology is similar to those proposed by other authors [8,28], it offers new nuances that highlight the innovative aspects of this study, as detailed below:
- Both the color rendering and the affinity to daylighting are assessed by means of the results observed in the surveys as well as the color saturation of the samples.
- The new metric is contrasted with the results obtained using other color rendering metrics, such as the Color Rendering Index, the Color Quality Scale, the Gamut Area, and TM-30-15.
2. Calculation Procedure of Daylight Spectrum Index
2.1. Metric Definition
The Daylight Spectrum Index (DSI) is defined as the ratio of the area bounded by the color perception of the SPD of a light source studied and that which is limited by daylight. In other words, the DSI represents the affinity of the light source perception to daylight according to its spectral distribution.
2.2. Calculation Procedure
2.2.1. Definition of Daylight Spectral Distribution
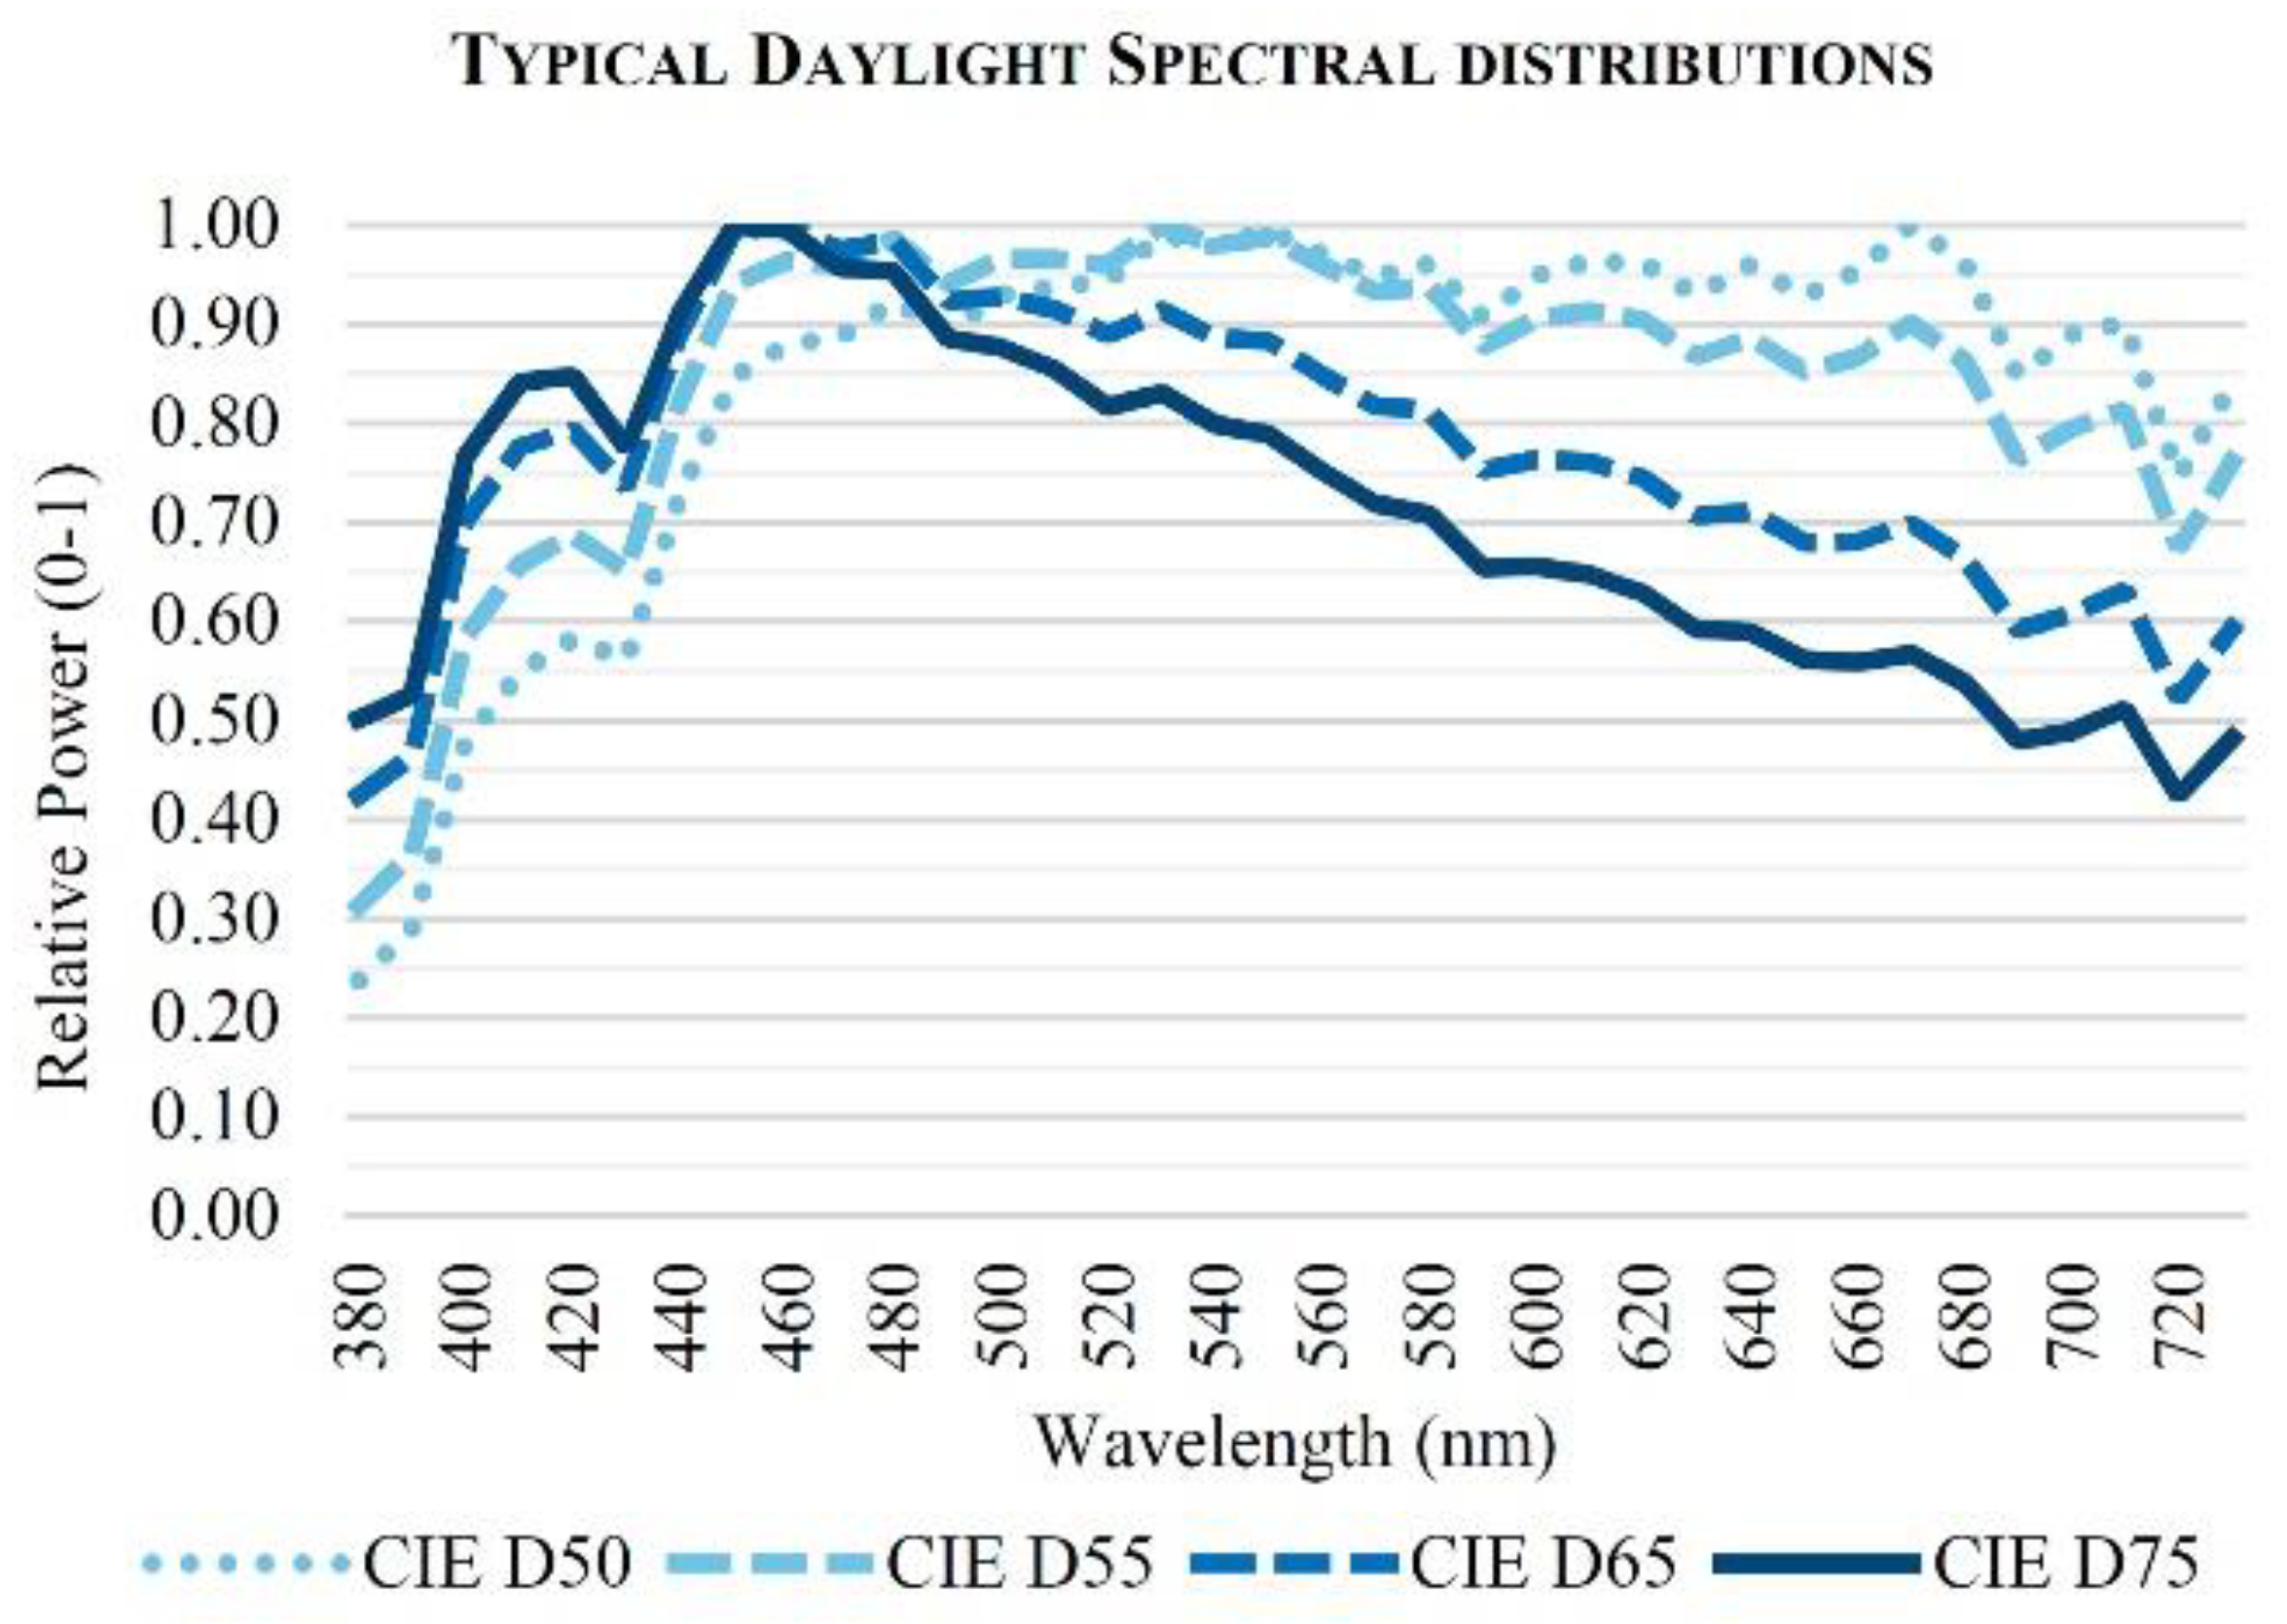
Sky conditions are key in establishing a suitable reference to assess the color rendering of a light source. The typical sky conditions for calculating the DSI correspond to CIE D65 [35], considered the most common daylight spectrum for Northern Europe. However, it must be recognized that the boundary conditions can affect the color perception of our context, and therefore, the spectral distribution of the sky should be adjusted to the typical weather conditions of the location where the color rendering analysis is carried out. Accordingly, a study in a location with a predominant clear sky should choose an SPD close to CIE D75, while an assessment in an environment with a mainly cloudy sky must select a typical spectral distribution for an overcast sky, that is to say, CIE D50. Figure 1 shows the most frequent spectral distributions for daylighting.
2.2.2. Color Perception of the Sky
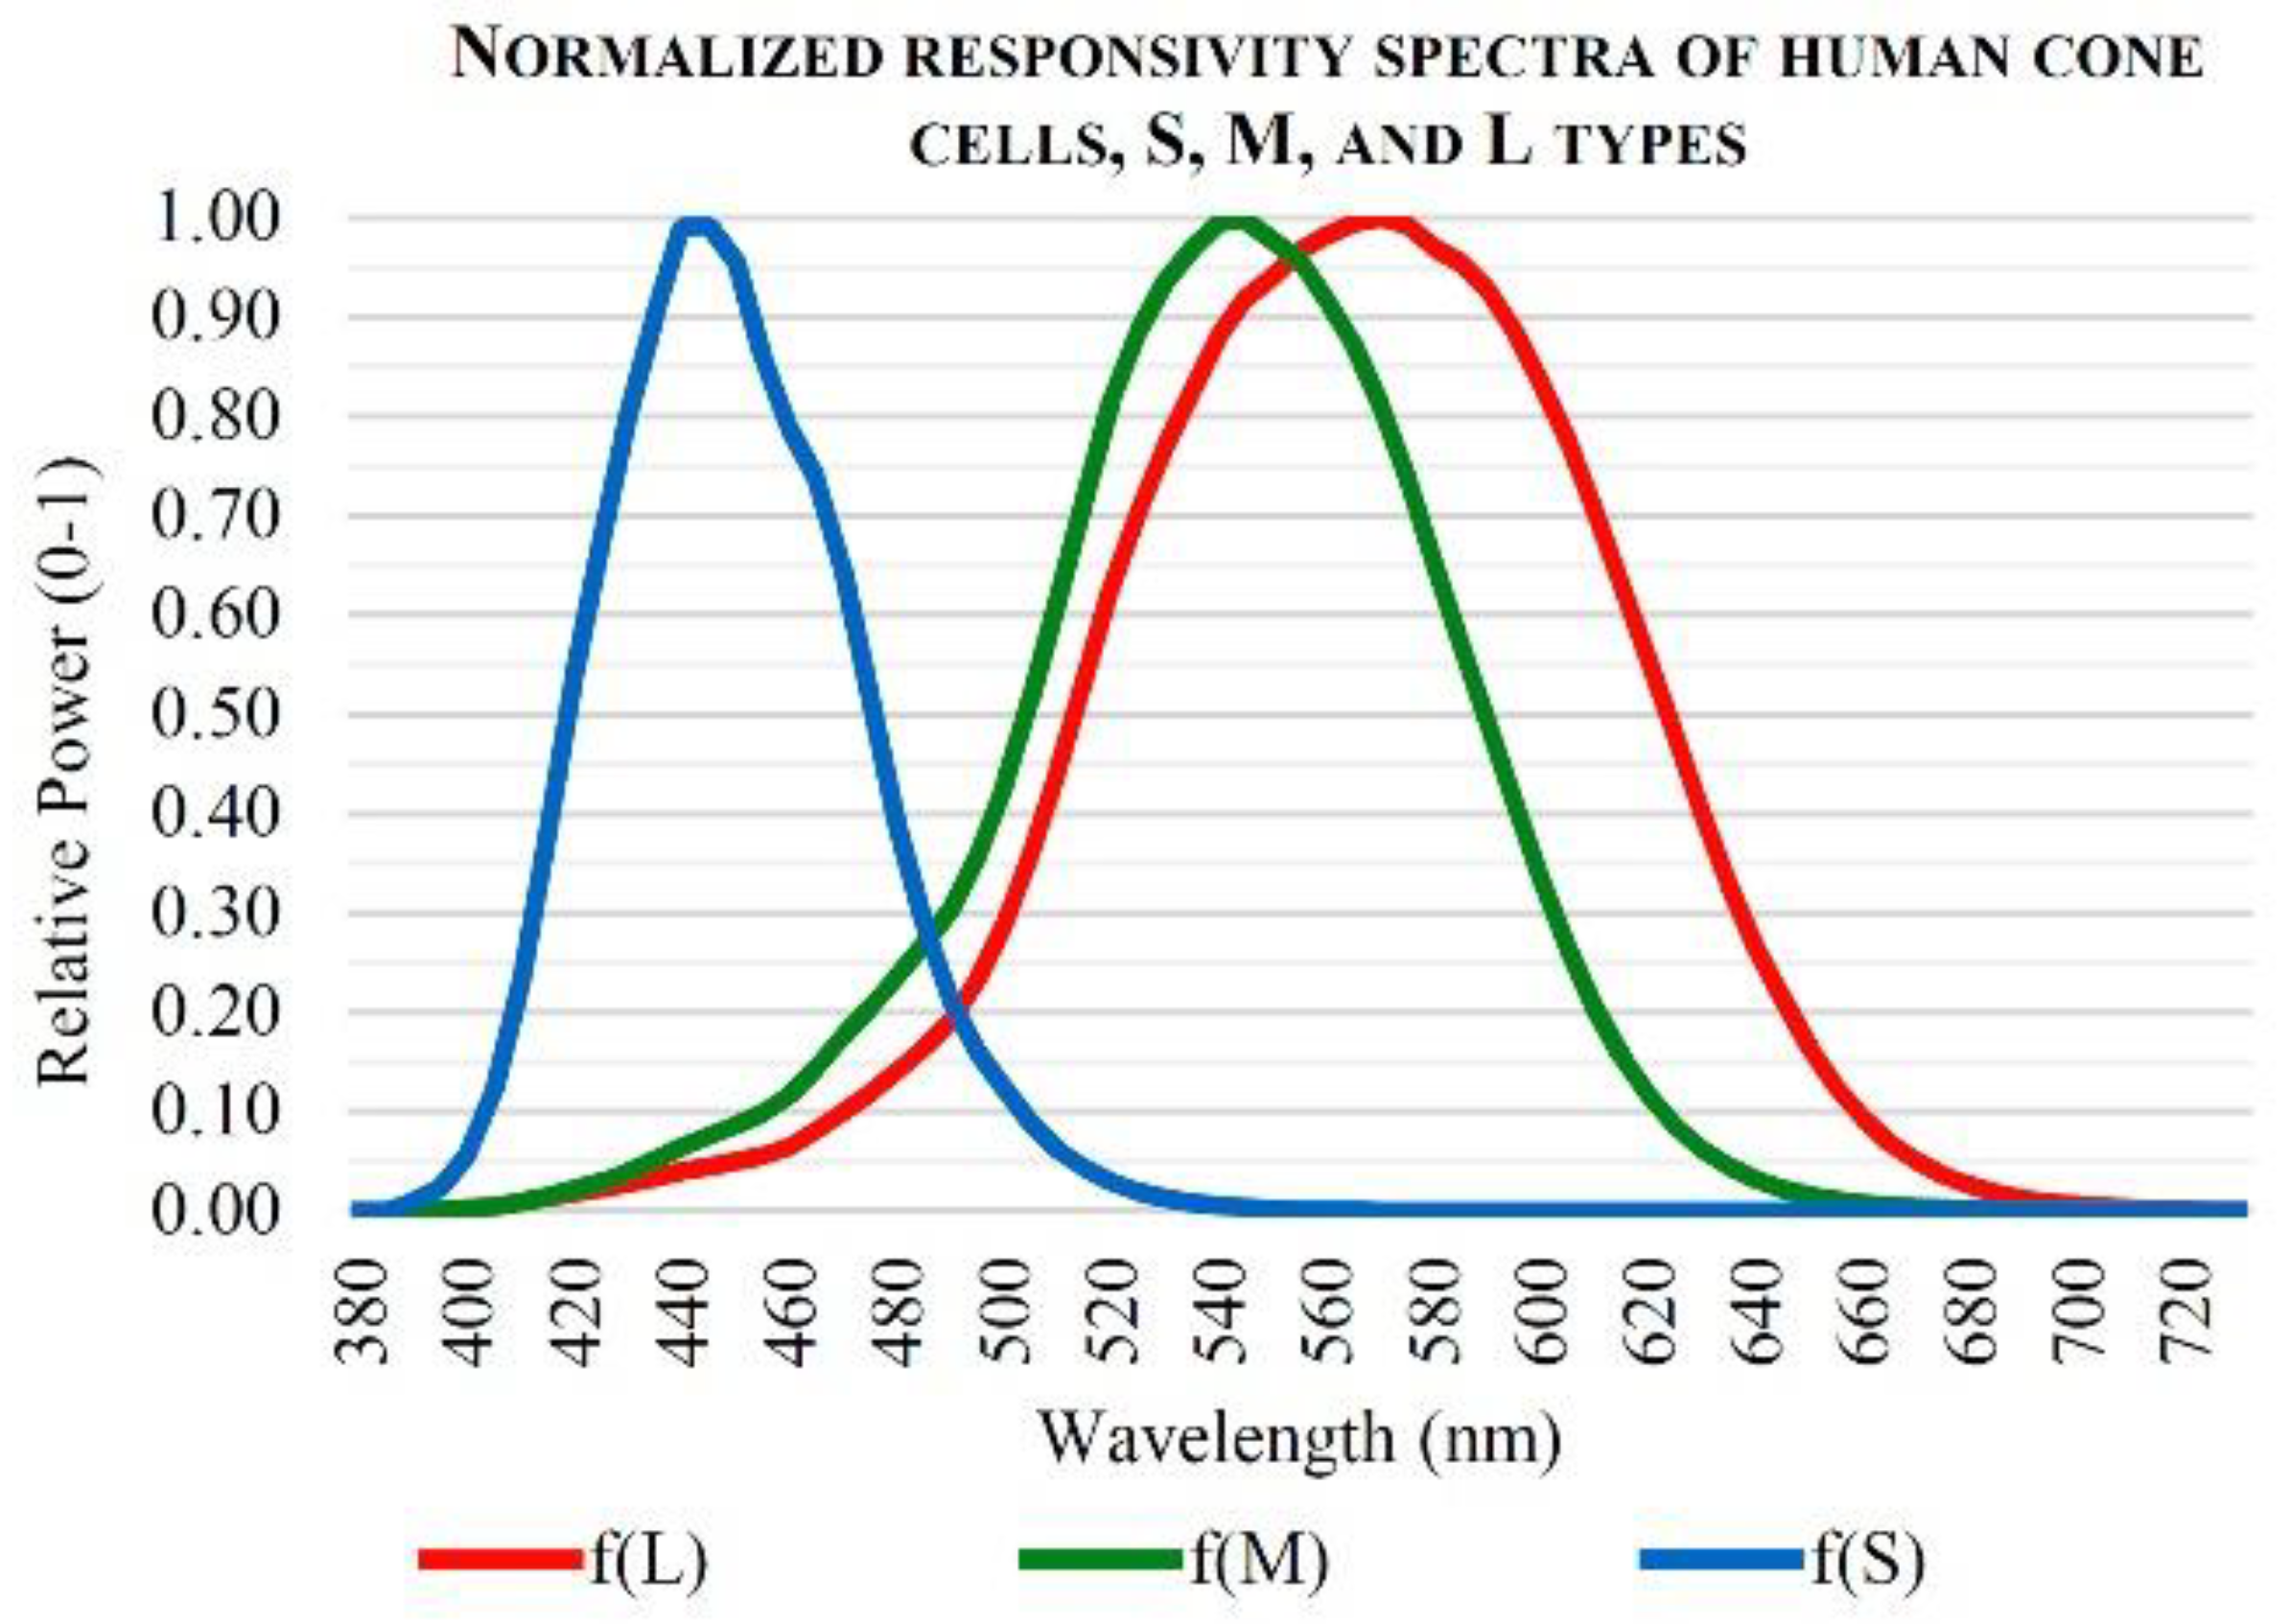
Once the suitable SPD for the sky conditions is selected, the color perception must be taken into account. The responsivity spectra of a human being for color perception is based on three cone cells, called long (L), medium (M), and short (S). The sensitivity functions of the cone photoreceptors are described in Figure 2 [36].
According to the degree of sensitivity of human color perception, the SPD of the selected sky conditions can be modified by the color functions, as expressed in Equations (1) to (3):
where f(L), f(M), and f(S) correspond to the color sensitivity functions and f(Sky) is equivalent to the SPD of the selected sky as a function of the wavelength.
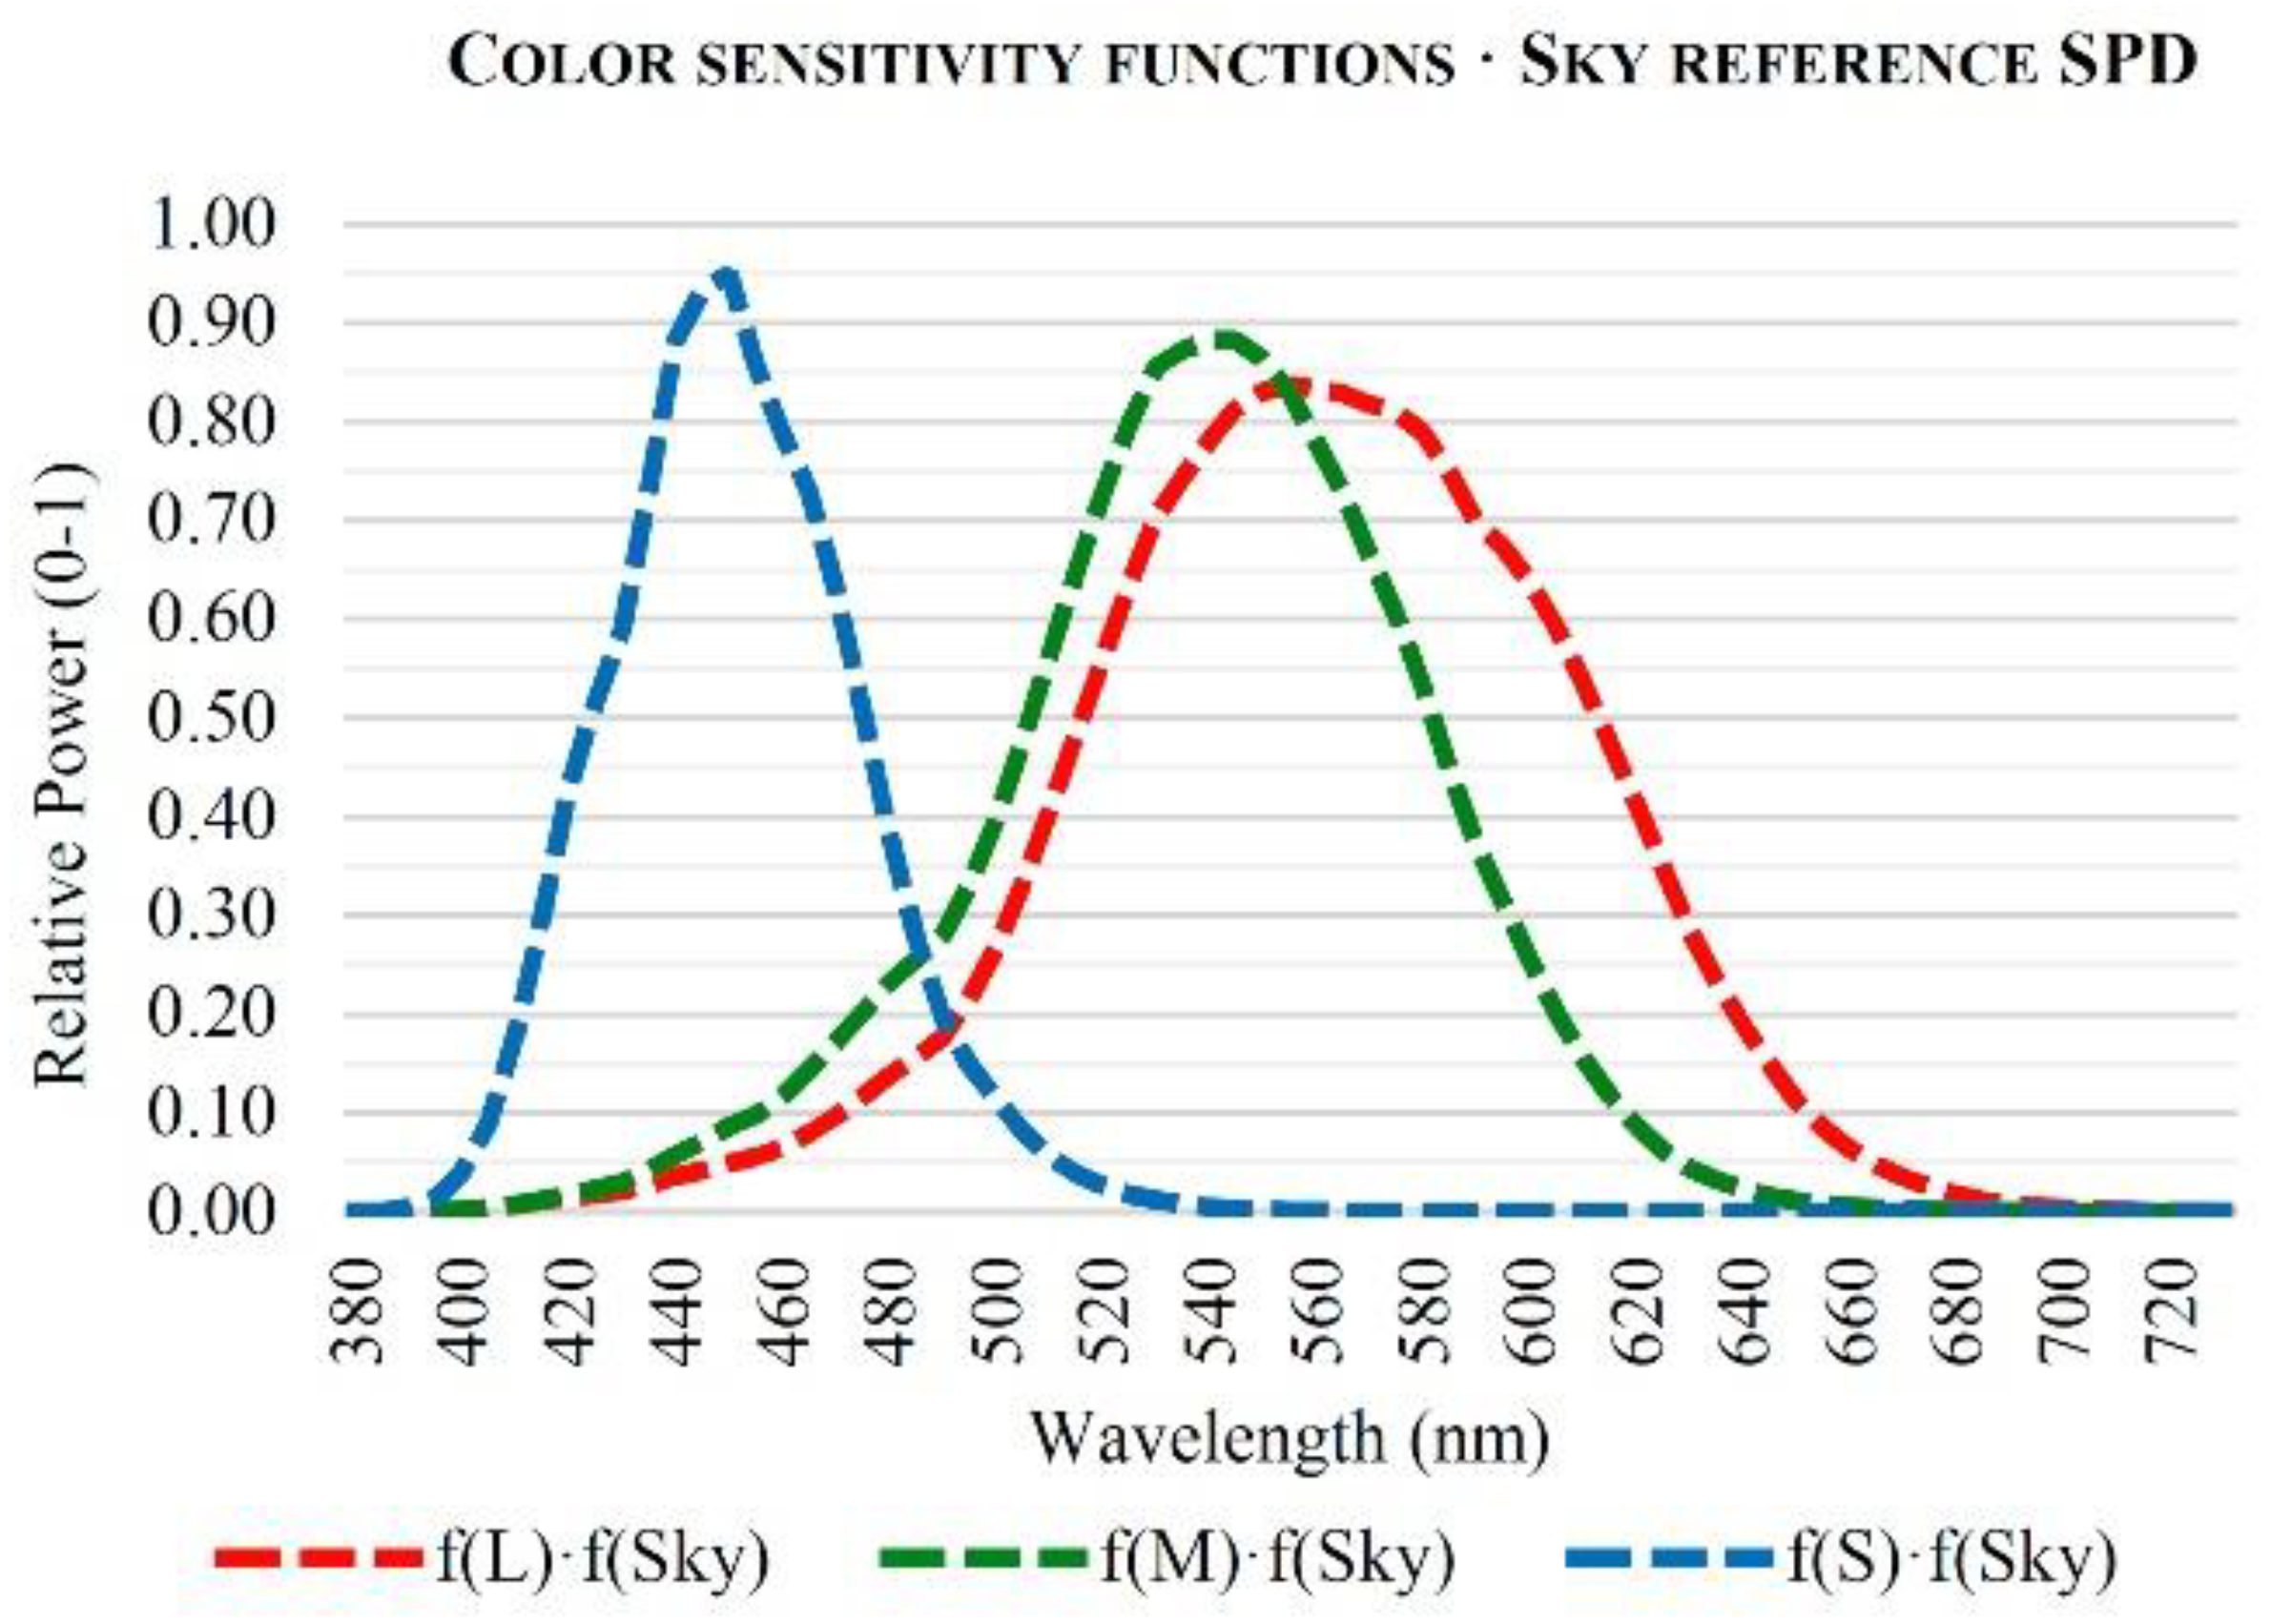
Figure 3 shows the SPD of the daylight conditions perceived by the human visual color system considering a typical daylight spectrum for Northern Europe, CIE D65. This spectral perception of natural light serves as a reference for the color rendering of the studied light source.
2.2.3. Normalization of the Resulting SPD of the Sky
After determining the human perception of the sky vault, the resulting function must be normalized. This normalization should be carried out as follows:
- The specific total perceived power (Ts) is calculated by the integration of the area under the resulting function.
- A scalar (P) is calculated according to the following Equation (4):where Ta represents an arbitrary value used to scale the results.
- Each value of the wavelength axis is multiplied by the scalar P in order to generate a normalized dataset.
The previous process can be expressed as seen in Equations (5) to (7):
where fD(L), fD(M), and fD(S) are the SPD of the sky modified by the color responsivity functions, as seen in Equations (1) to (3), and Ta is the arbitrary value used to scale the results.
This process helps determine a relative perception of daylighting, regardless of the luminance of the sky vault. Accordingly, the spectral distribution perceived from the light source studied can be compared with that defined by the daylight conditions, ignoring the difference of luminous flux.
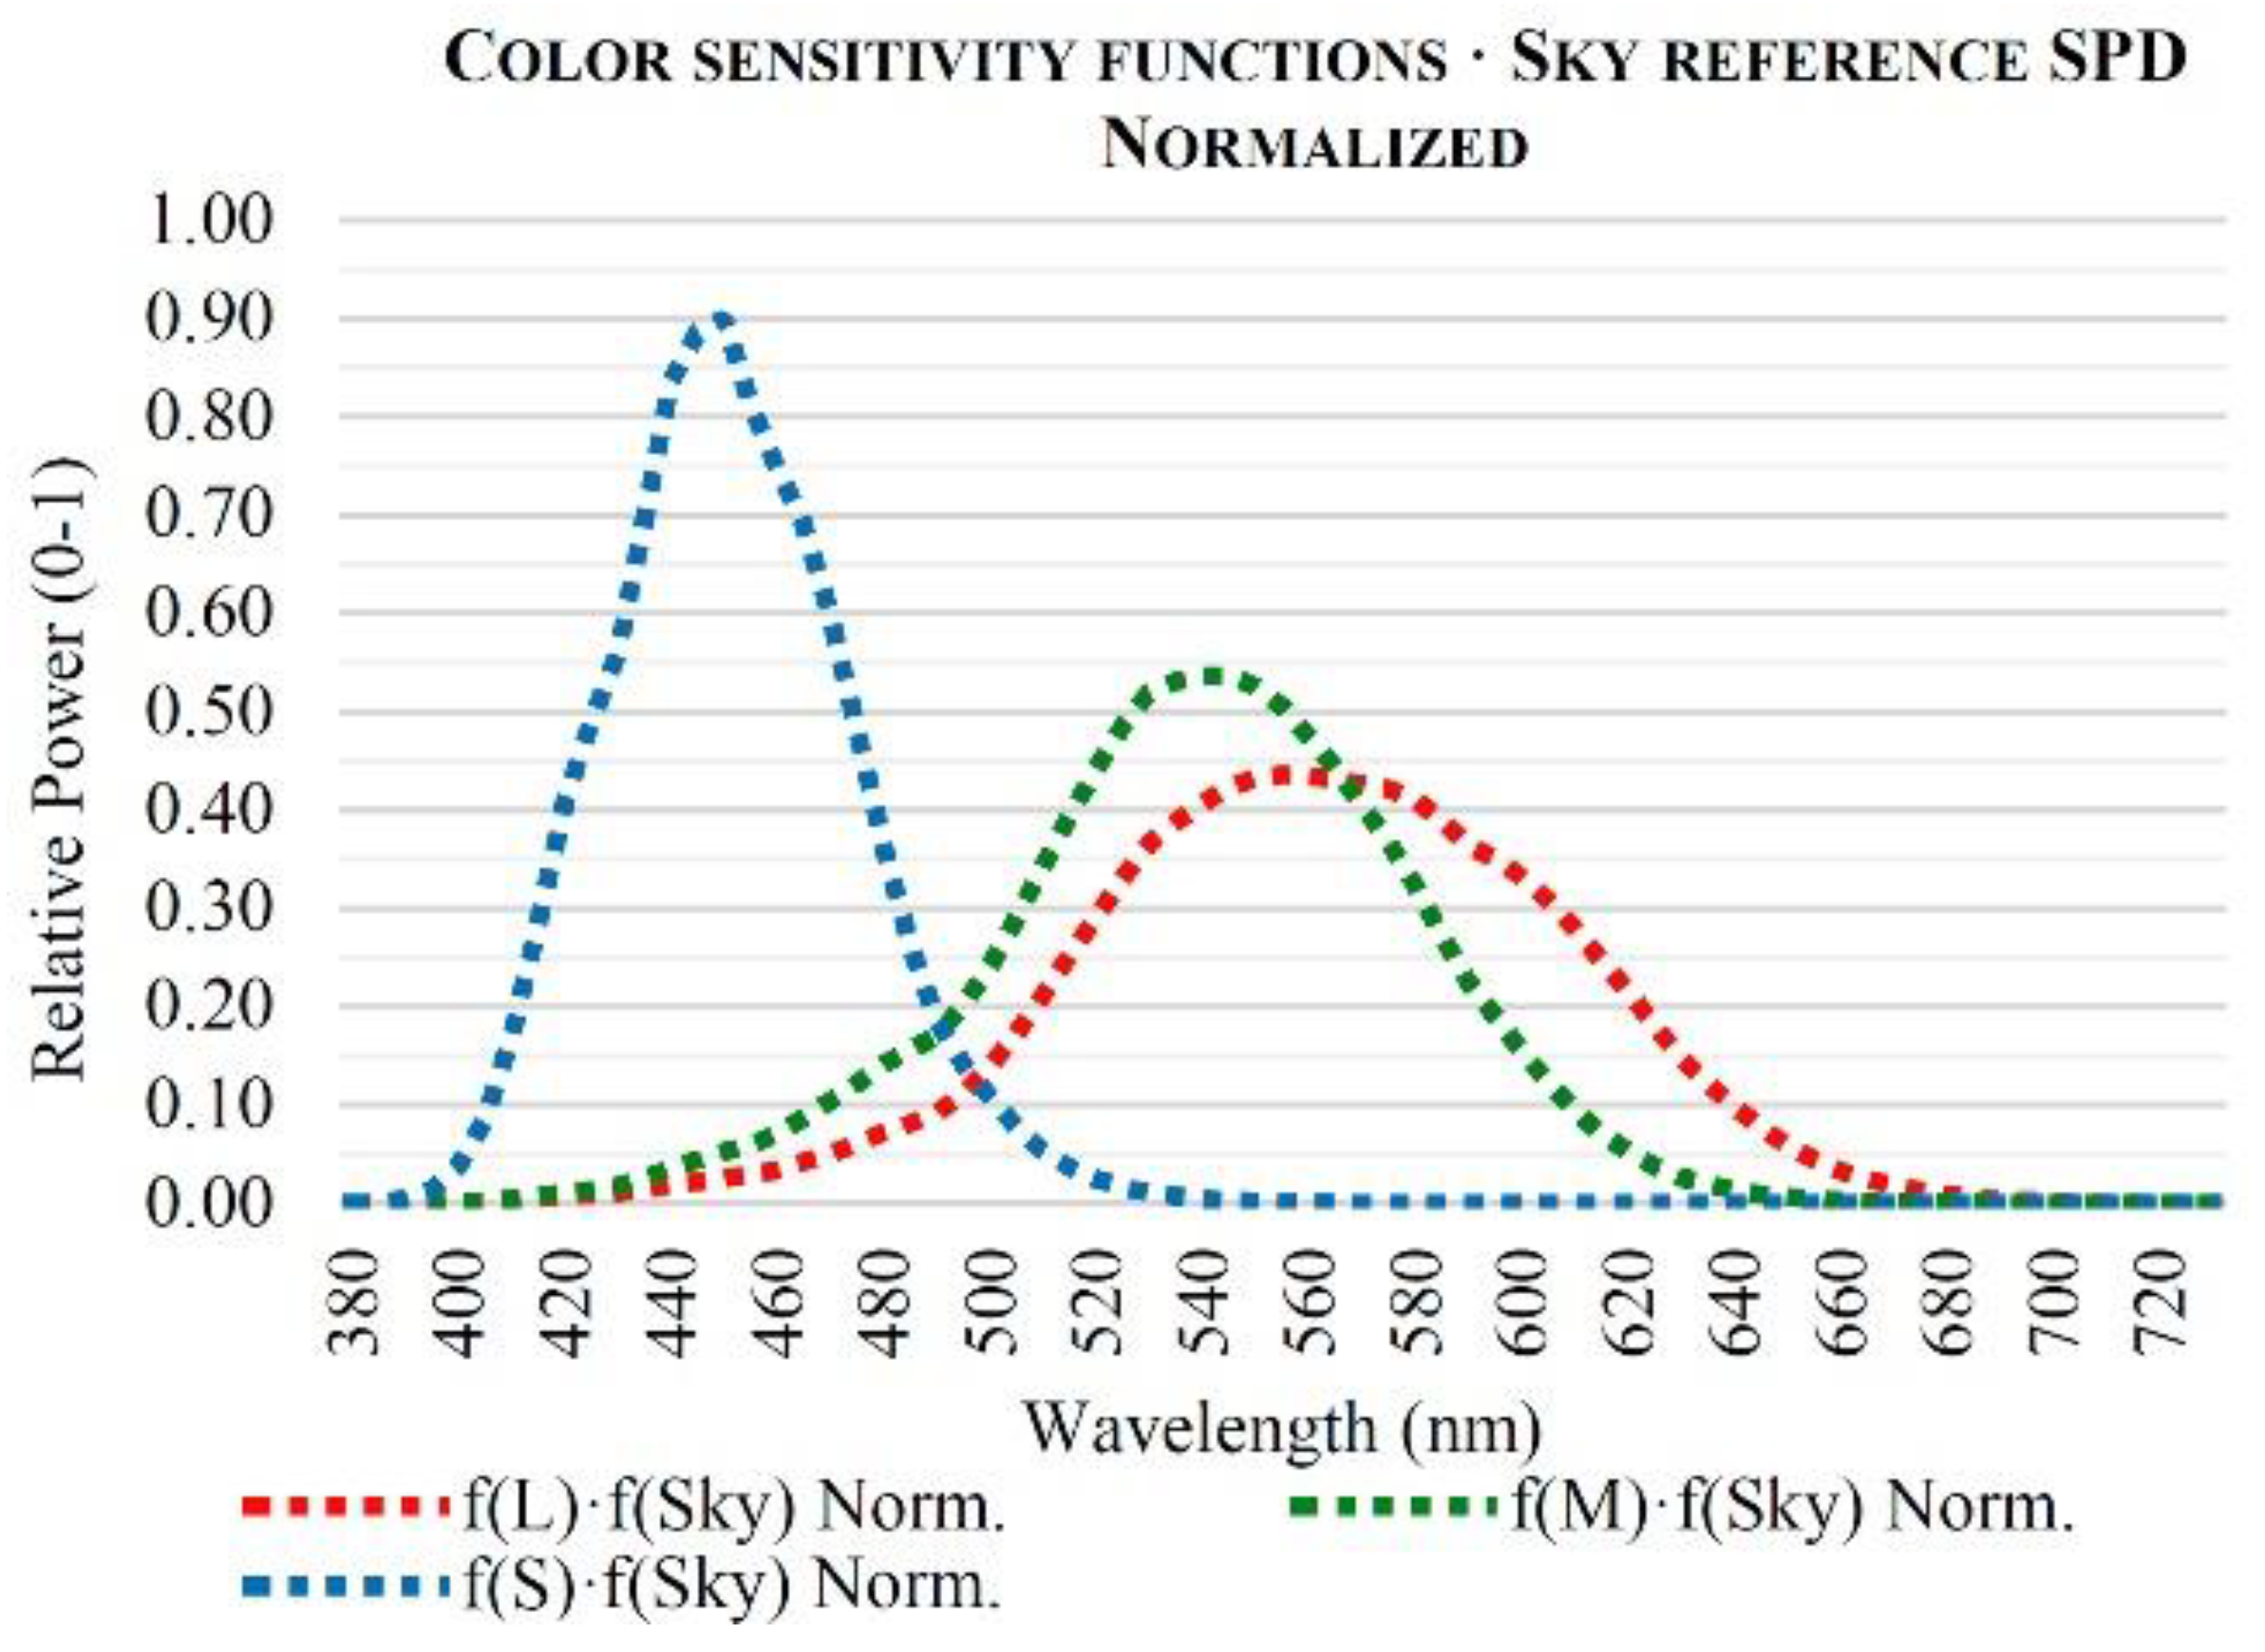
In accordance with Equations (5) to (7), Figure 4 shows the resulting SPD of the sky, modified by the color sensitivity functions and normalized for a scalar value of 10.
2.2.4. Color Perception of the Studied Light Source
As described in the previous procedure, the color perception of the light source studied can be defined in accordance with color functions, as seen in Equations (8) to (10):
where f(L), f(M), and f(S) correspond to the color sensitivity functions and f(Light) is equivalent to the SPD of the studied light source as a function of the wavelength.
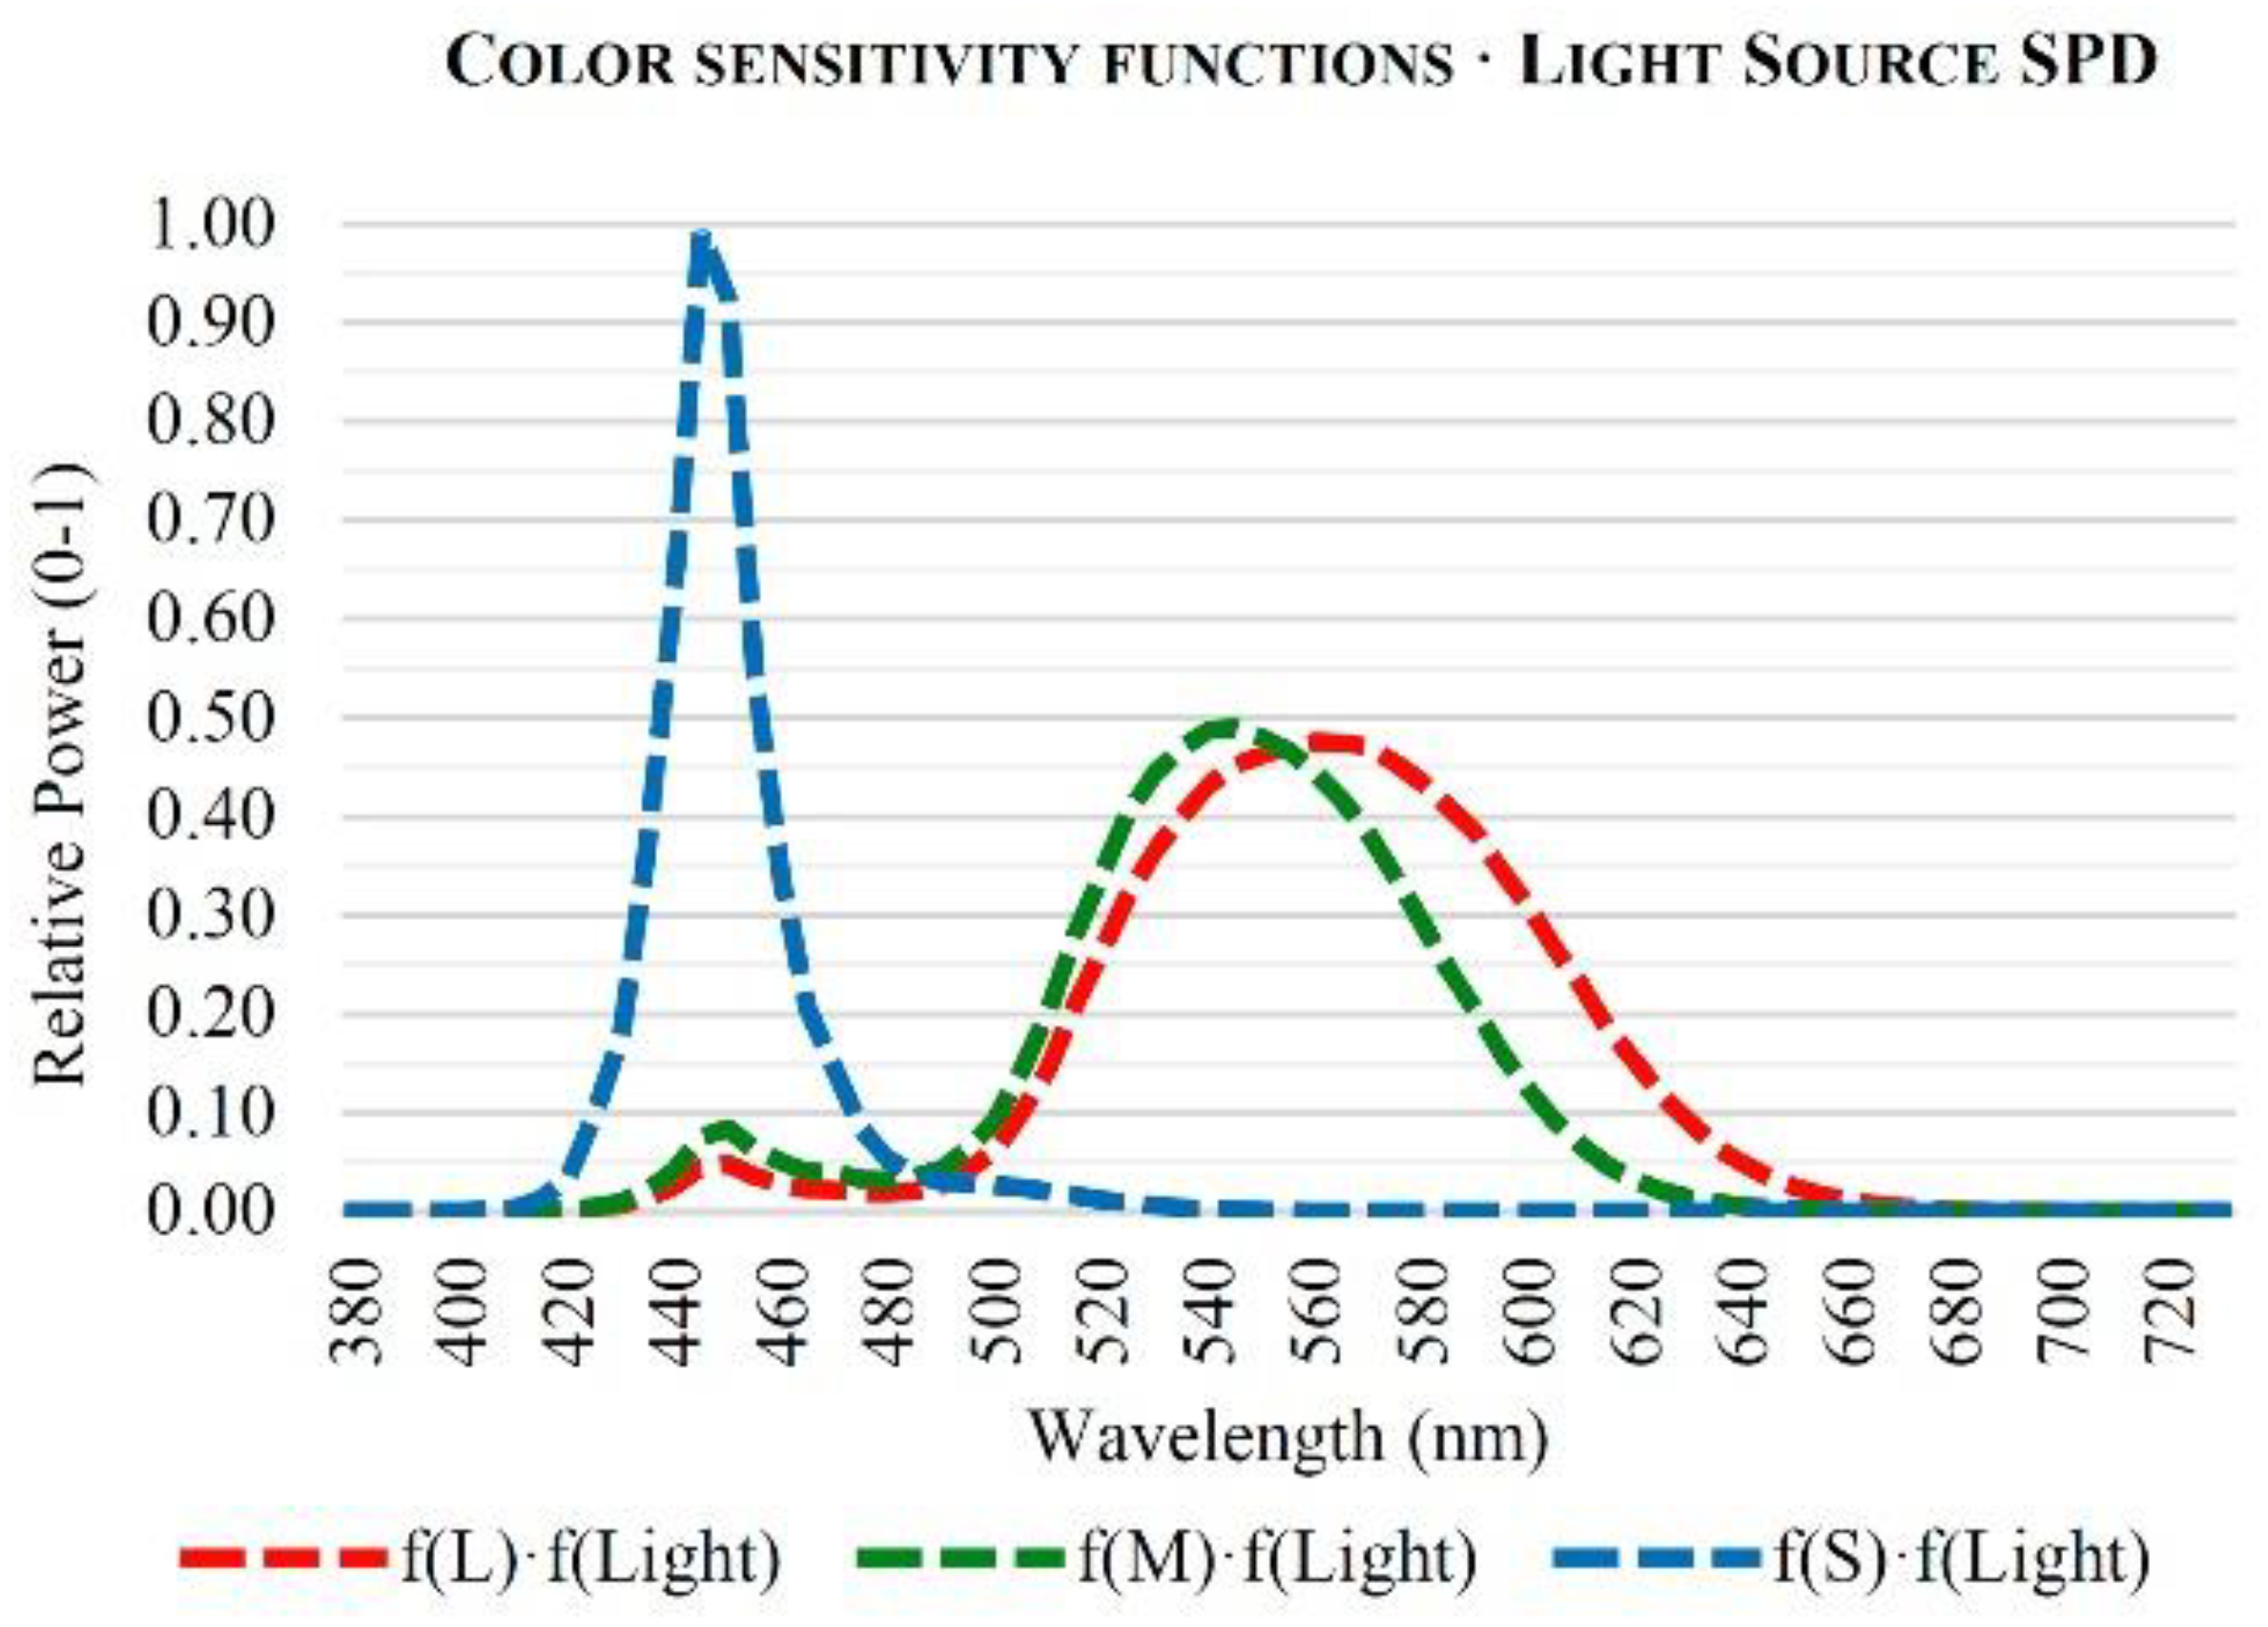
As an example, the color perception of the spectral distribution of an LED lamp, considering a correlated color temperature (CCT) of 6500 K, is shown in Figure 5.
2.2.5. Normalization of the Resulting SPD of the Studied Light Source
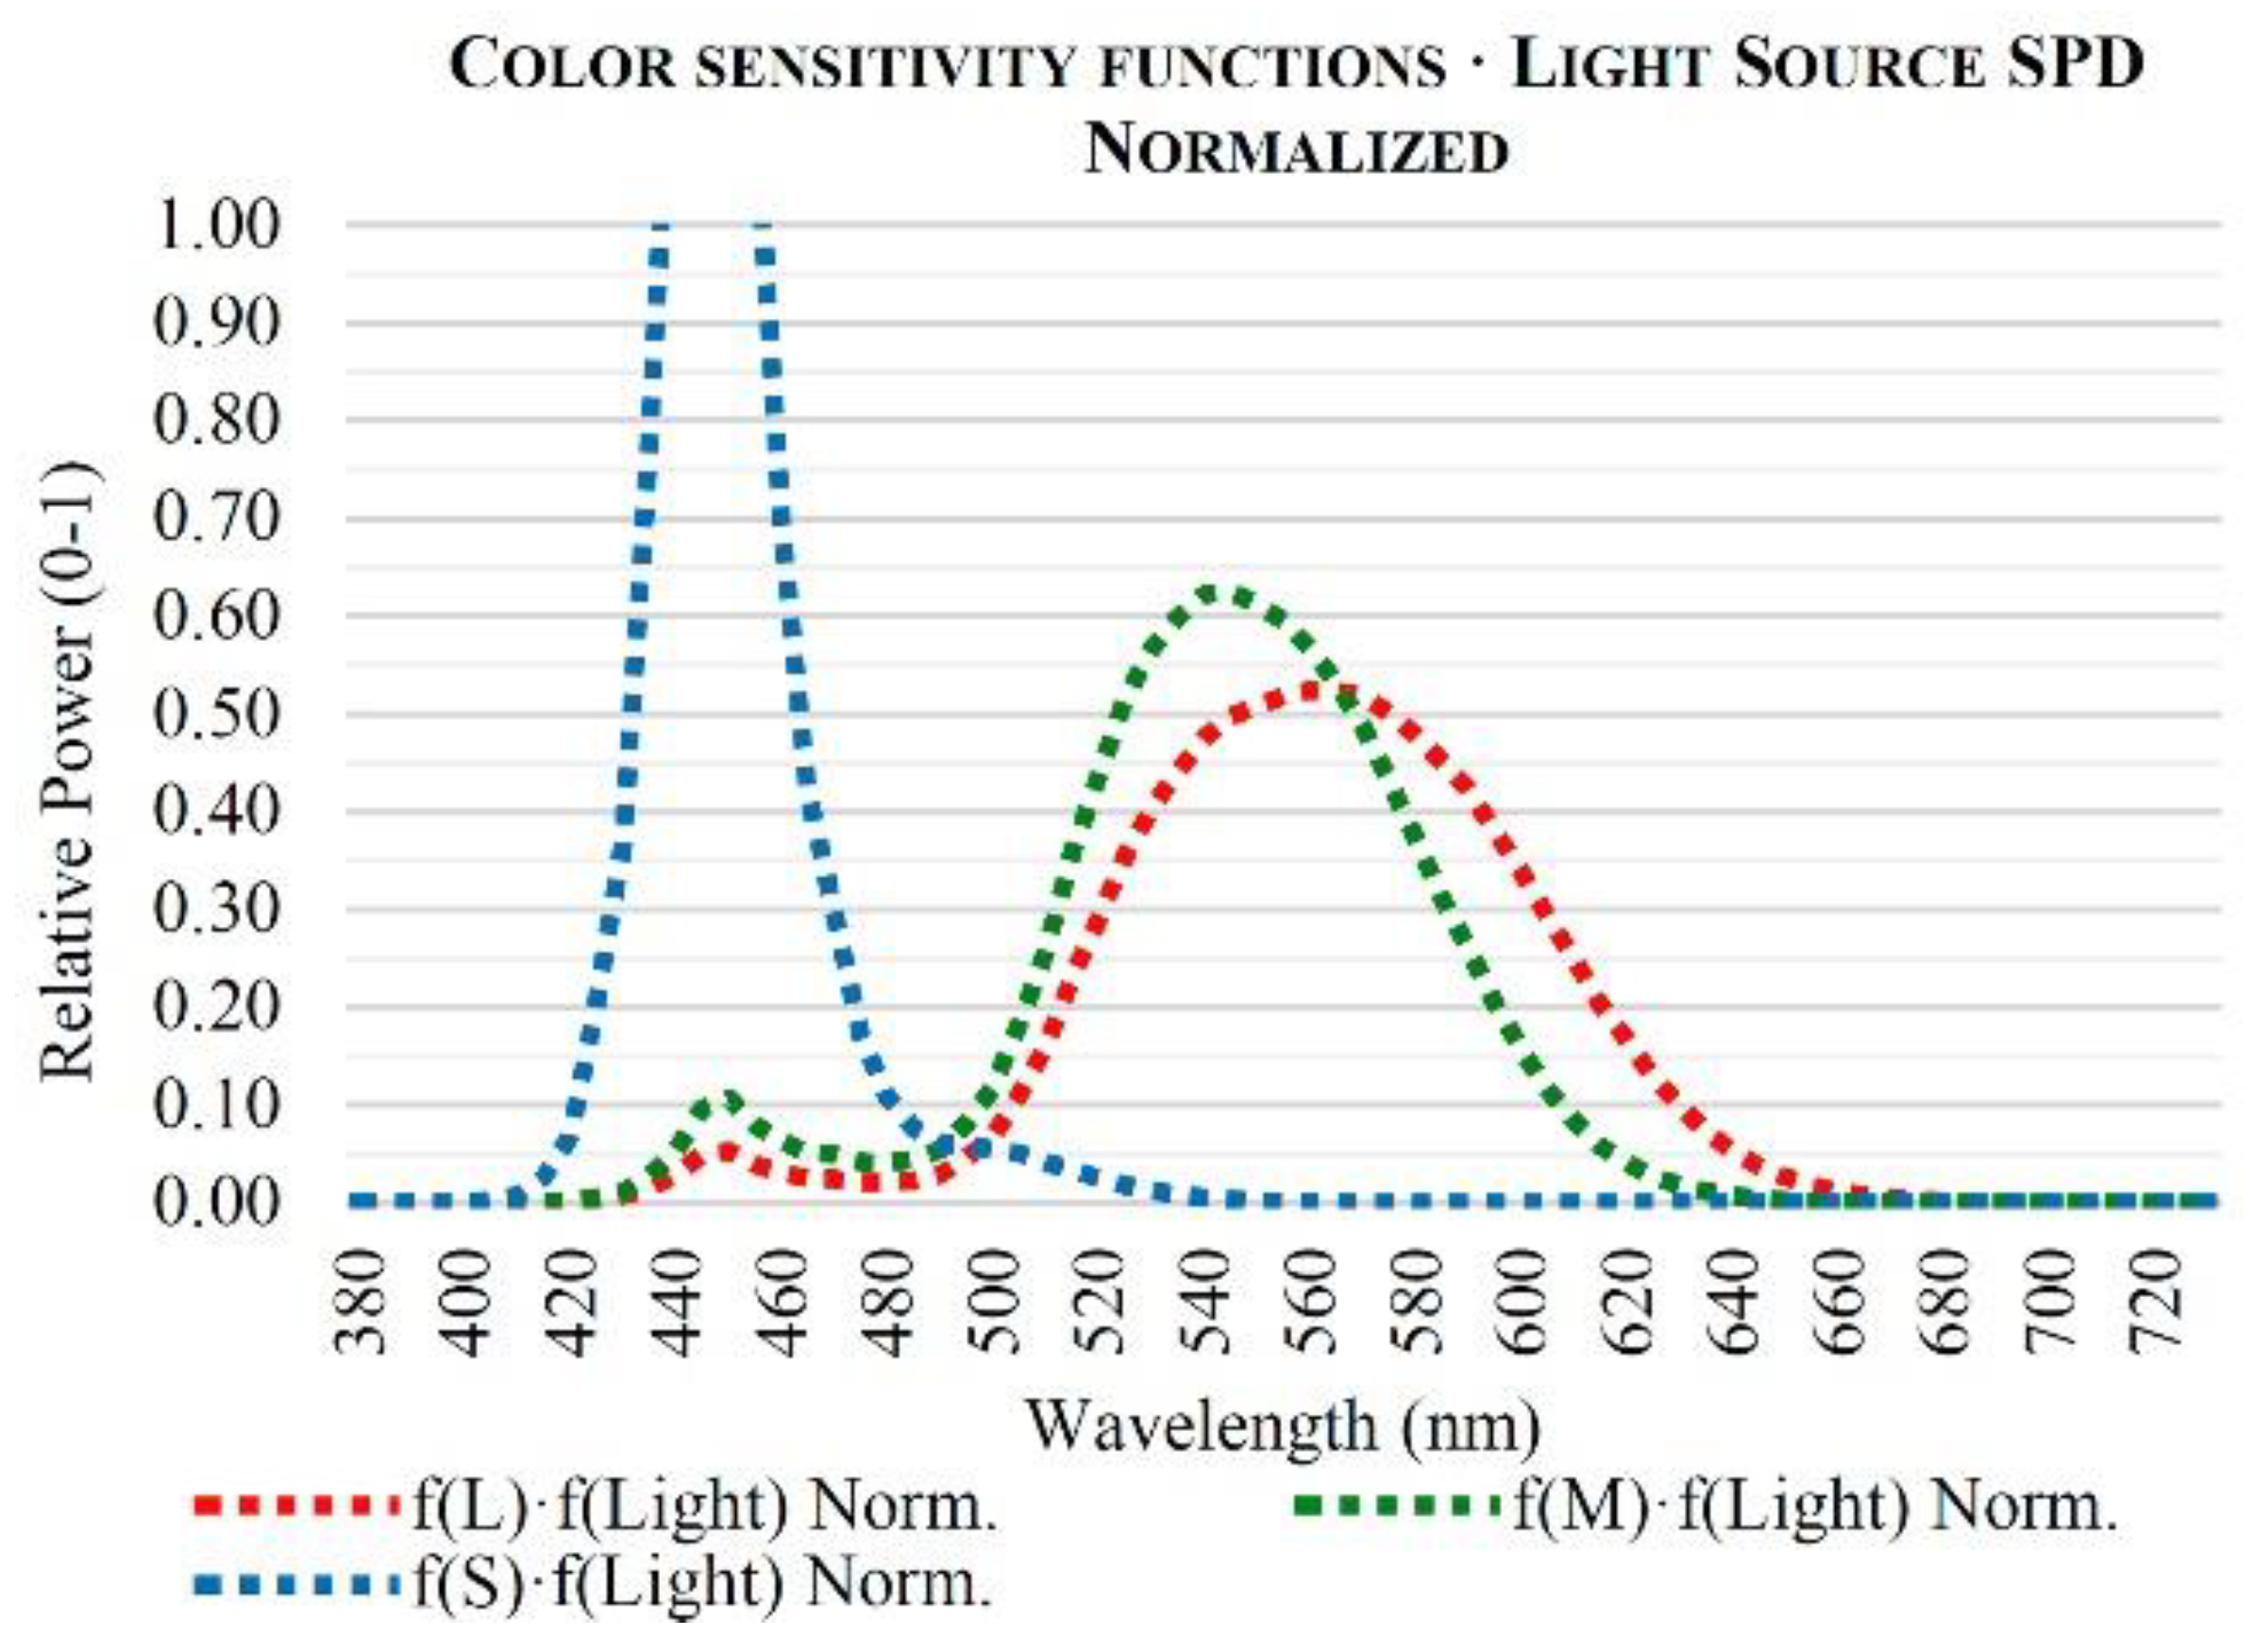
As described in the calculation process of daylight reference, the resulting SPD of the light source studied is normalized using the same scalar value as in the previous case and according to Equations (11) to (13):
where δ(L), δ(M), and δ(S) are the SPD of the light source studied multiplied by the color responsivity functions, as seen in Equations (8) to (10), and Ta is the scalar value defined in Equations (5) to (7).
As in the calculation process of the perceived daylight, Figure 6 shows the resulting SPD of the LED lamp analyzed, modified by the color sensitivity functions and normalized for the scalar value defined above.
2.2.6. Ratio of the Resulting Areas
As expressed before, the DSI is defined as the ratio of the normalized area bounded by the color perception of the SPD of a light source studied and that which is limited by daylight. This statement can be expressed as seen in Equations (14) to (16), depending on the color sensitivity functions described above:
where δN(L), δN(M), and δN(S) correspond to the normalized functions of the light source studied according to the color perception and fN(L), fN(M), and fN(S) are the same functions for the daylight reference.
As expressed in Equations (14) to (16), the color affinity of a light source with daylighting can be calculated depending on the color range defined by the cone photoreceptors. Therefore, DSIR determines the color affinity for red hues, while DSIG and DSIB conclude the similarity for green and blue hues, respectively.
The overall score for DSI can be defined as the average value between the results observed for each cone photoreceptor, that is to say, the mean value of Equations (14) to (16).
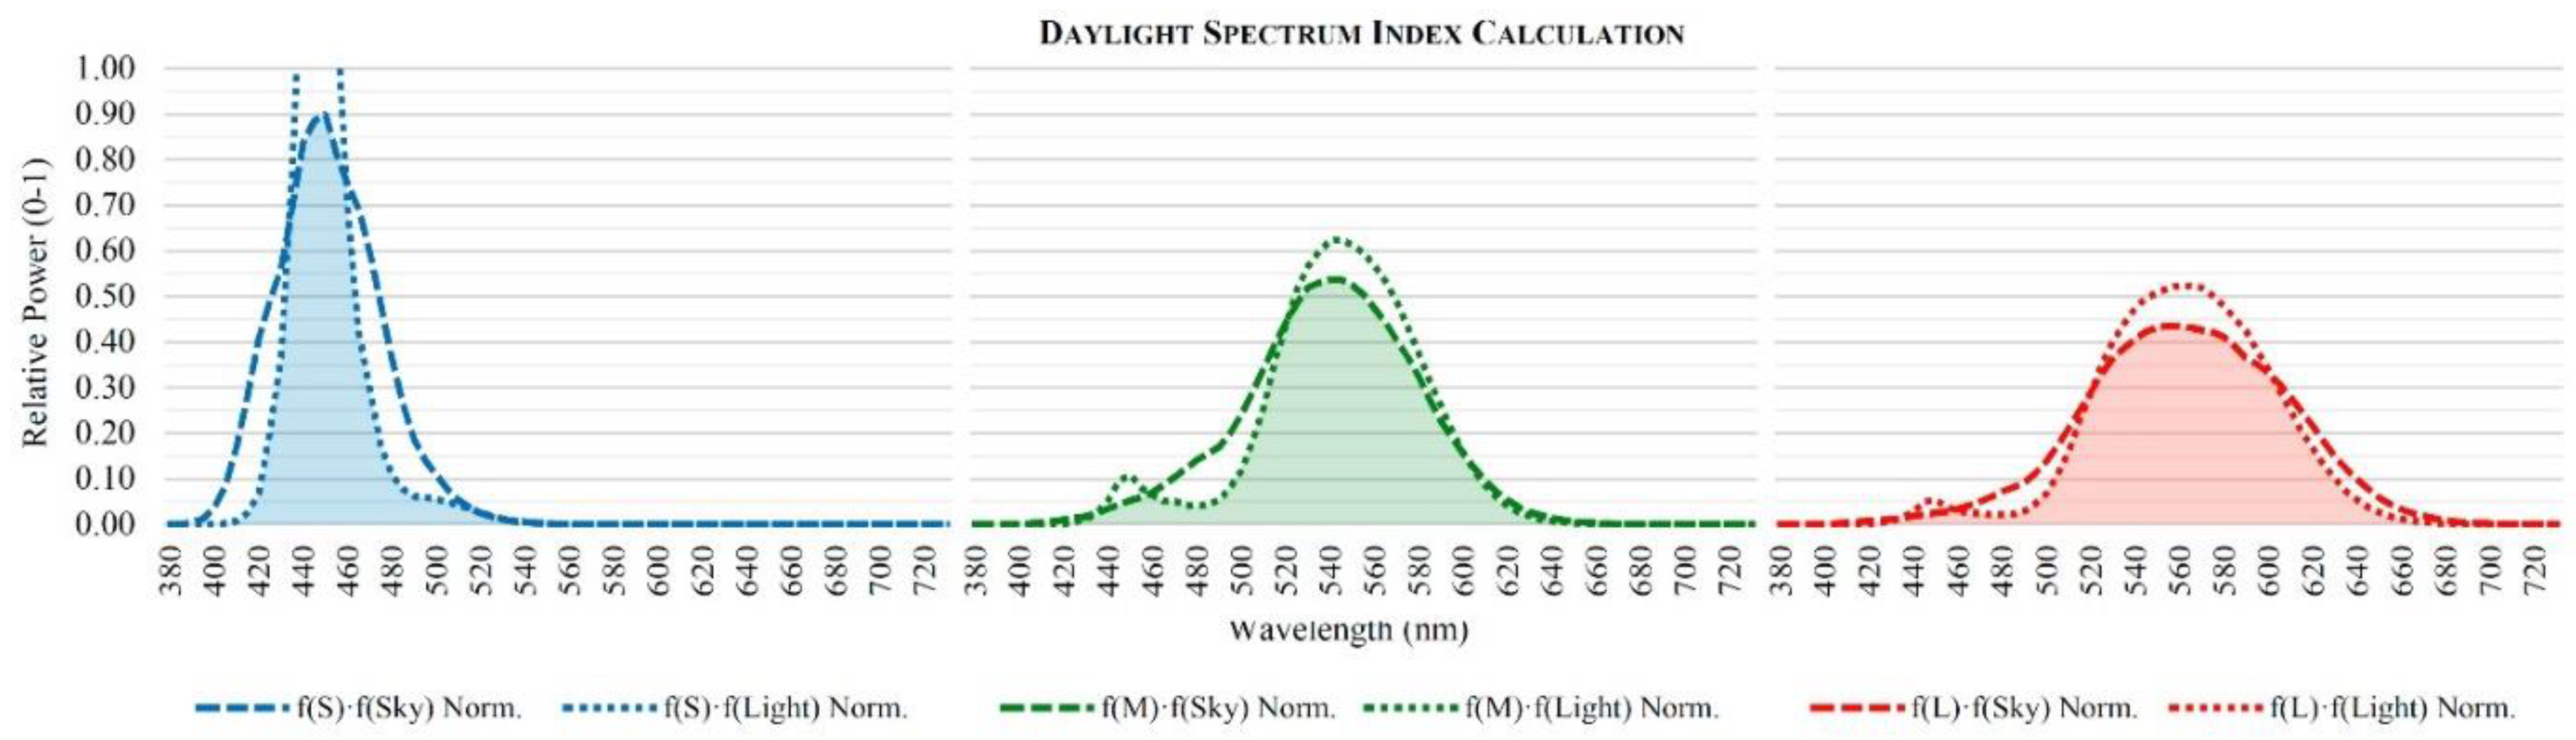
As deduced from Equations (14) to (16), the DSI for the analyzed LED lamp with a CCT of 6500 K in comparison with a daylight spectrum CIE D65 is shown in Figure 7, obtaining a DSI value equal to 83%, which corresponds to the area limited under both functions for each photoreceptor.
As can be deduced from the previous procedure, the calculation of DSI is a way to assess the affinity of a light source to the spectral distribution of daylight conditions, although it can also be useful to determine the color rendering of a studied lamp, since natural light represents a perfect color rendering for the human being.
3. Assessment of the Accuracy of DSI
3.1. Light Source Testing Box
The analysis of the accuracy of the proposed metric was argued in the assessment of 80 colorimetry surveys, where respondents answered questions on the color rendering, color temperature, saturation, and chromatic perception of different samples inside a light source testing box.
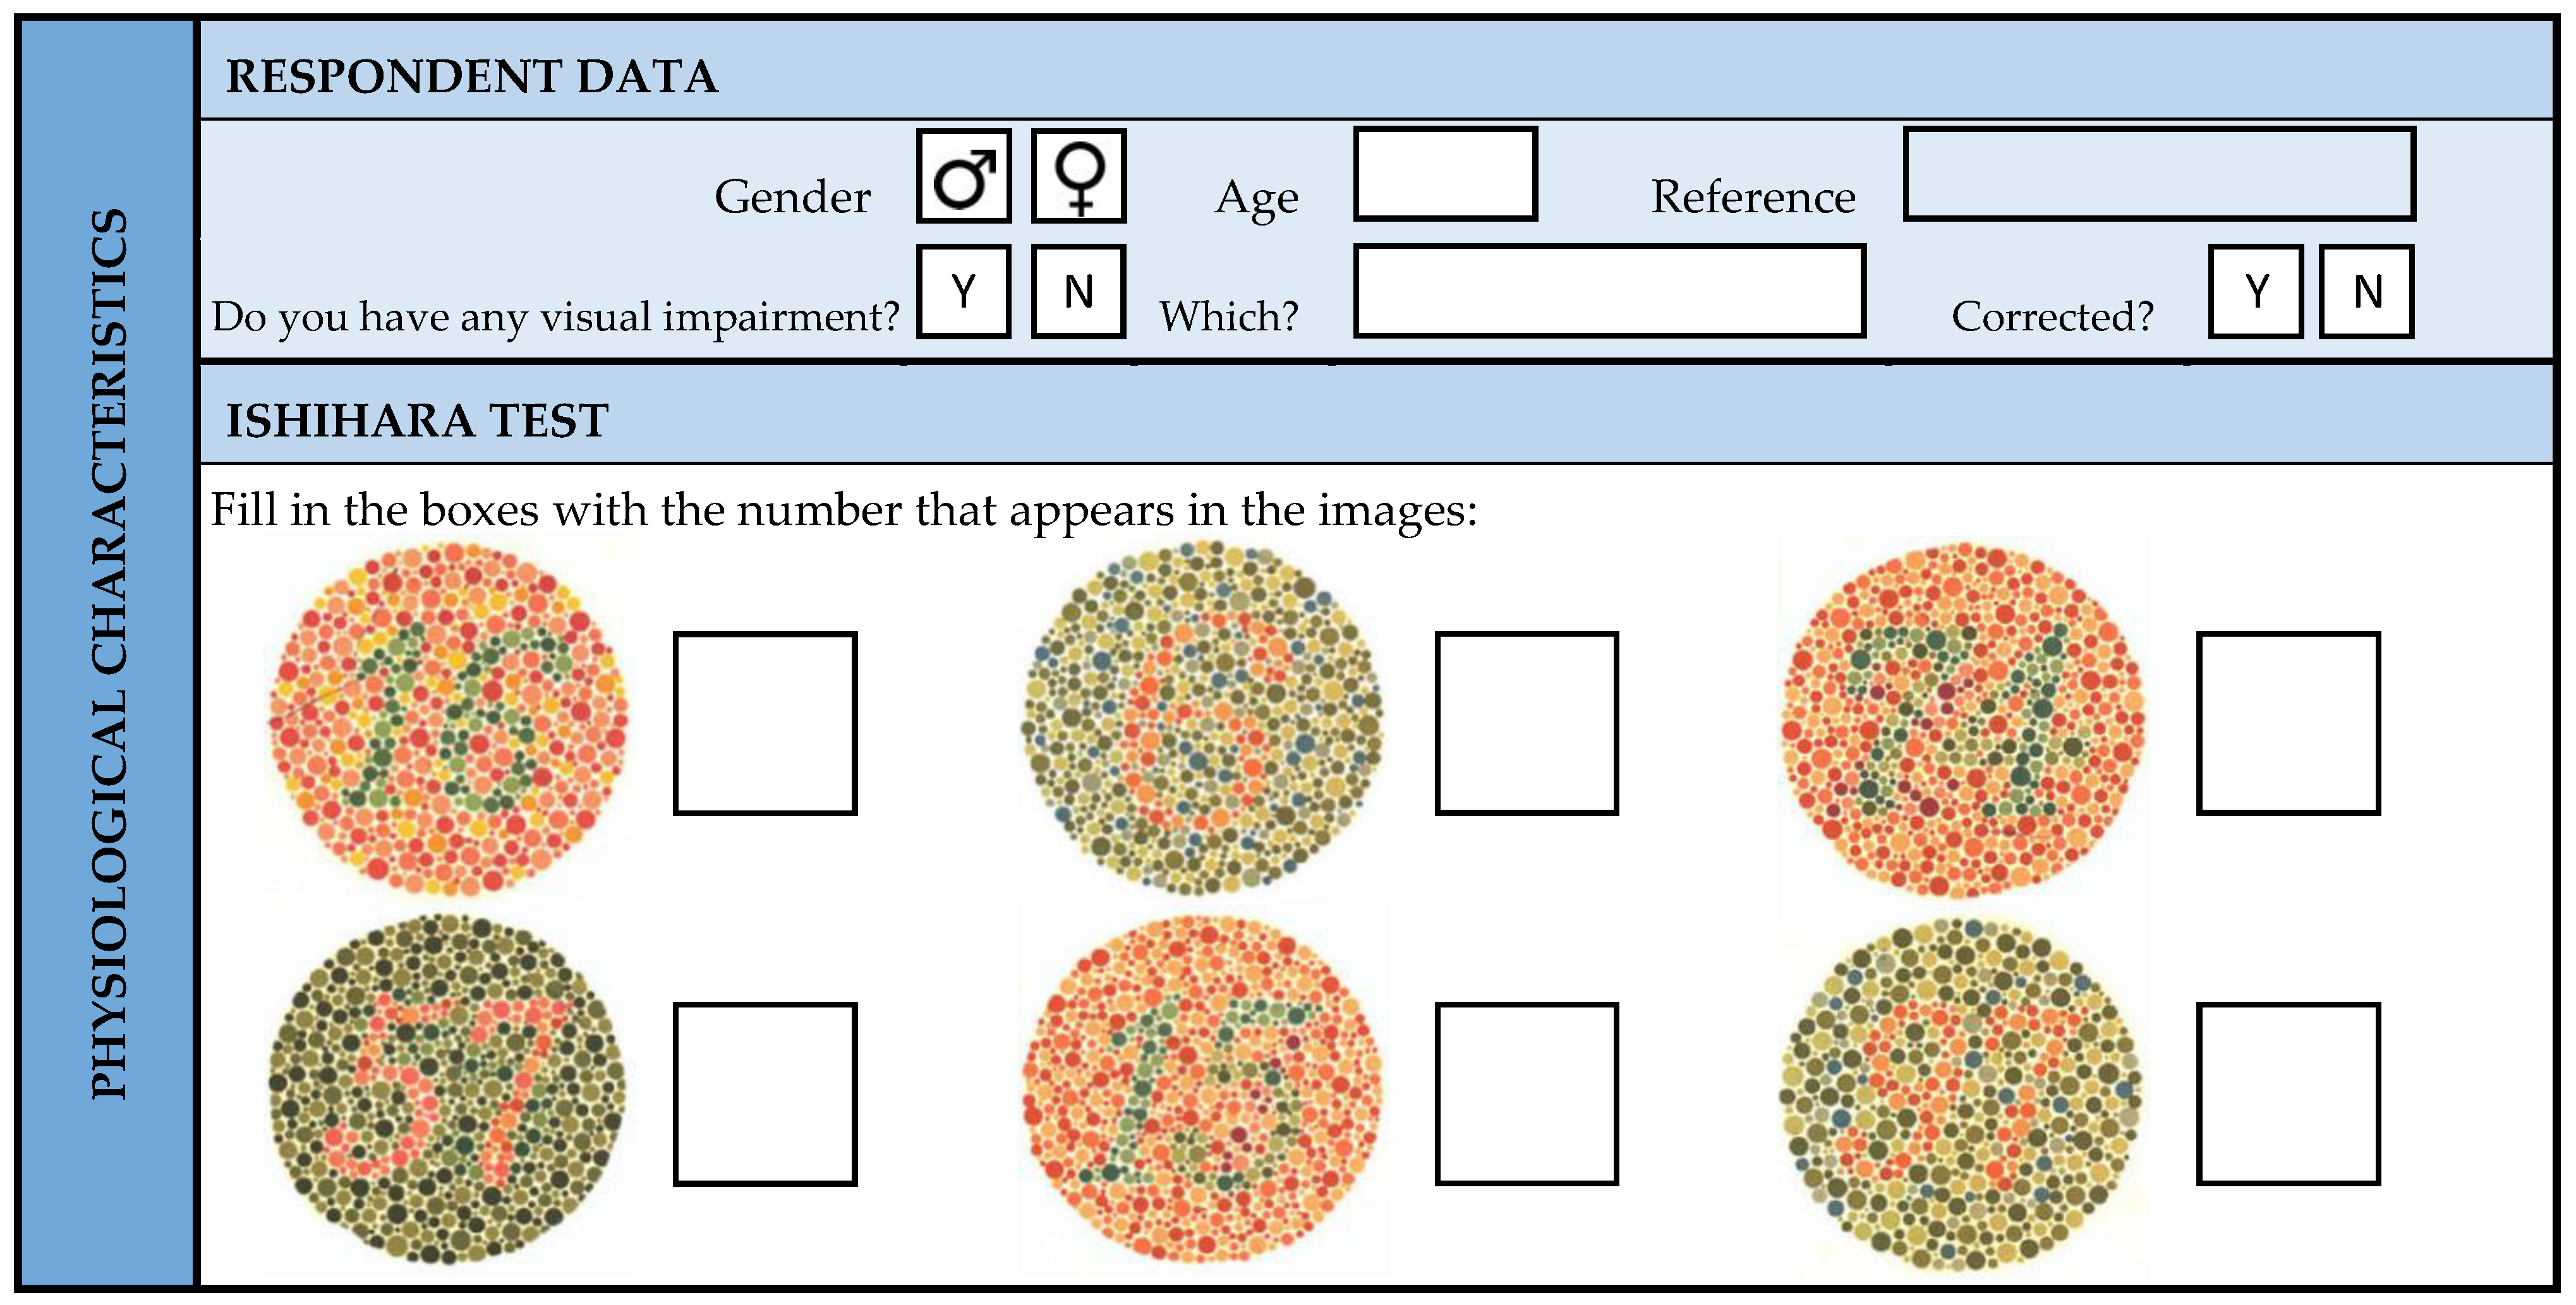
The survey sample was made up of 47 men and 33 women aged between 20 and 31 years old. Given that most of these respondents were students at the School of Architecture of Seville, a particular sensitivity to color perception was assumed. Prior to questions about colorimetry, the survey included questions on visual impairments, confirming that all respondents had suitably clear eyesight to perceive the objects inside the testing box. To ensure there were no respondents suffering from color blindness, each survey included a random Ishihara test [37], so all the surveys assessed have been completed by respondents with an appropriate color perception.
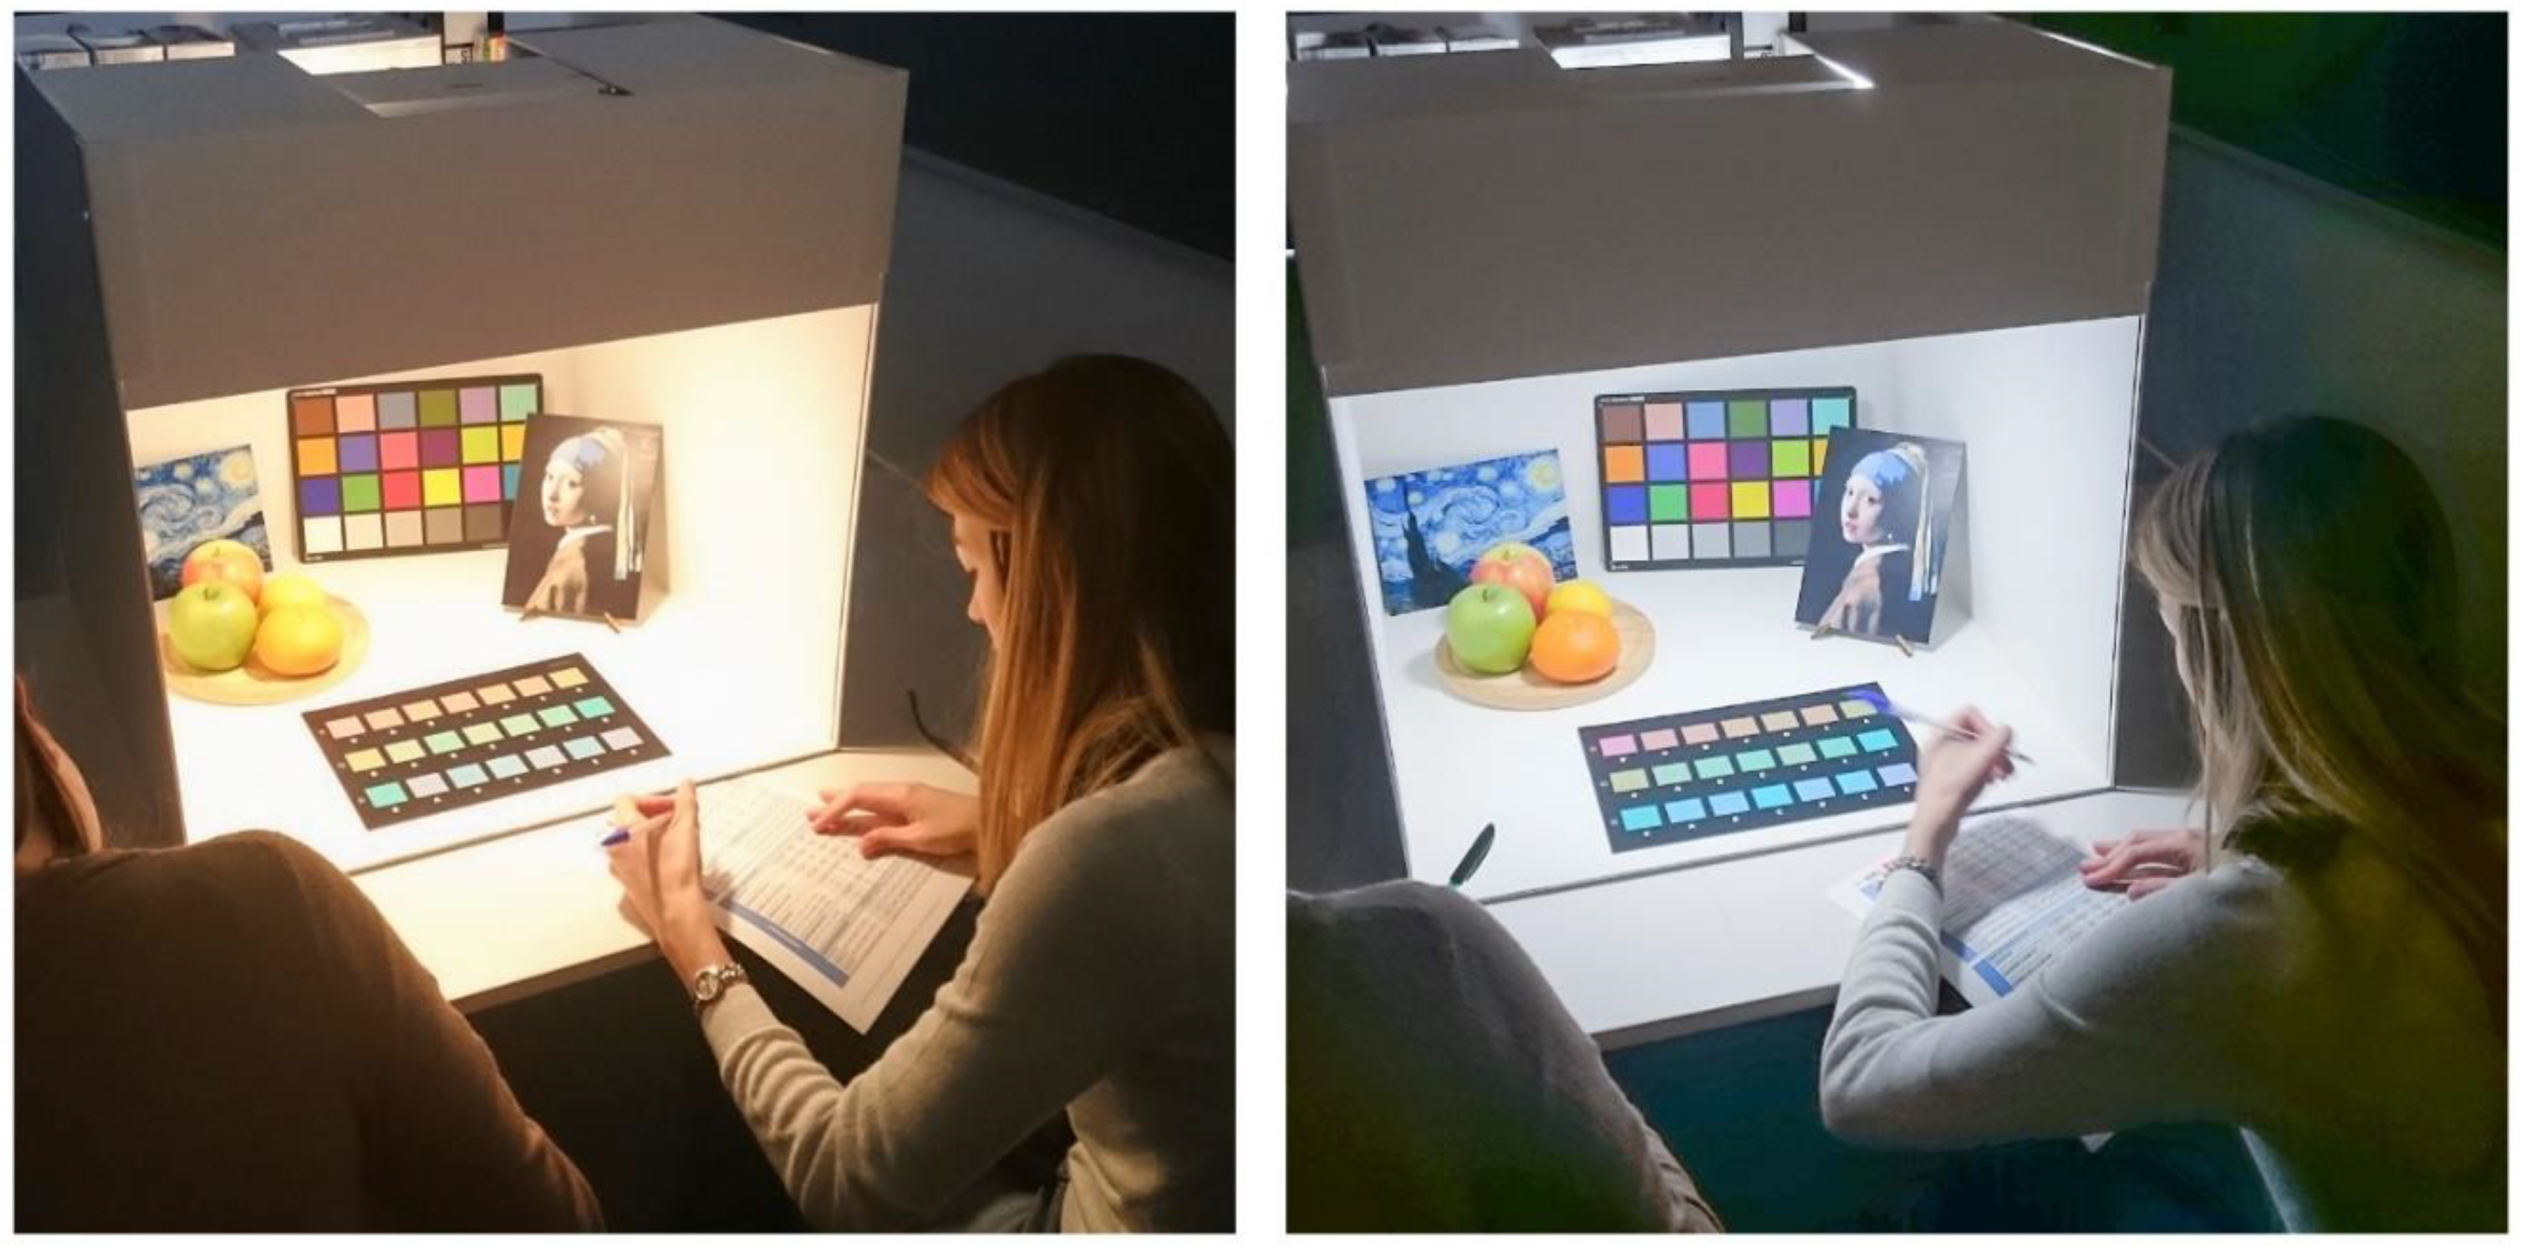
The light source testing box, shown in Figure 8, was 60 cm wide by 60 cm deep by 60 cm high and was made of medium-density fiberboard (MDF) painted white. The white paint has a constant reflectance of 90%, except in the wavelength interval between 380 and 400 nm, where the average reflectance is 50%. Six electric light sources were located in the top of the box, hidden by a white panel. The lamps ran along a lane in order to ensure the light source studied was situated exactly in the center of the testing box. The lamps projected light through an opal diffuser, thus making it impossible for respondents to identify the light source. Accordingly, a single-blind test could be carried out to prevent any potential prejudices on the part of the students surveyed.
3.2. Light Sources Analyzed
In addition to natural light, six lamps were evaluated by the respondents. In order to assess a wide range of luminaire types, three typical LED lamps—with a warm, neutral, and cool color temperature—were evaluated in the testing box as well as an incandescent lamp and two compact fluorescent lamps with cool and warm color temperatures. Multilight-emitting diodes, high-pressure sodium lamps, and metal halide luminaires were not assessed in the testing box due to the constraints of the box dimensions and their less frequent application to indoor architecture. The main color characteristics of the light sources studied, as well as the color rendering for most of the widespread metrics, are shown in Table 1.
The spectral distribution of the sky vault oscillates between CIE D65 and CIE D75, according to the typical sky conditions of spring and summer in Seville (southern Spain), the location where the trial was carried out. Both SPDs produce a perfect color rendering and can be compared with the results observed for the electric light sources studied. The SPD of the sky was checked before each battery of surveys with a Konica Minolta CL-70F spectrometer. All surveys were developed under daylight conditions avoiding direct solar incidence inside the testing box as well as a cloudy sky.
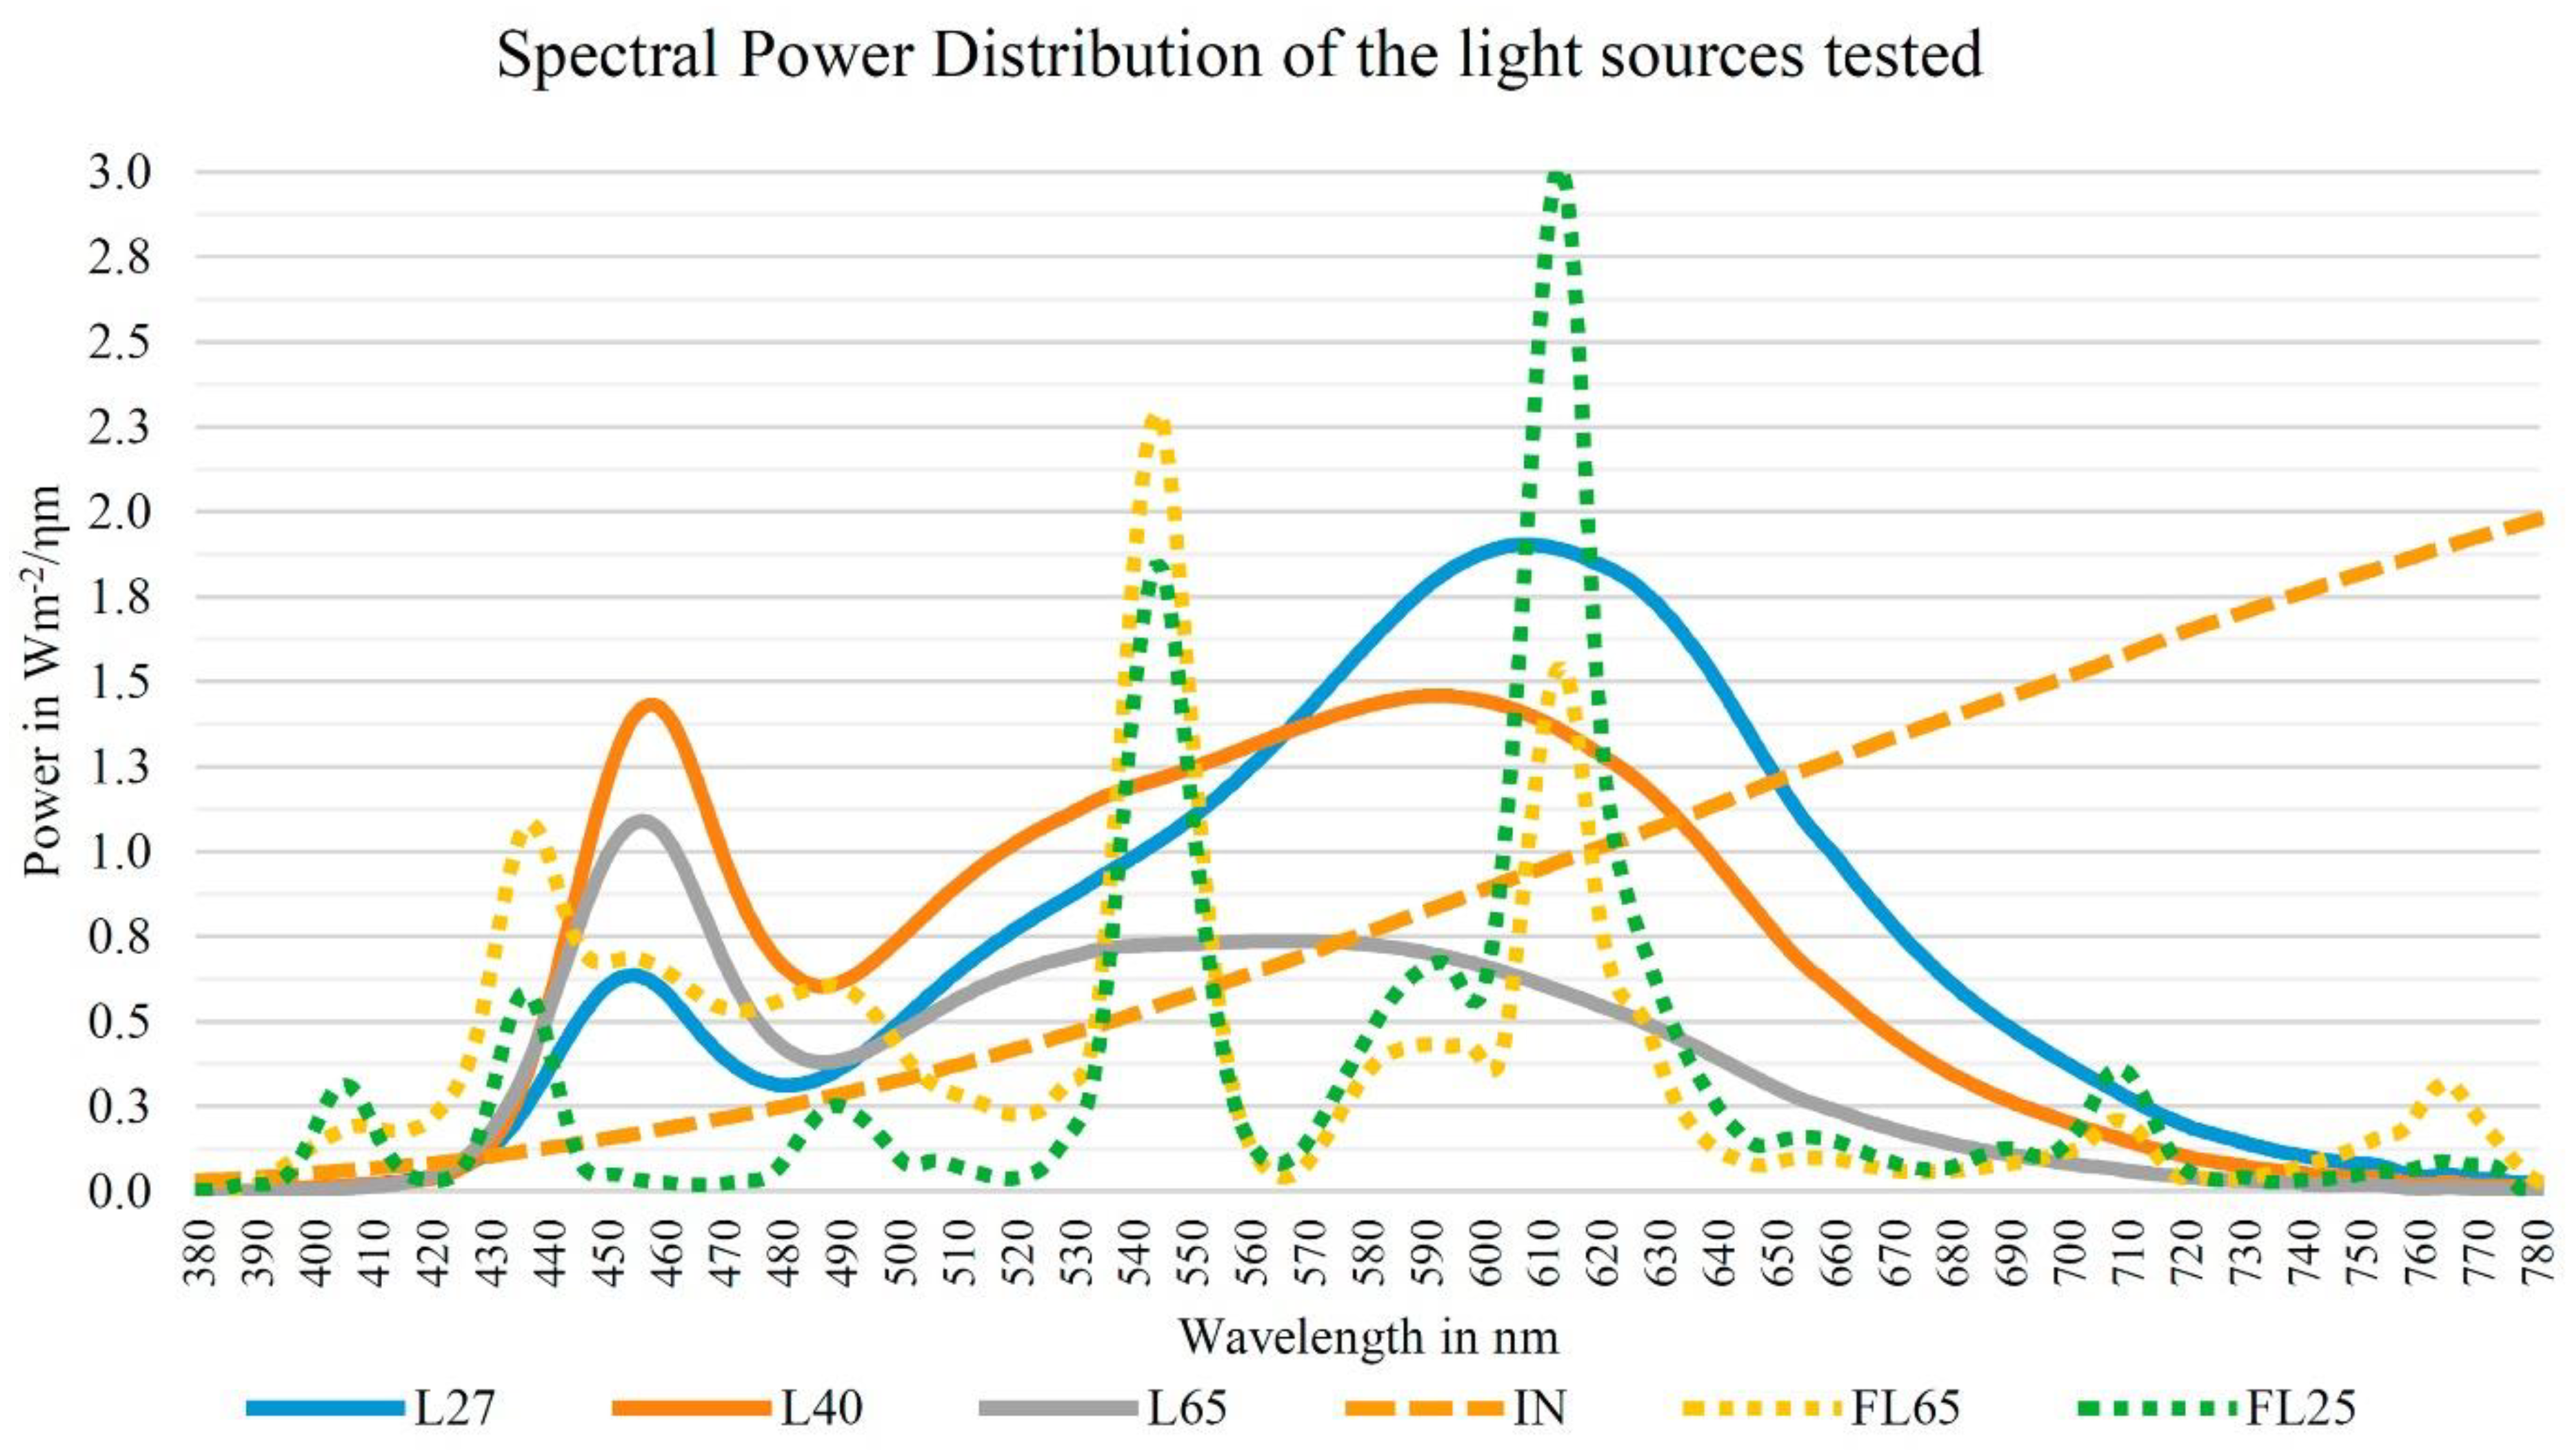
The SPDs of the electric light sources evaluated in the testing box are shown in Figure 9 and correspond to the color temperature values defined in Table 1.
In order to ensure the single-blind procedure, the lamps lighted up randomly, so that respondents could not identify the luminaires according to their switch on position. The time interval for assessing the color rendering of each lamp was set to 90 s, meaning that the students surveyed had the same boundary conditions to evaluate the chromatic perception of the sample inside the testing box.
It is worth noting that the switching on of the lamps was controlled by a dimmer, so the luminous flux emitted by the selection of luminaires was limited to the same illuminance conditions. A lux-meter PCE-L 100 was used before each battery of surveys to ensure similar illuminance values for all lamps tested.
3.3. Samples Assessed
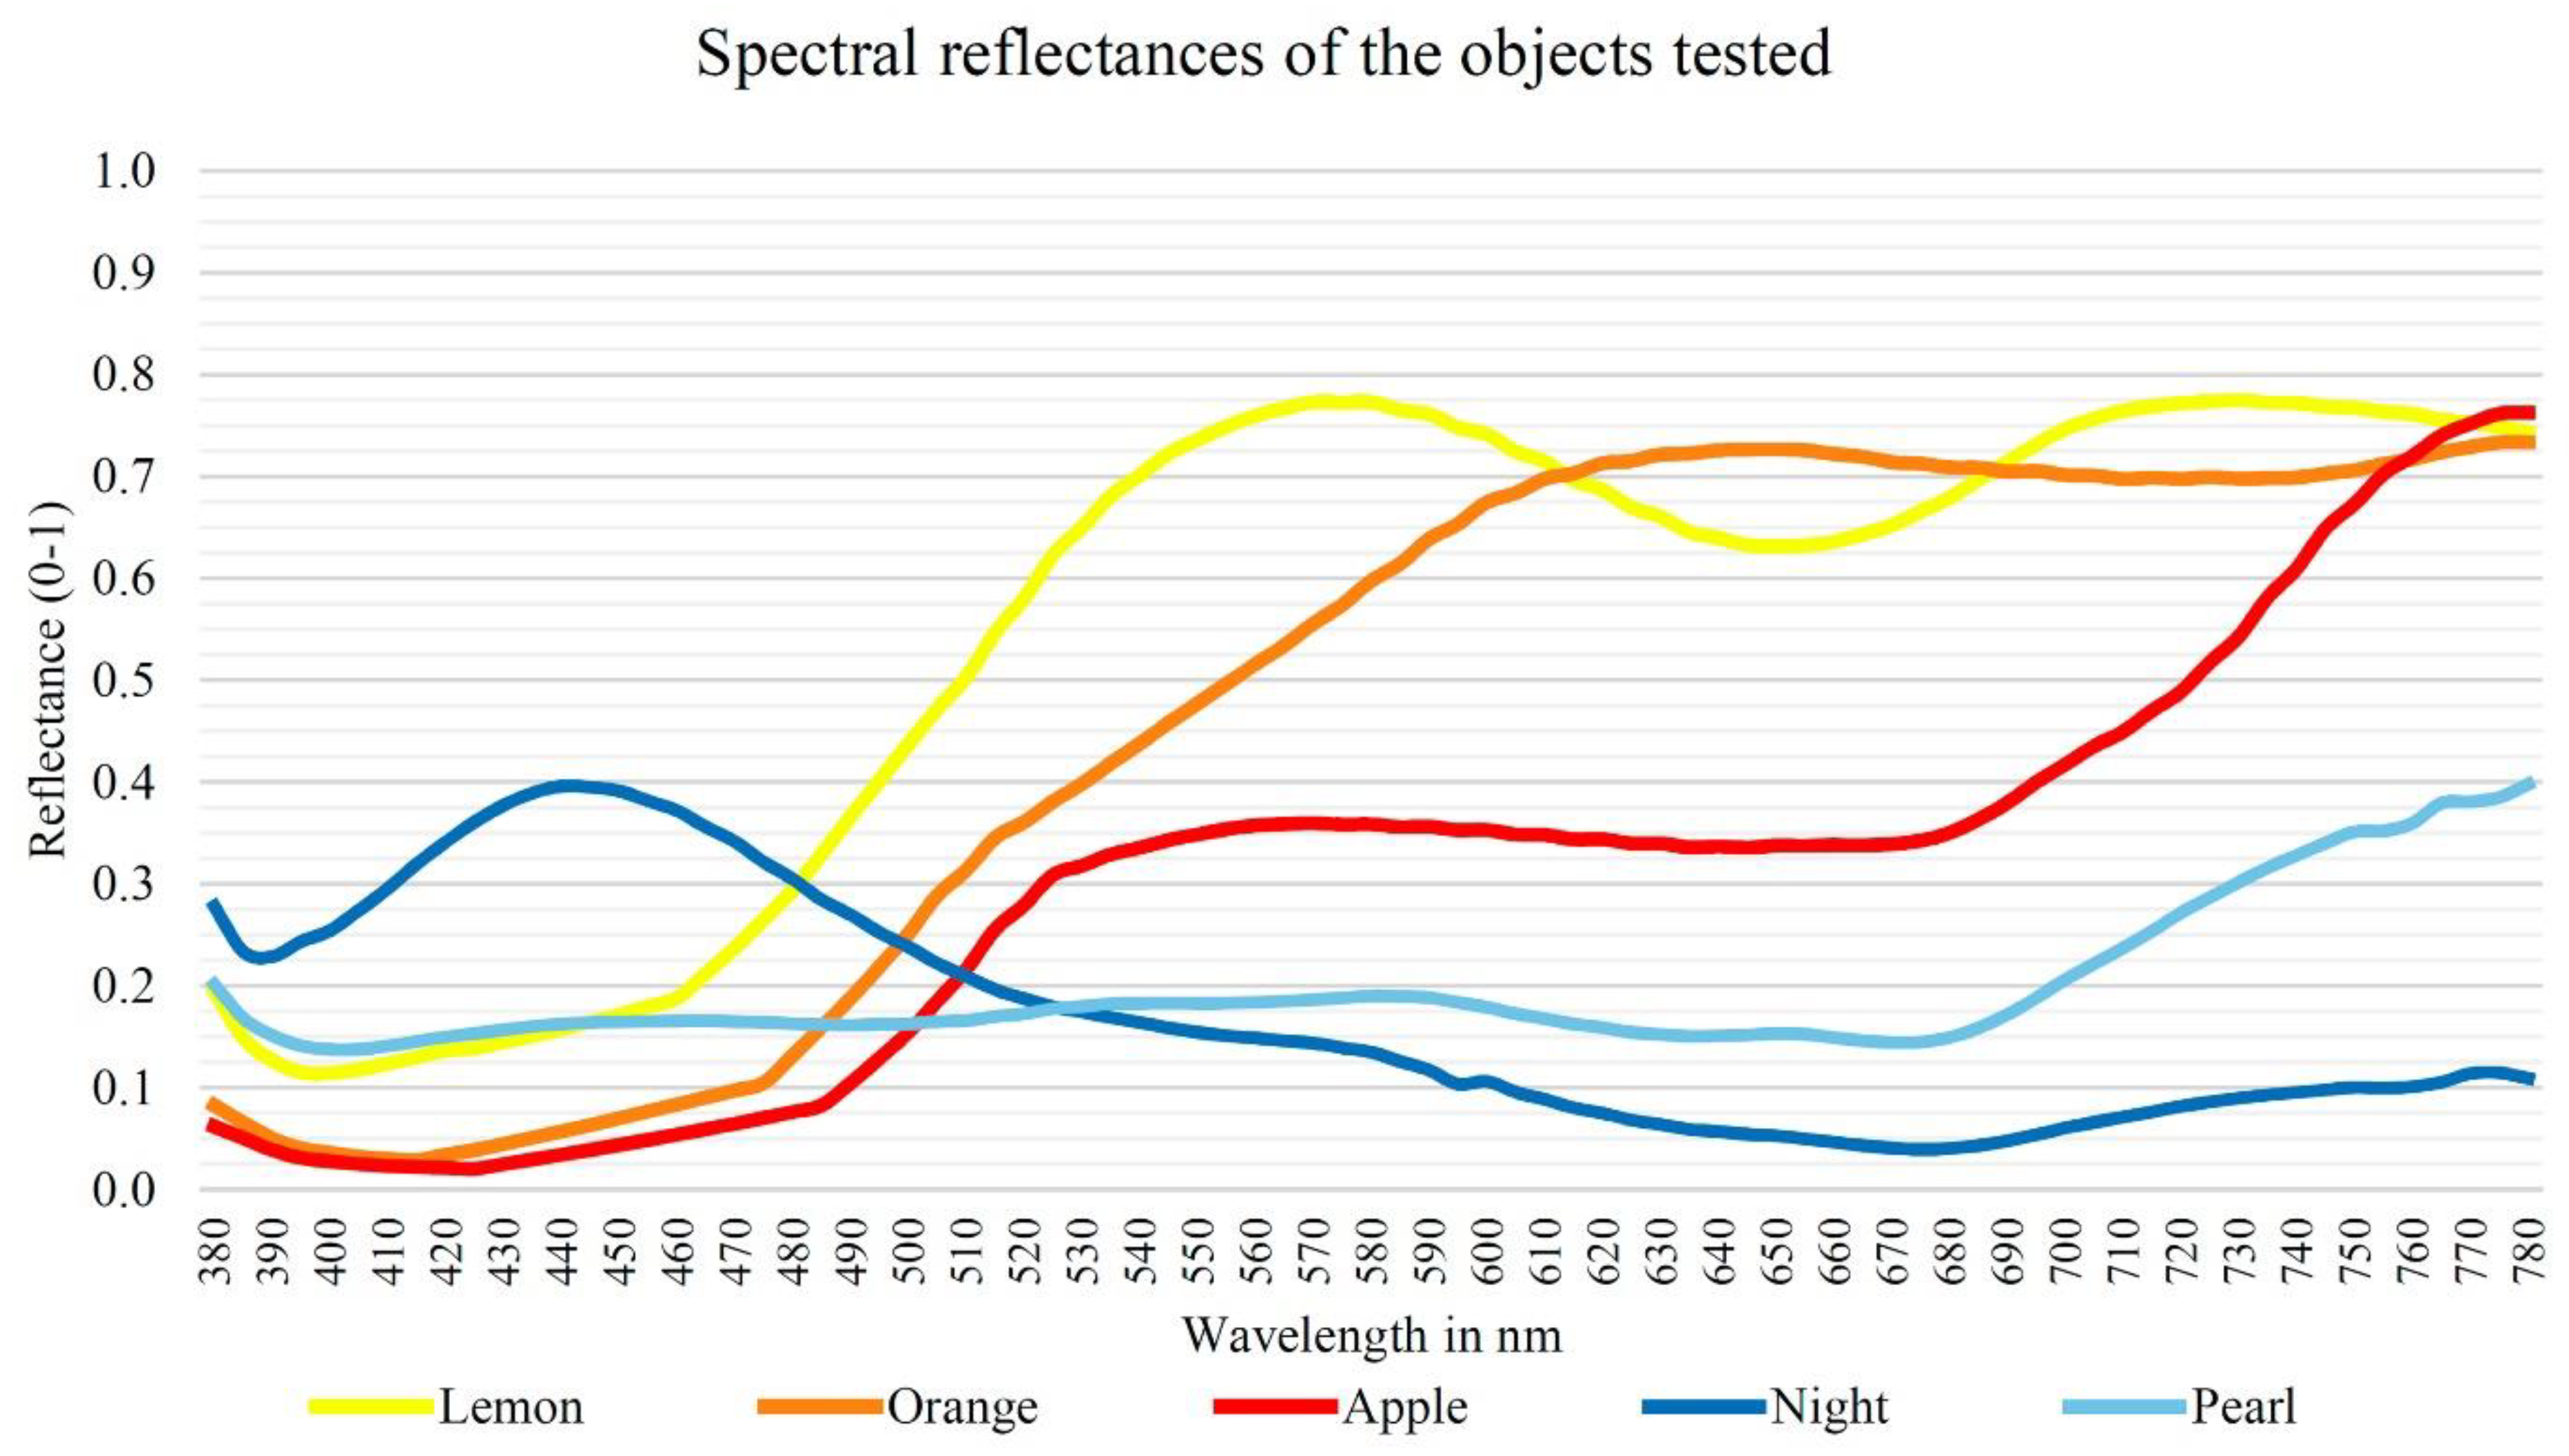
The testing box contained several objects that served as samples to evaluate the color rendering of the light sources studied. Warm colors were represented by several pieces of fruit, specifically, a lemon, an orange, and an apple. Accordingly, a first scenario of fruits was defined and assessed by the respondents. Cool colors were shown in two well-known painting samples: Girl with a Pearl Earring (1665, Johannes Vermeer) and The Starry Night (1889, Vincent van Gogh), so that a second scenario of paintings was included in the testing box. The spectral reflectance of the objects tested is shown in Figure 10.
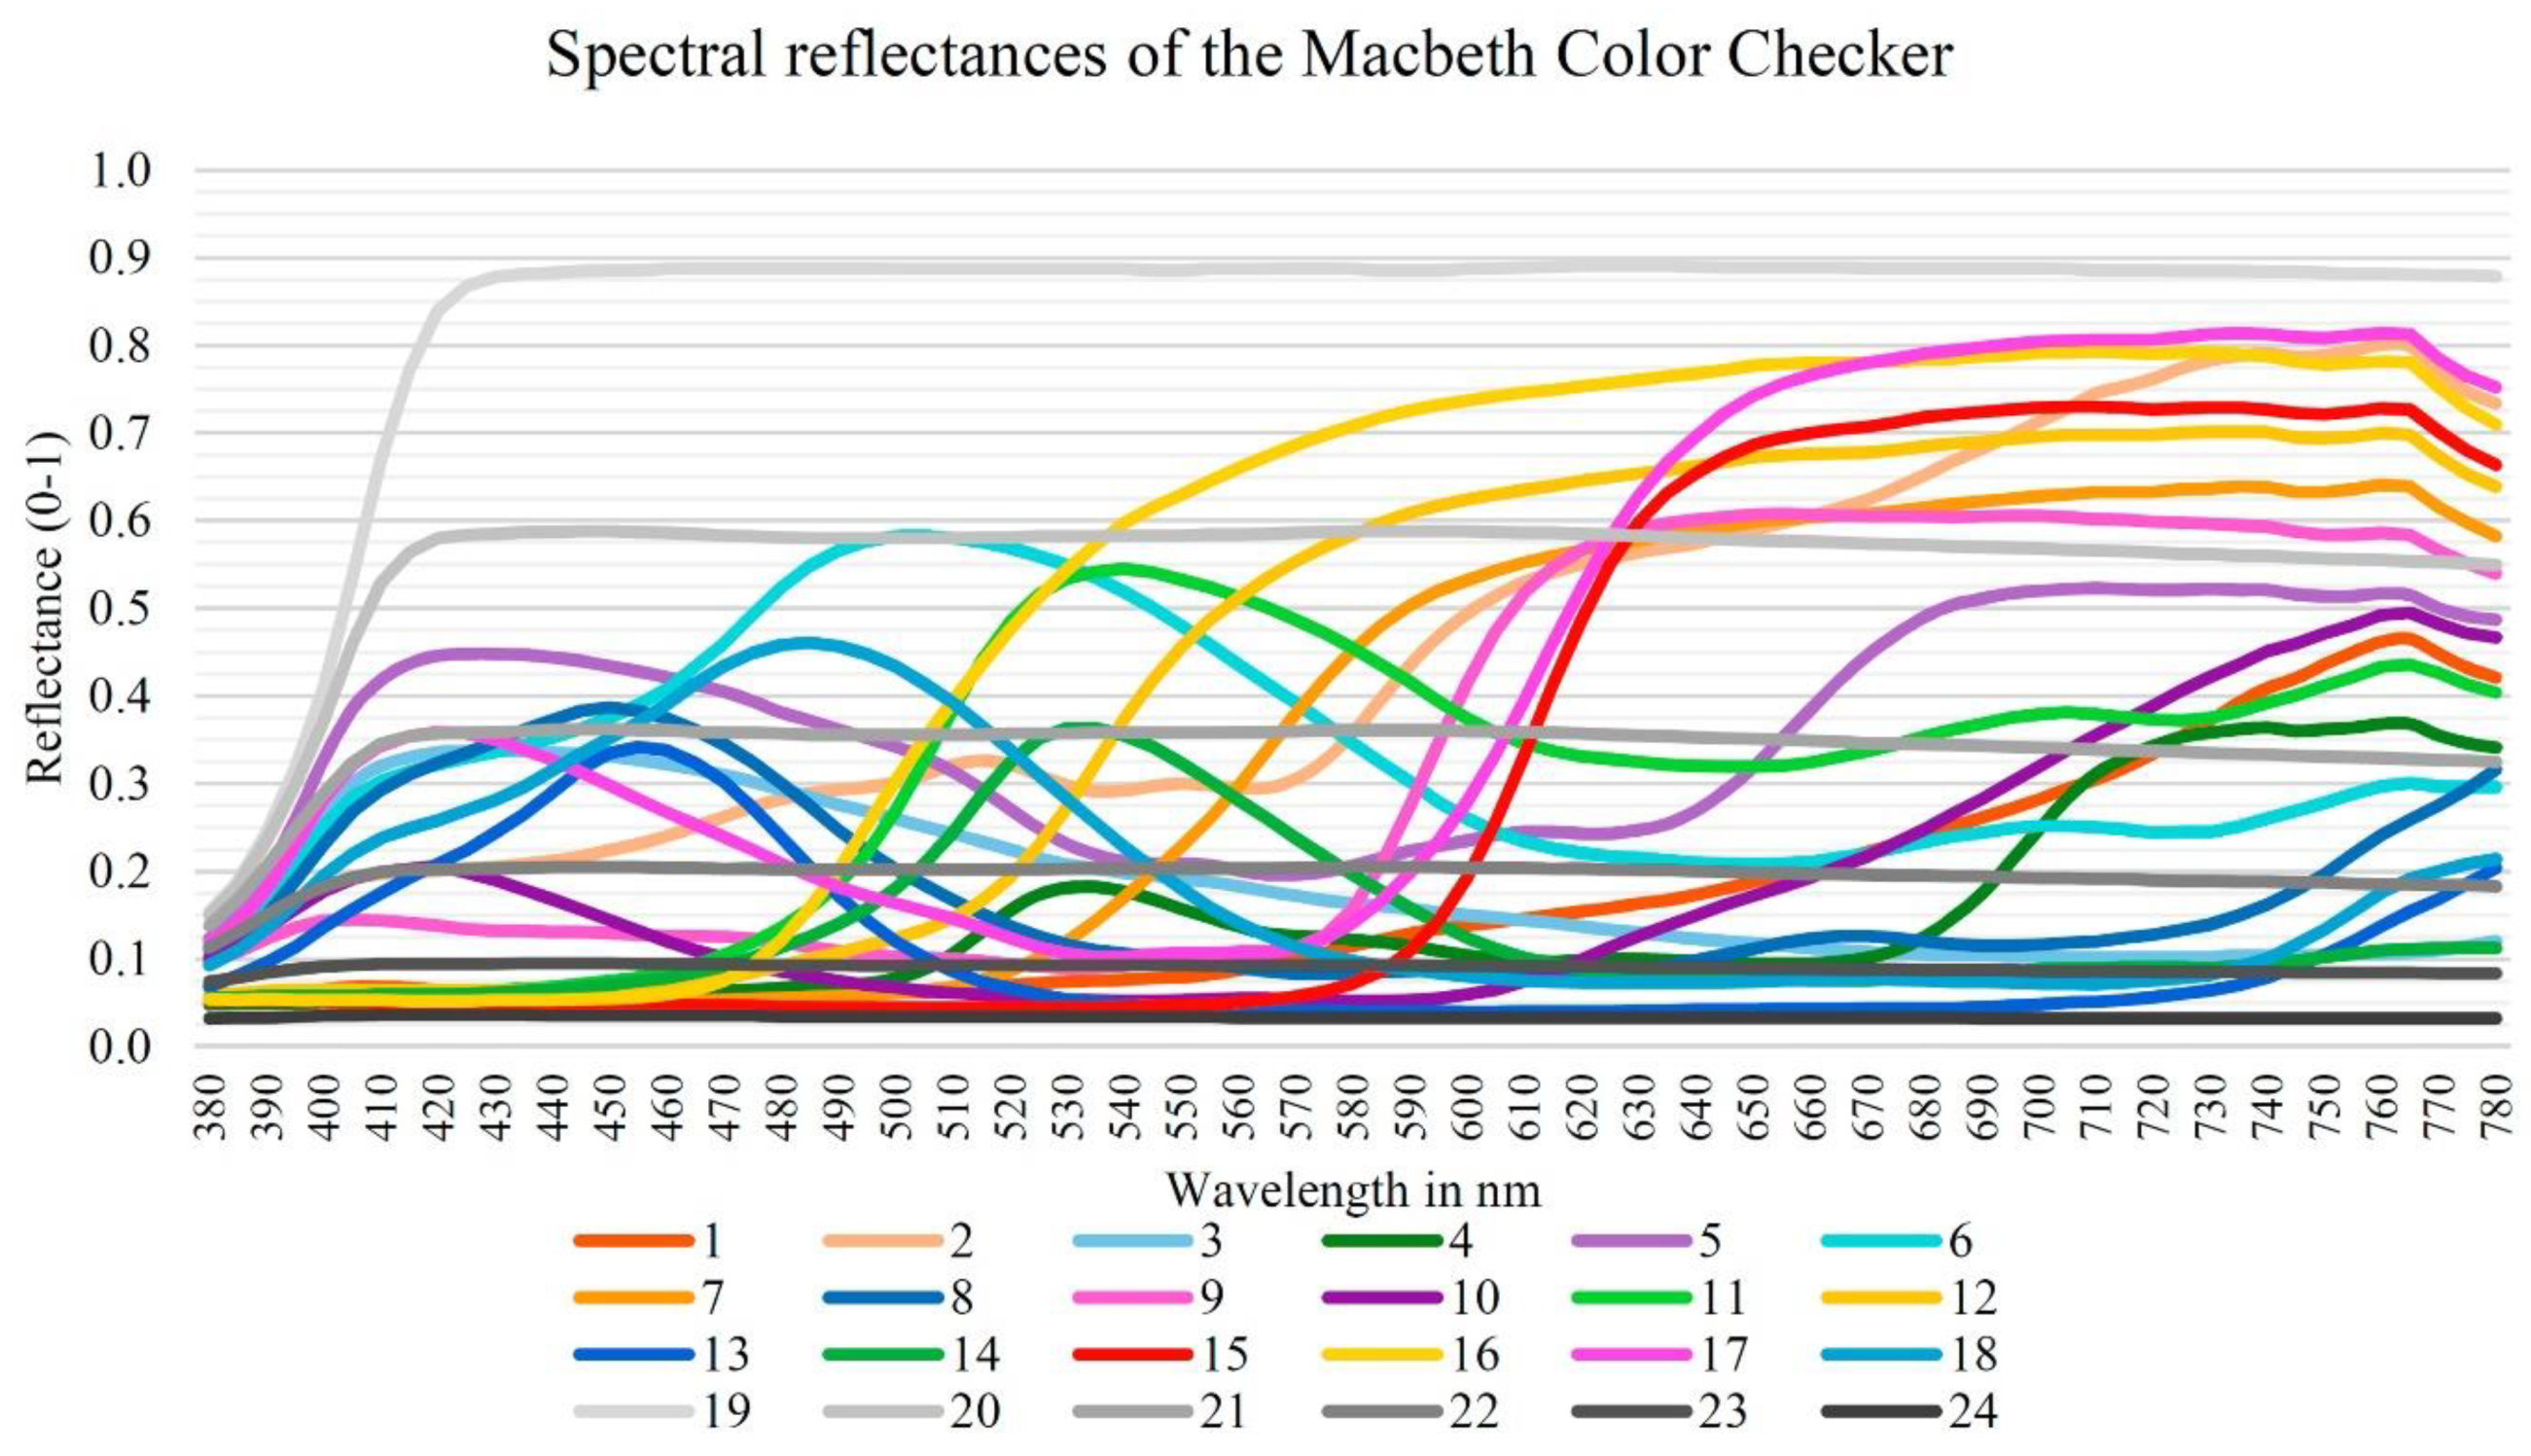
In addition to the scenarios of warm and cool hues mentioned above, a Macbeth Color Checker of 18 colors and 6 grayscale hues was included inside the light source testing box. This chart served to determine the subjective affinity of colors to the daylight reference, which acted as the perfect color rendering light source. Accordingly, daylight was always the first to be shown to respondents, although the electric lamps were switched on randomly to ensure the single-blind trial. Figure 11 shows the spectral reflectances of the Macbeth Color Checker samples used in the testing box. The color of each number corresponds to the sample described in the checker.
4. Analysis of Results
4.1. Color Rendering of the Light Sources
In agreement with the methodology described above, the color rendering of the studied light source was evaluated. For this purpose, respondents completed a survey box for each source, as shown in Appendix A.
In order to quantify the color rendering with a numerical value, a value of 100% was given for a “perfect” performance and a value of 50% was considered for a “sufficient” rendering in accordance with the survey form. The rating values between both limits were quantified linearly between 50% and 100%. Given that daylight represents a perfect color rendering [6], all values obtained were modified according to the average score of natural light, following Equation (17):
where Pi(MOD) is the value of color rendering considered for the studied light source, Pi is the color rendering value obtained from the surveys sample, and PDL(AVE) is the average score of the color rendering of daylighting.
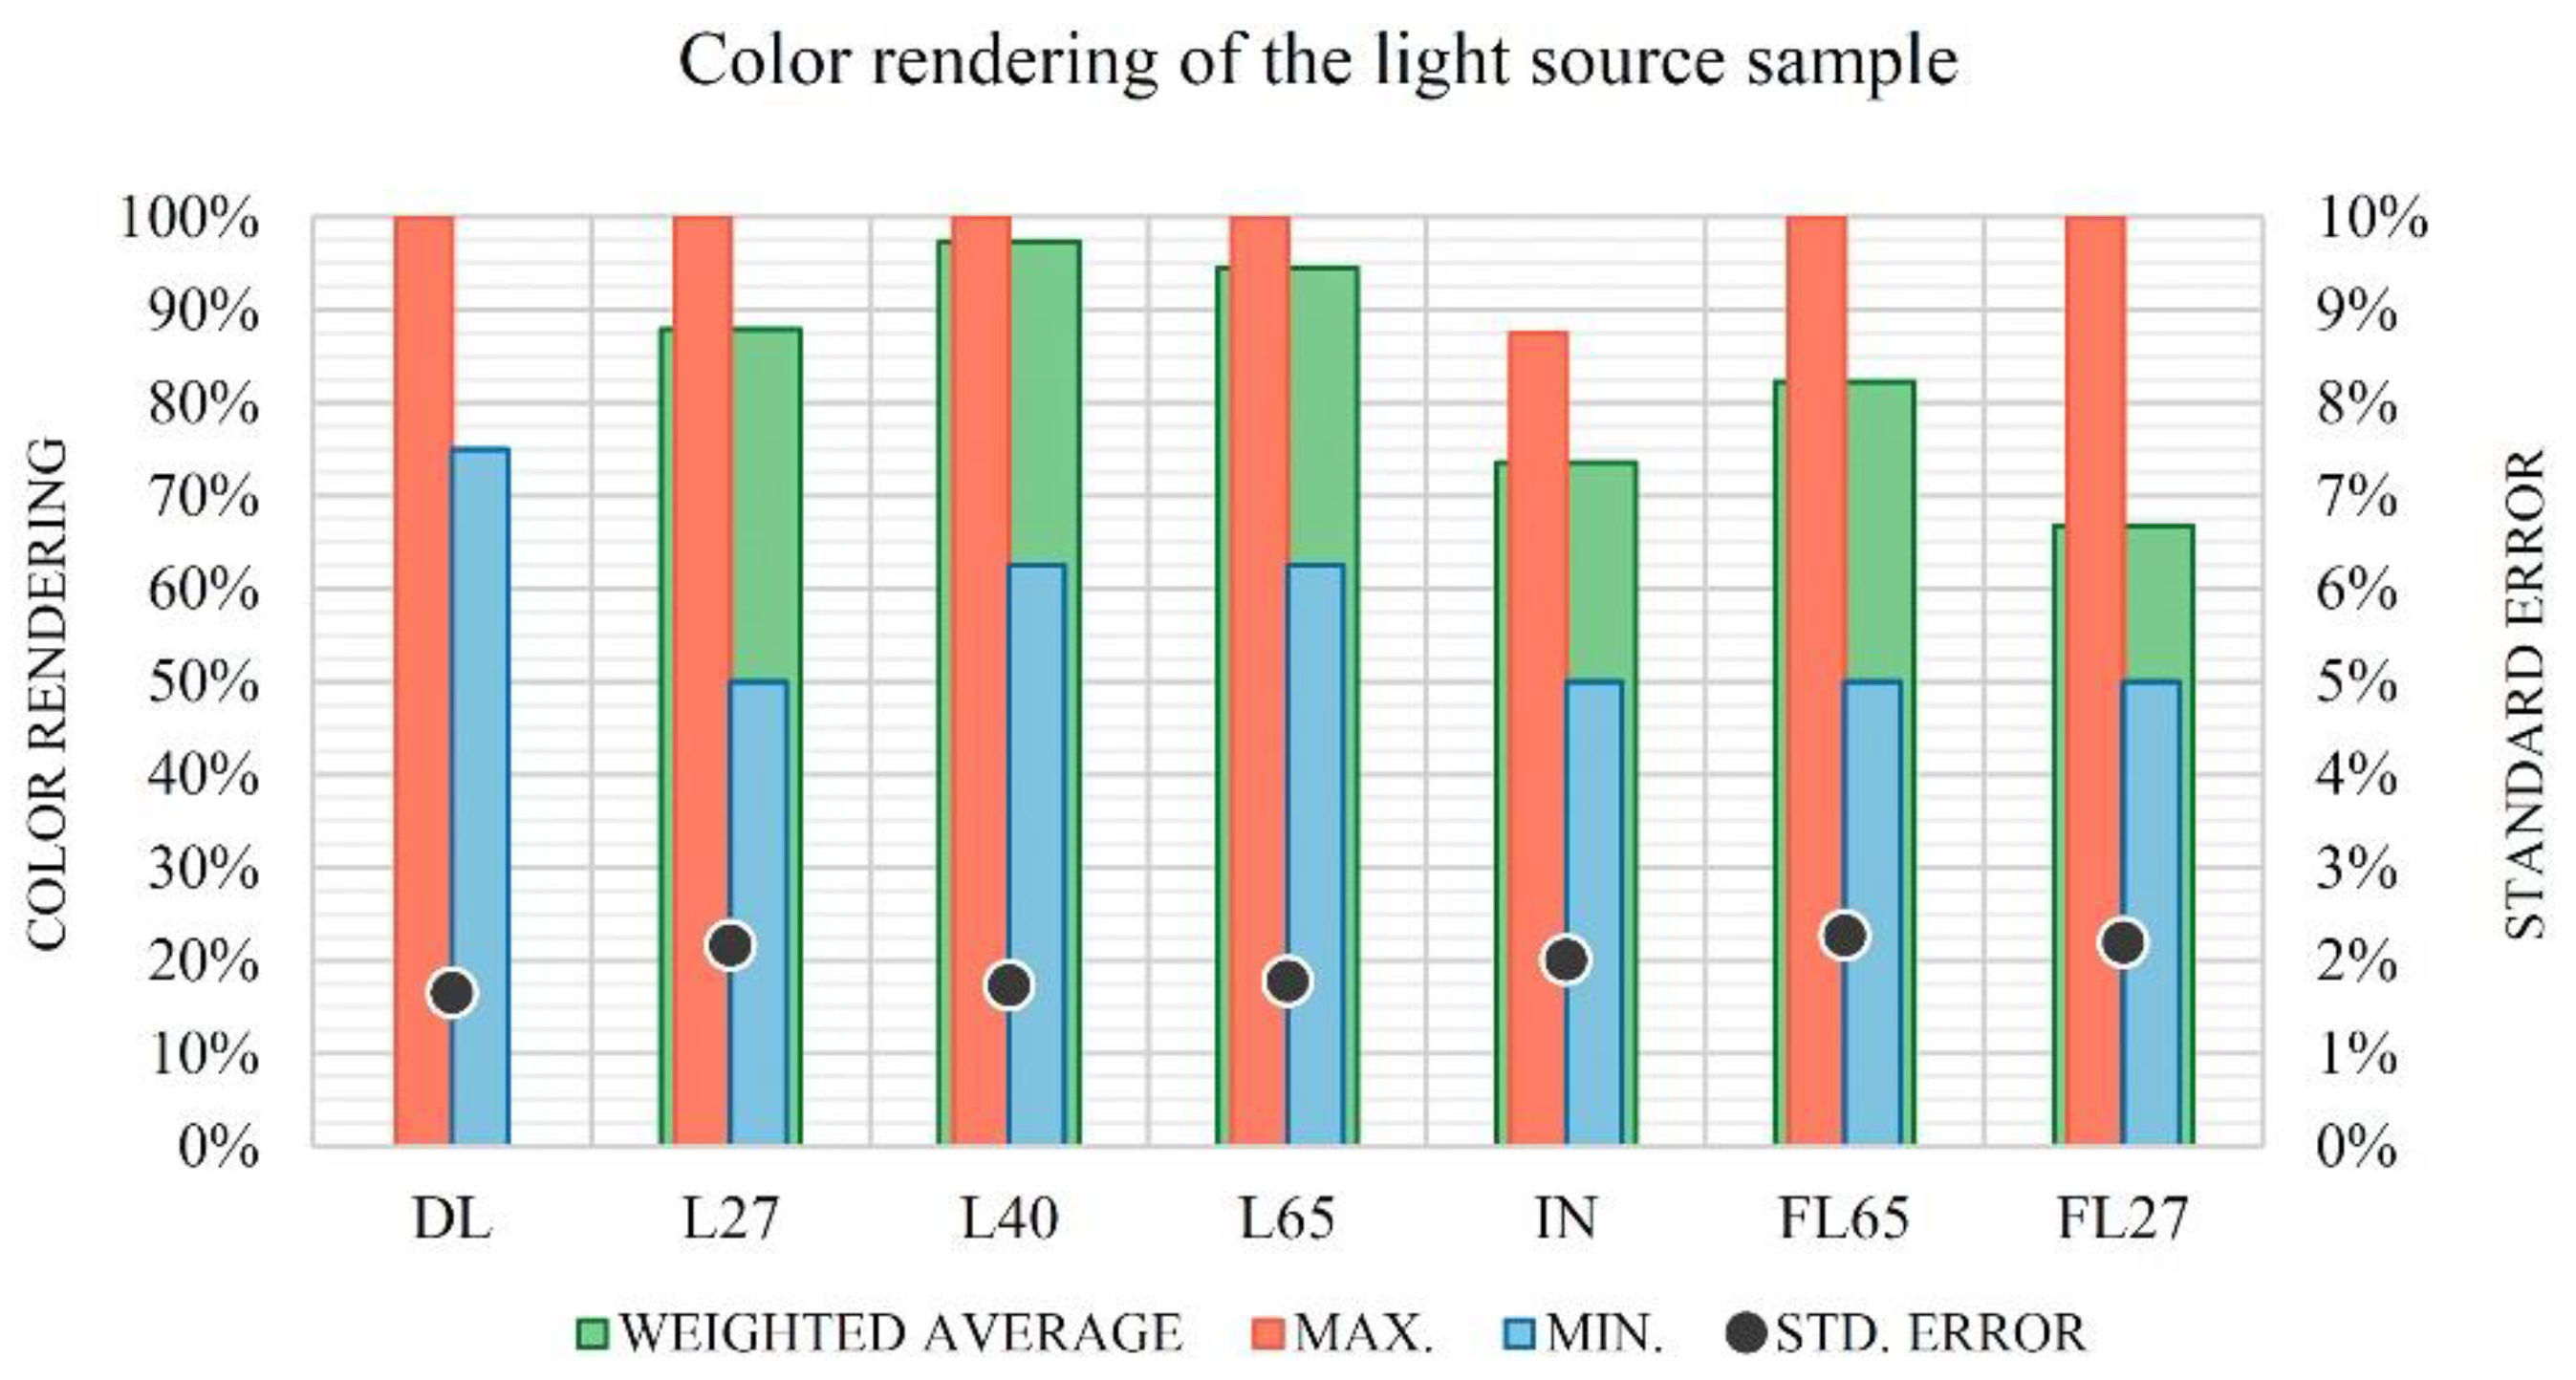
According to Equation (17), daylighting represents a perfect chromatic perception and the score for the electric lamps studied is relative to natural light. Figure 12 shows the color rendering for the light sources studied, showing the average, maximum, and minimum score as well as the standard error obtained from the surveys and procedure described above.
As seen in Figure 12, the standard error for all light sources is between 1.7% and 2.3%, with an average value of 2.0%. This deviation, minimized due to the high number of surveys, is considered sufficient to assess the color performance of the lamps analyzed, despite the subjectivity of this trial.
As expected, daylight (DL) allows the highest color rendering of the samples inside the testing box. As deduced from Figure 12, the LED lamps with a CCT between 4000 and 6500 K (L40 and L65) produce a better rendering than the rest of light sources. This is really worth noting, as according to CRI metric, the incandescent lamp (IN) produces a perfect color rendering, unlike the other luminaires. In fact, according to the survey results, the fluorescent lamp with a cool CCT (FL65) allows a better color performance than the incandescent lamp. Consequently, the CRI metric does not provide a suitable quantification of the color performance of LED lamps, confirming previous research [9,10]. It can be also deduced that the color temperature of the luminaire plays a key role in the color rendering of the light sources, given that when the CCT of the lamp is close to that observed under natural light, the source studied achieves a better performance in color perception.
In accordance with the previous statement, warm light sources allow a lower color rendering, since they differ from natural light. This is the case for the LED lamp with a CCT of 2700 K (L27), the incandescent lamp, and the warm fluorescent lamp (FL27), all of which show a deduced color rendering between 67% and 87%.
4.2. Color Saturation of the Light Sources
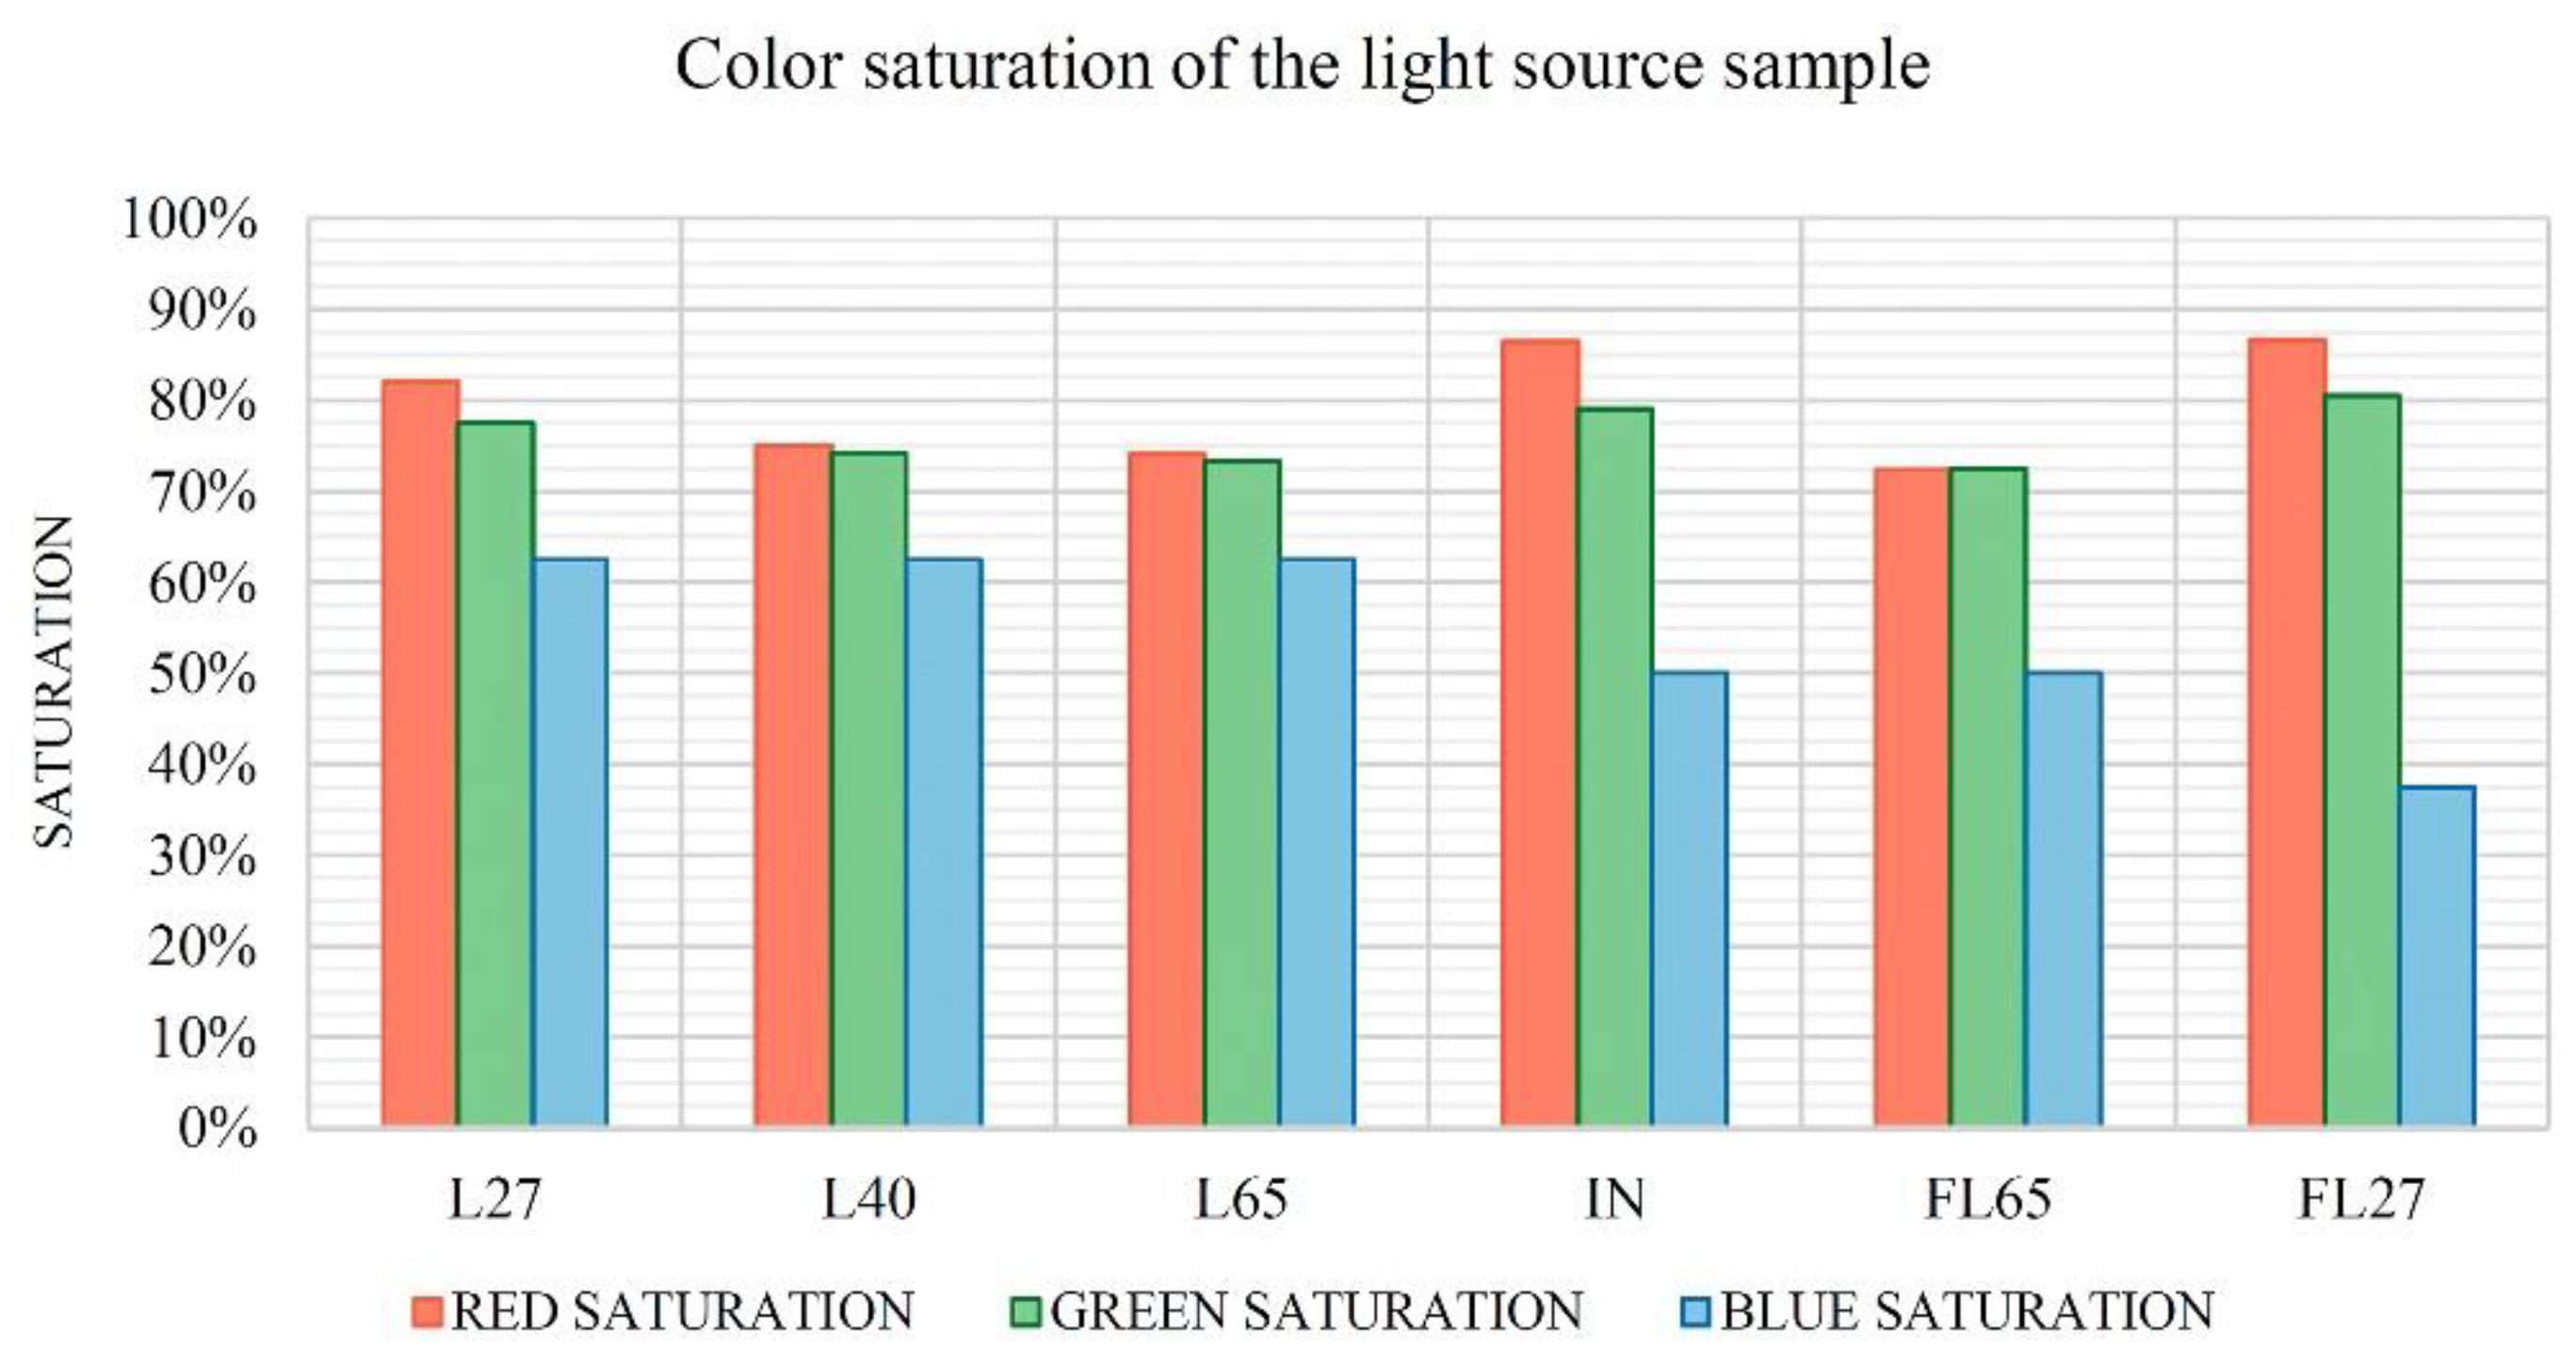
Following the analysis of the surveys, the color saturation of the light sources studied was evaluated. In this case, the respondents had to provide answers about the subjective saturation of the color samples inside the testing box, rating each lamp and hue from “nonsaturated”—numerical value of 50%—to “very saturated”—numerical value of 100%. Figure 13 shows the saturation perception of the samples for red, green, and blue hues according to the results obtained from the surveys.
As seen in Figure 13, the incandescent lamp (IN) produces higher saturation for red hues, while the cool LED lamp (L65) generates the maximum saturation for blue hues. Moreover, the warm fluorescent lamp (FL27) allows the highest saturation for green hues.
According to the previous analysis, it can be deducted that the SPD of a light source is essential to determine the hue saturation produced. As seen in Figure 9, the cool LED lamp has a peak in the SPD between 430 and 480 nm in comparison with the rest of its spectral distribution, that is to say, it emits in the wavelength interval of blue hues above all. Accordingly, the higher color saturation for this lamp is observed for the dominant range of its spectral distribution.
The same can be concluded from the incandescent lamp, where, as Figure 9 shows, the SPD increases linearly towards longer wavelengths. As in the previous case, the highest saturation for this lamp is observed for the hues which correspond to the dominant spectral distribution.
Finally, as seen in Figure 9, the SPD of the warm fluorescent lamp shows two noticeable peaks; one from 520 to 560 nm—green hues—and another from 600 to 640 nm—orange and red hues. In keeping with the SPD of this light source, this lamp achieves the highest saturation for green hues and a notable degree of saturation for red hues.
From the comparison of Figure 12 and Figure 13, it can be also deduced that the light sources which provide a better color rendering have a balanced saturation for all hues, as concluded from the results observed for the neutral and cool LED lamps (L40 and L65, respectively). In fact, quantifying the above statement, both LED lamps show a standard deviation for the three hues between 2.9% and 3.1%, while this value increases to 5.7% in the case of the incandescent lamp and to 5.3% for the warm fluorescent luminaire.
4.3. Daylight Affinity of the Light Sources
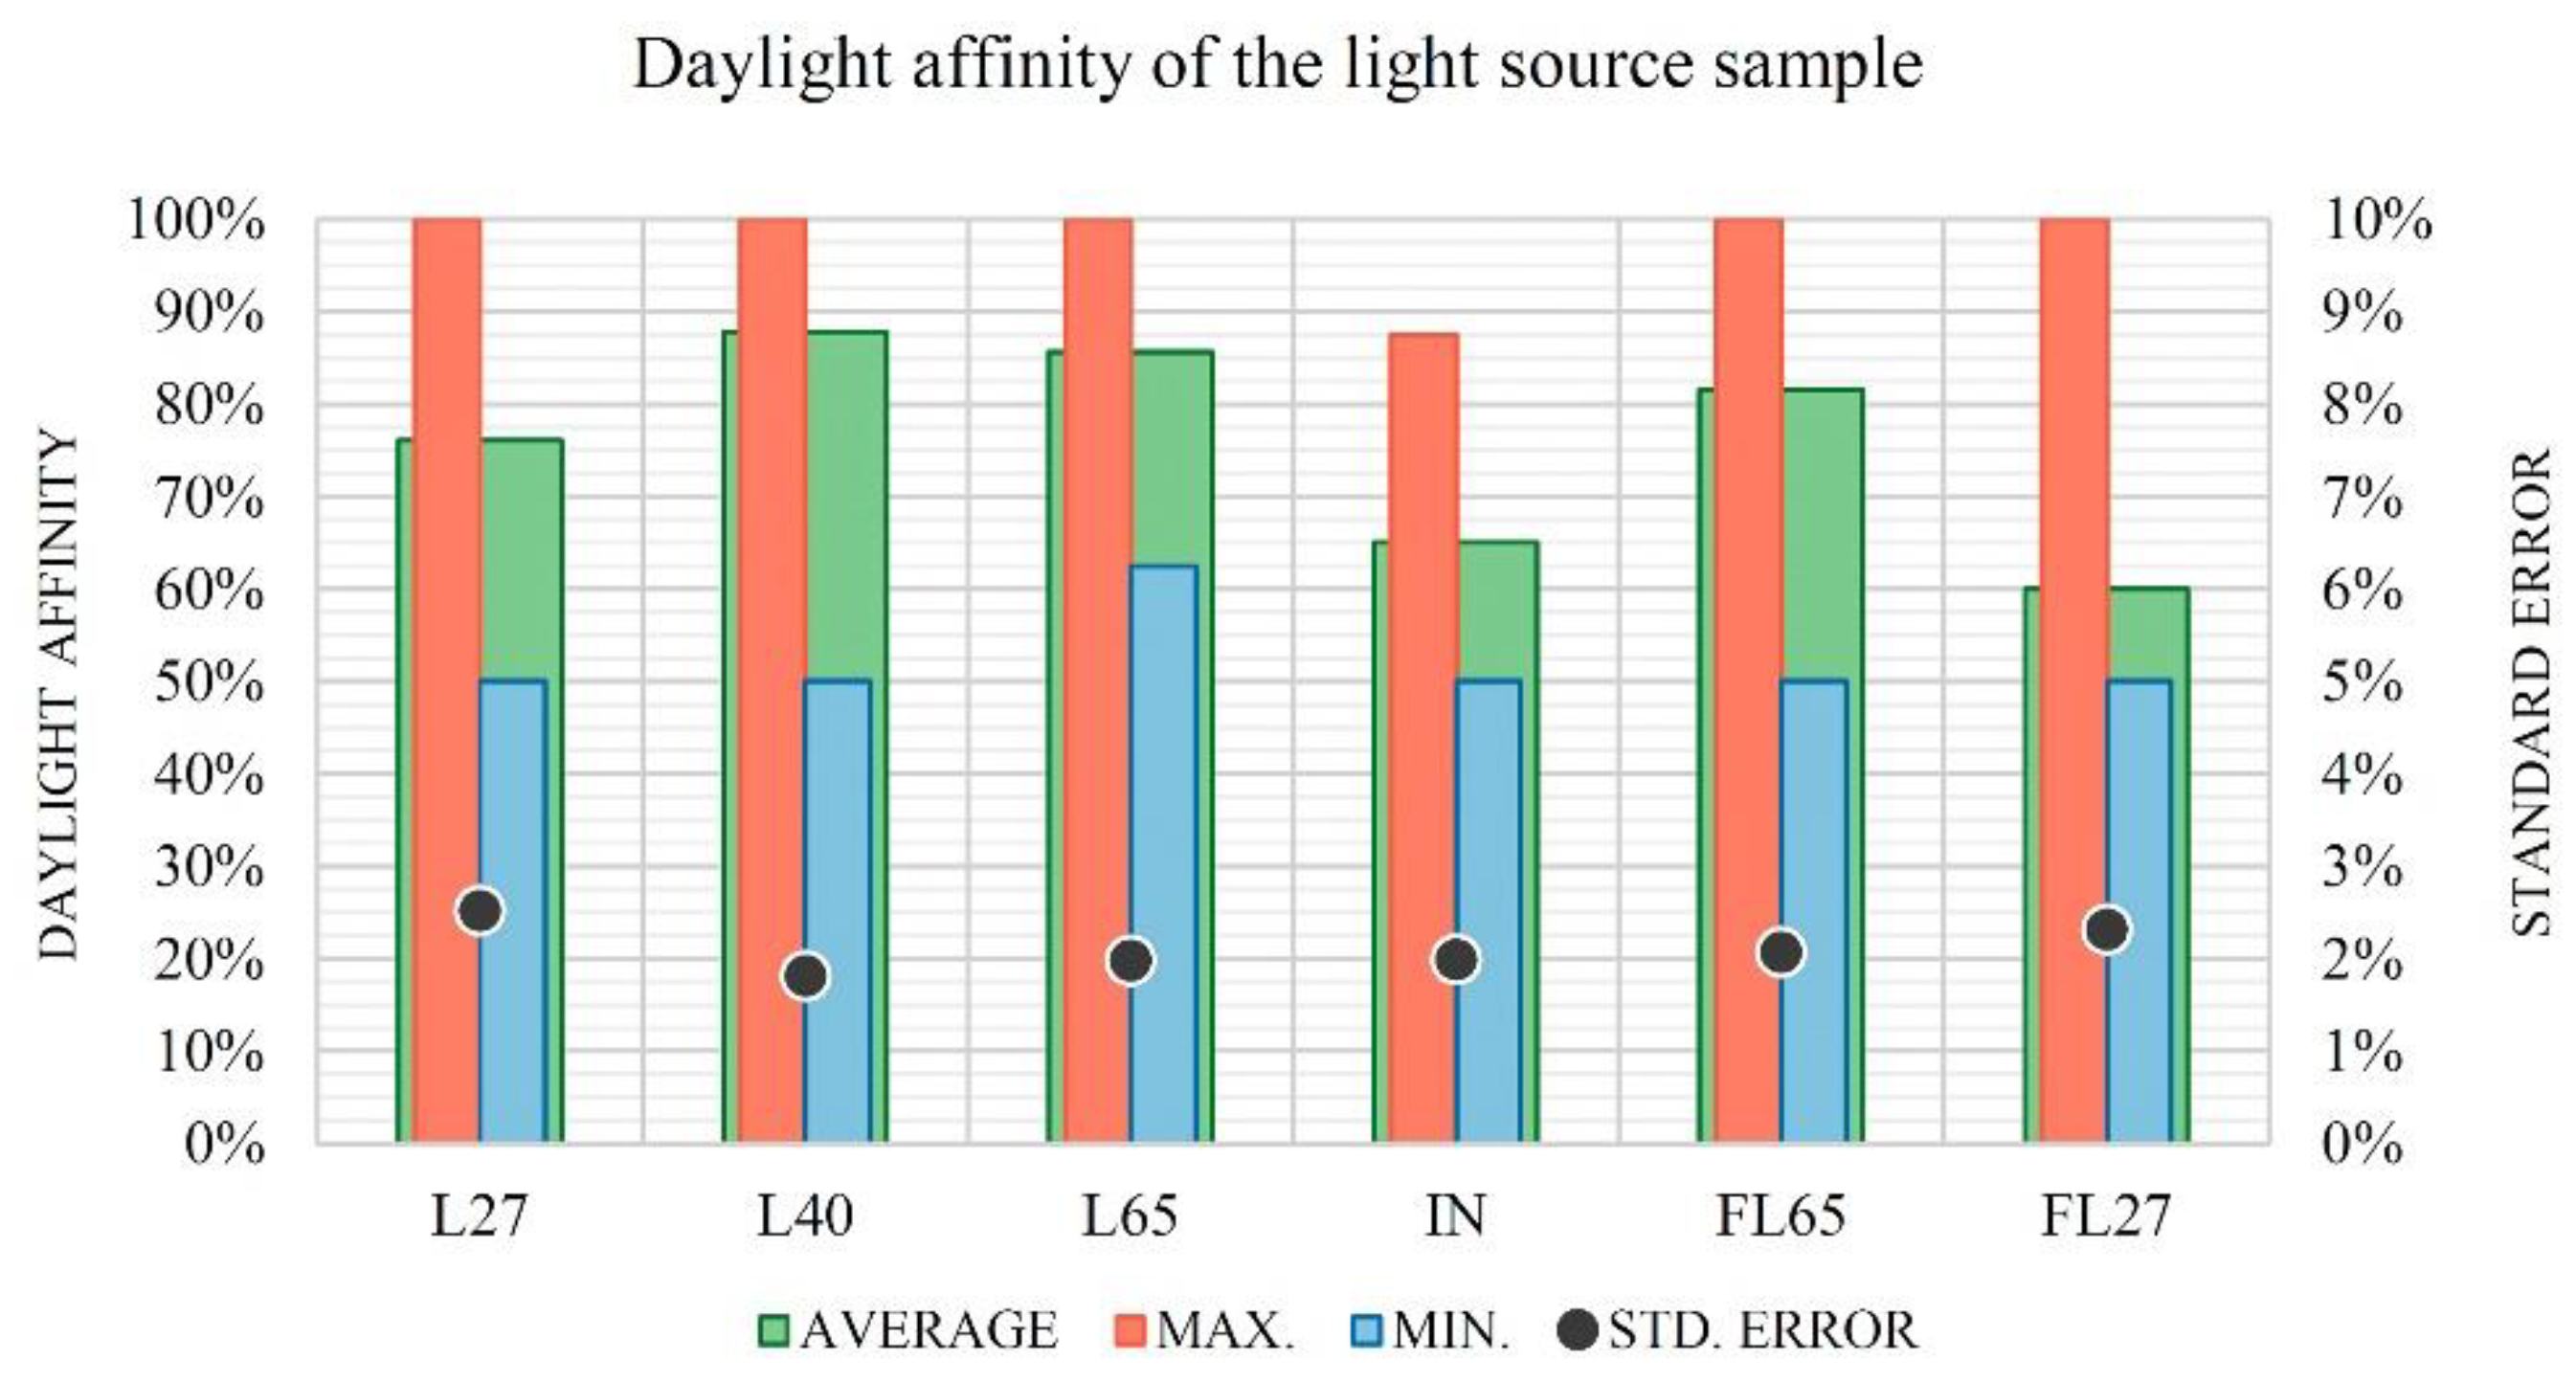
Following the procedure described in the previous analysis, the daylight affinity of the light sources studied was assessed based on the surveys collected. In this case, respondents were questioned on the similarity of the electric light source tested and natural light conditions regarding chromatic performance and color temperature. Each lamp was rated from “very far”—numerical value of 50%—to “very close”—numerical value of 100%. Figure 14 shows the daylight affinity assessed, according to the average, maximum, and minimum score as well as the standard deviation obtained from the surveys and the procedure described above.
For this trial, the students surveyed had the chance to compare natural and electric lighting conditions for each lamp, assessing the hue variation in the Macbeth Color Checker. As expressed in the methodology, the sky conditions were measured with a spectrometer, showing a slight variation of the daylight SPD between CIE D65 and CIE D75.
As deduced from Figure 14, cool lamps, such as the neutral and cool LED (L40 and L65 respectively) as well as the cool fluorescent light source (FL65), provide a higher affinity to daylight conditions, obtaining a score between 82% and 88%. Therefore, it can be concluded that CCT is decisive in determining the affinity of a light source to a natural environment. Specifically, lamps with a CCT between 4000 and 6500 K show not only a noticeable similarity to daylighting but also a better color rendering than other luminaires.
4.4. Accuracy of the Color Rendering Metrics
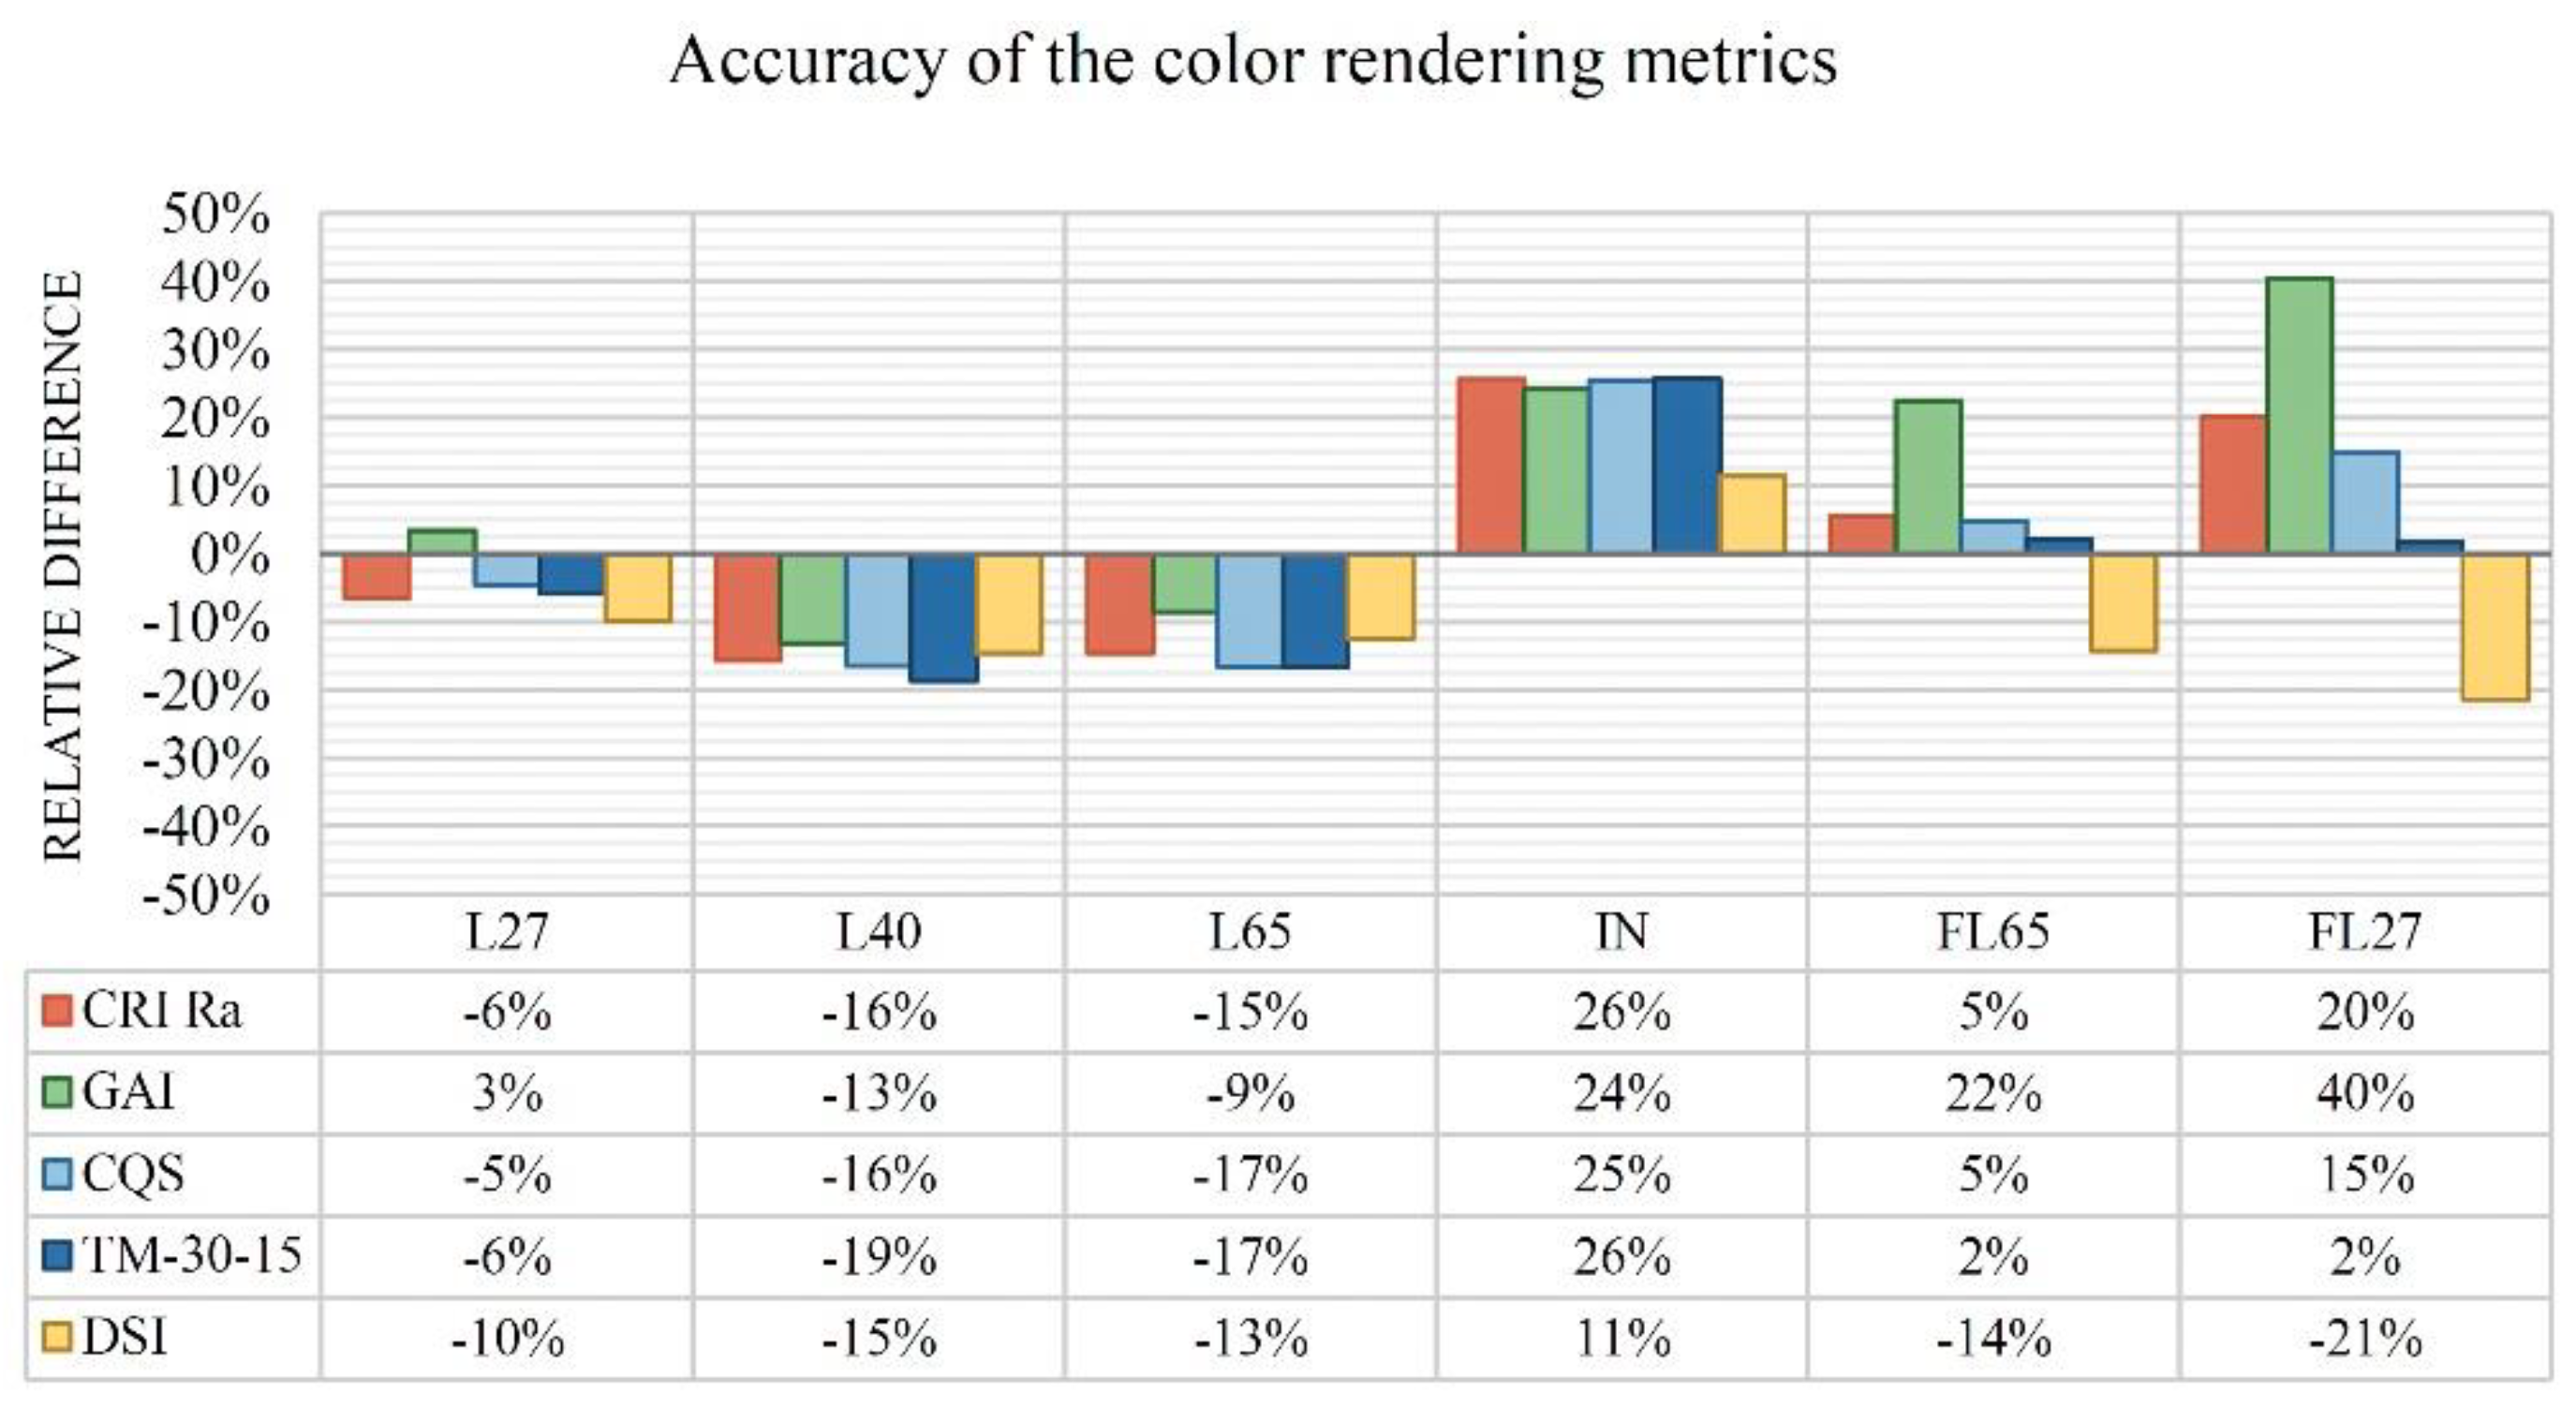
Finally, the accuracy of several metrics widely used for the study of color performance, including DSI, was analyzed. This assessment was based on the results obtained by means of the surveys carried out, which define the average color rendering for individual light sources, as seen in Figure 12, as well as the quantification of each metric shown in Table 1. Accordingly, the relative difference between the average color rendering concluded by the surveys and that quantified by each metric is seen in Figure 15.
At first glance, all metrics tend to overestimate the color performance of incandescent lamps, while LED lamps are usually undervalued, as observed in Figure 15. It is also worth noting that there is a high divergence between the results of the metrics analyzed with regard to fluorescent lamps.
CRI Ra [6] tends to underrate the color rendering of the LED lamps, considering an underestimation of up to 16% in the case of the LED with CCT of 4000 K. Moreover, this metric overrates the incandescent lamp up to 26%, while in the case of fluorescent luminaires, this increase is reduced between 5% and 20%. Based on this brief analysis, CRI would not be a suitable metric to assess the chromatic performance of LED lamps.
As can be deduced from Figure 15, GAI shows accurate results for the estimation of color rendering of LED lamps, although its precision is lower for incandescent and fluorescent luminaires, where the relative difference in the surveys assessed is between 22% and 40%.
CQS [9] shows a better estimation for LED lamps than CRI but overrates the incandescent lamp less, as can be deduced from Figure 15. This metric also demonstrates a suitable quantification of color rendering for fluorescent lamps, showing a relative difference between 5% and 15% for this type of light source. According to the previous statement, this metric could be used to replace the CRI.
Assessing the TM-30-15 Rf metric [12], it can be concluded that the procedure to quantify the color rendering shows similar results to those observed for CQS, although its performance in the evaluation of fluorescent lamps is noticeably higher, achieving a relative difference of 2% with respect to the survey results. Accordingly, this metric could be very useful in determining the color performance of LED and fluorescent luminaires, as its average relative difference for all lamps is close to 10%.
Finally, DSI [31] demonstrates a noticeable performance in evaluating the color rendering for LED lamps analyzed, showing a relative divergence with the surveys assessed of only 12%. This metric also determines the most realistic color perception for incandescent lamps, as its overestimation for this type of light source is only 11%. The relative difference for all lamps is near 14%, which means this metric is notably accurate. However, DSI tends to underrate the color performance of fluorescent lamps, so this procedure might not be so suitable in quantifying the rendering of these luminaires.
5. Conclusions
As deduced from the analysis of results, colorimetry is a science in constant evolution, providing new metrics in an attempt to quantify the color rendering of cutting-edge technology in electric lighting. In general terms, all metrics assessed in this study can be used to describe the performance of a light source, except CRI. In particular, GAI and DSI appear notably accurate in the interpretation of color rendering for LED lamps, although CQS and TM-30-15 demonstrate better precision for the measurement of color performance of fluorescent luminaires.
When further examining the analysis of DSI results, this new metric allows an accurate quantification of color rendering for LED lamps, achieving an average relative difference of 12% for this type of luminaires. This calculation procedure is also employed to quantify the color performance of incandescent lamps with higher precision than other metrics, as discussed in the analysis of results, reaching a divergence of 11% with respect to the surveys assessed. The accuracy of DSI is lower for fluorescent lamps, although this metric can be used in addition to other useful procedures, such as TM-30-15.
It is worth noting that, as stated in the calculation procedure of DSI, this new metric solely focuses on the affinity of the perceived spectrum of the light source analyzed with regard to daylighting, avoiding any chromatic adaptation formulae, color space, or subjective interpretation of results. Therefore, in addition to offering accurate color rendering calculation, it is also easy to determine. Moreover, as described in the aim of this study, DSI can serve to complement other current procedures, such as TM-30-15 or CIE 2017, providing information about the fidelity of the studied light source with respect to daylighting.
Moreover, it should also be noted that LED lamps provide the best color performance of all luminaires, as can be deduced from the surveys assessed. Specifically, LED lamps with a CCT between 4000 and 6500 K produce a better rendering than the rest of light sources tested in this research. Therefore, this type of luminaire not only allows the best energy efficiency but also provides higher chromatic perception, thus highlighting the obsolescence of incandescent and fluorescent lamps.
It should also be recognized that the analysis of the SPD of the light source studied is key in determining the color performance, as it can provide more information about the color rendering than other procedures. In the specific case of color saturation, it can be concluded that the dominant spectrum generated by the lamp determines the hue range where saturation is higher. In addition, it is observed that light sources which provide a better color rendering have a balanced saturation for all hues.
Finally, a clear relationship between color rendering and affinity with daylight conditions can be confirmed. In fact, the lamps that are more similar to the spectral perception of natural light also demonstrate the best color rendering, according to the surveys evaluated. Therefore, daylight acts as the main light source reference for determining the color perception of individuals.
Author Contributions
Conceptualization, I.A.; methodology, I.A., J.L. and P.B.; formal analysis, J.L.; investigation, I.A., J.L. and P.B.; data curation, J.L.; writing—original draft preparation, I.A., J.L. and P.B.; writing—review and editing, J.L. and P.B.; supervision, J.L. and P.B.; funding acquisition, I.A.
Funding
This research was founded by the government of Spain through the research project: Efficient design for biodynamic lighting to promote the circadian rhythm in shift work centers (Ref BIA2017-86997-R). The authors wish to express their gratitude for all the technical and financial support provided.
Acknowledgments
The authors are especially grateful to all those who participated as respondents in this study.
Conflicts of Interest
The authors declare no conflict of interest.
Abbreviations
| Glossary | |
| CRI | Color Rendering Index |
| CQS | Color Quality Scale |
| DSI | Daylight Spectrum Index |
| SPD | Spectral Power Distribution |
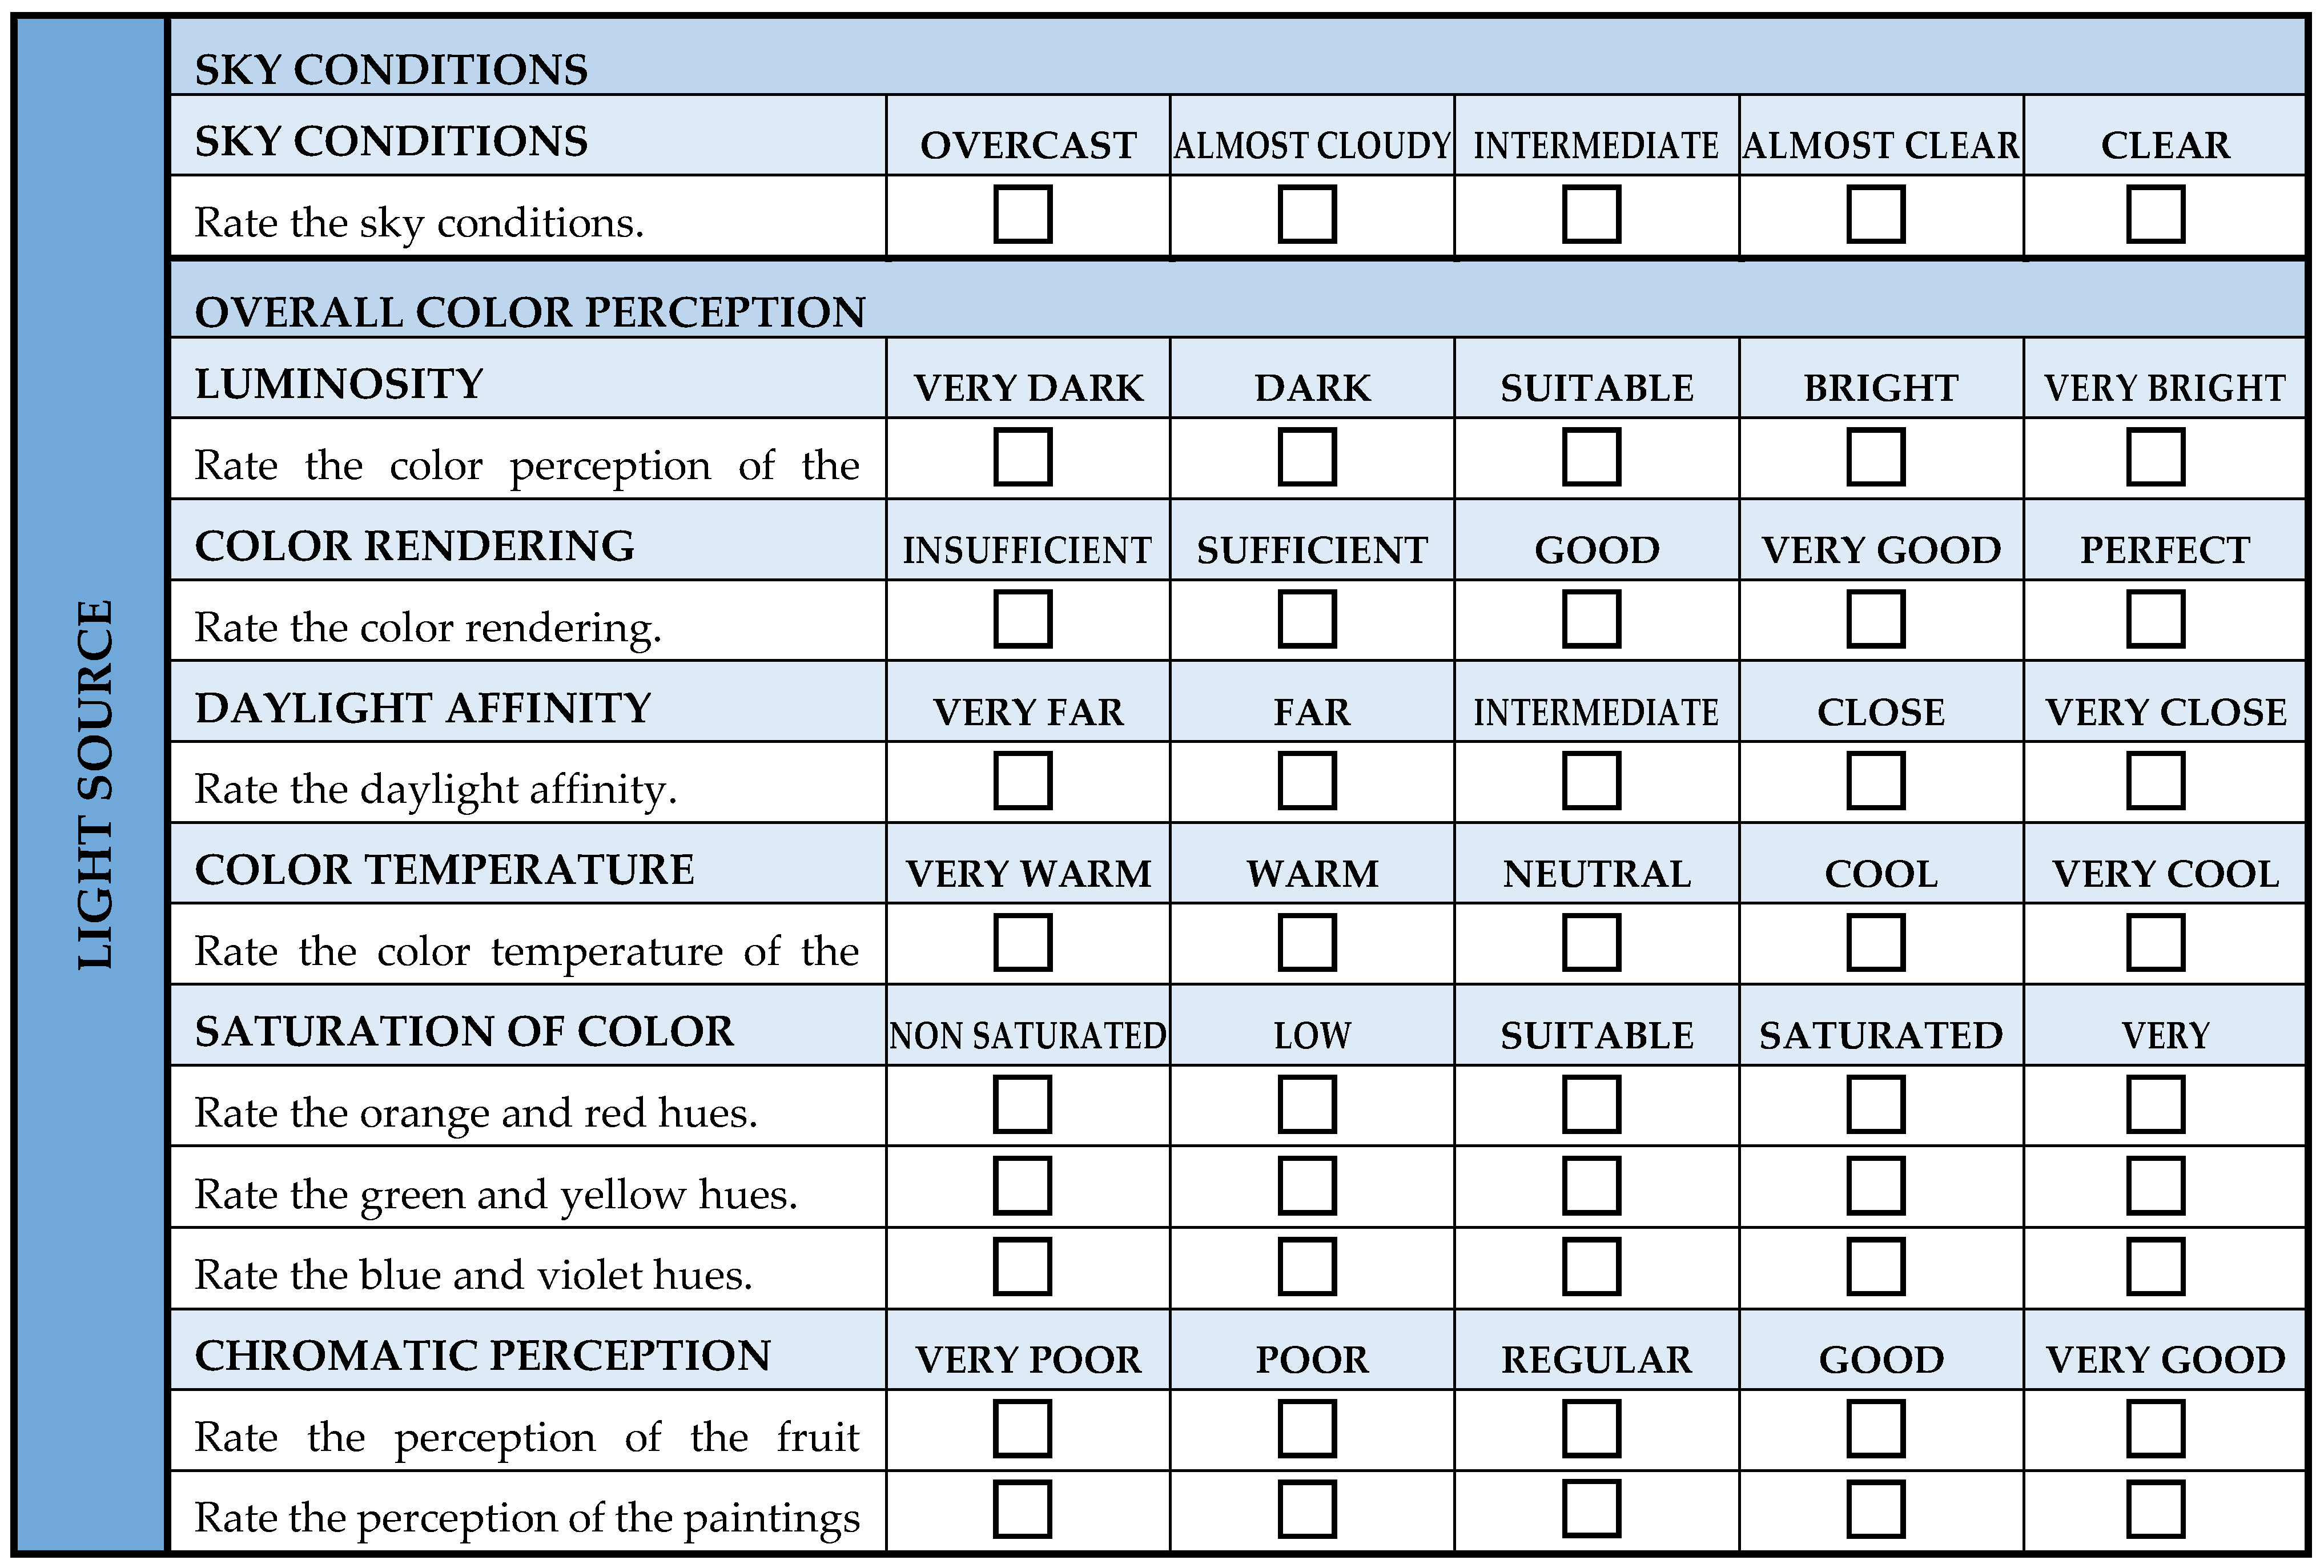
Appendix A. Survey Form
The survey form used for the trial described is shown below. As stated in the methodology, the respondents answered questions on their physiological response to the color perception, as well as others relating to the subjective perception of luminosity, color rendering, color temperature, saturation of different hues and the chromatic perception of the samples observed in the light source testing box. Each light source tested has its own survey box where respondents can assess the color qualities of the specific lamp. As described above, six electric light sources, in addition to natural light, were evaluated by 80 respondents.


References
- Sandor, N.; Schanda, J. Visual colour rendering based on colour difference evaluations. Light. Res. Technol. 2006, 38, 225–239. [Google Scholar] [CrossRef]
- Barbrow, L.E. International lighting vocabulary. J. SMPTE 1964, 73, 331–332. [Google Scholar] [CrossRef]
- MacAdam, D.L. Visual sensitivities to color differences in daylight. J. Opt. Soc. Am. 1942, 32, 247–274. [Google Scholar] [CrossRef]
- Schanda, J. A combined colour preference-colour rendering index. Light. Res. Technol. 1985, 17, 31–34. [Google Scholar] [CrossRef]
- Royer, M.P. What Is the Reference? An Examination of Alternatives to the Reference Sources Used in IES TM-30-15. J. Illum. Eng. Soc. 2016, 13, 71–89. [Google Scholar] [CrossRef]
- CIE TC1. Colour Rendering (TC1-33 Closing Remarks); Technical Report for Commission Internationale de l’Éclairage (CIE): Vienna, Austria, 1999. [Google Scholar]
- Rea, M.S.; Freyssinier, J.P. Color rendering: A tale of two metrics. Color Res. Appl. 2008, 33, 192–202. [Google Scholar] [CrossRef]
- Rea, M.S.; Freyssinier, J.P. Color rendering: Beyond pride and prejudice. Color Res. Appl. 2010, 35, 401–409. [Google Scholar] [CrossRef]
- Davis, W.; Ohno, Y. Color quality scale. Opt. Eng. 2010, 49, 1–16. [Google Scholar] [CrossRef]
- Smet, K.A.G.; Schanda, J.; Whitehead, L.; Luo, R.M. CRI2012: A proposal for updating the CIE colour rendering index. Light. Res. Technol. 2013, 45, 689–709. [Google Scholar] [CrossRef]
- Li, C.; Luo, R.M.; Li, C.; Cui, G. The CRI-CAM02UCS colour rendering index. Color Res. Appl. 2012, 37, 160–167. [Google Scholar] [CrossRef]
- IES Method for Evaluating Light Source Color Rendition; Illuminating Engineering Society: New York, NY, USA, 2015.
- Royer, M.P. IES TM-30-15 Is Approved—Now What? Moving Forward with New Color Rendition Measures. J. Illum. Eng. Soc. 2015, 12, 3–5. [Google Scholar]
- Yaguchi, H.; David, A.; Fuchida, T.; Hashimoto, K.; Heidel, G.; Jordan, W.; Jost-Boissard, S.; Kobayashi, S.; Kotani, T.; Luo, R.; et al. CIE 2017 Colour Fidelity Index for Accurate Scientific Use; Technical Report for Commission Internationale de l’Éclairage (CIE): Vienna, Austria, 2017. [Google Scholar]
- Royer, M.P.; Wei, M. The Role of Presented Objects in Deriving Color Preference Criteria from Psychophysical Studies. J. Illum. Eng. Soc. 2017, 13, 143–157. [Google Scholar] [CrossRef]
- Schanda, J.; Csuti, P.; Szabo, F. Colour fidelity for picture gallery illumination, Part 1: Determining the optimum light-emitting diode spectrum. Light. Res. Technol. 2015, 47, 513–521. [Google Scholar] [CrossRef]
- Lin, Y.; Wei, M.; Smet, K.A.G.; Tsukitani, A.; Bodrogi, P.; Khanh, T.Q. Colour preference varies with lighting application. Light. Res. Technol. 2017, 49, 316–328. [Google Scholar] [CrossRef]
- Hegde, A.L.; Bishop, N. Saturation based color appearance of objects: A comparison between healthy elderly, young adults, and young adults wearing goggles simulating cataract. Build. Environ. 2018, 127, 148–156. [Google Scholar] [CrossRef]
- Houser, K.W.; Wei, M.; David, A.; Krames, M.R. Whiteness Perception under LED Illumination. J. Illum. Eng. Soc. 2014, 10, 165–180. [Google Scholar] [CrossRef] [Green Version]
- Jost-Boissard, S.; Avouac, P.; Fontoynont, M. Assessing the colour quality of LED sources: Naturalness, attractiveness, colourfulness and colour difference. Light. Res. Technol. 2014, 47, 769–794. [Google Scholar] [CrossRef]
- Dangol, R.; Bhusal, P.; Halonen, L. Performance of colour fidelity metrics. Light. Res. Technol. 2014, 47, 897–908. [Google Scholar] [CrossRef]
- Chen, L.Y.; Dai, S.J.; Kuo, C.T.; Wang, H.C. Spectral design and evaluation of OLEDs as light sources. Org. Electron. 2014, 15, 2194–2209. [Google Scholar] [CrossRef]
- Gu, H.T.; Luo, M.R.; Liu, X.Y. Testing different colour rendering metrics using colour difference data. Light. Res. Technol. 2017, 49, 539–560. [Google Scholar] [CrossRef]
- Kim, I.T.; Choi, A.S.; Sung, M.K. Development of a Colour Quality Assessment Tool for indoor luminous environments affecting the circadian rhythm of occupants. Build. Environ. 2017, 126, 252–265. [Google Scholar] [CrossRef]
- Acosta, I.; Leslie, R.P.; Figueiro, M.G. Analysis of circadian stimulus allowed by daylighting in hospital rooms. Light. Res. Technol. 2017, 49, 49–61. [Google Scholar] [CrossRef]
- Beer, E.; Burgt, P.; Kemenade, J. Another Color Rendering Metric: Do We Really Need It, Can We Live without It? J. Illum. Eng. Soc. 2016, 12, 51–59. [Google Scholar]
- Islam, M.S.; Dangol, R.; Hyvarinen, M.; Bhusal, P.; Puolakka, M.; Halonen, L. User preferences for LED lighting in terms of light spectrum. Light. Res. Technol. 2013, 45, 641–665. [Google Scholar] [CrossRef]
- Smet, K.A.G.; Ryckaert, W.R.; Pointer, M.R.; Deconinck, G.; Hanselaer, P. A memory colour quality metric for white light sources. Energy Build. 2012, 49, 216–225. [Google Scholar] [CrossRef]
- Leslie, R.P.; Radetsky, L.C.; Smith, A.M. Conceptual design metrics for daylighting. Light. Res. Technol. 2012, 44, 277–290. [Google Scholar] [CrossRef]
- Katunský, D.; Dolníková, E.; Dolník, B. Daytime Lighting Assessment in Textile Factories Using Connected Windows in Slovakia: A Case Study. Sustainability 2018, 10, 655. [Google Scholar] [CrossRef]
- Allen, E.; Alman, D.H.; McCamy, C.S.; Nayatani, Y.; Ohta, N.; Schanda, J.; Simon, F.T.; Strocka, D.; Terstiege, H. A Method for Assessing the Quality of Daylight Simulators for Colorimetry; Technical Report for Commission Internationale de l’Éclairage (CIE): Vienna, Austria, 1999. [Google Scholar]
- Acosta, I.; Campano, M.A.; Molina, J.F. Window design in architecture: Analysis of energy savings for lighting and visual comfort in residential spaces. Appl. Energy 2016, 168, 493–506. [Google Scholar] [CrossRef]
- Kaminska, A.; Ożadowicz, A. Lighting Control Including Daylight and Energy Efficiency Improvements Analysis. Energies 2018, 11, 2166. [Google Scholar] [CrossRef]
- Acosta, I. Daylight Spectrum Index: Development of a new metric to determine the color rendering of light sources. In Proceedings of the International Conference on Civil and Urban Engineering, Prague, Czech Republic, 14 March 2017. [Google Scholar]
- CIE Division 2. Colorimetry—Part 2: Standard Illuminants for Colorimetry; Technical Report for Commission Internationale de l’Éclairage (CIE): Vienna, Austria, 2006. [Google Scholar]
- Kaiser, P.K. CIE 1988 2° Spectral Luminous Efficiency Function for Photopic Vision; Technical Report for Commission Internationale de l’Éclairage (CIE): Vienna, Austria, 1990. [Google Scholar]
- Birch, J. Efficiency of the Ishihara test for identifying red–green colour deficiency. Ophthal. Physiol. Opt. 1997, 17, 403–408. [Google Scholar] [CrossRef]
Figure 1.
Daylight spectral power distribution (SPD) of the most common skies for Europe. CIE S 014-2/E:2006.
Figure 1.
Daylight spectral power distribution (SPD) of the most common skies for Europe. CIE S 014-2/E:2006.

Figure 2.
Normalized responsivity spectra of human cone cells: short (S), medium (M), and long (L) types.
Figure 2.
Normalized responsivity spectra of human cone cells: short (S), medium (M), and long (L) types.

Figure 3.
SPD of the sky reference modified by color sensitivity functions f(L), f(M), and f(S).

Figure 4.
SPD of the sky reference modified by color sensitivity functions f(L), f(M), and f(S) and normalized for Ta = 10.
Figure 4.
SPD of the sky reference modified by color sensitivity functions f(L), f(M), and f(S) and normalized for Ta = 10.

Figure 5.
SPD of the studied light source modified by color sensitivity functions f(L), f(M), and f(S).
Figure 5.
SPD of the studied light source modified by color sensitivity functions f(L), f(M), and f(S).

Figure 6.
SPD of the light source modified by color sensitivity functions f(L), f(M), and f(S) and normalized for Ta = 10.
Figure 6.
SPD of the light source modified by color sensitivity functions f(L), f(M), and f(S) and normalized for Ta = 10.

Figure 7.
Daylight spectrum index (DSI) for an LED lamp with correlated color temperature (CCT) 6500 K compared with a daylight spectrum CIE D65.
Figure 7.
Daylight spectrum index (DSI) for an LED lamp with correlated color temperature (CCT) 6500 K compared with a daylight spectrum CIE D65.

Figure 8.
Analysis of color rendering of a warm and cool LED lamp in the light source testing box.

Figure 9.
SPDs of the light sources tested.

Figure 10.
Spectral reflectances of the objects tested.

Figure 11.
Spectral reflectances of the Macbeth Color Checker.

Figure 12.
Color rendering of the light sources tested.

Figure 13.
Color saturation of the light sources tested.

Figure 14.
Daylight affinity of the light sources tested.

Figure 15.
Accuracy of the color rendering metrics.


Table 1.
Main colorimetric characteristics of the light sources studied in the testing box.
| Source | 1 | 2 | 3 | 4 | 5 | 6 | 7 |
|---|---|---|---|---|---|---|---|
| Abbreviation | DL | L27 | L40 | L65 | IN | FL65 | FL25 |
| Description | Daylight CIE D65 | LED 2700 K | LED 4000 K | LED 6500 K | Incandescent | Fluorescent 6500 K | Fluorescent 2500 K |
| CCT | 6500 K | 2754 K | 4199 K | 5692 K | 2538 K | 6307 K | 2406 K |
| CRI Ra | 100 | 83 | 84 | 83 | 99 | 87 | 84 |
| GAI CRI | 100 | 91 | 86 | 87 | 97 | 106 | 112 |
| CQS | 100 | 84 | 84 | 81 | 99 | 86 | 78 |
| TM-30-15 Rf | 100 | 83 | 82 | 81 | 99 | 84 | 68 |
| DSI | 100 | 80 | 85 | 84 | 83 | 72 | 55 |
© 2018 by the authors. Licensee MDPI, Basel, Switzerland. This article is an open access article distributed under the terms and conditions of the Creative Commons Attribution (CC BY) license (http://creativecommons.org/licenses/by/4.0/).
Share and Cite
MDPI and ACS Style
Acosta, I.; León, J.; Bustamante, P. Daylight Spectrum Index: A New Metric to Assess the Affinity of Light Sources with Daylighting. Energies 2018, 11, 2545. https://doi.org/10.3390/en11102545
AMA Style
Acosta I, León J, Bustamante P. Daylight Spectrum Index: A New Metric to Assess the Affinity of Light Sources with Daylighting. Energies. 2018; 11(10):2545. https://doi.org/10.3390/en11102545
Chicago/Turabian StyleAcosta, Ignacio, Jesús León, and Pedro Bustamante. 2018. "Daylight Spectrum Index: A New Metric to Assess the Affinity of Light Sources with Daylighting" Energies 11, no. 10: 2545. https://doi.org/10.3390/en11102545
Note that from the first issue of 2016, this journal uses article numbers instead of page numbers. See further details here.