The Impact of Greening Tax Systems on Sustainable Energy Development in the Baltic States
by
 , and
, and
Dalia Streimikiene
1,* ,
,
Indre Siksnelyte
2, 
Edmundas Kazimieras Zavadskas
3 and
and
Fausto Cavallaro
4
1
Lithuanian Energy Institute, Breslaujos 3, LT-4440 Kaunas, Lithuania
2
Department of Business Economics and Management of Kaunas Faculty, Vilnius University, Muitines 8, LT-50229 Kaunas, Lithuania
3
Department of Construction Technology and Management, Vilnius Gediminas Technical University, Sauletekio al. 11, LT-10223 Vilnius, Lithuania
4
Department of Economics, University of Molise, Via De Sanctis, 86100 Campobasso, Italy
*
Author to whom correspondence should be addressed.
Energies 2018, 11(5), 1193; https://doi.org/10.3390/en11051193
Submission received: 18 April 2018
/
Revised: 25 April 2018
/
Accepted: 3 May 2018
/
Published: 8 May 2018
(This article belongs to the Section A: Sustainable Energy)
Abstract
:The paper deals with the greening of tax systems in the European Union (EU), and reviews the achievements of the Baltic States in relation to greening their tax systems and implementing the sustainable energy development goals set by the EU’s energy policies. Environmental taxes promote sustainable energy development, as they allow internalizing the external costs of atmospheric pollution in the energy sector. Energy production and consumption are a major source classical pollutants and greenhouse gas (GHG) emissions. Almost of the all EU member states (MS) apply pollution taxes as the most important economic tool for mitigating the environmental impacts of various economic activities. Considering the importance of the energy sector in terms of its contributions to total atmospheric emissions in the EU, it is supposed that environmental taxes are important drivers of sustainable energy development. Environmental taxes, as the main tool for the integration of negative externalities that are related to atmospheric pollution, are imposed to create incentives for reducing fossil fuel consumption and switching to renewable energy sources or fuels that have a lower carbon content and thus cause less pollution. The paper presents a comparative assessment of the impact of environmental taxes on sustainable energy development indicators in three selected countries from the Baltic region (Lithuania, Latvia, and Estonia) during the period 2005–2015, and reveals the role that the greening of tax systems has had on implementing sustainable energy development targets in the Baltic States.
1. Introduction
The main economic tools to promote sustainable energy development are fiscal and pricing policies for the internalization of the external costs of energy production. All of the European Union (EU) member states (MS) have environmental taxes for atmospheric pollution reduction in the energy sector [1,2]. The European Semester that was established in 2010 aimed for the better coordination of economic policies in EU MS. By establishing The Greening European Semester, the European Commission (EC) has also responded to the economic recession and threats of decreasing employment opportunities in the EU and all over the world. The main idea of The Greening European Semester that was adopted in 2014 was the enhancement of macroeconomic policy coordination among EU MS to promote sustainable development in the EU. In this context, it is obvious that the macroeconomic policies of all of the EU MS are socially, economically, and environmentally sustainable.
The Greening European Semester aims at switching from labor and corporate profit taxes to environmental taxes, and supposes to help in achieving sustainable economic recovery and ensure economic growth and an increase in employment. Therefore, environmental fiscal reform or green tax reform covers tax shifts from labor to environmental pollution and resources consumption, and allows achieving both environmental and economic objectives together [3]. The EC develops annual country-specific recommendations for EU MS. Countries are required to revise prepared National Reform Programs for each year by taking into account specific recommendations developed by the EC. MS should address the main priorities identified by the EC in their National Reform Programs. These priorities, first of all, are related to modifying the taxation system and decreasing the share of labor taxation in total tax revenues. At the same time, the share of taxes related to resource consumption and environmental pollution should be increased in total tax revenues. The environmental taxes promote the increase of resource efficiency by energy efficiency, recycling, and the reduction of EU dependency on energy import.
The Greening European Semester promotes the greening of tax systems in the EU. There have been ideas about the greening of tax systems since 1990, and some EU MS, such as Germany between 1999 and 2003, have implemented green budget reforms [4]. The EU Emissions Trading Scheme also demonstrates an important step towards the harmonized greening of tax systems in EU MS [5,6,7]. In several studies performed by L. Bovenberg et al. [8,9,10,11], most of the attention was paid to the assessment of welfare in terms of increasing the tax rate on pollution alongside reducing the tax on labor in order to keep the same state budget revenues. The main results achieved in these studies confirmed an improvement of environmental quality in all of the cases, but the efficiency result was not realized in several cases. There are other important papers dealing with the same issue. R. E. Lucas applied general equilibrium models [12], and the results indicated that the complete shifting of corporate income tax to other taxation has an insignificant impact on long-term economic growth in the United States (US). However, in numerous papers, important theoretical results were obtained showing the double dividends of tax system greening [13,14,15]. The findings of these studies dealing with environmental fiscal reform indicated that shifting from labor taxes to green taxes would speed up economic growth and increase employment. In several other papers [16,17,18,19], authors assessing the effects of green tax reform applied dynamic general equilibrium models, and reported on the positive outcome of this reform in terms of increased employment and economic growth [20].
The paper analyses the impact of greening environmental taxes on sustainable energy development trends in the Baltic States. This is the first study of such a type conducted in the Baltic States after EU accession in 2004, and provides valuable insights into environmental tax reforms and its implications for the sustainable development of the energy sector. For the assessment of sustainable energy development trends, this study applied a sustainable energy indicators development (ESDI) framework that was developed by the joint efforts of five international agencies and organizations (the International Atomic Energy Agency, the United Nations Department of Economic and Social Affairs, the International Energy Agency, Eurostat, and the European Environment Agency) [21].
The aim of this paper is to compare the environmental taxes that have an impact on the energy sector, and report the results of the sustainable energy development goals’ implementation in the Baltic States.
The main tasks to achieve this aim are:
- to analyze literature on the greening tax system and its impacts;
- to review greening tax steps and their achievements in the Baltic States;
- to analyze the dynamics of sustainable energy development indicators in the Baltic States;
- to perform an analysis of correlation of revenues from environmental taxes and sustainable energy development indicators in Lithuania, Latvia, and Estonia;
- to make policy recommendations based on the analysis conducted.
The methods applied: graphical, correlation, regression, and comparative analysis, and descriptive statistics and generalization methods.
2. Greening Tax Systems and Green Budget Reform
In the EU, the political discussion on greening tax systems started in the early 1990s, which is also when a number of environmental tax reforms were introduced in EU MS. Energy and climate change mitigation polices contribute to smart and “green” growth, and provide numerous other macroeconomic benefits as well. The main EU policy document Europe 2020 sets the goal of achieving 20% of greenhouse gas (GHG) emission reduction, a 20% increase in energy efficiency, and 20% of final energy consumption from renewable resources compared with the year 1990 by 2020. The implementation of sustainable development policies requires ensuring changes to existing production and consumption patterns, as they are unsustainable and lead to such global problems as climate change. Therefore, it is necessary to apply economic instruments that have an impact on behavioral changes towards sustainable production and consumption across all of the economic sectors. There are a large variety of economic tools to implement environmental policies and achieve faster sustainable energy development at the level of the EU. These tools also allow EU MS to reach environmental and sustainable development goals. Such economic tools as fines, taxes, charges, tradable permits, and deposit-refund systems are applied to impose costs on polluters and promote environmentally-friendly behavior.
EU MS have implemented a variety of economic instruments for environmental regulation; these are flexible and cost-effective tools that achieve sustainable development goals. These economic tools enable EU MS to correct market failures and internalize externalities in a cost-effective way, unlike administrative or regulatory measures that tackle environmental problems by setting maximum allowable emissions limits, banning the use of some materials, or enforcing the application of advanced pollution abatement technologies [22].
In the 2014 European Semester, the main goals to be addressed in the member states’ National Reform Programs are linked with the modification of tax, which is a strategy to promote economic growth and employment. Examples include changing the tax burden away from corporate profit and labor taxation on consumption, property, and combating pollution. MS should encourage increasing resource efficiency through promoting waste management, recycling and energy efficiency in order to reduce the dependency on energy imports.
The Annual Growth Survey adopted by the EC emphasizes the importance of phasing out environmentally harmful subsidies and promoting a job-generating green economy. The EC developed recommendations to move toward more growth and environment-friendly tax systems. The Annual Growth Survey emphasizes the importance of green tax reform for setting the European economy on a trajectory of green growth [23]. The main flexible economic instruments that have direct influence on sustainable energy development are environmental fees and charges, taxes, subsidies, and tradable pollution permits or allowances [24,25]. There are several types of environmental taxes, such as: energy taxes or/and CO2 taxes; transport taxes; and pollution and resources taxes (excluding taxes on oil and gas) [26].
The largest share of revenue from all of the environmental taxes is attributed to energy taxes in the EU (Figure 1).
As one can see from Figure 1, in the period 2005–2015, energy taxes—which include transport fuel taxes—accounted for the highest portion of environmental tax revenue, i.e., about 75% of the total EU environmental tax revenues, and each year, the taxes collected are increasing. Energy taxes include all of the taxes on the fuels that are used in the power and heating sector, industry, transport, etc. In 2015, 77% of all revenues from environmental taxes were generated by energy taxes in the EU. CO2 taxes are attributed to energy taxes, as they are usually levied on energy carriers. Taxes on transport represent the next most important source of environmental tax revenues in the EU. Transport taxes cover charges associated with the use and ownership of motor vehicles. Transport taxes count for about 20% of all of the environmental taxes, and only 3% come from pollution/resources taxes.
Several EU MS apply their fuel taxes based on the sulfur contents in the fuels. In 1971, Norway was the first country to do this. Currently, Germany, Austria, Belgium, the Netherlands, and Slovakia differentiate their fuel tax rates based on the sulfur content in fuels. By supporting resource efficiency, taxes can be applied to reduce dependency on resource imports [27,28]. All of the EU MS use energy taxes. The Energy Tax Directive was adopted in 2004. It sets minimum tax levels for the main energy carriers categories consumed in the EU. The Energy Tax Directive does not establish a system of CO2 taxation by itself; it just creates incentives to reduce CO2 emissions through higher energy prices [24,29,30,31].
Pollution and resource taxes include charges on measured or estimated atmospheric emissions (e.g., particulates, NOx, SO2, NH3, Volatile Organic Compounds (VOC), etc.) and emissions into water, taxes linked with noise, raw materials extraction taxes, waste management taxes, etc. The revenue accumulated from resources and pollution taxes is only marginal; revenue from energy and transport dominate in state budgets.
Environmental taxes reinforce the polluter-pays principle in a cost-effective and flexible way, and are important drivers of sustainable energy development. These taxes have been very popular in the energy sector among EU MS, and were introduced with the aim of producing behavioral changes in producers and consumers toward sustainable production and consumption. The increased application of economic tools to reduce atmospheric pollution in the energy sector is being foreseen in several important EU policy documents: the EU main development strategy, Europe 2020, the EU seventh Environment Action Program, and the EU strategy of sustainable development.
The approach taken by EU MS in vehicle taxation varies considerably. EU MS apply various types of taxes on the use, registration, and purchase of vehicles [26]. The main distinguishing feature of transport taxes in EU MS is related to the frequency of tax payment. In some countries, such as Latvia, transport taxes are paid once during the purchase or initial registration of vehicle. In other EU MS, they are paid annually and applied in the form of a license fee. The transport tax bases are generally similar among EU MS: engine power, engine capacity, car weight, CO2 emissions, etc. In 2015, only Lithuania and Estonia had neither a registration tax nor a circulation tax in place.
There are a number of MS that apply air pollution taxes, which are usually from large combustion plants. In 2015, these taxes made up only 3.5% of the total environmental tax revenues in the EU. Lithuania and Latvia are unique in that a very low share of their total environmental tax revenues comes from pollution and resource taxes.
Environmental fiscal reform (EFR) or green tax reform provides economic incentives to implement the polluter-pays principle and solve resource efficiency problems. EFR also provides for additional tax revenues, which enables budgets to be balanced. They also help achieve sustainable development through promoting the transition to a resource-efficient, green economy that supports jobs, economic growth, and innovation. In the following sections of the paper, the steps in greening tax systems in the Baltic States will be reviewed.
3. Greening of Tax Systems in the Baltic States
Environmental taxes enable the natural resources of Estonia, Latvia, and Lithuania to be used in more efficient and sustainable ways. However, the effectiveness of the environmental tax systems is linked to the tax base, tax rate, and evolution of the taxation policy. These issues vary among the Baltic States [32].
3.1. Estonia
Estonia has extensively applied economic instruments of environmental regulation since the 1990s. Environmental taxes applied in Estonia cover the excise duty on fuels, the registration tax on motor vehicles, the heavy goods vehicle tax, pollution taxes, and resource taxes. Excise duties on fuels in Estonia have mainly revenue-generating objectives. The environmental charges that have been implemented in Estonia since 1991 are the most important tool that the country has for achieving its sustainable energy development goals and implementing the polluter-pays principle.
The main types of environmental charges in Estonia are pollution and natural resource charges. The pollution taxes in Estonia cover air pollution charges on atmospheric emissions, water pollution charges, and charges for depositing waste in landfills. Natural resource taxes include water abstraction charges and mineral extraction charges [33].
According to the Alcohol, Tobacco, Fuel, and Electricity Excise Duty Act, which entered into force in 2015, the excise duty is imposed on energy products (aviation petrol, petrol, kerosene, diesel fuel, shale oil, heavy fuel oil, liquid petroleum gas, coal, coke, lignite, natural gas, and electricity) that have either been produced in Estonia or brought into Estonia. The rates of excise duties applied on energy products in Estonia in 2015 are presented in Table 1.
There are several exemptions from excise duty, such as for energy products that are used for purposes other than motor or heating fuel, including mineralogical processes and ships navigating for commercial purposes and fishing, etc. Biogas that is used for heating purposes, oil shale, and solid fuels that are used in households as heating fuel are exempted from the excise duty. In 2015, revenues from energy taxes in Estonia generated about EUR 491.23 million in revenue, which was 2.41% of Estonia’s gross domestic product (GDP) (on average within the EU, energy taxes generate 1.87% of GDP).
There are two types of transport taxes in Estonia: registration and circulation taxes on heavy vehicles. The registration tax rate in 2014 amounted to EUR 121.43 for the registration of a personal vehicle. The circulation tax is imposed on heavy vehicles in Estonia, and is taxed based on total weight. The circulation tax is paid quarterly for the several classes of vehicles. In 2015, revenues from transport taxes in Estonia amounted to EUR 12.16 million, or 0.06% of GDP. On average within the EU, transport taxes generated about 0.5% of GDP between 2005 and 2015. Transport taxes in Estonia provide for very low budget revenues, and in 2015, among the EU’s 28 countries, Latvia was in the 28th position in terms of revenue derived from transport taxes as a proportion of GDP.
The Environmental Charges Act in Estonia entered into force in 2006. According this law, pollution charges are imposed on waste disposal, the emission of pollutants into the atmosphere, groundwater, and soil in Estonia. Revenues from pollution charges in Estonia are transferred into the state budget. The one exception is revenues from pollution charges on municipal waste management, as 75% of the pollution charges on municipal waste disposal are allocated to the budget of the municipalities from which the waste originated. Only 25% of the revenues from pollution charges on waste management go to the state budget. The pollution tax rates in Estonia from 2015 are given in Table 2.
The rates of air pollution charge are increased if the pollutants are emitted into the atmosphere from stationary pollution sources that are located within the boundaries of local governments bordering on the Narva River, and/or if the height of the release of pollutants is higher than 100 m above ground level. The same increased rates are applied to pollutants that are released into the atmosphere from stationary pollution sources located in the Kivioli, Johvi, Narva, Kohtla-Jarve, Sillamae, Tartu, Tallinn, Haapsalu, Kuressaare, Narva-Joesuu and Pärnu administrative territories.
In Estonia, mineral resources extraction charges are imposed on the extraction of mineral resources. In 2015, revenues from pollution and resource taxes in Estonia amounted to EUR 59.44 million, or 0.29% of Estonia’s GDP. On average within the EU, revenues from pollution and resource taxes generated about 0.8% of GDP between 2005 and 2015.
3.2. Latvia
In Latvia, the environmental taxes in 2015 covered the fuel excise duty, subsidized electricity tax, motor vehicles registration tax, motor vehicles circulation tax, company car tax, pollution taxes, and resource taxes. In Latvia, energy taxes covered both taxes on energy products that were used in transport, and stationary pollution sources. The most important petroleum products for transport in Latvia are petrol and diesel fuel. There are two types of energy taxes: excise duties applied to energy products, and the subsidized electricity tax, which was introduced on 1 January 2014. This new tax is time-limited, and applies to income received between 2014 and 2017. The following excise duties were applied to energy products in Latvia in 2015 (Table 3).
There are some exemptions for excise duties in Latvia. They apply to fuels used in aircraft and ships (except those used for private recreation); the generation of energy in combined heat and power (CHP), and chemical treatment plants. The total revenue from energy tax in Latvia in 2015 amounted to EUR 758.19 million, which was the equivalent of 3.11% of Latvia’s GDP.
The income that was collected from the electricity taxes was used for a newly established Electricity Customer Support Fund. The fund was established to offset the rising electricity costs caused by the increased utilization of renewable resources. The Compulsory Procurement Component has been added to electricity bills since 2013 to support the use of renewable energy sources. The rates of electricity tax are linked with the fuel used for electricity production. For example, there is a 15% charge on the income generated from fossil fuels used in CHP plants, while the charge on the income generated from renewable resources is only 10%. CHP plants with a capacity of up to 4 MW that are using fossil fuels, and CHP plants that are using renewable resources where heat is delivered to district heating systems are charged only 5%.
There are three specific types of transport charges in Latvia: registration tax for cars and motorcycles, and two circulation taxes. One circulation tax is applied to all vehicles, and another is applied only to company cars.
Car registration taxes are paid for all of the vehicles that are registered in Latvia. There are a few exemptions; the vehicles that are exempt from custom duties include vehicles that are more than 25 years old (having a “historical car” status), electric vehicles, vehicles adapted for people with disabilities, sports cars, and motorcycles.
The circulation tax is called the Motor Vehicles Tax in Latvia, and is paid annually for all vehicles, except tractors and trailers weighing less than 3.5 tons, trams, trolleybuses, off-road vehicles, snowmobiles, mopeds, and bicycles. Exemptions are also applied for emergency and diplomatic vehicles, and vehicles used by people with disabilities. The Company Car Tax is a monthly circulation tax on vehicles that are used both by companies and personal vehicles. The tax has been collected since 1 January 2011. The rate of the vehicle operation tax for such cars, which was registered for the first time on 31 December 2008 and came into effect in Latvia after 31 December 2016, is calculated based on the amount of carbon dioxide (CO2) emissions caused by the vehicle in grams (g) per kilometer (km) (EUR 0–EUR 756) [35]. There are no aviation charges in Latvia.
Vehicles are also taxed under the Natural Resources Tax, in addition to being subject to registration taxes. Those who import or sell vehicles in Latvia pay this. The rate of this tax was EUR 40 per vehicle in 2014. The total revenue for Transport Tax in Latvia in 2015 amounted to EUR 110.87 million, which was equivalent to 0.46% of Latvia’s GDP.
The Natural Resources Tax in Latvia covers the aggregates tax, water pollution tax, landfill tax, water abstraction tax, taxes on various goods that have a negative impact on the environment, taxes on materials used for packaging purposes, taxes on radioactive materials, taxes on atmospheric pollution (including CO2), taxes on the use of various coal types, and a tax on the pumping of natural gas or GHG into geological structures (Aarhus University, Roskilde, Denmark 2015). Tax revenues for the extraction or use of natural resources or/and environmental pollution are also paid; these amount to: 1.4% into the State budget, and 2.6% into the budget of the local municipality in which the relevant activity is being performed [36].
The Waste Disposal Tax and Landfill Tax were introduced in Latvia in 1991, the rates on these taxes have increased several times since their introduction. The most recent increase was in January 2014. The tax rate is charged on a per ton basis, and depends on the type of waste disposed. For example, in 2015, municipal waste was charged EUR 12.00 per ton; construction and demolition waste was charged EUR 21.34 per ton; asbestos was charged EUR 35.57 per ton; hazardous waste was charged EUR 35.57 per ton; and industrial waste was charged EUR 21.34 per ton [35].
The Water Abstraction Tax is applied depending on the quality and type of water extracted. Customers who consume more than 10 cubic meters within a 24-h period are obliged to pay this tax. Rates are set based on water management costs.
The Aggregates Tax is applied to the tax extraction of natural materials. It is applied on the basis of the weight or volume of extracted natural materials.
Air Pollution Tax rates are applied to emissions of atmospheric pollutants (including CO2) in Latvia; the 2015 rates are given in Table 4. In the same table, the pollution charge rates on pollutants that have been discharged into water (2015 rate) are also presented.
Packaging Taxes are applied to materials that have been used for packaging, and are taxed on a per kg basis. This also includes plastic bags. Tax charges for the pumping of natural gas and greenhouse gases into geological structures depend on the particular gas pumped [34,35,36].
In 2015, the total revenue for environmental taxes in Latvia amounted to EUR 892.13 million, which was equivalent to 3.66% of Latvia’s GDP (the EU average for environmental taxes was 2.43% of GDP) [37].
3.3. Lithuania
Lithuania implemented economic instruments for environmental regulation in 1991. The environmental taxes that have been applied in Lithuania currently cover the fuel excise duty, motor vehicles registration tax, the heavy goods vehicle tax, pollution taxes, and resource taxes.
There is one type of energy tax in Lithuania: excise duty. The following energy carriers are subject to excise duty: energy products; coal, coke, and lignite; electricity; and other products if they are sold or used as motor fuel, fuel additives, or as heating fuel [38]. The Law on Excise Duty of the Republic of Lithuania was adopted in 1994. It was valid until 30 June 2002. In accordance with the harmonization process of Lithuanian legislation and EU legislation, a new edition of the Law on Excise Duty was adopted in 2004. In order to implement the new provisions of the Council Directive 2008/118/EC, which were related to the general arrangements for excise duty, a new Law on Excise Duty was adopted in Lithuania on 1 April 2010.
The excise duties that were applied to the energy products in Lithuania in 2015 are given in Table 5.
There are several exemptions from the excise duty in Lithuania. The Lithuanian Law on Excise Taxes provides exemptions from the excise tax for electricity that is generated from renewable resources. Exemptions include motor fuels that are supplied or used for the purpose of air navigation; ship fuel supplied or used for the purposes of navigation within community waters; energy products when they are used for purposes other than as fuel; heating fuel; energy products that are used for the production of all types of electricity; coal that is sold or in any other way transferred into residents’ ownership; electricity from renewable energy sources; electricity and natural gas used in households, etc. In 2015, revenues from energy taxes in Lithuania amounted to EUR 622.94 million, which was equivalent to 1.66% of Lithuania’s GDP.
There are two types of transport taxes imposed in Lithuania: registration tax and circulation tax on heavy vehicles. The registration tax or vehicle import duty is levied on vehicles between seven and 10 years old, which amounts to 5% of their customs value, and vehicles greater than 10 years old, which amounts to between 10–20% of their customs value. The circulation tax on heavy vehicles is taxed according to their total weight. These taxes generate very low revenues, and in 2015, among the 28 EU countries, Lithuania was in the 27th position in terms of revenue derived from transport taxes as a proportion of GDP.
The law on pollution taxes was adopted in Lithuania in 1991. There are pollution taxes for polluting the environment from stationary pollution sources, mobile pollution sources, and packaging waste [39]. The pollution tax for polluting the environment from stationary pollution sources is paid by natural and legal persons who pollute the environment; these people are obliged to have a permit for the usage of natural resources with determined rates for the emission of pollutants into the water, the atmosphere, the ground, and deeper layers of the soil.
The pollution tax for polluting the environment from mobile pollution sources is paid by natural and legal persons who pollute the environment through mobile sources used for economic and commercial activities. The manufacturers and importers of goods pay the pollution tax for polluting the environment with goods and/or packaging waste.
The pollution tax in Lithuania is imposed on pollutants that are discharged into the environment, including specified goods (tires and accumulators used in transport vehicles, and others) and specified filled packaging (glass, plastic, metal, paper, and other packaging).
The pollution tax for emitting pollutants from stationary sources of pollution is paid according to the actual amount of pollutants discharged into the atmosphere, water bodies, and soil during the reporting period. The tax for emitting pollutants from mobile sources of pollution (except for aircrafts) is calculated according to the amount of fuel used during the reporting period, and for pollutants emitted from aircrafts, the number of taking-off and landing cycles. The pollution tax for polluting the environment with packaging waste is calculated according to the amount of taxable goods that were actually placed on the internal market of the Republic of Lithuania.
The pollution tax, except for that paid for polluting the environment with packaging waste, is allocated in the following way: 1.3% of the revenue goes to the state budget, and 2.7% goes to the municipal budget of the municipality in the territory in which the object of pollution was located. These funds are used to finance the environmental investment projects that are provided for in the Lithuanian Environmental Investment Fund program, and measures that are provided for in the special municipal Environment Protection Support Program, respectively. The tax for polluting the environment with goods or packaging waste is paid to the state budget. These funds are used for implementing the goals of the Program on the Management of Goods or Packaging Waste that was established in the Law on Waste Management of the Republic of Lithuania.
There are pollution tax exemptions in Lithuania. They are linked to the use of biofuel and reductions in atmospheric pollution from stationary pollution sources of at least 5%. Such pollution sources are exempted from taxes for up to three years from the beginning of implementation.
There are exemptions from the pollution tax for pollution from mobile sources if: exhaust gas neutralization systems are installed and operating; vehicles are used for agricultural activities; the income gained from such activities account for more than 50% of the total income; or transport vehicles use and submit documents certifying the consumption biofuel of established standards.
The stationary pollution sources tax rate is charged per ton of pollutants emitted into the atmosphere (Table 6).
The rates of the pollution tax are indexed by applying the consumer price index according to the procedures developed by the government or institutions authorized by it. The pollution tax with an increased tax rate is applied in cases where the set amount of allowed pollutant emissions from stationary sources is exceeded, or the amount of pollutants, taxable goods, and/or taxable packaging is concealed.
The Law on State Natural Resources Tax was adopted in 1991, and revised in 2006, 2010, and 2014. The tax rates for different materials were set out in the Law and differentiated depending on the natural resources. From 2010, taxes on minerals and water resources were allocated in the following way: 90% went to the state budget, and 10% went to the municipal budget in the territory where the minerals and water were extracted. The generated revenues are used to finance the measures that are provided for the special municipal Environmental Protection Support Program [40]. The total revenue for pollution and resource taxes in 2015 was EUR 36.86 million, which was equivalent to 0.1% of Lithuania’s GDP.
3.4. Comparison of Baltic States’ Environmental Taxes
The Baltic States have implemented quite different taxation systems. There is no vehicle tax in Lithuania and Estonia that applies to all vehicles. The International Monetary Fund has recently recommended that the Baltic States introduce taxes on vehicles. For all of the Baltic States, the revenues from taxes on pollution and natural resources account for a small portion of the total environmental tax revenues. Although there are quite different tax rates linked to the energy sector in the Baltic States, it is obvious that Estonia has the highest burden of environmental taxes targeting the energy sector of all the Baltic States [41].
When comparing the environmental taxation and greening of tax systems among the Baltic States, the main findings should be addressed with precaution. Low environmental tax revenues can be linked to quite low or very high rates of environmental taxes. At the same time, higher revenues from environmental taxes can be linked to low tax rates, which create incentives to purchase low-taxed and cheap products. For example, the implementation of high rates of excise duties in the Baltic States caused a reduction of revenues to the budget, because citizens started to buy these products in neighboring countries that had lower excise taxes, such as Poland. However, a comparison of the ratios of environmental tax revenues to GDP is an informative indicator for comparing the Baltic States in terms of achievements related to greening budget revenues and the importance of environmental taxes for accumulating budget revenues. It is expected that the increase in revenues from environmental taxes that are linked to the energy sector have an impact on the implementation of sustainable energy development targets.
In Lithuania, the environmental taxes in 2015 accounted for 1.85% of Lithuania’s GDP. For Lithuania, this is one of the lowest results since 2002, when the revenue accumulated from environmental taxes reached 2.81% of Lithuania’s GDP. Energy taxes are responsible for the largest share of revenue that was collected from environmental taxes in Lithuania. In 2015, the revenue from energy taxes in Lithuania reached 1.66% of GDP, which was half of what was acquired in Estonia (3.11% of GDP). The revenue that was accumulated from pollution taxes, resources taxes, and transport taxes in Lithuania provided only 0.19% of Lithuania’s GDP in 2015. Such a small number is very unusual among the other EU MS, as for most of them, revenues from transport taxes are the second largest contribution to the state budget from environmentally-linked taxes.
Environmental tax revenues in Lithuania in 2015 were significantly below EU MS average (2.43% of GDP), as were energy tax revenues. Revenues from pollution and resource taxes were also quite low in comparison with the average among the EU MS. In 2015, within the EU MS, Lithuania was in the 25th position in terms of revenue accumulated from environmental taxes as a share of GDP, in the 21st position in terms of the energy tax revenues’ proportion of GDP, in the 27th position in terms of the transport tax revenues’ proportion of GDP, and in 9th position in terms of the pollution/resources tax revenues’ proportion of GDP.
In Estonia, revenues from environmental taxes in 2015 accounted for 2.77% of GDP, and were lower than previous years, as well as lower than the EU average (2.43% of GDP). In 2015, the government increased some excise duties to match the established minimum rates by the EU. In its green budget reform efforts, the Estonian government increased taxes on consumption and environmental taxes to finance cuts in personal income taxes. In 2015, energy taxes made up the largest proportion of environmental taxes (2.41% of Estonia’s GDP). Pollution and resources taxes contributed 0.29% of Estonia’s GDP, and transport taxes contributed 0.06% of Estonia’s GDP.
In terms of the revenues collected from all of the environmental taxes as a share of GDP, Estonia was in a higher position compared with Lithuania; it was ranked 11th in the EU in 2015. In terms of the revenues that were accumulated from energy taxes as a proportion of GDP, Estonia was ranked 7th among the EU’s 28 countries. However, for revenues from transport taxes, Estonia was ranked 28th in the EU.
In Latvia, revenues from environmental taxes in 2015 accounted for 3.66% of GDP, and each year, they are growing. This is 1.23% higher than the EU MS average (2.43% of GDP). In 2015, energy taxes accounted for the largest proportion of environmental taxes (3.11% of Estonia’s GDP). In comparison with the other Baltic States, Latvia generated quite high revenue from transport taxes (0.46% of GDP). In 2015, the ratio of transport tax revenues to GDP in Latvia was very close to the average level among EU MS (0.48% of GDP). However, revenues generated from pollution taxes, resources taxes, and energy taxes were lower in Latvia than in Estonia and Lithuania (0.09% of GDP); at the same time, they were still higher than the average among EU MS (0.08% of GDP).
Latvia ranked fourth among the EU MS in terms of the proportion of its GSP that came from environmental taxes, second in terms of the proportion of its GDP that came from energy tax revenues, 14th–15th in terms of the proportion of its GDP that came from transport tax revenues, and 10th in terms of the proportion of its GDP that came from pollution/resources tax revenues.
In Figure 2, the changes in environmental tax revenues as a proportion of GDP in the Baltic States between 2005 and 2015 are presented.
Based on the results provided in Figure 2, one can notice that the lowest ratio of revenues for environmental tax to GDP can be observed in Lithuania, i.e., slightly below 2%. In Latvia and Estonia, the proportions of revenues from environmental taxes were over the EU MS average level between 2009 and 2015. The most significant proportion of revenues that came from environmental taxes was in Latvia in 2010.
Figure 3 presents the changes in revenues generated by energy taxes in the Baltic States.
Comparing the Baltic States in terms of the revenues generated from environmental taxes linked to the energy sector, it is obvious that Estonia had the most significant contribution of revenues to its GDP from energy taxes. Meanwhile, Lithuania had the lowest proportion of revenues to its GDP from energy taxes (Figure 3).
Figure 4 presents the changes in environmental tax revenues as the proportion of total revenues from taxes and social contributions in Lithuania, Latvia, and Estonia.
In 2015, Latvia had the highest proportion of revenues in overall environmental taxes and social contributions, followed by Estonia. Lithuania had the lowest proportion of environmental tax revenues in total taxes and social contributions; however, this proportion corresponded to the EU average in 2015. In most of the EU MS, the share of environmental taxes in total taxes and social contributions ranged 6–10%. In 2015, the EU average proportion of environmental taxes in total taxes and social contributions was 6.13%.
Eurostat provides an important indicator for comparison of EU MS in terms of energy taxes: the implicit tax rate on energy. This indicator allows assessing the importance of energy taxes to a country’s economic development. A higher implicit tax rate on energy represents a higher taxation burden applied on energy consumption in the country. The energy implicit tax rate is represented as EUR/ton, and is defined as the ratio between revenues from energy taxes and final energy consumption within a specific year. The implicit tax rate is a useful indicator for comparative assessments of energy consumption taxation, as it is not linked to the size of the tax base in the specific country. In the EU between 2005 and 2015, the implicit tax rate on energy increased from 193.88 EUR/tone to 233.4 EUR/tone, which was an increase of more than 20%. However, two things were observed: in 2008, there was a decline in energy tax revenue due to the global financial crisis, and in 2010, there was a substantial increase in final energy consumption that exceeded the increase in revenues from energy taxes. The changes in the implicit tax rates on energy in the Baltic States are given in Figure 5.
In 2015, Latvia had the most significant implicit energy tax rate among the Baltic States (173.98 EUR/ton). Lithuania had the lowest effective energy tax rate (only 115.35 EUR/ton), followed by Estonia (153.8 EUR/ton). Lithuania’s implicit energy tax rate was almost half the EU average.
3.5. Comparison of Price-Based Instruments in the Baltic States
The greening of a tax system is also related to other fiscal measures that promote environmental protection and clean energy. Electricity generation is a key sector of GHG emissions, and is very important in terms GHG mitigation policies. Besides environmental taxes, governments are also implementing other economic measures for the internalization of externalities such as subsidies for clean energy carriers. The Baltic States have implemented various policies that aim to reduce GHG emissions and promote the use of renewable energy sources. These policies are also implemented with the aim of achieving sustainable development in the energy sector.
Policies that promote renewable electricity are categorized into a few categories; these include quantity-based policies and price-based policies. In price-based instruments, the regulator sets a specific price for a specific variable that is related to the use of renewable energy sources. In quantity-based policies, the desired level of outcome is defined, and an artificial market is created. The participants in this market can act freely to fulfill their needs, while at the same time contributing toward an energy policy target.
Feed-in tariffs are a price-based instrument; they are also one of the most popular renewable energy support instruments for renewable electricity in EU MS. Feed-in tariffs are usually set within a fixed-price scheme that guarantees operators in the electricity sector a defined price for electricity that is sold to the grid. Alternatively, feed-in-tariffs can be set as premium tariffs that are added as a specific bonus to the wholesale market price of electricity perceived by generators. Usually, the duration of premium tariffs and the size of tariffs vary between countries. There are other types of renewable electricity support schemes, such as tax allowances, tradable green certificates, investment grants and loans, net-metering policies, and various tendering schemes that are applied separately and in combination with other policies and measures in the energy sector. All three Baltic States have feed-in tariffs for the promotion of renewable electricity.
In Estonia, power generation from renewable resources is promoted by a premium feed-in tariff. The set bonus is additional to the price of electricity on the wholesale market, and does not differ for the specific renewable energy technologies. In addition, CHP plants using peat and oil-shale waste with a capacity of less than 10 kW are eligible for a premium tariff. Also, investment support schemes that cover 80% of project costs are available for bioenergy and wind energy plants. The government also finances up to 60% of the eligible investment costs for the construction of CHP plants and infrastructure linked to CHP plants [32].
In Latvia, electricity generation from renewable resources is promoted through a quite complicated support scheme, which is linked to a wide variety of feed-in tariffs. In Latvia, all of the renewable energy technologies in the electricity sector (except large hydropower plants (HPP) >10 MW) in Latvia receive support. The feed-in tariff rates are linked to the price of natural gas by setting a specific coefficient that is linked to the size of the power plant. There are different regulations set in Latvia for power plants and CHP plants. Feed-in tariffs are set for a period of 20 years, and rights to sell electricity within the mandatory procurement process are granted for electricity suppliers through tender procedures. For the first 10 years of operation, a reduced feed-in tariff rate is applied for the operators of renewable electricity plants.
In Lithuania, three policies promote renewable electricity: feed-in tariffs, tax regulation, and grants. Feed-in tariffs for electricity production from renewable energy sources in power plants exceeding a capacity of 10 kW are allocated through tender procedures. The National Control Commission for Prices and Energy (NCCPE) in Lithuania sets the maximum feed-in tariff for the subsequent tender quarterly, and the market participant asking for the lowest feed-in tariff wins the competition. Power plants that have a capacity lower than 10 kW can sell the electricity that they produce from renewable resources at an established guaranteed price, which is defined by the NCCPE. The feed-in tariffs in Lithuania are established for small-scale HPPs with a capacity lower than 10 MW, biomass plants, wind power plants, and solar energy. A feed-in tariff support scheme was introduced in Lithuania from 1 April 2002, and will be operational until 31 December 2020.
In addition, the producers of electricity from renewable resources in Lithuania are eligible for grants from the Fund for the Special Program for Climate Change Mitigation and the Lithuanian Environmental Investment Fund. The intensity of the subsidies is up to 80% of the total project costs. Besides that, in Lithuania, electricity production from wind and biogas is supported under the Rural Development Program. As mentioned above, the Lithuanian Law on Excise Taxes provides exemptions from excise tax for electricity that is generated from renewable energy sources. In addition, biofuel power plant operators are eligible for environmental (atmospheric) pollution tax allowances.
In the following sections, the dynamics of sustainable energy indicators will be compared in the Baltic States in order to assess the impact of greening tax systems on the achievements of the Baltic States in relation to implementing sustainable energy development targets. A sustainable energy indicators framework will be developed for addressing the main EU energy policy targets that are linked to sustainable energy development.
4. Research Methodology and Results
The research methodology that was used to find out the impact that environmental taxes have had on the Baltic States’ sustainable energy development goals is presented in the following sections.
4.1. Framework of Energy Indicators for Sustainable Development
Sustainable energy development is the main energy policy goal of the EU. The EU has established three main priorities for sustainable energy development: competitiveness, environmental sustainability, and energy supply security. The competitiveness is linked to the EU strategy Europe 2020, which was established in order to encourage the EU MS to be among the most competitive countries in the world regarding sustainable energy development. Another important target for the EU is to achieve the environmental sustainability of the energy sector. The main attributes of environmental sustainability in the energy sector are reducing GHG emissions, increasing the utilization of renewable energy sources, and improving energy efficiency. Energy security is a core problem for the EU; therefore, diversifying energy supplies and reducing the energy dependency of EU MS are among the sustainable development priorities for the EU’s energy sector.
Several indicator frameworks were created in order to assess sustainable energy development trends in specific countries. Among these, the Energy for Sustainable Development Indicators (ESDI) framework is the most widely applied. It was first developed by the joint efforts of five international agencies and organizations: the International Atomic Energy Agency, the United Nations Department of Economic and Social Affairs, the International Energy Agency, Eurostat, and the European Environment Agency. These organizations are recognized worldwide as leaders in energy and environmental statistics and analysis [21]. The framework outlines general guidelines and specific methodology sheets for 30 energy indicators in order for statisticians, analysts, policymakers, and academics to analyze the effects of energy policies on the social, economic, and environmental dimensions of sustainable development. The nine indicators from the main ESDI list, which are linked to the economic, social, and environmental dimensions of sustainable energy development, were selected for this study. A comprehensive description of the selected ESDI indicators for this study, and their links to the EU’s energy and environmental policies targets, can be found in [42]. Other empirical studies also applied some indicators from the ESDI framework. The Energy for Sustainable Development framework has also been applied to sustainability assessments of electricity market models [43,44,45,46], energy-efficiency policies [47,48], and the impact of corporate social responsibility on sustainable energy development [49,50].
Trends in the energy intensity of the economy and primary energy consumption can be analyzed by applying the economic indicators from the EISD list. Social indicators can address public health, energy independence, and trends in atmospheric pollution; renewable energy development can be analyzed by applying environmental indicators from the EISD list. These indicators are able to address the requirements of the main EU energy policy documents that are linked to the security of energy supply, promotion of renewable energy sources, and improvements in energy efficiency and climate change mitigation. The indicators framework for the comparative assessment of achievements in implementing priorities of sustainable energy development goals is given in Table 7.
Selected indicators from the EISD list that are linked to EU sustainable energy development targets can be also linked to each other via the chain of mutual impacts. These indicators enable the creation of a comprehensive policy framework that can monitor the progress achieved by EU MS in implementing sustainable energy development goals. The framework can also track other various interacting policy measures that are linked to specific indicators of sustainable energy development. Policy makers in the energy sector can apply the EISD as they provide economic, social, and environmental data that is linked in a coherent and consistent way to sustainable energy development. This framework is very useful for making comparisons between countries, analyzing sustainable energy development trends, and providing verifiable assessments of policies and measures.
In the following sections, the changes to the most important sustainable energy development indicators in Lithuania, Latvia, and Estonia are analyzed by applying graphical analysis and methods of descriptive statistics, correlation, and regression analysis, and seeking to define the best performing country in a way that links this performance with results in implementing green budget reform.
4.2. Dynamics of Sustainable Energy Development Indicators in the Baltic States
The dynamics of sustainable energy development indicators in the Baltic States between 2005 and 2015 years are given in Figure 6, Figure 7, Figure 8, Figure 9, Figure 10, Figure 11, Figure 12, Figure 13 and Figure 14 below. The most relevant indicator that addresses sustainable energy development trends is linked to energy efficiency, or energy intensity. Energy intensity is being assessed as the final or primary energy consumption ratio to GDP. This indicator expresses the aim of Strategy Europe 2020 and the Energy and Climate package, which is linked to energy efficiency improvement. This indicator addresses other main targets of policies that promote sustainable energy, such as: environmental sustainability, competitiveness, and security of energy supply. The reduction of the energy intensity of GDP in the Baltic States influences the reduction of atmospheric pollution and GHG emission reductions. It also increases the competitiveness of the economy, since decoupling energy consumption from GDP growth is an indicator of the increased competitiveness of the economy, as energy is expensive and has a high burden on economic activities. In addition, a decrease in energy intensity indicates an increase in energy supply security in terms of reducing energy import dependencies, as less energy is required to produce the same added value in the country [50].
There are various drivers that reduce energy intensity in the country: restructuring the economy and increasing the share of low energy, shifting from transport and industry sectors to less energy-intensive industries, implementing advanced energy-saving production methods and technologies, using more energy-efficient appliances, and other measures. In Figure 6, the changes in energy intensity between 2005 and 2015 are presented for Lithuania, Latvia, and Estonia.
All three Baltic States have an energy intensity of GDP that is significantly above the average level among EU MS. Estonia has the highest energy intensity in its GDP. Lithuania has the lowest energy intensity in its GDP among the Baltic States. However, energy intensity decreased in all of the Baltic States since they entered the EU. The economic recession of 2008 had an influence on energy intensity, which increased. Since 2008, Estonia’s energy intensity was increasing; however, since 2010, the energy intensity of Estonia’s GDP started to decline. In Latvia and Lithuania, the energy intensity of their GDPs started to decline in 2010, which was linked to their recovery from the economic crisis.
Primary energy consumption indicates the quantity of energy that is demanded to cover the total inland energy consumption of a country (Figure 7):
In the EU, primary energy consumption in 2015 was similar to 1990 levels. Primary energy consumption in the EU decreased by more than 10% between 2005 and 2015. This was primarily linked to the economic recession, favorable conditions, and various implemented energy-efficiency improvement policies and measures. In the EU during the investigated period, fossil fuels continued to dominate the primary energy supply. However, their proportion decreased 26% between 2005 and 2015. The proportion of renewable resources in the gross final energy consumption doubled over the same period, from 9% in 2005 to 16.7% in 2015. The annual average increase rate was about 1% per year.
In 2015, Lithuanian primary energy consumption decreased by about 27% compared with 2005 levels, while in Estonia primary energy consumption increased about 15% compared with the same base year and, in Latvia primary energy consumption was almost the same compared with 2005, i.e., it decreased by only 5%.
Increasing the share of renewable energy in the primary energy supply, final energy consumption and electricity and heat production are among the priorities of sustainable energy development. These targets are directly linked with environmental sustainability, as they provide for GHG emission reduction and increase the competitiveness of the economy. The increased utilization of renewable energy sources also increases energy security, since the deployment of local energy resources diminishes dependency on energy imports.
All of the EU MS have adopted national renewable energy action plans and presented all of the intended actions that are necessary to meet their renewable energy targets to the EC. These plans include renewable energy targets for: electricity, heating, cooling, transport, and final energy demand. In addition, all of the planned policies and measures to achieve the set targets are presented in national plans. Since green budget reform has promoted renewable resources, countries have also introduced additional measures, such as feed-in-prices, subsidies etc.
In Figure 8, the trends of the share of renewable energy in final energy consumption in the Baltic States are given.
Once again, Latvia’s high share of renewable energy sources in its final energy consumption distinguishes it from the other Baltic States, and is also above the average EU level. However, in other Baltic States, the proportion of renewable energy sources in their final energy consumption is also above the EU average. Since their entrance into the EU in 2004, the share of renewable resources has increased by more than 60% in Estonia, and by more than 50% in Lithuania. The exceptional situation in Latvia is linked to its natural conditions and high hydro energy potential. One can notice that during the investigated period, the highest increase in the proportion of renewable resources in final energy demand was achieved in Estonia. Estonia achieved the target set for 2020 (increase the share of renewable resources in final energy consumption to 25%) in 2011, while Lithuania achieved the target (increase the share of renewable resources in final energy consumption to 23%) in 2014. The target for Latvia is to increase the share of renewable resources in final energy consumption to 40%, and it is almost reached.
The dynamics of the share of renewable resources in electricity generation in the Baltic States is given in Figure 9.
Latvia once again has the highest proportion of renewable energy sources in its gross electricity consumption. The share of electricity generated from renewable resources in the other Baltic States was lower than the average EU levels during the analyzed period. In all of the Baltic States, a growth trend is observed between 2005 and 2015 regarding the portion of renewable energy sources in electricity consumption. However, in 2013 and 2014, Estonia experienced a slight decline because of weather conditions linked to wind energy.
In Figure 10, the use of renewable energy in the transport sectors of Lithuania, Latvia, and Estonia are provided.
In all of the Baltic States, the proportion of renewable energy sources in fuels used in transport is lower than average EU levels. Estonia has the lowest share of renewable resources in fuels used in transport (0.4%). Estonia has a very low share of renewable energy in transport, far behind its Europe 2020 target of 10%; in response, measures have been announced, but have not yet been adopted. These include a 5–7% biofuel mixing obligation for motor fuel, and financial support for producing and using biomethane in transport. Estonia is ranked last among the 28 EU countries in terms of renewable energy in transport; the EU average was 6.6% in 2015. In comparison, Lithuania reached 4.6% of renewable resources in fuel consumption in transport in 2015, which is in line with the targets set by EU Directive 2003/30/EC; it was ranked 20th in the EU in 2015. Latvia has reached 3.9% and was ranked 22nd in the EU in 2015, but despite that, Latvia is in a good position in terms of implementing the target set by the 2003/30/EC Directive.
CHP generation is linked with environmental sustainability and competitiveness, since it enables an increase in energy efficiency and a reduction in GHG emissions. Figure 11 presents the changes in the share of CHP generation in gross electricity generation in Lithuania, Latvia, and Estonia.
Estonia has the lowest proportion of CHP in gross electricity production, which is also significantly lower than the EU average. Meanwhile, Lithuania and Latvia have higher proportions of CHP in their gross electricity generation. Due to the significant share of hydro in its gross electricity production, the proportion of CHP in Latvia’s gross electricity production has high fluctuations. In both Latvia and Lithuania, the proportion of CHP in their gross electricity generation is higher than the EU average. Lithuania also had a significant increase in the share of CHP in its gross electricity production, i.e., from 16% to 31%, during the analyzed period.
The carbon intensity of energy consumption is the most important indicator of the environmental sustainability of energy. It can be linked with the results of implementing all of the other targets of sustainable energy development, such as decreasing the energy intensity, final energy demand, and electricity consumption, and increasing the proportion of renewable energy sources in primary energy supply and the share of CHP in gross electricity consumption. Increasing energy efficiency and utilizing renewable energy sources are the main pathways to decreasing GHG emissions in the fuel combustion sector.
Figure 12 presents the changes in the ratio between GHG emissions and energy consumption in Lithuania, Latvia, and Estonia. This indicator from the ESDI list can replace the indicator of total GHG emissions from fuel combustion, as it enables a better comparison of GHG emission trends and the achieved results of climate change mitigation policies in the energy sector of the Baltic States, due to the different size of the countries and their energy sectors.
Estonia has the greatest decline of GHG emissions in its energy sector among the Baltic States. Lithuania had the worst results, which was a result of the country finally closing the Ignalina nuclear power plant in 2009. As a result, the carbon intensity of energy consumption in the country increased by 24% in 2010. The closure of the nuclear power plant had an impact on the growth of the proportion of fossil energy carriers in the primary energy supply. In Lithuania, the carbon intensity of energy decreased from 2010 onwards, as the share of renewable resources and imported electricity increased in that time. Estonia achieved the best results regarding carbon intensity decline in its energy sector among the Baltic States; the carbon intensity of its energy consumption decreased 12% between 2005 and 2015.
Figure 13 presents the trends of GHG emissions per capita in the Baltic States.
The GHG emissions per capita in Latvia amounted to 5.9 tons per capita, which was the third lowest in the EU. Lithuania managed to achieve a GDP growth that was faster than its growth in GHG emissions, implementing the EU Sustainable Development Strategy. In 2014, annual GHG emissions in Lithuania amount to seven tons per capita, which was among the lowest in the EU. Meanwhile, GHG emissions in Estonia amounted to about 14 tons per capita, which was the highest in the EU, and 60% bigger than the EU average (8.7 tons per capita).
The security of energy supply can be visualized through the energy dependency rate, which is expressed by the ratio between net energy imports and gross inland energy consumption. This indicator indicates the ability of a country or region to meet all of its energy needs. In 2015, in EU MS, the highest need was for petroleum products, of which about 90% were imported. For natural gas, energy import dependency in 2015 was about 60% across all of the EU MS. Figure 14 presents the trends of energy dependency in the Baltic States.
One can notice that Lithuania had the highest energy dependency rate in 2015 among the Baltic States. This is linked to the closure of the nuclear power plant in Lithuania in 2009, and the subsequent steep growth of its energy imports. Meanwhile, Estonia had the lowest energy import dependency rate, as the country has significant resources of oil shale, and has been using them intensively for energy generation. Estonia’s dependency rate was only 7% in 2015. Latvia had an energy dependency level that was similar to the EU average, but one can notice a positive decreasing trend regarding its energy import dependency, i.e., from 64% in 2005 to 51% in 2015, while the EU average was stable over the same period.
4.3. The Influence of Environmental Fiscal Reform on the Baltic States’ Sustainable Development Trends in the Energy Sector
Further linear equations of the temporal dynamics of the selected sustainable energy development indicators from the ESDI list for the Baltic States will be applied for the assessed period, and for future predictions in case of stable development. Linear regression establishes a relationship between ESDI indicators (dependent variables) and years (independent variable). It is represented by the equation Y = b × X + a, where Y is the dependent variable, b is the slope of the line, X is the independent variable, and a is the intercept. The determination coefficient (R2) was selected to assess the correspondence of the linear equation to the actual data. The determination coefficient showed which part of the data dissemination could be justified by the linear regression. The closer R2 is to 1, the closer the equation is to the actual data.
In practical application regressive analysis, it is required that R2 ≥ 0.25. If R2 ≤ 0.25, it is very unlikely that linear regression will be suitable to assess the trends of the selected sustainable energy development indicators. Based on the R2 conditions, the linear regression equations of the selected ESDI trends for the Baltic States are presented in Table 8. The highlighted R2 values show that the linear regression equations are reliable, and that a prognosis for the future could be made.
Based on the results presented in Table 8, the linear regression equation is applicable to assess trends and make a prognosis regarding the ESDI of the Baltic States, which are presented in the table. The temporal dynamics of linear regression show that during the investigated period (2005–2015), the economic dependency on energy intensity over years (x) in Lithuania shows quite a rapid decrease (−13.255x), and in 2020 could be about 130 kg of oil equivalent per 1000 EUR. Meanwhile, the EU average also shows a declining tendency (−2.64x), and in 2020 could be 110 kg of oil equivalent per 1000 EUR. The primary energy consumption in Lithuania has a tendency to decrease (−3.7082x), and according to prognosis in 2020, could be about 55% less compared to 2005 levels. The EU average also shows a declining tendency (−1.2436x), and in 2020 could be about 17% less compared to 2005 levels. The carbon intensity of energy consumption in the EU has a slightly decreasing tendency every year (−0.8355x); the prognosis shows that in 2020, the intensity of GHG emissions’ energy consumption in the EU will be 15% less compared to 2000 levels (11% compared to 2005). The share of renewable resources in final electricity generation shows an increasing tendency in all of the Baltic States. According to the prognosis, the share in Latvia will be more than 50%, the share in Estonia and Lithuania will be more than 20%, and the EU average will be about 30%. The share of renewable resources in final energy consumption rose during the examined period in all of the Baltic States; the prognosis shows that in 2020, the share of renewable resources in the final energy consumption will be about 35% in Estonia, about 27% in Lithuania, and about 21% on average among the EU MS.
In order to determine the strength of the connection between the selected sustainable energy development indicators and the environmental taxes, Spearman’s correlation coefficient was applied. Therefore, the strength of correlation between ESDI and the share of environmental taxes (million euro) were analyzed using Spearman’s coefficient of correlation, which shows the significance of the change of one variable to another (Table 9).
As one can see from Table 10, the implemented environmental tax reforms, or greening of taxes, had an impact on the achievement of sustainable energy development targets in the Baltic States.
Energy taxes in Lithuania have had a positive impact on energy intensity; the correlation between energy taxes and energy intensity is very strong (−0.825). Energy taxes in Latvia have had a positive impact on the carbon intensity of energy consumption; the correlation between indicators and energy taxes is very strong (−0.804). Correlations between energy taxes and the share of renewable resources in final electricity generation and the share of renewable resources in final energy consumption are very strong in all of the Baltic States. It can be concluded that environmental taxes undoubtedly have had a positive impact on the development of renewable energy. Due to the developed transport tax system in Latvia, transport taxes have had a positive impact, and the correlation between transport taxes and the share of renewable resources in fuel used in transport is very strong (0.824). Environmental tax reform has influenced consumers to buy less environmentally damaging products and change their behavior in general. They also provide incentives for producers to implement new technologies and innovations, and further improve products and processes.
5. Conclusions
Since fuel combustion is the main source of atmospheric and GHG emissions, the increase of the proportion of environmental taxes to GDP is anticipated to have a positive impact on the interlinked main targets of sustainable energy development: environmental sustainability, competitiveness, and energy security. However, there are other policies targeting sustainable energy development, including feed-in tariffs, green tradable certificates, tradable emission allowances, subsides from EU Structural Funds, etc.
An analysis of the progress of environmental tax reforms in three Baltic States indicated quite significant differences in the ratios between revenues from environmental taxes and GDP. It also showed quite a large divergence between the energy tax rates and the other environmental tax rates among the analyzed countries. Latvia had the best results among the Baltic States in regard to increasing the contribution of environmental taxes to its GDP, and consequently greening its tax system. Latvia also has one of the highest rates of transport taxes among the Baltic States. Lithuania had one of the lowest ratios between environmental tax revenues and GDP among the EU MS.
Comparing the Baltic States in terms of their sustainable development achievements in the energy sector, indicators from the ESDI framework were analyzed and compared. Environmental taxes have an impact on the penetration of renewable energy sources (in various sectors); they also have an impact on changes in energy intensity, GHG emission indicators, and other factors.
Estonia achieved most of its sustainable development targets in the energy sector, especially targets related to the high penetration of renewable resources in final energy consumption and a low energy-dependency rate. Lithuania decreased its energy intensity and increased its share of renewable electricity consumption. Latvia increased its share of renewable energy sources in electricity production and final energy consumption; these positive results were mainly linked to natural conditions, such as the high hydro resources available in the country.
A correlation analysis of environmental taxes and indicators of sustainable energy development revealed that an increase in the proportion of environmental taxes had a significant positive impact on sustainable energy development in the Baltic States. Therefore, greening tax systems provides incentives for the implementation of new advanced technologies, the improvement of products and production processes in the energy combustion sector, and increased competitiveness, environmental sustainability, and energy supply security.
The conducted comparative assessment of greening environmental taxes and their impact on sustainable energy development in the Baltic States indicated that after EU accession, the Baltic States achieved good results in implementing sustainable energy development targets due to green budget reforms and increasing the share of environmental taxes in total budget revenues. Therefore, the harmonization of energy and environmental policies can provide win–win solutions in terms of increasing renewable energy sources, energy efficiency, and energy independency; harmonization can also decrease energy intensity, reduce atmospheric pollution, mitigate climate change, and improve human health.
The main limitations of the study are that this paper does not analyze the other factors that might have had an impact on sustainable energy development in the Baltic States, and thus might have also had a significant impact on sustainable energy development trends. Also, the other impacts of greening budget revenues are not assessed in this study.
Author Contributions
The contribution of all authors is equal.
Funding
This research received no external funding.
Acknowledgments
Indre Siksnelyte acknowledges support by the World Federation of Scientists (Switzerland).
Conflicts of Interest
The authors declare no conflict of interest.
References
- European Environment Agency. Environmental Tax Reform in Europe: Implications for Income Distribution [Interactive]. Technical Report No 16/2011. 2011. Available online: http://www.eea.europa.eu/publications/environmental-tax-reform-in-europe/ (accessed on 20 November 2017).
- European Commission. Tax Reforms in EU Member States. Tax Policy Challenges for Economic Growth and Fiscal Sustainability [Interactive]. Working Paper N. 34-2012. European Commission: Brussels, Belgium, 2012. Available online: http://ec.europa.eu/taxation customs/resources/documents/taxation/gen info/economic analysis/tax papers/taxation paper 34 en.pdf (accessed on 14 November 2017).
- European Commission. Tax Reforms in EU Member States 2013 of European Commission [Interactive]. European Commission: Brussels, Belgium, 2013. Available online: http://ec.europa.eu/taxation customs/resources/documents/taxation/gen info/economic analysis/tax papers/taxation paper 38.pdf (accessed on 14 November 2016).
- Bach, S. The effects of environmental fiscal reform in Germany: A simulation study. Energy Policy 2002, 30, 803–811. [Google Scholar] [CrossRef]
- Barker, T.; Köhler, J. Equity and eco tax reform in the EU: Achieving a 10 per cent reduction CO2 emissions using excise duties. Fisc. Stud. 1998, 19, 375–402. [Google Scholar] [CrossRef]
- Ekins, P.; Dresner, S. Green Taxes and Charges: Reducing Their Impact on Low-Income Households; Policy Studies Institute: London, UK, 2004. [Google Scholar]
- Institute for European Environmental Policy (IEEP). Evaluation of Environmental Tax Reforms: International Experiences [Interactive]. Final Report. 2013. Available online: http://www.efv.admin.ch/e/downloads/finanzpolitik grundlagen/els/IEEP 2013 e.pdf (accessed on 1 December 2017).
- Bovenberg, L. Green tax reforms and the double dividend: An updated reader’s guide. Int. Tax Public Financ. 1999, 6, 421–443. [Google Scholar] [CrossRef]
- Bovenberg, L.; de Mooij, R.A. Environmental levies and distortionary taxation. Am. Econ. Rev. 1994, 84, 1085–1089. [Google Scholar]
- Bovenberg, L.; Goulder, L.H. Optimal environmental taxation in the presence of other taxes: General-equilibrium analysis. Am. Econ. Rev. 1996, 86, 985–1000. [Google Scholar]
- Bovenberg, L.; Smulders, S. Transitional impacts of environmental policy in an endogenous growth model. Int. Econ. Rev. 1996, 37, 861–893. [Google Scholar] [CrossRef]
- Lucas, R.E. Supply side economics: An analytical review. Oxf. Econ. Pap. 1990, 42, 293–316. [Google Scholar] [CrossRef]
- Koskela, E.; Schob, R. Alleviating unemployment: The case for green tax reforms. Eur. Econ. Rev. 1999, 43, 1723–1746. [Google Scholar] [CrossRef]
- Bayindir-Upmann, T.; Raith, M.G. Should high tax countries pursue revenue-neutral ecological tax reforms? Eur. Econ. Rev. 2003, 47, 41–60. [Google Scholar] [CrossRef]
- Leipprand, A. Links between the Social and Environmental Pillars of Sustainable Development. Task 1D: Environmental Taxes, Ecologic; Ecologic Institute: Berlin, Germany, 2007. [Google Scholar]
- McNally, R.H.G.; Mabey, N. The Distributional Impacts of Ecological Tax Reform; WWF: Surrey, UK, 1999. [Google Scholar]
- Jorgenson, D.W.; Wilcoxen, P.J. Reducing U.S. carbon dioxide emissions: An econometric general equilibrium assessment. Resour. Energy Econ. 1993, 15, 7–25. [Google Scholar] [CrossRef]
- Goulder, L.H. Environmental taxation and the “double dividend”: A reader’s guide. Int. Tax Public Financ. 1995, 2, 157–183. [Google Scholar] [CrossRef]
- Cummins, J.G.; Kevin A., Hassett; Hubbard, R.G. Tax reforms and investment: A cross-country comparison. J. Public Econ. 1996, 62, 237–273. [Google Scholar] [CrossRef]
- Freire-Gonzalez, J.; Ho, M.S. Environmental Fiscal Reform and the Double Dividend: Evidence from a Dynamic General Equilibrium Model. Sustainability 2018, 10, 501. [Google Scholar] [CrossRef]
- International Atomic Energy Agency; United Nations Department of Economic and Social Affairs; International Energy Agency; Eurostat; European Environment Agency. Energy Indicators for Sustainable Development: Guidelines and Methodologies; IAEA: Austria, Vienna, 2005; ISBN 92-0-116204-9. [Google Scholar]
- Eurostat. Environmental Statistics and Accounts in Europe. Statistical Books. 2010. Available online: http://ec.europa.eu/eurostat/documents/3217494/5723037/KS-32-10-283-EN.PDF/22a4889d-e6c9-4583-8d17-fb5104e7eec0 (accessed on 11 December 2017).
- Aarhus University. Study on Environmental Fiscal Reform Potential in 12 EU Member States. Final Report to DG Environment of the European Commission; No. 07.0307/ETU/2013/SI2.664058/ENV.D.2; Aarhus University: Roskilde, Denmark, 2014. [Google Scholar]
- European Commission. Environmental Taxes—Revised Statistical Guide[Interactive]; European Commission: Brussels, Belgium, 2013. Available online: http://epp.eurostat.ec.europa.eu/cache/ITY OFFPUB/KS-GQ-13-005/EN/KS-GQ-13-005-EN.PDF (accessed on 14 July 2015).
- European Commission. Excise Duty Tables. Energy Products and Electricity; European Commission: Brussels, Belgium, 2016. [Google Scholar]
- Aarhus University. Study on Environmental Fiscal Reform Potential in 14 EU Member States: Appendices. Final Report to DG Environment of the European Commission; No. 07.0201/2014/685390/ENV.D.2; Aarhus University: Roskilde, Denmark, 2015. [Google Scholar]
- European Topic Centre on Sustainable Consumption and Production. Resource Taxation and Resource Efficiency; Working Paper; European Topic Centre on Sustainable Consumption and Production: Copenhagen, Denmark, 2012. [Google Scholar]
- Chancel, L.; Ilse, S. Environmental taxes and equity concerns: A European perspective. In Background Paper Prepared for the Spring Alliance Conference “Go Green, Be Social”; European Commission: Brussels, Belgium, 2012. [Google Scholar]
- Mooij, R. Environmental Taxation and the Double Dividend. In Contributions to Economic Analysis; North Holland: Amsterdam, The Netherlands, 2000. [Google Scholar]
- European Environment Agency. Environmental Taxes: Recent Developments in Tools for Integration [Interactive]. 2010. Available online: http://edz.bib.uni-mannheim.de/daten/edz-bn/eua/00/envissue18.pdf (accessed on 12 November 2017).
- Rosenstock, M. Environmental Taxation within the European Union. Cyprus Econ. Policy Rev. 2014, 8, 113–123. [Google Scholar]
- Blumbergaa, D.; Barisaa, A.; Veidenbergsa, I.; Blumbergaa, A.; Kuhi-Thalfeldtb, R. Evaluation of RES-E support policies in the Baltic States. In Proceedings of the 9th International Conference “Environmental Engineering”, Vilnius, Lithuania, 22–23 May 2014; ISBN 978-609-457-640-9. [Google Scholar]
- European Environment Agency (EEA). National and regional story (Estonia)–Flexibility. The European Environment—State and Outlook 2015. 2015. Available online: http://www.eea.europa.eu/soer/countries/ee/national-and-regional-story-estonia-flexibility (accessed on 16 December 2017).
- European Commission. Taxes in Europe Database. Taxation and Customs Union, Excise Duty–Energy. 2016. Available online: http://ec.europa.eu/taxation_customs/index_en.htm (accessed on 23 October 2017).
- Latvia State Revenue Service. Natural Resources Tax. 2017. Available online: https://www.vid.gov.lv/default.aspx?tabid=8&id=6681&hl=2 (accessed on 25 November 2017).
- The Parliament of the Republic of Latvia. Natural Resources Tax Law; The Parliament of the Republic of Latvia: Riga, Latvia, 2006.
- Database—Eurostat, Environment and Energy Database. Available online: http://ec.europa.eu/eurostat/data/database (accessed on 12 November 2017).
- Institute for European Environmental Policy (IEEP). Environmental Tax Reform in Europe: Opportunities for the Future. Annexes to Final Report. 2014. Available online: http://www.ieep.eu/assets/1398/ETR_in_Europe_-_Annex_2_3_4.pdf (accessed on 25 October 2016).
- The Republic of Lithuania. The Law on Pollution Tax of the Republic of Lithuania; Law No. VIII-1183; The Republic of Lithuania: Vilnius, Lithuania, 1999.
- The Republic of Lithuania. Taxes on State Natural Resources; Law No. I-1163; The Republic of Lithuania: Vilnius, Lithuania, 1991.
- Streimikiene, D. Review of internalization of externalities and dynamics of atmospheric emissions in energy sector of Baltic States. Renew. Sustain. Energy Rev. 2017, 70, 1131–1141. [Google Scholar] [CrossRef]
- Streimikiene, D.; Sivickas, G. The EU sustainable energy policy indicators framework. Environ. Int. 2008, 34, 1227–1240. [Google Scholar] [CrossRef] [PubMed]
- Streimikiene, D.; Bruneckiene, J.; Cibinskiene, A. The review of electricity market liberalization impacts on electricity prices. Transform. Bus. Econ. 2013, 12, 40–60. [Google Scholar]
- Siksnelyte, I. Sustainability Assessment of Electricity Market Models. Ph.D. Thesis, Vilnius University, Vilnius, Lithuania, 2015. [Google Scholar]
- Streimikiene, D.; Siksnelyte, I. Sustainability Assessment of Electricity Market Models in selected developed world countries. Renew. Sustain. Energy Rev. 2016, 57, 72–82. [Google Scholar] [CrossRef]
- Streimikiene, D.; Siksnelyte, I. Electricity Market Opening Impact on Investments in Electricity Sector. Renew. Sustain. Energy Rev. 2014, 29, 891–904. [Google Scholar] [CrossRef]
- Vasauskaite, J.; Streimikiene, D. Review of Energy Efficiency Policies in Lithuania. Transform. Bus. Econ. 2014, 13, 628–643. [Google Scholar]
- European Environment Agency. Primary Energy Consumption by Fuel. Available online: http://www.eea.europa.eu/data-and-maps/indicators/primary-energy-consumption-by-fuel-6/assessment (accessed on 21 November 2016).
- Streimikiene, D. Impact of Environmental Taxes on Sustainable Energy Development in Baltic States, Czech Republic and Slovakia. Ekon. Manag. 2015, 18, 4–23. [Google Scholar]
- Stjepcevic, J.; Siksnelyte, I. Corporate Social Responsibility in Energy Sector. Transform. Bus. Econ. 2017, 1, 628–643. [Google Scholar]
Figure 1.
Environmental tax revenue by type of tax in the 28 European Union (EU) countries, Million euro.
Figure 1.
Environmental tax revenue by type of tax in the 28 European Union (EU) countries, Million euro.

Figure 2.
Revenues from environmental taxes in the Baltic States, as the percentage of gross domestic product (GDP). EU: European Union.
Figure 2.
Revenues from environmental taxes in the Baltic States, as the percentage of gross domestic product (GDP). EU: European Union.

Figure 3.
Dynamics of revenues from energy taxes in the Baltic States, as the percentage of GDP.

Figure 4.
Dynamics of revenues from environmental taxes in the Baltic States, as the percentage of total taxes and social contributions.
Figure 4.
Dynamics of revenues from environmental taxes in the Baltic States, as the percentage of total taxes and social contributions.

Figure 5.
Implicit energy tax rate in the Baltic States, EUR per ton of oil equivalent.

Figure 6.
Energy intensity of the economy, gross inland consumption of energy divided by GDP (kg of oil equivalent per 1000 EUR).
Figure 6.
Energy intensity of the economy, gross inland consumption of energy divided by GDP (kg of oil equivalent per 1000 EUR).

Figure 7.
Primary energy consumption index, 2005 = 100.

Figure 8.
Share of renewable resources in gross final energy consumption, %.

Figure 9.
Electricity generated from renewable sources in gross electricity consumption, %.

Figure 10.
The use of renewable energy in fuel consumption of transport, %.

Figure 11.
Combined heat and power generation as a percentage of gross electricity generation.

Figure 12.
Carbon intensity of energy consumption; index 2000 = 100.

Figure 13.
Greenhouse gas emissions per capita, tons of CO2 equivalent.

Figure 14.
The trends of energy dependency rates, %.


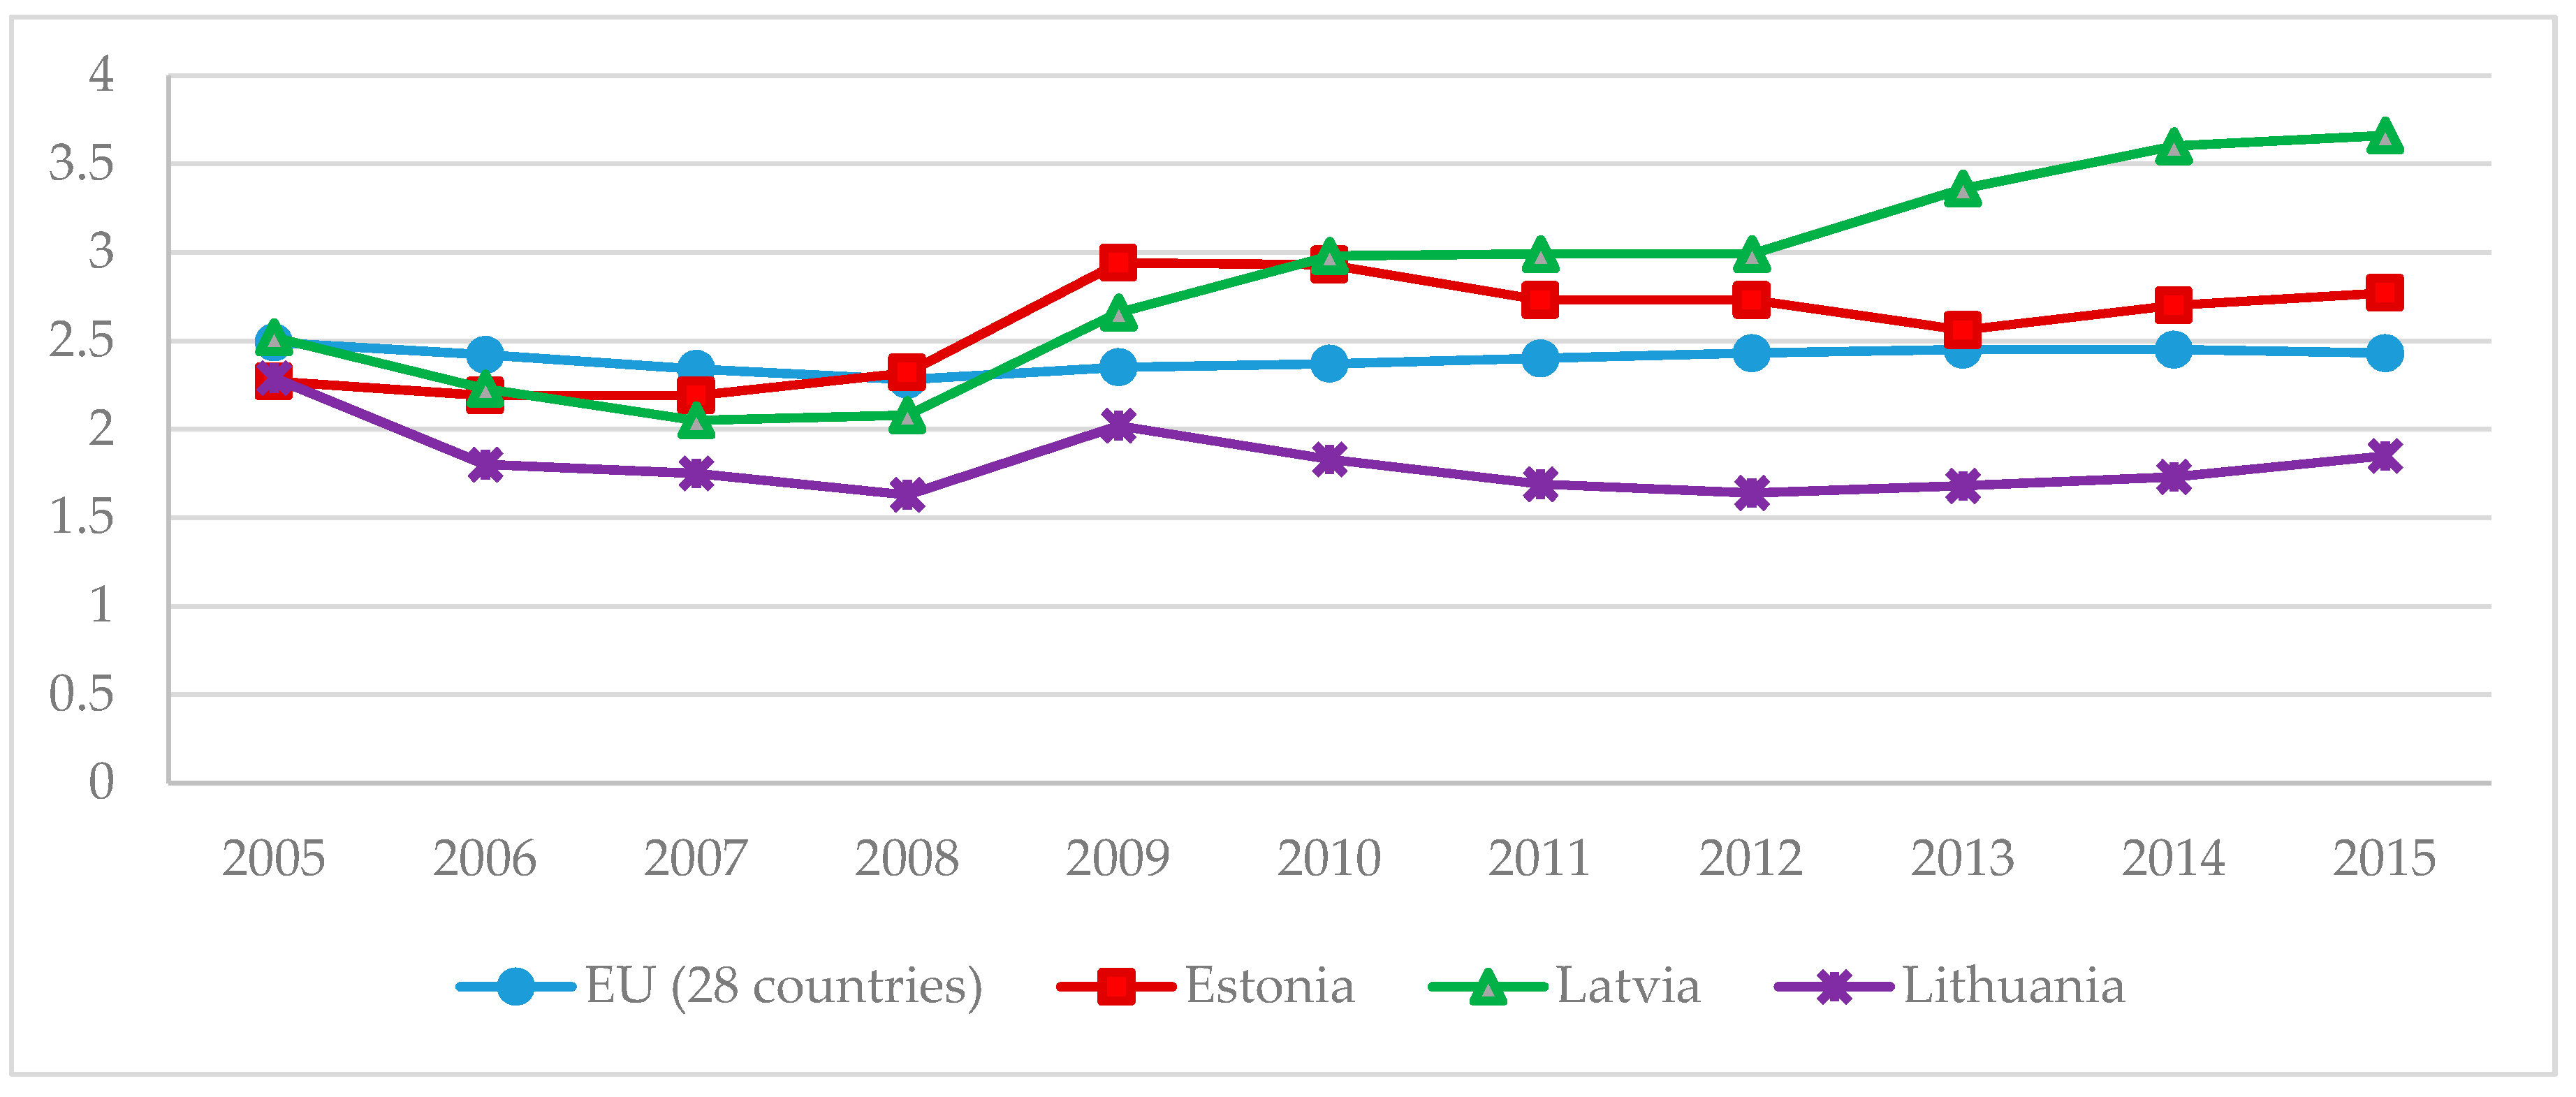
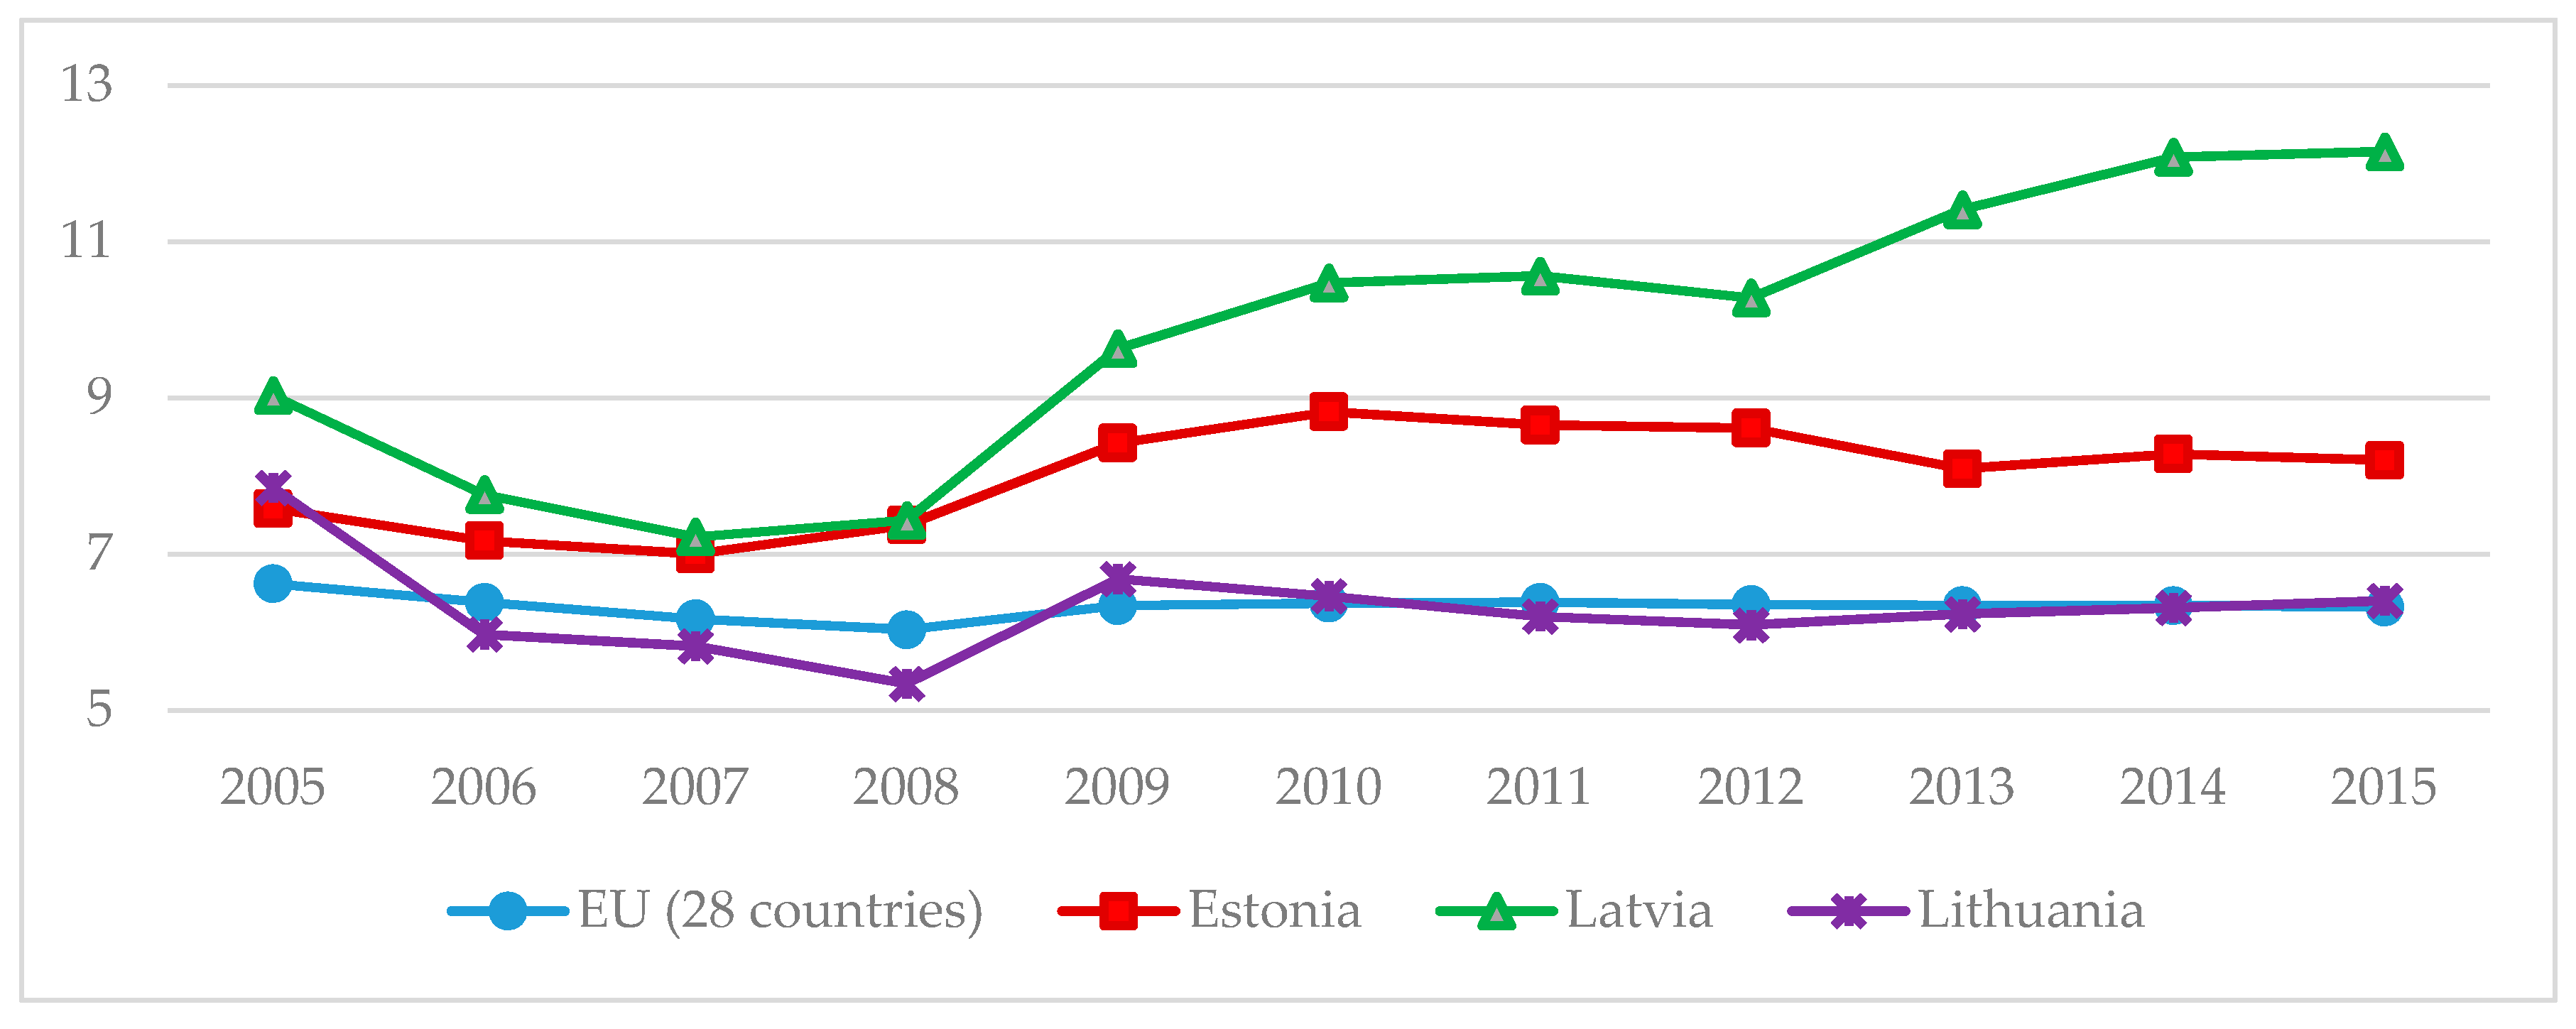
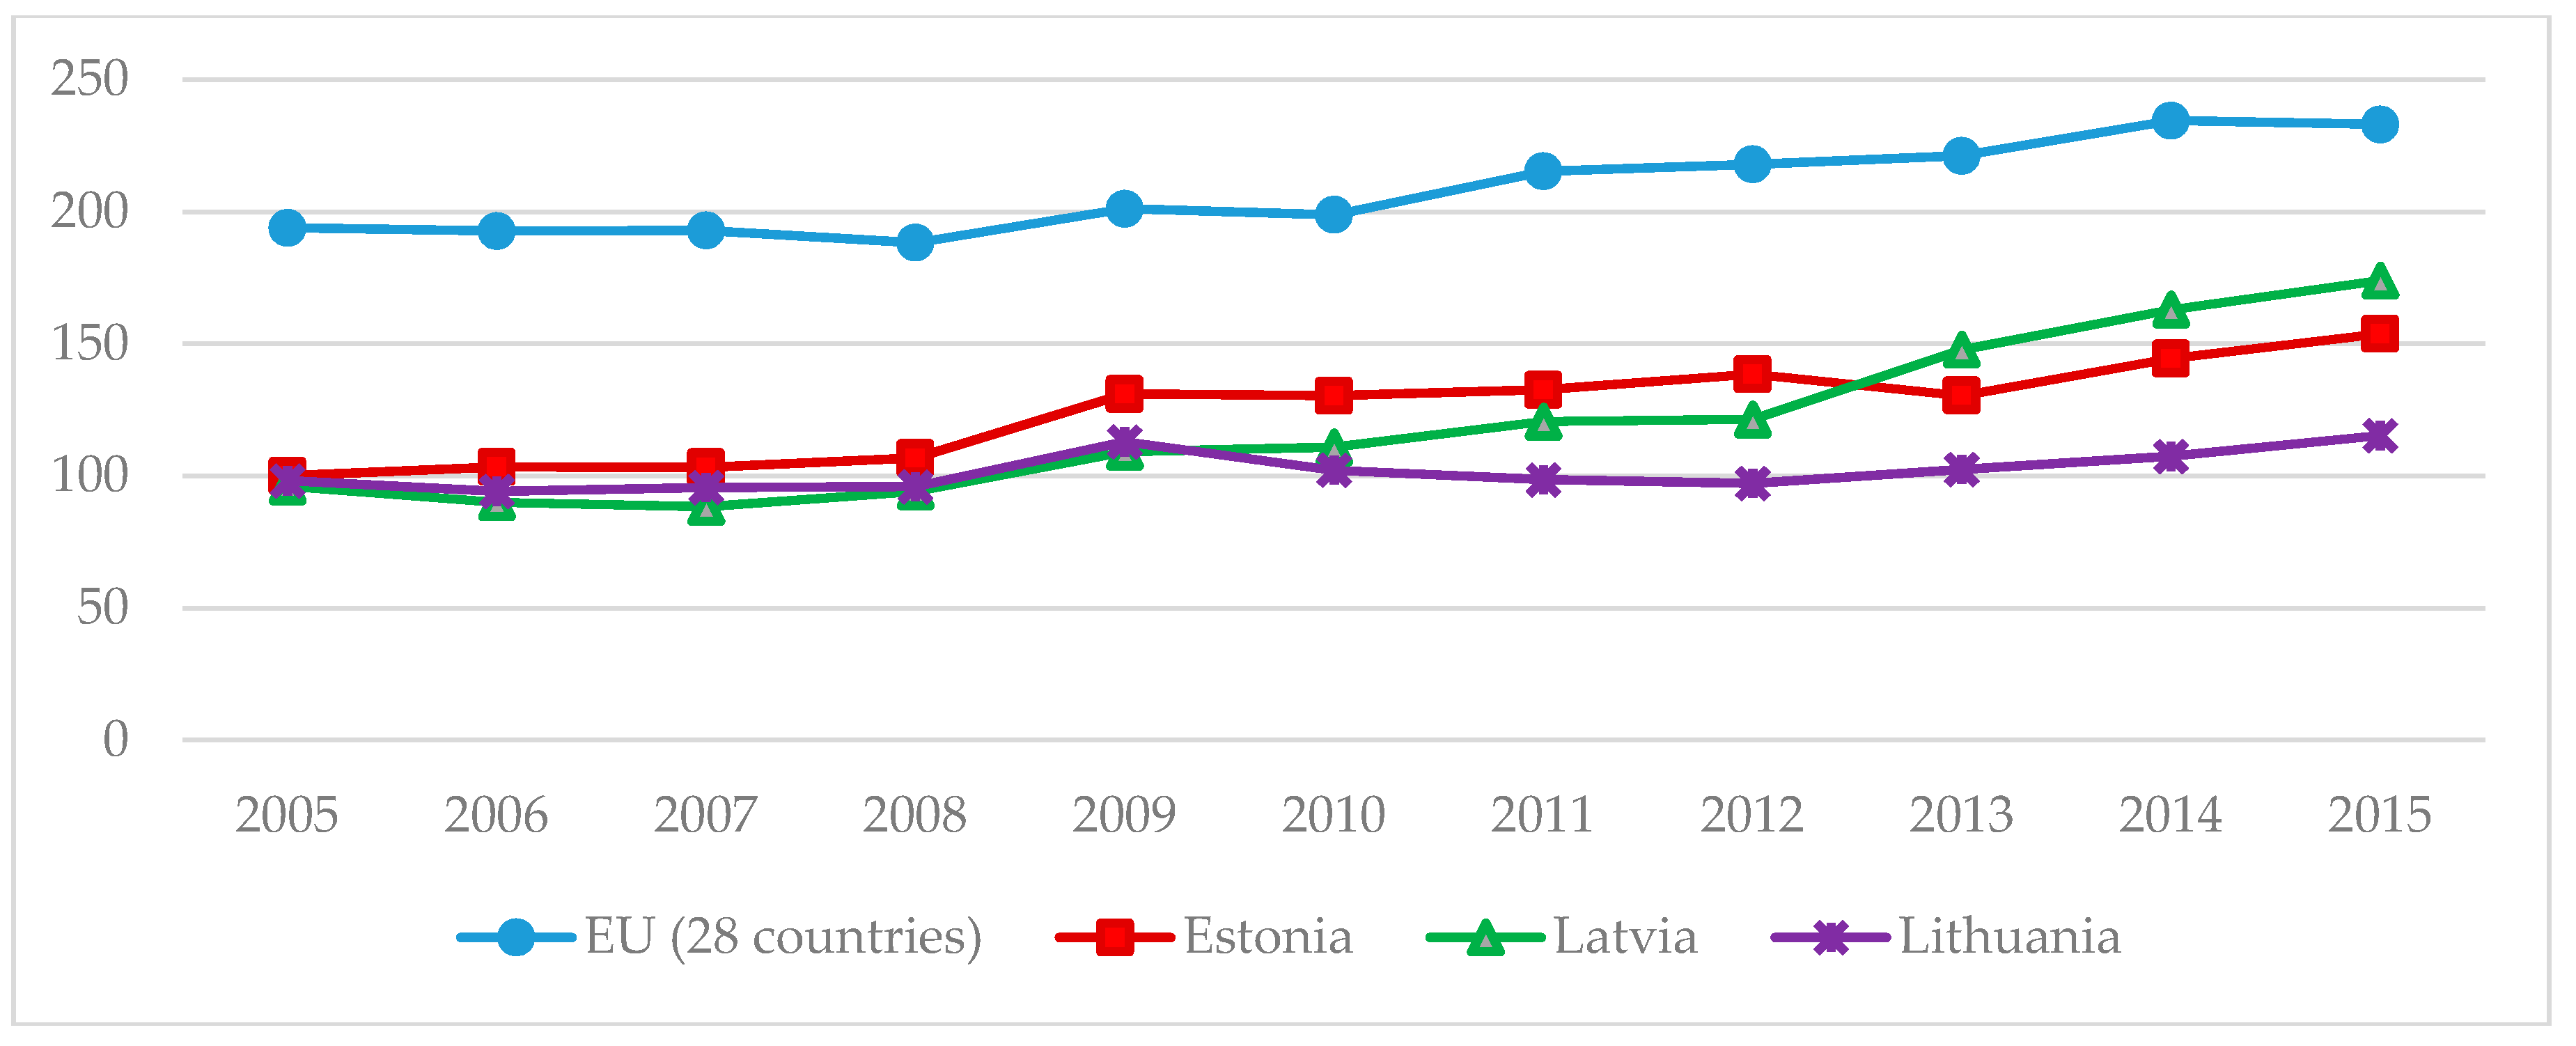
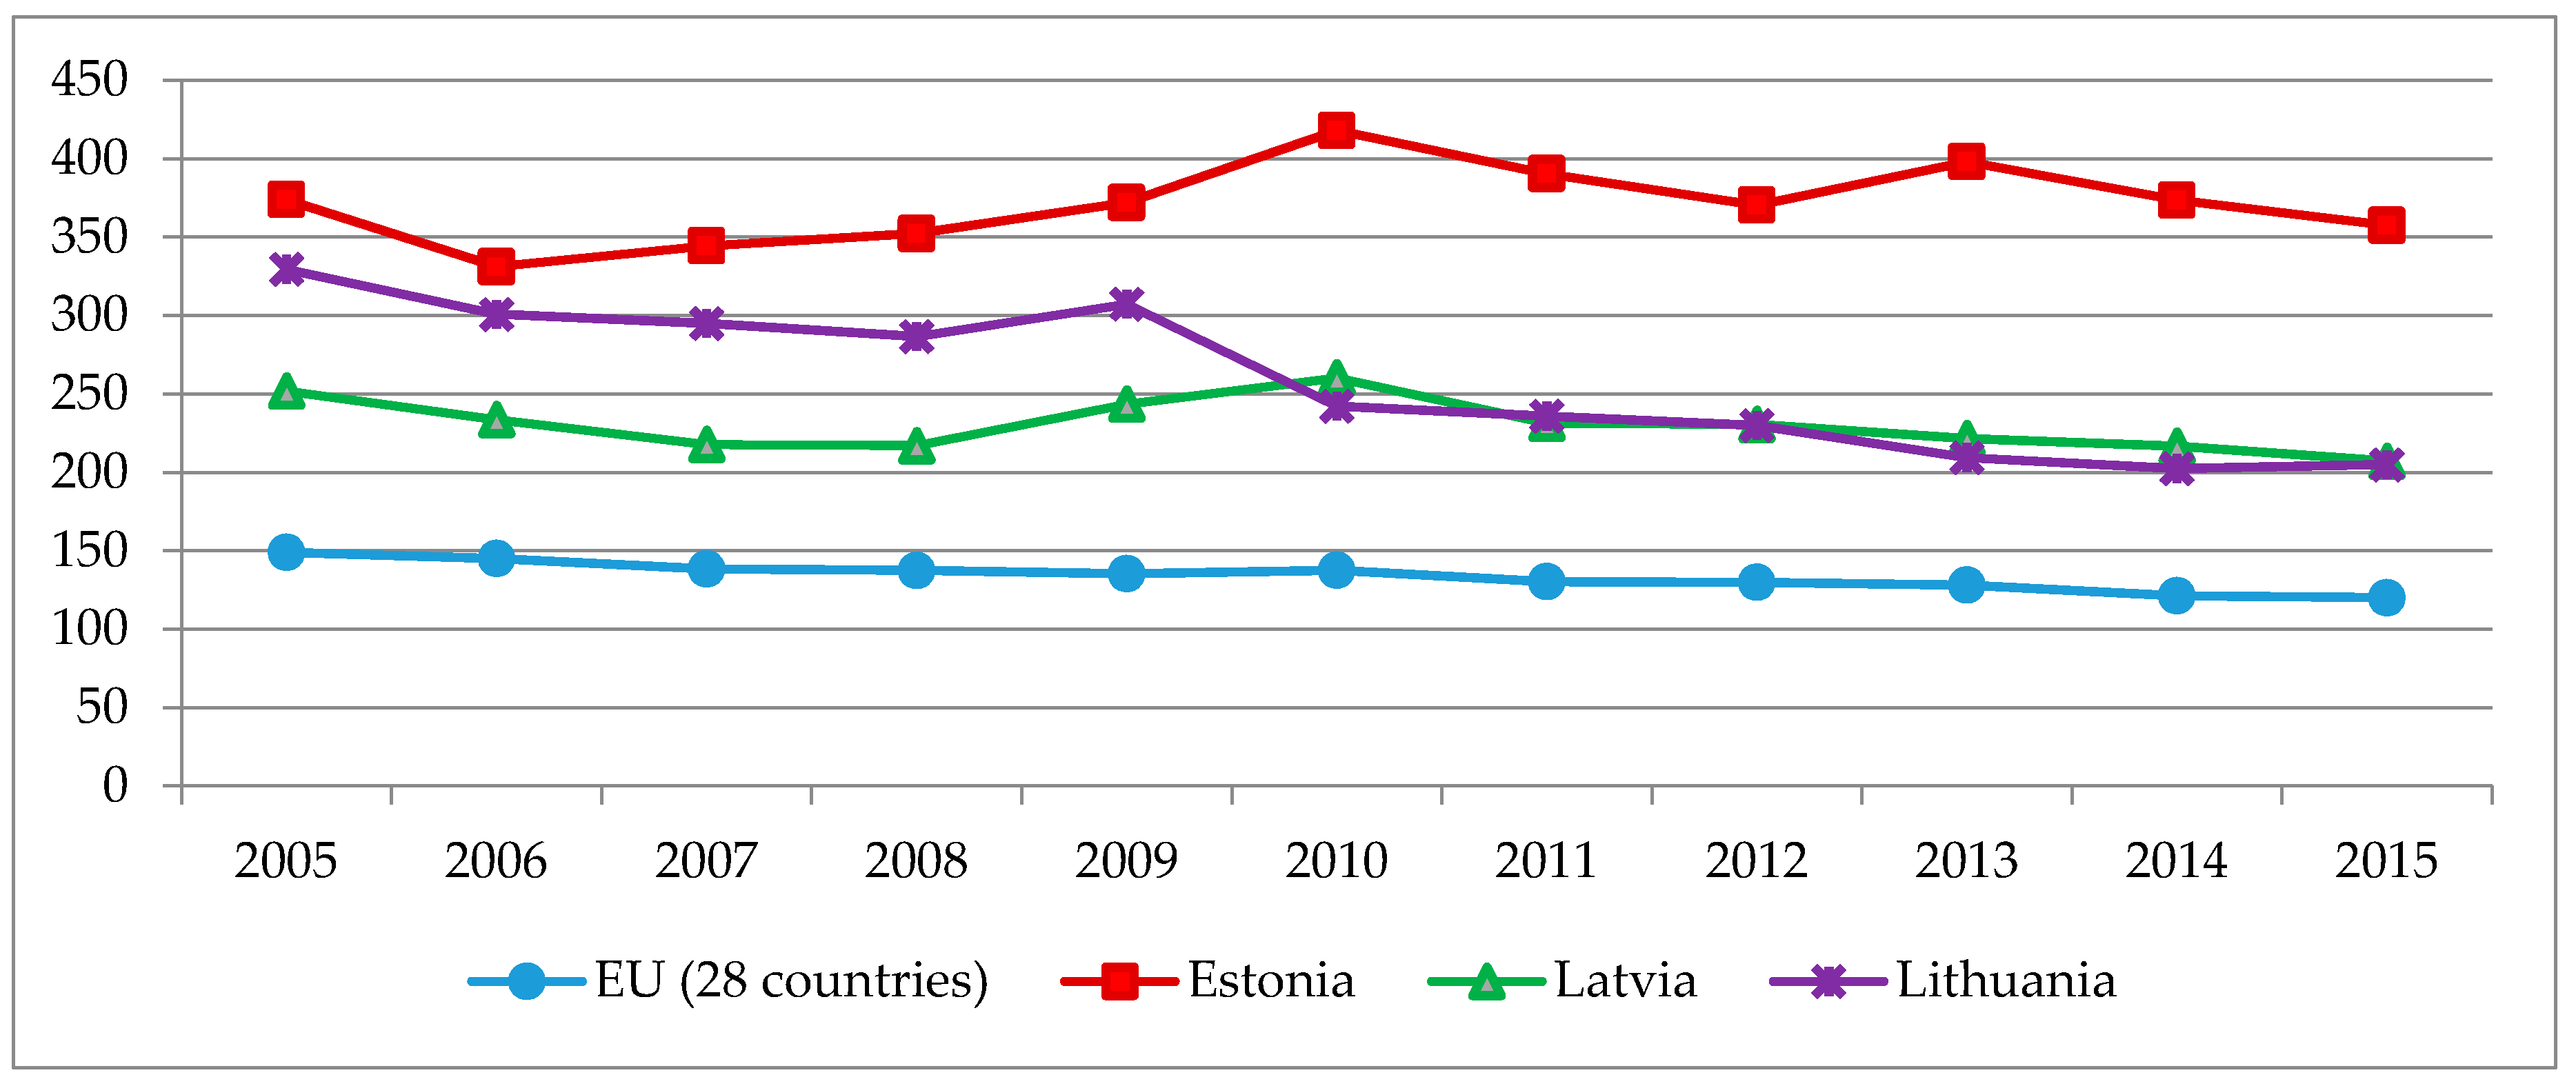
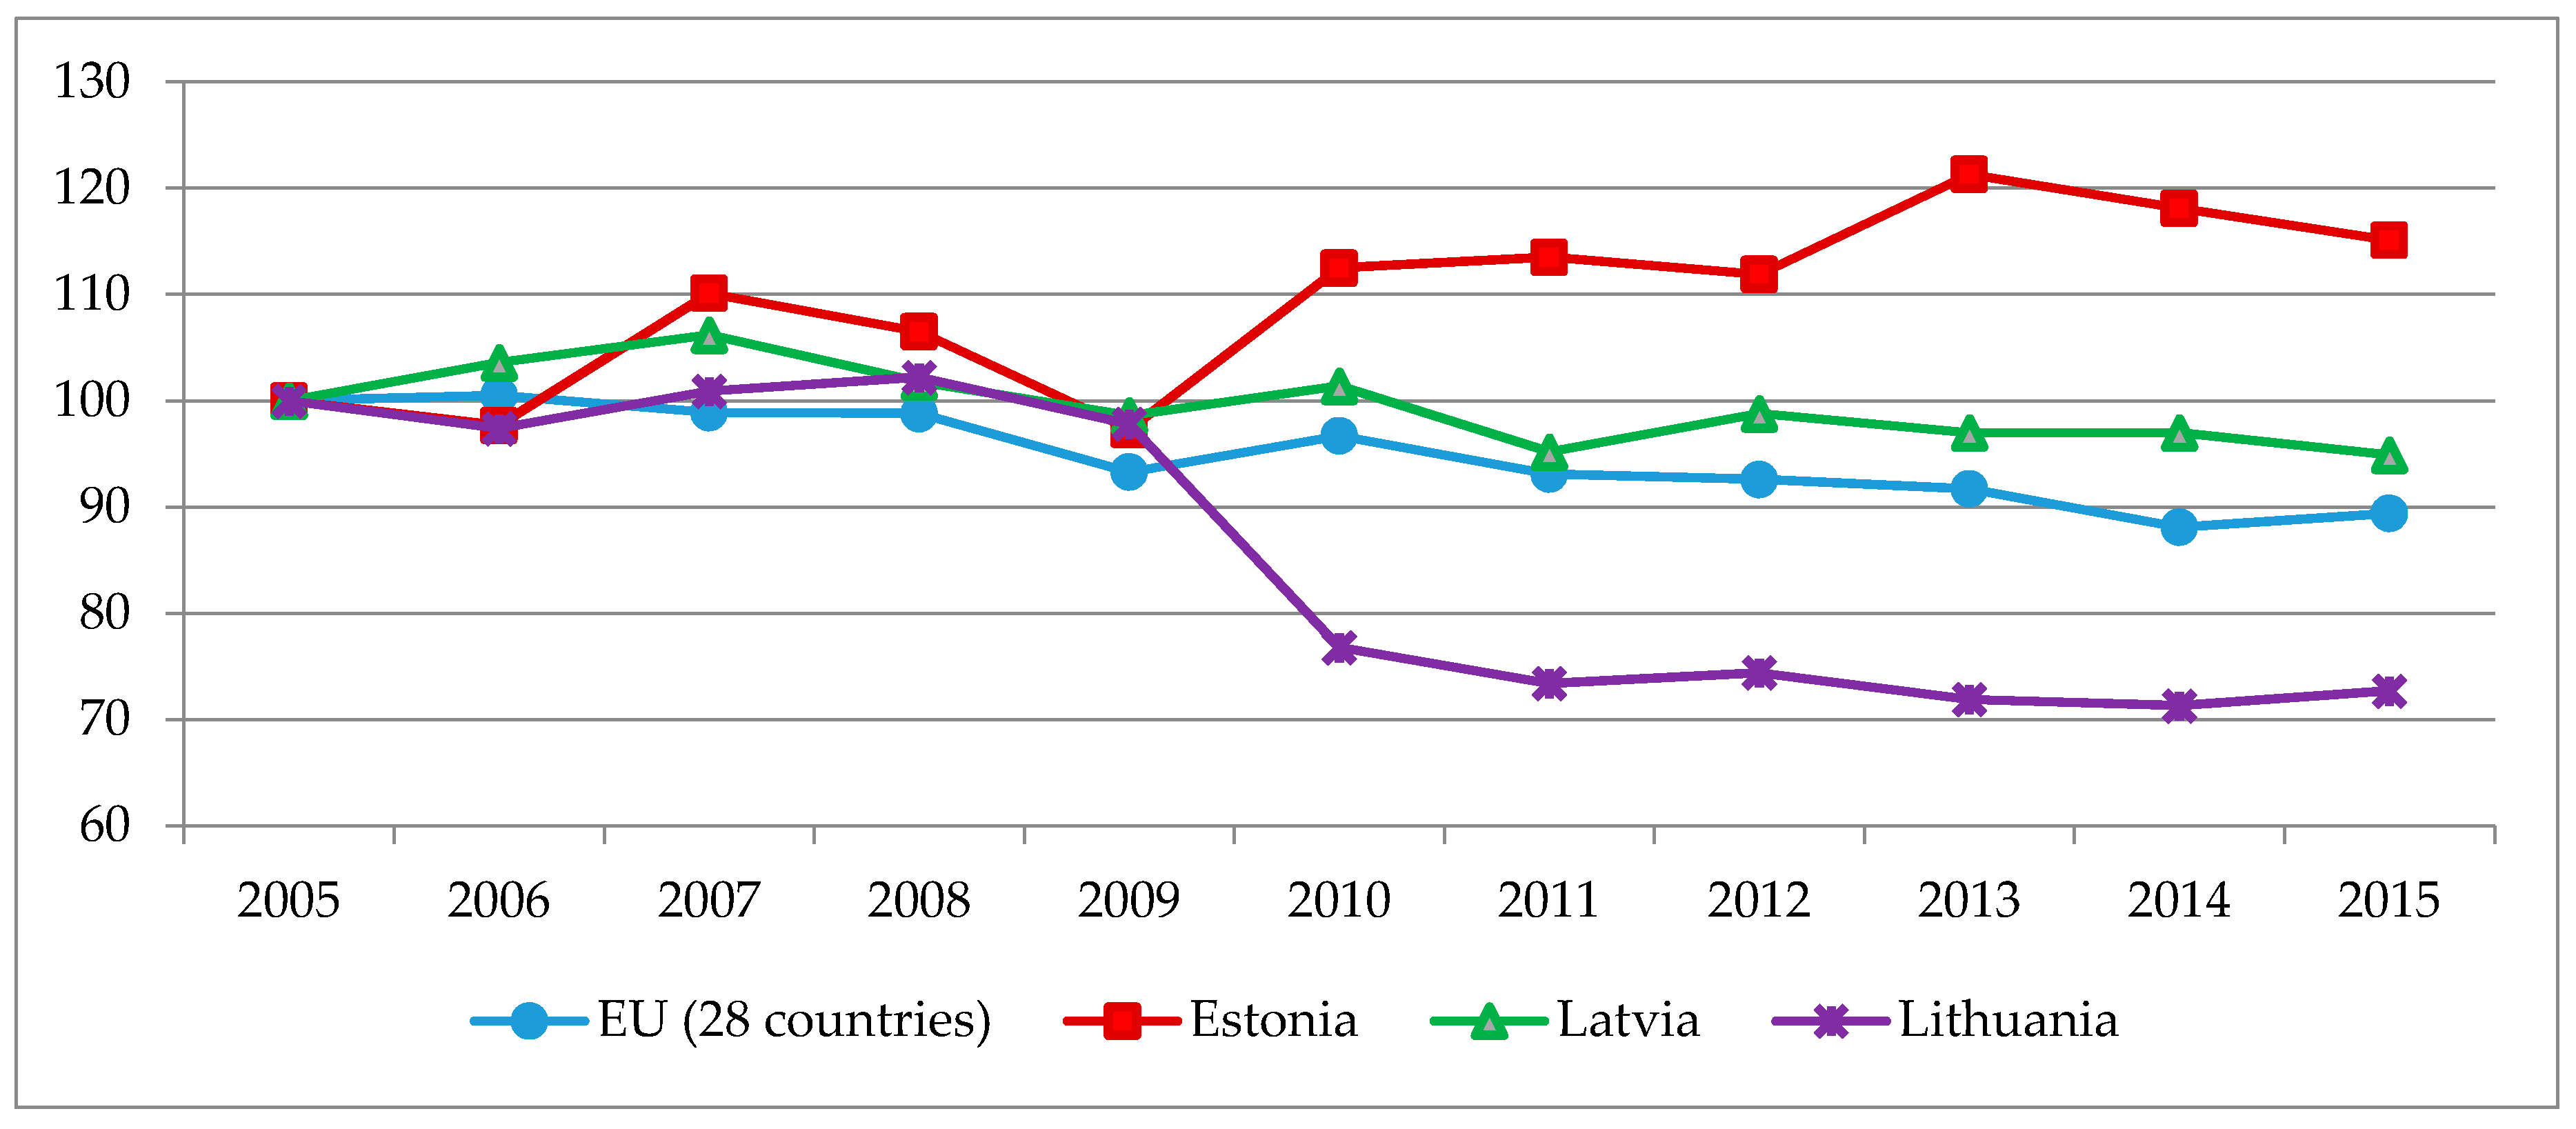
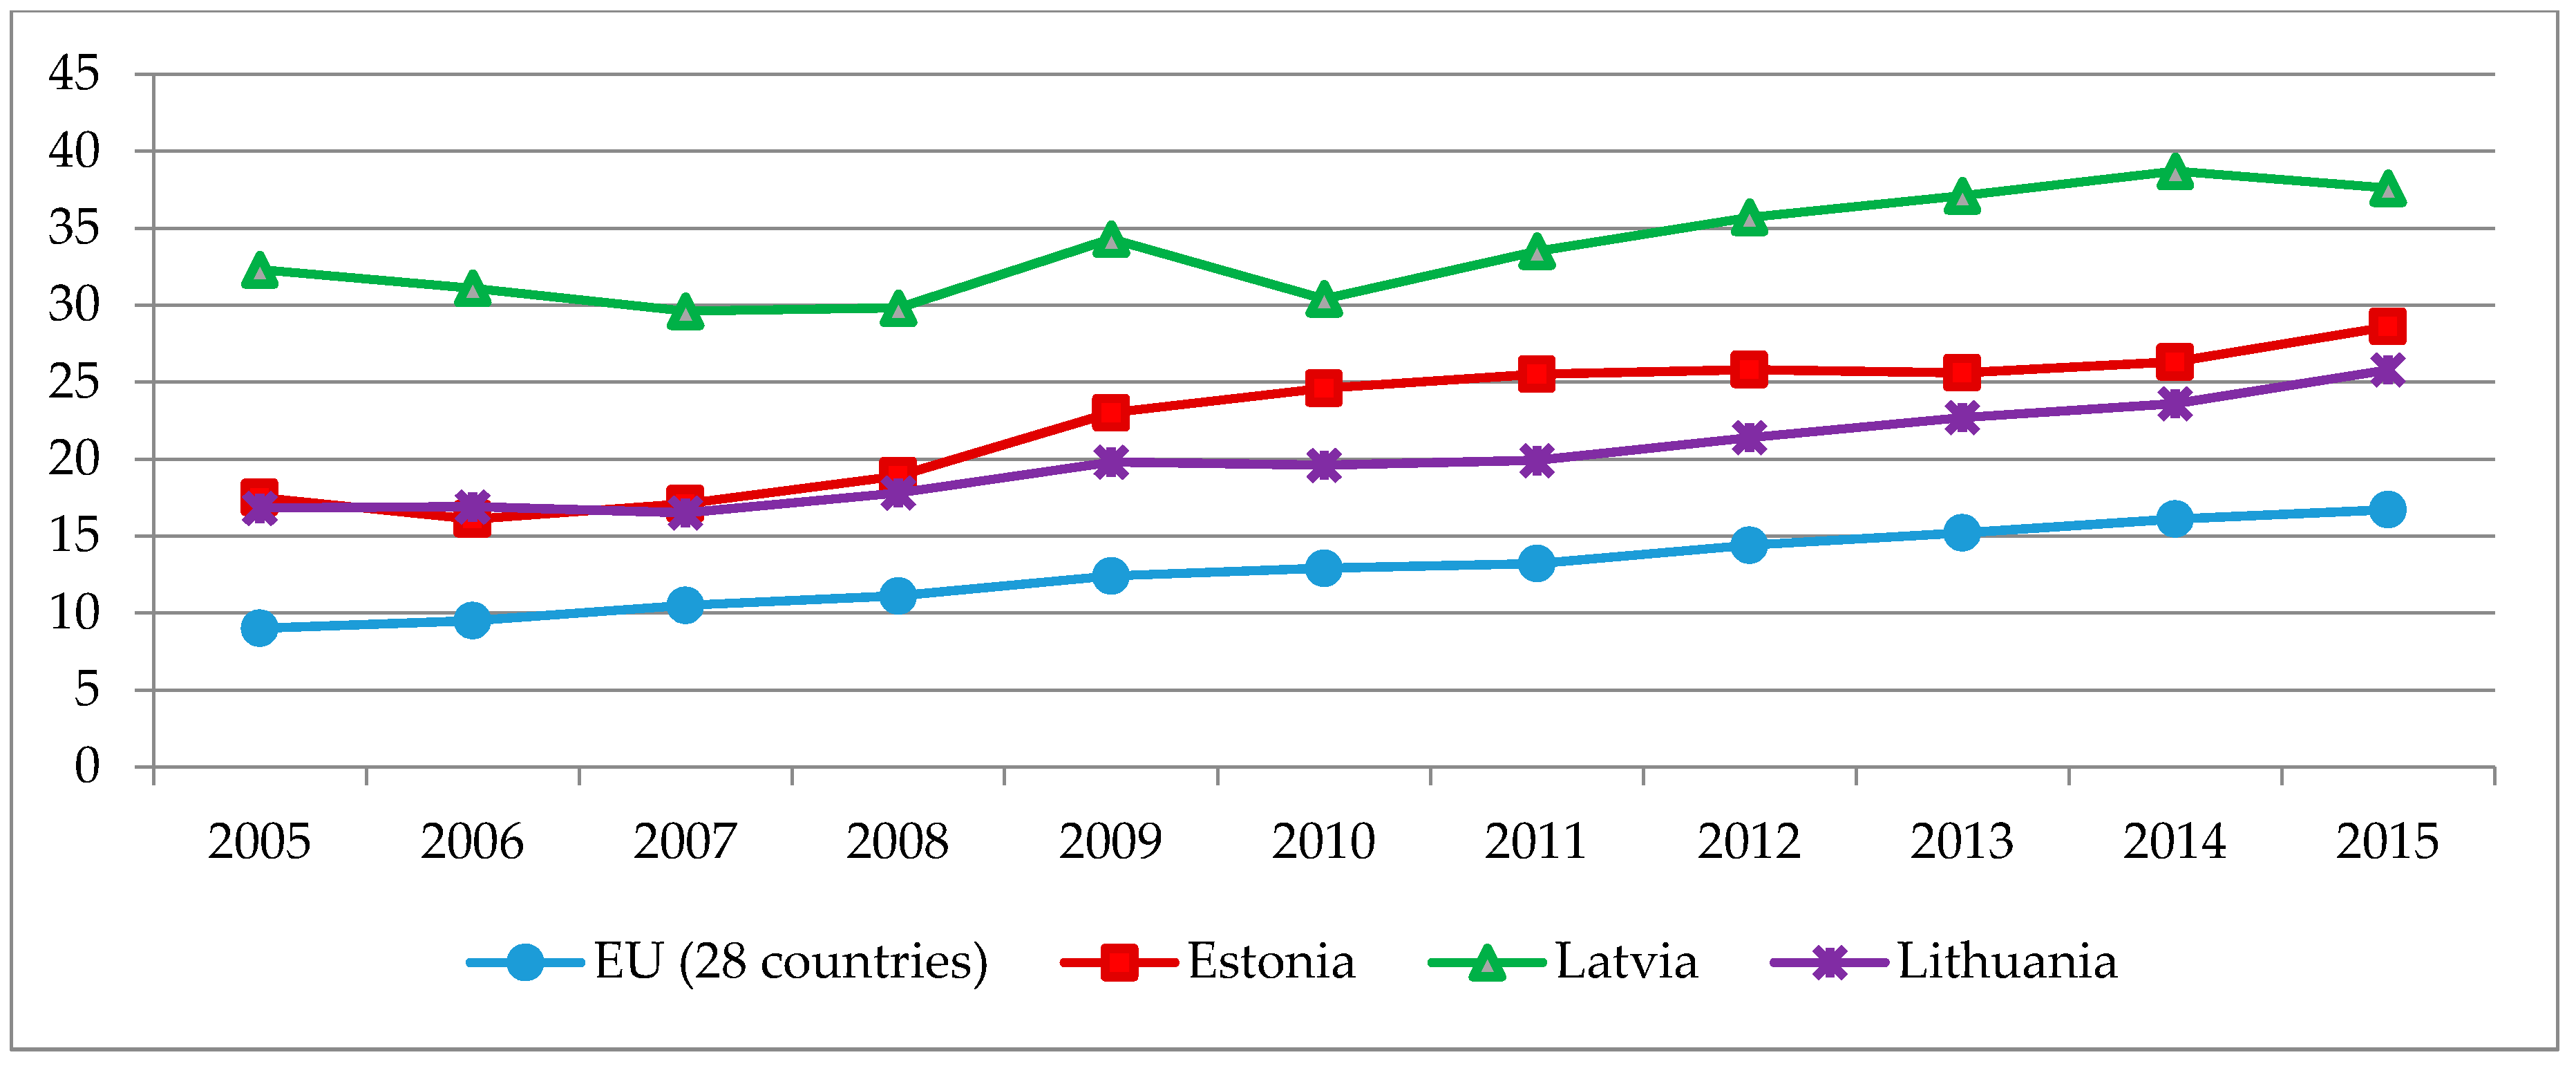
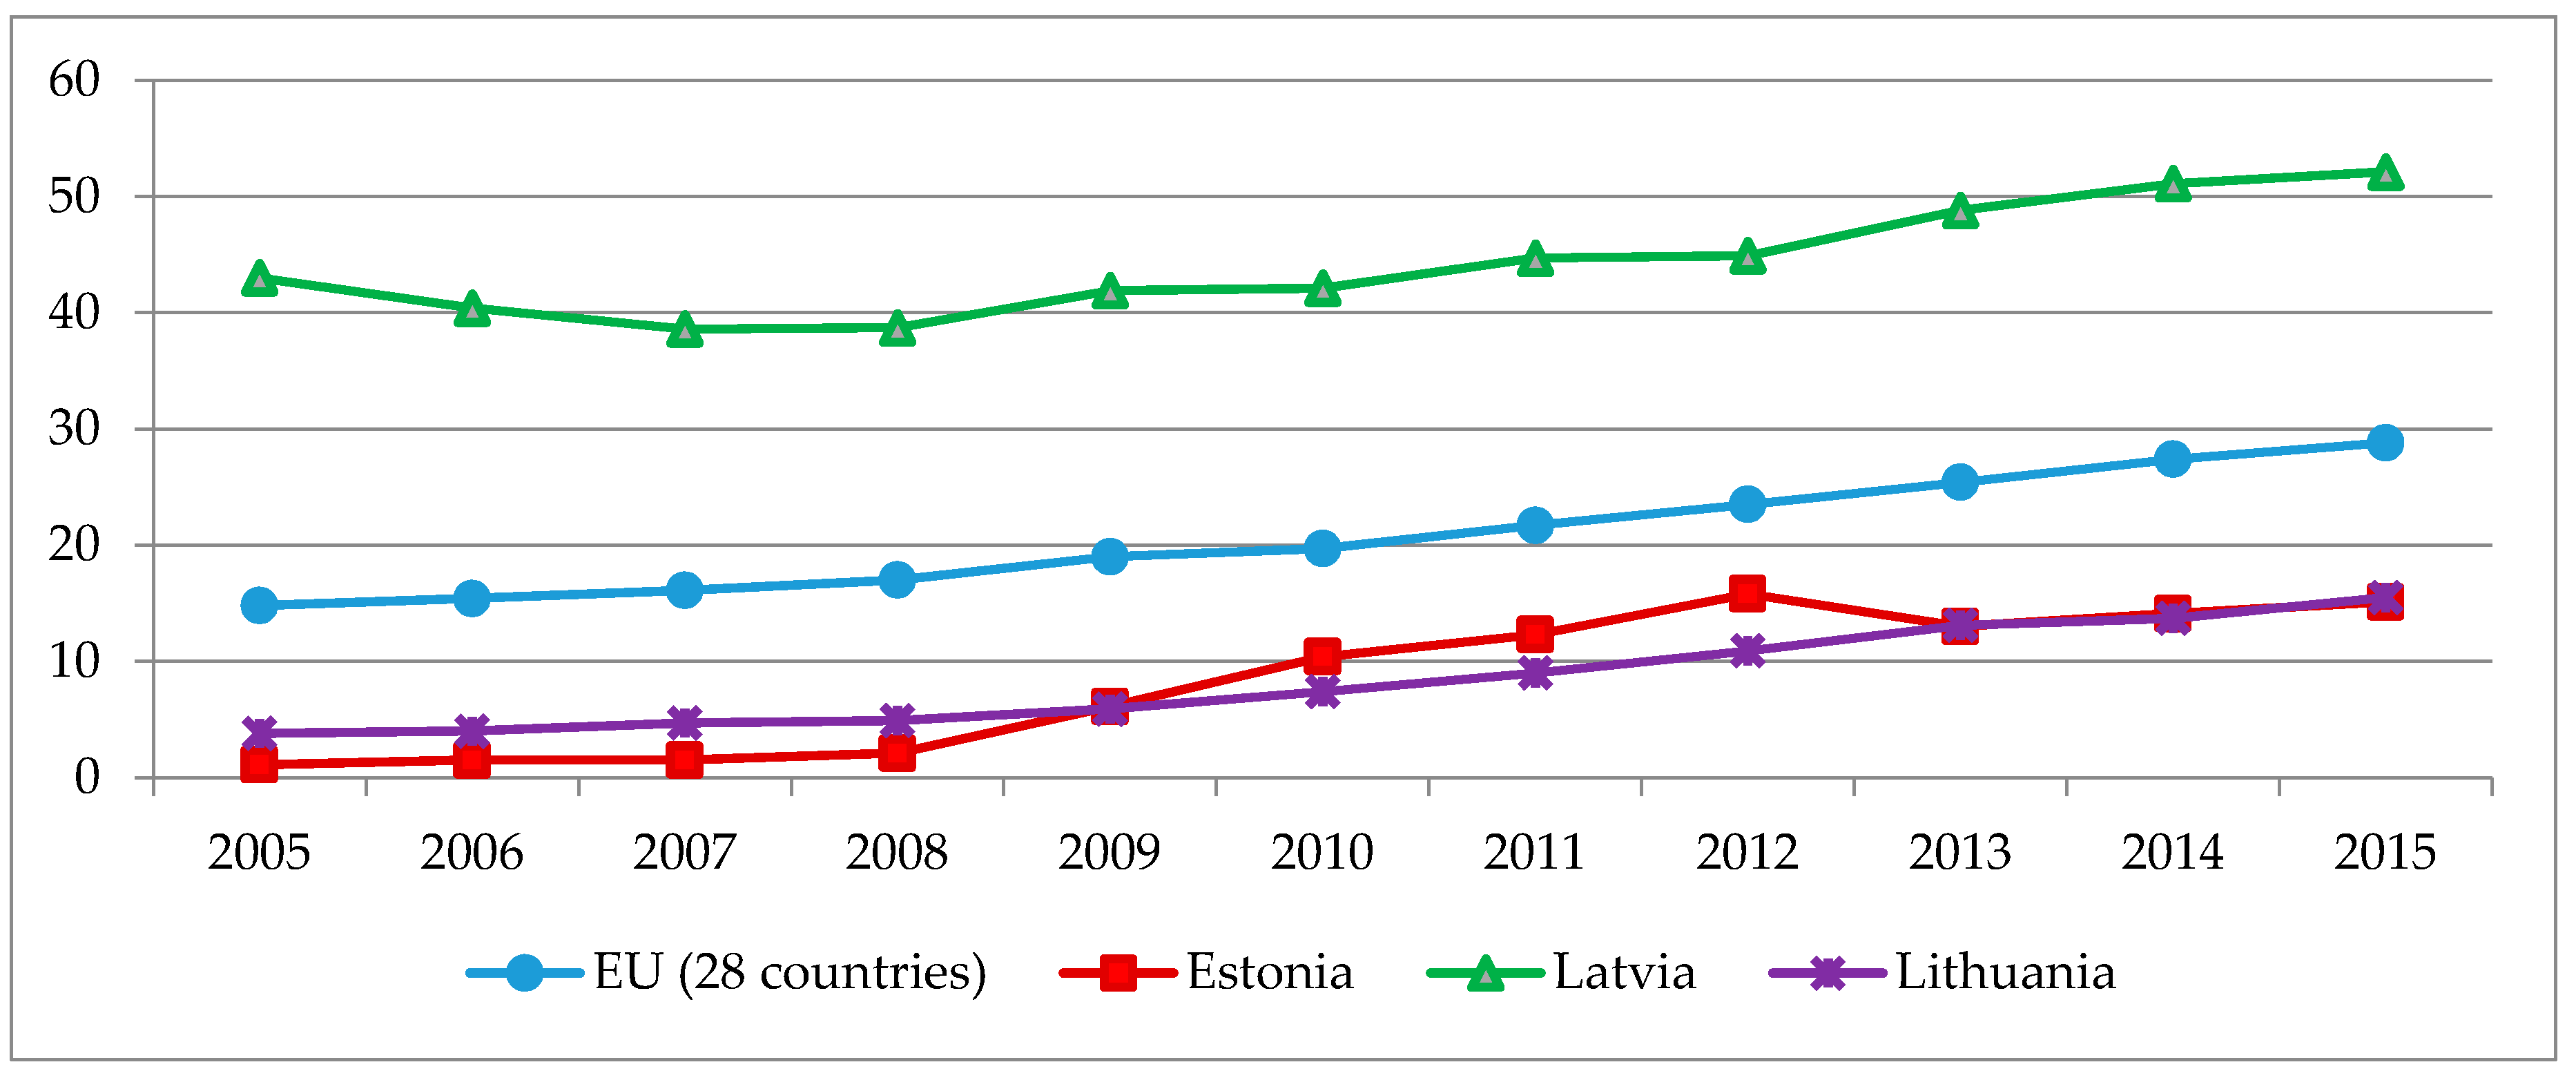
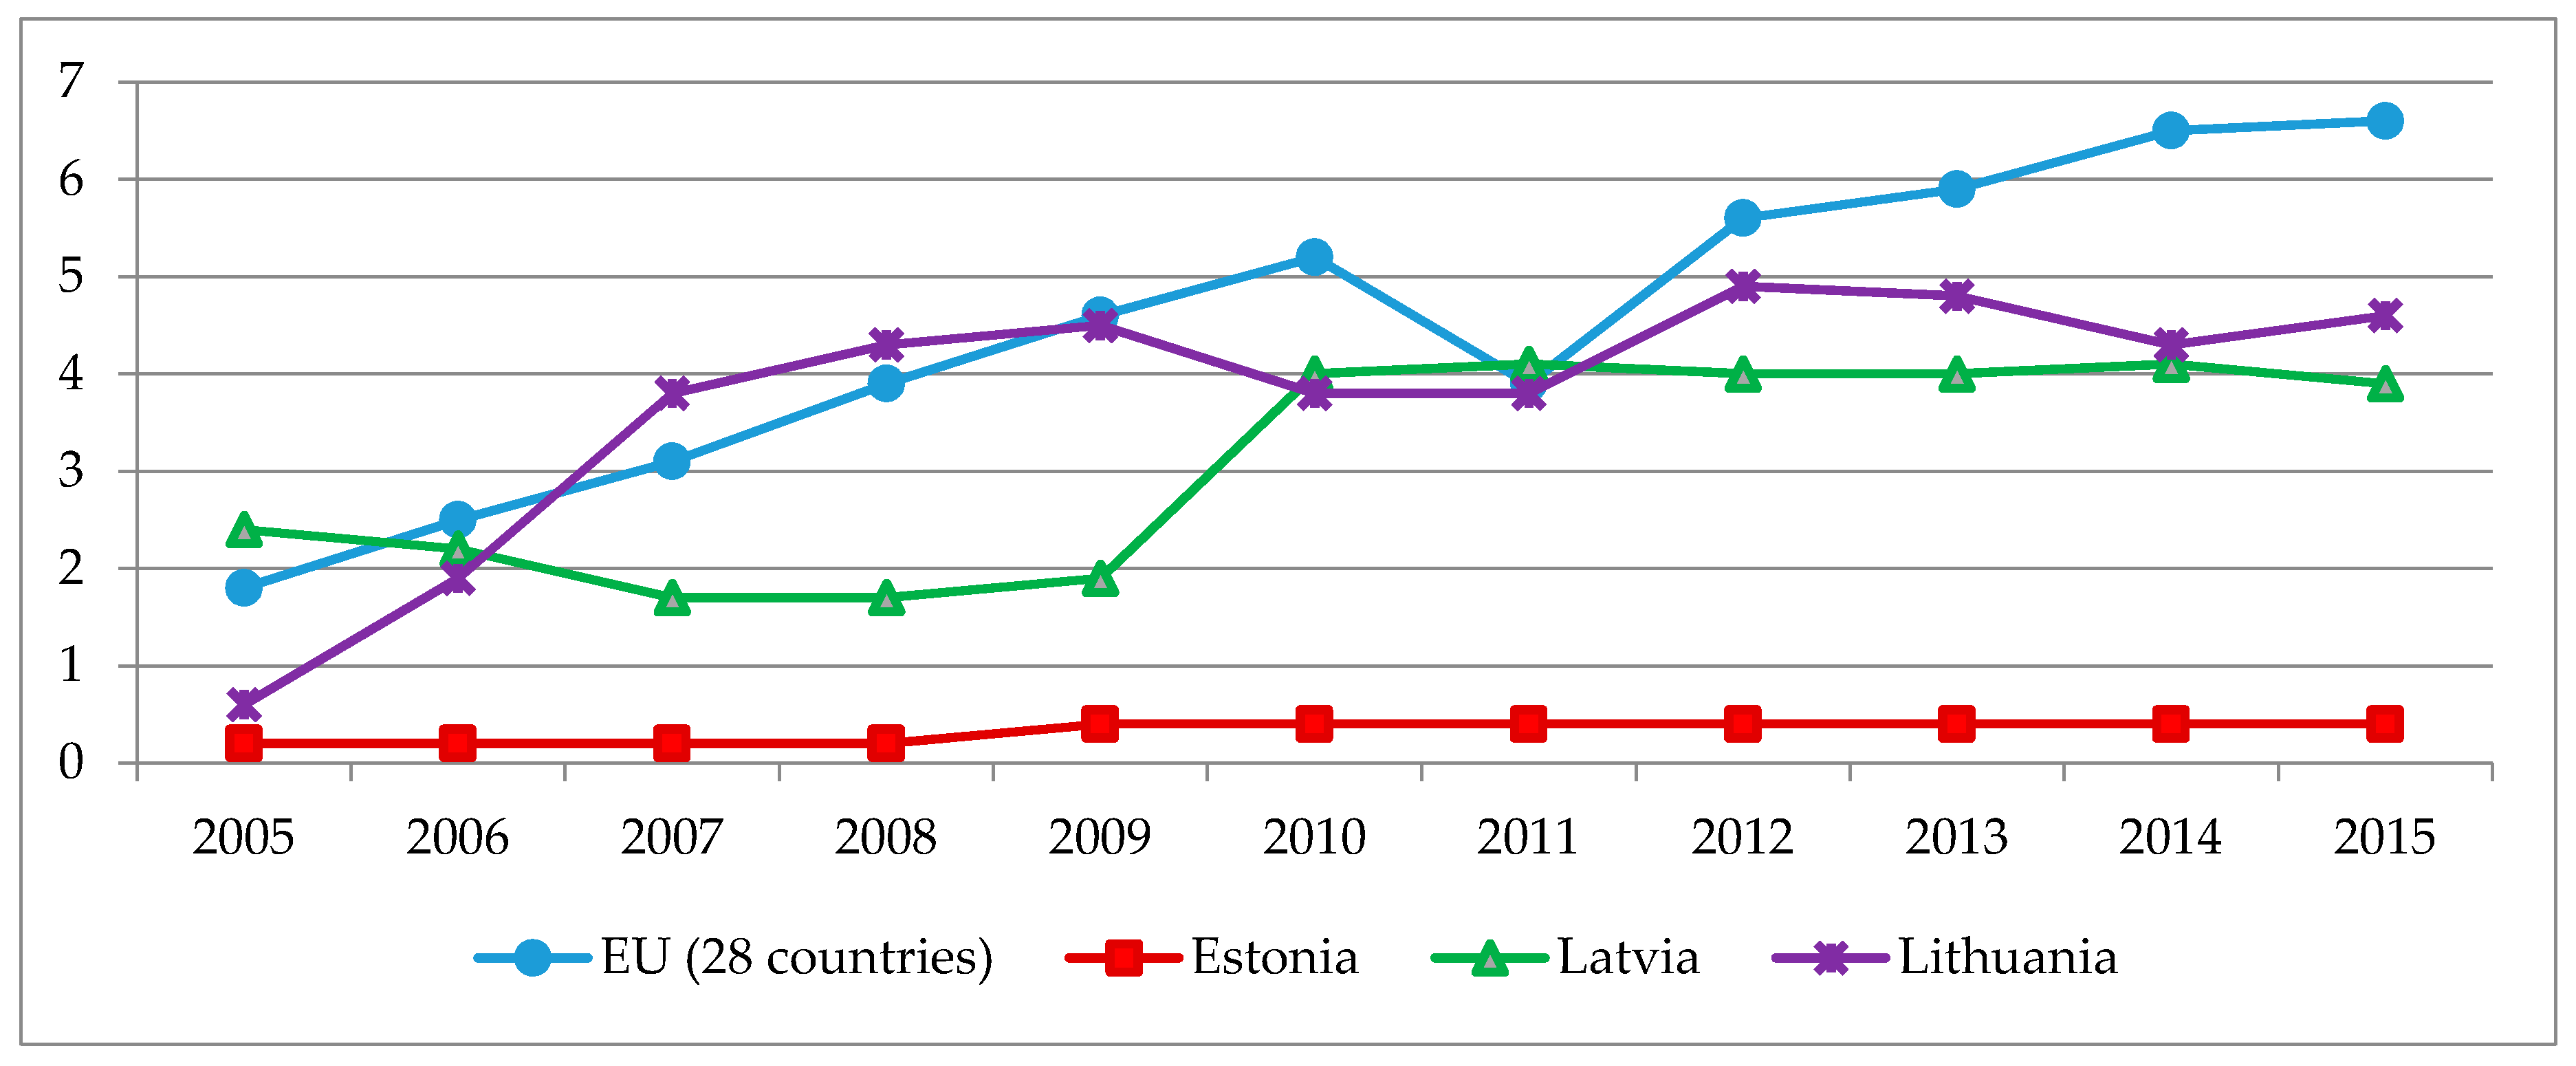
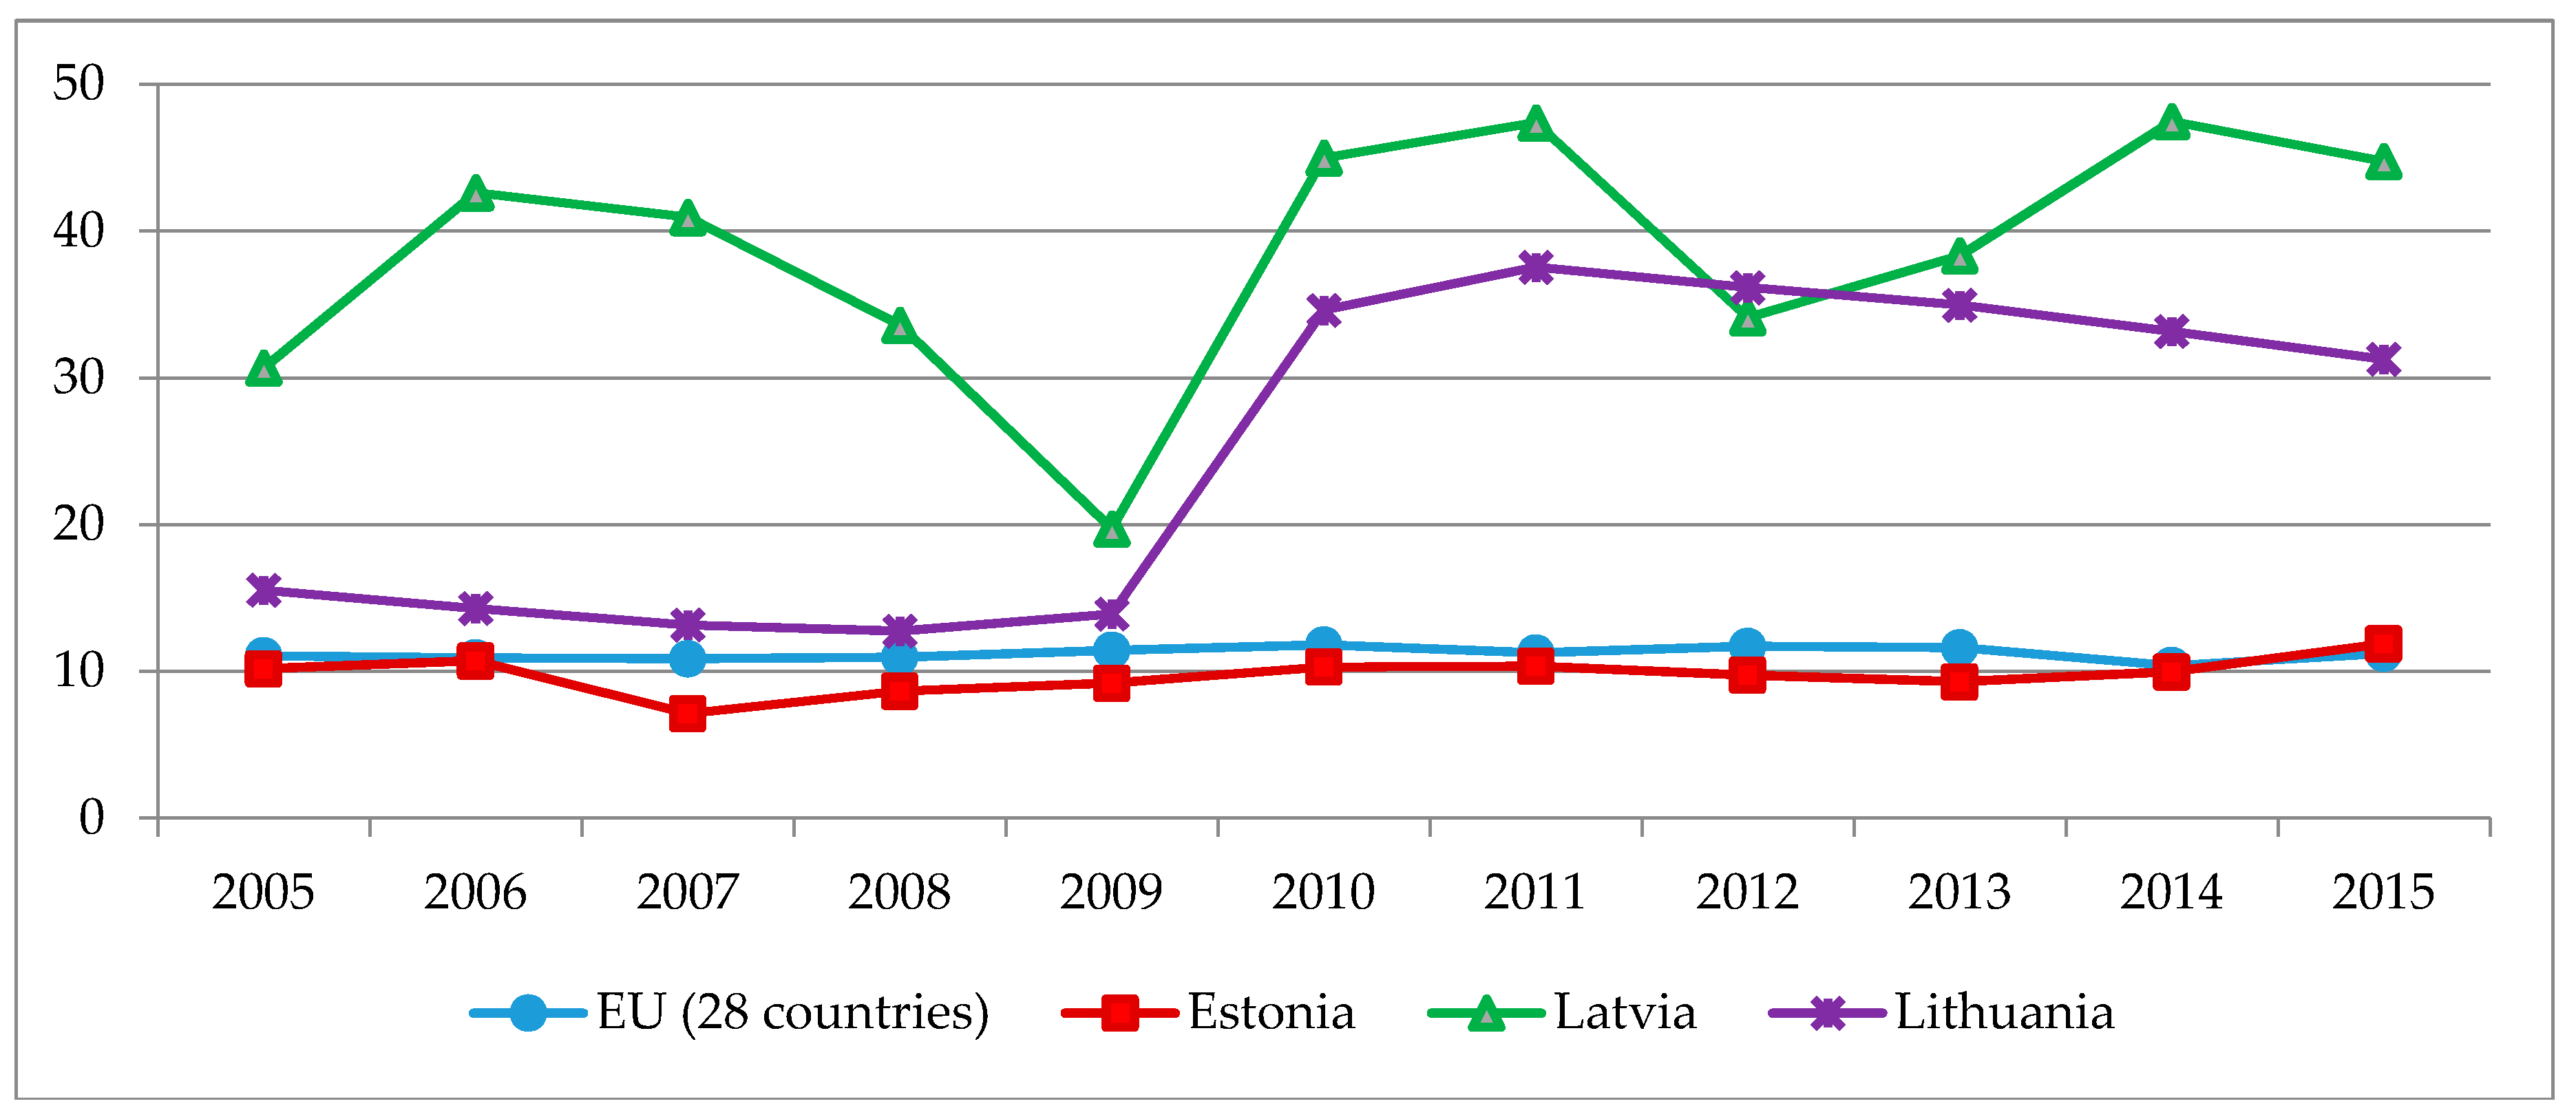
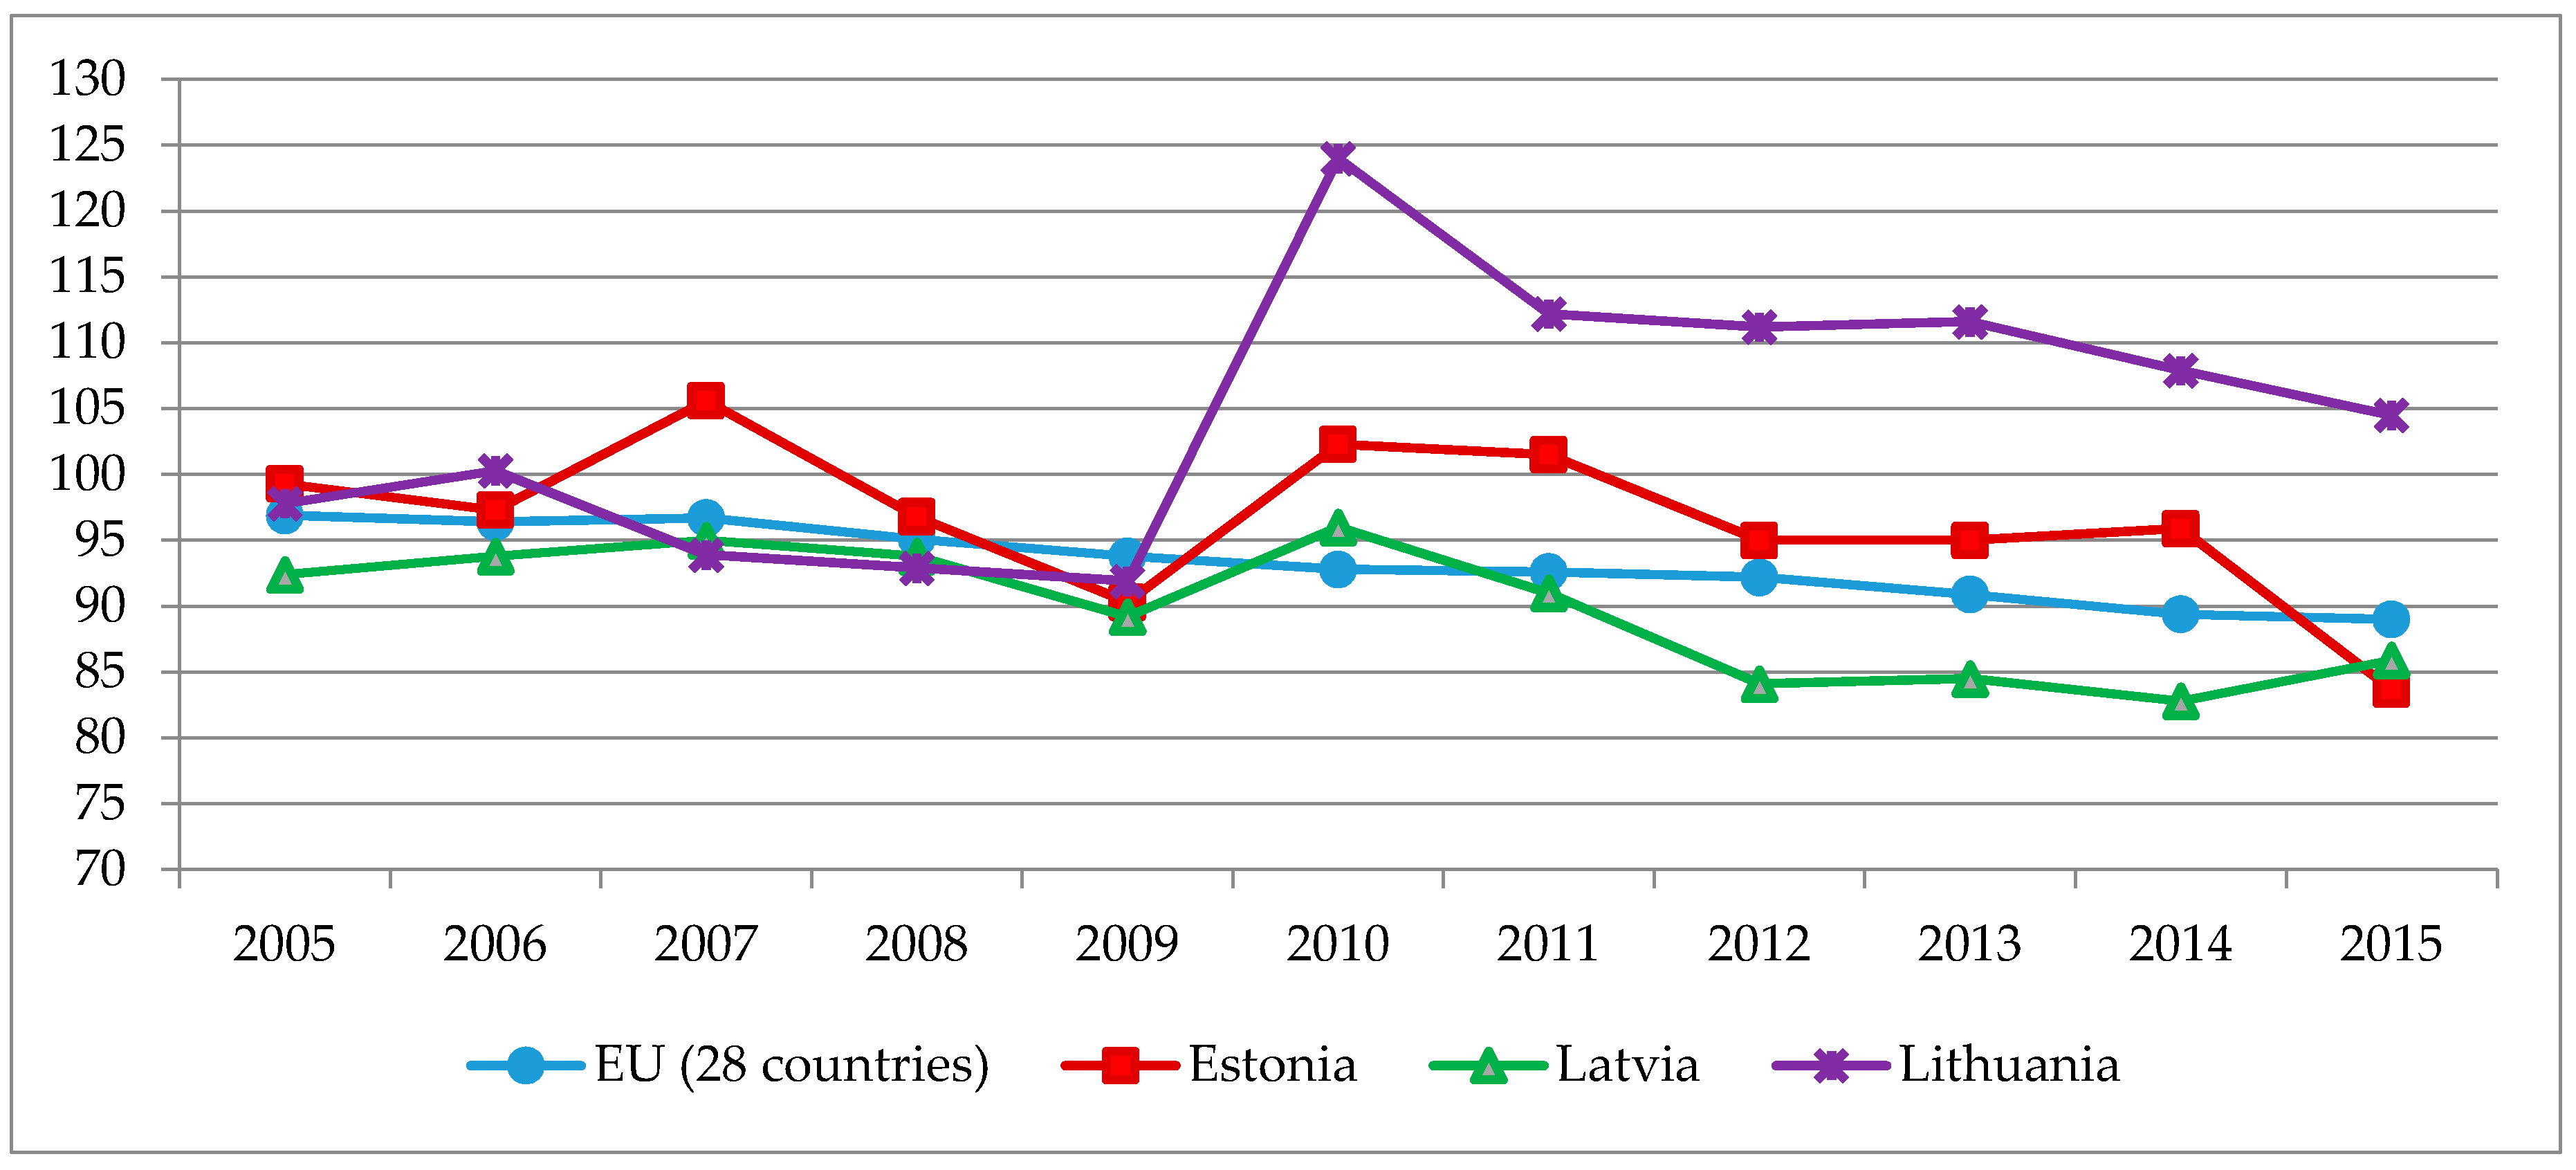
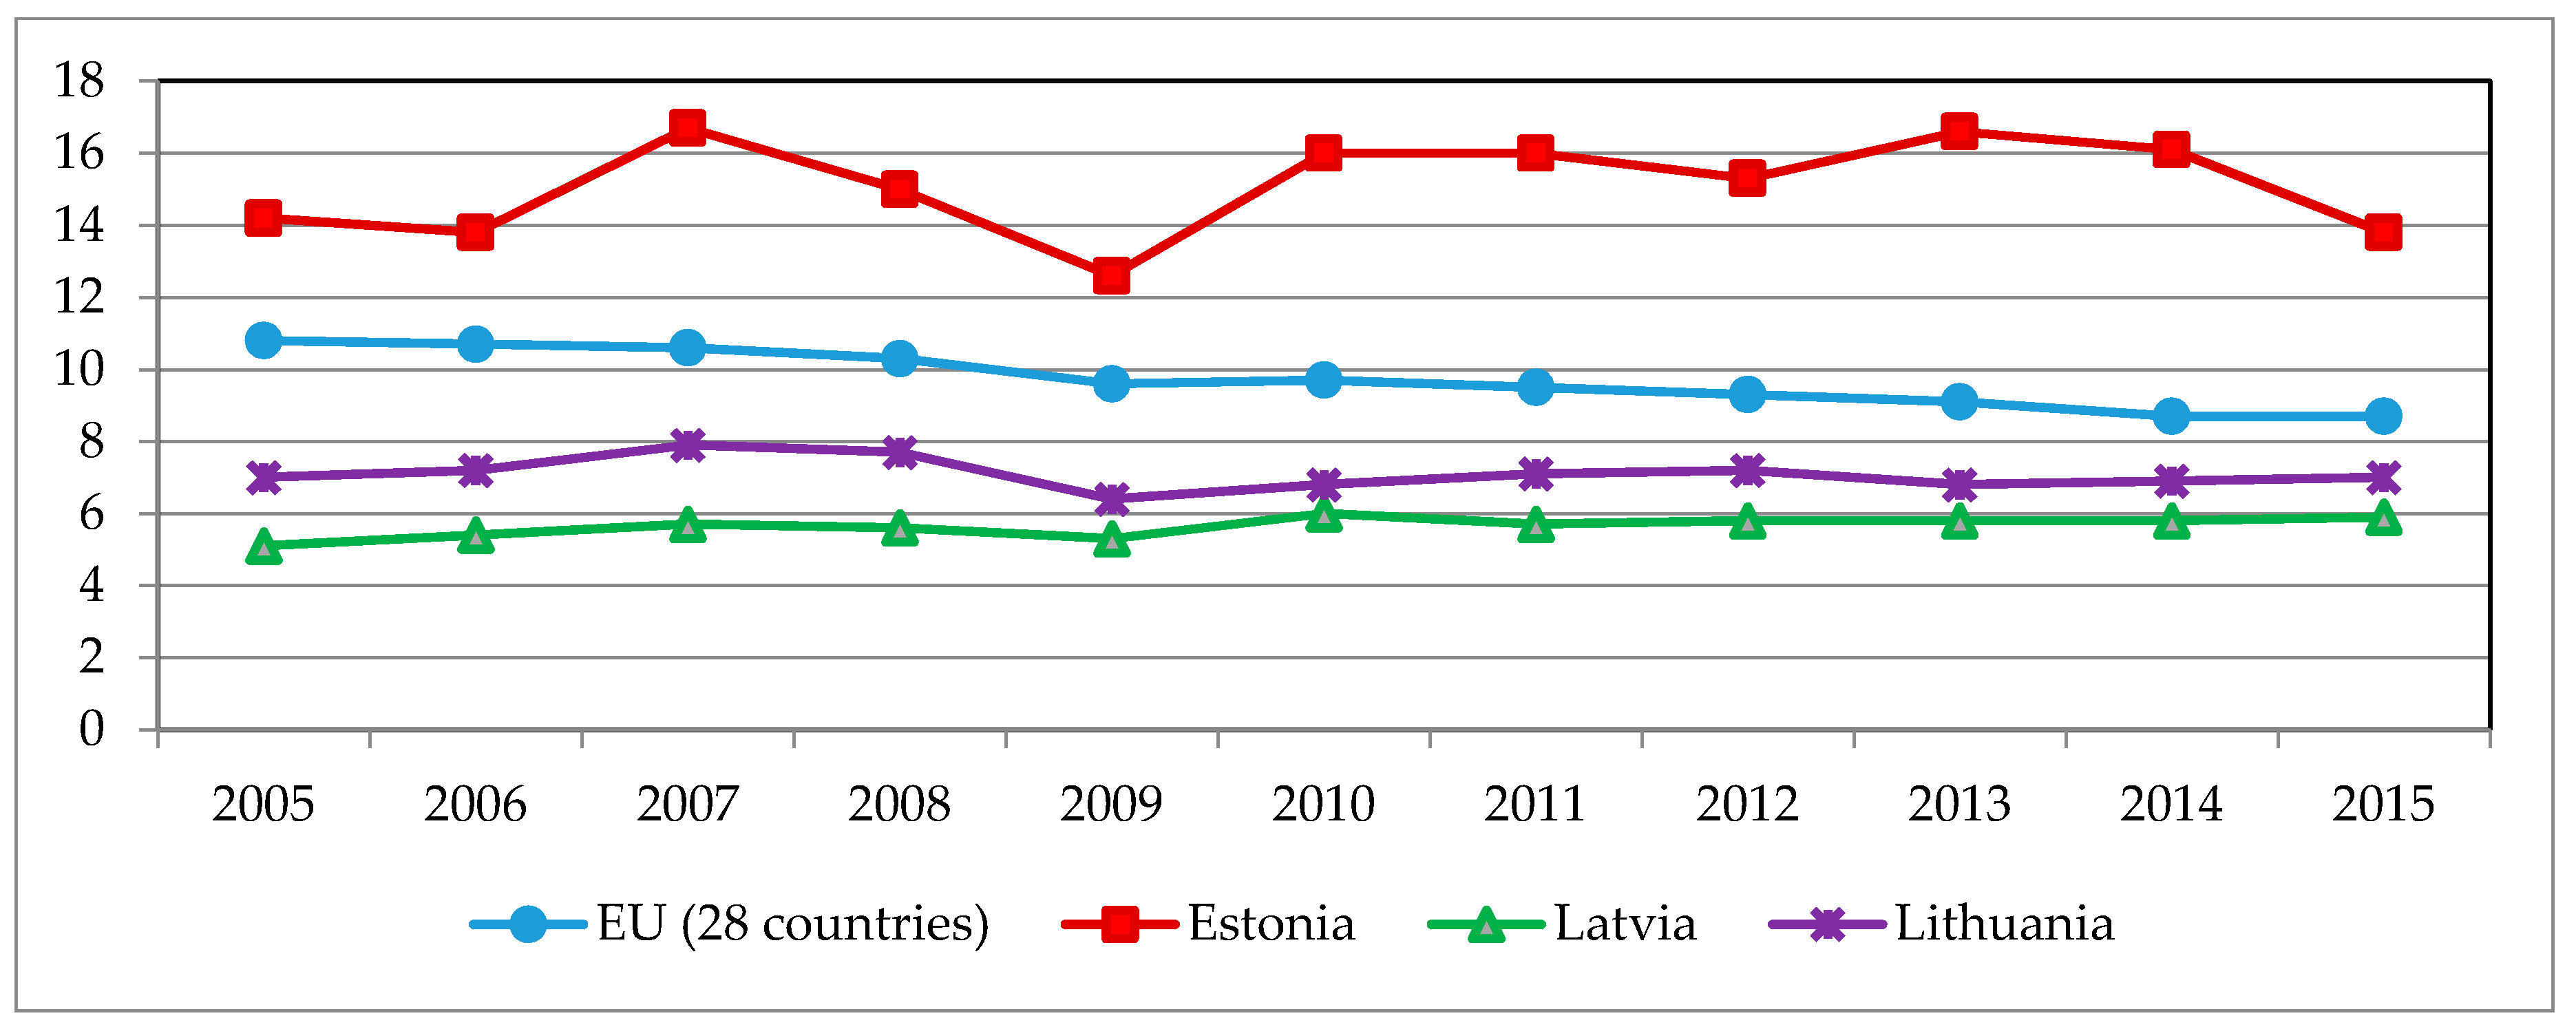
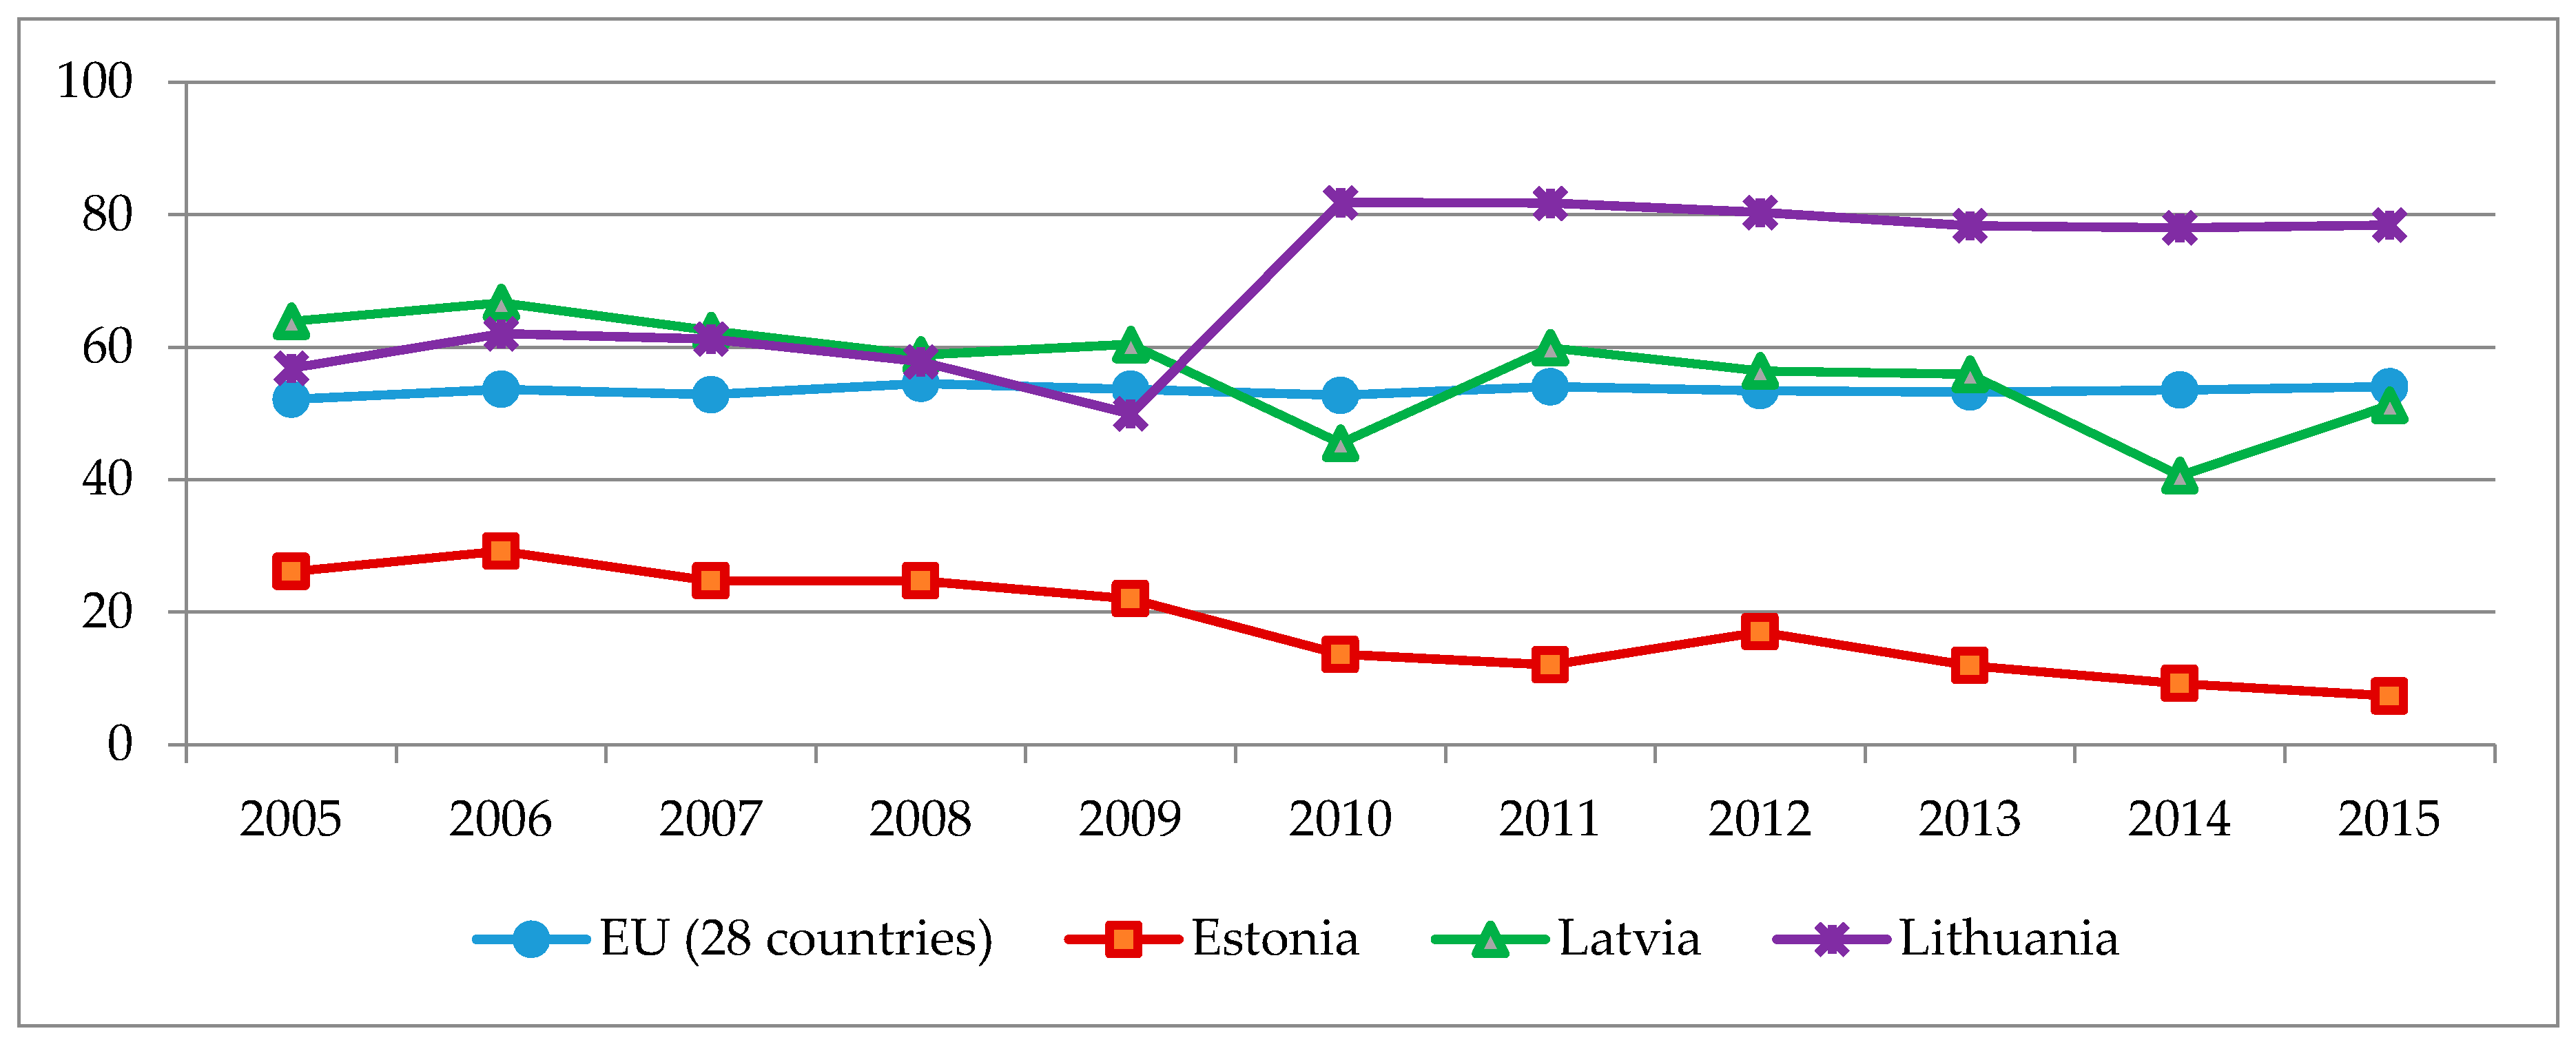
Table 1.
Excise duties in Estonia, 2015 [34].
Table 1.
Excise duties in Estonia, 2015 [34].
| Excise Duties | Energy Products | Unit | EUR |
|---|---|---|---|
| Petrol | Leaded petrol. | per 1000 L | 4227.7 |
| Unleaded petrol. | per 1000 L | 422.77 | |
| Gas oil (diesel) | Propellant use. | per 1000 L | 392.92 |
| Industrial/commercial use. | per 1000 L | 110.95 | |
| Heating—Business and non-business use. | per 1000 L | 110.95 | |
| Kerosene | Propellant use and industrial/commercial use. | per 1000 L | 330.10 |
| Heating—Business and non-business use. | per 1000 L | 330.10 | |
| Heavy fuel oil | Heating—both business and non-business use. | per 1000 kg | 15.01 |
| Liquefied Petroleum Gas (LPG) | Propellant use and industrial/commercial use. | per 1000 kg | 125.26 |
| LPG for heating use (business and non-business). | per 1000 kg | 0.00 | |
| Natural gas | Propellant use and industrial/commercial use. | per GJ | 0.00 |
| Heating—Business and non-business use. | per GJ | 0.70 | |
| Coal, coke, and lignite | Heating—Business use and non-business use. | per GJ | 0.30 |
| Electricity | Business and Non-business use. | per MWh | 4.47 |
Table 2.
The tax rates for pollutants in Estonia, 2015 [34].
Table 2.
The tax rates for pollutants in Estonia, 2015 [34].
| Pollutants | Tax Rate, EUR/Tone |
|---|---|
| I Pollutants Discharged into the Atmosphere | |
| SO2 | 145.46 |
| CO | 7.70 |
| Particulates (except heavy metals and compounds of heavy metal) | 146.16 |
| NOx | 122.32 |
| Volatile organic compounds (except mercaptans and methane) | 122.32 |
| Mercaptans | 31,785 |
| Heavy metals and compounds of heavy metals | 1278 |
| II Pollutants Discharged into the Waters, Ground, and Deeper Layers of the Soil | |
| Organic matter | 1435 |
| Phosphorous compounds | 12,014 |
| Nitrogen oxides | 2826 |
| Suspended solids | 552.89 |
| Sulfates | 7.09 |
| Monophenols | 24326 |
| Oil, oil products, mineral oil, or liquid products obtained from the thermal treatment of solid fuel or other organic matter | 4582 |
| Other hazardous waste for the purposes of the Water Act, which have not been specified above | 21,056 |
| III Waste Disposal | |
| Non-hazardous and hazardous waste | 29.84 |
| Waste building materials as well as construction and demolition waste containing asbestos | 0.63 |
| Mine waste from oil shale | 0.91 |
| Waste that contains wood preservatives, inorganic pesticides, asbestos, arsenic, or lead | 62.65 |
| Waste that contains mercury, cadmium, cyanides, polychlorinated biphenyls or polychlorinated terphenyls or organic pesticides | 625.56 |
| Oil shale, fly ash, oil shale bottom ash, and cement clinker dust | 2.98 |
| IV Types of Packaging | |
| Glass packaging | 600 |
| Plastic packaging | 2500 |
| Metal packaging | 2500 |
| Paper and carton packaging | 1200 |
| Wood packaging | 1200 |
Table 3.
Excise duties in Latvia, 2015 [34].
Table 3.
Excise duties in Latvia, 2015 [34].
| Excise Duties | Energy Products | Unit | EUR |
|---|---|---|---|
| Petrol | Leaded petrol. | per 1000 L | 455.32 |
| Unleaded petrol. | per 1000 L | 411.21 | |
| Unleaded petrol with 70–85% bioethanol. | per 1000 L | 123.36 | |
| Gas oil (diesel) | Gas oil used as a propellant. | per 1000 L | 332.95 |
| Gas oil used as a propellant: if the fuel contains at least 30% biofuel of rapeseed origin by volume. | per 1000 L | 233.35 | |
| Gas oil used as a propellant: fuels that are 100% biofuels. | per 1000 L | 0.00 | |
| Gas oil used for industrial or commercial use and both business and non-business heating. | per 1000 L | 56.91 | |
| Gas oil used for industrial or commercial use and both business and non-business heating: fuels that contain at least 5% biofuel of rapeseed origin are taxed less. | per 1000 L | 21.34 | |
| Gas oil used for industrial or commercial use and both business and non-business heating: gas oil used for certain agricultural purposes. | per 1000 L | 0.00 | |
| Kerosene | Kerosene used as a propellant. | per 1000 L | 332.95 |
| Kerosene used for industrial or commercial use and both business and non-business heating. | per 1000 L | 56.91 | |
| Kerosene used for industrial or commercial use and both business and non-business heating that contains at least 5% biofuel of rapeseed origin are taxed less. | per 1000 L | 21.34 | |
| Heavy fuel oil: | Heating—business and non-business use. | per 1000 kg | 15.65 |
| Liquefied Petroleum Gas (LPG) | Propellant and industrial or commercial use. | per 1000 kg | 161.00 |
| LPG for heating—business and non-business use. | per 1000 kg | 0.00 | |
| Natural gas | Used as a propellant. | per GJ | 2.67 |
| Natural gas used to heat covered agricultural land or industrial poultry houses | per GJ | 0.00 | |
| Heating—business and non-business use. | per GJ | 0.46 | |
| Coal, coke, and lignite | Heating—business and non-business use. | per GJ | 0.30 |
| Electricity | Business and non-business use. | per MWh | 1.01 |
Table 4.
Pollution tax rates in Latvia, 2015 [34].
Table 4.
Pollution tax rates in Latvia, 2015 [34].
| Pollutant | Tax Rate, EUR/Tone |
|---|---|
| Air Pollution Taxes | |
| CO2 | 3.5 |
| PM10 (not containing heavy metals) | 75 |
| CO | 7.83 |
| CH4 and other NOC | 18.5 |
| SO2, NOx, VOCs | 85.37 |
| Heavy metals | 1138.3 |
| PM10 for bulk handling on open terminals | 1500 |
| Water Pollution Tax | |
| Non-hazardous substances | 5.50 |
| Suspended (non-hazardous) substances | 14.23 |
| Moderately hazardous substances | 42.69 |
| Hazardous substances | 11,382.97 |
| Especially hazardous substances | 71,143.59 |
| Phosphorus (total content) | 270.00 |
Table 5.
Excise duties in Lithuania, 2015 [34].
Table 5.
Excise duties in Lithuania, 2015 [34].
| Excise Duties | Energy Products | Unit | EUR |
|---|---|---|---|
| Petrol | Leaded petrol. | per 1000 L | 579.24 |
| Unleaded petrol. | per 1000 L | 434.43 | |
| Gas oil (diesel) | Propellant use and industrial/commercial use. | per 1000 L | 330.17 |
| Heating—business and non-business use. | per 1000 L | 21.14 | |
| Kerosene | Propellant use and industrial/commercial use. | per 1000 L | 330.17 |
| Heating—business and non-business use. | per 1000 L | 330.17 | |
| Heavy fuel oil | Heating—business and non-business use. | per 1000 kg | 15.06 |
| LPG | Propellant use and industrial/commercial use. | per 1000 kg | 304.10 |
| LPG for heating—business and non-business use. | per 1000 kg | 0.00 | |
| Natural gas | Propellant use | per GJ | 5.83 |
| Industrial/Commercial use. | per GJ | 0.00 | |
| Heating—business and non-business use. | per GJ | 0.00 | |
| Coal, coke, and lignite | Heating—business use. | per GJ | 0.15 |
| Heating—non-business use. | per GJ | 0.30 | |
| Electricity | Business use. | per MWh | 0.52 |
| Non-business use. | per MWh | 1.01 |
Table 6.
The tax rates for pollutants in Lithuania, 2015 [34].
Table 6.
The tax rates for pollutants in Lithuania, 2015 [34].
| Pollutants | Tax Rate, Eur/Tone | |
|---|---|---|
| I Pollutants Discharged into the Atmosphere | ||
| SO2 | 104 | |
| NOx | 196 | |
| Vanadium pentoxide | 3855 | |
| Solid particles (organic and inorganic) | 61 | |
| II Pollutants Discharged into the Waters, Ground, and Deeper Layers of the Soil | ||
| BDS7 | 256 | |
| Total nitrogen | 201 | |
| Total phosphorus | 1007 | |
| Suspended materials | 103 | |
| Sulfates | 0.58 | |
| Chlorides | 2.8 | |
| III Pollution Tax Rates for Pollution from Mobile Sources of Pollution | ||
| Vehicles | petrol | 7 |
| diesel | 8 | |
| liquefied petroleum gas | 7 | |
| compressed natural gas | 6 | |
| Vessels | petrol | 11 |
| diesel | 12 | |
| fuel oil with sulfur content 0.5% | 2.8 | |
| fuel oil with sulfur content from 0.5% to 1.5% | 5 | |
| fuel oil with sulfur content from 1.5% to 2.5% | 7 | |
| Rail transport | diesel | 9 |
| Take-off/landing cycle of aircrafts | for one cycle | 1.70 |
| IV Goods | ||
| Tires weighing over 3 kg | new | 86 |
| retreated | 86 | |
| used | 104 | |
| Accumulators | 144 | |
| Voltaic cells | 2896 | |
| Oil or petrol filters for internal combustion engines | 463 | |
| Intake air filters for internal combustion engines | 463 | |
| Hydraulic shock absorbers for motor vehicles | 347 | |
| V Types of Packaging | ||
| Glass packaging | 57 | |
| Plastic packaging | 521 | |
| Composite packaging and polyethylene terephthalate (PET) packaging | 579 | |
| Metal packaging | 753 | |
| Paper and carton packaging | 28 | |
| Other packaging | 57 | |
Table 7.
Framework of sustainable energy development indicators.
| Indicator | Units of Measurement | Target Value |
|---|---|---|
| Economic Indicators | ||
| Energy intensity of the economy | Gross inland consumption of energy divided by GDP (kg of oil equivalent per 1000 EUR) | − |
| Primary energy consumption | Index, 2005 = 100 | − |
| Environmental Indicators | ||
| Carbon intensity of energy consumption | Greenhouse gas emissions (energy sector), Index, 2000 = 100% | − |
| Electricity generated from renewable sources | % of gross electricity consumption | + |
| The share of renewable resources in final energy consumption | % from the amount of energy produced (net) | + |
| The share of renewable resources in fuel consumption of transport | % from the amount of fuel used | + |
| Combined heat and power generation in electricity | % of gross electricity generation | + |
| Social Indicators | ||
| Public health | Greenhouse gas emissions per capita, tons of CO2 equivalent | − |
| Energy dependence rate | % of energy import of gross inland energy consumption | − |
Table 8.
Linear equations of energy sustainability temporal dynamics and their statistical significance. ESDI: framework of indicators for the development of sustainable energy.
Table 8.
Linear equations of energy sustainability temporal dynamics and their statistical significance. ESDI: framework of indicators for the development of sustainable energy.
| ESDI Indicator | Country | Linear Equation | Determination Coefficient (R2) |
|---|---|---|---|
| Energy intensity of the economy | Lithuania | y = −13.255x + 338,05 | R2 = 0.90489 |
| EU 28 countries | y = −2.64x + 149.68 | R2 = 0.94508 | |
| Primary energy consumption | Estonia | y = 1.9791x + 97.58 | R2 = 0.64986 |
| Latvia | y = −0.8082x + 104.35 | R2 = 0.57802 | |
| Lithuania | y = −3.7082x + 107.59 | R2 = 0.78998 | |
| EU 28 countries | y = −1.2436x + 102.29 | R2 = 0.89739 | |
| Carbon intensity of energy consumption | Estonia | y = −0.98x + 102.49 | R2 = 0.2959 |
| Latvia | y = −1.1418x + 96.715 | R2 = 0.62141 | |
| Lithuania | y = 1.5809x + 94.896 | R2 = 0.271 | |
| EU 28 countries | y = −0.8355x + 98.267 | R2 = 0.97179 | |
| The share of renewable resources in final electricity generation | Estonia | y = 1.7136x − 1.8273 | R2 = 0.88265 |
| Latvia | y = 1.2191x + 36.895 | R2 = 0.74611 | |
| Lithuania | y = 1.2509x + 0.94 | R2 = 0.95156 | |
| EU 28 countries | y = 1.4691x + 11.985 | R2 = 0.97714 | |
| The share of renewable resources in final energy consumption | Estonia | y = 1.2555x + 15.104 | R2 = 0.89515 |
| Latvia | y = 0.8218x + 28.715 | R2 = 0.68938 | |
| Lithuania | y = 0.8882x + 14.744 | R2 = 0.93365 | |
| EU 28 countries | y = 0.7855x + 8,1055 | R2 = 0.99424 | |
| The share of renewable resources in fuel used in transport | Estonia | y = 0.0255x + 0.1745 | R2 = 0.7 |
| Latvia | y = 0.2618x + 1.52 | R2 = 0.64288 | |
| Lithuania | y = 0.3009x + 1.9491 | R2 = 0.64252 | |
| EU 28 countries | y = 0.4645x + 1.7218 | R2 = 0.91129 | |
| Combined heat and power generation in electricity | Lithuania | y = 2.6361x + 9.3944 | R2 = 0.63909 |
| Public health | Latvia | y = 0.0609x + 5.28 | R2 = 0.54611 |
| EU 28 countries | y = −0.2282x + 11.096 | R2 = 0.96391 | |
| Energy dependence rate | Estonia | y = −2.1618x + 30.944 | R2 = 0.88281 |
| Latvia | y = −1.7545x + 67.055 | R2 = 0.53825 | |
| Lithuania | y = 2.7282x + 53.285 | R2 = 0.56352 |
Table 9.
Scale of correlation coefficient values.
| Very Strong | Strong | Average | Weak | Very Weak | No Link | Very Weak | Weak | Average | Strong | Very Strong |
|---|---|---|---|---|---|---|---|---|---|---|
| from −1 to −0,8 | from −0.79 to −0.6 | from −0.59 to −0.4 | from −0.39 to −0.1 | from −0.09 to 0 | 0 | from 0 to 0.09 | from 0.1 to 0.39 | from 0.4 to 0.59 | from 0.6 to 0.79 | from 0.8 to 1 |
Table 10.
Correlation between ESDI indicators and environmental taxes.
| ESDI Indicator | Taxes | Estonia | Latvia | Lithuania |
|---|---|---|---|---|
| Energy intensity of the economy | Total | 0.344 | −0.614 | −0.764 |
| Energy | 0.384 | −0.604 | −0.825 | |
| Transport | −0.097 | −0.599 | 0.334 | |
| Pollution | −0.144 | −0.666 | −0.233 | |
| Primary energy consumption | Total | 0.774 | −0.720 | −0.640 |
| Energy | 0.773 | −0.717 | −0.687 | |
| Carbon intensity of energy consumption | Total | −0.524 | −0.810 | 0.182 |
| Energy | −0.521 | −0.804 | 0.283 | |
| Transport | −0.320 | −0.768 | −0.220 | |
| Pollution | −0.410 | −0.732 | −0.361 | |
| The share of renewable resources in final electricity generation | Energy | 0.939 | 0.887 | 0.870 |
| Pollution | 0.392 | 0.849 | 0.458 | |
| The share of renewable resources in final energy consumption | Energy | 0.956 | 0.847 | 0.904 |
| Pollution | 0.468 | 0.759 | 0.512 | |
| The share of renewable resources in fuel used in transport | Transport | 0.353 | 0.824 | −0.723 |
| Combined heat and power generation in electricity | Energy | 0.327 | 0.385 | 0.575 |
| Pollution | −0.163 | 0.526 | −0.053 | |
| Public health | Total | 0.234 | 0.696 | −0.252 |
| Energy | 0.231 | 0.683 | −0.245 | |
| Transport | 0.354 | 0.722 | −0.021 | |
| Pollution | 0.154 | 0.468 | 0.105 | |
| Energy independence | Total | −0.914 | −0.718 | 0.465 |
| Energy | −0.925 | −0.736 | 0.535 |
Note: Strong correlation is marked by colored cells.
© 2018 by the authors. Licensee MDPI, Basel, Switzerland. This article is an open access article distributed under the terms and conditions of the Creative Commons Attribution (CC BY) license (http://creativecommons.org/licenses/by/4.0/).
Share and Cite
MDPI and ACS Style
Streimikiene, D.; Siksnelyte, I.; Zavadskas, E.K.; Cavallaro, F. The Impact of Greening Tax Systems on Sustainable Energy Development in the Baltic States. Energies 2018, 11, 1193. https://doi.org/10.3390/en11051193
AMA Style
Streimikiene D, Siksnelyte I, Zavadskas EK, Cavallaro F. The Impact of Greening Tax Systems on Sustainable Energy Development in the Baltic States. Energies. 2018; 11(5):1193. https://doi.org/10.3390/en11051193
Chicago/Turabian StyleStreimikiene, Dalia, Indre Siksnelyte, Edmundas Kazimieras Zavadskas, and Fausto Cavallaro. 2018. "The Impact of Greening Tax Systems on Sustainable Energy Development in the Baltic States" Energies 11, no. 5: 1193. https://doi.org/10.3390/en11051193
Note that from the first issue of 2016, this journal uses article numbers instead of page numbers. See further details here.