A Comparative Thermodynamic Study of Equilibrium Conditions for Carbon Deposition from Catalytic C–H–O Reformates


Department of Chemical Technology and Engineering, West Pomeranian University of Technology, Szczecin, 71065 Szczecin, Poland
*
Author to whom correspondence should be addressed.
Energies 2018, 11(5), 1177; https://doi.org/10.3390/en11051177
Submission received: 3 April 2018
/
Revised: 16 April 2018
/
Accepted: 2 May 2018
/
Published: 7 May 2018
(This article belongs to the Section I: Energy Fundamentals and Conversion)
Abstract
:The importance of carbon deposition occurring during catalytic fuel reforming is briefly described along with former studies on the process. Thermodynamic fundamentals of modeling the critical conditions of the deposition equilibrium are presented. Computational results of ternary C–H–O diagrams with the threshold lines between the carbon deposition and deposition-free regions are discussed for two new pressure levels of 3 and 30 bar and a temperature range from 200 to 1000 °C. The process pressure does not affect the temperature range typical for the type of deposited carbon allotrope; either graphite, multi-walled carbon nanotubes, or single-walled carbon nanotubes in bundles. However, pressure has a profound influence on the location of the threshold lines for carbon deposition. Three reforming processes of two hydrocarbon fuels are analyzed; catalytic partial oxidation, and wet and dry reforming. Chord lines representing varied compositions of process mixtures are introduced to the ternary diagrams. The intersection points of the chord lines with the threshold lines are used in a novel interpretation of the functions of the oxygen-to-carbon critical ratio against temperature and pressure, which can be used in avoiding carbon deposition in catalytic reforming of natural gas and liquefied petroleum gas.
1. Introduction
The demand for useful energy is systematically growing as the world aims to improve its standard of living. The burning of all fossil fuel forms has serious environmental consequences. A promising alternative of fossil fuels for the future is seen in hydrogen. Energy produced by hydrogen-based fuel cells is characterized as high-quality energy, because of the high conversion efficiency from chemical to electrical energy. The efficiency is almost twice as high compared to internal combustion engines and because of the zero emissions of pollutants and greenhouse gases to the environment, hydrogen fuel cells are currently the promoted form. Hydrogen can be obtained using several technologies: steam reforming (SR) [1]; auto-thermal reforming (ATR) [2]; dry reforming (DR) [3]; or catalytic partial oxidation reforming (CPOX) [4].
Catalytic steam reforming is the most common process due to its high energy efficiency. This technology has been widely applied in chemical industries for large-scale hydrogen production, which accounts for 50% of the hydrogen generated worldwide by using methane from natural gas (NG) as the main hydrocarbon source [5]. It is a well-known process described recently by Adiya et al. [6] and Tuna et al. [7]. The reactions that occur in this process primarily produce H2, CO2, and CO, but there is no set quantity for these compounds. The compounds’ concentrations depend on several factors, such as reagent concentration, temperature, and pressure of the reformer, as well as the physical and chemical characteristics of the chosen catalyst. The overall reaction that occurs in the steam reforming process takes place at temperatures between 650 and 850 °C obtaining H2 yields of 60–70% at a H2/CO ratio equal to 3.0 [7].
In addition to the main reforming reaction, other reactions can simultaneously occur and modify the equilibrium conversion of CO2 and CH4. Boudouard’s reaction leads to carbon formation by carbon monoxide decomposition. This reaction is very important for the reforming process since it is responsible for solid carbon deposition in catalysts. It occurs when the decomposition reaction of carbon monoxide, together with the decomposition reaction of methane, are faster than the carbon removal rate [8].
The formation of carbon deposits on catalysts leads to a blockage of catalyst pores by the deposited carbon, separation of the catalyst from its support, and lack of gas flow due to an increase in pressure caused by pore blockage [9]. The carbon formation may take place by three routes that result in different kinds of coke [10]. At low temperatures, less than 500 °C, adsorbed hydrocarbons may accumulate on the nickel surface and slowly polymerize into an encapsulating film, blocking and deactivating the nickel surface. At high temperature, above 600 °C, pyrolytic coke formed by the thermal cracking of hydrocarbons may encapsulate and deactivate the catalyst particle. At temperatures greater than 450 °C, whisker (filamentous) carbon is the principal product of carbon formation via a mechanism involving the diffusion of carbon through nickel crystals, nucleation, and whisker growth with a nickel crystal on the top. The whisker-type carbon does not deactivate the nickel surface, but rather causes a breakdown of the catalyst by pore plugging [10]. Ginsburg et al. [11] calculated the correlation between the CO2/CH4 ratio and the process of carbon formation on the surface of Ni-based catalysts. According to their model, the reactant ratio should be equal to 2 in order to provide less carbon accumulation. The oxidizing system must have an excess of CO2 as an oxidant.
The modeling of carbon deposition from lower hydrocarbon fuels at thermodynamic equilibrium was widely discussed by Jaworski et al. [12,13]. A minimization algorithm of the system’s total Gibbs energy was applied using the commercial software HSC for both dry and wet reforming processes within the range of 200 °C to 1000 °C and for four levels of constant pressure. Five carbon solid allotropes, such as graphite, diamond, amorphous, multi-walled carbon nanotubes (MWCNT), and single-walled nanotubes in bundles (SWCNT), were allowed to appear in the solid phase. However, no indication of deposits of diamond and amorphous carbon were found for the analyzed systems. The computation results of the deposition conditions at thermodynamic equilibrium showed for the wet reforming of NG and LPG that the maximum critical atomic oxygen to carbon (O/C) ratios were found at 2.0, 2.4, 2.7, and 3.2 for pressures of 1, 3, 10 and 30 bar, respectively. It was concluded that higher O/C values to the one used in predictions should be applied to avoid nanotubular carbon depositions [13]. In addition, the threshold temperature of 431 °C or 577 °C for the deposition boundaries between graphite and MWCNT or MWCNT and SWCNT were confirmed regardless of pressure.
Another available option for hydrogen-rich fuel production beyond steam or CO2 reforming is catalytic partial oxidation (CPOx). A thermodynamic analysis of equilibrium conditions of hydrogen production from natural gas and LPG using the CPOx reformer, with reference to carbon deposition phenomena, was performed by Jaworski and Pianko-Oprych [14]. Methane catalytic reforming in the range of 1 < O/C < 4 resulted in the formation of solid carbon deposits. However, only a single form of depositing carbon was predicted at a time if the O/C ratio fell below the critical value. Depending on the temperature, it was either graphite from 200 to 431 °C, or one of the two carbon nanotubes. Multi-walled carbon nanotubes were found most stable in the range from 431 to 577 °C and single-walled nanotubes in bundles prevailed from 577 up to 1000 °C. The maximum critical O/C ratio was about 2.7 or 2.9 for methane with air or pure oxygen as the oxidant, respectively, while for Liquefied petroleum gas (LPG)–oxidant pairs the O/C maxima were lower by about 0.2 [14].
The presented thermodynamic analyses were carried out for a range of fuels indicating the predominant role of temperature in solid carbon formation. The carbon element had different allotropic forms in the gas and solid phases and, therefore, the electrochemical data for both purified single-walled and multi-walled CNTs were critical in predicting the conditions of carbon deposition.
The key objective of the paper is to present the development of an integrated approach for understanding the mechanism of carbon deposition from catalytic C–H–O reformates. This is envisaged through a theoretical modeling presented in [12,13,14] over an extended range of operating conditions. To achieve this objective, a thermodynamic analysis on carbon deposition from C–H–O reformates will be expanded for the total pressure of 3 bar and 30 bar and compared with the previous results [12] obtained for 1 bar and 10 bar. Differences in the deposition boundaries for all solid carbon forms predicted for the catalytic partial oxidation, and dry and wet reforming of the NG and LPG will be explained based on the deposition boundaries in the ternary C–H–O diagrams for different temperatures and pressures. The results of this study will quantify the relationship between carbon formation and reforming system conditions promoting coke deposition. Such a comparative analysis of equilibrium deposition for the CPOx, and dry and wet reforming of lower hydrocarbons in NG and LPG will allow the indication of the critical temperature for the deposition at chosen process pressures and reactant compositions.
2. Results
This section presents the computational results of threshold atomic ratios of carbon, oxygen, and hydrogen, which separate regions of single-phase gas mixture concentrations from two-phase regions containing solid carbon deposits under thermodynamic equilibrium. The results are presented in C–H–O ternary diagrams as the isothermal threshold lines for the temperature range from 200 to 1000 °C and two process pressures of 3 and 30 bar. The modeling is carried out separately for the deposition of graphite only and when deposition of carbon nanotubes is also allowed. In addition, the diagrams are supplied with chord lines drawn between points representing compositions of two fuels and three oxidants that represent different compositions of reformates. Jointly with the results of our former study [12] of ternary diagrams for 1 and 10 bar, those diagrams are used for the interpretation and discussion of the critical O/C values for the fuel-oxidant pairs in the full temperature and pressure ranges.
2.1. Ternary Diagrams for 3 and 30 Bar
Additional modeling, explained in Section 4, is carried out to construct the critical lines for the two missing ternary diagrams, for 3 and 30 bar. Like in our previous studies, only three allotropes of solid carbon result from the computations, namely graphite up to 431 °C, then multiwalled carbon nanotubes up to 577 °C, and from there to 1000 °C, only single-walled carbon nanotubes were found.
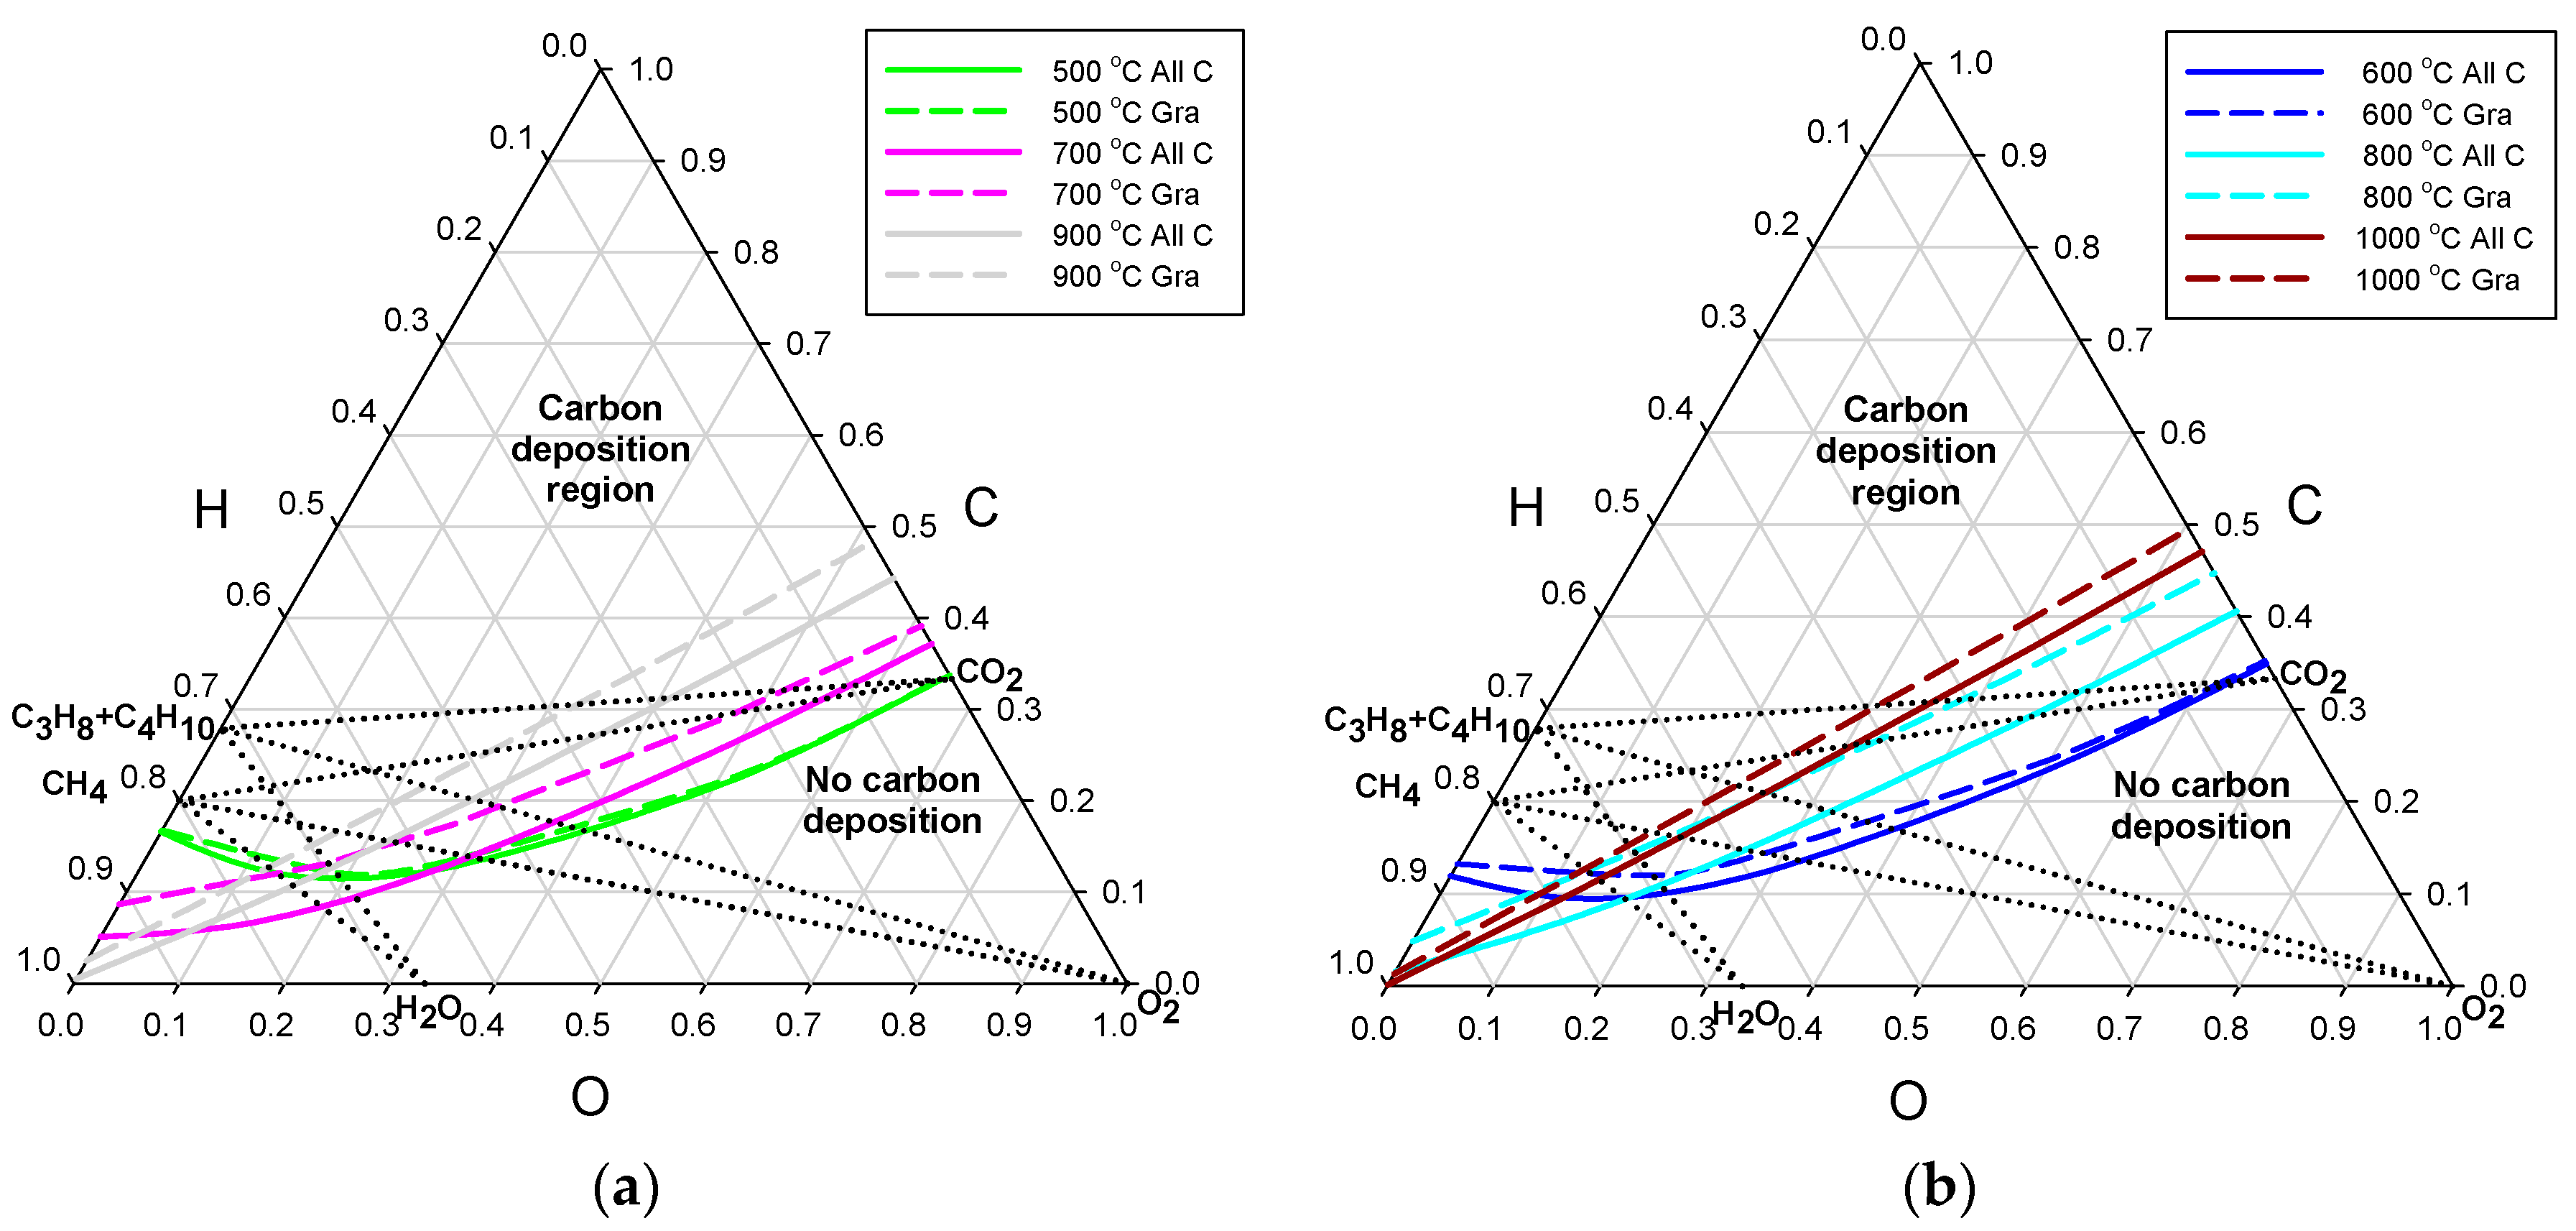
Since this study aims to explain differences in the critical O/C ratios for different fuels and oxidants, their composition points are also shown in the diagrams. It can be observed that the computed threshold lines, for temperatures from 200 °C to 1000 °C in Figure 1a,b, exhibit a similar evolution to that shown in corresponding graphs for 1 and 10 bar, published in [12]. Most pronounced differences, for the tested pressure range, are found for the highest pressure of 30 bar (Figure 1b). They are mainly in the region of fuel-oxidant mixtures of low hydrogen content, on the right side of the diagrams, where the temperature effect on the threshold lines is minimal.
Two types of fuel: natural gas (containing about 94% of CH4) or liquefied petroleum gas (containing mainly C3H8 and C4H10) are used in this study. Depending on the type of the reforming process, a fuel reacts with one of three types of oxidant; oxygen, O2, from air, water steam, H2O, or carbon dioxide, CO2. The composition of a given mixture of the fuel–oxidant pair is represented in ternary diagrams by points located along the straight line connecting the fuel point at the left triangle edge with the oxidant point located on the opposite side. A crossing point of the fuel-oxidant line with the relevant threshold line determines the critical composition of the mixture in terms of the C, H, and O atomic ratios. Raising the C content in the mixture from the crossing point means entering the carbon deposition region. The location of the fuel-oxidant lines relative to the relevant deposition threshold line strongly influences the course of the critical O/C curves versus temperature.
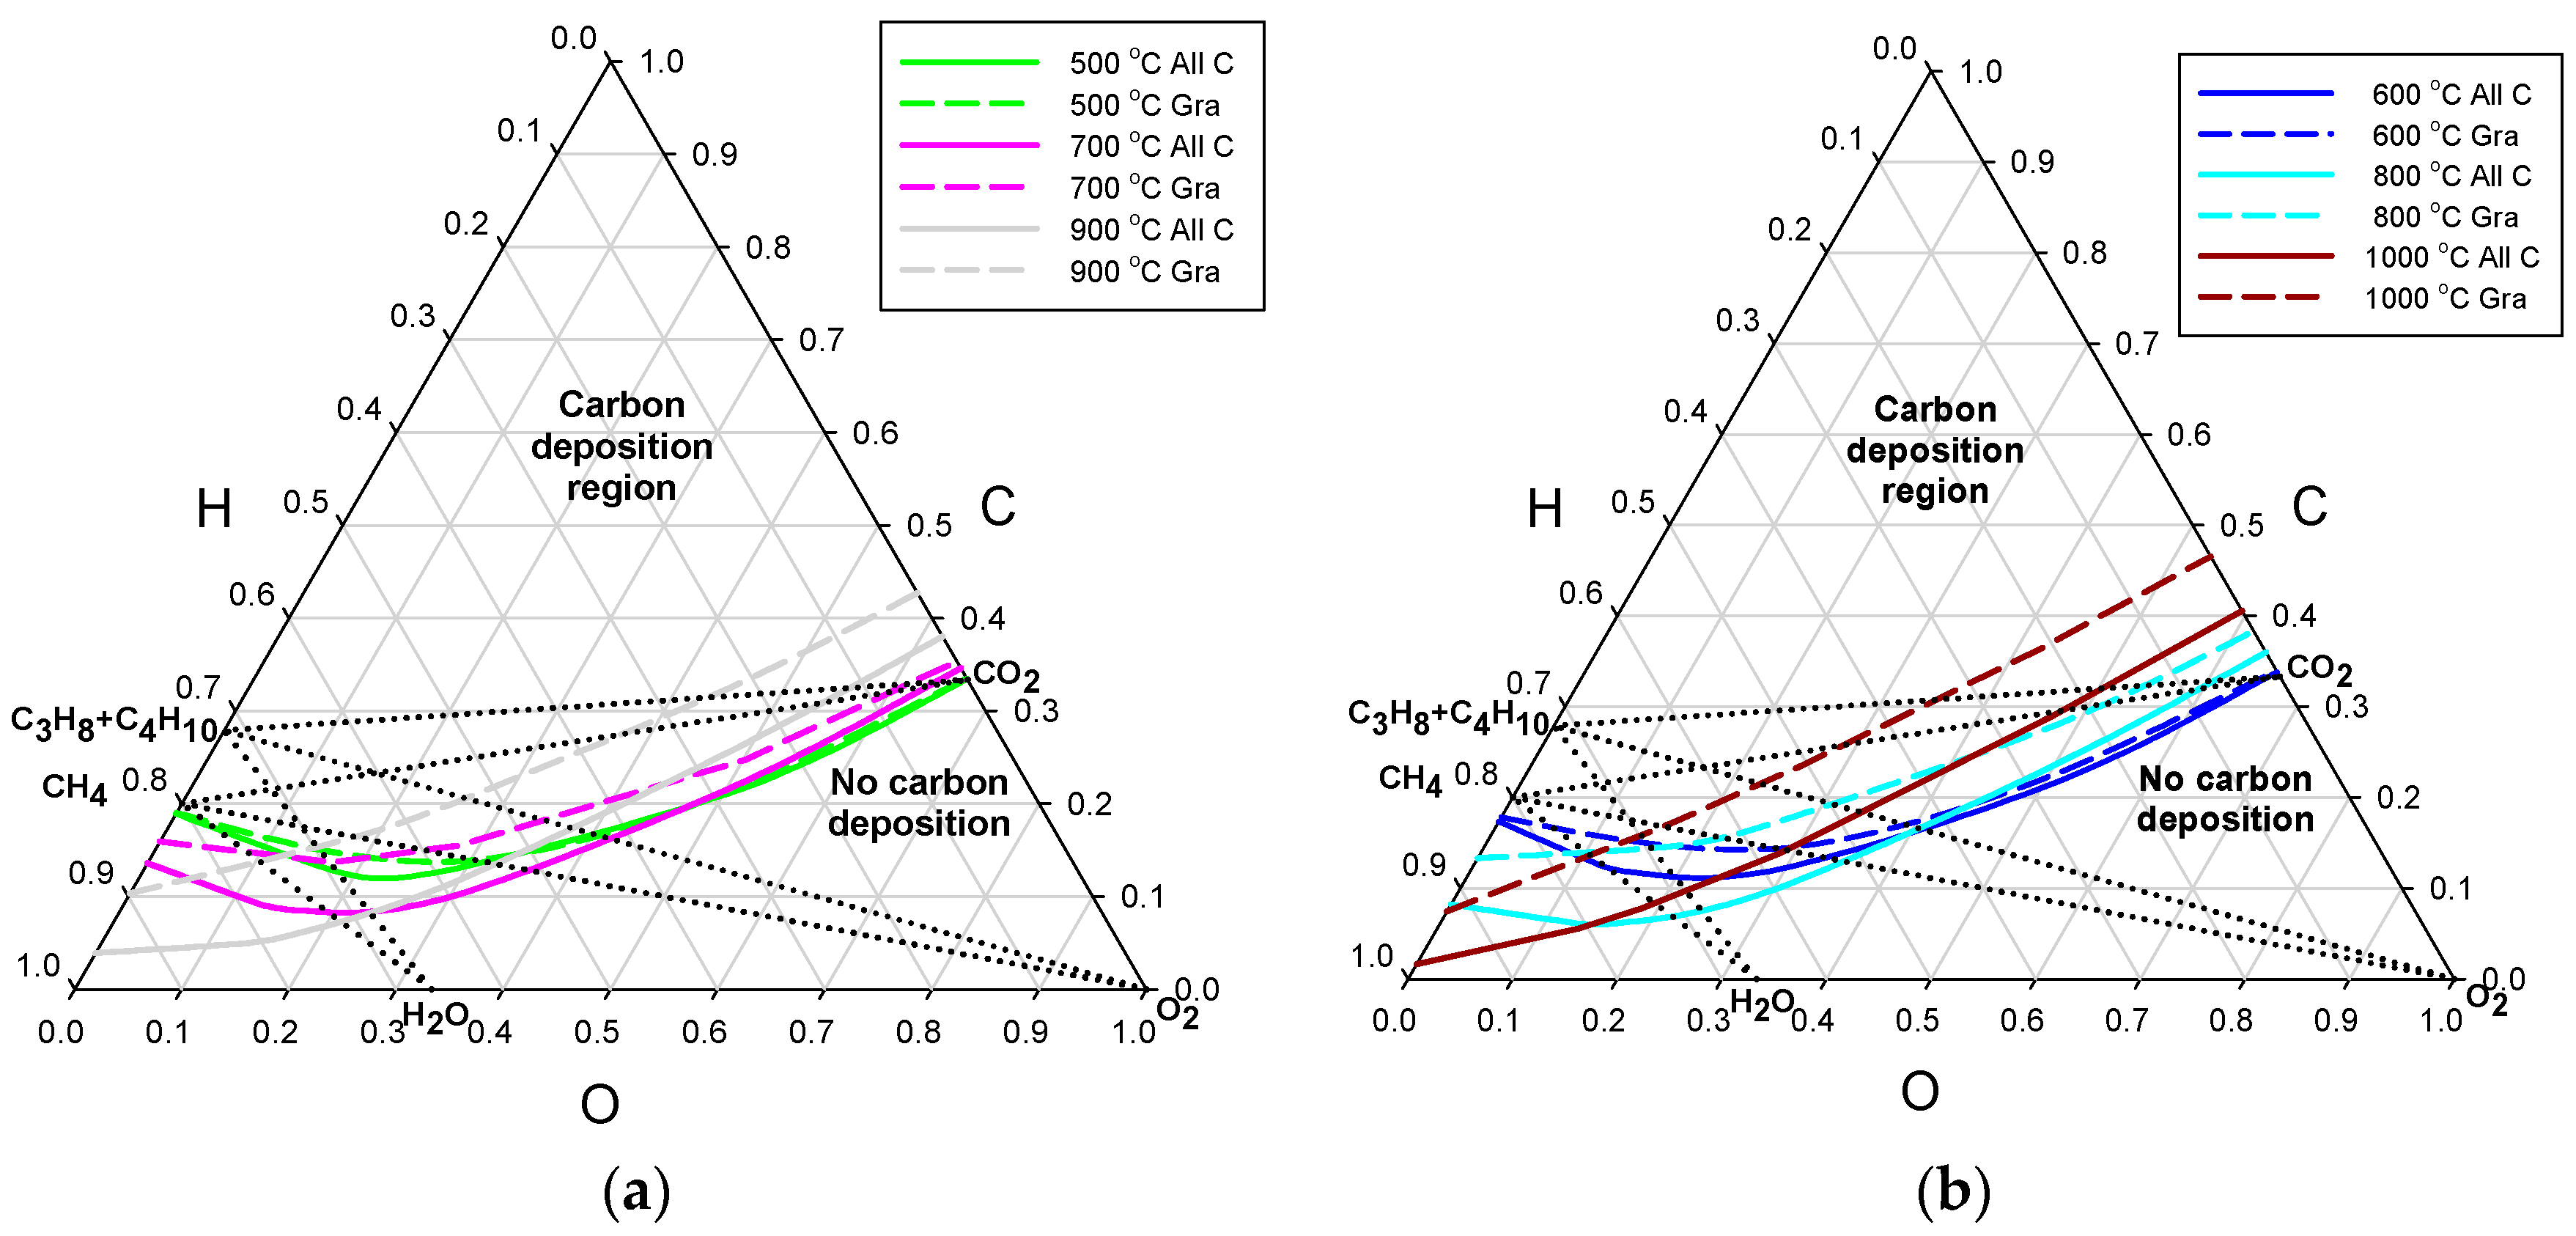
In almost all published results of computation of carbon deposition, graphite was the only solid carbon allotrope predicted [12]. It is, therefore, informative to compare the threshold lines for either graphite only, or all possible carbon allotropes independent of temperature. The effect of allowing for the filamentous forms of carbon deposits is represented in Figure 2a,b for the process pressure of 3 bar and in Figure 3a,b for 30 bar. The threshold lines are shown in pairs of constant temperature, with the solid lines representing all carbon forms and the broken lines ascribed to graphite. Starting from the temperature of 500 °C, only three pairs of temperature lines with 200 °C increments are shown in each diagram, for the sake of clear presentation.
It follows from Figure 2 and Figure 3 that the maximum effect of the presence of filamentous carbon, as an alternative to solely graphite in the equilibrated deposits, was computed for 800 °C or 1000 °C for the pressure of 3 or 30 bar, respectively. For the purpose of highlighting that effect, the threshold lines for the applied pressure levels are shown in Figure 4a,b, separately for the two temperatures.
A direct conclusion that follows from the examination of the two diagrams is that rising of the reforming pressure for those temperatures mostly results in lowering the critical carbon atomic ratio of the reformed mixture. However, the opposite effect can be noticed for reformed mixtures of a high hydrogen atomic ratio, for about H > 0.66. Therefore, the effect of temperature on the critical values of the carbon, C, and oxygen, O, is not monotonic for the wet reformates. The pressure effects are smaller for the lower limit of the studied temperature, i.e., below 500 °C, where the most stable form of carbon is graphite.
In the following two sections, the detailed explanation is presented for the published [13,14] different courses of the critical O/C ratio for the analyzed fuel-oxidant mixtures. This is considered separately for the natural gas and liquefied petroleum gas. Different shapes of the published threshold O/C curves can be justified by comparing the crossing points of the critical temperature lines in the ternary diagram with a chord relevant to the fuel–oxidant pair. For instance, the chord line for C3H8 + C4H10(LPG) – CO2 runs across the diagram almost horizontally, which means the critical carbon ratio, C, is then roughly constant. However, the critical oxygen atomic ratio, O, increases with increasing temperature. In that case of the dry LPG reforming, the critical O/C ratio lowers with rising temperature. On the contrary, the chord lines for wet reformates run in the diagrams from the two fuel points (CH4 or LPG) to “H2O”, through high atomic ratios of hydrogen, H, and are almost parallel to the threshold lines of low temperature range from 200 to 400 °C.
2.2. Natural Gas Reformates
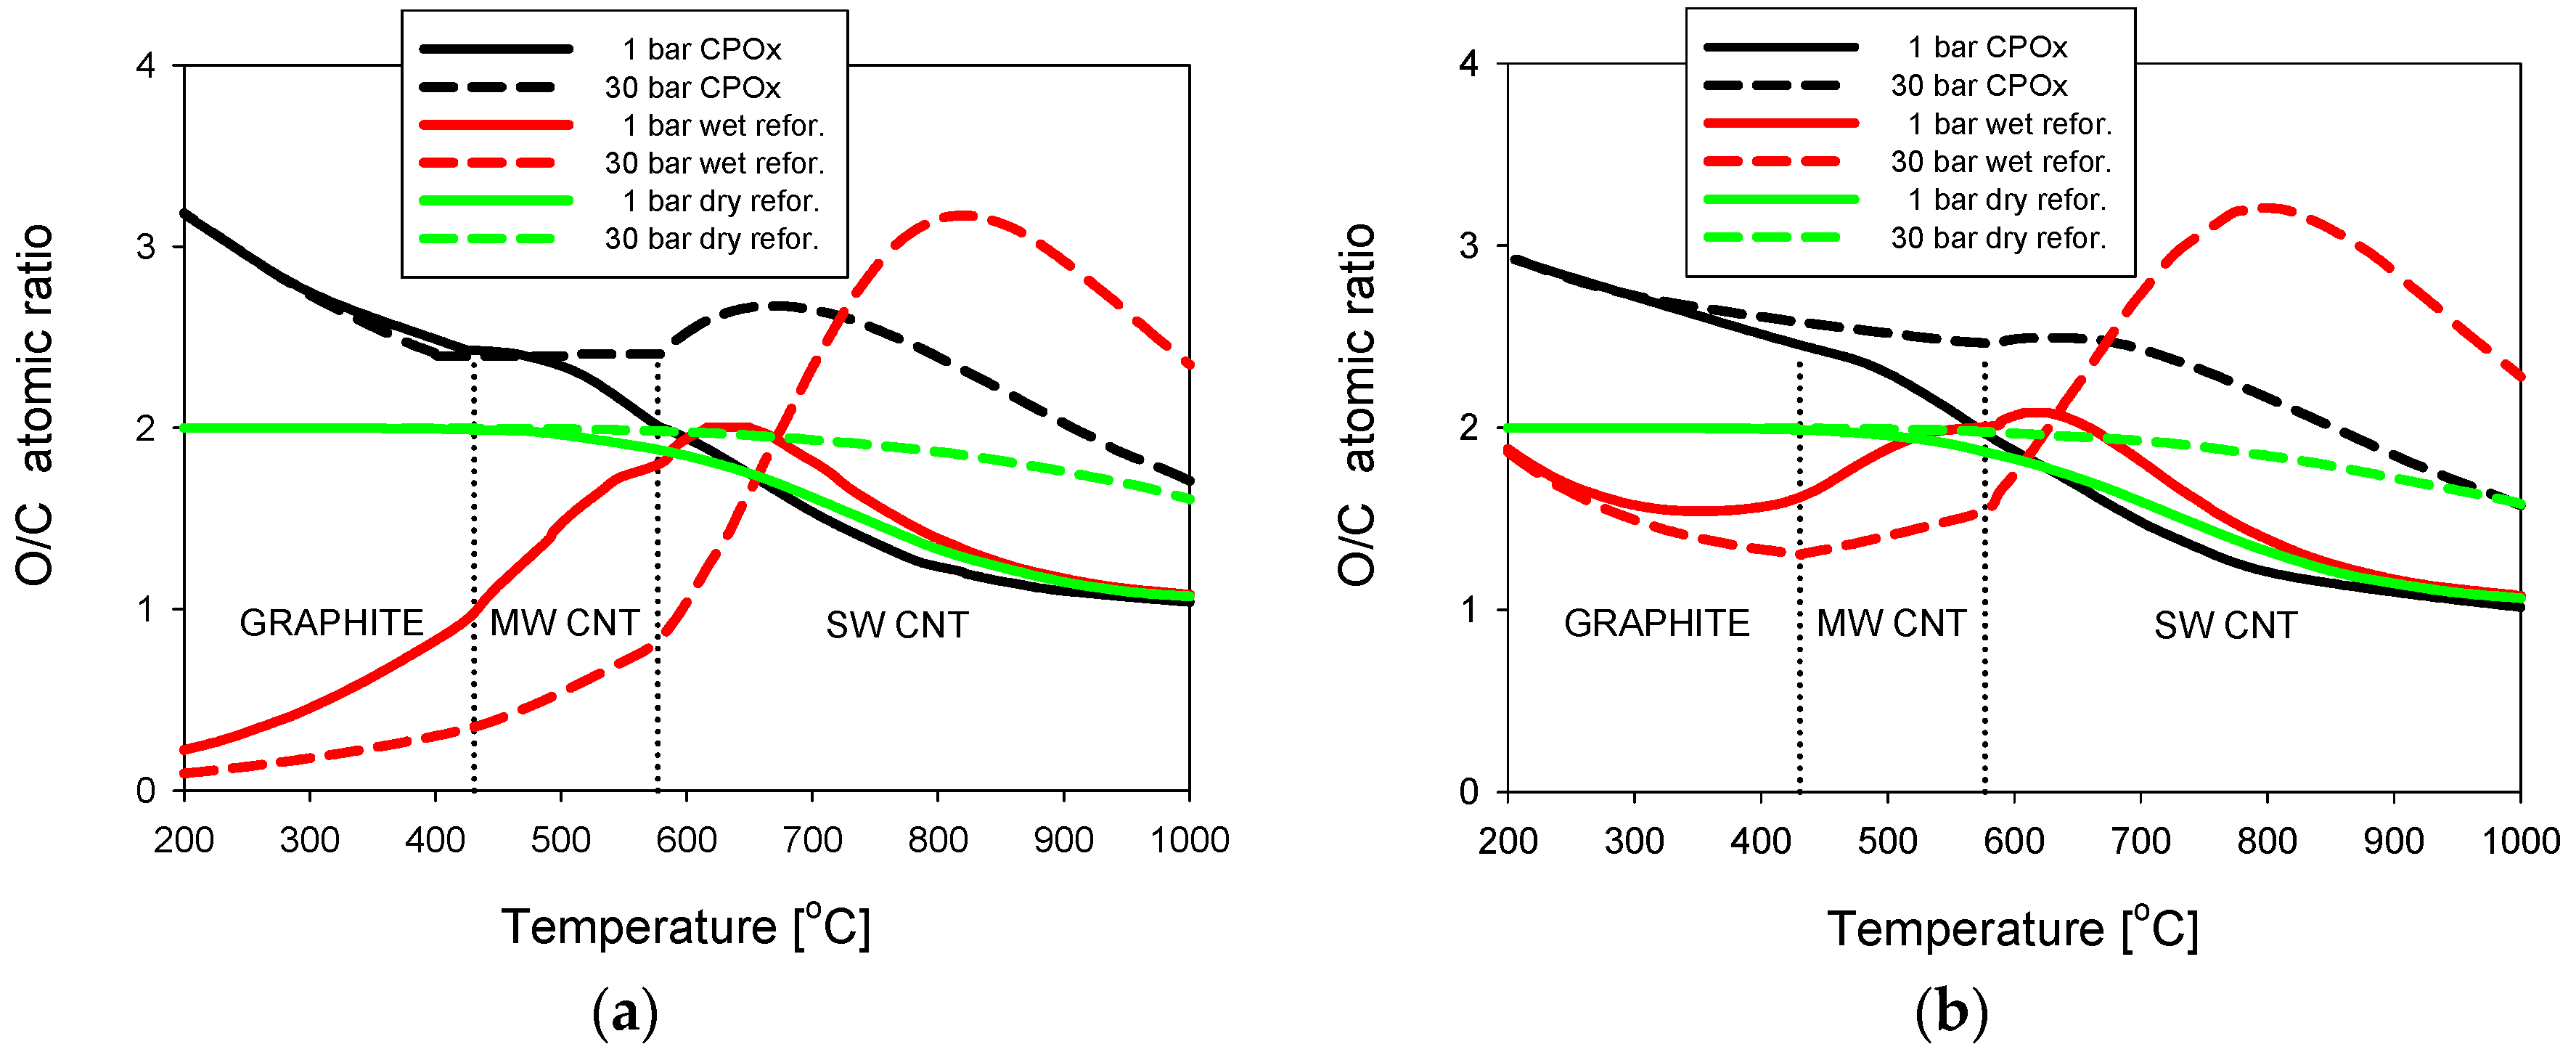
A cumulative graph is presented in Figure 5a for three reformates of natural gas (NG): from catalytic partial oxidation [13], water steam reforming, and carbon dioxide [14]. Computed data for two border levels of the process pressure, either 1 bar (solid lines) or 30 bar (broken lines), are chosen for comparison.
In the range of graphite deposition, pressure has almost no effect on the threshold O/C values for the CPOx or dry reforming of natural gas, as shown in Figure 5a. This is a consequence of only small differences in the critical line locations in the ternary diagrams for temperatures below 500 °C and the hydrogen atomic ratio H < 0.6, irrespective of the process pressure. This conclusion is valid for low-hydrogen reformates and the results from a comparison of such lines in Figure 1b for P = 30 bar with their counterparts in Figure 1a for P = 3 bar, and also in Figure 4b of [12] for P = 1 bar. In addition, the threshold O/C ratio is a constant of about 2.0 for dry reformates in that temperature range. For higher temperatures than about 500 °C, the critical O/C ratio increases with growing pressure of the two reforming processes at thermodynamic equilibrium.
Different flows of the threshold curves for changing pressure at the NG wet reforming (diagram chords from “CH4” to “H2O” that lie in the range of H > 0.66), results in a considerable influence of pressure. In the temperature range below 700 °C, the critical O/C values are smaller with the increasing pressure. However, above 700 °C there is a similar trend to the other reforming types, i.e., the critical O/C values grow with rising pressure. At the pressure of 1 bar, all tree O/C lines approach a constant value of O/C = 1 when the process temperature approaches 1000 °C.
2.3. Liquified Petroleum Gas Reformates
A similar collective graph of equilibrium conditions for three reformates of liquefied petroleum gas (LPG) is presented in Figure 5b. A considerable similarity in the shape of the O/C threshold lines to those of NG reformates (Figure 5a) can be noticed for the CPOx and dry reforming types.
However, the critical lines for the wet reforming of LPG have different shapes than those of NG for the deposition regions of graphite and multi-walled carbon nanotubes, i.e., for temperatures lower than 577 °C. They start at 200 °C from about O/C = 1.9 then decrease to a minimum at roughly 400 °C, and start growing with increasing temperature in the area of MWCNT deposition and the beginning of the SWCNT. In the region of SWCNT deposition from LPG wet reformates, the O/C curves show maxima dependent on the process pressure with a close similarity to their equivalents for NG wet reformates.
3. Discussion
In the modeling of carbon deposition, the same computing methodology as that published in former papers [12,13,14] is applied to predict conditions of the thermodynamic equilibrium of reformates. Unchanged chemical potential data from the literature are also applied for considered forms of solid carbon allotropes. The C–H–O ternary diagrams for two previous levels of process pressure, 1 and 10 bar [12], are now extended to 3 and 30 bar. It follows from the comparative analysis of those diagrams that the flow of the threshold lines, between the deposition and deposition-free regions, continues the trends found earlier [12], both for the process temperature and pressure. In particular, the ranges of deposition temperature for three carbon allotropes; graphite, and multi-walled and single-walled nanotubes, were independent of pressure. The maximum differences between the threshold lines are found at higher temperatures than formerly in [12], i.e., about 800 °C and 1000 °C for the pressure of 3 and 30 bar, respectively.
The ternary diagrams are now also equipped with chord lines indicating the compositions of possible fuel-oxidant mixtures. The crossing points of the chord and threshold lines correspond to relevant points of the O/C critical lines for a given fuel-oxidant pair. The points are used in the interpretation and explanation for the critical lines in the function of temperature and pressure in our former results [13,14].
Six types of reformed mixtures of fuel-oxidant are considered using two fuels (NG or LPG) and three oxidants: air in CPOx reforming [13] and water (wet reforming) or carbon dioxide (dry reforming) in [14]. The non-monotonic influence of both process temperature and pressure on the computed critical O/C lines is easily explained by referencing to the distribution of the relevant threshold and chord lines in the ternary diagram. Detail explication of the specific O/C functions of temperature and pressure are presented in Section 2.2 and Section 2.3. It is explained in reference to appropriate—for the analyzed fuel-oxidant mixtures—threshold and chord lines in ternary diagrams.
4. Materials and Methods
4.1. Basic Reactions and Energy Effects
The reforming reactions depend on the type of fuel and on the reforming reactant. They are usually carried out in the gas phase to obtain hydrogen, H2, and carbon monoxide, CO. This study concerns lower, i.e., C1 to C4, saturated hydrocarbons, which are the most popular and still low-cost fossil fuels. Those fuels can be reformed in reactions with an oxygen-carrying reactant, such as water steam (H2O), carbon dioxide (CO2), or oxygen (O2). Basic reactions, (a) to (c), of the hydrocarbon fuels with the reforming reactants are presented in the summary forms in Table 1. The number of carbon atoms in the fuel molecules is equal to “n”. The reaction equations are followed by associated standard values of the reaction enthalpy, , and chemical potential, , at the temperature of 298 K. The data were obtained from the recognized database [15]. The wet and dry reforming reactions, respectively (a) and (b), are highly endothermal, whereas the partial oxidation reaction (c) is exothermal.
Substrates and products of the basic reactions can further react to form also vapors of carbon, C(g), as shown in reactions (d) to (g). The thermodynamic effects of the deposition of m atoms of carbon vapors to form solid graphite, Cg(s), are also included in Table 1.
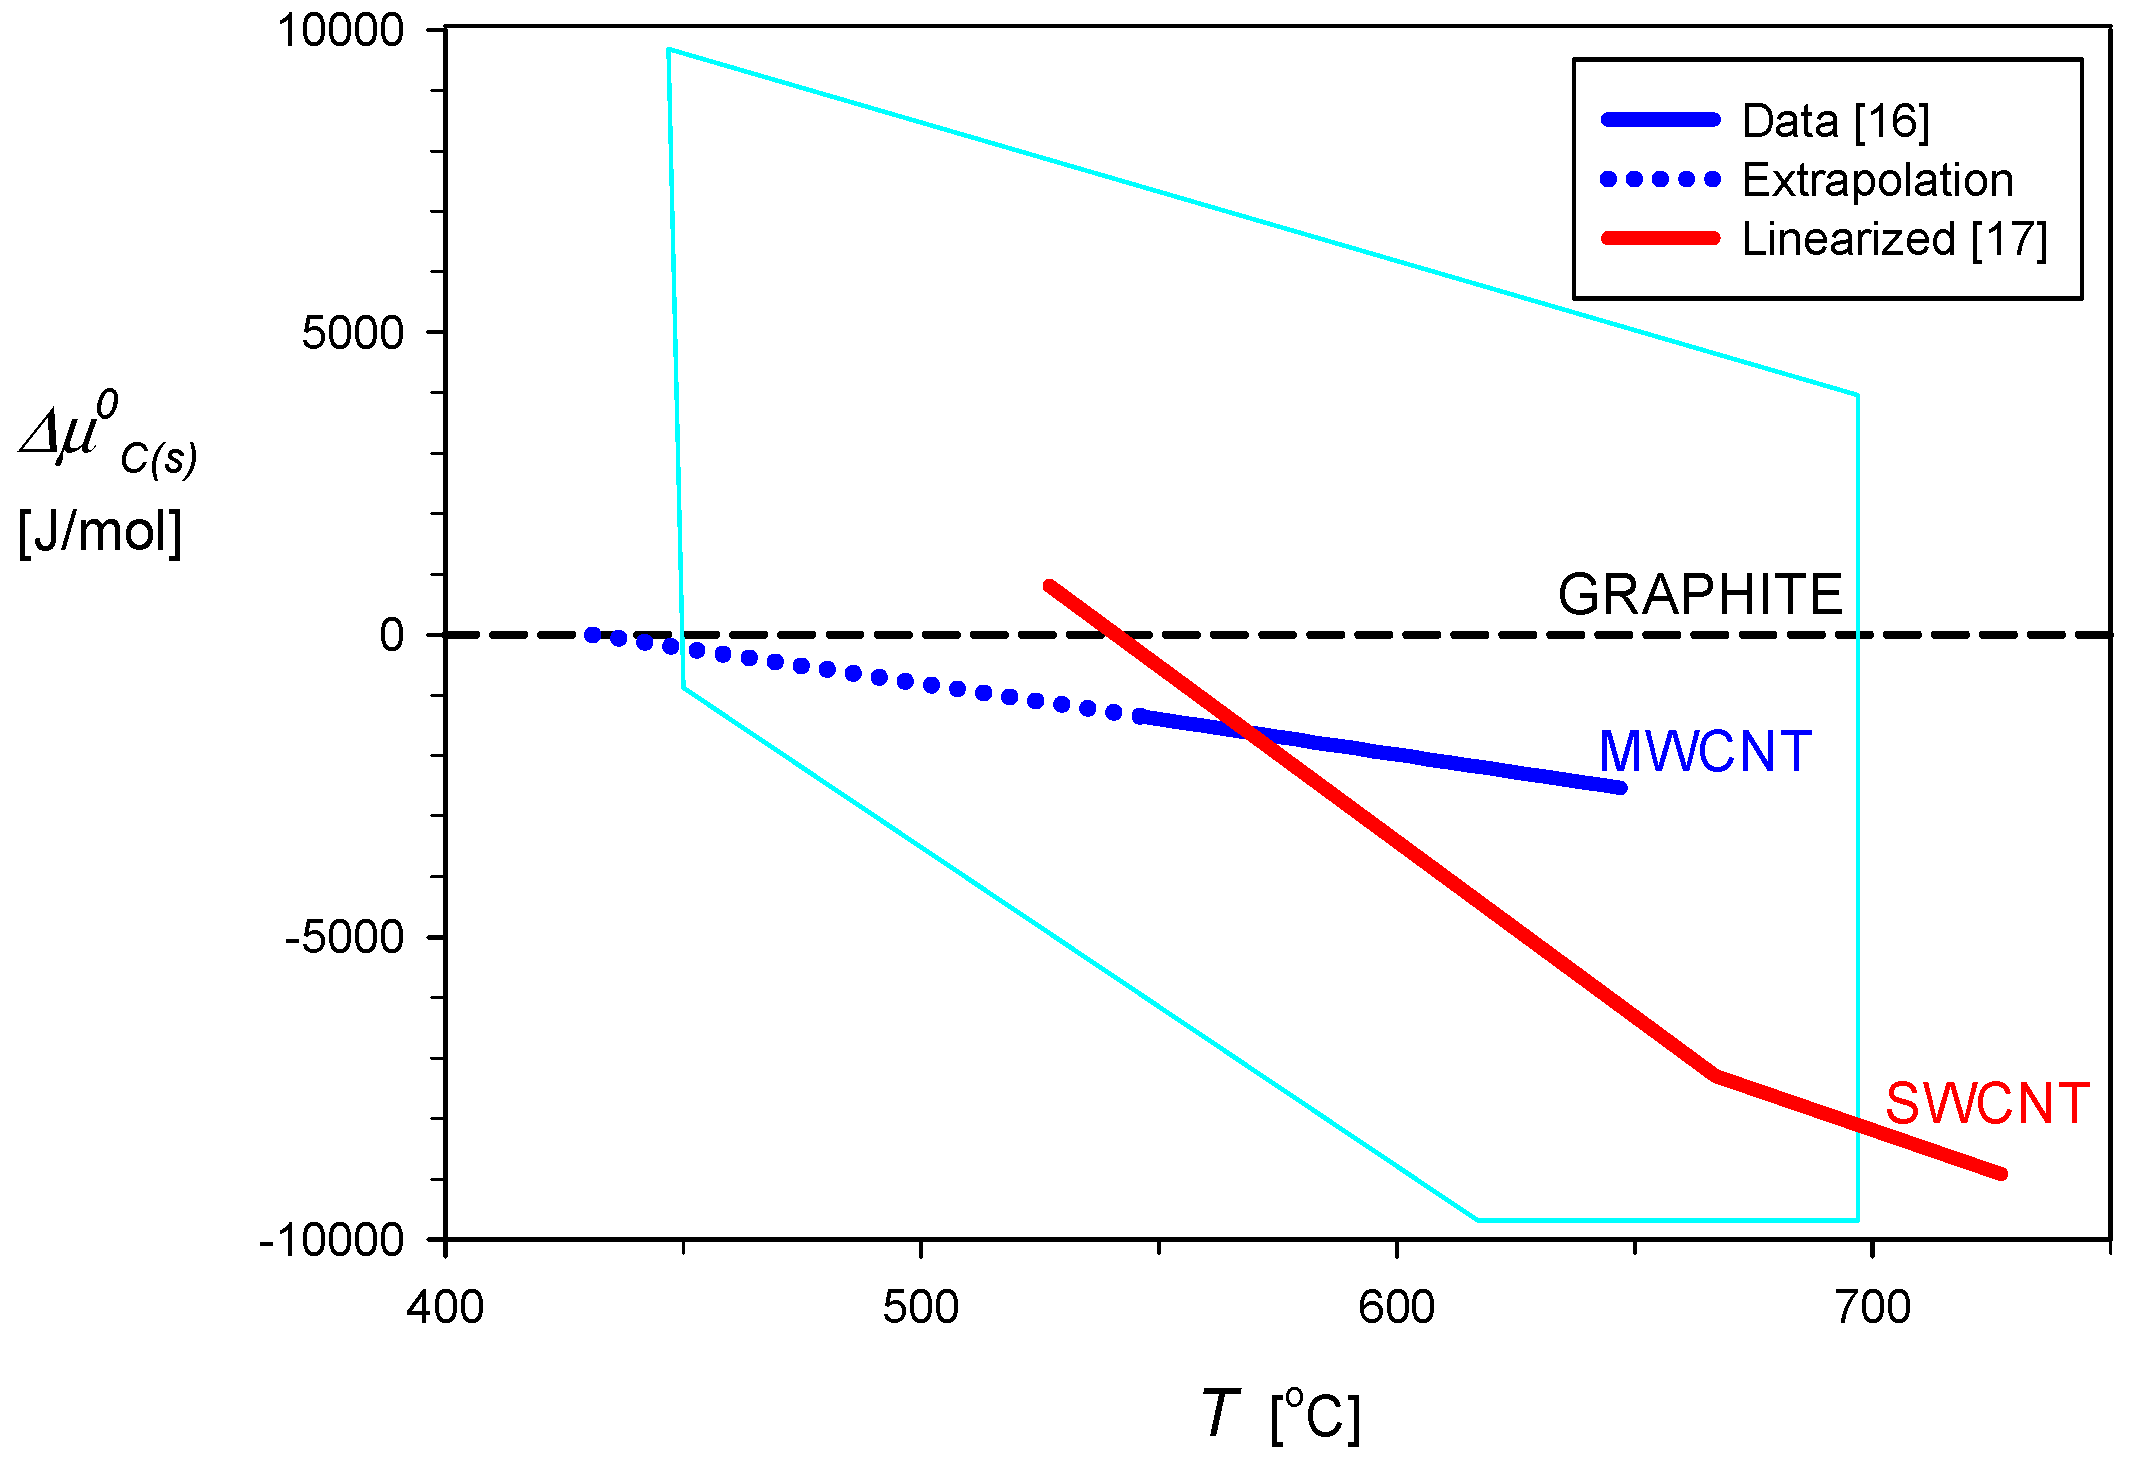
Reliable thermodynamic data for carbon nanotubes at the reference temperature of 298 K cannot be found in the subject literature. However, several values of the chemical potential of the carbonaceous deposits can be computed from compositions of the reacting fuel–oxidant mixtures at the coking threshold. This was already reviewed in our previous study [12] with the conclusion that the wide scatter of the chemical potential estimates resulted most probably from deriving them for different mixtures of the crystallographic forms of the carbonic deposits in relevant experiments. The pentagon shown by the blue lines in Figure 6 shows the range of estimates of the standard chemical potential of filamentous carbon deposits, as determined from the coking threshold compositions in several reforming reactions. The estimates are presented as their difference, , from the standard chemical potential of graphite, , which is assumed to be 0 for any temperature, according to the convention applied in physical chemistry.
Chemical potential data for the carbon nanotubes, CNT, should be obtained for their purified forms, either multi-walled, MWCNT, or single-walled in bundles, SWCNT. Such data for elevated temperatures is available from electrochemical measurements published by Gozzi et al. [16,17]. For measurements with the multi-walled CNT and in temperature ranging from 820 K to 920 K, the authors [16] obtained the following relationship:
This relationship is graphically shown in Figure 6 by the dark blue solid line, which is also extrapolated to , to represent its chemical potential equal to that of graphite, which occurs at about 431 °C. Results of similar measurements carried out for bundled single-walled carbon nanotubes [17], in the temperature range from 750 K to 1015 K, were presented in the form of the 9th degree polynomial:
A piecewise approximation of that function is presented in Figure 6 by the red line. The common point of Equations (1) and (2) occurs at a temperature of about 577 °C. Such temperature functions of the chemical potentials of the MWCNT and SWCNT were used in calculations of the equilibrium concentrations of the gas and solid phases with the HSC software [18]. The calculations were based on the principles of the thermodynamic equilibrium, which are briefly described in the following section.
4.2. Thermodynamic Equilibrium
The basic postulate of chemical statics, for the thermodynamic equilibrium (*) to occur [19], is the reaction system reaches then a minimum of its total Gibbs energy, G (J):
The chemical potential of a species “j”, μj (J/mol), is the partial molar Gibbs energy of the system for constant temperature and pressure:
In a homogeneous mixture of many species, the chemical potential can be expressed as the sum of its standard value (for pure species “j”), , and a contribution of the ratio of the species activity in the mixture, aj, to its value in the standard state, :
When dealing with gas phase mixtures, the species activity is usually expressed as a product of the species partial pressure, Pj, and the fugacity coefficient, φj:
The fugacity coefficient practically equals 1.0 [19] when the species partial pressure, Pj, is significantly lower than its critical pressure and also the process temperature is much higher than the species critical temperature.
In the state of thermodynamic equilibrium, denoted by “*”, the species chemical potential should be constant in all phases containing the species: solid (s), liquid (l), and gas (g):
Consequently, in the case of chemical reactions between species in a given phase, the postulate of Equation (3) leads to Equation (8), which is valid for constant temperature and pressure:
The stoichiometric coefficients, νj,i, of the j-th reactant, that participates in the i-th reaction, are negative for substrates and positive for products.
The standard enthalpy and chemical potential of a chemical reaction “i” are calculated in a similar way, accounting for contributions from substrates and products:
Their values for relevant reactions are quoted in Table 1.
The conditional minimum of the total Gibbs energy, expressed in Equation (3), can be computed in several ways [20]. This leads to the determination of the composition of each phase at the thermodynamic equilibrium for the prescribed initial mole number of substrates and the final phase species, temperature, and pressure. Those computations can be carried out with the help of a commercial package, such as HSC [18], which was used in this study.
4.3. Modeling Procedure and Scope
The modeling of equilibrium conditions of C–H–O mixtures was specifically directed to detect the beginning of the formation of solid carbon. Two types of such computations were applied in our former studies [12,13,14] and they were based on the principles presented in the previous section. Details of the computing procedure were also described there and the interested reader is referred to those open access papers. The relationship (Equation (1)) for MWCNT was directly applied to widen the HSC databank. However, the function of temperature, Equation (2), was piecewise linearly approximated for and then introduced to the HSC software database. The approximation lines are presented in Figure 6, with the extrapolation of Equation (1) to the level of shown by the broken line. The border temperatures of 431 and 577 °C were found independent of the process pressure in the equilibrium calculations. They correspond to the crossing points of the pairs of lines in Figure 6: graphite–MWCNT and MWCNT–SWCNT. The depositing type of carbon is characterized in the thermodynamic equilibrium by the lowest value of its standard chemical potential.
Our former paper [12] reported details on the critical C, O, and H atomic fractions around which a step change from none to a detectable amount of solid carbon occurs. This allowed for determining critical lines, which divide in ternary C–H–O diagrams the carbon deposition area from the deposition-free area. However, only two levels of the total pressure, i.e., 1 bar and 10 bar, of the equilibrated mixture of carbon-, hydrogen-, and oxygen-containing compounds were applied in [12]. This present study is aimed at a comparison and discussion of the critical deposition lines presented for the CPOx reforming in [13] and for the wet and dry reforming in [14]. Those two papers discussed the critical O/C atomic ratios against temperature for two types of hydrocarbon fuels, NG and LPG, and three types of oxygen-containing reforming oxidants; O2 from air, H2O, and CO2. Four levels of constant pressure: 1, 3, 10, and 30 bar, were used in [13,14], while only two of them, i.e., 1 and 10 bar, were applied in [12] Therefore, the former computational results are supplemented in this study by new data for C–H–O ternary diagrams for the pressure of 3 and 30 bar, as presented in Section 2.
Author Contributions
Z.J. and P.P.-O. designed the study; Z.J. designed and performed the computations, Z.J. analyzed a majority of the data; P.P.-O. contributed to analyses of the data and wrote the main part of the Introduction; and Z.J. wrote the rest of the paper.
Funding
This research was funded by [European Union’s Seventh Framework Programme] grant number [FP7/2007–2013], [Fuel Cells and Hydrogen Joint Undertaking (FCH JU)] grant number [621213] and [Polish research funds] grant number [3126/7.PR/2014/2].
Acknowledgments
The research program leading to these results received funding from the European Union’s Seventh Framework Programme (FP7/2007–2013) for the Fuel Cells and Hydrogen Joint Undertaking (FCH JU) under grant agreement no. 621213 with the STAGE-SOFC acronym. Information contained in the paper reflects only the view of the authors. The FCH JU and the Union are not liable for any use that may be made of the information contained therein. The work was also financed from the Polish research funds awarded for project no. 3126/7.PR/2014/2 of international cooperation within STAGE-SOFC in the years 2014–2017. The authors received funds from FCH JU for covering the costs to publish in open access.
Conflicts of Interest
The authors declare no conflict of interest.
References
- Xie, H.; Yu, Q.; Zhang, Y.; Zhang, J.; Liu, J.; Qin, Q. New process for hydrogen production from raw coke oven gas via sorption-enhanced steam reforming, Thermodynamic analysis. Int. J. Hydrogen Energy 2017, 42, 2914–2923. [Google Scholar] [CrossRef]
- Purima, P.; Jayanti, S. A high-efficiency auto-thermal system for on-board hydrogen production for low temperature PEM fuel cells using dual reforming of ethanol. Int. J. Hydrogen Energy 2016, 41, 13800–13810. [Google Scholar] [CrossRef]
- Sumrunronnasak, S.; Tantayanon, S.; Kiatgamolchai, S.; Sukonket, T. Improved hydrogen production from dry reforming reaction using a catalytic packed-bed membrane reactor with Ni-based catalyst and dense PdAgCu alloy memberane. Int. J. Hydrogen Energy 2016, 41, 2621–2630. [Google Scholar] [CrossRef]
- Araiza, D.G.; Gomez-Cortes, A.; Diaz, G. Partial oxidation of methanol over copper supported on nanoshaped ceria for hydrogen production. Catal. Today 2017, 282, 185–194. [Google Scholar] [CrossRef]
- Energy USD-EEAR. Hydrogen, Fuel Cells & Infrastructure Technologies Program. 2005. Available online: http://www1.eere.energy.gov/hydrogenandfuelcells/mypp/ (accessed on 26 March 2018).
- Adiya, Z.I.S.G.; Dupont, V.; Mahmud, T. Steam reforming of shale gas in a packed bed reactor with and without chemical looping using nickel based oxygen carrier. Int. J. Hydrogen Energy 2018, 43, 6904–6917. [Google Scholar] [CrossRef]
- Tuna, C.E.; Silveira, J.L.; da Silva, M.E.; Boloy, R.M.; Braga, L.B.; Perez, N.P. Biogas steam reformer for hydrogen production: Evaluation of the reformer prototype and catalysts. Int. J. Hydrogen Energy 2018, 43, 2108–2120. [Google Scholar] [CrossRef]
- Alves, H.J.; Junior, C.B.; Niklevicz, R.R.; Frigo, E.P.; Frigo, M.S.; Cimbra-Araujo, C.H. Overview of hydrogen production technologies from biogas and the applications in fuel cells. Int. J. Hydrogen Energy 2013, 38, 5212–5225. [Google Scholar] [CrossRef]
- Loffler, D.G.; Taylor, K.; Mason, D. A light hydrocarbon fuel processor producing high purity hydrogen. J. Power Sources 2003, 117, 84–91. [Google Scholar] [CrossRef]
- Rostrup-Nielson, J.R. Catalytic Steam Reforming. Catalysis—Science and Technology; Anderson, J.R., Boudart, M., Eds.; Springer: Berlin/Heidelberg, Germany, 1984; Volume 5, ISBN 978-3-642-93247-2. [Google Scholar]
- Ginsburg, J.M.; Pina, J.; Solh, T.E.I.; Lasa, H.I. Coke formation over a nickel catalyst under methane dry reforming conditions: Thermodynamic and kinetic models. Ind. Eng. Chem. Res. 2005, 44, 4846–4854. [Google Scholar] [CrossRef]
- Jaworski, Z.; Zakrzewska, B.; Pianko-Oprych, P. On thermodynamic equilibrium of carbon deposition from gaseous C-H-O mixtures: Updating for nanotubes. Rev. Chem. Eng. 2017, 33, 217–235. [Google Scholar] [CrossRef]
- Jaworski, Z.; Pianko-Oprych, P. On the deposition equilibrium of carbon nanotubes or graphite in the reforming processes of lower hydrocarbon fuels. Entropy 2017, 19, 650. [Google Scholar] [CrossRef]
- Jaworski, Z.; Pianko-Oprych, P. On nanotube carbon deposition at equilibrium in catalytic partial oxidation of selected hydrocarbon fuels. Int. J. Hydrogen Energy 2017, 42, 16920–16931. [Google Scholar] [CrossRef]
- Yaws, C.L. Yaws’ Critical Property Data for Chemical Engineers and Chemists. 2012. Available online: http://app.knovel.com/hotlink/toc/id:kpYCPDCECD/yaws-critical-property (accessed on 4 January 2017).
- Gozzi, D.; Iervolino, M.; Latini, A. The thermodynamics of the transformation of graphite to multiwalled carbon nanotubes. J. Am. Chem. Soc. 2007, 129, 10269–10275. [Google Scholar] [CrossRef] [PubMed]
- Gozzi, D.; Latini, A.; Lazzarini, L. Experimental thermodynamics of high temperature transformations in single-walled carbon nanotube bundles. J. Am. Chem. Soc. 2009, 131, 12474–12482. [Google Scholar] [CrossRef] [PubMed]
- Outotec’s HSC Chemistry v.8.0 Software; Outotec (Finland) Oy, Research Center Pori: Pori, Finland, 2014.
- Smith, J.M.; Van Ness, H.C.; Abbott, M.M. Introduction to Chemical Engineering Thermodynamics, 7th ed.; McGraw Hill Higher Education: New York, NY, USA, 2004; ISBN 0-07-310445-0. [Google Scholar]
- Castillo, J.; Grossmann, I.E. Computation of phase and chemical equilibria. Comput. Chem. Eng. 1981, 5, 99–108. [Google Scholar] [CrossRef]
Figure 1.
Ternary C–H–O diagrams for: (a) pressure of 3 bar; and (b) pressure of 30 bar.

Figure 2.
Deposition threshold lines for the process pressure of 3 bar, separately for graphite only—broken lines, and all carbon allotropes—solid lines: (a) temperatures of 500, 700, and 900 °C; and (b) temperatures of 600, 800, and 1000 °C.
Figure 2.
Deposition threshold lines for the process pressure of 3 bar, separately for graphite only—broken lines, and all carbon allotropes—solid lines: (a) temperatures of 500, 700, and 900 °C; and (b) temperatures of 600, 800, and 1000 °C.

Figure 3.
Deposition threshold lines for the process pressure of 30 bar, separately for graphite only (Gra)—broken lines, and all carbon allotropes (All C)—solid lines: (a) temperatures of 500, 700, and 900 °C; and (b) temperatures of 600, 800, and 1000 °C.
Figure 3.
Deposition threshold lines for the process pressure of 30 bar, separately for graphite only (Gra)—broken lines, and all carbon allotropes (All C)—solid lines: (a) temperatures of 500, 700, and 900 °C; and (b) temperatures of 600, 800, and 1000 °C.

Figure 4.
Deposition threshold lines for the border process pressures of 1 and 30 bar: (a) temperature of 800 °C; and (b) temperature of 1000 °C.
Figure 4.
Deposition threshold lines for the border process pressures of 1 and 30 bar: (a) temperature of 800 °C; and (b) temperature of 1000 °C.

Figure 5.
Critical O/C lines for the catalytic partial oxidation reforming (CPOx), wet and dry reformates of: (a) natural gas; and (b) liquefied petroleum gas.
Figure 5.
Critical O/C lines for the catalytic partial oxidation reforming (CPOx), wet and dry reformates of: (a) natural gas; and (b) liquefied petroleum gas.

Figure 6.
Chemical potential of the formation of carbon deposits relative to graphite. ![Energies 11 01177 i001]() represents the range of for carbon nanotubes (CNTs) [12] estimated from the compositions in the literature at the coking threshold.
represents the range of for carbon nanotubes (CNTs) [12] estimated from the compositions in the literature at the coking threshold.
 represents the range of for carbon nanotubes (CNTs) [12] estimated from the compositions in the literature at the coking threshold.
Figure 6.
Chemical potential of the formation of carbon deposits relative to graphite. ![Energies 11 01177 i001]() represents the range of for carbon nanotubes (CNTs) [12] estimated from the compositions in the literature at the coking threshold.
represents the range of for carbon nanotubes (CNTs) [12] estimated from the compositions in the literature at the coking threshold.
represents the range of for carbon nanotubes (CNTs) [12] estimated from the compositions in the literature at the coking threshold.

Table 1.
Basic reactions and their standard thermodynamic data.
| Equation | kJ mol−1 | kJ mol−1 | Reaction (i) |
|---|---|---|---|
| CnH2n+2 + nH2O(g) = nCO + (2n + 1)H2 | ≅56.4 + 148.4 n | ≅61.6 + 79.6 n | (a) |
| CnH2n+2 + nCO2 = 2nCO + (n + 1) H2 | ≅56.4 + 189.6 n | ≅61.6 + 108.2 n | (b) |
| CnH2n+2 + n/2O2 = nCO + (n + 1) H2 | ≅56.4 − 93.4 n | ≅61.6 − 149.0 n | (c) |
| CH4 = C(g) + 2H2 | 791.2 | 721.8 | (d) |
| 2CO = C(g) + CO2 | 544.2 | 551.2 | (e) |
| CO + H2 = C(g) + H2O | 585.4 | 579.8 | (f) |
| 2H2 + CO2 = C(g) + 2H2O | 626.5 | 608.5 | (g) |
| m C(g) = m Cg(g) | −716.7 m | −671.2 m | (h) |
© 2018 by the authors. Licensee MDPI, Basel, Switzerland. This article is an open access article distributed under the terms and conditions of the Creative Commons Attribution (CC BY) license (http://creativecommons.org/licenses/by/4.0/).
Share and Cite
MDPI and ACS Style
Jaworski, Z.; Pianko-Oprych, P. A Comparative Thermodynamic Study of Equilibrium Conditions for Carbon Deposition from Catalytic C–H–O Reformates. Energies 2018, 11, 1177. https://doi.org/10.3390/en11051177
AMA Style
Jaworski Z, Pianko-Oprych P. A Comparative Thermodynamic Study of Equilibrium Conditions for Carbon Deposition from Catalytic C–H–O Reformates. Energies. 2018; 11(5):1177. https://doi.org/10.3390/en11051177
Chicago/Turabian StyleJaworski, Zdzisław, and Paulina Pianko-Oprych. 2018. "A Comparative Thermodynamic Study of Equilibrium Conditions for Carbon Deposition from Catalytic C–H–O Reformates" Energies 11, no. 5: 1177. https://doi.org/10.3390/en11051177
Note that from the first issue of 2016, this journal uses article numbers instead of page numbers. See further details here.