Analysis of the Brazilian Energy Efficiency Program for Electricity Distribution Systems
by
Rogério Diogne de Souza e Silva
1,*, 
Rosana Cavalcante de Oliveira
2 and
Maria Emília de Lima Tostes
1 1
Graduate Program in Electrical Engineering, Federal University of Para, Belem 66075-110, Brazil
2
Laboratory of Artificial Intelligence and Decision Support, Institute for Systems and Computer Engineering, Technology and Science, 4200 Porto, Portugal
*
Author to whom correspondence should be addressed.
Energies 2017, 10(9), 1391; https://doi.org/10.3390/en10091391
Submission received: 12 June 2017
/
Revised: 3 September 2017
/
Accepted: 8 September 2017
/
Published: 13 September 2017
(This article belongs to the Section F: Electrical Engineering)
Abstract
:In this paper, a methodology was developed to analyze the results of energy efficiency programs used in the electricity distribution sector in Brazil. Analyzing the gains obtained through the investments made, and classifying which actions resulted in the best performance, contributed to decision making on the best allocation of investments to obtain the greatest energy savings. The Brazilian Energy Efficiency program was analyzed with a developed non-parametric model, using the data envelopment analysis method, and the categories of projects with better performance were determined. A database of the results from 1704 projects, from 2008 to 2016 in the Energy Efficiency program in Brazil´s electricity distribution sector, was used. The results obtained show that the best performance was achieved by projects in the industrial and cogeneration categories; however, in Brazil these constitute only 4.24% of the projects presented and 5.28% of the total investments in the last eight years, indicating a need to review the regulatory strategies for energy efficiency in this country.
1. Introduction
Energy efficiency is a high potential and low-cost source that can reduce total energy costs by about 20%, implementing energy efficiency measures substantially lowers costs compared to the initiation of new sources of supply and offers an excellent mechanism for the reduction of carbon emissions [1]. According to the International Energy Agency (IEA), energy efficiency not only saves energy and reduces emissions, but also has other potential benefits, such as energy security, energy prices, macroeconomic impacts, industrial productivity, public budget, and health and well-being, among others [2].
Reducing energy demand has been the main focus of energy efficiency policies in several countries. This goal can be reached through the improvement of products and process efficiency in energy consumption on both the demand and supply sides. Energy conservation goals can be attained by using measures for improving efficiency in appliances, services, and processes that consume energy in all sectors. Such measures lead to policies that focus on the demand side, for instance, by establishing patterns for buildings, requisites for efficiency in equipment, and promoting energy management in industries and other consumption units. However, it is imperative that such tools be well-projected, linked with realistic goals, and precisely monitored [2].
The use of energy efficiency initially depends on public and/or private strategies that define incentive actions as a way for market growth, to a point where this is measurable and factual and can be used for policy making, and consequently for national energy planning as if this were a primary source of energy. According to the IEA, energy efficiency measures are now recognized as energy sources. This statement is based on the fact that, in 2010, investment in energy use reduction by member countries of the IEA, relative to investments between 1974 and 2010, was greater than in any other single energy source. IEA member countries saved USD $490 per capita on average, and a total of USD $540 billion was spent on energy in 2015 as a result of energy efficiency gains since 2000, and 1.5 billion tons of CO2 (Gt CO2) in 2015, and 13 Gt CO2 since 2000, were prevented from being released into the environment [3].
Globally, the impacts of electricity distribution company programs, which mainly consist of demand-side management (DSM), are being seen on the promotion of energy efficiency. However, on initial analysis, it is illogical that a provider whose product is the commercialization of electricity would invest in the reduction of the consumption of its product. Ongoing breakthroughs in the market for electricity, such as the inclusion of competitive markets in distribution, smart grids, and distributed generation, have signaled changes in the business model of providers, including substantial effects on the measures of energy efficiency in the sector. Behrangrad [4] evaluated DSM business models in different electricity market segments of several countries and stated that business models are influenced by several factors, such as market regulation, power system characteristics, and infrastructure. He highlighted that such factors actually depend on changes, with the proliferation of infrastructure, smart grids, and distributed generation, with intermittent renewable energies and storage devices, all affecting the DSM business models.
The development of regulatory tools is necessary for the success of inserting energy efficiency strategies into the energy planning of the world’s power systems. Apajahlati et al. [5] stated that energy conservation measures contribute significantly to the reduction of climate change and energy insecurity. They evaluated the influence of the 2006/32/UE and 2012/27/UE directives, which implemented mandatory investment into energy efficiency in Europe. According to Rosenow [6], the United Kingdom was the first country in Europe to have mandatory measures for energy savings, starting in 1994. A specific method was followed in the residential sector, which was considered the sector targeted for energy savings and the reduction of pollutant gas emissions, resulting in electric power savings in the order of 90 TWh/year. Abrardi et al. [7] proposed an optimal tariff model that would lead to energy efficiency on the demand side. They indicated that the energy provider or the regulatory body must propose compatible tariff options for both parties; for instance, if the provider’s energy efficiency activities have a high impact on the reduction in demand, the consumer must pay a high demand price, but a lower price on the consumption of electricity. On the other hand, if the provider does not carry out measures for energy efficiency or if these have a low impact, the price of the demand tariff will be lower and the price of electricity consumption will be higher. Thollander and Palm [8] developed an energy efficiency decision support system for industrial energy management, considering the fact that the most commonly used model for energy management systems, the model for consumption–product, is insufficient for the understanding of management practices in industrial energy. They suggested that the success of such measures is due to the use of hybrid models, beginning with social and technical analyses of the industrial environment, prior to the implementation of a management system.
Internationally, it is quite evident that energy issues are inseparable from climate change, so much so that in the 21st Conference of the Parties of United Nations (COP 21), held in Paris in December 2015, 189 countries participated, resulting in 162 Intended Nationally Determined Contributions (INDC), which consist of proposals for measures and definitions of targets for greenhouse gas reduction. The accord between countries aims to limit the increase in global average temperature to below 2 °C compared to pre-industrial levels. The agreement replaces other goals outlined in the Kyoto Protocol and must be reviewed every five years. However, from among the proposed INDCs, only 143 mention energy efficiency measures, and among these, only a few dictate new policies for the sector [9]. Thoyre [10] and Slazvik and Csete [11] analyzed how energy efficiency may be used in public policies considering climate change. Thoyre used data from North Carolina, USA, as a reference to compare 36 American states that adopted energy efficiency policies. Thoyre deduced that such projects tend to emphasize energy efficiency on the demand side, and rarely produce substantial impacts on the supply side, thus limiting the potential for electricity consumption reduction and consequently, climate benefits. Slazvik and Csete evaluated the Hungarian energy policy and its role in the economic recovery plan of the Hungarian government. The authors began with an examination of the National Energy Strategy 2030, which takes into account climate policy with regard to adaptation and mitigation, and lists the sources of renewable energies as important tools for reaching strategic goals. The Strategy intends to increase energy savings as a short-term solution with bearable costs and earn a relatively fast return on investment.
Calili et al. [12] developed a model for predicting impacts of energy savings in Brazil. Their results indicate that savings running on 1% electric power per year over a five-year period will result in profits between USD $70 and 80 million per year and avoids emissions of 3500 MtCO2eq per year. In contrast, the newly inaugurated USD $7.8 billion Belo Monte hydroelectric power plant had a return on investment over a period of 30 years, indicating that investments in energy efficiency have a better return on investment than a new hydroelectric power plant. Brazil proposed emissions reductions of 37% and 43% until 2025 and 2030, respectively, as its INDC. One of the measures for attaining these goals was a 10% increase in energy efficiency in the country through the National Plan for Energy (PNEf) [13,14]. Brazil has specific programs for energy savings and efficient use of energy. Of these, two stand out: The National Program for Energy Conservation (PROCEL) and the Energy Efficiency Program (PEE). The former is overseen by Electrobras, and the latter by the providers of electric power managed by the Brazilian Regulatory Electricity Agency (ANEEL). The PROCEL has allowed for savings of 92.2 TWh for the last 30 years, whereas the last 18 years of PEE projects totaled 9.48 TWh per year in electricity consumption reduction and 2.95 GW in demand reduction during peak hours [15,16]. Although these programs were relatively successful, Brazil is not in a comfortable position, according to the American Council for Energy Efficiency Economy (ACEEE), which published a report analyzing several aspects and indicators. This report lists a ranking of 23 countries in order of their performance in energy efficiency; Brazil comes in second to last. One of the indicators is the cost per capita for each country with regard to energy efficiency measures; Brazil invests USD $3.29, whereas Germany, placed first in the same ranking, invests USD $318.49. Another reason for this large gap is linked to energy management; Brazil only has 23 companies that are ISO 50.001 certified, whereas Germany has 3402 companies with this certification [17].
In this context, a methodology was developed to analyze the results of energy efficiency programs applied to the electricity distribution sector, based on Brazil’s situation. Analyzing the gains obtained through the investments made and classifying which actions obtained the best performance, helped contribute to deciding which investments to make to obtain greater energy savings. A mathematical model was constructed using a non-parametric method known as Data Envelopment Analysis (DEA). DEA is a technique that is applicable to problems with multiple inputs and outputs and is based on an analysis of the efficiency boundary. Its use has been proposed for energy planning in distribution systems since it defines indicators that aid in decision making. Several authors use this technique, in an isolated manner or in hybrid structures, linked with other modeling techniques. Pacudan and Guzman [18] developed a model using DEA to simulate the effect of energy efficiency policies in the energy distribution system in the Philippines. Through this model, the authors classified the performance of 15 energy providers regarding their technical and operational efficiency and the influence of energy efficiency measures on the demand side. Results indicated that energy savings greater than 19.8% allow for an increase in operational productivity for the providers.
Chen and Zhang [19] developed a model using DEA linked with Slack-Based Measures (SBM) to determine the Efficiency Factor of the regional economy in China, considering the use of land, energy, and greenhouse gas emissions. Alvarez and Rudnick [20] developed a model using DEA, focusing on input in conjunction with a variable return scale (VRS) to analyze the efficiency of regulatory mechanisms in Italy, Brazil, and Chile and determined the increase in energy efficiency in the electric distribution grids.
Oh and Hildreth [21] elaborated on a stochastic and deterministic model using stochastic frontier analysis (SFA) and DEA to measure the effectiveness of initiatives to save energy in the automotive industry. They presented the best projects for energy consumption reduction. Through a hybrid model with rough set theory (RST) techniques and data envelopment analysis (DEA), Lee and Tong [22] determined the efficiency in the transfer of energy in photovoltaic systems. Furthermore, using baseline data from 30 Chinese provinces, Zeng et al. [23] developed a DEA model to solve an efficient carbon allocation problem through a license concession for the emission of financial assets mechanism.
The remainder of this paper is structured as follows: in Section 2, Brazilian Energy Efficiency Programs are discussed; in Section 3, the methodology used is presented; the results of the data analysis are in Section 4; and in Section 5, the developed model and the results obtained are examined. Finishing with Section 6, concluding remarks are presented.
2. Brazilian Energy Efficiency Programs
As listed above, Brazil has two incentive programs for the efficient use of electric power: the PROCEL and the PEE [14]. The PROCEL, which was instituted on 30 December 1985, is a Brazilian government plan coordinated by the Ministry of Mines and Energy (MME) and executed by the Brazilian Power Plants S.A—Eletrobras. It aims to promote the efficient use of electric power and reduce waste. The results created by the program contribute to the efficiency of goods and services and enable the postponement of investments in the electricity sector, thereby reducing environmental impacts. Specifically, the PROCEL conducts the following activities: identifying and assigning an energy efficiency label for equipment and buildings; disseminating information on energy efficiency through educational action in the formal education system or publication of books, software, and technical manuals; provisioning support to municipalities for planning and implementing equipment substitution projects and improving public lighting and traffic lights; and providing training and assistance for the planning and implementation of projects that reduce energy consumption in municipalities and promote the efficient use of electricity and water in sanitation. Between 1986 and 2015, the PROCEL invested USD $808 million, which led to electricity savings of 92.2 TWh [15].
In the 1990s, there were major changes in the electricity market in Brazil, including the creation of ANEEL, the Brazilian Regulatory Electricity Agency, representing a new regulatory framework for the electricity sector, as well as for future actions in energy efficiency in the electricity distribution sector. In early 2000, the intensification of energy-efficient measures was evident, motivated by the crisis in the Brazilian electricity sector, culminating in law 9.991 on 24 July 2000. This law introduced three important points: mandatory investment of resources from the billing of concessionaires and licensees of public electricity distribution services, the way these resources are applied, and the deadlines for said investments [24]. This law was an important step for the development of the energy market in Brazil, as it established the mandatory application of at least 0.75% of business revenue into research and development (R&D) in the electricity sector and at least 0.25% into the final results of a program of energy efficiency (PEE).
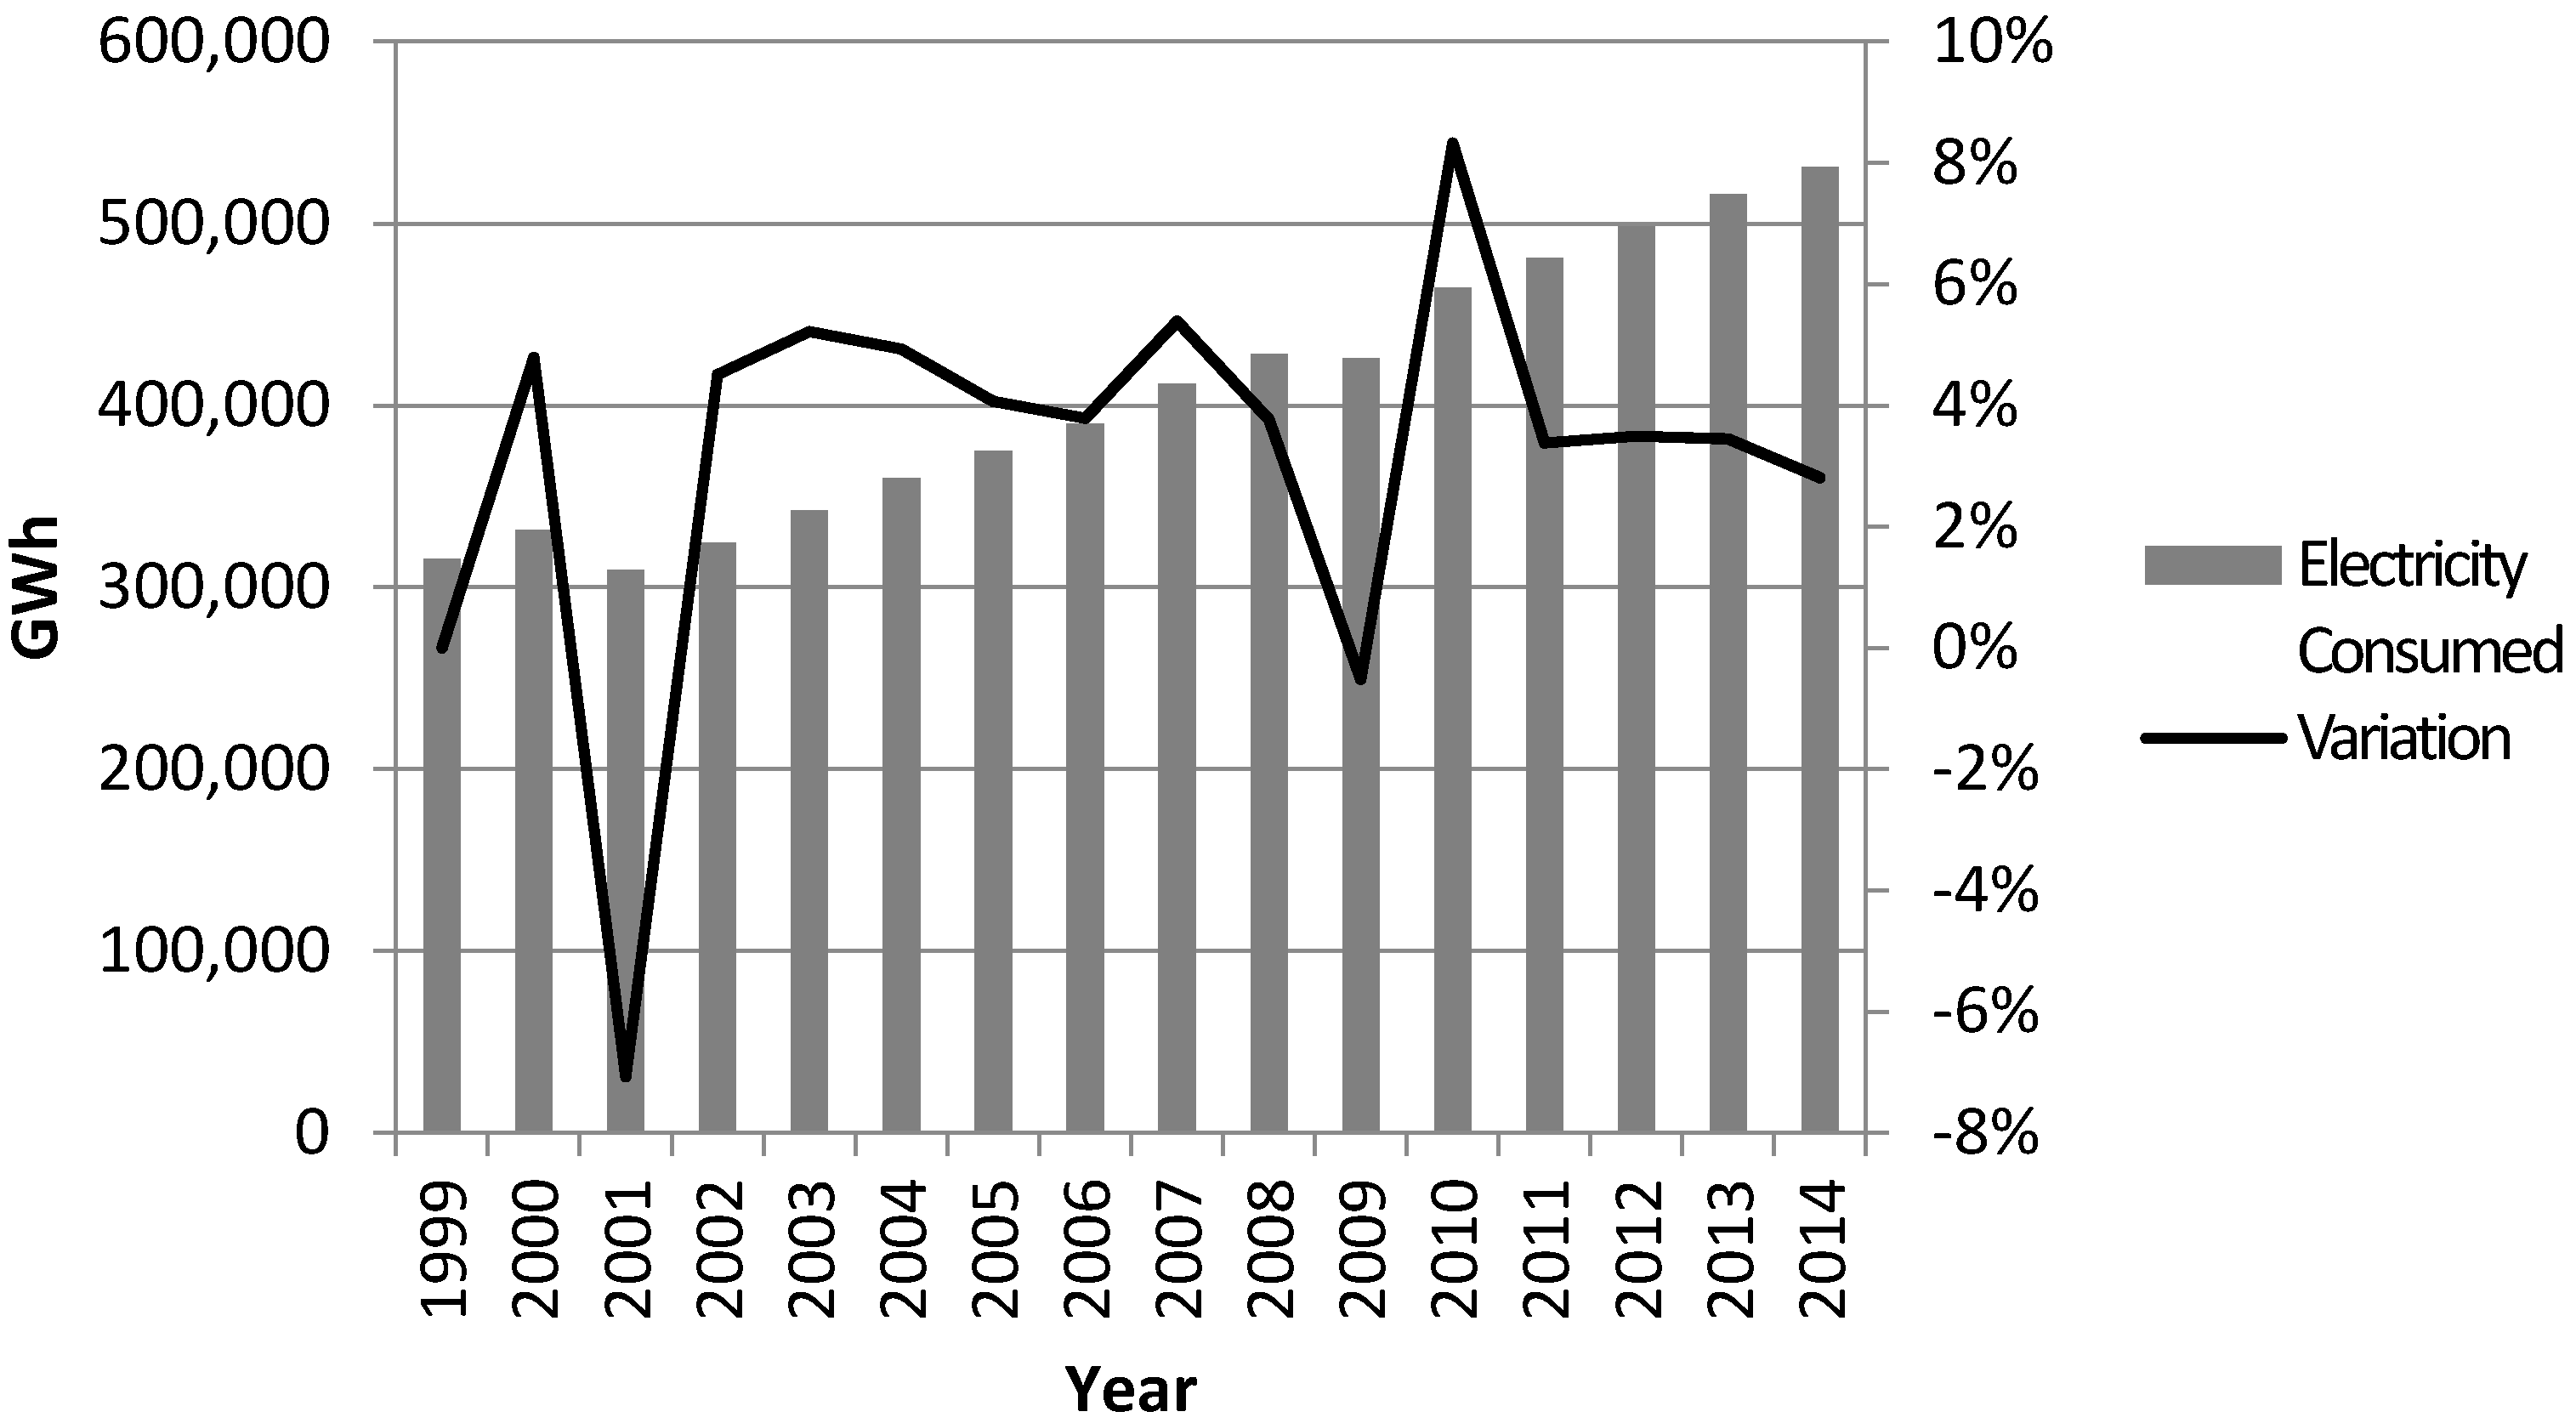
Despite such progress, the electricity sector crisis worsened, resulting in rationing the supply of electricity through the Emergent Program for Reduction of Electric Power Consumption (PERCEE), which was in force from 1 June 2001 until 28 February 2002. PERCEE determined compliance with consumption reduction targets, according to the type of consumer and the monthly average of electricity consumed, subject to penalties if the targets were not met. The penalties were significant, from increases of 50 to 200% of the tariff, up to the suspension of the electric power supply of the consumer unit. Reduction targets for residential consumers were 20% and for other consumers 15–25% [25]. Figure 1 presents electricity consumption data for Brazil between 1999 and 2015, and the variation in consumption for the same period. There was a reduction of 7.07% in consumption in 2001, exemplifying the impact of PERCEE [26,27].
Law 9.991/2000 has been adapted to address how resources are allocated and types of priority projects [28,29]. Other laws and decrees later emerged in Brazil, highlighting the importance of strategy in the public policy formulation for energy efficiency. Table 1 lists the main regulatory tools for energy efficiency that emerged in Brazil.
Currently, in the Brazilian Congress, the law project 1.917/2015 provides free market strategies for the distribution sector, in which the consumer may choose the desired distribution company and opt for lower priced concessionaires, whose cost reductions for electricity distribution may lead to a reduction in the final price paid by the consumer.
As a consequence of Law 9.991/2000, the Energy Efficiency Program focuses on promoting the efficient use of electric power in all economic sectors by means of projects that demonstrate the importance and economic viability of improving the energy efficiency of equipment, processes, and final uses of energy. It is aligned with the Brazilian energy planning, present in the National Plan for Energy Efficiency (PNEf), which sees it as the main source of revenue for energy efficiency in the Brazilian electricity distribution system [14].
The PEE is mandatory for electricity distribution companies with a market share greater than 1.000 GWh/year, and at least 50% of its resources must be applied to the two consumer classes with the greatest market share. In profit-seeking consumer units, projects must be conducted via energy performance contracts, with the total value invested in the project being refunded. However, for projects in non-profit-seeking consumer units, investments are non-refundable. One of the comparative advantages of using non-profit-seeking consumer units compared to other forms of financing is that there is no interest to be collected—only monetary correction. Furthermore, consumers must refund only the implementation costs. The main goal of the energy performance contract is to avoid the transfer of public resources to profit-seeking consumer units and reduce the lack of trust in relation to the success of the energy efficiency measures. Since the payment is conditioned to the success of the chosen measure, ANEEL adopts the International Protocol for Measurement and Verification of Performance by Efficiency Valuation Organization (EVO) as a measurement and verification methodology [16].
Consumption classes considered for the PEE are as follows: rural, industrial, trade and services, residential, public service, public agencies, and public lighting. Projects geared according to these classes must be contracted via Public Call, which is a mechanism for implementing energy efficiency measures. The distribution company issues a public notice, requesting energy efficiency project presentation, wherein competition occurs in a process including auctioning quality and price. The main goal of these public projects is to motivate the societal participation in general, providing a greater diversity of projects and incentives for the creation of an energy efficiency market. They are also aimed at making the decision process for projects and consumers benefited by the PEE more transparent and democratic, thus promoting greater societal participation [16].
The main choice criterion, among projects participating in the Public Call, is based on the cost–benefit relation (RCB) of each project (Equation (1)); benefits are considered to be the valuation of the economized energy and the reduction of demand in peak hours during the project life, and the costs are all the investments for accomplishing said project. As a general rule, a project will be approved if it reaches an RCB lesser than or equal to 0.8 [16].
The RCB is represented by
where CAT is the total annual cost, given in $/year; BAT is the total annual benefit, also in $/year.
3. Methodology
In order to evaluate the Brazilian energy efficiency program, a methodology was used to analyze the projects, classify and quantify the variables, model the problems and determine the best performing projects, and this was culminated with recommendations for the improvement of the program.
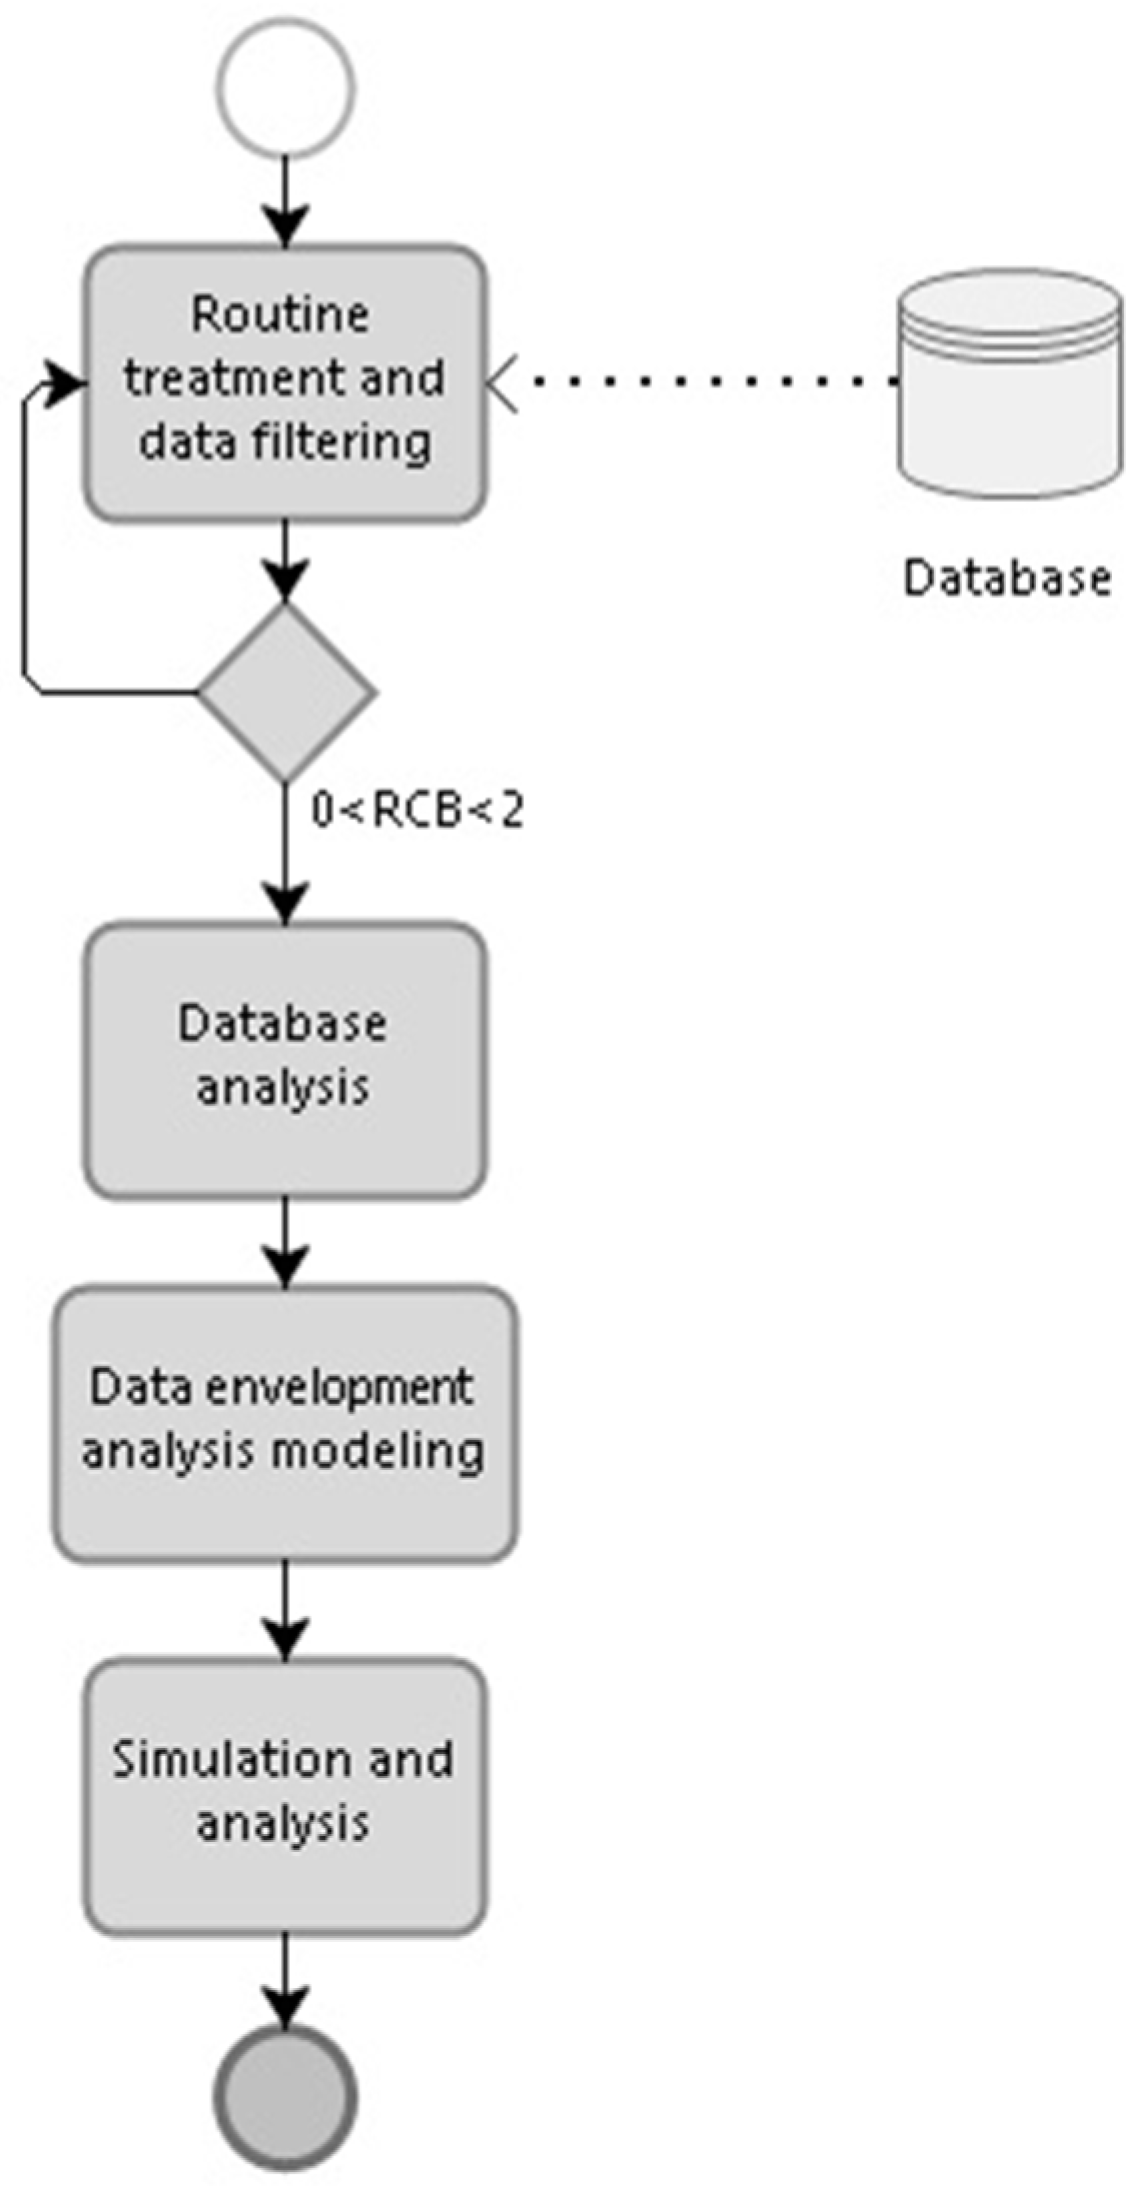
In the flowchart in Figure 2, the steps of the methodology used are presented.
The detailed steps of the methodology are as follows:
- Database: To analyze the PEE, a database from 2008 until March 2016 was used, comprising 1704 projects forwarded to the ANEEL by the electric utilities with information about potential projects. The projects were classified into 14 categories (Appendix A) and 7 final uses, and the database included 5 variables: saved energy, peak demand reduction, total cost of project, cost of saved energy, and RCB. The database is available on the ANEEL website, a download address is available in the Supplementary Materials section.
- Routine treatment and data filtering: In this step, routines were developed for the treatment and selection of the data to be analyzed, and consisted of the filtering of spurious and inconsistent data, which was due to a failure of data processing by energy concessionaires. Only the projects with the data for all the variables were selected, and subsequently, the RCB was adopted with a parameter of less than 2. Above this value, the data of the projects were not included, because the cut-off limit for acceptance of the project by ANEEL is equal to 1, so the costs of projects with an RCB above this value must be assumed by the consumer unit.
- Data analysis: This step involved consolidating the data, classified by category and the final use of the energy, and subsequent analysis. The total value of projects, the energy saved, the reduction in peak demand, the total cost of the projects, the cost of energy saved, and the cost–benefit ratio are presented for each category. The analysis of the cited variables, in relation to the number of projects carried out per category, was performed. The same analysis was performed considering the final energy use classification.
- Data envelopment analysis modeling: A model was developed using the data envelopment analysis (DEA) method, treating the problem like a black box, given its unknown production function, but with the inputs and outputs well known. As a principle, inputs were minimized and outputs maximized. The chosen methodology to model the problem, to identify types of measures for energy efficiency, takes into consideration the characteristics of the available database that results in the best program. The methodology consists of determining the efficiency boundary that defines the most efficient project categories, and consequently the measures of energy efficiency, composed of the categories with the best input–output relation. All other categories outside of the boundary curve are classified as a function of their distance from the curve.
DEA is a non-parametric method that uses part-based linear programming to calculate the most efficient units in a given sample set of decision units. The decision units that form the boundary also include those considered to be less efficient. Each unit is compared with a linear combination of units that produce at least as much from each output as the inefficient unit with the smallest possible quantity of input. The operational efficiency is calculated with a score ranging from 0 to 1, in which 1 is given to the most efficient units that form the boundary curve, to be determined according to Equations (2) and (3) [30].
This is subject to
Equation (2) corresponds to the objective function, where E represents the efficiency index, given by the weighted sum of the outputs and divided by the weighted sum of the inputs. In Equation (3), there are restrictions for optimizing the objective function. vr represents the weights assigned to the outputs r; ui represents the weights assigned to inputs i; zrj represents the observed quantity of output r for unit j; xij is the observed quantity of input i for unit j; n is the total number of units under analysis; s represents the total outputs; and m, the total inputs. The variables E0, Zr0, xi0 are relative to the first decision unit, denominated unit 0. The weights u and v are vectors, obtained by Equations (2) and (3), which involves finding the values of u and v such that the efficiency measure for which the nth project is maximized. The model allows total flexibility in the selection of weights, and imposes non-negativity and feasibility constraints of the decision units.
This method has two outcomes in relation to the returns to scale: the constant returns to scale (CRS) model, which, by its own denomination, does not alter the returns to scale, and the variable returns to scale (VRS) model, which considers production efficiency situations with variation of scale and does not assume proportionality among inputs and outputs [30]. In this work, the VRS model was selected, in which the variables may be correlated; hence, the results showed the best categories when a larger number of variables was considered. The DEA constraints can be configured for the specific characteristics of the problem, referencing the model in relation to the minimization of inputs or the maximization of outputs [20,30]. This objective function can be evaluated by the two options, and in this way, models for inputs and outputs were simulated, according to Equations (4) and (5):
Equation (5) refers to a dual input-oriented model.
The values obtained for E assign an efficiency value for each decision-making unit (DMU). DMUs with E < 1 are classified as inefficient, if E = 1, the DMUs will lay on the efficiency boundary. The variable λj is a convexity constant, which represents the weights assigned to the outputs and inputs, guaranteeing the convexity of the efficiency frontier.
The developed model shows the best type of project to be executed by the electricity distribution companies, taking into account three main aspects: the lowest cost of energy saved, the largest amount of energy saved, and the greatest peak demand reduction. The cost of energy saved per project was selected as the input, the energy saved per project and the peak demand reduction hours per project as outputs, and the project categories as DMUs, according to Table 2.
- Simulation and analysis: This step involved the simulation and determination of the efficiency boundary between categories. From the results obtained, the best categories of the project were identified, and the categories that do not reach the efficiency boundary will be evaluated and the necessary gains for these to reach the efficiency curve were determined.
4. Results of Data Analysis
After the data treatment, the number of projects considered for analysis was reduced to 1677, and of this sample, the total investment during this period was USD $1.49 billion, resulting in a 4.29 TWh/year energy economy and a 1.33 GW reduction in demand during peak hours. Presented in Table 3 are the data of the variables in relation to the category.
The five categories with the greatest number of projects are as follows: low-income with 451 (26.89%), public agencies with 422 (25.16%), trade and services with 230 (13.71%), public service with 141 (8.41%), and residential with 129 (7.69%). The low-income category consists of projects with investments in consumers benefiting from the social tariff due to having low family income. It includes the exchange of inefficient equipment, such as refrigerators and light bulbs, for new ones with greater efficiency. Public agency projects are non-refundable and have significant potential to increase the efficiency of their facilities.
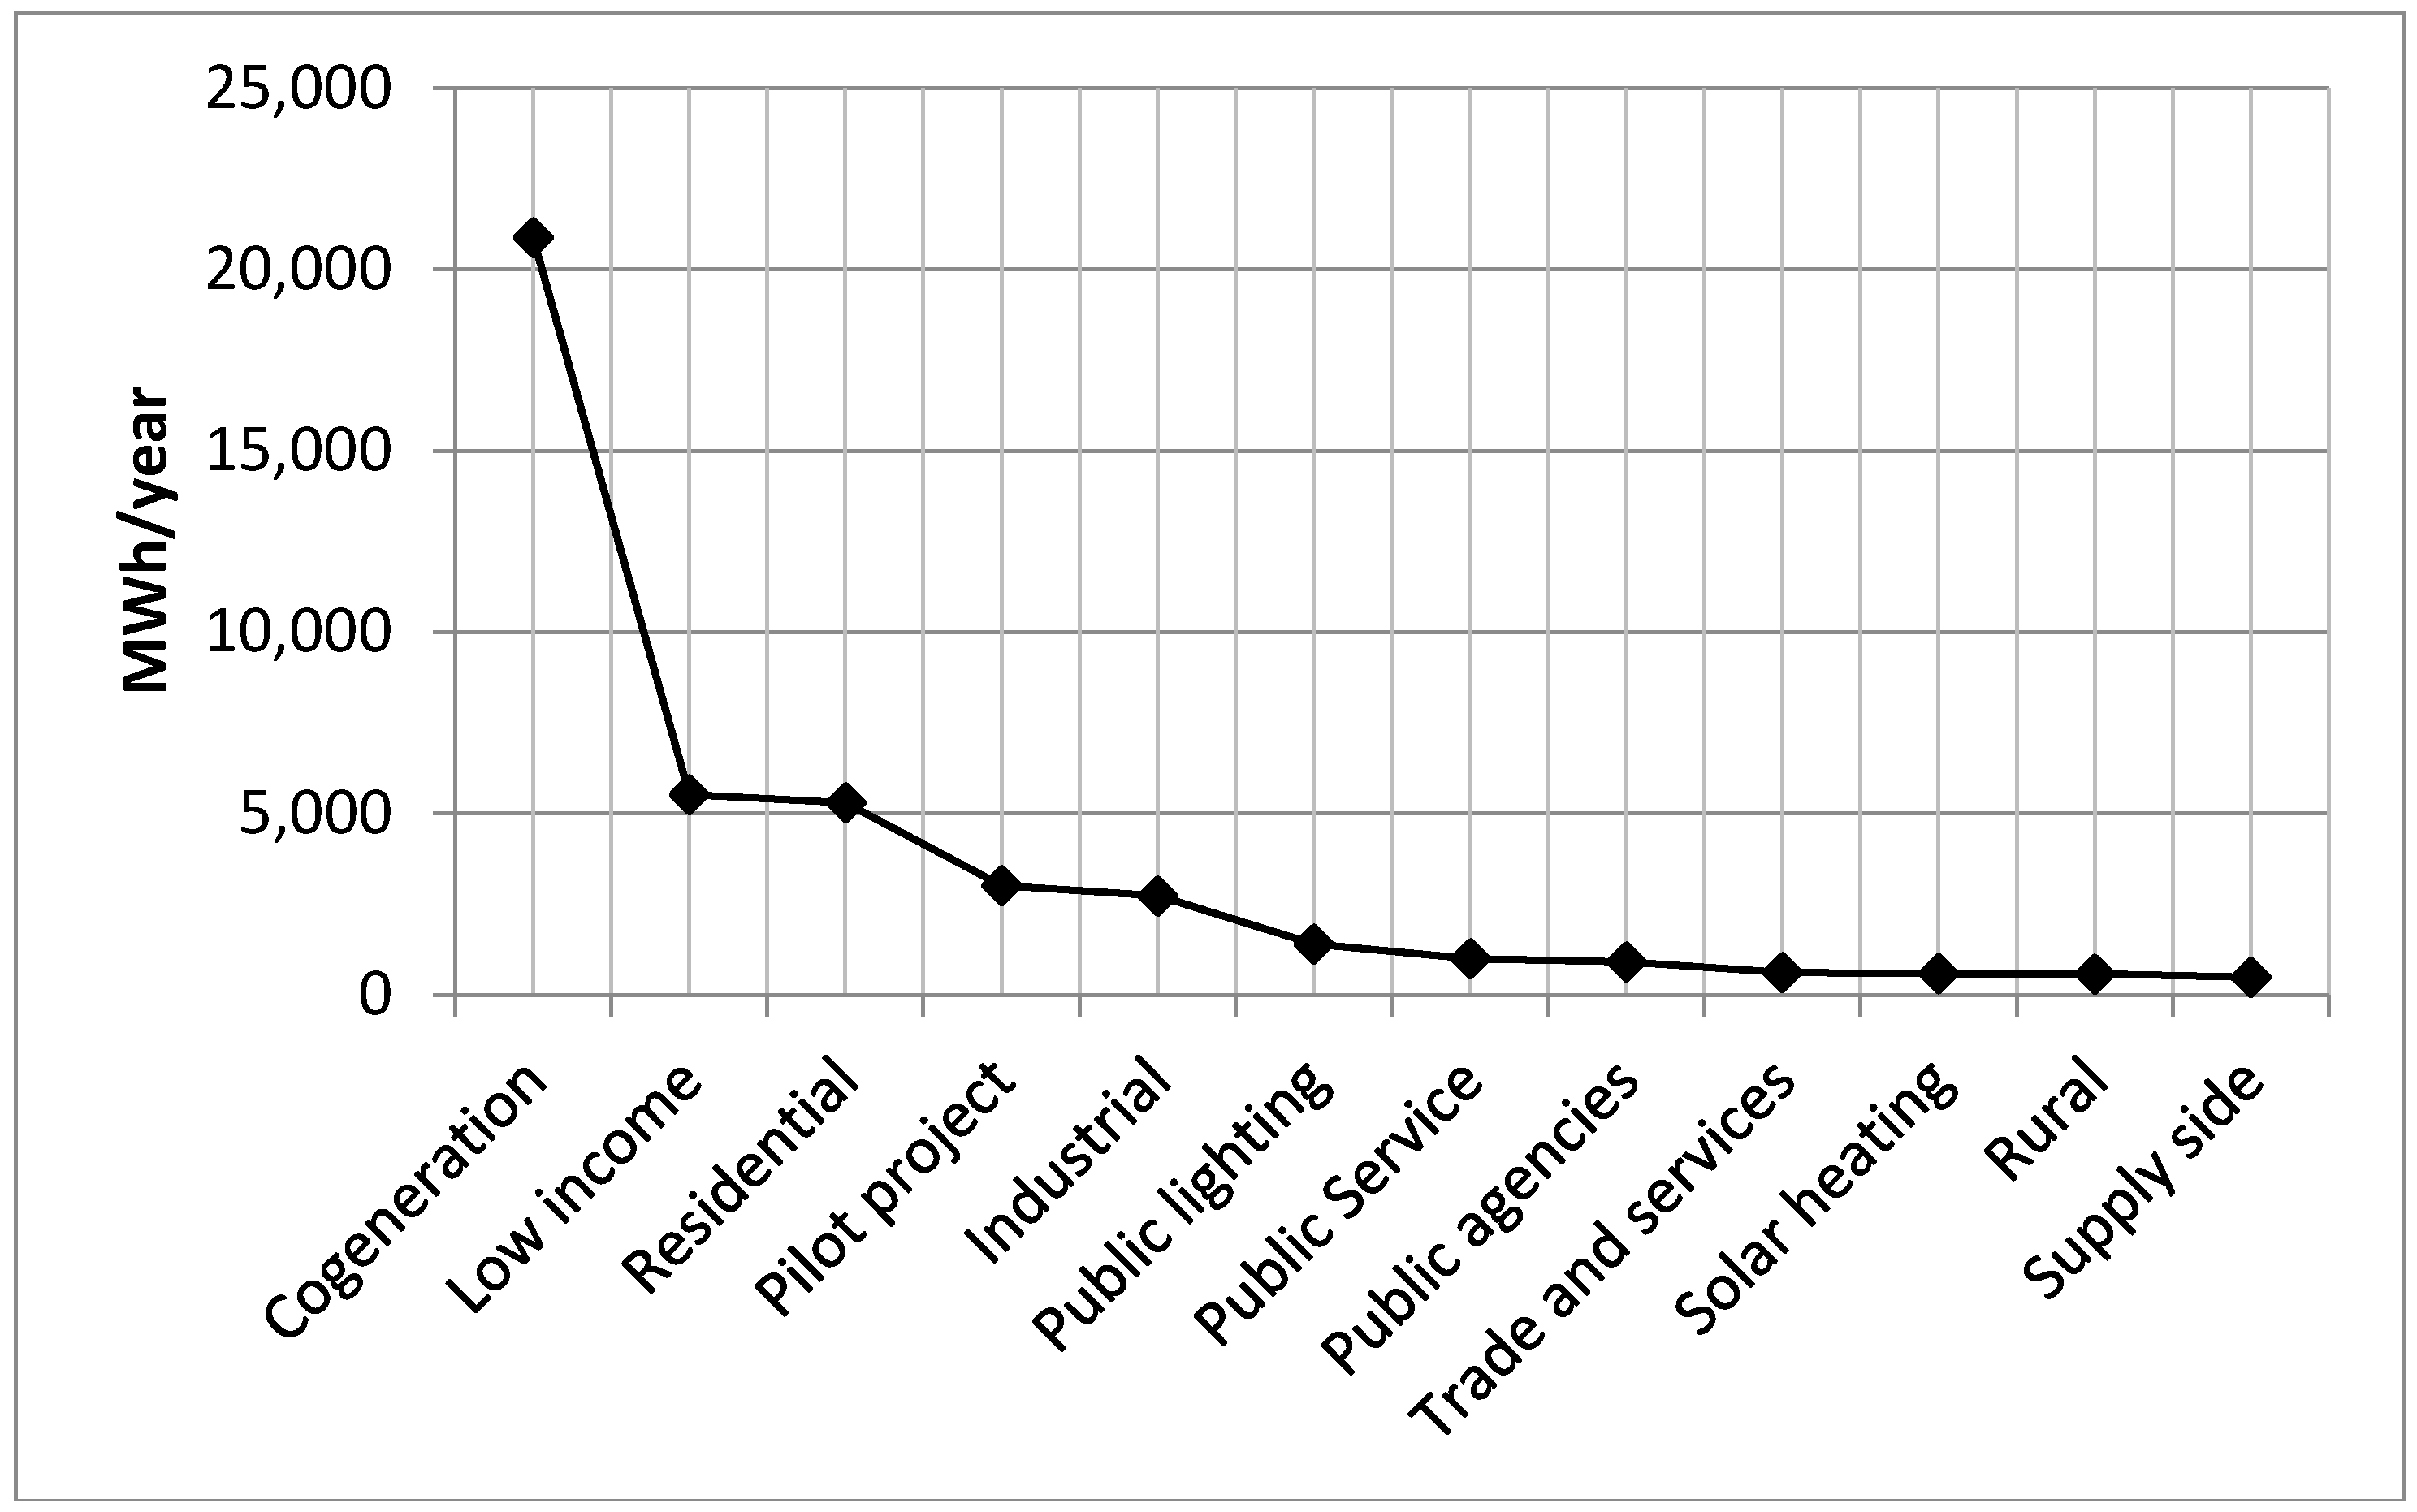
Figure 3 shows the energy savings per project per category. As for the energy saved by project, the categories with the best performance are cogeneration, low-income, residential, pilot project, and industrial.
We observed that cogeneration had 3.78 times the energy savings per executed project than the low-income category, which has a greater number of projects executed. The low efficiency of public agency projects should be discounted, although they represent one quarter of the total projects analyzed.
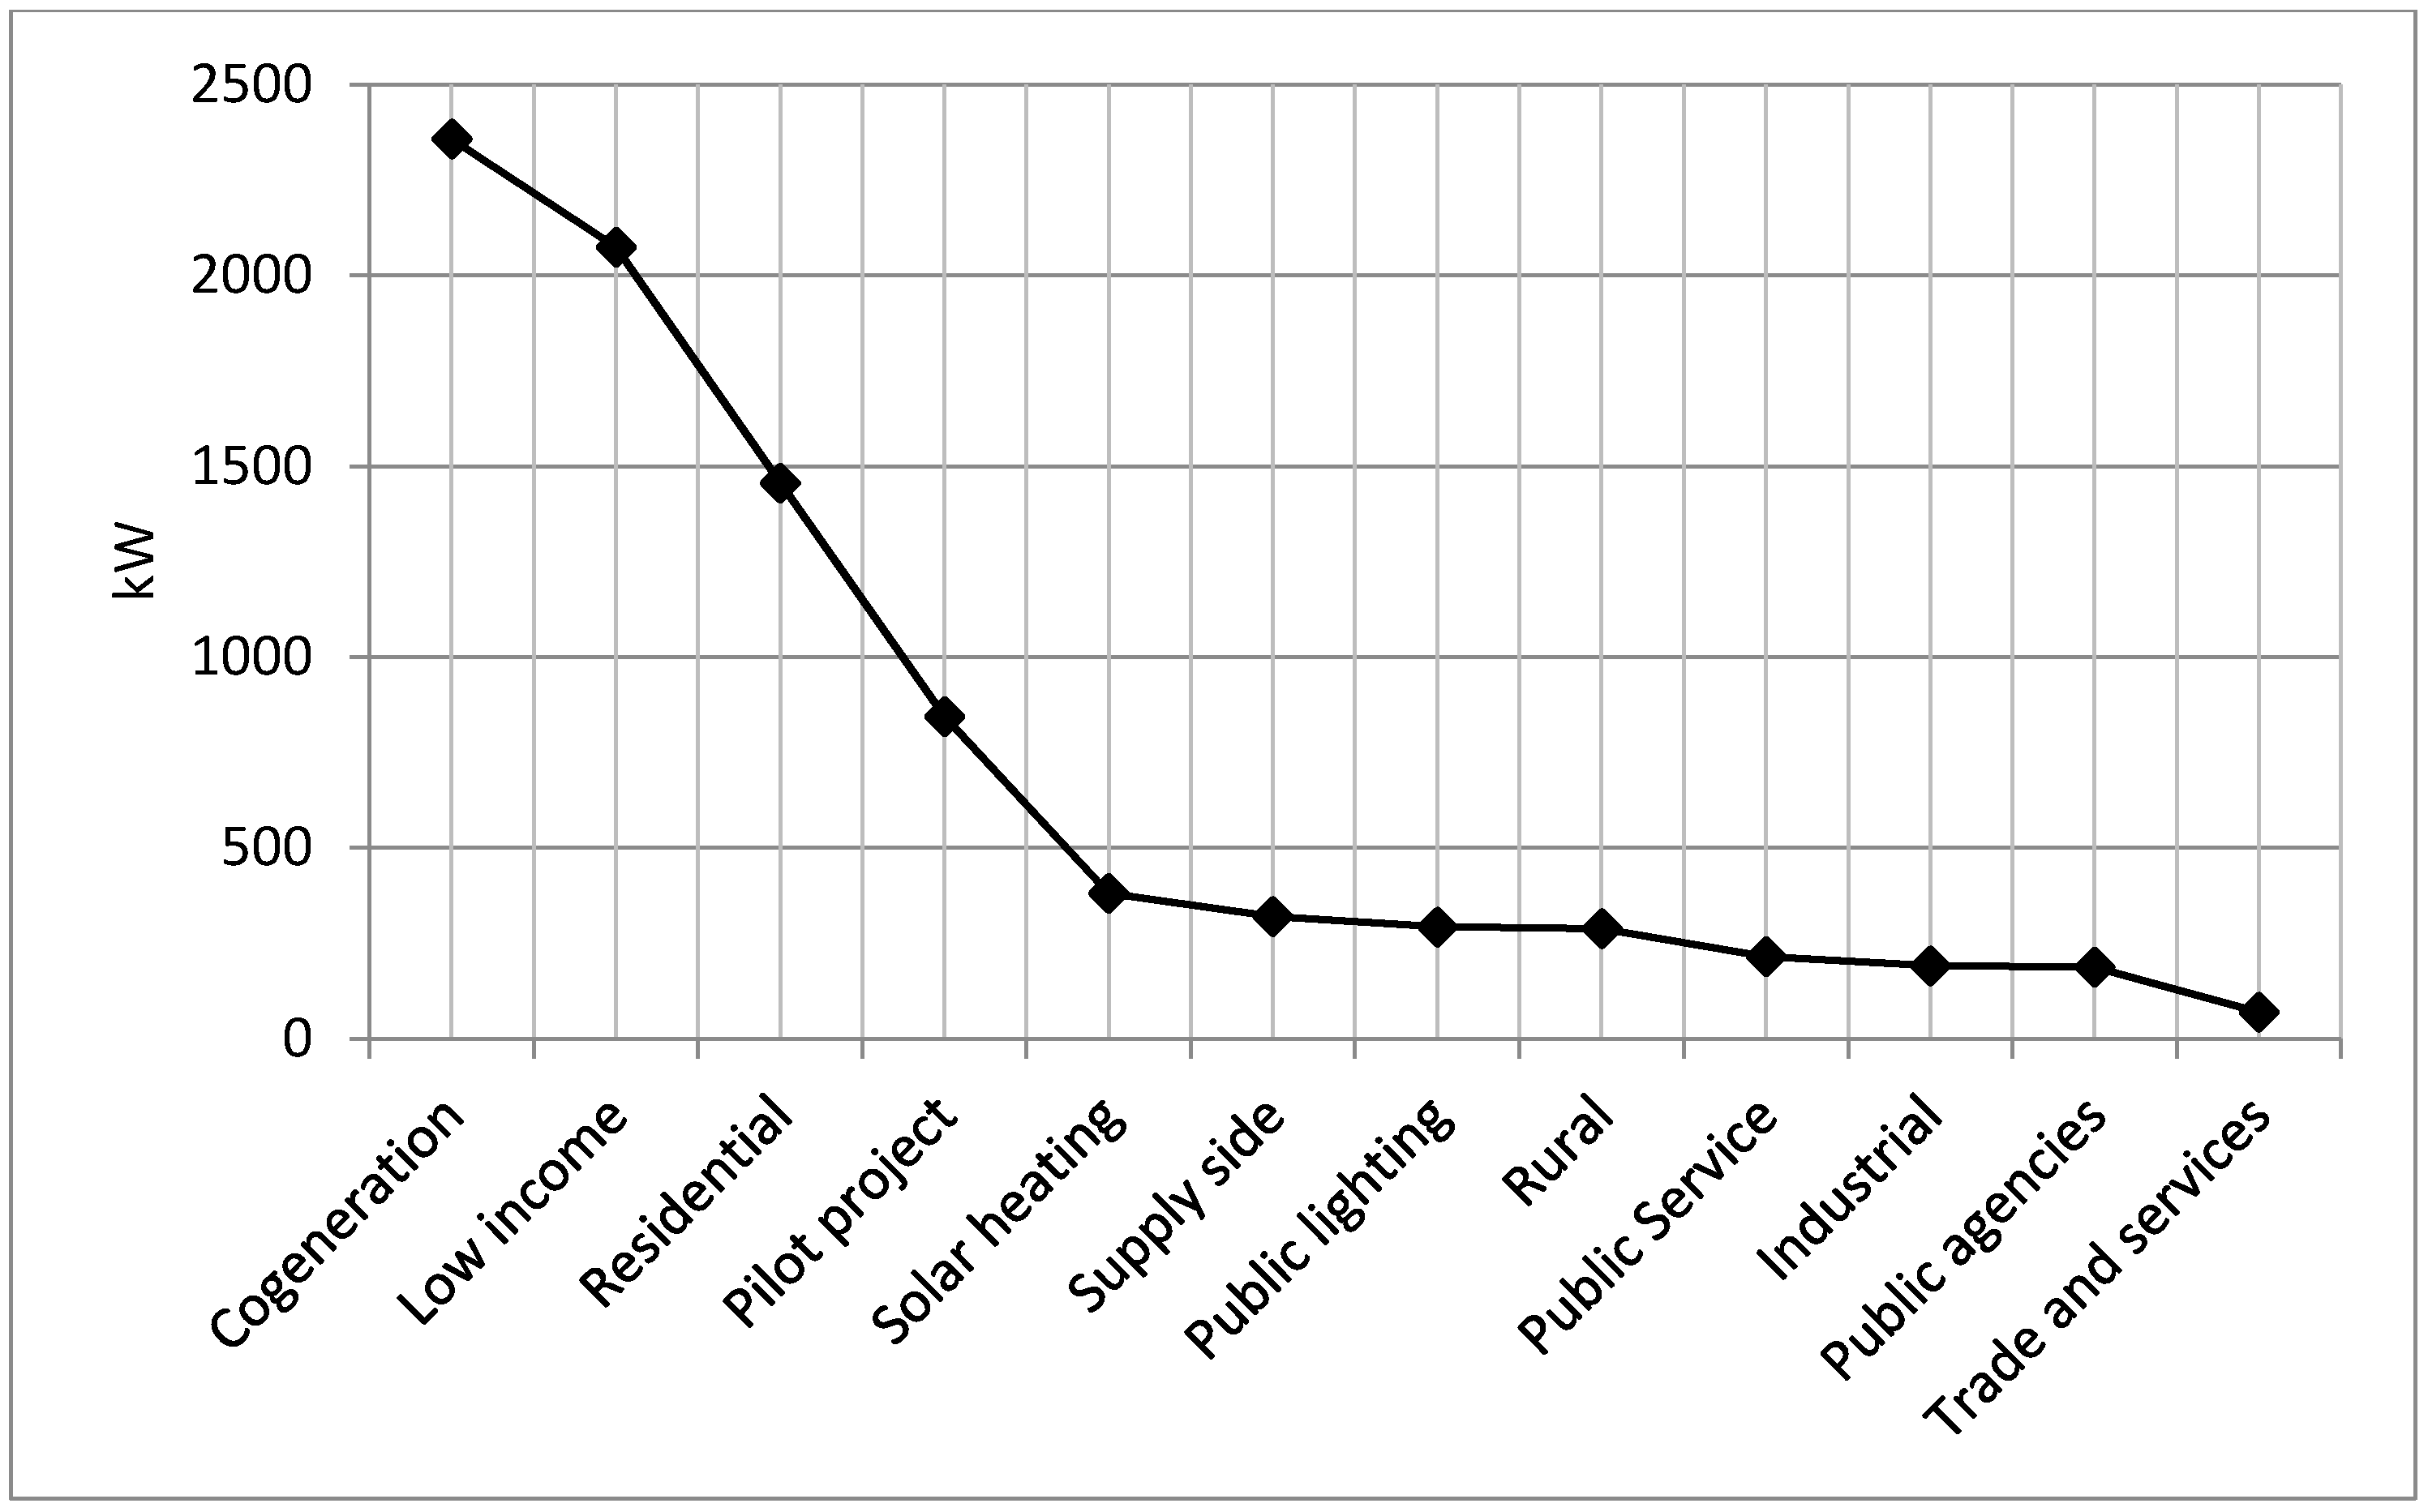
Figure 4 shows a graph with the peak demand reduction (PDR) per project. In the line graph, the highest reduction rates occurred in cogeneration (2357.43 kW/project), low-income (2073.94 kW/project), residential (1455.70 kW/project), pilot (843.59 kW/project), and solar heating (380.28 kW/project).
The public lighting and industrial categories were characterized by operation during peak hours; however, they did not observe this correlation in the data analyzed, with average reduction rates of 292.97 kW/project and 190.81 kW/project, respectively. Several other types of consumers often have high rates of operation at peak hours, such as public service (water and sewage companies), trade and services (malls, supermarkets, schools, business offices, and others), and public agencies (hospitals, universities, schools, and police stations), although there is a low representation of these categories in the demand reduction results at peak hours.
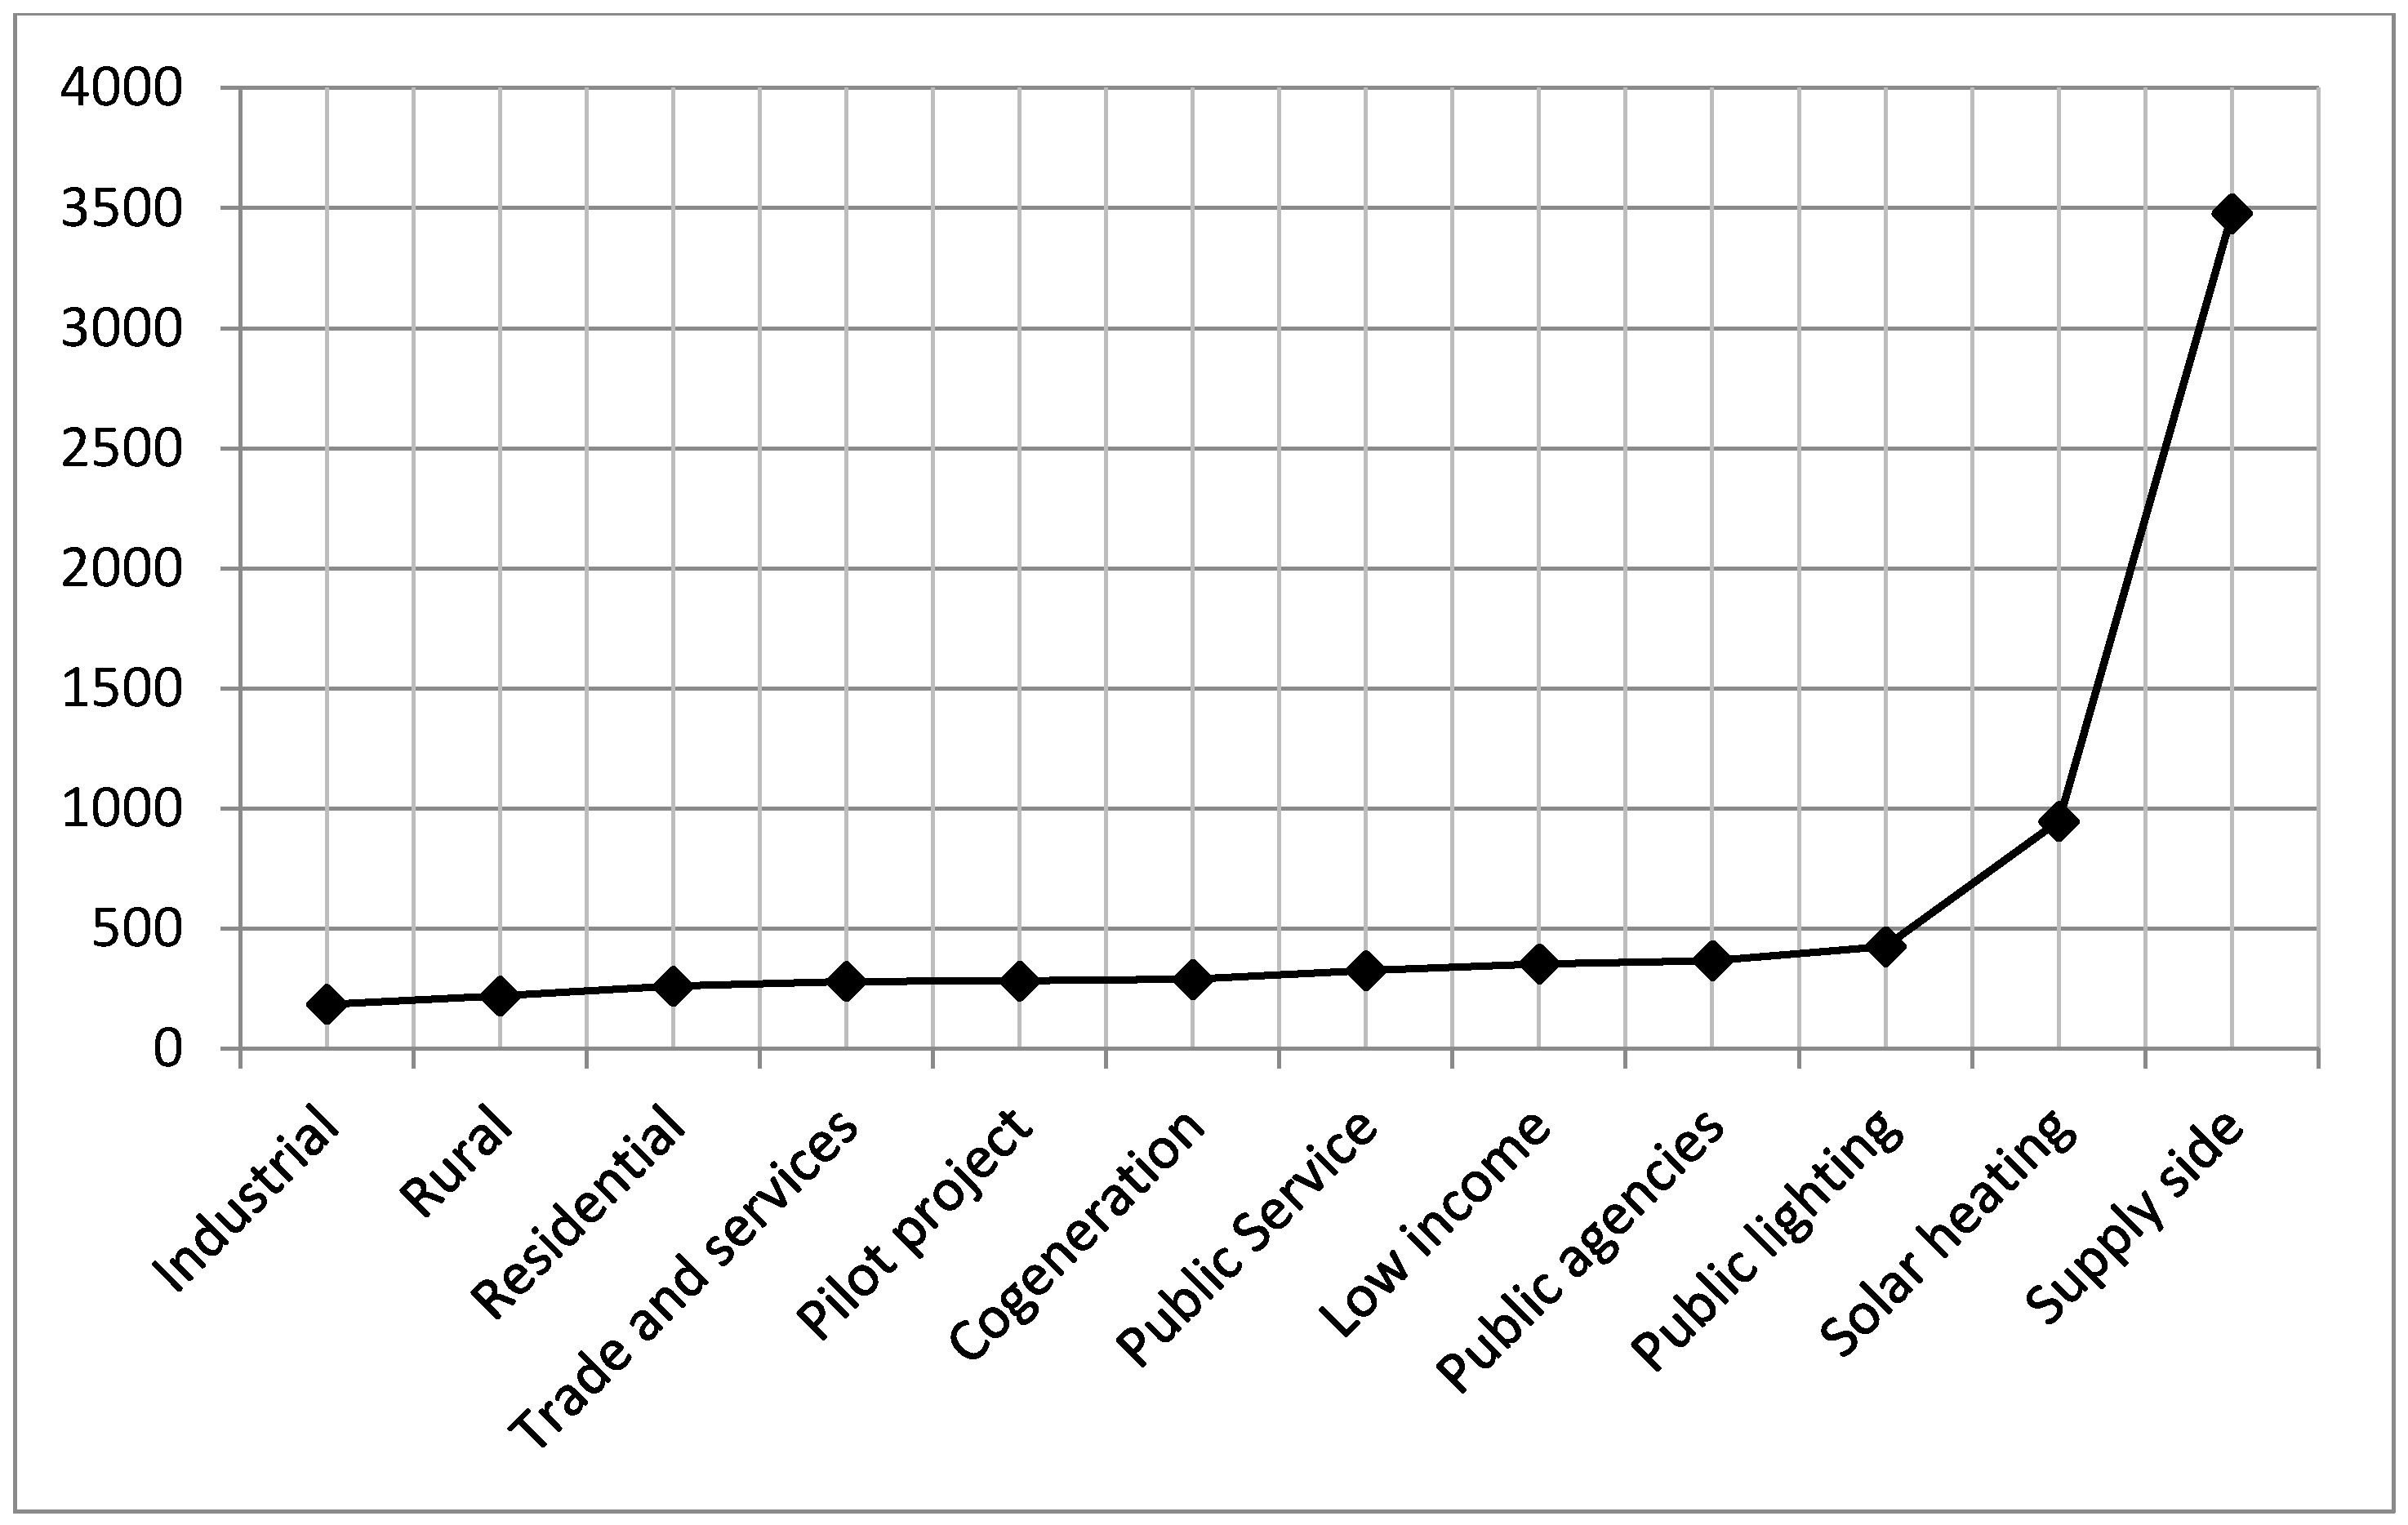
The cost of energy saved by category was analyzed using the relationship between the total investment realized and the energy savings. Figure 5 shows a graph of the cost of energy saved, in which the industrial category, with 184.92 USD/MWh·year, had the lowest energy cost savings, followed by rural with 219.74 USD/MWh·year, residential with 261.34 USD/MWh·year, trade and services with 280.67 USD/MWh·year, pilot projects with 282.79 USD/MWh·year, and cogeneration with 290.05 USD/MWh·year. The only project on the supply side cost was 3476.92 USD/MWh·year, the largest among the categories.
The categories with the highest number of projects were low-income and public agencies having costs of 353.85 USD/MWh·year and 367.41 USD/MWh·year, respectively.
As for the RCB, the results are detailed in Figure 6, with the rural, cogeneration, industrial, low-income, and residential categories standing out. Projects with an RCB above one indicate costs greater than the benefits, denoting the failure of actions, at least in regards to energy efficiency.
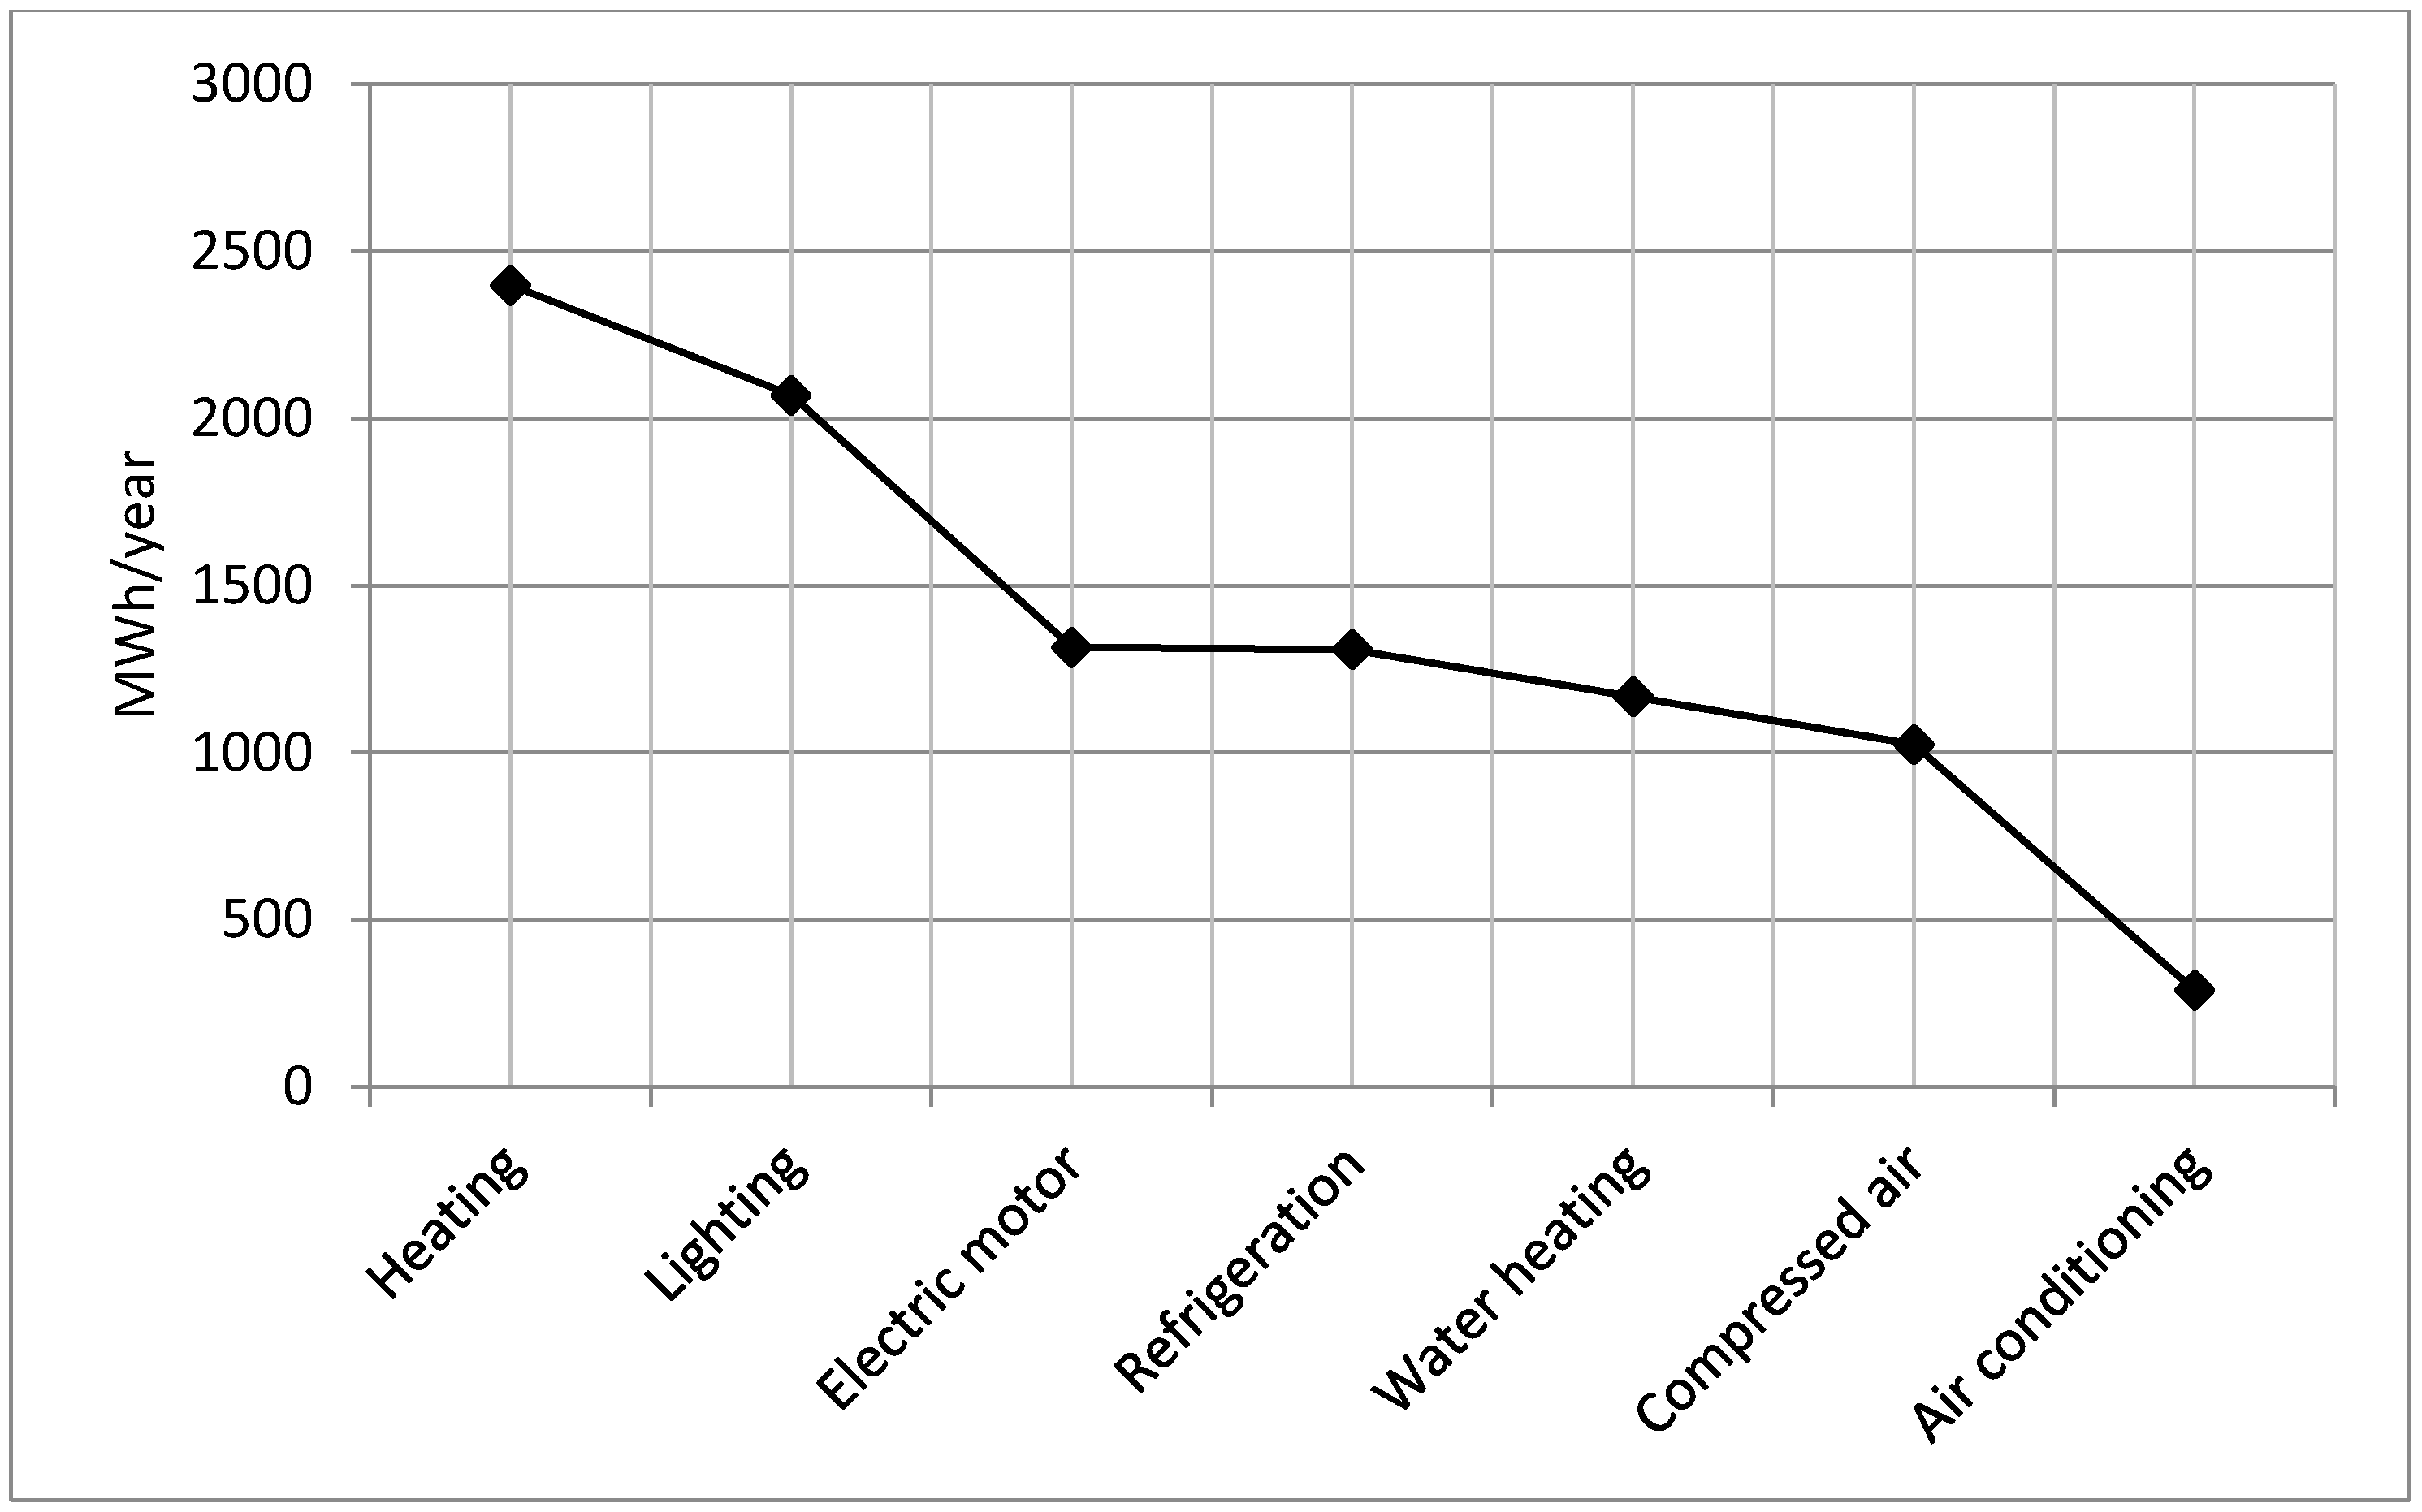
In addition to the categories, the database provides a classification of projects in relation to the final energy use, classified into seven variables, according to Figure 7. The following final energy use results stand out. Heating had eight projects with an average energy savings per project of 2398.39 MWh/year, lighting with 1247 projects and 2069.18 MWh/year, and electric motors with 133 projects and 1314.61 MWh/year.
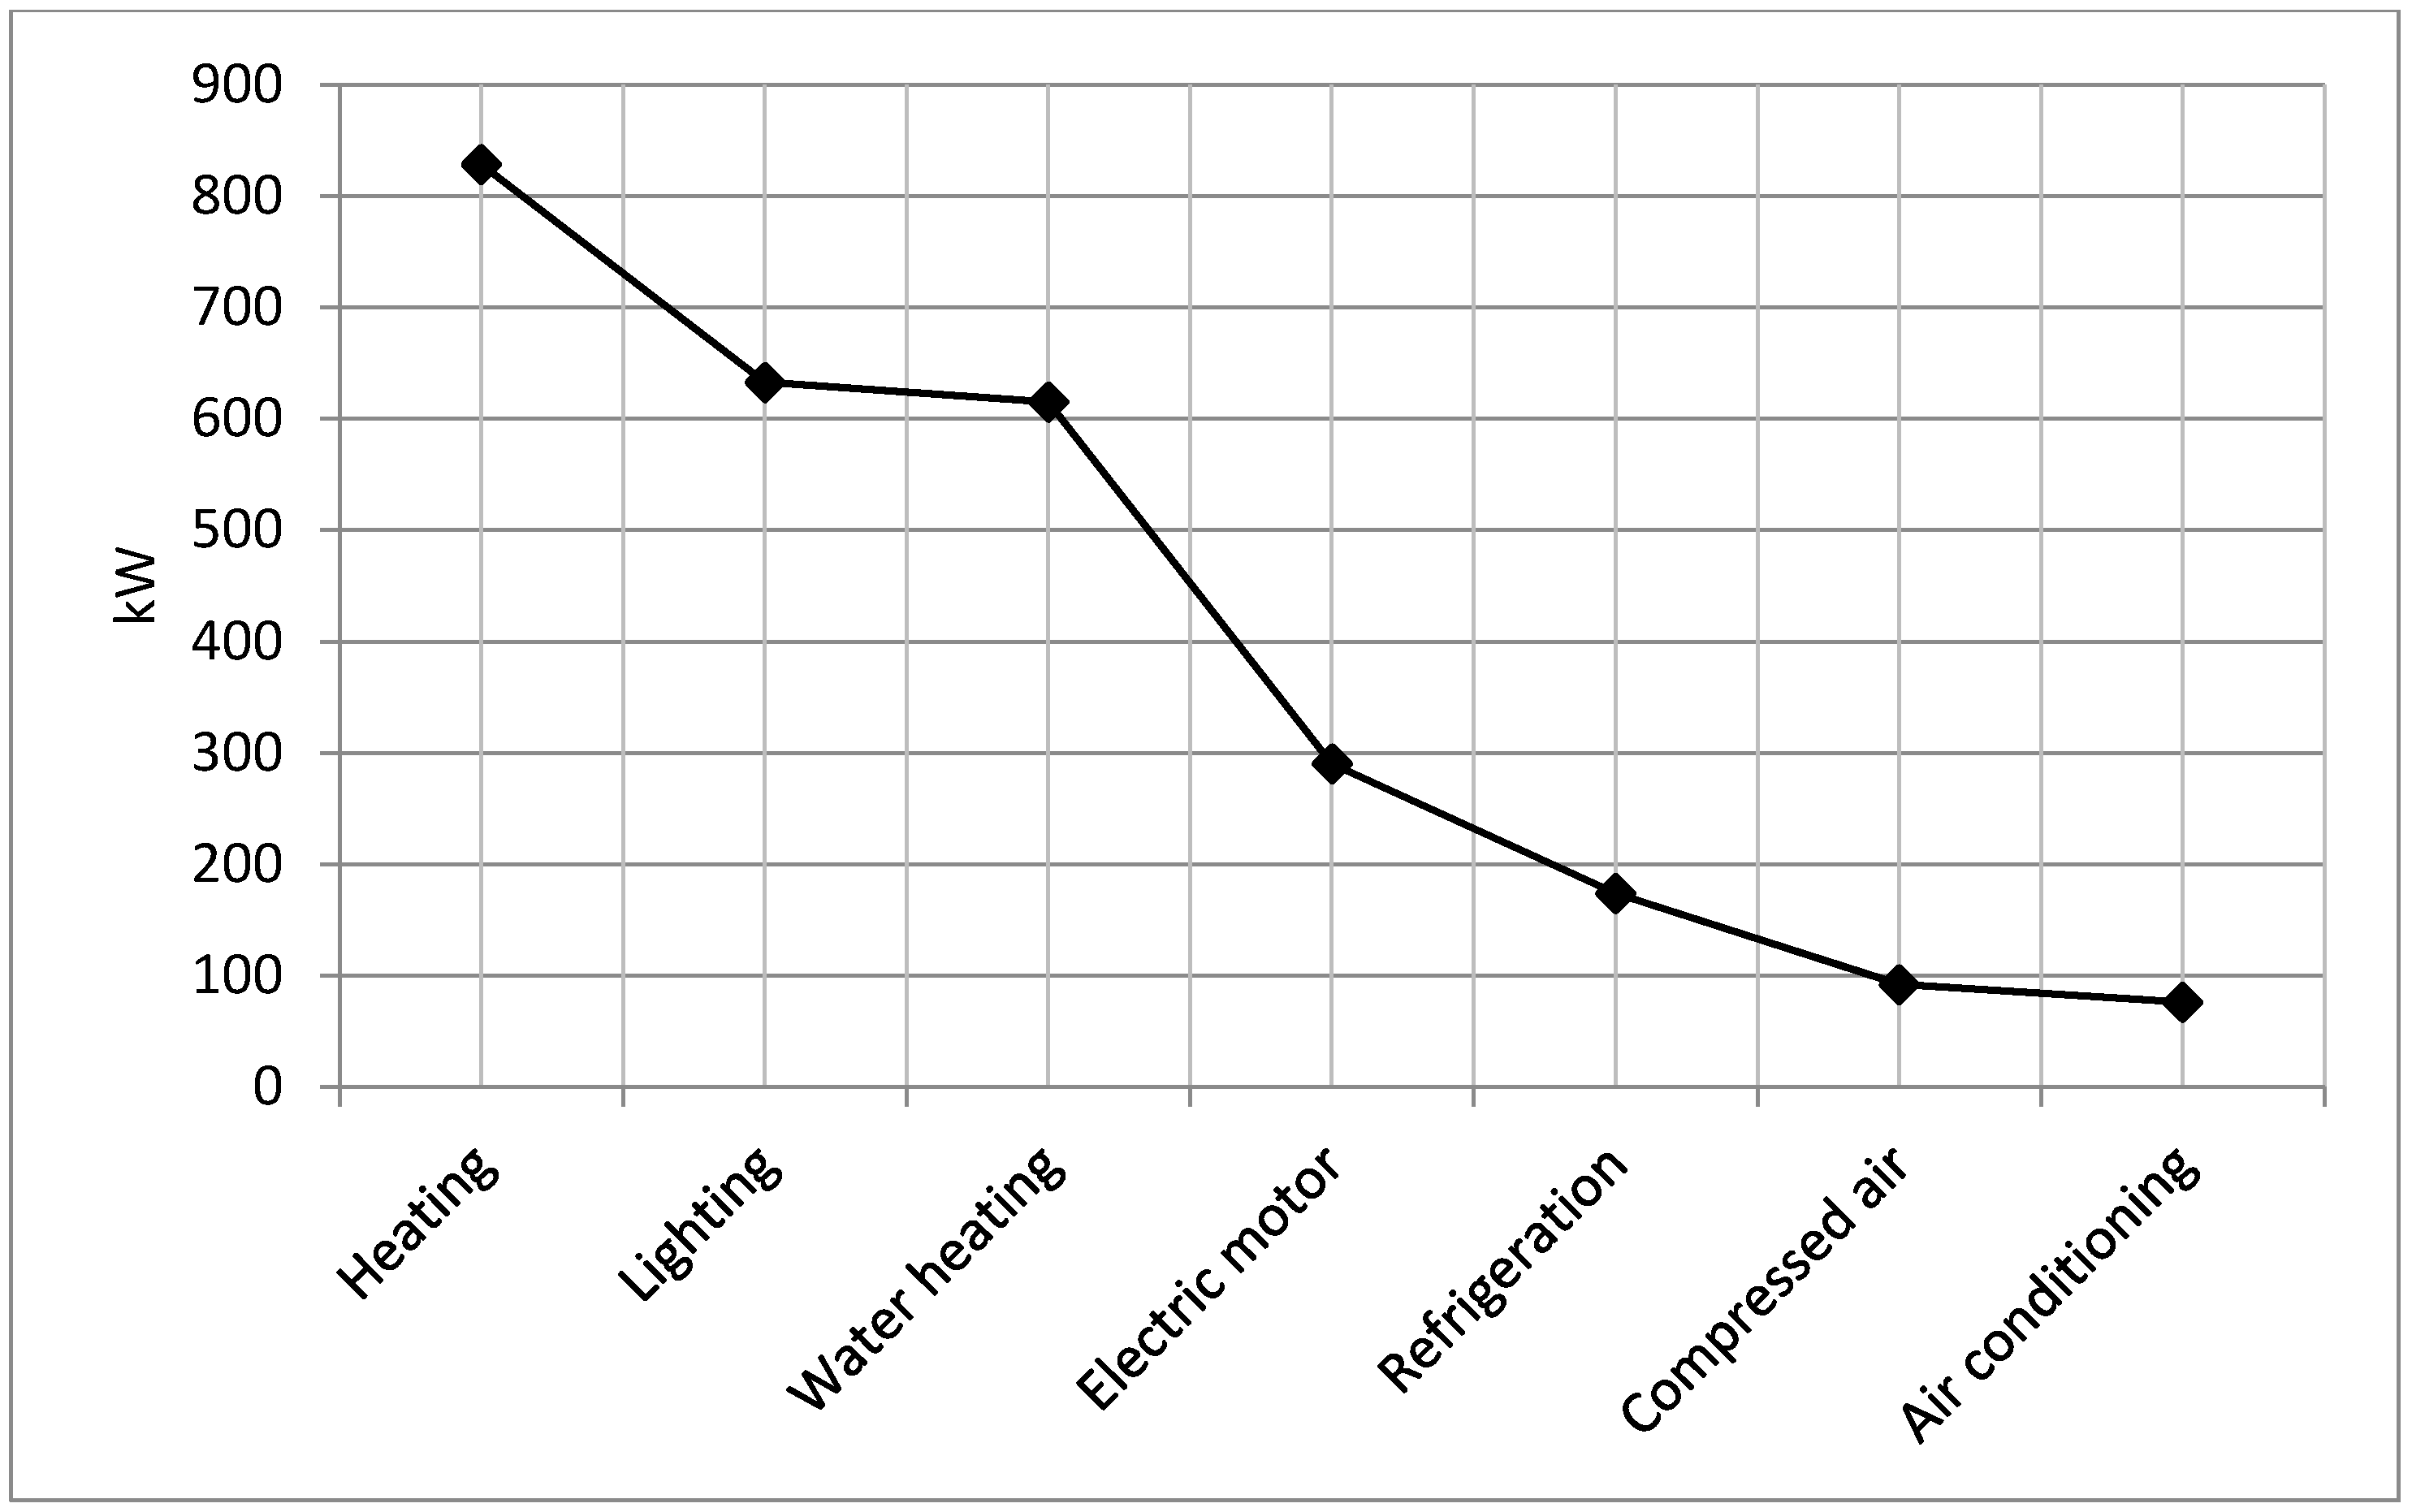
The reduction of demand at peak hours can be seen in Figure 8, where heating, with only eight projects, projected a reduction of 828.18 kW/project, lighting with a reduction of 632.67 kW/project, water heating with 615.03 kW/project, electric motors with 290.27 kW/project, refrigeration with 173.95 kW/project, compressed air 92.20 kW/project, and air conditioning with 76.36 kW/project.
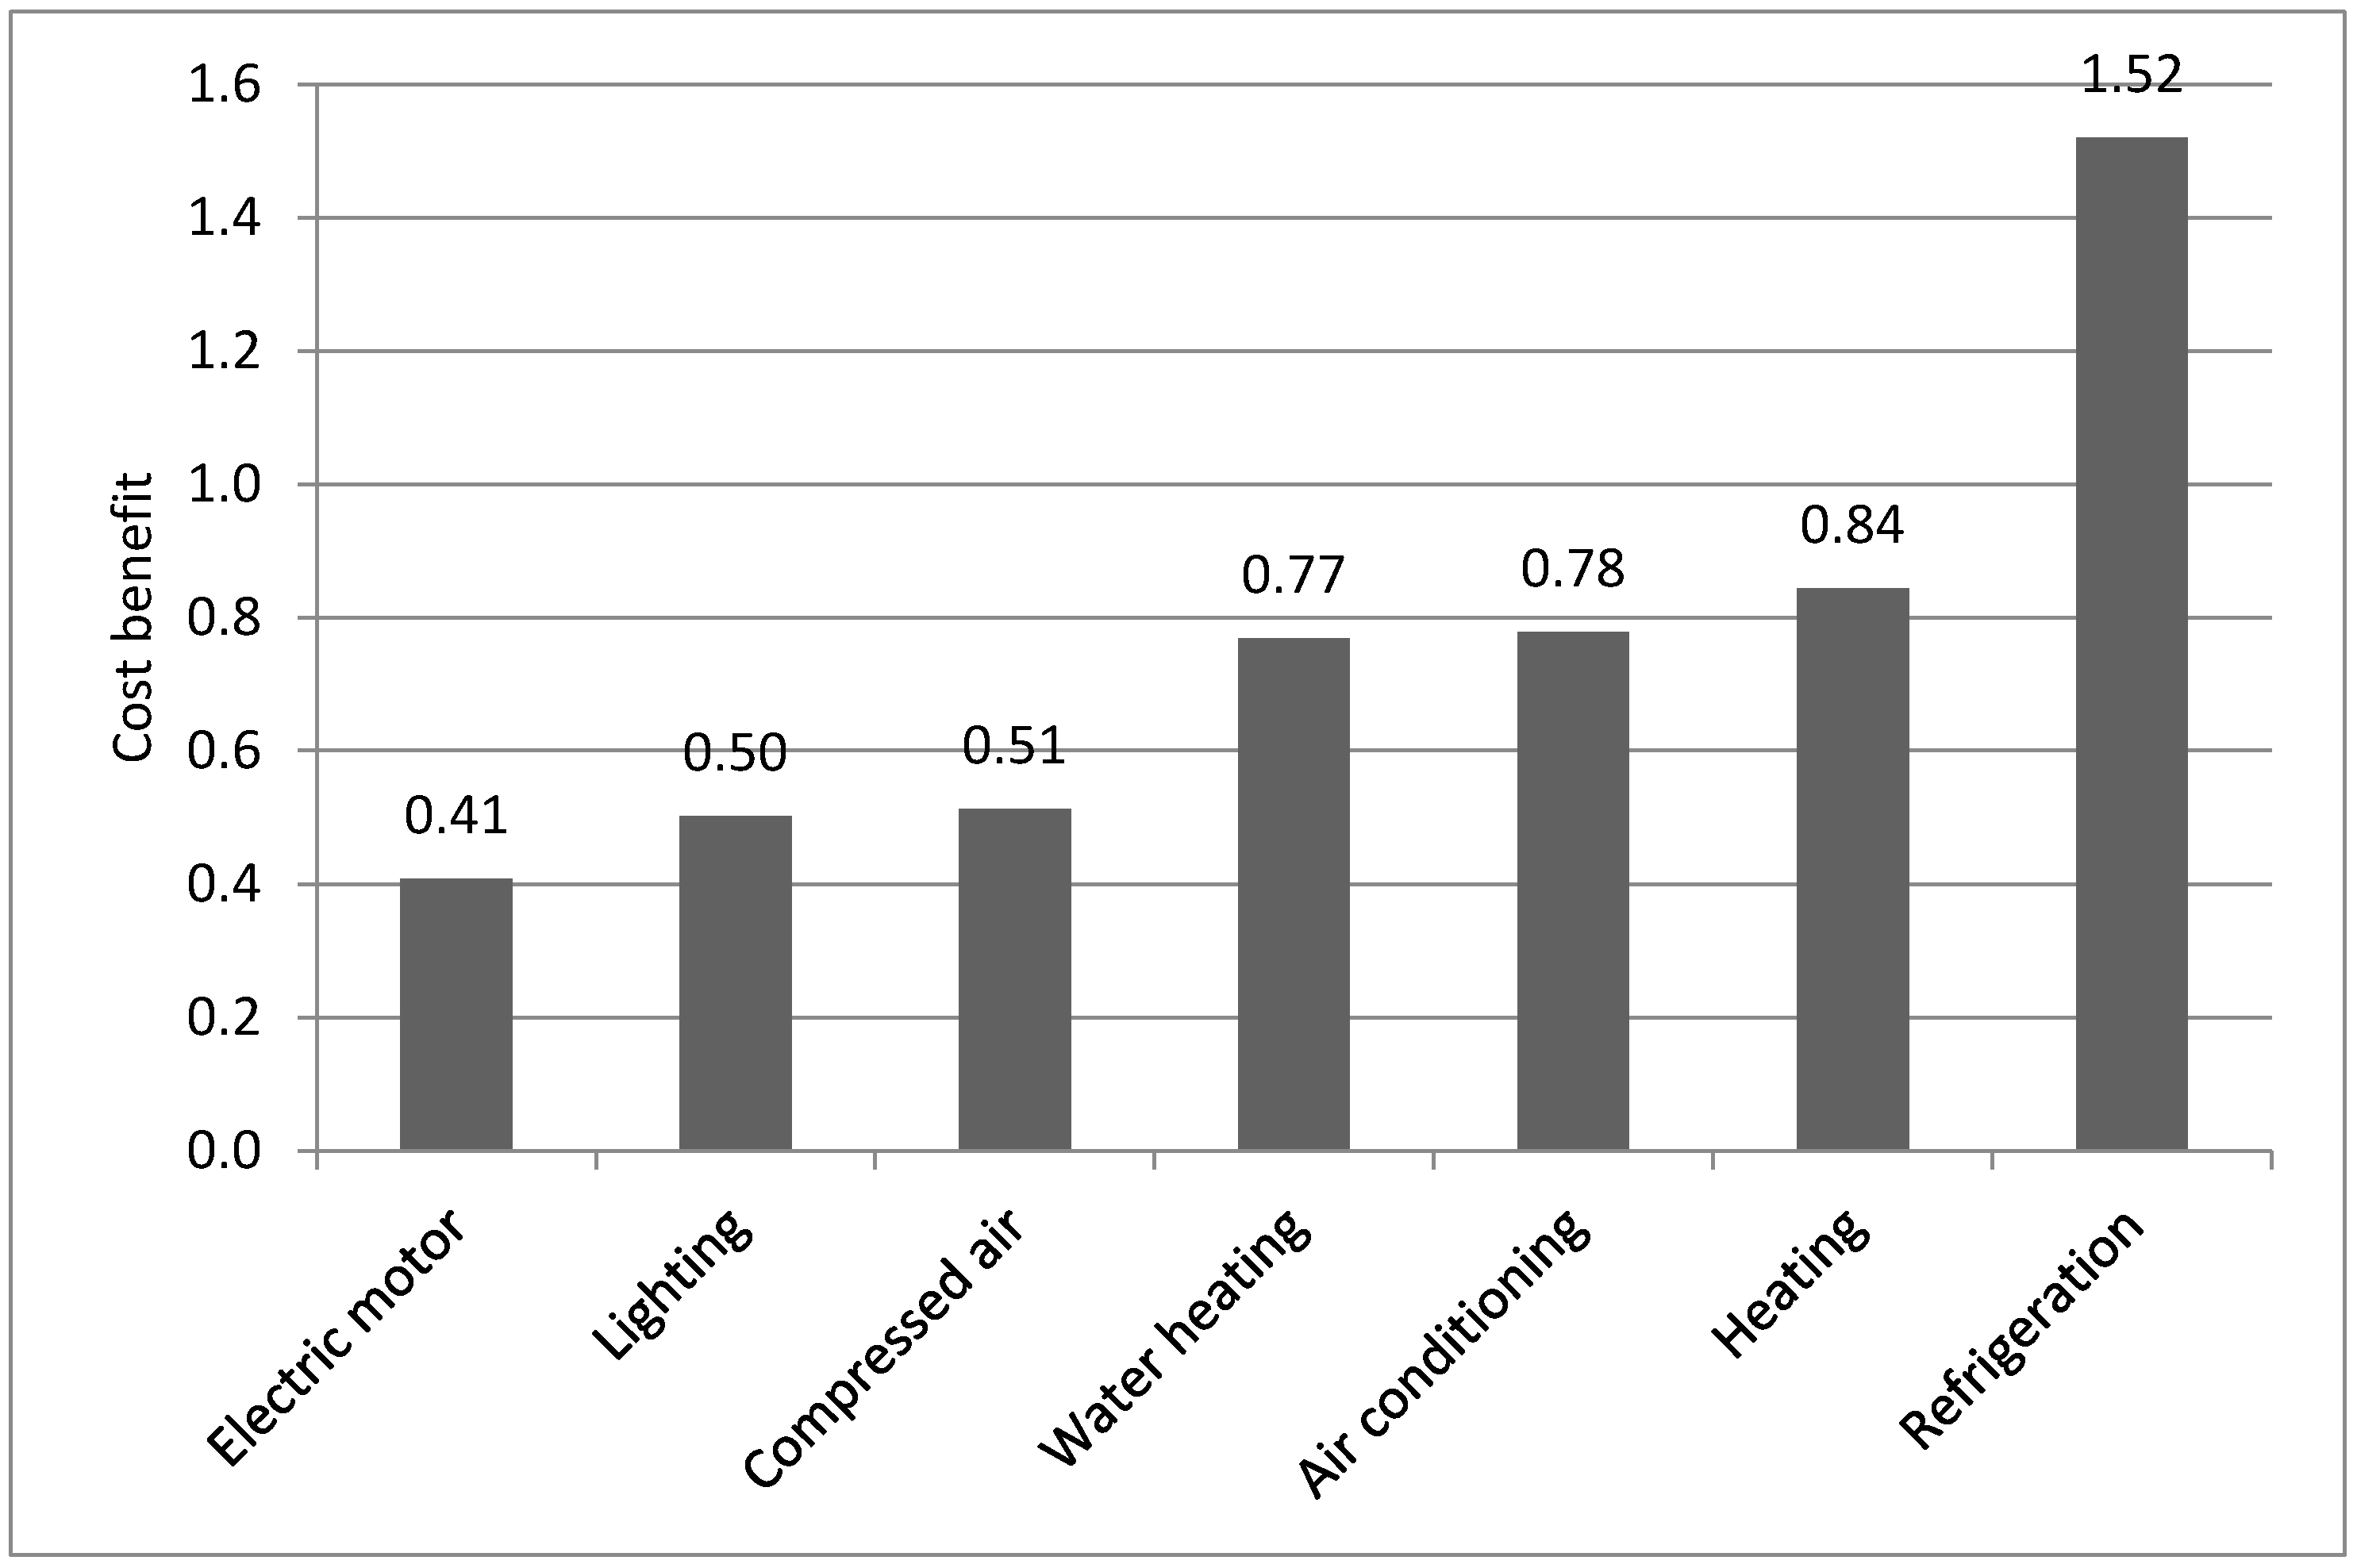
Figure 9 shows the performance of the final energy use according to the RCB. The first three are below 0.7 with electric motors at 0.41, lighting at 0.50, and compressed air at 0.51.
The final energy use type classified as “Others” presented the highest energy savings per project and 244 projects, so this represents a failure in the classification of the data, and the regulatory agency must create a strategy to reduce the results that show considerable impact without proper classification.
Evaluating the presented data, we noted that the project categories have wide ranges in performance in relation to the considered variables, with the lowest-cost projects in the saved energy category, although they showed a low reduction in demand or lower energy savings than the other categories, with a greater amount of saved energy. Given the need for variable correlation, we next present a model of correlation between input and output variables to find the most efficient project categories in the Brazilian Energy Efficiency Program.
5. Data Envelopment Analysis Modeling
The objective function was modeled considering both one input and two outputs, in addition to 12 DMUs. According to the variables available, we evaluated the most significant quantities considered representative of the problem. We decided to correlate the available data with the number of projects executed in each category, according to the project size, determining the average value of each variable, which were presented in the previous section.
- Output 1: The energy saved per project is the relationship between the total energy save by category and the number of projects, shown in Figure 3.
- Output 2: The peak demand reduction per project is the relation between the total peak demand reduction by category and the number of projects, shown in Figure 4.
Listed in Table 4 are the data used in the DEA simulation.
Simulations Results and Analysis
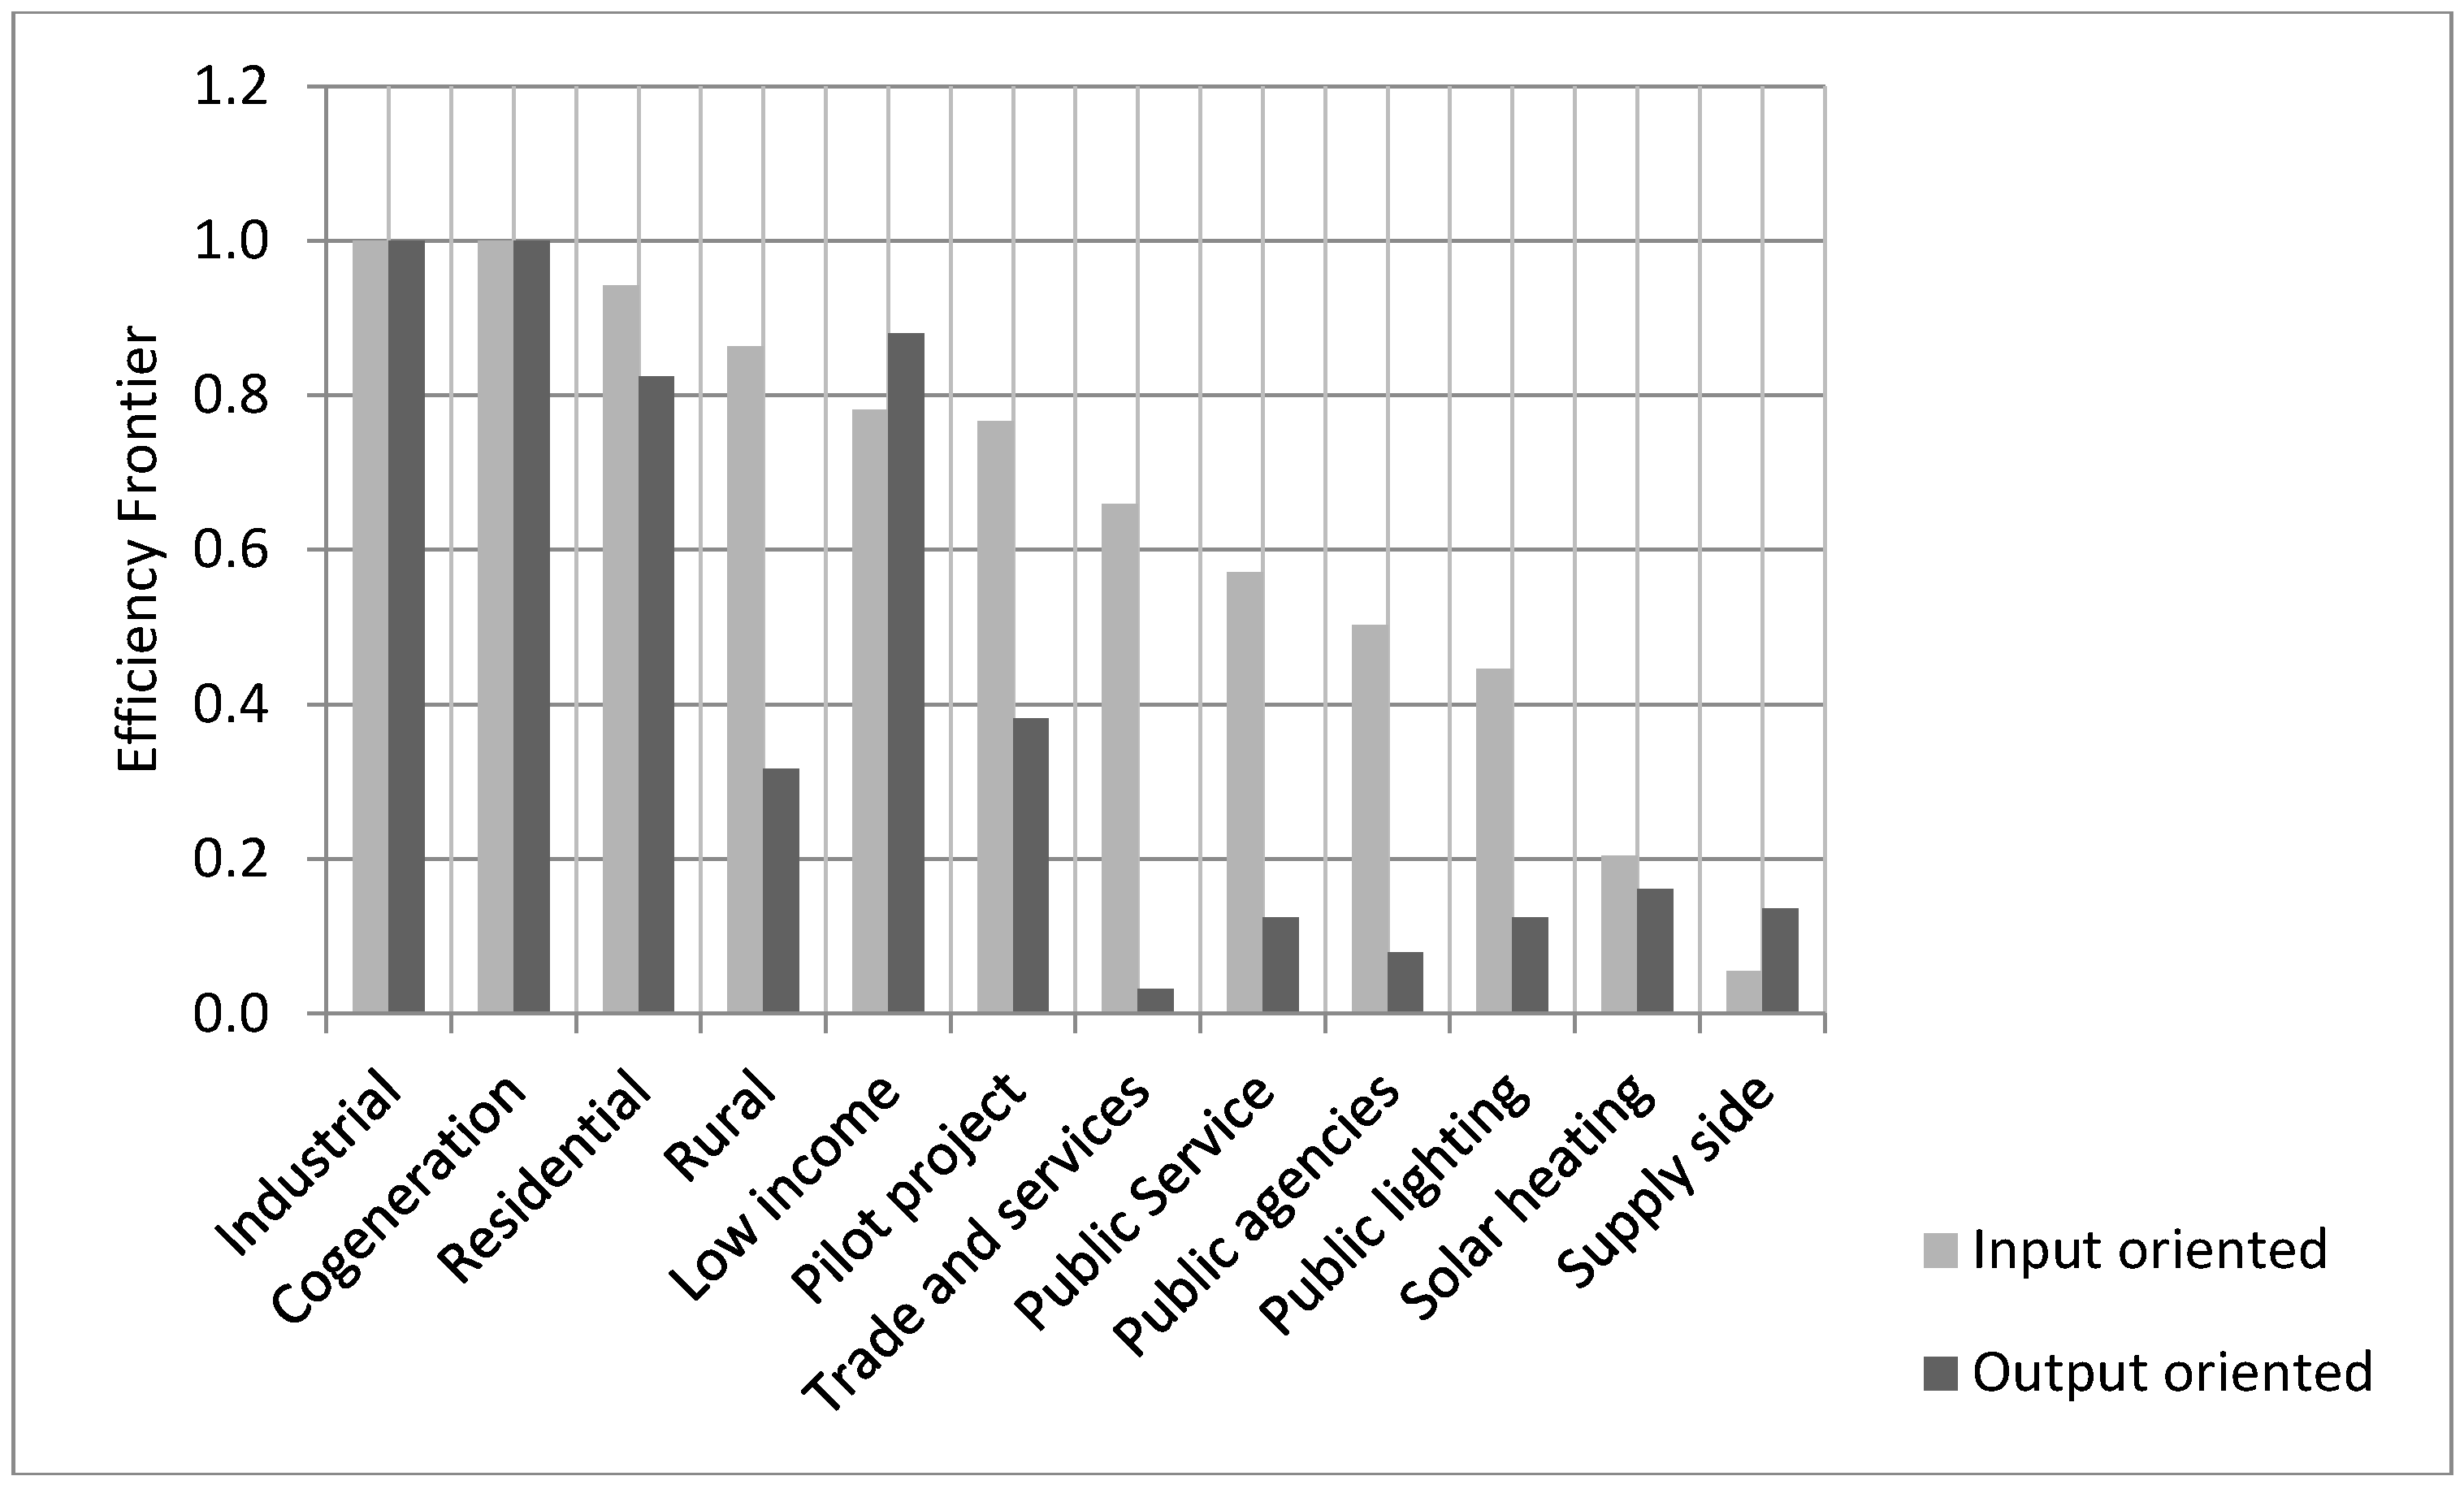
Two simulations were performed, one in relation to the inputs and the other to the outputs. Only two categories were determined as most efficient in both: industrial and cogeneration, as shown in Figure 10.
In Figure 10, there are 10 inefficient categories: residential, rural, low-income, pilot project, trade and services, public service, public agencies, public lighting, solar heating, and supply side. The difference between input and output shows how much each variable should be increased for projects to reach the same performance as projects on the efficiency boundary. In Table 5, the results are presented, using the model with the minimization of inputs.
To reach the efficiency boundary, the cost of energy per project invested in the supply side category should decrease by 94.50% and the energy saved per project should be increased by 693.26%, the most inefficient DMU. For the solar heating category, the cost of energy should decrease by 79.51% and the energy saved should be increased by 646.01%. The public lighting category should reduce the cost of energy by 55.37% and increase the energy saved by 156.35%. The public agencies category should reduce the cost of energy by 49.67%, increase the energy saved by 200.68%, and reduce peak demand by 2.07%. The residential category has an inefficient DMU that is closest to the boundary, and should reduce the cost of energy by 5.76% and increase the energy saved per project by 151.68%.
The results obtained with the model that maximizes outputs are presented in Table 6. The low-income category is closest to the efficiency curve, which needs to increase the energy saved by 278.44%, reduce the peak demand by 13.67%, and reduce the cost of energy by 18.03%. Residential projects should increase their energy savings by 200.75% and reduce the peak demand by 21.30%. The public agencies category should decrease the cost of energy by 21.06%, increase the saved energy by 204.61%, and reduce the peak demand by 1161.06%. The most inefficient DMU was the trade and services category, requiring a 3035.10% increase in energy saved and a 3031.86% reduction in peak demand.
In analyzing the results of projects from previous years, the establishment of weights for the categories that do not reach the efficiency boundary are suggested; that is, these project categories, depending on their diminished performance relative to the boundary, must attain better energy savings and greater reduction during peak hours for their approval. In the category of public agencies and public services, the resources are non-refundable, without requiring performance contracts, which can result in lower savings.
With these results, it can be inferred that a redistribution of investments should be applied to the resources, aiming at greater energy savings and reduced demand at peak hours. Among the categories, 95.76% of the total projects executed and 94.72% of the investments applied to date are ineffective.
6. Conclusions
Based on the obtained results, we verified that the prioritization of project categories may optimize the reduction in electric power consumption in the Brazilian distribution system. The results indicate that project categories, and consequently the measures for energy efficiency, are diverse, and it is paramount that this diversity is considered when prioritizing measures for the Energy Efficiency Program. It was observed that the categories with better performance only account for 4.24% of the total projects submitted. The industrial and cogeneration categories were the most efficient, and while the residential and low-income categories were close, they still require optimization.
Techniques and methodologies used to quantify the depreciation of the measures taken to improve energy efficiency must be stipulated in the pilot project, as well as the addition of new data variables to be collected by the ANEEL. Notably, the lifespan of equipment does not define or guarantee the continuity of energy efficiency initially obtained, and may become indispensable to determine adequate parameters for measuring the depreciation of results in energy efficiency measurements.
The DSM tariff strategies, such as offering differentiated tariffs based on peak hours, must be evaluated by the appropriate criteria. Considering only the reduction in consumed energy, the behavior of emissions tends to be equivalent to the reduction of emissions in non-generated electric power. However, some energy efficiency measures may have a greater impact on the reduction of greenhouse gases, as is the case of energy cogeneration that can use residues from the productive process to generate thermal and electrical energy.
The data collected must be characterized in such a way that it may be quantified and/or qualified objectively, for instance, through the insertion of indicators and weights, to allow for better data analysis and consequently better decision making in the future.
More information about the projects is required to conduct a better analysis and provide better direction for decision makers. Given the results, we observed that to obtain better performance, the energy efficiency measures need to be linked with energy management as a strategy to perpetuate the effects of the measures. As such, projects must promote the certification of performance in buildings and/or processes, quantifying their efficiency, as well as empowering the consumer units to establish goals for increasing energy savings. The availability of acquisition systems and data registry must be adopted as a basic and mandatory requisite for the consumer units participating in the Energy Efficiency Program, and such information should be made periodically available to the project manager. It is recommended that the methodology of the projects implemented by the PEE be mandatorily linked to the implementation of an energy management system, even using an installment certification according to the ISO 50.001 standard, in light of the degradation of the results from past-implemented energy efficiency measures, as a strategy to maintain and guarantee that energy efficiency will, in fact, be considered as a significant source of energy in the national electricity grid.
As a solution to improve the selection of projects with better performance, we suggest assigning weights to the categories to optimize the results of the projects, through incentives to the projects with the best performance, without excluding the participation of all the others, by simply providing goals of energy saving and peak demand reduction compatible with the categories with better results.
Supplementary Materials
The database is available on the ANEEL website: http://www.aneel.gov.br/pt/programa-eficiencia-energetica, in the Management Program section. The download database can be done directly at: http://www.aneel.gov.br/documents/656831/14930488/PEE+Projetos+junho2016/7a401677-72ac-4557-8532-adb200c1a753.
Author Contributions
Rogério Diogne de Souza e Silva, Rosana Cavalcante de Oliveira and Maria Emília de Lima Tostes designed the whole study. Rogério Diogne de Souza e Silva and Rosana Cavalcante de Oliveira conducted data collection, modeling, and results analysis. All authors performed the discussion of the results and the conclusions of the manuscript.
Conflicts of Interest
The authors declare no conflict of interest.
Appendix A
Definition of project categories:
- Low-income: Actions that aim to encourage the efficient use of energy by low-income consumers, which are imposed by the social tariff of electric energy, for those whose per capita family income is less than half the Brazilian minimum wage (approximately $140/month).
- Public lighting: Actions in facilities that involve roads, squares, traffic lights, served by municipalities.
- Pilot project: Unpublished and promising projects that aim to consolidate some energy efficiency technology or for use on a small scale.
- Trade and services: Actions in consumer units involved in commercial activity or the provision of services. Included in this category are entities providing non-profit services. It is characterized by the containment of several consumer units, such as shops, malls, schools, universities, hospitals, restaurants, non-governmental organizations, etc.
- Industrial: These are projects focused on process optimization, introduction of efficient motors, and energy management systems, among others, in industrial consumer units served by the electricity concessionaire, regardless of the size of the industry.
- Public agencies: Actions in consumer units of public organizations at the municipal, state, and federal levels. It serves administrative buildings, schools, universities, and hospitals, among others.
- Residential: Shares in residential consumer units and condominiums not classified as low-income projects.
- Rural: Projects in consumer units with rural activity.
- Public service: Actions in consumer units of bodies that provide public services, such as the collection, treatment, and supply of water, the collection and treatment of sanitary and solid waste, electricity, and gas, among others.
- Solar heating: Implementing systems for the solar heating of water, instead of processes that use electricity for the generation of heat.
- Supply side: Projects focused on the area of electricity generation and distribution, primarily by incentivized sources.
- Cogeneration: Actions in consumer units with the potential to implement energy cogeneration actions, classified as an incentive source.
- Educational: Projects aimed at spreading the concept of energy efficiency and sustainable development.
- Municipal energy management: Projects aiming to improve the management of the final use of electric energy in the municipalities.
References and Notes
- ICF International, Inc. Energy Efficiency as a Low-Cost Resource for Achieving Carbon Emissions Reductions. In National Action Plan for Energy Efficiency; ICF International, Inc.: Fairfax, VA, USA, 2009. [Google Scholar]
- International Energy Agency. Capturing the Multiple Benefits of Energy Efficiency; International Energy Agency: Paris, France, 2014.
- International Energy Agency. Energy Efficiency Market Report 2016; International Energy Agency: Paris, France, 2016.
- Behrgarnd, M. A review of demand side management business models in the electricity market. Renew. Sustain. Energy Rev. 2015, 47, 270–283. [Google Scholar] [CrossRef]
- Apajalahti, E.L.; Lovio, R.; Heiskanen, E. From demand side management (DSM) to energy services: A Finnish case study. Energy Policy 2015, 81, 76–85. [Google Scholar] [CrossRef]
- Rosenow, J. Energy savings obligations in the UK—A history of change. Energy Policy 2012, 49, 373–382. [Google Scholar] [CrossRef]
- Abrardi, L.; Cambini, C. Tariff regulation with energy efficiency goals. Energy Econ. 2015, 49, 122–131. [Google Scholar] [CrossRef]
- Thollander, P.; Palm, J. Industrial energy management decision making for improved energy efficiency—Strategic system perspectives and situated action in combination. Energies 2015, 8, 5694–5703. [Google Scholar] [CrossRef]
- United Nations. Framework Convention on Climate Change: Twenty First Session Conference of the Parties; United Nations: Paris, France, 2015. [Google Scholar]
- Thoyre, A. Energy efficiency as a resource in state portfolio standards: Lessons for more expansive policies. Energy Policy 2015, 86, 625–634. [Google Scholar] [CrossRef]
- Slazvik, J.; Csete, M. Climate and Energy Policy in Hungary. Energies 2012, 5, 494–517. [Google Scholar] [CrossRef]
- Calili, R.F.; Souza, R.C.; Galli, A.; Armstrong, M.; Marcato, A.L. Estimating the cost savings and avoided CO2 emissions in Brazil by implementing energy policies. Energy Policy 2014, 67, 4–15. [Google Scholar] [CrossRef]
- United Nations. Intended Nationally Determined Contribution of Brazil. In Towards Achieving the Objective of the United Nations Framework Conventions on Climate Change; United Nations: Paris, France, 2015. [Google Scholar]
- Ministry of Mines and Energy. National Plan for Energy Efficiency: Premises and Basic dirEctives; Ministry of Mines and Energy: Brasilia, Brazil, 2011.
- Results PROCEL 2016-Base Year and 2015. Eletrobras. 2016. Available online: http://www.procelinfo.com.br (accessed on 3 May 2016).
- Energy Efficiency Program—Program Management. ANEEL. Available online: http://www.aneel.gov.br/pt/programa-eficiencia-energetica/ (accessed on 3 May 2016).
- American Council for Energy Efficiency Economy. The 2016 International Energy Efficiency Scorecard; Report E1602; American Council for Energy Efficiency Economy: Washington, DC, USA, 2016. [Google Scholar]
- Pacudan, R.; Guzman, E. Impact of energy efficiency policy to productive efficiency of electricity distribution industry in the Philippines. Energy Econ. 2002, 24, 41–54. [Google Scholar] [CrossRef]
- Chen, S.; Zhang, S. Large-Scale land use for construction and energy consumption after the new millennium with their impact on total factor efficiency change in China’s regional economy. Energies 2014, 7, 1986–2003. [Google Scholar] [CrossRef]
- Alvarez, F.; Rudnick, H. Impact of energy efficiency incentives on electricity distribution companies. IEEE Trans. Power Syst. 2010, 25, 1865–1872. [Google Scholar] [CrossRef]
- Oh, S.C.; Hildreth, A.J. Estimating the technical improvement of energy efficiency in the automotive industry—Stochastic and deterministic frontier benchmarking approaches. Energies 2014, 7, 6196–6222. [Google Scholar] [CrossRef]
- Lee, Y.S.; Tong, L.I. Predicting high or low transfer efficiency of photovoltaic systems using a novel hybrid methodology combining rough set theory, data envelopment analysis and genetic programming. Energies 2012, 5, 545–560. [Google Scholar] [CrossRef]
- Zeng, S.; Xu, Y.; Wang, L.; Chen, J.; Li, Q. Forecasting the allocative efficiency of carbon emission allowance financial assets in China at the provincial level in 2020. Energies 2016, 9, 329. [Google Scholar] [CrossRef]
- Law 9.991 of 24 July 2000. Presidency of the Republic 2000, Brazil.
- Provisional Measure 2.198–4, 27 July 2001. Presidency of the Republic 2001, Brasilia, Brazil.
- Empresa de Planejamento Energético (EPE). Brazilian Energy Balance 2009 Year 2008; Energy Research Company: Brasilia, Brazil, 2009. [Google Scholar]
- Empresa de Planejamento Energético (EPE). Brazilian Energy Balance 2015 Year 2014; Energy Research Company: Brasilia, Brazil, 2015. [Google Scholar]
- Law 11.465 of 28 march 2007. Presidency of the Republic 2007, Brasilia, Brazil.
- Law 13.203 of 08 dezembro 2015. Presidency of the Republic 2015, Brasilia, Brazil.
- Pinheiro, T.M.M. Quality Incentive Regulation: Brazil Electricity Utilities Performance Comparative. Master’s Thesis, Brasília University, Brasilia, Brazil, 2012. [Google Scholar]
Figure 1.
Electricity consumption history in Brazil between 1999 and 2015, adapted from Brazilian Energy Balance 2009, year 2008, and Brazilian Energy Balance 2015, year 2014.
Figure 1.
Electricity consumption history in Brazil between 1999 and 2015, adapted from Brazilian Energy Balance 2009, year 2008, and Brazilian Energy Balance 2015, year 2014.

Figure 2.
Methodology flowchart.

Figure 3.
Energy saved per project for each category.

Figure 4.
Peak demand reduction per project for each category.

Figure 5.
Cost of energy saved for each category.

Figure 6.
Cost–benefit relation for each category.

Figure 7.
Energy saved per project for final energy use.

Figure 8.
Peak demand reduction (PDR) per project for each final energy use.

Figure 9.
Cost–benefit relationship for each final energy use.

Figure 10.
Simulation results with the model DEA—efficiency frontier.


Table 1.
Main energy efficiency regulatory tools for in Brazil.
| Year | Law or Decree |
|---|---|
| 1996 | 9.427: Creation of the Brazilian Regulatory Electricity Agency. |
| 2000 | 9.991: Determines issues relating to investments in research and development (R&D) and energy efficiency on behalf of concessionary, permission, and authorized companies in the electric power sector. |
| 2001 | 10.295: Known as the Law of Energy Efficiency, establishes minimum efficiency indices for machines and appliances manufactured or marketed in the country, based on relevant technical indicators, which consider the useful life of the equipment, also states that, one year after publication of the levels of energy efficiency, a program of targets will be established for its progressive evolution and obliges manufacturers and importers of the equipment to take the necessary measures to comply with the maximum levels of energy consumption and minimum energy efficiency. |
| 2002 | 10.438: Institutes the PROINFA- Incentive Program for Alternative Sources of Electric Power ; main goal is to increase the share of electric power produced by Autonomous Independent Producers (PIA) (via wind power, small hydroelectric power plants, and biomass) in the National Interconnected Electric System. |
| 2002 | 4.508: Decides on the specific regulations that define the minimum levels of energy efficiency for the three-phase electric motors of squirrel cage induction rotors—produced domestically or abroad, for sale or use in Brazil—of mandatory character. |
| 2010 | 12.212: Creates the Social Tariff that establishes discounts for consumers who are classified to be low-income paying and determines that concessionaires and permissions for the distribution of electric power must apply; at least 60% of the resources from PEE for consumer units are funded by the Social Tariff. |
| 2012 | Resolution 482: Establishes the conditions for micro and mini generation of energy distributed to the electric power distribution system and the electric power compensation system. |
Table 2.
Variables used in model Data Envelopment Analysis (DEA).
| Input (x) | Output (z) | Decision-Making Units (DMU) (E0) |
|---|---|---|
| Cost of energy saved per project | Energy saved per project Peak demand reduction per project | Low-income |
| Public agencies | ||
| Trade and services | ||
| Public service | ||
| Residential | ||
| Industrial | ||
| Rural | ||
| Solar heating | ||
| Pilot project | ||
| Cogeneration | ||
| Public lighting | ||
| Supply side |
Table 3.
Brazilian Energy Efficiency Program—data totals by category.
| Category | Number of Projects | Saved Energy (GWh/Year) | Peak Demand Reduction (MW) | Total Cost (103 USD) | Cost of Saved Energy (USD/MWh) | Cost-benefit Relation |
|---|---|---|---|---|---|---|
| Low-income | 451 | 2488.93 | 935.34 | 880,703.38 | 353.85 | 0.58 |
| Public agencies | 422 | 382.42 | 78.89 | 140,507.57 | 367.41 | 0.67 |
| Trade and services | 230 | 141.31 | 15.89 | 39,661.03 | 280.67 | 0.68 |
| Public service | 141 | 140.13 | 30.29 | 45,654.03 | 325.80 | 0.61 |
| Residential | 129 | 683.08 | 187.79 | 178,515.58 | 261.34 | 0.58 |
| Industrial | 64 | 174.39 | 12.21 | 32,247.41 | 184.92 | 0.51 |
| Rural | 57 | 32.73 | 16.41 | 7192.35 | 219.74 | 0.24 |
| Solar heating | 41 | 23.70 | 15.59 | 22,452.85 | 947.24 | 0.64 |
| Pilot project | 25 | 75.30 | 21.09 | 21,294.41 | 282.79 | 0.86 |
| Cogeneration | 7 | 146.19 | 16.50 | 42,403.05 | 290.05 | 0.51 |
| Public lighting | 4 | 5.59 | 1.17 | 2377.03 | 425.40 | 0.61 |
| Supply side | 1 | 0.48 | 0.32 | 1668.92 | 3476.92 | 1.93 |
| Educational | 91 | - | - | 70,679.68 | - | - |
| Municipal energy management | 14 | - | - | 2891.82 | - | - |
| Total | 1677 | 4294.26 | 1331.50 | 1,488,249.11 | 346.57 | 0.70 |
Table 4.
Data used for the DEA simulation.
| DMU | Input 1 | Output 1 | Output 2 |
|---|---|---|---|
| Low-income | 353.85 | 5518.69 | 2073.94 |
| Public agencies | 367.41 | 906.22 | 186.94 |
| Trade and services | 280.67 | 614.38 | 69.10 |
| Public service | 325.80 | 993.83 | 214.84 |
| Residential | 261.34 | 5295.22 | 1455.70 |
| Industrial | 184.92 | 2724.84 | 190.81 |
| Rural | 219.74 | 574.24 | 287.95 |
| Solar heating | 947.24 | 578.13 | 380.28 |
| Pilot project | 282.79 | 3,012.04 | 843.59 |
| Cogeneration | 290.05 | 20,884.80 | 2357.43 |
| Public lighting | 425.40 | 1396.95 | 292.97 |
| Supply side | 3476.92 | 480.00 | 320.00 |
Table 5.
Percentage increase required to reach the efficiency boundary using the input-oriented model.
Table 5.
Percentage increase required to reach the efficiency boundary using the input-oriented model.
| Category | Cost of Energy Saved-Goal (%) | Energy Saved per Project-Goal (%) | Peak Demand Reduction per Project-Goal (%) |
|---|---|---|---|
| Residential | –5.76 | 151.68 | 0.0 |
| Rural | –13.70 | 516.30 | 0.0 |
| Low-income | –21.92 | 235.38 | 0.0 |
| Pilot project | –23.41 | 172.12 | 0.0 |
| Trade and services | –34.11 | 343.51 | 176.14 |
| Public service | –42.88 | 194.44 | 0.0 |
| Public agencies | –49.67 | 200.68 | 2.07 |
| Public lighting | –55.37 | 156.35 | 0.0 |
| Solar heating | –79.51 | 646.01 | 0.0 |
| Supply side | –94.50 | 693.26 | 0.0 |
Table 6.
Percentage increase required to reach the efficiency boundary for each category using the output-oriented model.
Table 6.
Percentage increase required to reach the efficiency boundary for each category using the output-oriented model.
| Category | Cost of Energy Saved Goal (%) | Energy Saved per Project-Goal (%) | Peak Demand Reduction per Project-Goal (%) |
|---|---|---|---|
| Low-income | –18.03 | 278.44 | 13.67 |
| Residential | 0.0 | 200.75 | 21.30 |
| Pilot project | 0.0 | 551.74 | 161.72 |
| Rural | 0.0 | 1421.94 | 215.48 |
| Solar heating | –69.38 | 3512.47 | 519.92 |
| Supply side | –91.66 | 4251.00 | 636.70 |
| Public lighting | –31.82 | 1395.03 | 704.67 |
| Public service | –10.97 | 2001.45 | 997.30 |
| Public agencies | –21.06 | 2204.61 | 1161.06 |
| Trade and services | 0.0 | 3035.60 | 3031.86 |
© 2017 by the authors. Licensee MDPI, Basel, Switzerland. This article is an open access article distributed under the terms and conditions of the Creative Commons Attribution (CC BY) license (http://creativecommons.org/licenses/by/4.0/).
Share and Cite
MDPI and ACS Style
Silva, R.D.d.S.e.; Oliveira, R.C.d.; Tostes, M.E.d.L. Analysis of the Brazilian Energy Efficiency Program for Electricity Distribution Systems. Energies 2017, 10, 1391. https://doi.org/10.3390/en10091391
AMA Style
Silva RDdSe, Oliveira RCd, Tostes MEdL. Analysis of the Brazilian Energy Efficiency Program for Electricity Distribution Systems. Energies. 2017; 10(9):1391. https://doi.org/10.3390/en10091391
Chicago/Turabian StyleSilva, Rogério Diogne de Souza e, Rosana Cavalcante de Oliveira, and Maria Emília de Lima Tostes. 2017. "Analysis of the Brazilian Energy Efficiency Program for Electricity Distribution Systems" Energies 10, no. 9: 1391. https://doi.org/10.3390/en10091391
Note that from the first issue of 2016, this journal uses article numbers instead of page numbers. See further details here.